
Submitted:
08 August 2025
Posted:
11 August 2025
You are already at the latest version
Abstract
Atopic dermatitis (AD) and asthma are key manifestations of the atopic march, characterized by a progressive development of allergic diseases from early skin inflammation to later respiratory involvement. Emerging evidence highlights the role of gut microbiota in modulating immune responses. However, the therapeutic potential of specific probiotic strains in preventing or mitigating the atopic march remains underexplored. This study aimed to evaluate the immunomodulatory and therapeutic effects of selected probiotic strains in a murine model of ovalbumin (OVA)-induced AD and asthma. Mice received oral administration of B. plebeiu, B. ovatus, F. duncaniae, F. taiwanense and F. prausnitzii for four weeks before being exposed to OVA to induce AD and later asthma. Skin reactions were assessed after OVA application, and asthma was induced via aerosolized OVA. Afterward, blood and lung fluid samples were collected to evaluate immune markers such as total IgE, OVA-specific IgE, and IL-4. Results showed that B. plebeius improved skin histology in AD, while B. ovatus initially induced AD symptoms but later reduced them significantly between days 40–54. B. plebeius and B. ovatus reduced serum total IgE in asthma. B. plebeiu, B. ovatus, F. duncaniae, F. taiwanense and F. prausnitzii significantly lowered OVA-IgE in serum and IL-4 levels in lung fluid (p < 0.05). These selected probiotic strains helped reduce allergic skin responses and later asthma by decreasing inflammation, particularly IL-4. These findings support their potential to prevent or mitigate the progression from AD to asthma and offer promising insight into targeted probiotic interventions for allergic diseases.
Keywords:
atopic dermatitis
; asthma
; ovalbumin
; probiotic
1. Introduction
Atopic dermatitis (AD) and asthma are chronic allergic diseases that have become increasingly prevalent worldwide, particularly among children. Both conditions involve complex immune dysregulation, impaired epithelial barrier function, and chronic inflammation. In recent years, accumulating evidence has highlighted the critical role of the gut microbiota in shaping host immunity and maintaining systemic homeostasis. Dysbiosis—an imbalance in the gut microbial community—has been associated with heightened susceptibil-ity to allergic diseases, including AD and asthma.
The etiology of Atopic dermatitis (AD) development is complex and involves abnormal immune and inflammatory responses, including skin barrier defects, exposure to environmental factors, and neuropsychological factors (Trautmann et al., 2000; Geha, 2003; Novak et al., 2003; Howell et al., 2004). About 70~80% of patients with AD present with external forms of AD and an increased serum immunoglobulin E (IgE) level (Leung et al., 2004). Scratching from intense itching leads to skin damage, which leads to the release of cytokines and chemokines, and consequently a further increase in skin permeability. This then further promotes the entry of allergens into the skin, which is also a cause of AD (Homey et al., 2006).
The use of animal models to simulate human AD patterns has greatly expanded our understanding of the disease and allowed for in-depth studies of its pathogenesis. Mice, dogs, and guinea pigs can develop symptoms similar to AD, however mouse models are mainly used because they are easy to establish and maintain, low cost, and most importantly, the genetic strain can be manipulated. Since the Nc/Nga mouse was first described as a spontaneously occurring AD model in 1997 (Matsuda et al., 1997), many mouse models have been developed. These animal models can be divided into three groups: (1) models induced by epidermal epicutaneous sensitizers; (2) transgenic mice selected to overexpress or lack certain genes; and (3) mice with spontaneously occurring AD-like skin lesions. These models display many features of human AD, allowing for a better understanding of the pathogenesis and treatment of the disease. These models are based on skin injury and allergen sensitization AD, which is AD induced by repeated epidermal sensitization of depilated skin with ovalbumin (OVA), and have been used in five mouse strains so far, including BALB/c and C57BL/6 mice (Spergel et al., 1999). Epidermally sensitized mice show increased scratching behavior and skin lesions characterized by epidermal and dermal thickening, CD4+ T cell and eosinophil infiltration, and Th2 cytokines IL-4, IL-5, and IL-13. In addition, increased expressions of OVA-specific IgG1, IgE and IgG2a in serum have also been reported, with higher expressions of IL-4, IL-5, IL-13, and IFN-γ in the spleen cells of OVA-sensitized mice. In addition, OVA-sensitized mice have been reported to show increased asthmatic hyperresponsiveness after the aerosol administration of OVA, a feature similar to that of most AD patients (Spergel et al., 1999).
Despite growing interest in the gut-skin-lung axis, the relationship between specific bacterial strains and allergic disease remains underexplored. Notably, the roles of Bacteroides plebeius, Bacteroides ovatus, Faecalibacterium duncaniae, Faecalibacterium taiwanense, and Faecalibacterium prausnitzii in the pathogenesis of AD and asthma are not well understood. Some studies suggest lower levels of B. plebeius in asthmatic children and reduced F. prausnitzii in AD patients (Song et al., 2016). F. duncaniae, a recently reclassified butyrate-producing species, has shown anti-inflammatory activity in murine asthma models (Hu et al., 2023), yet human data remain limited. The immunoregulatory potential of B. ovatus has been suggested in early-life microbiome studies (Fujimura et al., 2016), while F. taiwanense, a novel species isolated in Taiwan, remains largely uncharacterized in allergic disease.B. plebeius, originally identified in Japanese individuals with seaweed-rich diets, can degrade porphyran and may influence mucosal immunity (Hehemann et al., 2010). B. ovatus, a common gut commensal, supports IgA production and gut barrier function. F. duncaniae and F. prausnitzii are key producers of butyrate, which strengthens epithelial integrity and promotes anti-inflammatory regulatory T cell responses (Quevrain et al., 2016). Moreover, our previous analysis of human stool microbiota revealed that these five bacterial strains are associated with asthma and AD (unpublished data).
Given the limited number of comprehensive studies on this topic, we aim to investigate the associations and underlying mechanisms of these strains in the context of AD and asthma. By elucidating their immunomodulatory effects, we hope to contribute to the development of microbiome-based therapeutic strategies for allergic diseases and atopic march.
2. Materials and Methods
2.1. Study Animals
Female BALB/c mice were purchased from the National Applied Research Laboratories and were allowed to acclimate for at least one week before exposure. All the animal experiments and care were approved by the Institutional Animal Care and Use Committee (IACUC) of the Agricultural Technology Research Institute. Mice (weighing 19–22 g) had ad libitum access to rodent chow and water. The environment was set onto a 12h dark/-light cycle, with a temperature of 24 ± 2 °C and 50 ± 20% relative humidity.
2.2. Study Design and Procedures
2.2.1. OVA-Induced AD Animal Model
The animals were randomly divided into 6 groups (n=12 in each group) in which the average weight of animals in each group should not exceed 20%: Group A (normal group), intraperitoneal injection of normal saline (0.2 mL/mouse) + saline (0.2 mL/mouse, oral administration); Group B (negative control group), intraperitoneal injection of OVA (20 μg/0.2 mL/mouse) + saline (0.2 mL/mouse, oral administration); Group C (B. plebeius group), intraperitoneal injection of OVA (20 μg/0.2 mL/mouse) + B. plebeius (0.2 mL/mouse, oral administration); Group D (B. ovatus group), intraperitoneal injection of OVA (20 μg/0.2 mL/mouse) + B. ovatus (0.2 mL/mouse, oral administration); Group E (F. duncaniae group), intraperitoneal injection of OVA (20 μg/0.2 mL/mouse) + F. duncaniae (0.2 mL/mouse, oral administration); Group F (F. taiwanense group), intraperitoneal injection of OVA (20 μg/0.2 mL/mouse) + F. taiwanense group (0.2 mL/mouse, oral administration); and Group G (F. prausnitzii group), intraperitoneal injection of OVA (20 μg/0.2 mL/mouse) + F. prausnitzii group (0.2 mL/mouse, oral administration).
The AD animal model was induced by OVA, which was purchased from Sigma-Aldrich A5503. Before local sensitization, the hair on the backs of the animals was shaved. OVA was applied to the skin surface, which was then bandaged and fixed for local stimulation. The application area was about 1 × 1 cm2. Systemic sensitization was performed by intraperitoneal injection of OVA (20 μg/200 μL/mouse) for 1 week, followed by stimulation of the skin with OVA (100 μg/100 μL/mouse) for 7 days. This constituted 1 cycle, and a total of 3 cycles were performed.
2.2.2. OVA-Induced Late-Stage Asthma Animal Model
After the 4th week of the test period as shown in the test flow chart, OVA (20 μg/0.2 mL/mouse, i.p) was injected intraperitoneally every 2 weeks, and the asthma model was continuously induced with 2% OVA aerosol for 3 days before sacrifice and continued every 2 weeks during the induction period. Feeding with probiotics was conducted once a day with a feeding needle. The serum levels of total IgE were measured by ELISA. The serum IgE level in the normal group was significant lower than that in the negative control group (29.25 ± 16.84 ng/ml vs 104.16 ± 67.95 ng/ml; p<0.05). ELISA was used to measure the expression level of OVA-IgE in serum. ELISA was also used to measure the expression level of IL-4 in alveolar flushing fluid.
Mice were challenged with aerosolized OVA (3 %) for three consecutive days. Mice will be exposed to OVA for sensitization and challenge to induce AD in the animal model, systemic sensitization was performed by intraperitoneal injection, and the normal animal group was injected with saline. Before local sensitization, the animal’s back hair was shaved, and then OVA was applied to the skin surface and then bandaged and fixed to induce local irritation. The smearing area was about 1 × 1 cm². The normal animal group was smeared with saline. Systemic sensitization is performed by intraperitoneal injection of OVA (20 μg/200 μL/mice) and then stagnation for 1 week, and then OVA (100 μg/100 μL/mice) is used to stimulate the skin for 7 days. This is one cycle, which requires 3 cycles in total.
The flow chart is as follows:
Figure 1.
Flow chart of the animal experiment: Six groups of mice were orally administration probiotics or saline for 73 days continuously. Mice intraperitoneal injected OVA (20 μg) and Al(OH)3 in sterile saline on day 29, 43 and 57. The mice were sensitized with a patch containing 100 μg of OVA, applied to the shaved dorsal skin for 1 week per cycle. This procedure was repeated 3 times to induce the atopic dermatitis (AD) model. All animals in every group will continue to the next experiment which will be challenged with aerosolized OVA (3 %) for 3 days. The animals were sacrificed 24 hours after the last OVA exposure for procurement of BALF and lung tissue. OVA= ovalbumin, i.p=Intraperitoneal, BALF= bronchoalveolar lavage fluid. Skin condition observation.
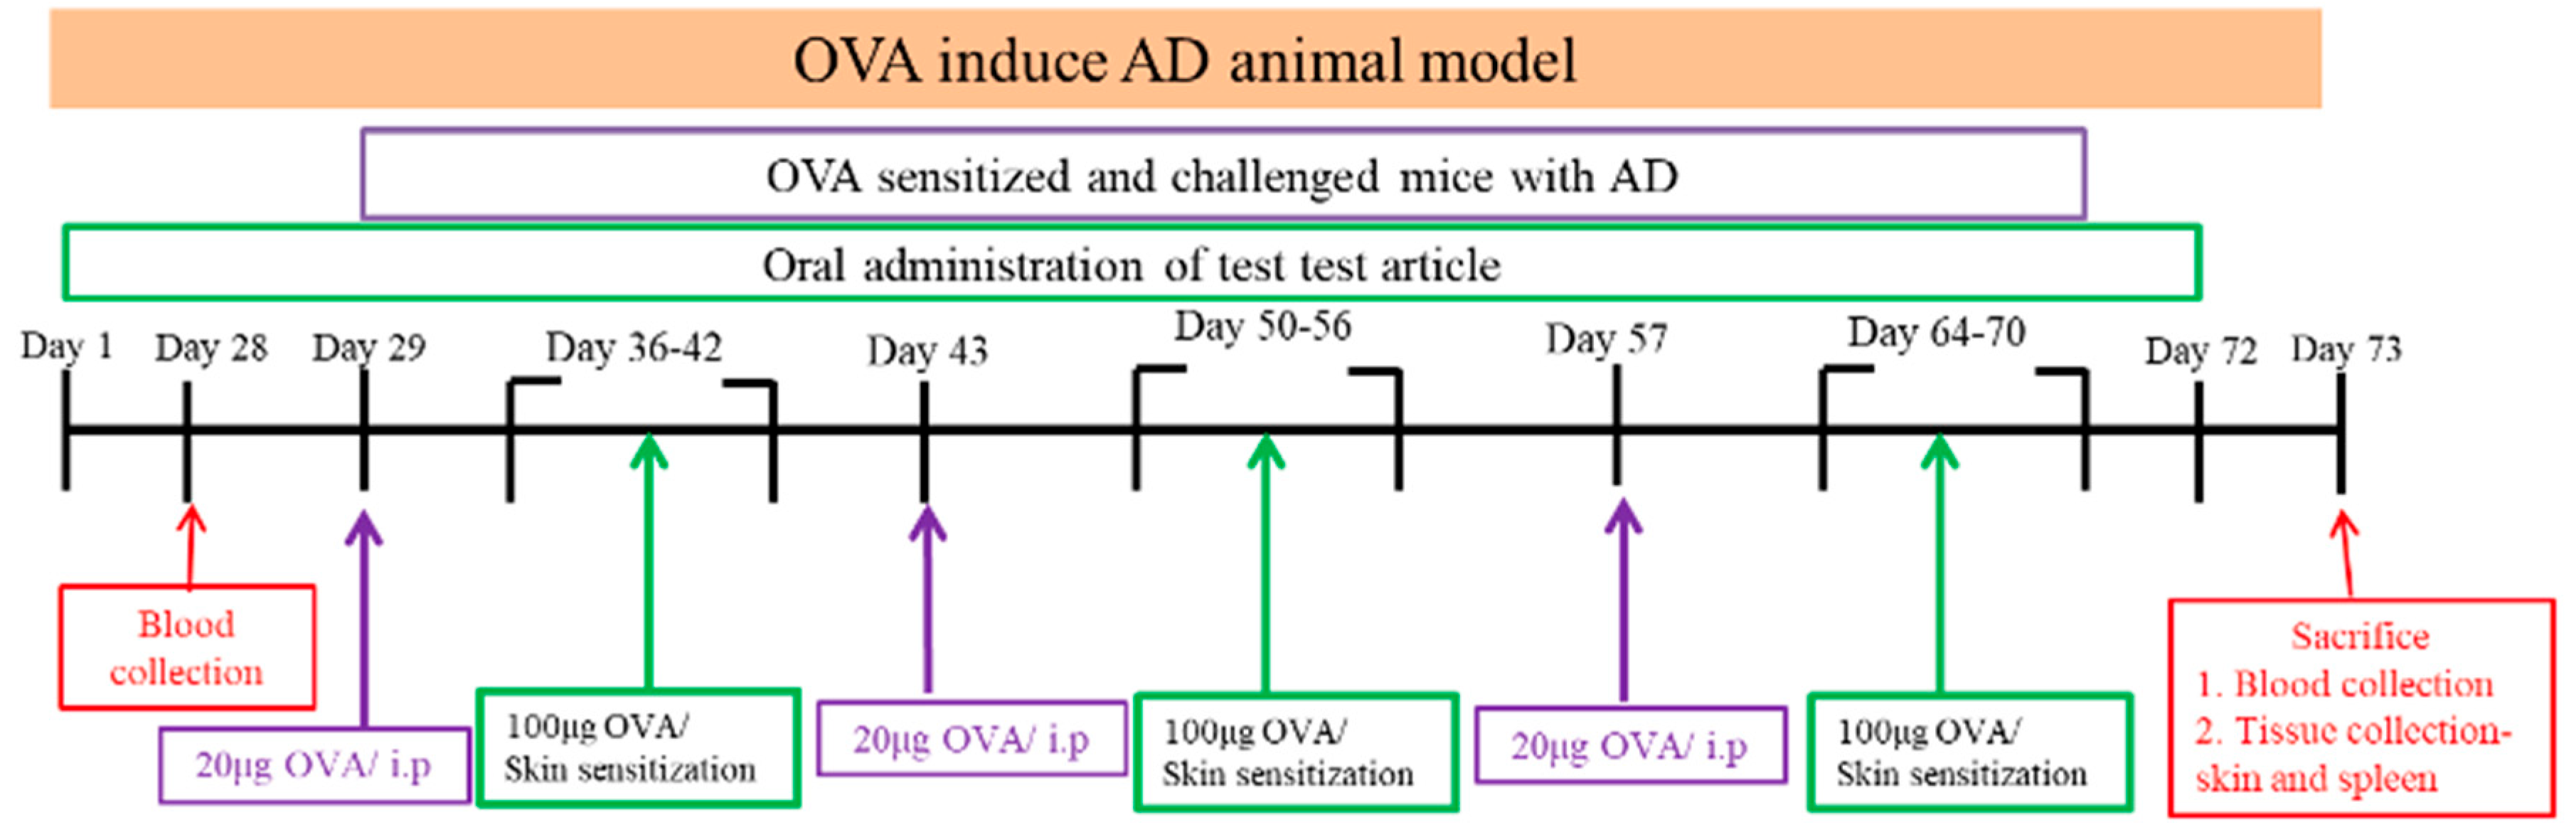
After stimulating the skin with OVA, we observed and evaluated the skin using an AD score examination every 3 to 4 days. After stimulating the skin with OVA, observe the skin condition, score and take pictures once every 3 to 4 days. The AD score examination for the severity of dermatitis was assessed according to four symptoms: (1) erythema/hemorrhage, (2) scarring/dryness, (3) edema, and (4) excoriation/erosion. Each symptom was scored from 0 to 3 (none, 0; mild, 1; moderate, 2; severe, 3).
2.2.3. Blood Collection and Processing Methods
Before the test, blood was collected in blood collection tubes without anticoagulants using Lancet, facial vein blood collection. After the test, blood was collected from the mouse hearts at sacrifice, and the blood was without anticoagulant blood collection tubes. We centrifuged the blood without anticoagulants at 4°C at 3500rpm for 10 minutes, then took the supernatant as serum, stored it at -40°C until analysis.
2.2.4. Lung Washing Fluid Collection
We used 0.5 mL Phosphate Buffered Saline (PBS) to lavage the lungs three times. In addition, we collected at least 1 mL of lung washing fluid, centrifuged it at 2000 rpm using an Eppendorf Centrifuge 5810R at 4°C for 15 minutes, collected the supernatant, and store it at -80°C for the subsequent analysis of IL-4 and IFN-γ. The washed lungs were stored in 10% neutral formalin for subsequent analysis. ELISA was used to measure the expression level of IFN-γ in the alveolar flushing fluid.
Within 24 h of the final challenge, we sacrificed the rats and collected blood samples. We collected the blood from the abdominal aorta, which we then centrifuged (3500 rpm at 4 °C for 15 min) and stored at -70°C. We used ELISA kits to determine serum IgE concentration.
We washed the lungs four times with 0.3 mL PBS (1.2 mL). We centrifuged the BALF at 2000 rpm at 4 °C for 10 min. We centrifuged the supernatant of BALF 3000 rpm at 4 °C for 10 min, which we then stored at −70 °C. We used ELISA kits to determine the IL-4 and TNF-α concentrations in the BALF.
2.3. Statistical Analysis
Experimental results are reported as mean ± standard deviation (SD). We used SPSS software version 22.0 (IBM, Armonk, NY, USA) for data processing. We performed sta-tistical analysis using one-way ANOVA followed by the Duncan’s t-test. We considered p<0.05 to be statistically significant.
3. Results
3.1. Body Weight Change
No animals died during the experiment. There was no significant difference in body weight among the groups in the first week (p>0.05). In the second week, the body weight of the B. ovatus group was significantly higher than that of the F. taiwanense and F. prausnitzii group (p<0.05). In the third week, the body weight of B. plebeius and B. ovatus was significantly higher than that of the F. prausnitzii group (p<0.05). In the fourth week, the body weight of the normal group and the B. plebeius group was significantly higher than that of the F. taiwanense group (p<0.05). There was no significant difference among the groups in the fifth week. In the sixth to eighth weeks, the body weight of the normal group was significantly higher than that of the other groups (p<0.05) (Figure 1).
3.2. Total Serum IgE
The serum IgE levels in the B. plebeius and B. ovatus groups were 57.01±40.36 pg/ml and 57.75±34.40 pg/ml, respectively, which were significantly lower than in the negative control group. The F. duncaniae, F. taiwanense and F. prausnitzii Group serum IgE levels were 147.56±142.51, 167.24±122.97 and 308.18±128.24 pg/ml , respectively, which were no significantly than in the negative control group.There was a significant difference in the oral B. ovatus group (p<0.05) between the negative control group (Figure 2).
3.3. OVA-IgE Content in Serum
The expression levels of OVA-IgE in the serum of the normal group and the negative control group were 0.19±0.06 and 0.58±0.16, respectively, and the expression level of OVA-IgE in the normal group was significantly lower than that in the negative control group (p<0.001). In addition, the serum levels of OVA-IgE in the B. plebeiu, B. ovatus, F. duncaniae, F. taiwanense and F. prausnitzii groups were 0.43±0.09, 0.33±0.07, 0.27±0.13,0.15±0.10 and 0.46±0.11, respectively. The OVA-IgE expression of B. plebeiu, F. prausnitzii, B. ovatus, F. duncaniae, and F. taiwanense treatments displayed a downward trend from the negative control value. (Figure 3).
3.4. Expression of IL-4 in Alveolar Flushing Fluid
The level of IL-4 in the alveolar lavage fluid of the normal group was significantly lower than that in the negative control group (2.75 ± 2.31 pg/mL vs. 20.54 ± 5.78 pg/mL; p < 0.05). In addition, the IL-4 levels in the alveolar lavage fluid of the B. plebeius, B. ovatus, F. duncaniae, F. taiwanense, and F. prausnitzii groups were 10.74 ± 6.41, 7.92 ± 5.79, 7.56 ± 3.63, 7.98 ± 1.98, and 15.36 ± 4.36 pg/mL, respectively, all of which were significantly lower than those in the negative control group (p < 0.05) (Figure 4).
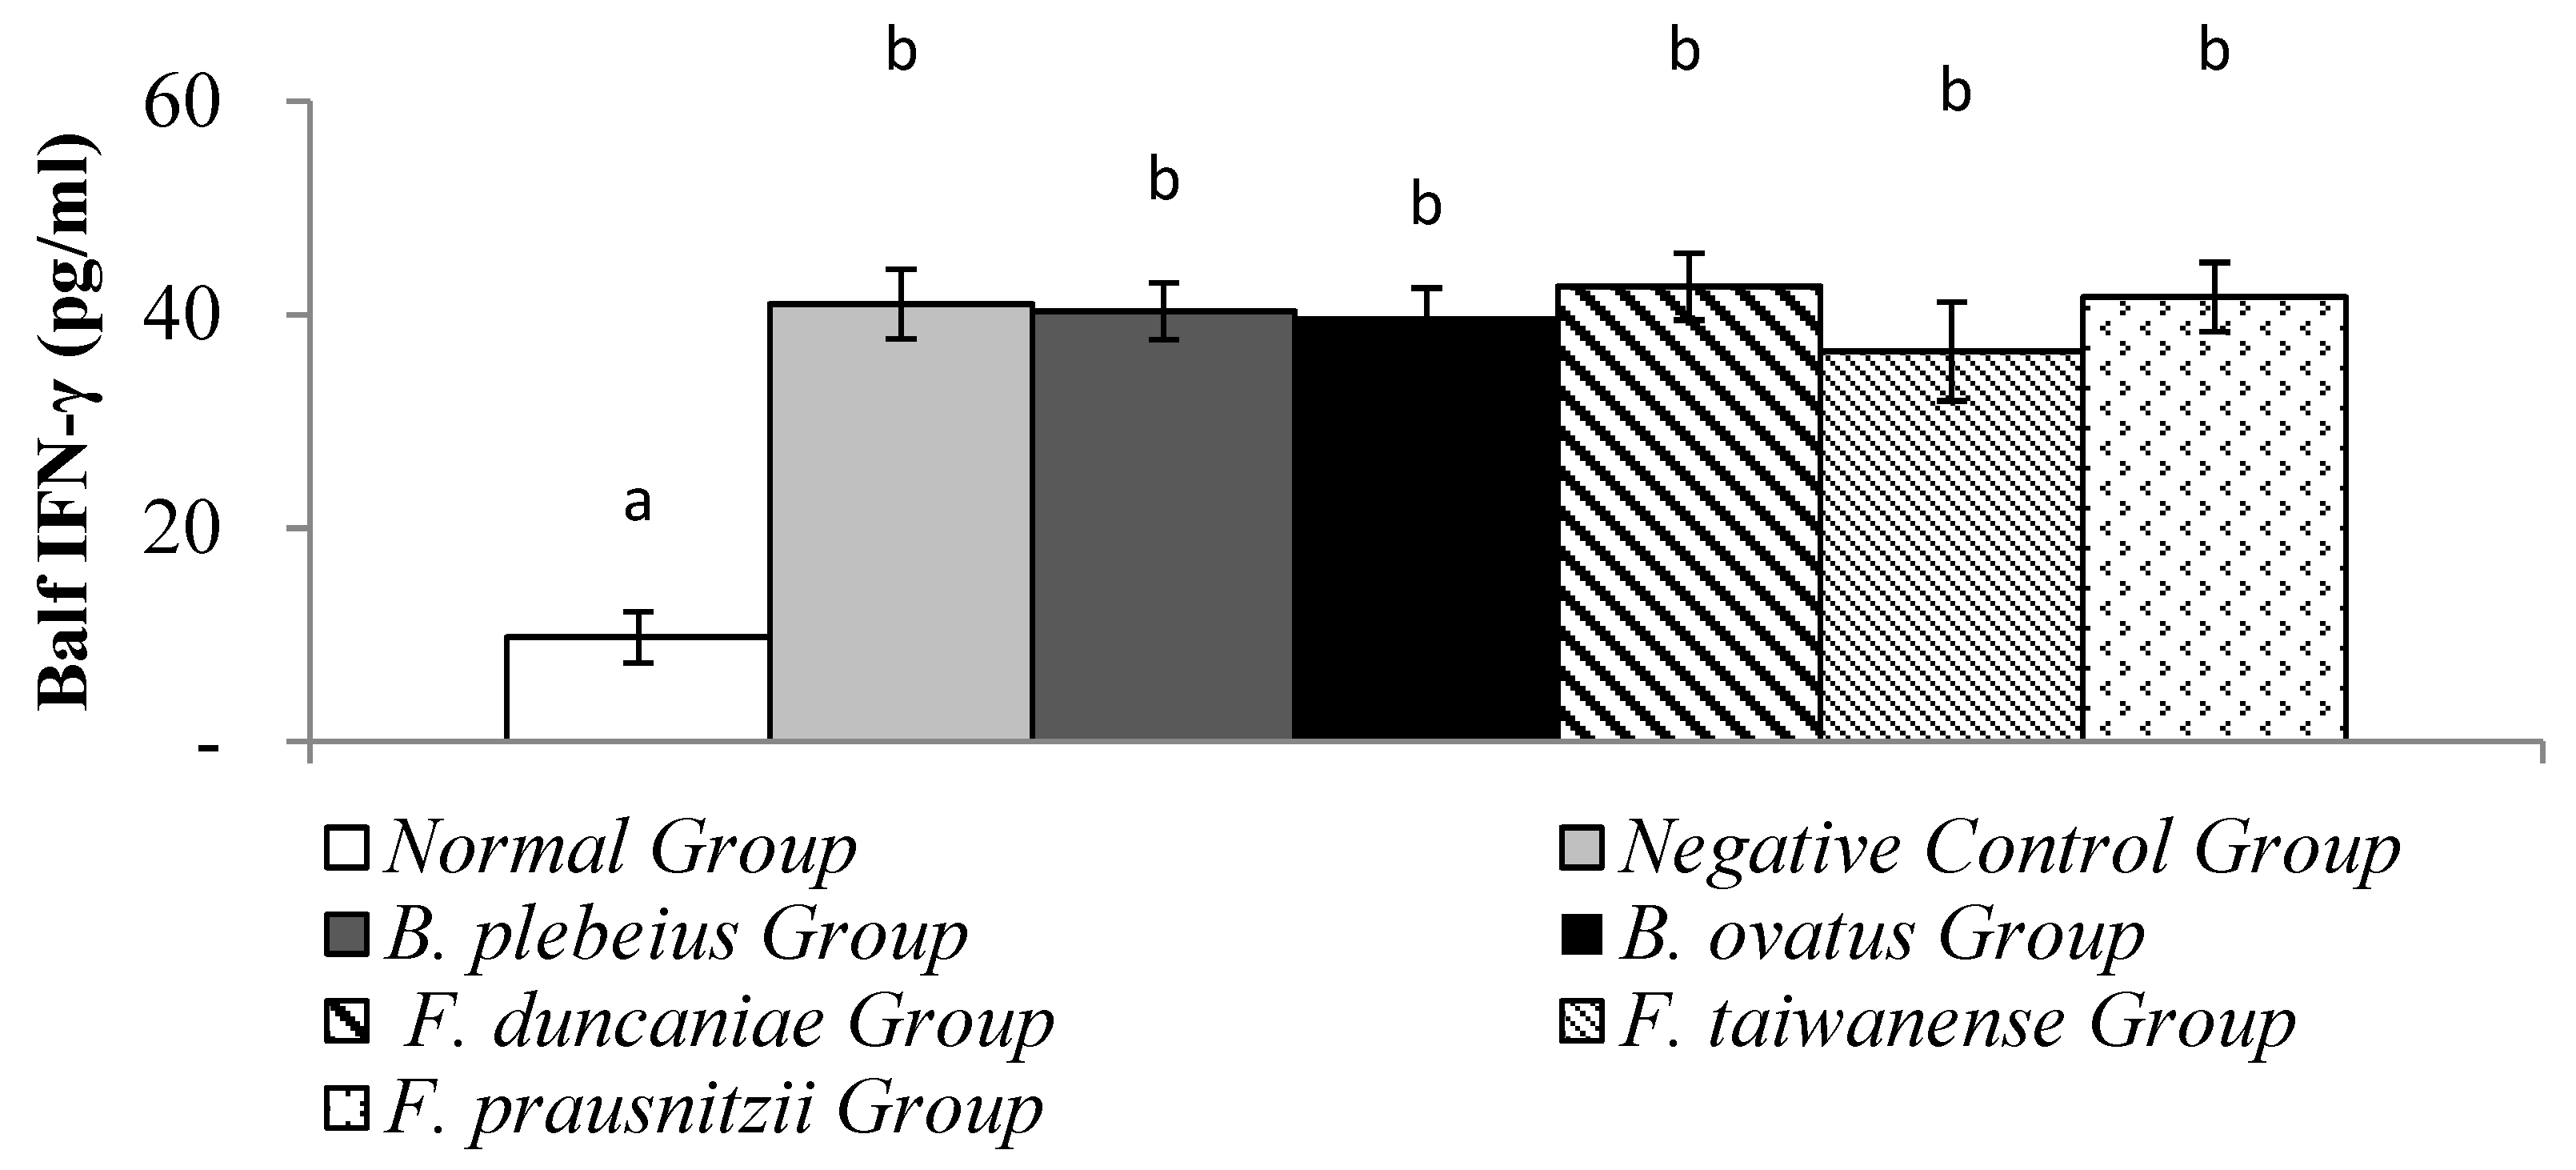
3.5. Expression of IFN-γ in Alveolar Flushing Fluid
The level of IFN-γ in alveolar flushing fluid in the normal group was significantly lower than that in the negative control group (9.77 ± 2.39 pg/ml vs 41.02 ± 3.26 pg/ml; p<0.05). In addition, the levels of IFN-γ in the alveolar washing fluid of the B. plebeiu, B. ovatus, F. duncaniae, F. taiwanense and F. prausnitzii groups were 40.35 ± 2.66, 39.84 ± 2.69, 42.65±3.13, 36.58±4.65 and 41.69±3.26 pg/ml, respectively, and there was no significant difference compared with the negative control group (p>0.05) (Figure 5).
3.6. Skin Condition Observation
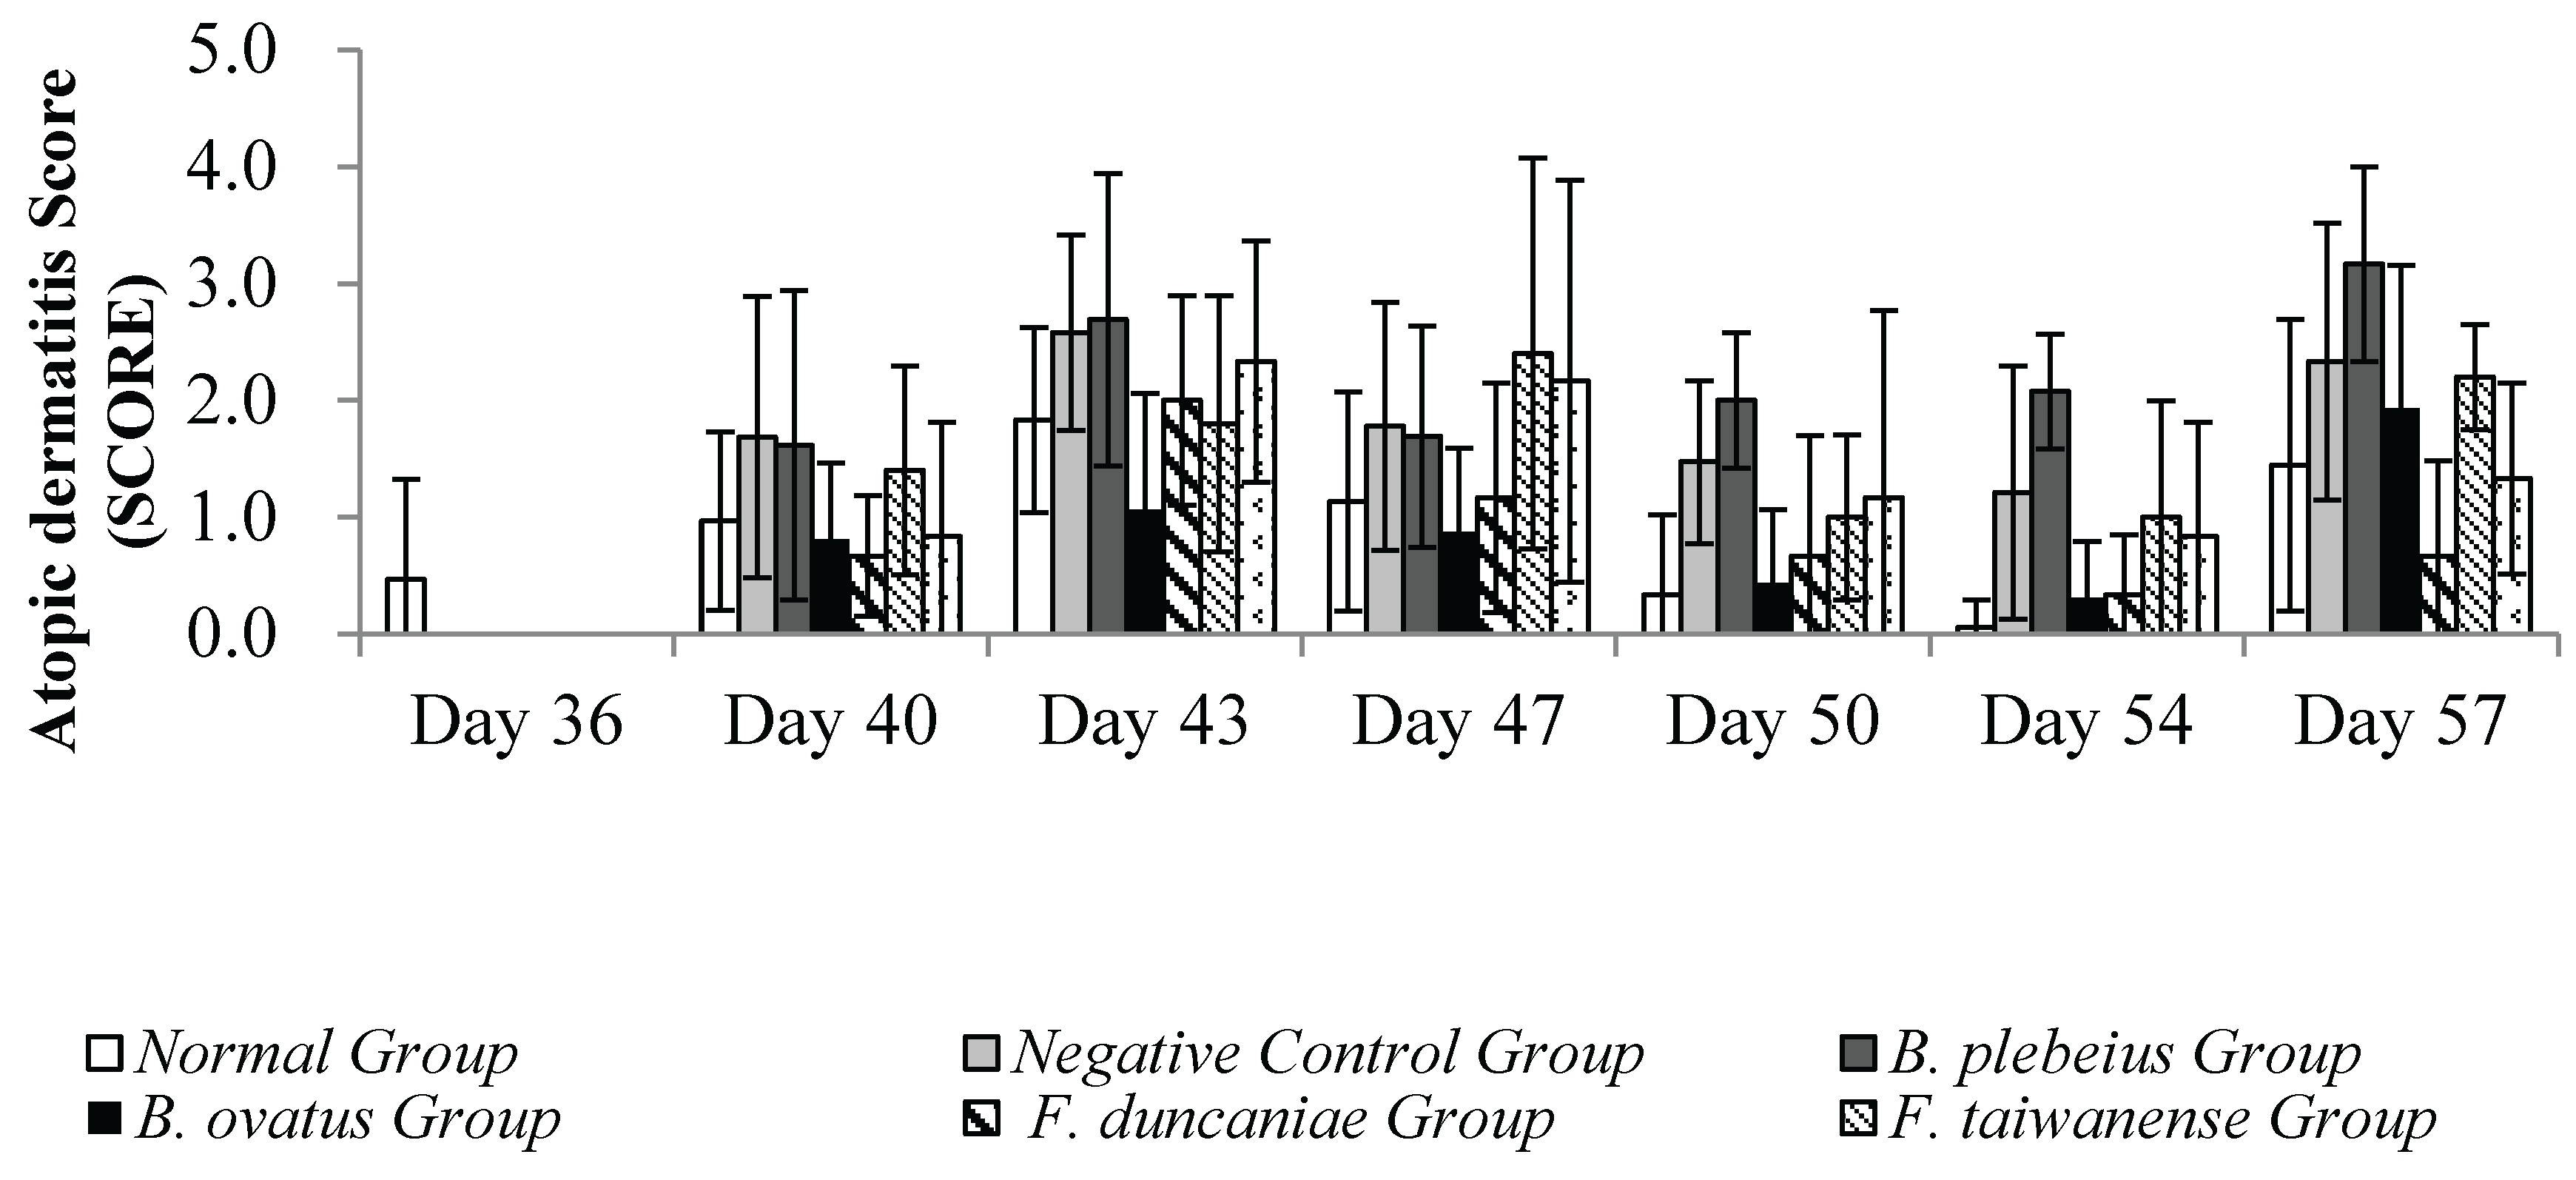
The observation results of the skin condition of each group in the stimulation-induced AD animal model with OVA are summarized in. During the induction period, observations and recordings were made once at intervals of 3 to 4 days, and the skin stimulation was performed twice in total. During the first skin stimulation period (day 40~43), the average AD score examination at the stimulation site in the negative control group was significantly higher than that of the normal group (p<0.05) (Figure 6). Compared with the negative control group, the average skin SCORE in the B. ovatus group was significantly lower (p<0.05), while the average skin SCORE in the B. plebeius group was lower but without significance (p>0.05).
When the animals were unwrapped and not in contact with the allergen (OVA), the skin condition of the animals in each group gradually returned to normal. On days 47 and 50, the average SCORE scores of the stimulated skin were 1.3 and 0.5 in the normal group; 2.5 and 1.8 in the negative control group; 0.88and 0.44 in the B. plebeius group; and1.17 and 0.67 in the F. duncaniae group. The average skin SCORE in the negative control group was significantly higher than the scores in the normal group and B. ovatus group (p<0.05), while the average score in the B. ovatus group was close to the normal group.
During the second skin stimulation induction with OVA (days 54 and 57), the severity of dermatitis in the control group was slower than that of the first stimulation induction, and the recovery time was shortened. The B. ovatus and F. duncaniae Group scores were 0.31, 1.93 and 0.33, 0.67 , respectively. In addition, the average scores in the negative control group were higher than those in the other groups, and there was a significant difference with the normal group (p<0.05).
Figure 7.
Skin condition observation.
4. Discussion
This study presents an interesting and unique approach to understanding the role of probiotics in AD and development of AD. Not many studies have utilized this specific investigation method, which combines oral probiotic administration with OVA skin stimulation to create a model that mirrors the progression of AD to asthma. In this study, the AD model was induced by OVA skin stimulation following 4 weeks of the oral administration of probiotics (B. plebeius, B. ovatus, F. duncaniae, F. taiwanense and F. prausnitzii) and OVA.
During the final 3 days of the test, 3% OVA aerosol was administered to induce the asthma model. The expression of IgE in the serum, cytokine levels in the lung lavage fluid, and the condition of the skin at the stimulation site were then evaluated.
When an allergic reaction occurred, Th2 cells secreted IL-4, which increased the concentration of IgE antibodies in the serum.Our findings are similar to a previous study in which the linear discriminant analysis effect size indicated that Bacteroidaceae and Porphyromonadaceae can act as possible biomarkers associated with the diagnosis of AD. Probiotics can modify the composition of the gut microbiome, which may have an impact on the incidence and development AD. Thus, it can be concluded that the development of AD is significantly influenced by gut microbiota (Ye et al. 2021).
AD is a chronic, relapsing inflammatory skin disease whose pathogenesis has not been fully understood. Although some AD mouse models already exist, it is not easy to establish a model that can represent the natural development of human AD (Kim et al. 2012). In this study, we developed an AD model based on the inside-outside theory and investigated the effects of B. plebeius, B. ovatus, F. duncaniae, F. taiwanense and F. prausnitzii. Probiotics have been considered as immunomodulators in allergic diseases. The AD model resulted in skin erythema and itching, and increased skin inflammation, as assessed by mouse skin scoring. Oral administration of F. duncaniae and F. prausnitzii alleviated all the disease parameters mentioned above. In AD model, OVA-specific IgE and Total IgE were expressed, but these expressions were reduced in B. plebeius, B. ovatus, F. duncaniae, and F. taiwanense reated AD mice.According to Asahi data, atopic manifestations occur in a series, usually with AD in infancy and allergic rhinitis and/or asthma later in life. In this study, 3% OVA was administered into the trachea after the experiment to induce asthma. The late-stage atopic dermatitis-asthmatic pattern is defined as immune dysregulation driven by Th2 cells, characterized by elevated levels of interleukin (IL)-4, IL-13, and IL-5 (Lee et al. 2024). Administration of B. plebeius, B. ovatus, F. duncaniae, F. taiwanense, and F. prausnitzii significantly reduced the level of IL-4 in lung lavage fluid.
5. Conclusion
The results of this study reveal that probiotic, particularly B. plebeius, B. ovatus, F. duncaniae, and F. taiwanense play a important role in alleviating symptoms of AD including skin erythema, itching, and inflammation, as shown by improved mouse AD skin scoring. Additionally, these probiotics have shown to reduce levels of OVA-specific IgE and total IgE, which are key markers of allergic reactions. This study also demonstrated that the selected probiotic strains effectively alleviated both atopic dermatitis and subsequent asthma, conditions characterized by Th2-driven immune dysregulation. Notably, treatment with these probiotics led to a reduction in IL-4 levels in bronchoalveolar lavage fluid. These findings suggest that probiotic intervention can attenuate allergic immune responses, thereby improving both AD and its progression to asthma, and may offer a promising therapeutic strategy for managing allergic diseases.
Author contributions
F-YZ: Writing – review & editing, Visualization, Data curation, Formal Analysis, Methodology. C-YY: Supervision, Validation, Writing – review & editing, Data curation. C-HH: Conceptualization, Writing – review & editing, Resources, Data curation. J-SL: Conceptualization, Writing – review & editing, Resources, Data curation. P-YC: Conceptualization, Writing – review & editing, Resources, Data curation. I-JW: Supervision, Writing – review & editing, Methodology, Writing – original draft, Investigation, Project administration, Resources.
Data Availability Statement
The data presented in this study are available on request from the corresponding author due to (specify the reason for the restriction).
Acknowledgments
This study was supported by the grants from the National Science and Technology Council (NSTC 113-2314-B-192-002) in Taiwan.
Conflict of interest
The authors have no conflict of interest to declare.
References
- Geha, R. S. Allergy and hypersensitivity. Nature versus nurture in allergy and hypersensitivity. Current opinion in immunology 2003, 15(6), 603–608. [Google Scholar] [CrossRef]
- Howell, M. D.; Jones, J. F.; Kisich, K. O.; Streib, J. E.; Gallo, R. L.; Leung, D. Y. Selective killing of vaccinia virus by LL-37: implications for eczema vaccinatum. The Journal of Immunology 2004, 172(3), 1763–1767. [Google Scholar] [CrossRef] [PubMed]
- Homey; Bernhard. Cytokines and chemokines orchestrate atopic skin inflammation. Journal of Allergy and Clinical Immunology 2006, 118(1), 178–189. [Google Scholar] [CrossRef]
- Lee, Min Jung; Kang, Mi Jin; Lee, So Yeon; Lee, Eun; Kim, Kangjin; Won, Sungho; Suh, Dong In; Kim, Kyung Won; Sheen, Youn Ho; Ahn, Kangmo; Kim, Bong Soo; Hong, Soo Jong. Perturbations of Gut Microbiome Genes in Infants with Atopic Dermatitis According to Feeding Type. Journal of Allergy and Clinical Immunology 2018, 141(4), 1310–19. [Google Scholar] [CrossRef] [PubMed]
- Leung, D. Y.; Boguniewicz, M.; Howell, M. D.; Nomura, I.; Hamid, Q. A. New insights into atopic dermatitis. The Journal of clinical investigation 2004, 113(5), 651–657. [Google Scholar] [CrossRef]
- Marco, M. L. Health benefits of fermented foods: microbiota and beyond. Curr Opin Biotech 2017, 44, 94–102. [Google Scholar] [CrossRef]
- Matsuda, H.; Watanabe, N.; Geba, G. P.; Sperl, J.; Tsudzuki, M.; Hiroi, J.; Ra, C. Development of atopic dermatitis-like skin lesion with IgE hyperproduction in NC/Nga mice. International immunology 1997, 9(3), 461–466. [Google Scholar] [CrossRef] [PubMed]
- Novak, N.; Bieber, T.; Leung, D. Y. Immune mechanisms leading to atopic dermatitis. Journal of Allergy and Clinical Immunology 2003, 112(6), S128–S139. [Google Scholar] [CrossRef]
- Spergel, J. M.; Mizoguchi, E.; Oettgen, H.; Bhan, A. K.; Geha, R. S. Roles of T H 1 and T H 2 cytokines in a murine model of allergic dermatitis. The Journal of clinical investigation 1999, 103(8), 1103–1111. [Google Scholar] [CrossRef]
- Trautmann, A.; Akdis, M.; Kleemann, D.; Altznauer, F.; Simon, H. U.; Graeve, T.; Akdis, C. A. T cell–mediated Fas-induced keratinocyte apoptosis plays a key pathogenetic role in eczematous dermatitis. The Journal of clinical investigation 2000, 106(1), 25–35. [Google Scholar] [CrossRef]
- Ye, Siqi; Yan, Fenggen; Wang, Haiyan; Mo, Xiumei; Liu, Junfeng; Zhang, Yu; Li, Hongyi; Chen, Dacan. Diversity Analysis of Gut Microbiota between Healthy Controls and Those with Atopic Dermatitis in a Chinese Population. Journal of Dermatology 2021, 48(2), 158–67. [Google Scholar] [CrossRef]
- Lee, J. H.; Im, D. S. Magnolol reduces atopic dermatitis-like symptoms in BALB/c mice. Life 2024, 14(3), 339. [Google Scholar] [CrossRef]
- Kim, H. J.; Kim, Y. J.; Kang, M. J.; Seo, J. H.; Kim, H. Y.; Jeong, S. K.; Hong, S. J. A novel mouse model of atopic dermatitis with epicutaneous allergen sensitization and the effect of L actobacillus rhamnosus. Experimental dermatology 2012, 21(9), 672–675. [Google Scholar] [CrossRef] [PubMed]
- Mahdavinia, M.; et al. Gut microbiome is associated with asthma and race in children with food allergy. Journal of Allergy and Clinical Immunology 2023, 152(6), 1234–1245. [Google Scholar] [CrossRef]
- Song, H.; et al. Faecalibacterium prausnitzii subspecies-level dysbiosis in the human gut microbiome underlying atopic dermatitis. Journal of Allergy and Clinical Immunology 2016, 137(3), 852–860. [Google Scholar] [CrossRef] [PubMed]
- Hu, Y.; et al. Faecalibacterium: A bacterial genus with promising human health benefits. Frontiers in Microbiology 2023, 14, 10410495. [Google Scholar]
- Fujimura, K. E.; Sitarik, A. R.; Havstad, S.; Lin, D. L.; Levan, S.; Fadrosh, D.; Lynch, S. V. Neonatal gut microbiota associates with childhood multisensitized atopy and T cell differentiation. Nature Medicine 2016, 22(10), 1187–1191. [Google Scholar] [CrossRef]
- Hehemann, J. H.; Correc, G.; Barbeyron, T.; Helbert, W.; Czjzek, M.; Michel, G. Transfer of carbohydrate-active enzymes from marine bacteria to Japanese gut microbiota. Nature 2010, 464(7290), 908–912. [Google Scholar] [CrossRef]
- Quévrain, E.; Maubert, M. A.; Michon, C.; Chain, F.; Marquant, R.; Tailhades, J.; Seksik, P. Identification of an anti-inflammatory protein from Faecalibacterium prausnitzii, a commensal bacterium deficient in Crohn’s disease. Gut 2016, 65(3), 415–425. [Google Scholar] [CrossRef]
- Lee, Y.; et al. Oral administration of Faecalibacterium prausnitzii and Akkermansia muciniphila strains from humans improves atopic dermatitis symptoms in DNCB induced NC/Nga mice. Scientific Reports 2022, 12(1), 7324. [Google Scholar] [CrossRef]
- Cukrowska, B.; et al. Gut microbiota profile in children affected by atopic dermatitis and food allergy. Scientific Reports 2019, 9(1), 4094. [Google Scholar]
- Effendi, W. I.; et al. Faecalibacterium duncaniae as a novel next generation probiotic: A review. Frontiers in Immunology 2024, 15, 1347676. [Google Scholar]
- Demirci, M.; et al. Reduced Akkermansia muciniphila and Faecalibacterium prausnitzii levels in the gut microbiota of children with allergic asthma. Allergologia et Immunopathologia (Madr) 2019, 47(4), 365–371. [Google Scholar] [CrossRef] [PubMed]
Figure 2.
Weight changes.
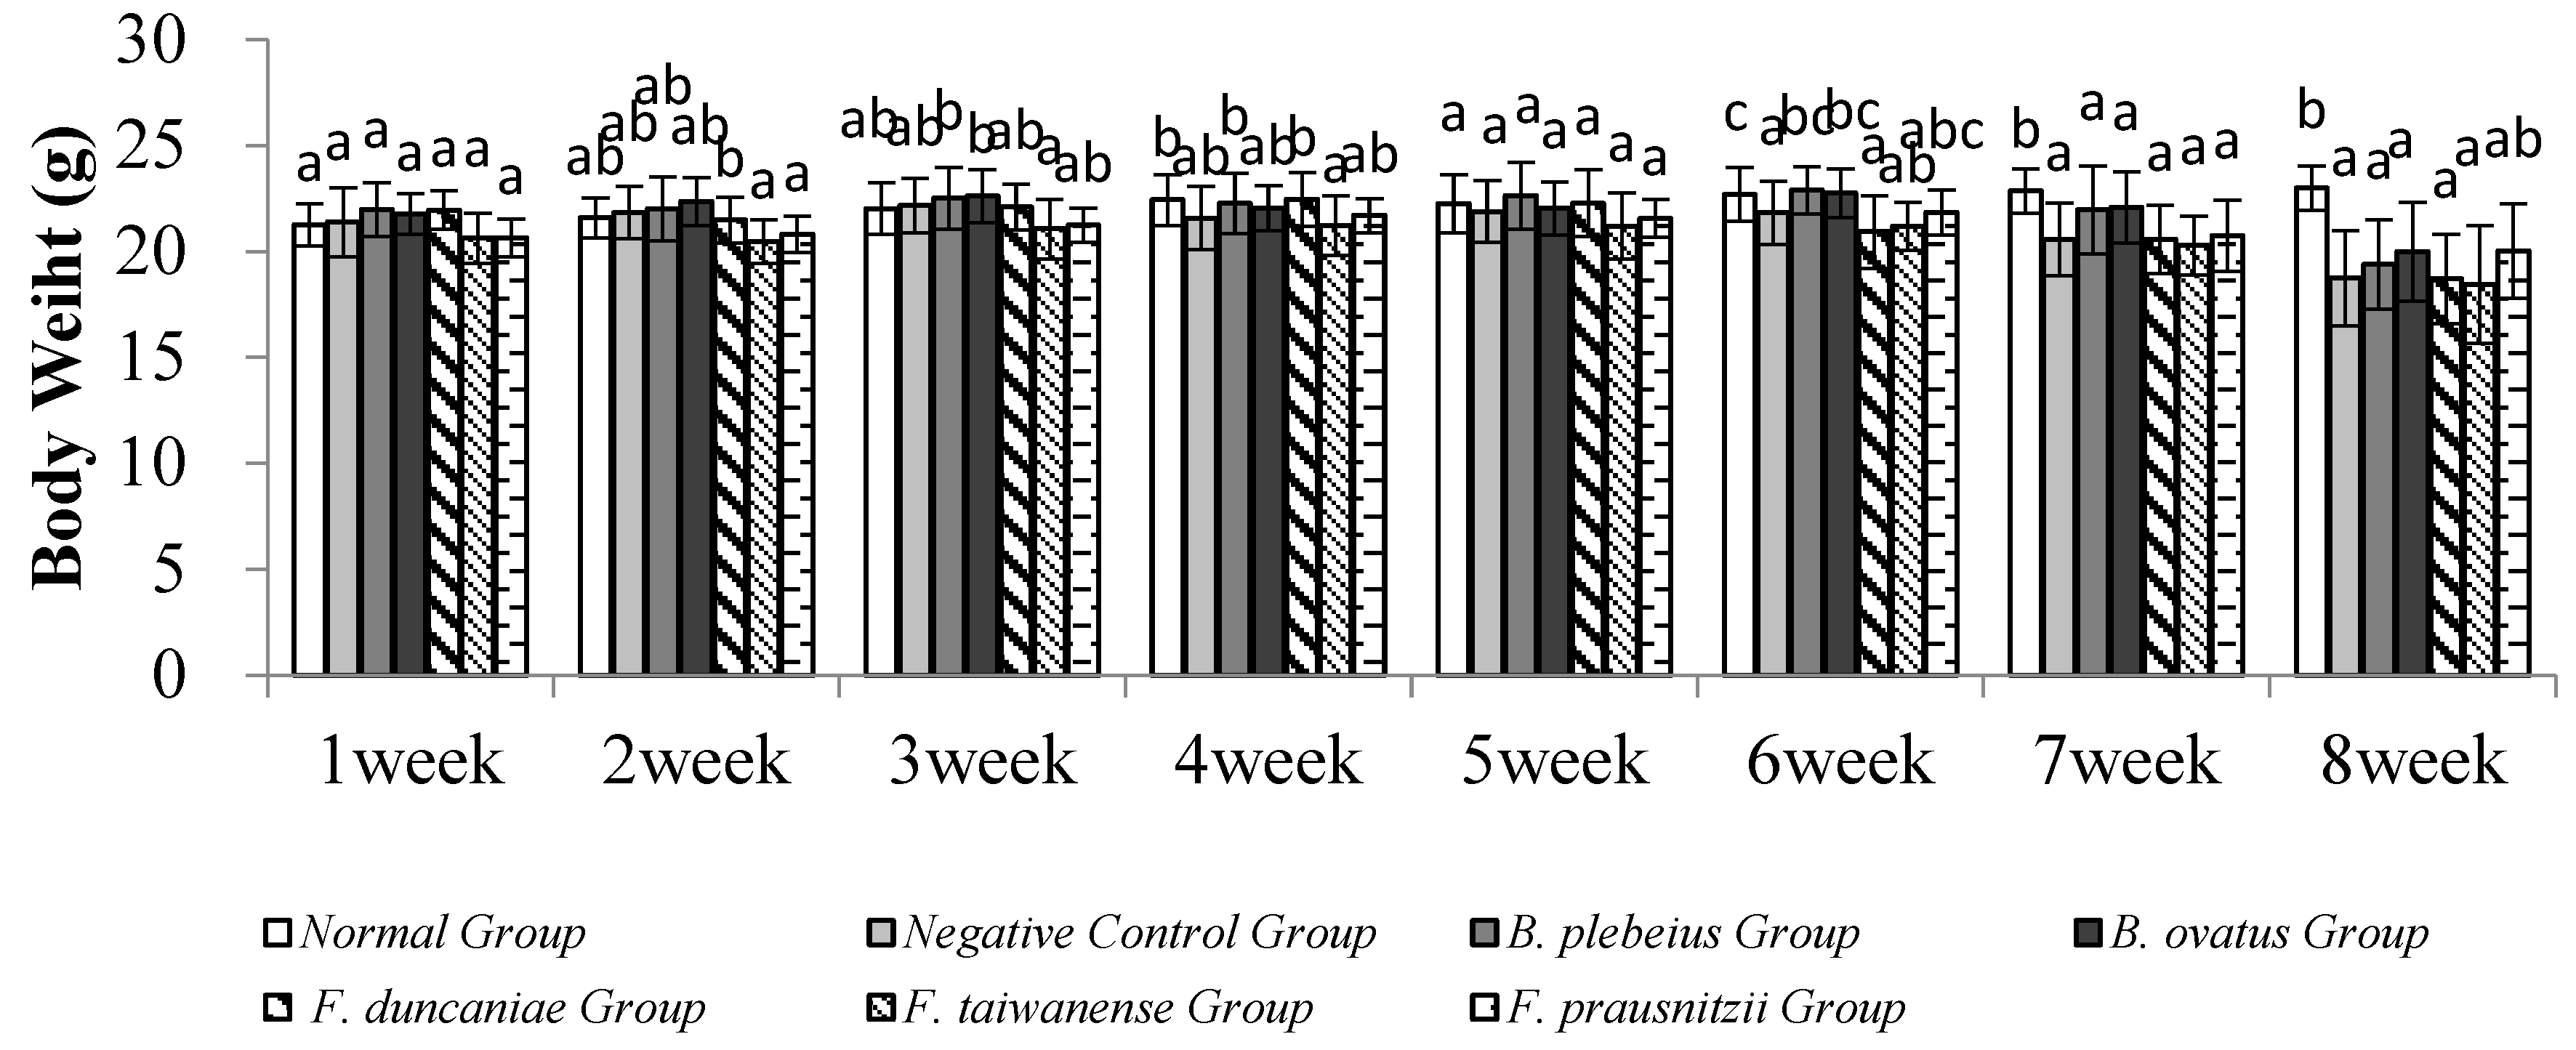
Figure 3.
Total IgE content in serum. a, b, and c represent significant differences (p<0.05).
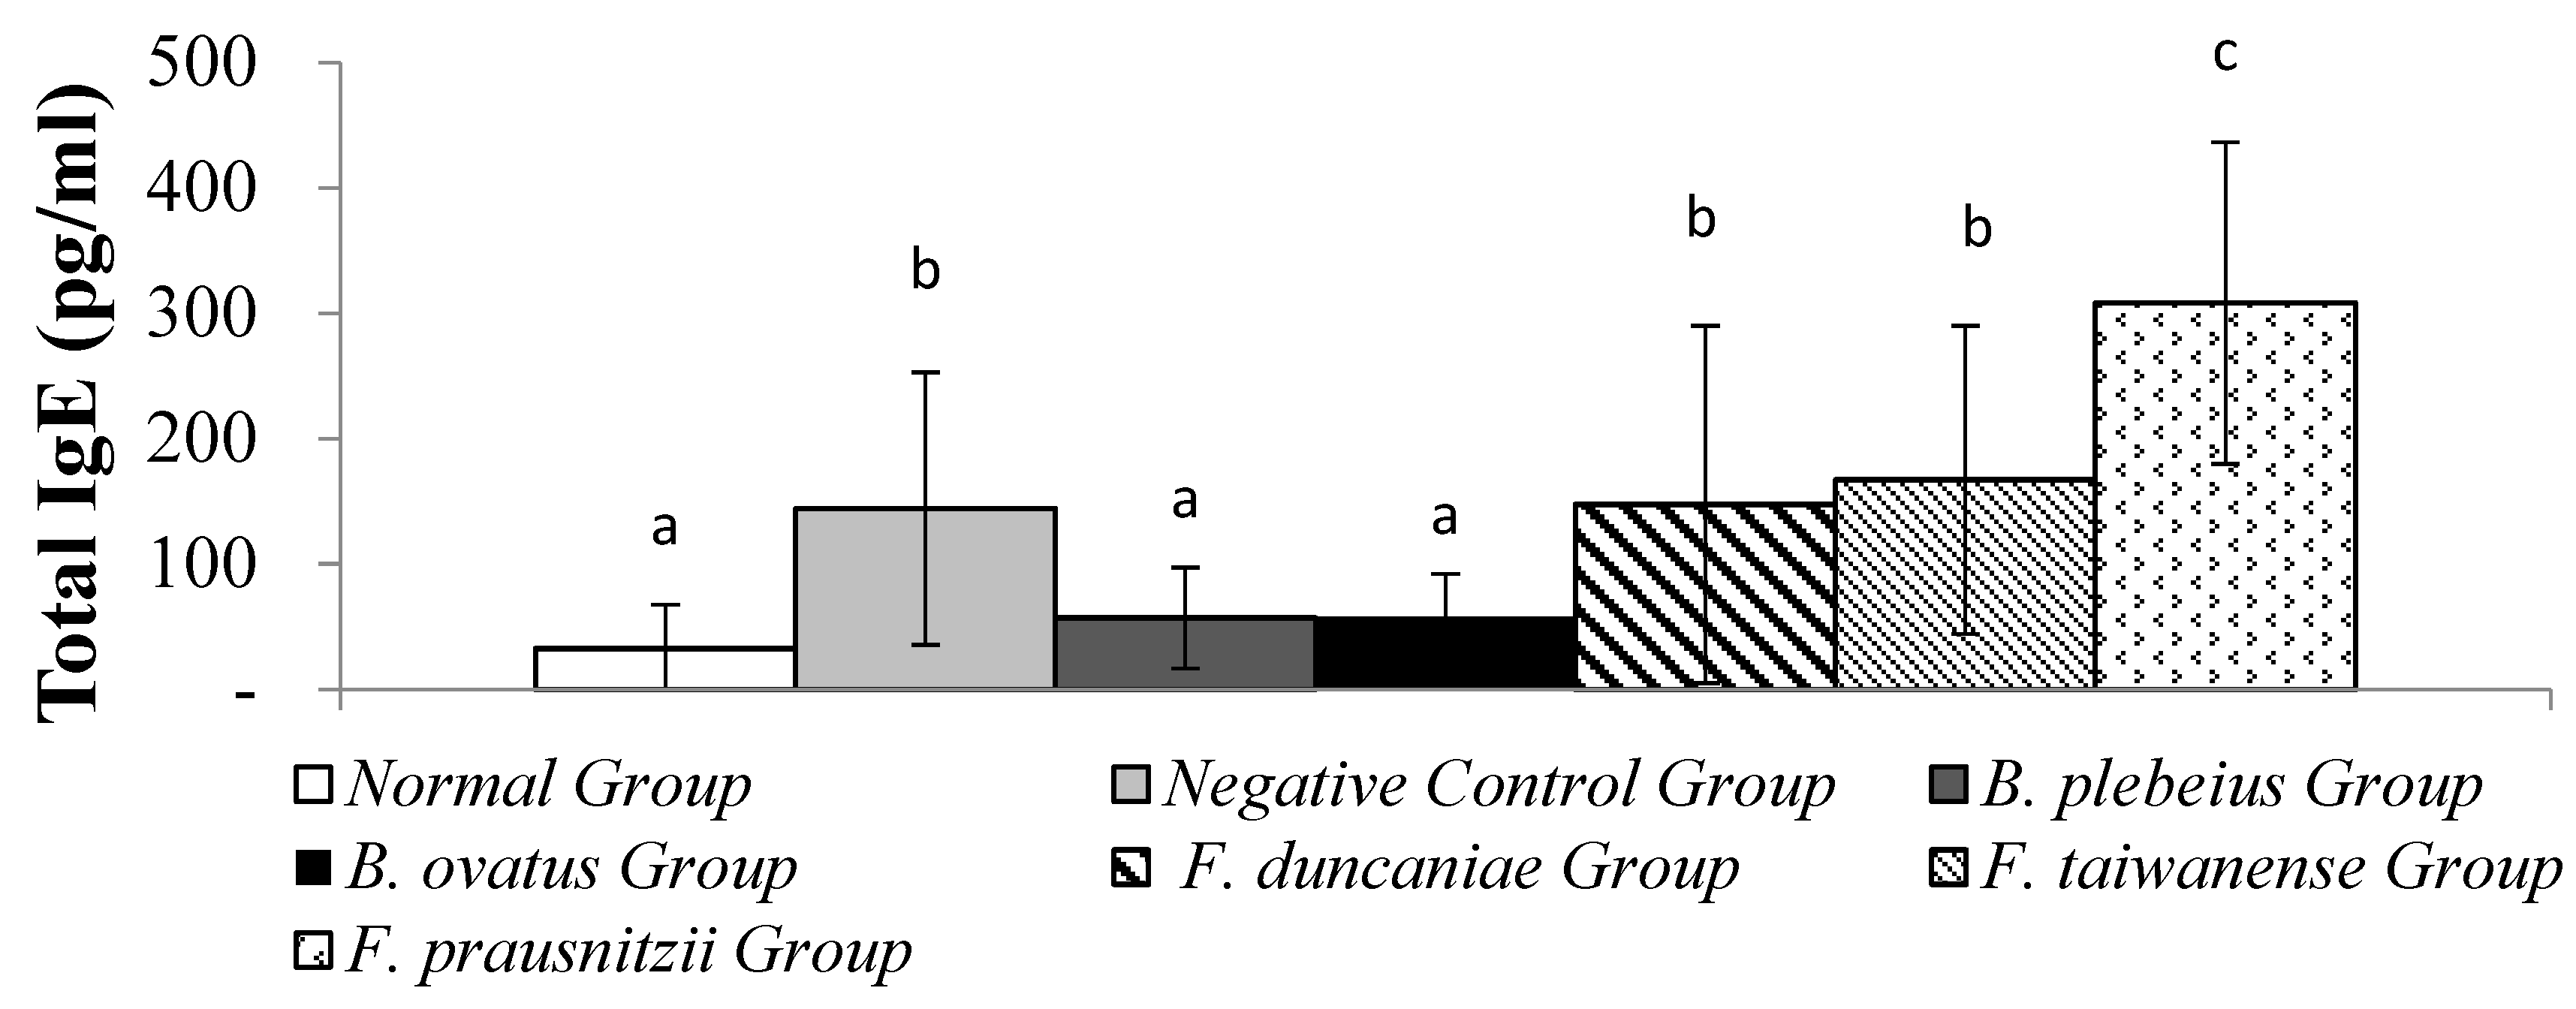
Figure 4.
OVA-IgE content in serum. a, b, c and d represent significant differences (p<0.05).
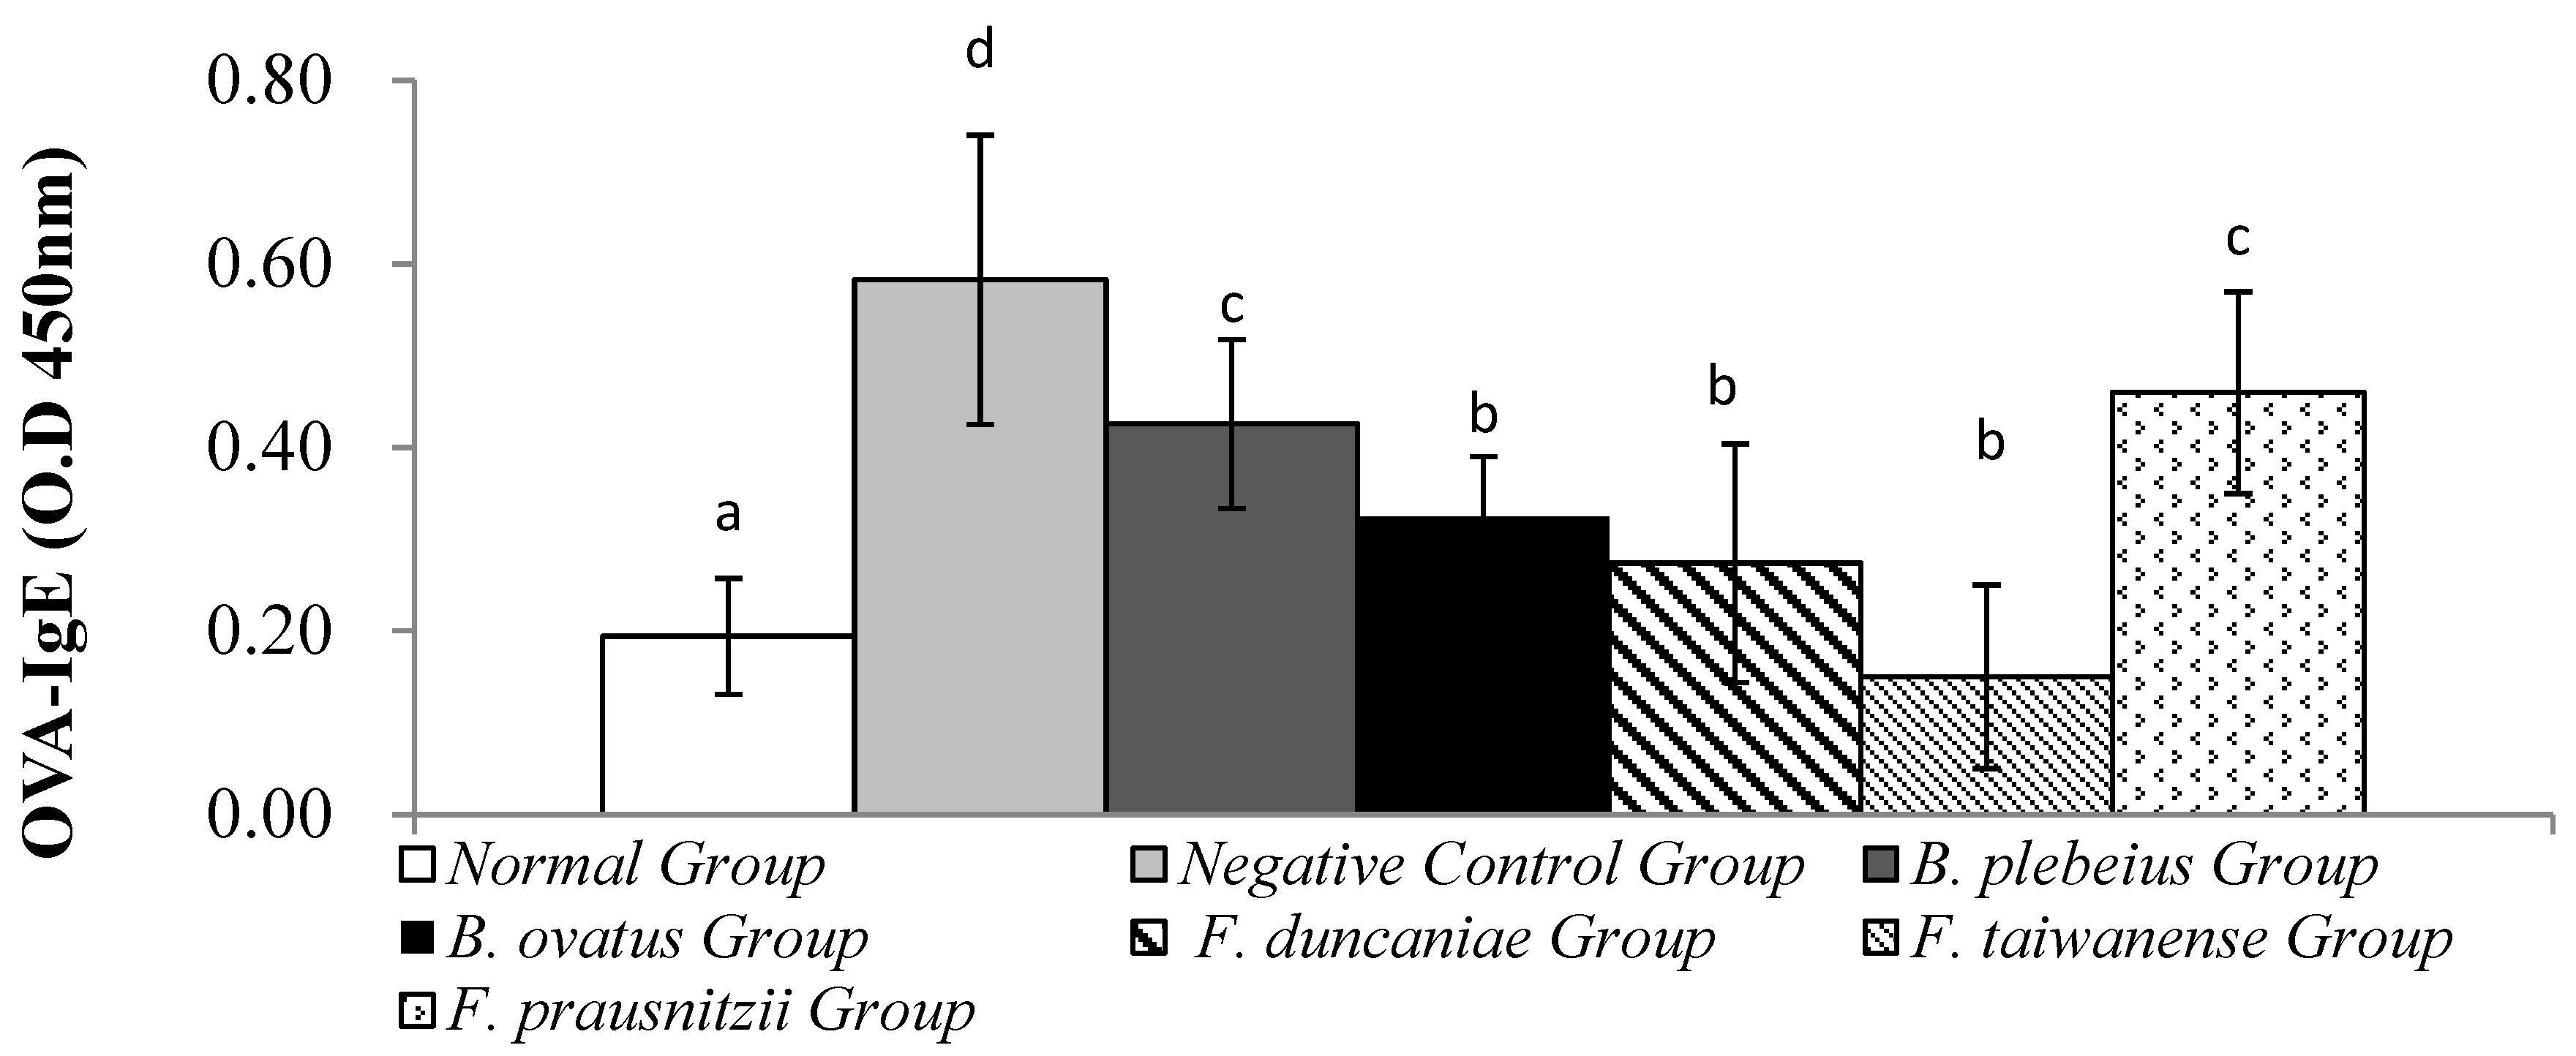
Figure 5.
IL-4 contents in lung flushing fluid. a, b, and c represent significant differences (p<0.05).
Figure 5.
IL-4 contents in lung flushing fluid. a, b, and c represent significant differences (p<0.05).
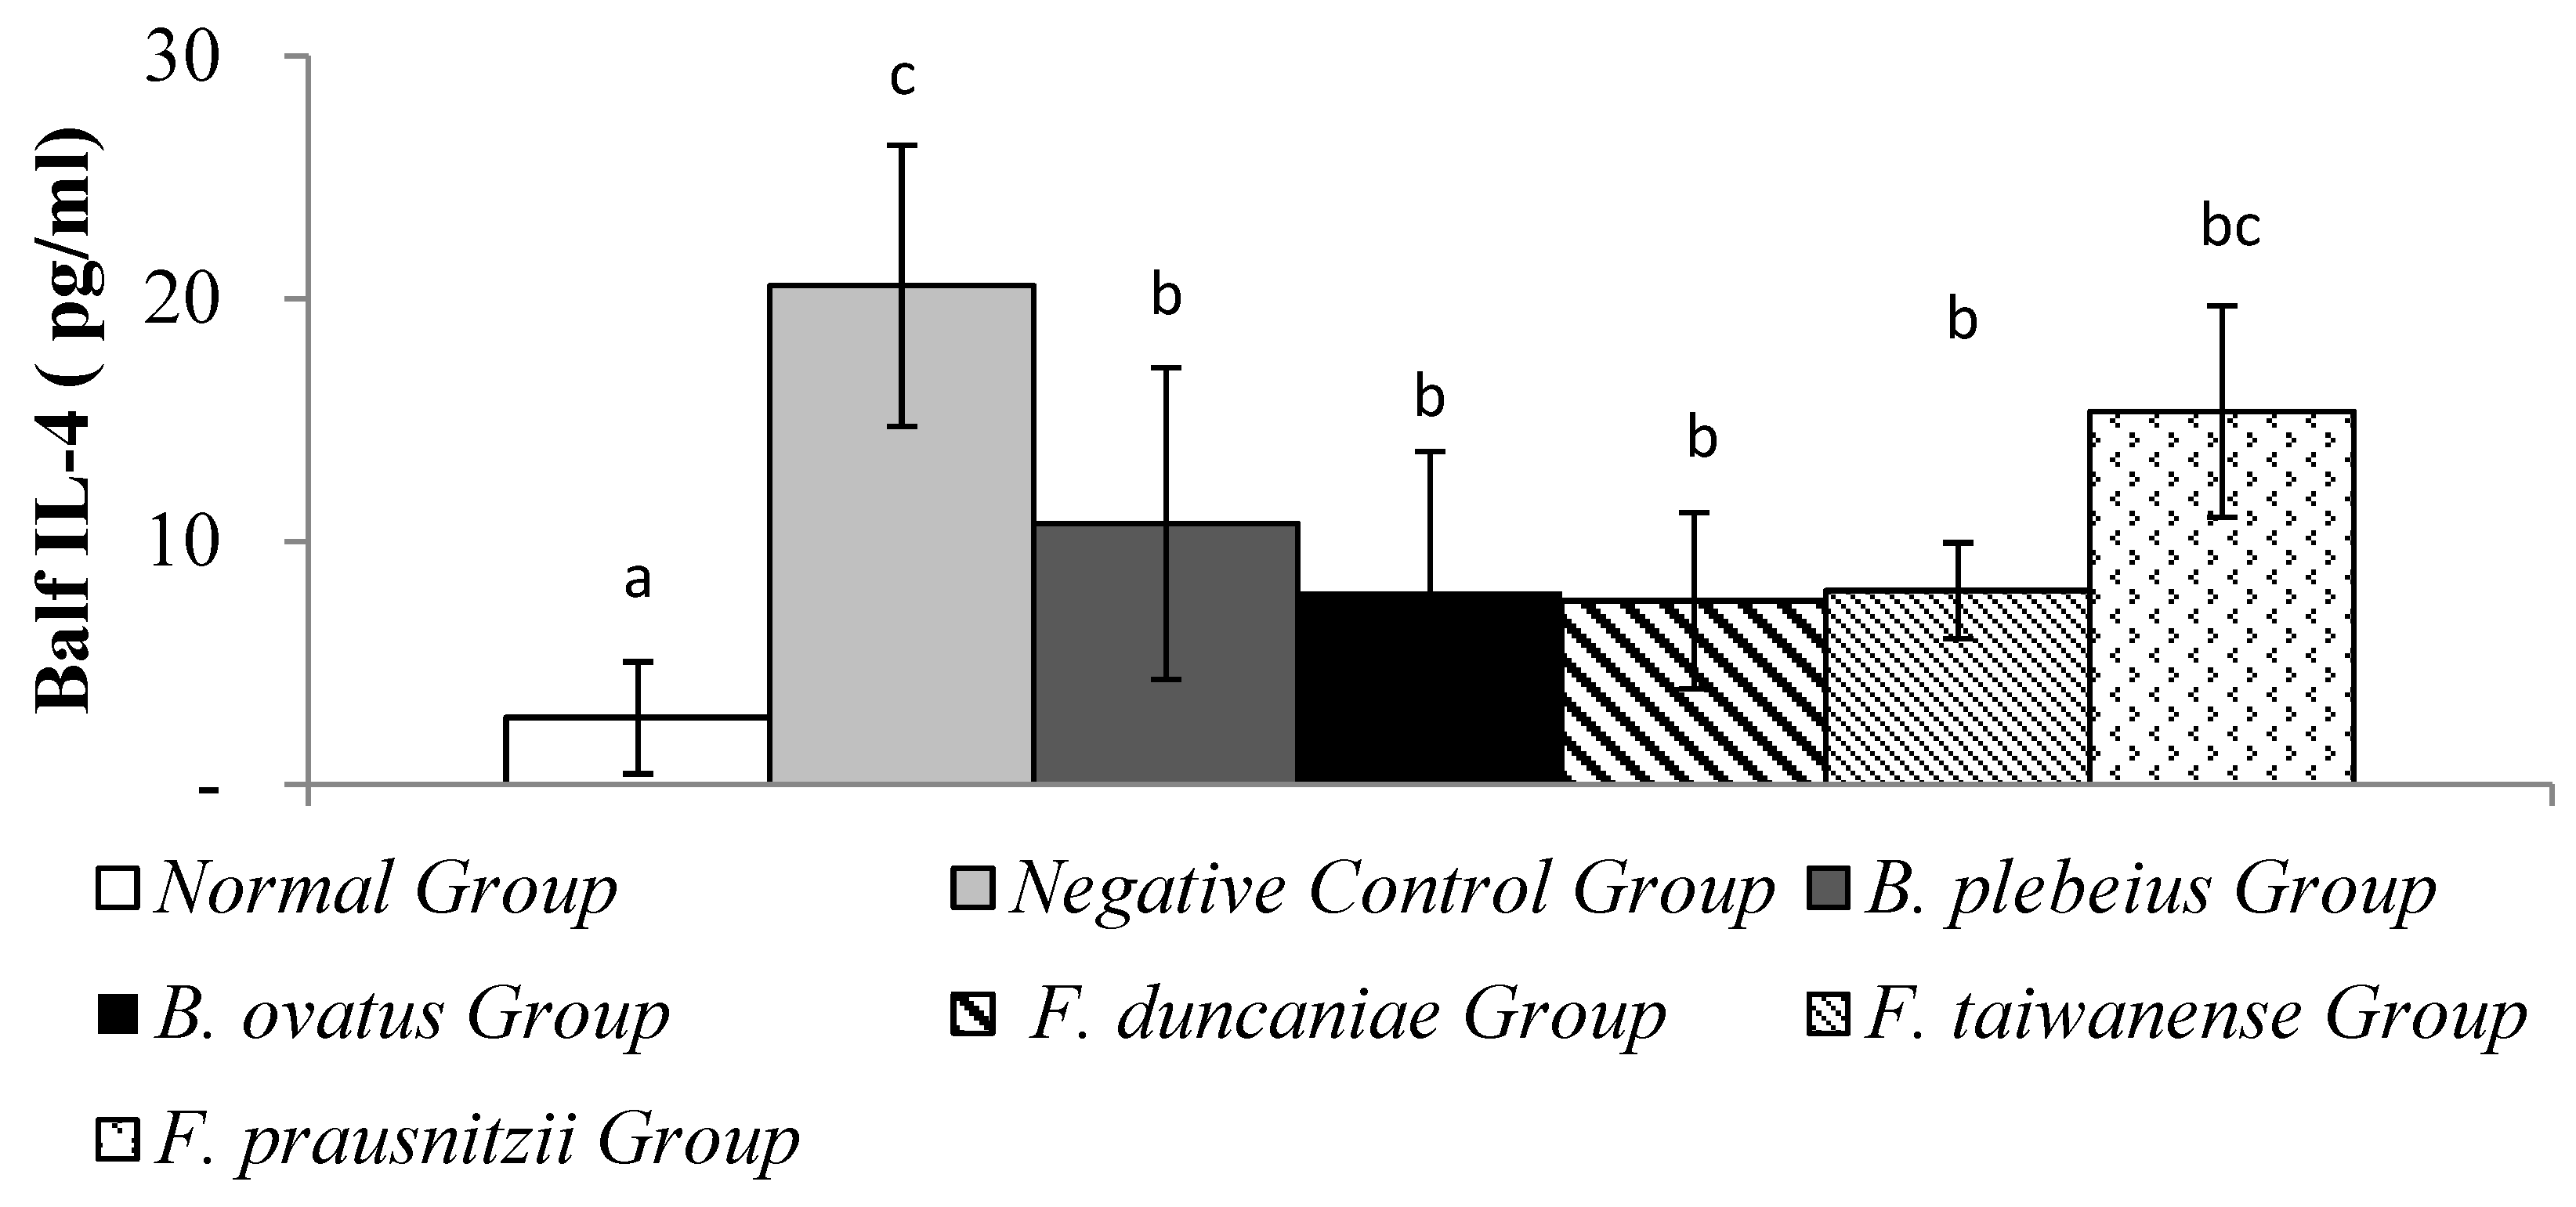
Figure 6.
Expression of IFN-γ in alveolar flushing fluid. a and b represent significant differences (p<0.05).
Figure 6.
Expression of IFN-γ in alveolar flushing fluid. a and b represent significant differences (p<0.05).
Disclaimer/Publisher’s Note: The statements, opinions and data contained in all publications are solely those of the individual author(s) and contributor(s) and not of MDPI and/or the editor(s). MDPI and/or the editor(s) disclaim responsibility for any injury to people or property resulting from any ideas, methods, instructions or products referred to in the content. |
© 2025 by the authors. Licensee MDPI, Basel, Switzerland. This article is an open access article distributed under the terms and conditions of the Creative Commons Attribution (CC BY) license (http://creativecommons.org/licenses/by/4.0/).
Copyright: This open access article is published under a Creative Commons CC BY 4.0 license, which permit the free download, distribution, and reuse, provided that the author and preprint are cited in any reuse.


