Submitted:
06 August 2025
Posted:
07 August 2025
You are already at the latest version
Abstract
This study adheres to a logistic regression modeling protocol originally developed for long-range intelligence analyses and employs data from UN demographic estimates (2024 Revision) to generate a set of statistical functions that suggest a moderately strong relationship between median age and the direction (arithmetic sign) of the international net migration rate (NMR). According to this functional relationship, from 1990 to 2015, the probability of experiencing a persistently positive net migration rate (a +NMR, directly followed by five consecutive years of +NMRs) rose from less than 0.13 at a median age of 15 years, to a probability greater than 0.55 at 36 years, and to nearly 0.78 at 45 years. Assuming that a significant number of countries surpassing a median age of 36 years before 2055 will become continuous migrant net receivers, several countries in Asia, Latin America, and North Africa, for which UN scenarios currently project a continuous series of -NMRs, or a pattern of sign-switching NMRs, will likely experience a continuous series of +NMRs. These results suggest that, by 2055, more of the flow of international migrants could be spread amongst a more varied pool of continuous net-receiving states than the UN’s future scenarios currently indicate.
Keywords:
international migration
; net migration rate
; immigration
; emigration
; demographic projections
; age structure
; political demography
; age-structural models
; median age
1. Introduction
As gaps in income, governance, and political stability have widened between the countries bearing the most youthful distributions of residents (Figure 1) and those countries with population age distributions (age structures) that are more mature, international migration has assumed a greater role in the demographic dynamics of countries, as well as a weightier presence in both international and domestic politics. As a result, the future direction of the international net migration rate (the annual total of immigrants minus emigrants per thousand country residents, from here on abbreviated as NMR) has increasingly become of interest to foreign affairs, defense, and intelligence analysts, as well as to those policymakers who focus on their own country’s migration trends and migration policies, and their political consequences.
The objectives of the following research have been (1.) to statistically demonstrate the tendency of independent states, as they approach the mature phase (Figure 1) of the age-structural transition (the gradual shift from a youthful, high-fertility population to a low-fertility population that is distributionally much more mature), to become continuous net receivers of international migrants, and (2.) to determine when, during the course of this transition, today’s youthful, migrant net-sending countries are likely to assume the role of a continuous migrant net receiver. Toward accomplishing these objectives, the study strives to address three principal research questions: (1.) Can the shift from low to high probabilities of attaining a lengthy series of years with a positive NMR (+NMR, where the population’s proportion of annual immigrants exceeds annual emigrants) be statistically described as a probabilistic function of country-level median age (the age of the person for whom half of the population is younger)? (2.) If so, are there groups of countries (outlier groups) with characteristics that allow them to remain independent of this median-age-related trend? And (3.), if this function exists and its outlier groups are acknowledged, what median age could serve as an appropriate +NMR cut point (the median age at which most countries are predicted to have settled into a continuous series of +NMRs)?
To pursue answers to these questions, the study employs a logistic regression modeling protocol, heuristic conventions, and vocabulary that are drawn from the age-structural theory of state behavior (or simply, age-structural theory). Age-structural theory encompasses a body of research that was originally developed to assist foreign affairs, defense, and intelligence analysts in their efforts to anticipate, over the medium-to-long-term future, changes in the behavior and performance of states [1,2,3] using the UN Population Division’s open-access demographic estimates and projections [4].
Over the course of their studies of migration, geographers and demographers have reasoned that aspects of the demographic transition (i.e., fertility and mortality decline, subsequent shifts in age structure, and trends in population growth or decline)—as well as the broad range of development factors that this transition affects, and the factors that affect it (which appear as correlates)—influence international migration [5,6,7]. Moreover, preliminary examinations of the UN’s most recent NMR data [4] in regions where countries have approached or entered the mature phase of the age-structural transition (see Figure 1) are suggestive of a statistical tendency among countries to settle into a continuous, or near-continuous, series of +NMRs (Figure 2) before the close of the demographic window (a series of fiscally advantageous and development-favorable age structures that countries typically encounter between the median ages of about 26 and 40 years [1,8]).
The following analysis is intended to provide demographic projectionists and strategic foreign affairs analysts with two potentially useful products: (1.) a practical estimate of the range of median ages across which most countries are likely to cease producing either a continuous series of −NMRs or various patterns of sign-switching NMRs (shifts from −NMRs to +NMRs and back again), and instead settle into generating an unbroken, or nearly unbroken, series of +NMRs; and (2.) the identification of several economic, political, and demographic outlier groups that are likely to remain independent of this age-structural relationship.
The discussion that follows these results focuses on countries in developing regions that the UN medium scenario projects will newly enter or closely approach the mature phase of the age-structural transition by 2055. Among this set are countries that are projected—using Bayesian statistical methods that have been adopted by the UN Population Division [10,11]—to generate either −NMRs, or sign-switching NMRs, but which could (according to the following modeling results) undergo a shift to a continuous series of +NMRs. The essay concludes with some brief speculation on the identity of these countries and the possible sources of their immigrant populations.
2. Materials and Methods
2.1. Geographic and Temporal Extent of Data
The study’s list of independent states was drawn from the United Nations worldwide list of countries but excluded: (1.) non-independent political entities (e.g., Hong Kong, Palestine, and Western Sahara); and (2.) independent states with a resident population of fewer than 500,000 individuals (thus, currently excluding Belize, Iceland, Brunei, and numerous small-island states) [4].
Whereas data from 1970 to 2019 were used for preliminary analyses, to minimize missing data from now-extinct (Cold War era) states and to focus on the increasingly large group of low-fertility countries that were nearing the end of the intermediate phase of the age-structural transition or had entered its mature phase, the study’s statistical modeling effort was primarily targeted on the period from 1990 (the beginning of the post-Cold War era) to 2015. Data during the years 2016 to 2023 (the latter, the final year of the UN 2024 revision of its demographic estimates [4]) were reserved for use in out-of-sample tests.
To address an early reviewer’s concern, a separate effort was made to generate results for some of the Cold War years, 1970 (a year when most overseas colonies of Western powers had achieved independence) to 1989, and then to model the entire data set, from 1970 to 2015, by excluding the extinct political entities for which NMR and median age data were unavailable or incompatible with the most recent revision of the UN demographic estimates [4] (the results of which (Appendix A4, Table A4) supported the earlier decision to use 1990 to 2015 data).
2.2. Age-Structural Modeling
The statistical technique used in this analysis, logistic regression analysis, employs an iterative algorithm and maximum likelihood estimation to fit a simple logistic curve to a series of dichotomous observations of a dependent variable, y=[,1], across the domain of a continuous variable, x, yielding a monotonic probabilistic function, P(x) [12]. The following analysis adheres to age-structural modeling’s logistic regression protocol [1], which restricts the user’s statistical model to a logit (equation 1) in which k is a constant and a mediates the pitch of the curve, yielding a probabilistic logistic outcome function (equation 2), P(m). At any median age, m, within the data’s coverage of the continuous median-age domain, M, which simulates the age-structural transition, P(m) predicts the probability (P) of observing the condition y=1.
During the course of research using age-structural modeling, two groups of states have been shown to frequently behave independently of median age. Each is included in the logit of age-structural modeling’s standard model, P(m)*, and is statistically isolated (i.e., controlled) and assessed as the product of a dichotomous independent (dummy) variable and corresponding coefficient:
For purposes of deductively hypothesizing the effects of additional characteristic groups of states, this modeling protocol allows for any number of experimental dichotomous (dummy) variables (C1, C2, …, C n) and their corresponding coefficients (c1, c2, …, cn). However, in order to maintain its analysis solely in the median-age domain, age-structural modeling’s logistic regression modeling protocol does not permit additional continuous variables.
When graphed across M, the resultant probabilistic age-structural function, P(m), ideally assumes the form of a simple logistic curve—a positively or negatively sloping sigmoid, monotonic function with its inflection point, IP, fixed at a probability of 0.50. However, as a best fit to dichotomous data in M, the logistic regression algorithm can also generate a partial segment of a simple logistic curve (i.e., a positively or negatively sloping tail).
Whereas a two-dimensional visualization of P(m) provides indications of the direction, age-structural timing, and completeness of the probabilistic shift from conditions where y=0 dominates, to conditions where y=1 dominates, aspects of this shift can be quantitatively assessed and compared using several additional indicators (shown in the logistic regression tables in Appendix A):
- the median age at the inflection point, IP, which is indicative of the age-structural timing of peak change;
- P(15), which reflects the probability at which countries are likely to attain y=1 in the earliest phase of the age-structural transition;
- P(45), which indicates the probability of y=1 near the beginning of the post-mature phase of the age-structural transition; and
- an estimate of the function’s first derivative at IP, , indicating how abruptly (steeply) the shift from y=0 to y=1 occurs (a larger P’(IP) indicates a steeper shift to y=1 around the inflection point).
To generate age-structural modeling’s standard age-structural function, P(m)* (i.e., a function that can be compared to similarly modeled functions of other age-structural analyses), the iterative logistic regression algorithm is tasked with fitting parameters for the logit’s constant, k, its pitch, a, and for generating values for the coefficients, bRR and bLP, of its two standard dummy variables, BRR and BLP. In this logit of the standard age-structural model, experimental dummy variables and their coefficients, ciCi, are not permitted.
2.3. The Dependent Variable: Persistently +NMR
Preliminary evidence of frequent NMR sign switching in the early and late youthful phase of the age-structural transition called attention to the need for an outcome variable that would:
- reflect a substantial degree of serial continuity of +NMRs, rather than respond to each acute +NMR or discontinuous set of +NMRs in countries that frequently undergo NMR sign switching; and
- exhibit a monotonic functional relationship with median age that would be an appropriate fit for logistic regression analysis.
To meet these criteria (Figure 3), each country datum (i) of the continuous variable, NMR, was transformed to a dichotomous variable, , such that:
Thus, yi during a specific year (t0) was assigned the integer value of one (1) if NMRi,t0 was positive, and only if NMRiremained positive during each of the following five consecutive years (t1→t5).
2.3. Within-Sample and Out-of-Sample Testing
The standard form of the age-structural function, (m)*, was validated by comparing its functional probability of a persistently +NMR to a discrete within-sample reconstruction of the curve (i.e., means and standard deviations for four within-sample years: 1995, 2000, 2005, and 2010) and an out-of-sample test using 2016-to-2018 data (for definitions of the discrete median-age categories used, see Figure 1). To comply with the standard model, two outlier groups were omitted: (1.) the set of consistently resource-reliant states (i.e., often referred to as rentier states, including the six Gulf Cooperation Council states, Angola, Equatorial Guinea, Gabon, Iran, Iraq, Kazakhstan, Libya, Timor-Leste, and Venezuela), and the set of (2.) least populated states (fewer than 5.0 million residents).
2.4. Experimental Analyses
Several experimental factors were added as dummy variables to age-structural theory’s standard logit in order to statistically isolate countries with hypothetically influential characteristics from the logistic regression’s curve-fitting algorithm. These hypothetically influential factors were assessed by dummy variables that controlled for:
- Freedom House’s “Not Free” status states (the category representing the lowest Freedom Scores) (Appendix A.3, Table A3, Model A3b) [14],
- high-income countries in the World Bank lending categories (Appendix A.3, Table A3, Model A3c, A3e) [15], and
- Freedom House’s “Free” status states (the highest Freedom Scores) (Appendix A.3, Table A3, Model A3d, A3e) [14].
Logistic functions were also generated in response to early review questions using the standard model for pre-1990 (during the Cold War) data, as well as the full set of data from 1970 to 2015 (Appendix A.4, Table A4, Model A4c) [4]. To address the concern that post-catastrophic surges of migration, whether high-amplitude negative or positive NMRs (|NMR|>10.0), disrupted the overall age-structural pattern leading to mature net receivers, functions with and without high-amplitude NMRs were generated and compared (Appendix A.2, Table A2, Models A2a, A2b) [4],
2.4. The Empirical Peak Shift to Persistently +NMRs
Being a two-dimensional simple logistic function, both the inflection point of P(m)* and the theoretical maximum (peak) of its first derivative, P’(m)*, reside at a median age where the probability of a persistently +NMR is 0.50 (Appendix B.2, Figure A2). This theoretical assumption was validated by individually identifying (and graphing) the median age at which countries first began a series of five consecutive persistently +NMRs (thus, 10 consecutive +NMRs) [4]. For this test, data were omitted to account for the standard model’s two controls: for the set of consistently resource-reliant states, and for a set of least populated states.
2.5. A Cut Point for +NMRs
In logistic regression analysis, the cut point (or cut-off point) separates the portion of the logistic function that is dominated by dichotomous data with the value of y=0, from that portion dominated by y=1 [12]. Statistical software typically sets the default cut point at the simple logistic function’s inflection point, above which the theoretical probability that y=1 is 0.50, and the odds ratio (correct predictions divided by incorrect predictions) is 1.0 (i.e., 1 to 1). In practice, however, analysts often adjust the cut point to increase the odds of a correct prediction (a true positive)—thus lowering the odds of a false positive, while increasing the risk of missing true positives just below the cut point.
In this analysis, two indicators of predictive success were generated for P(m)*:
- the proportion of correct predictions of +NMRs at median ages higher than the cut point’s median age (a proportion that is expected to decrease as the cut point increases), and
- the odds ratio of a correct predictions of +NMRs (a ratio that is expected to increase as the cut point increases).
Using these two measures, a pair of graphs were generated—the first based on theoretical calculations from the standard model’s functional probabilities, the second on empirical data:
- The theoretical graph uses a proportion of correct predictions and the odds ratios that were generated from the functional probabilities of P(m)*. These results assume a limitless number of evenly distributed observations and a precise fit to the standard model, P(m)*. In this theoretical graph, the cut point was moved from a median age of 15 to 48 years.
- The second graph describes empirical proportions of correct predictions and odds ratios that were determined from reserve data (years 2021 to 2023). For these empirical results, the cut point was started at a median age of 15 years and ended at 42 years, after which less than 15 observations were available.
3. Results
The following section summarizes the results of a series of logistic regression analyses (Appendix A, Table A1, Table A2, Table A3 and Table A4) that address the study’s primary research questions (as well as to address reviewers’ questions and comments). These results are described in the following narrative and are portrayed as probabilistic functions in the median-age domain.
3.1. Age Structure’s Relationship with Persistently +NMRs
- The standard age-structural function portrays a relationship of moderate strength in which the probability of a persistently +NMR (a +NMR, followed by five consecutive +NMRs) gradually accumulates as states advance through the age-structural transition (Figure 4a). States exceeding a median age of 34 years have a probability greater than 0.50 of being persistently +NMRs.
The fitted standard logistic function, P(m)*, covers the period from 1990 to 2015 data and employs age-structural analyses’ two controls: resource-reliant states (total natural resource rents greater than 20.0% of GDP), and the least populated states (less than 5.0 million residents) (Appendix A.1, Table A1, Model A1b). This analysis suggests that, at a median age of 15 years, most non-resource reliant states and those with populations greater than 5.0 million are expected to experience a low (although non-zero) probability of experiencing a persistently +NMR (p=0.13±0.02). This curve reaches its inflection point (p=0.50) near the close of the intermediate phase of the age-structural transition (at a median age of 34±2 years). By the median age of 45 years, the probability of a persistently +NMR is expected to have risen to relatively high levels (p=0.76±0.03).
For the purpose of validation of the function, P(m)*, of the standard model, categorical proportions (for categories, see Figure 1) for both within-sample means and 2016-to-2018 out-of-sample means (Figure 4b) were found to be fairly consistent with the statistically generated logistic representation of this relationship.
Early reviews of this research noted that NRM data are irregularly punctuated by high-amplitude NMRs (|NMR|> 10.0) which (a reviewer suspected) would influence the pattern of persistently +NMRs among youthful countries, where high-amplitude −NMRs and +NMRs are frequent (Appendix B.1, Figure A1a–c) due to catastrophic events in-country and in neighboring countries (e.g., armed conflict, famine, economic and political instabilities, etc.). However, the segregation of both negative and positive high-amplitude NMRs as dummy variables (Appendix A.2, Table A2, Models A2a, A2b) neither appreciably altered the inflection point nor the form of the resultant logistic function.
Another early review questioned the decision to avoid using data from 1970 to 1989. Despite missing data from states that became extinct at the end of the Cold War (e.g., the Soviet Union, Yugoslavia, Czechoslovakia, and the German Democratic Republic) and, in the 1970s and 1980s, a dearth of countries with populations in the mature phase of the age-structural transition, logistic regression fit a similar logistic function to available data from 1970 to 2015 (Appendix A.4, Table A4, Model A4c).
3.2. Outlier Groups
- This best-fit logistic function was generated by statistically controlling for three sets of countries—resource-reliant states, the least populated states, and states the most autocratic states—whose pattern of net migration has been either largely unresponsive to movement through the age-structural transition, or otherwise inconsistent with the median-age-related pattern followed by the majority of states.
For example, at youthful and intermediate phases of the transition, when most countries are net senders of migrants, resource-reliant states (total natural resource rents greater than 20.0% of GDP) stand out as youthful net receivers of migrants (i.e., a negative coefficient) of labor migrants. In contrast, the least populated states (with less than 5.0 million residents, many of which are small-island states) tend to act as net senders (i.e., having a positive coefficient) of migrants to diaspora communities, even in the late-intermediate and mature phases of the transition.
In addition, most of the migrant net senders (−NMRs) that persist through the transition’s late-intermediate phase or into the mature phase can be statistically isolated by the optional inclusion of a third dummy variable isolating politically repressive states in the logit equation. These age-structurally intermediate and mature outliers were identified as “Not Free” in Freedom House’s annual global assessment of political rights and civil liberties (Appendix A.3, Table A3, Model A3b), and include Belarus, China, Cuba, Democratic People’s Republic of Korea, Iran, Russia, Venezuela, and Viet Nam.
Notably, neither the addition of the two standard controls (resource-reliant states and the least populated states), nor of “Not Free” states in the 1990-to-2015 logit equation (Appendix A.3, Table A3) substantially moves the logistic curve’s inflection point beyond the 0.95 confidence limits of the original function (without controls, Appendix A.1, Table A1, Model A1a) or substantially alters probabilistic outcome values at its extreme median ages (i.e., at P(15) or P(45)).
3.3. Evidence of Proximate Effects
- The results of additional experimental analyses suggested that both high levels of per-capita income and high levels of political rights and civil liberties were strong proximate contributors to a lengthy succession of +NMRs.
When added to the logit equation as dichotomous independent variables, individually or together, the presence of states in the World Bank’s high-income lending category [15] and states assessed as “Free” in Freedom House’s annual survey [14] altered the functional form of the logistic relationship and, when both included in the logit, removed much (but not all) of the probability of a persistently +NMR that is associated with median age. Of the two, the effect of controlling for high per-capita income was substantially stronger than the effect of a “Free” assessment.
3.4. The Shift to Persistently +NMRs
- Future shifts, from −NMRs to a long series of persistently +NMRs, are expected to occur as countries surpass the inflection point of P(m)*, at median ages centered around 34(±2) years.
A review of NMR data disclosed a pattern of direction shifting (Figure 5) that has been roughly consistent with the model’s theoretical expectations (Appendix B.2, Figure A2)—i.e., that the shift to a lengthy series of persistently +NMRs, although not restricted to any portion of the transition, has peaked around the model’s inflection point. Notably, the collection of independent countries that have joined the set of migrant net-receiving states since 1970 has been regionally diverse, including states in Latin America (Argentina, Chile, and Colombia), southern Africa (South Africa), Europe (Ireland, Spain, and the United Kingdom), and East Asia (Japan, the Republic of Korea, and Taiwan).
3.5. A Median-age Cut Point for +NMRs
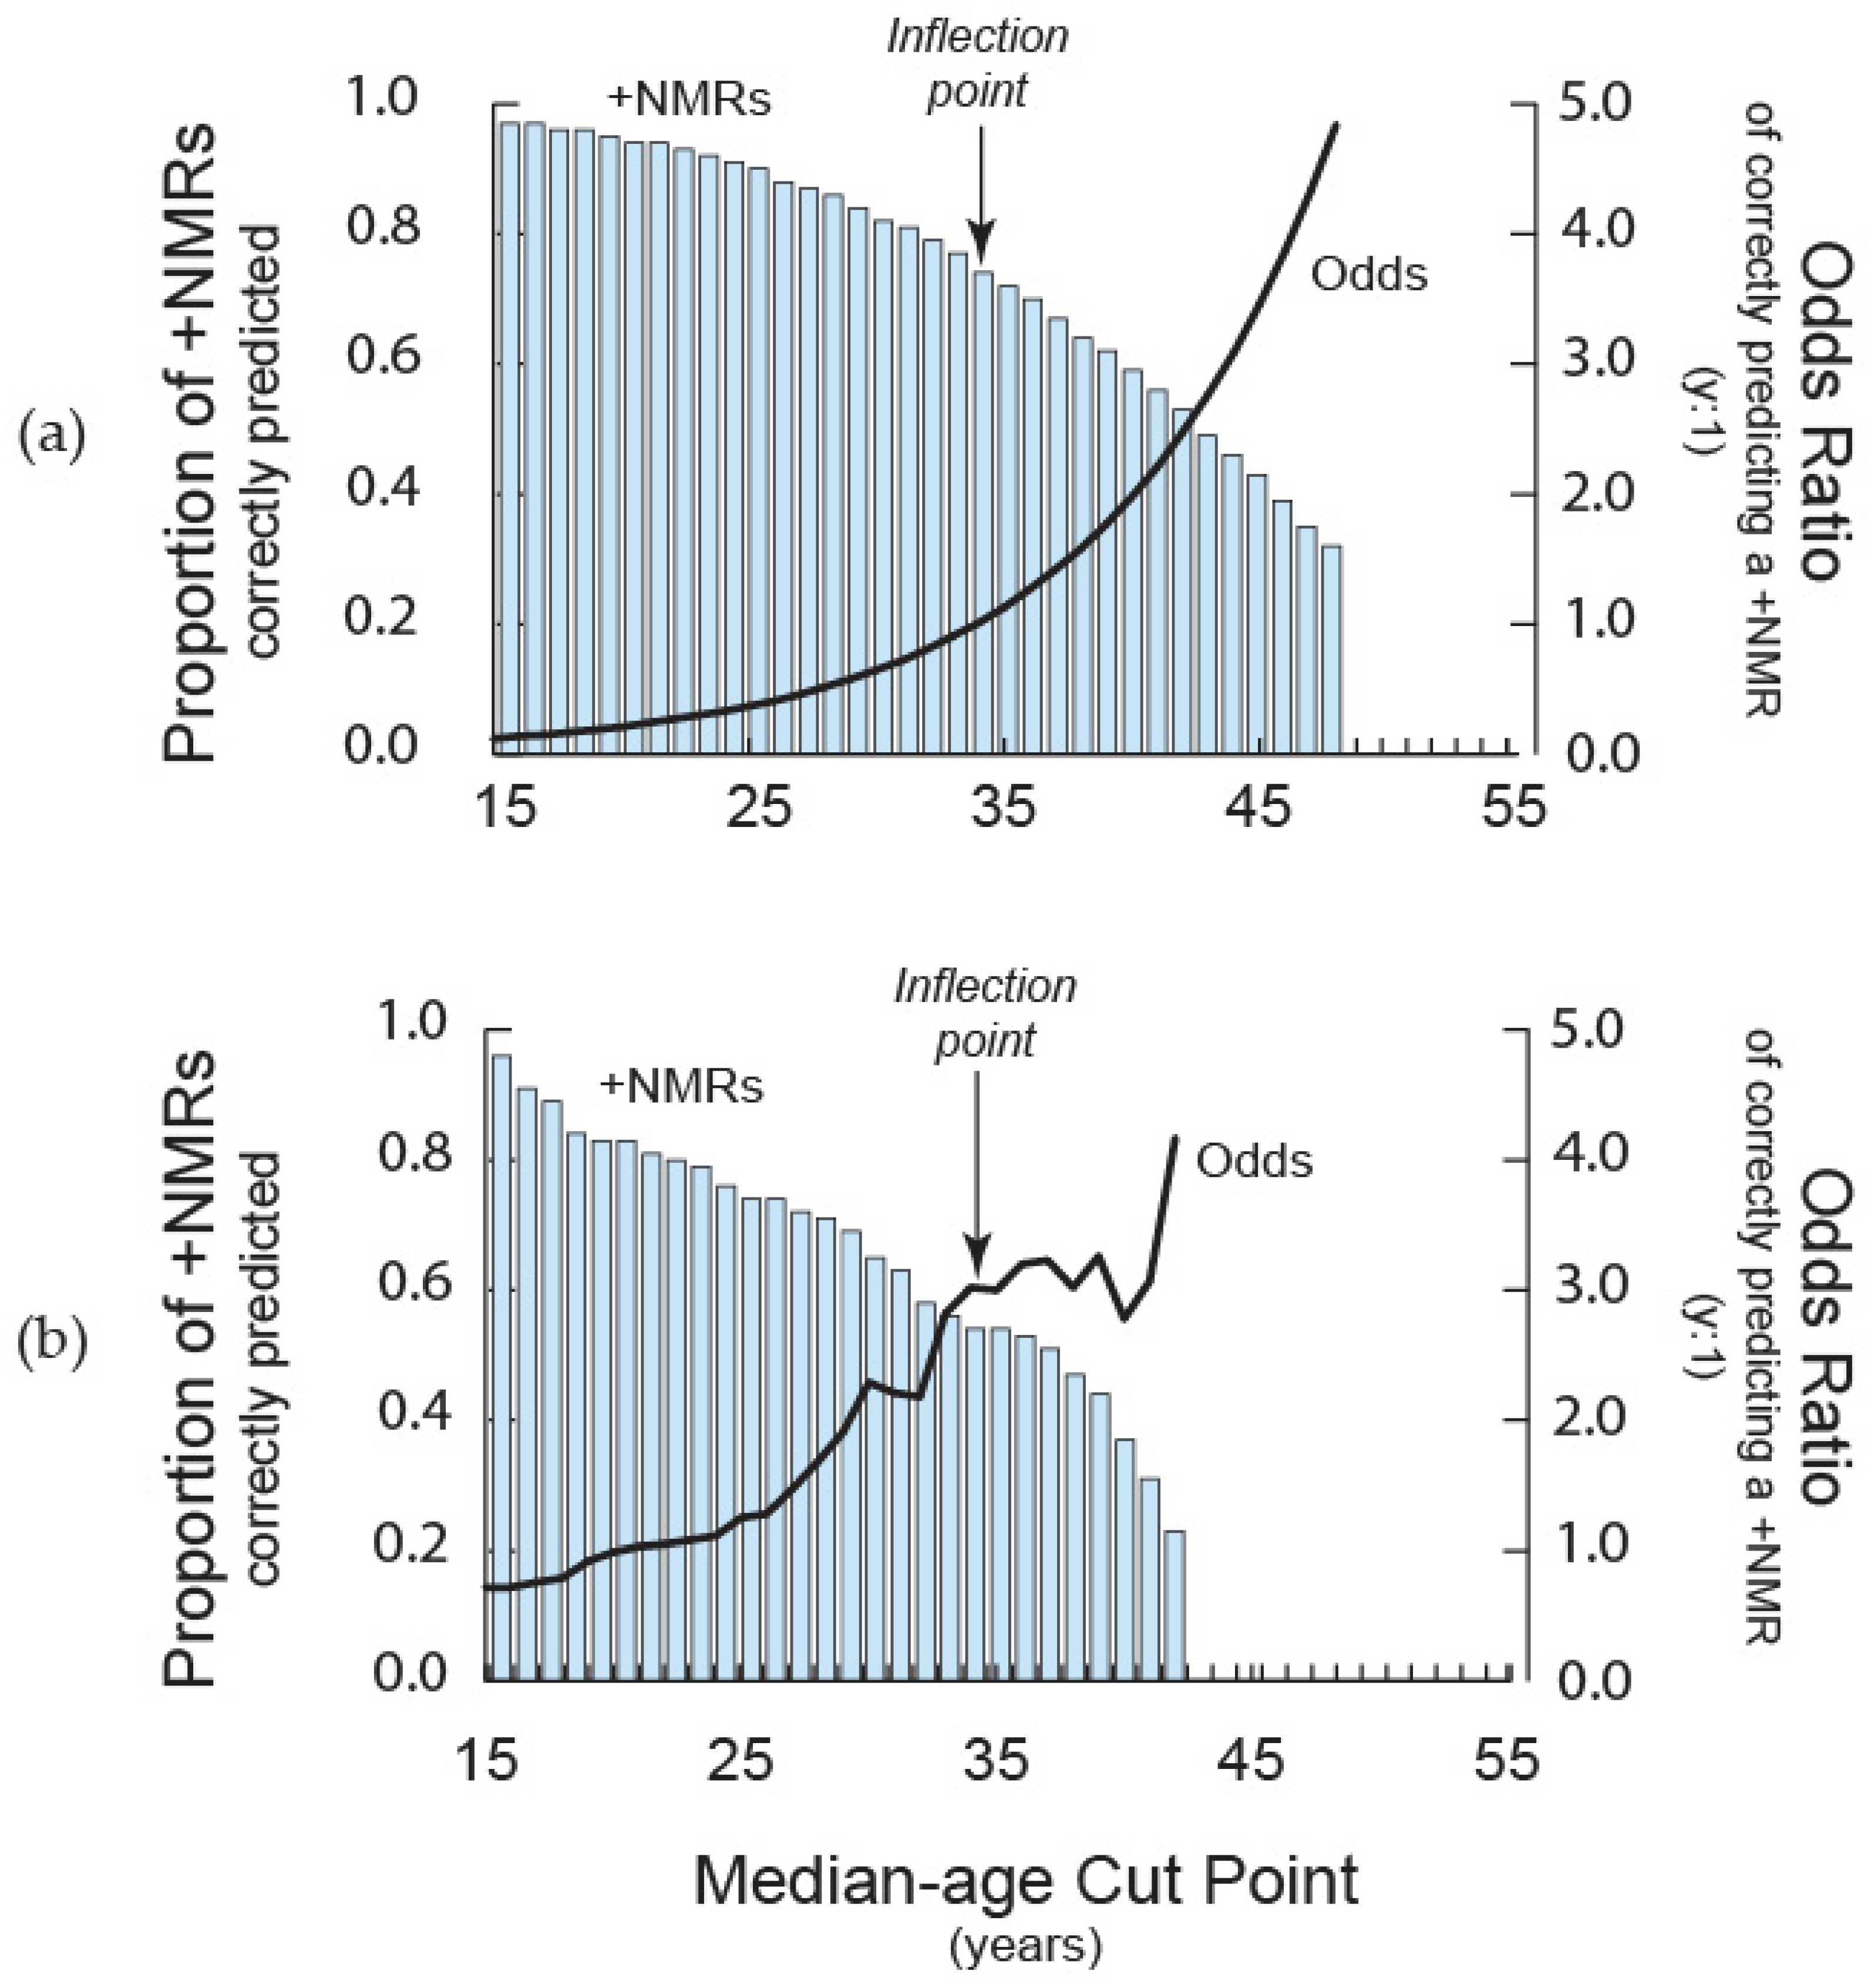
- As an alternative to employing the inflection point of P(m)* as the default cut point, empirical calculations (Figure 6b) using reserved data (years 2021 to 2023) indicates that a median-age cut point between 35 and 39 years would (at least, at present), provide relatively high odds of prediction success (around 3 to 1) with a relatively small sacrifice in the proportion of correct predictions of +NMRS.
Logistic regression’s iterative algorithm is designed to maximize the likelihood of separating data dominated by instances of y=1, from data dominated by y=0, at the function’s inflection point. However, at this cut point (where P(m)=0.50), the odds of a correct prediction are, by definition, 1-to-1—a level of predictive success that, in practice, is usually unacceptably low for forecasting. Nonetheless, advancing the cut point to attain higher odds of a correct prediction often entails passing over potentially correct predictions, some of which could be critically important to the prediction’s ultimate users.
This cut-point tradeoff becomes apparent when theoretical prediction odds are calculated from the functional probabilities that were fit to P(m)* (Figure 6a). In this theoretical calculation (which assumes limitless countries, and data that are perfectly fit to the function and evenly distributed across the age-structural transition) a cut point with 2-to-1 odds of a correct prediction can only be achieved at a median age of 40 years. Moreover, when compared to results using the inflection-point as the cut point, those odds can only be secured with the loss of about one-third of the correct predictions of persistently +NMRs.
A more realistic, more irregular empirical tradeoff (Figure 6b) can be observed using UN estimates [4] from three years of reserved data, 2021 to 2023. As the median-age cut point is advanced in this empirical graph (which is based upon the true positions of unevenly distributed data from the world’s countries) the odds of a correct prediction (+NMR) flattens near 3-to-1 between median ages 35 and 39 years, with relatively minor losses to the proportion of correct predictions of +NMRs.
4. Discussion
This analysis should alert demographic projectionists and strategic foreign affairs analysts that a significant number of countries—specifically in Latin America, South Asia, and Southeast Asia—are likely to assume the future role of continuous, or near-continuous, net receivers of international migrants as those countries approach, or enter, the mature phase of the age-structural transition.
However, not all countries should be expected to make this median-age-associated shift in the direction of NMR. According to this analysis, exceptions are likely to emerge among: the least populated states (less than 5.0 million residents, particularly densely populated small-island states and some sparsely populated poorly developed states), among resource-reliant states (particularly those rentier states, like the Gulf Cooperation Council states, which actively recruit labor migrants and expel them when unemployed or upon retirement), and states that analysts expect will maintain repressive governments (e.g., those consistently scored “Not Free” in Freedom House’s annual assessment, particularly communist states, states ruled by religious law and hierarchy, as well as any personal dictatorships that have developed the means to guarantee authoritarian succession).
If one assumes a median-age cut point at 36.0 years—i.e., that all countries that are likely to respond to this relationship will experience +NMRs at, or before, they cross this cut point—then, by 2055, several countries that are currently expected to produce −NMRs or experience sign-switching NMRs, may have begun, instead, to generate a lengthy series of +NMRs. These include countries in:
- North Africa, probably in Morocco, Algeria, and Tunisia, which are likely to receive increasing inflows of migrants from coastal West Africa, the Sahel, and other Arab states that could outpace migrant outflows;
- South Asia, most likely India, which could receive a greater influx of South Asian and Southeast Asian migrants (India’s southern cities are already experiencing substantial within-country migration from the youthful rural central north, as well as from some of India’s South Asian neighbors [16]);
- Southeast Asia, particularly in Malaysia (already a migrant net receiver) and Indonesia, which could experience an increased inflow of migrants from less economically developed parts of South Asia, Southeast Asia, and the Middle East (and possibly from India and China, which have diaspora populations in these countries); and
- Latin America, probably in Brazil and Colombia (both have recently become migrant net receivers, primarily due to the influx of Venezuelans), as well as Ecuador, Mexico, and Uruguay, which could receive larger inflows from poor communities in the Andean and Central American regions. As Argentina and Chile (both have recently become net receivers) continue to develop economically, these cosmopolitan societies could experience a greater influx of international migrants of Latin American origin, as well as from more distant regions, as they have in the past.
Sub-Saharan Africa’s lingering youthfulness, chronic political instability, and projected population growth suggest a continued upward trajectory in the numbers of the region’s cross-border migrants. Moreover, even by 2055, the gradual declines expected in fertility and slow advances in median age make it difficult to imagine the emergence of a new, economically vigorous and politically stable set of continuous migrant net receivers in sub-Saharan Africa, beyond the small set that is already present.
Currently, sub-Saharan Africa’s continuous net receivers are limited to:
- Senegal, a relatively politically stable coastal West African state that, while still youthful, serves as a conduit for migrants leaving the conflict-torn Sahel, many of whom later head northward, primarily to the Maghreb and Europe,
- some of sub-Saharan Africa’s most oil-rich rentier states (Gabon, Equatorial Guinea, and Angola), and
- southern African states (particularly South Africa and Namibia).
Notably, even when projected to 2055, the UN Population Division’s medium scenario falls far short of projecting a median age of 36.0 years in all of tropical Africa—a region extending from Mauritania, eastward across the Sahel to Somalia, south through coastal West Africa, Central Africa, and East Africa, and then southward again, ending in Angola and Mozambique (notably, South Africa has already experienced major fertility decline and entered the demographic window).
According to the UN’s medium scenario, tropical Africa’s most age-structurally mature states (with more than 5.0 million residents) are projected to be Ghana and Kenya, which could enter the demographic window (beginning at a median age of about 26 years) between 2045 and 2050. However, even the slow pace of age-structural change that is projected for these two countries can be viewed as optimistic. Demographers recall that while fertility was declining in Arab North Africa and within Africa’s southern cone, other promising tropical African countries (e.g., Côte d’Ivoire, Nigeria, and Senegal) have repeatedly stalled along their projected path to lower fertility, despite gains in other fundamental development indicators.
5. Conclusions
Whether in Latin America, along the Mediterranean coast of North Africa, or among states in South Asia or Southeast Asia, the presence of additional regional net-migrant receiver states could alter today’s global pattern of migration, particularly as North American and European governments further restrict the ability of migrants to enter and remain in-country. Whereas UN projection scenarios currently do not incorporate this median-age-associated shift toward long-term positive net migration, the results of this study’s analysis suggest that, by remaining mindful of this relationship and its likely exceptions, demographers could—with some confidence—integrate this shift into future long-term demographic projections.
Would the discussion of the possible emergence of a new set of migrant net receivers matter to strategic foreign affairs and intelligence analyses? Here the answer is clearly “yes”. Economic and political lessons for the future can already be gleaned from the ongoing experiences of increasingly attractive migrant-destination countries such as South Africa, Colombia, and Brazil. Being able to anticipate the identities of emerging long-term net receivers of international migrants, long-range analysts would be well placed to consider how the redistribution of international migration’s economic effects, much of which could augment economic growth [17,18], as well as immigration’s political effects, some of which could erode political stability [19], will alter today’s regional and national patterns of development.
Acknowledgments
The author wishes to thank a series of anonymous reviewers who, previous to and following submission, influenced the final product of this research.
Abbreviations
The following abbreviations are used in this manuscript:
| FH | Freedom House |
| GCC | Gulf Cooperation Council |
| NIC | National Intelligence Council |
| NMR | International net migration rate |
| WB | World Bank |
| UN | United Nations |
Appendix A
Appendix A.1

Table A1.
Age-structural Models: Post-Cold War model (1990 to 2015) with standard pair of independent var.
Table A1.
Age-structural Models: Post-Cold War model (1990 to 2015) with standard pair of independent var.
| Outcome variable: Annual probability of a persistently +NMR † | ||||
| Logit Parameter Coefficients and Standard Errors †† | ||||
| Models: | Model A1a | Model A1b ††† | Model A1c | Model A1d |
| Standard Model | ||||
| Period: | 1990-2015 | 1990-2015 | 1990-2015 | 1990-2015 |
| Graphic function: | Figure 4a | |||
| Domain variable [continuous] | ||||
| Median age | 0.111*** (0.005) | 0.112*** (0.005) | 0.111*** (0.005) | 0.112*** (0.004) |
| Standard independent var. [dichotomous] | ||||
| A Resource-reliant states (=0) | --- | -1.090*** (0.104) | -1.046*** (0.102) | --- |
| B Least populated states (=0) | --- | 0.440*** (0.082) | --- | 0.322*** (0.080) |
| Constant | -3.133 (0.146) | -3.400 (-0.124) | -2.836 (0.134) | -3.652 (0.139) |
| n | 4129 | 4129 | 4129 | 4129 |
| N (average countries per year) | 163 | 163 | 163 | 163 |
| IP = (median age of inflection point) | 34 yrs | 34 yrs | 35 yrs | 33 yrs |
| P(15), P(45) (P at median ages 15, 45) | 0.14, 0.75 | 0.13, 0.76 | 0.10, 0.75 | 0.14, 0.76 |
| P’(IP) (change in P near IP) | 0.028 | 0.028 | 0.025 | 0.025 |
† A persistently positive net migration rate is an NMR that is positive at t0, for which NMRs at t1 to t5 are also positive. NMR data from World Population Prospects, the 2024 Revision [6]. †† The sign (+,-) of the continuous domain coefficient indicates the direction of the function’s slope. Among dichotomous controls, a positive coefficient indicates a lower within-group probability than the model predicts; a negative coefficient indicates a higher within-group probability than the model predicts. ††† Age-structural theory’s standard function (with two standard controls, resource-reliant states and the least populated states). *p<0.050, **p<0.010, ***p<0.001. A Total natural resource rents>0.20*GDP. B Less than 5.00 million residents.
Appendix A.2
Table A2.
Age-structural Models: With and without high-amplitude NMRs (|NMR|>10.0).
| Outcome variable: Annual probability of a persistently +NMR † | ||
| Logit Parameter Coefficients and Standard Errors †† | ||
| Models: | Model A2a ††† (A1b) | Model A2b |
| Standard Model | ||
| Period: | 1990-2015 | 1990-2015 |
| Graphic function: | Figure 4a | |
| Domain variable [continuous] | ||
| Median age | 0.112*** (0.005) | 0.111*** (0.005) |
| Standard controls [dichotomous] | ||
| A Resource-reliant states (=0) | -1.090*** (0.104) | -0.886*** (0.110) |
| B Least populated states (=0) | 0.440*** (0.082) | 0.429*** (0.064) |
| Experimental controls [dichotomous] | ||
| C Negative high-amplitude NMRs (< -10.0) (=0) | --- | 2.220*** (0.284) |
| D Positive high-amplitude NMRs (>+10.0) (=0) | --- | -1.203*** (0.134) |
| Constant | -3.133 (0.146) | -4.316 (0.329) |
| n | 4129 | 4129 |
| N (average countries per year) | 163 | 163 |
| IP = (median age at inflection point) | 34 yrs | 34 yrs |
| P(15), P(45) (P at median ages 15, 45) | 0.13, 0.76 | 0.13, 0.76 |
| P’(IP) (change in P near IP) | 0.028 | 0.028 |
† A persistently positive net migration rate is an NMR that is positive at t0, for which NMRs at t1 to t5 are also positive. Net migration rate data from World Population Prospects, the 2024 Revision [6]. †† The sign (+,-) of the continuous domain coefficient indicates the direction of the function’s slope. Among dichotomous controls, a positive coefficient indicates a lower within-group probability than the model predicts; a negative coefficient indicates a higher within-group probability than the model predicts. ††† Age-structural theory’s standard function (with two standard controls, resource-reliant states and the least populated states). A Total natural resource rents>0.20*GDP. B Less than 5.00 million residents. C NMR< -10.0 per thousand. D NMR> +10.0 per thousand. *p<0.050, **p<0.010, ***p<0.001.
Appendix A.3
Table A3.
Age-Structural Models: With experimental dichotomous independent variables.
| Outcome variable: Annual probability of a persistently +NMR † | |||||
| Logit Parameter Coefficients and Standard Errors †† | |||||
| Models: | Model A3a ††† (A1b) | Model A3b | Model A3c | Model A3d | Model A3e |
| Standard Model | |||||
| Period: | 1990-2015 | 1990-2015 | 1990-2015 | 1990-2015 | 1990-2015 |
| Graphic function: | Figure 4a | ||||
| Domain variable [continuous] | |||||
| Median age | 0.112***(0.005) | 0.103*** (0.005) | 0.039*** (0.006) | 0.079*** (0.005) | 0.019** (0.007) |
| Standard controls [dichotomous] | |||||
| A Resource-reliant states (=0) | -1.090*** (0.104) | -1.411*** (0.116) | -0.912*** (0.109) | -1.408*** (0.110) | -1.138*** (0.113) |
| B Least populated states (=0) | 0.440*** (0.082) | 0.541*** (0.084) | 0.499*** (0.089) | 0.496*** (0.083) | 0.534*** (0.089) |
| Experimental controls [dichotomous] | |||||
| FH Not Free status (=0) | --- | 0.741*** (0.103) | --- | --- | --- |
| WB High income (=0) | --- | --- | -2.165*** (0.117) | --- | -1.992*** (0.119) |
| FH Free status (=0) | --- | --- | --- | -1.108*** (0.094) | -0.812*** (0.104) |
| Constant | -3.133 (0.146) | -3.262 (0.149) | 0.189 (0.236) | -1.427 (0.202) | 1.199 (0.273) |
| n | 4129 | 4129 | 4129 | 4129 | 4129 |
| N (average countries per year) | 163 | 163 | 163 | 163 | 163 |
| (median age at inflection point) | 34 yrs | 33 yrs | 62 yrs | 44 yrs | 115 yrs |
| P(15), P(45) (P at median ages 15, 45) | 0.13, 0.76 | 0.14, 0.79 | 0.14, 0.35 | 0.09, 0.54 | 0.14, 0.21 |
| P’(IP) (change in P near IP) | 0.028 | 0.026 | 0.010 | 0.020 | 0.005 |
† A persistently positive net migration rate is an NMR that is positive at t0, for which NMRs at t1 to t5 are also positive. Net migration rate data from World Population Prospects, the 2024 Revision [6]. †† The sign (+,-) of the continuous domain coefficient indicates the direction of the function’s slope. Among dichotomous controls, a positive coefficient indicates a lower within-group probability than the logistic model predicts; a negative coefficient indicates a higher within-group probability. ††† Age-structural theory’s standard function (with two standard controls, resource-reliant states and the least populated states). WB=World Bank; FH=Freedom House. A Total natural resource rents>0.20*GDP. B Less than 5.00 million residents. *p<0.050, **p<0.010, ***p<0.001.
Appendix A.4
Table A4.
Age-structural Models: Cold War and Post-Cold War Models.
| Annual Probability of Experiencing a Persistently +NMR † | ||||
| Logit Parameter Coefficients and Standard Errors †† | ||||
| Models: | Model A4a ††† (A1b) | Model A4b | Model A4c | Model A4d |
| Standard Model | Standard (1970-89) | Standard (1970-2015) | ||
| Post-Cold War | Cold War Model | Full data | Full data | |
| Period: | 1990-2015 | 1970-1989 | 1970-2015 | 1970-2015 |
| Graphic function: | Figure 4a | |||
| Domain variable [continuous] | ||||
| Median age | 0.112*** (0.005) | 0.188*** (0.008) | 0.117*** (0.004) | 0.130*** (0.004) |
| Standard controls [dichotomous] | ||||
| A Resource-reliant states (=0) | -1.090*** (0.104) | -1.557*** (0.145) | -1.152*** (0.083) | -1.257*** (0.085) |
| B Least populated states (=0) | 0.440*** (0.082) | -0.316** (0.109) | 0.206** (0.064) | 0.213*** (0.064) |
| Experimental controls [dichotomous] | ||||
| 1990-to-2015 period (=0) | --- | --- | --- | 0.651*** (0.066) |
| Constant | -3.133 (0.146) | -3.383 (0.194) | -2.869 (0.111) | -3.354 (0.124) |
| n | 4129 | 2591 | 6720 | 6720 |
| N (average countries per year) | 163 | 151 | 158 | 158 |
| IP = (median age inflection point) | 34 yrs | 29 yrs | 32 yrs | 35 yrs |
| P(15), P(45) (P at median ages 15, 45) | 0.13, 0.76 | 0.09, 0.96 | 0.13, 0.82 | 0.08, 0.81 |
| P’(IP) (change in P near IP) | 0.028 | 0.047 | 0.029 | 0.032 |
† A persistently positive net migration rate is an NMR that is positive at t0, for which NMRs at t1 to t5 are also positive. Net migration rate data from World Population Prospects, the 2024 Revision [6]. †† The sign (+,-) of the continuous domain coefficient indicates the direction of the function’s slope. Among dichotomous controls, a positive coefficient indicates a lower within-group probability than the model predicts; a negative coefficient indicates a higher within-group probability than the model predicts. ††† Age-structural theory’s standard function (with two standard controls, resource-reliant states and the least populated states). A Total natural resource rents>0.20*GDP. B Less than 5.00 million residents. *p<0.050, **p<0.010, ***p<0.001.
Appendix B
Appendix B.1
Figure A1.
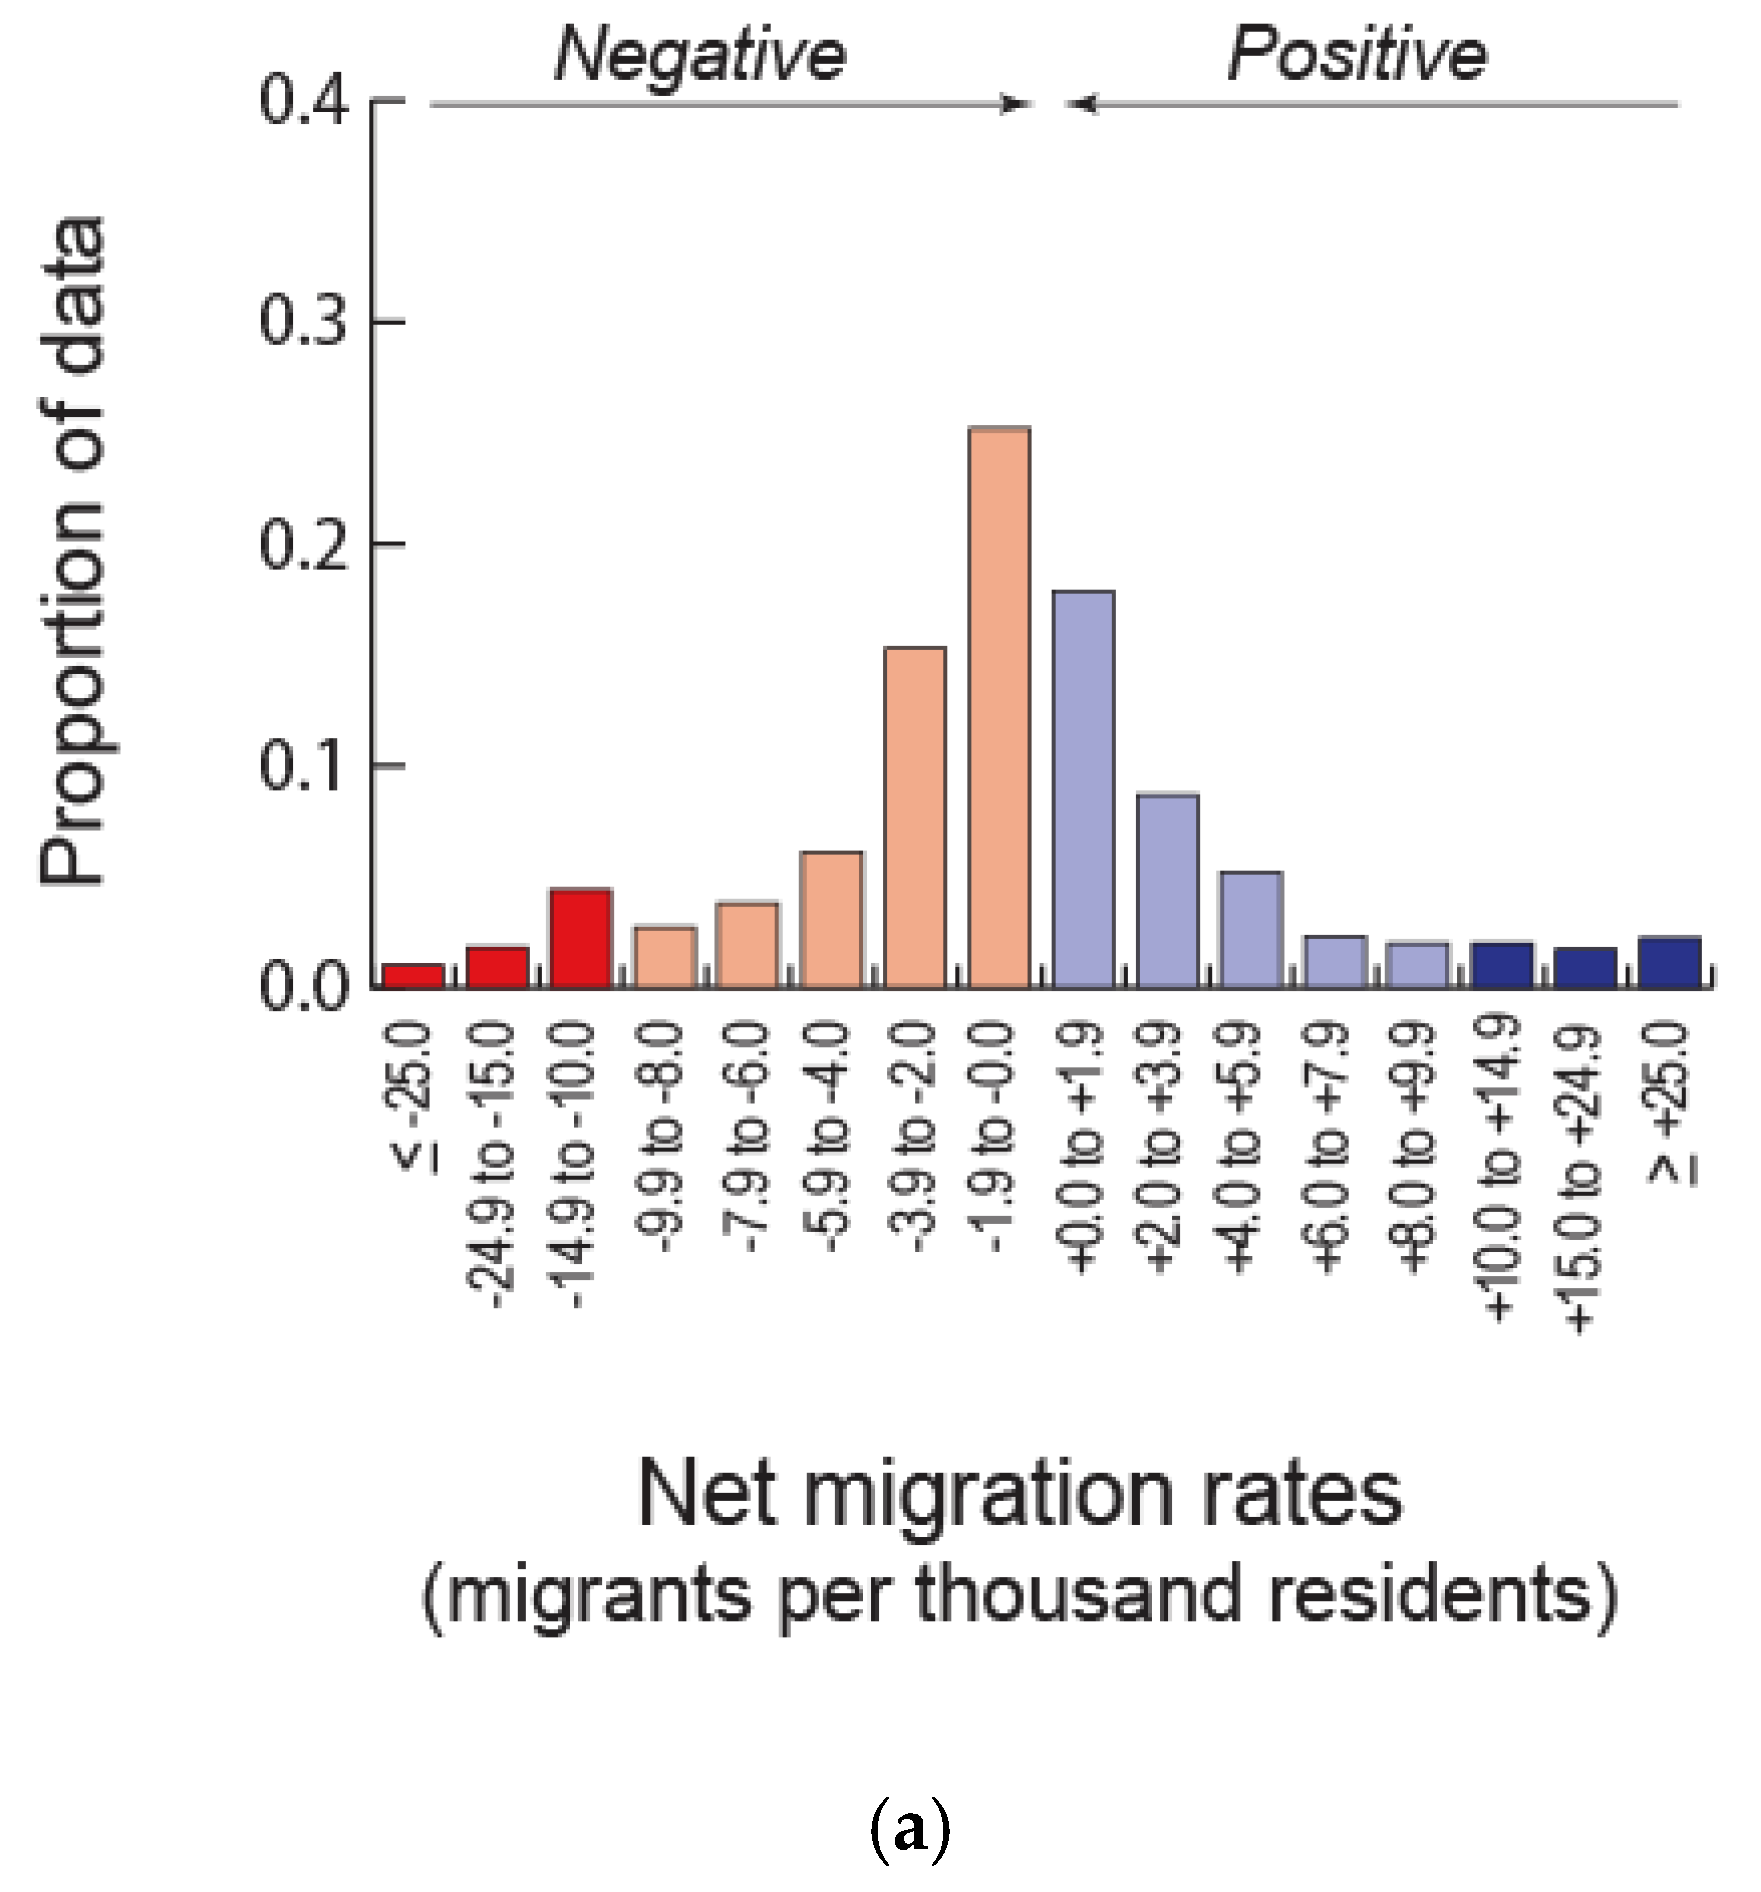
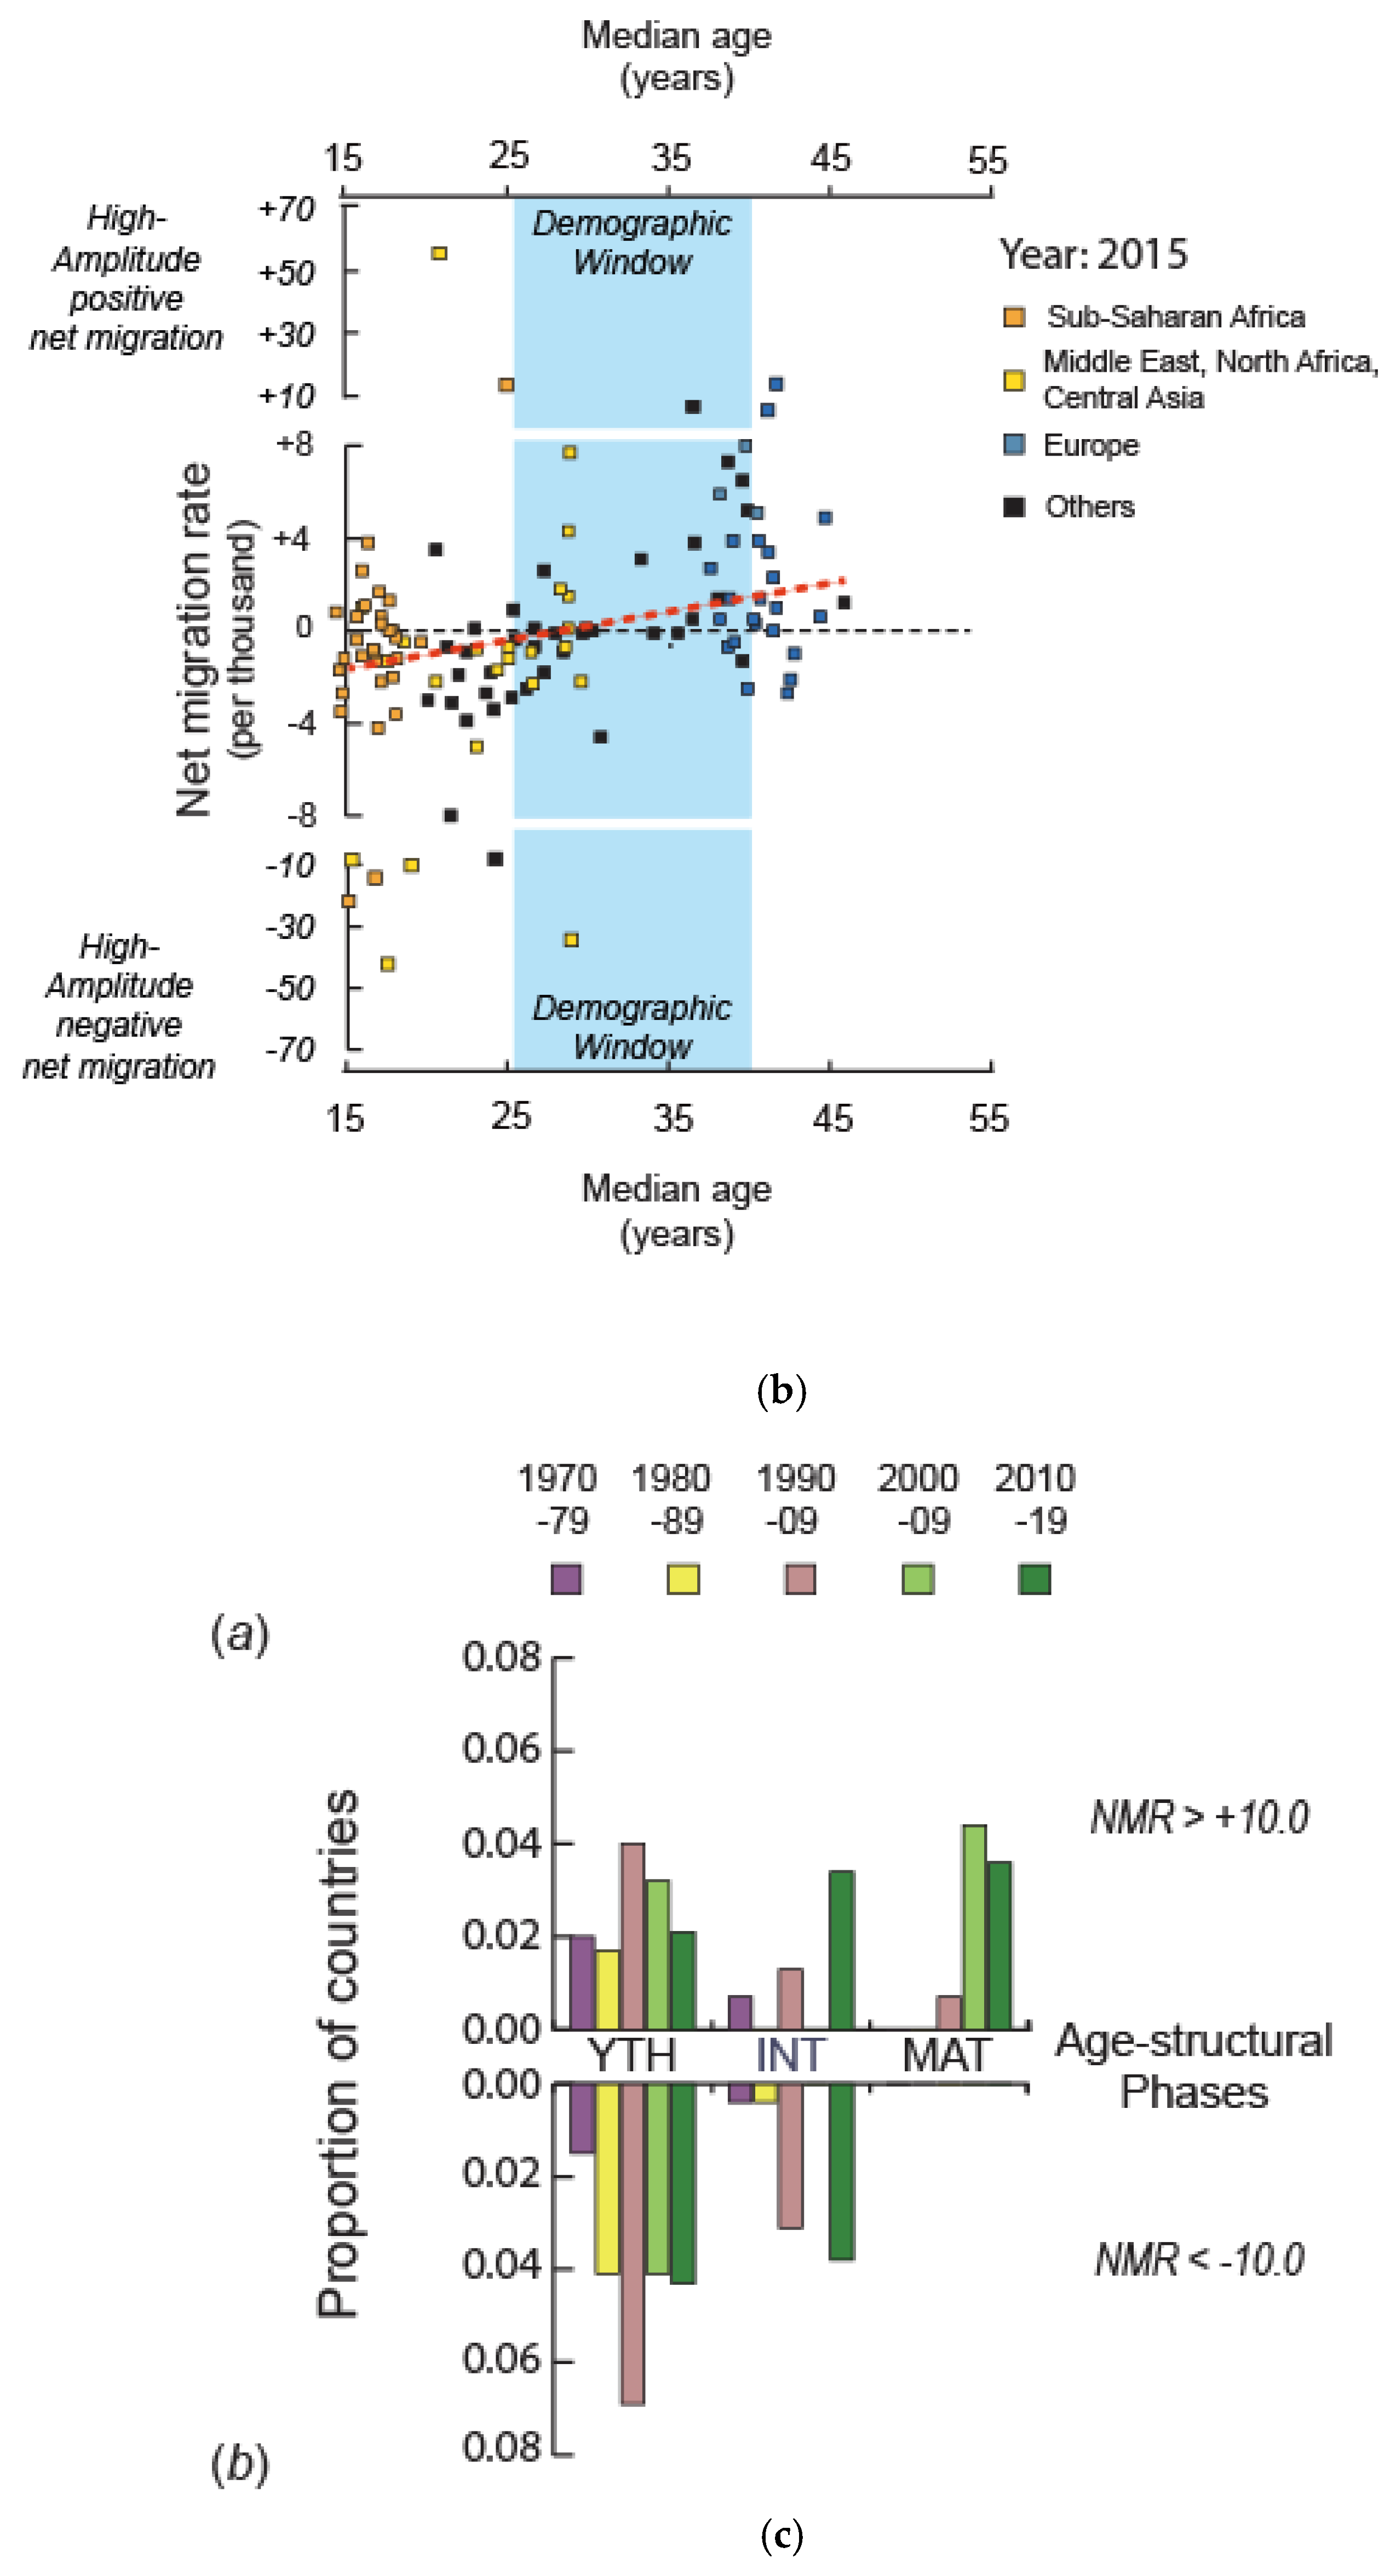
(a). The frequency distribution of negative (net sending) and positive (net receiving) country-level NMRs, 1990 to 2019. These data are limited to countries with populations greater than 500,000 residents and are drawn from the most recent UN estimates [4]. The frequencies of high amplitude NMRs, both negative (≤ −10.0) and positive (≥ +10.0), are shown as darkened bars. (b). The presence of negative and positive high amplitude NMRs. Data are 2015 NMR and median age estimates drawn from the most recent UN estimates [4]. (c). The frequencies of (a) high-amplitude positive NMRs and (b) high-amplitude negative NMRs for each of three age-structural phases: youthful (YTH), intermediate (INT), and mature (MAT) (see Figure 1 for details of phases). The data for these tabulations span five decades, from 1970-79 to 2010-19.
Figure A1.
(a). The frequency distribution of negative (net sending) and positive (net receiving) country-level NMRs, 1990 to 2019. These data are limited to countries with populations greater than 500,000 residents and are drawn from the most recent UN estimates [4]. The frequencies of high amplitude NMRs, both negative (≤ −10.0) and positive (≥ +10.0), are shown as darkened bars. (b). The presence of negative and positive high amplitude NMRs. Data are 2015 NMR and median age estimates drawn from the most recent UN estimates [4]. (c). The frequencies of (a) high-amplitude positive NMRs and (b) high-amplitude negative NMRs for each of three age-structural phases: youthful (YTH), intermediate (INT), and mature (MAT) (see Figure 1 for details of phases). The data for these tabulations span five decades, from 1970-79 to 2010-19.
Appendix B.2
Figure A2.
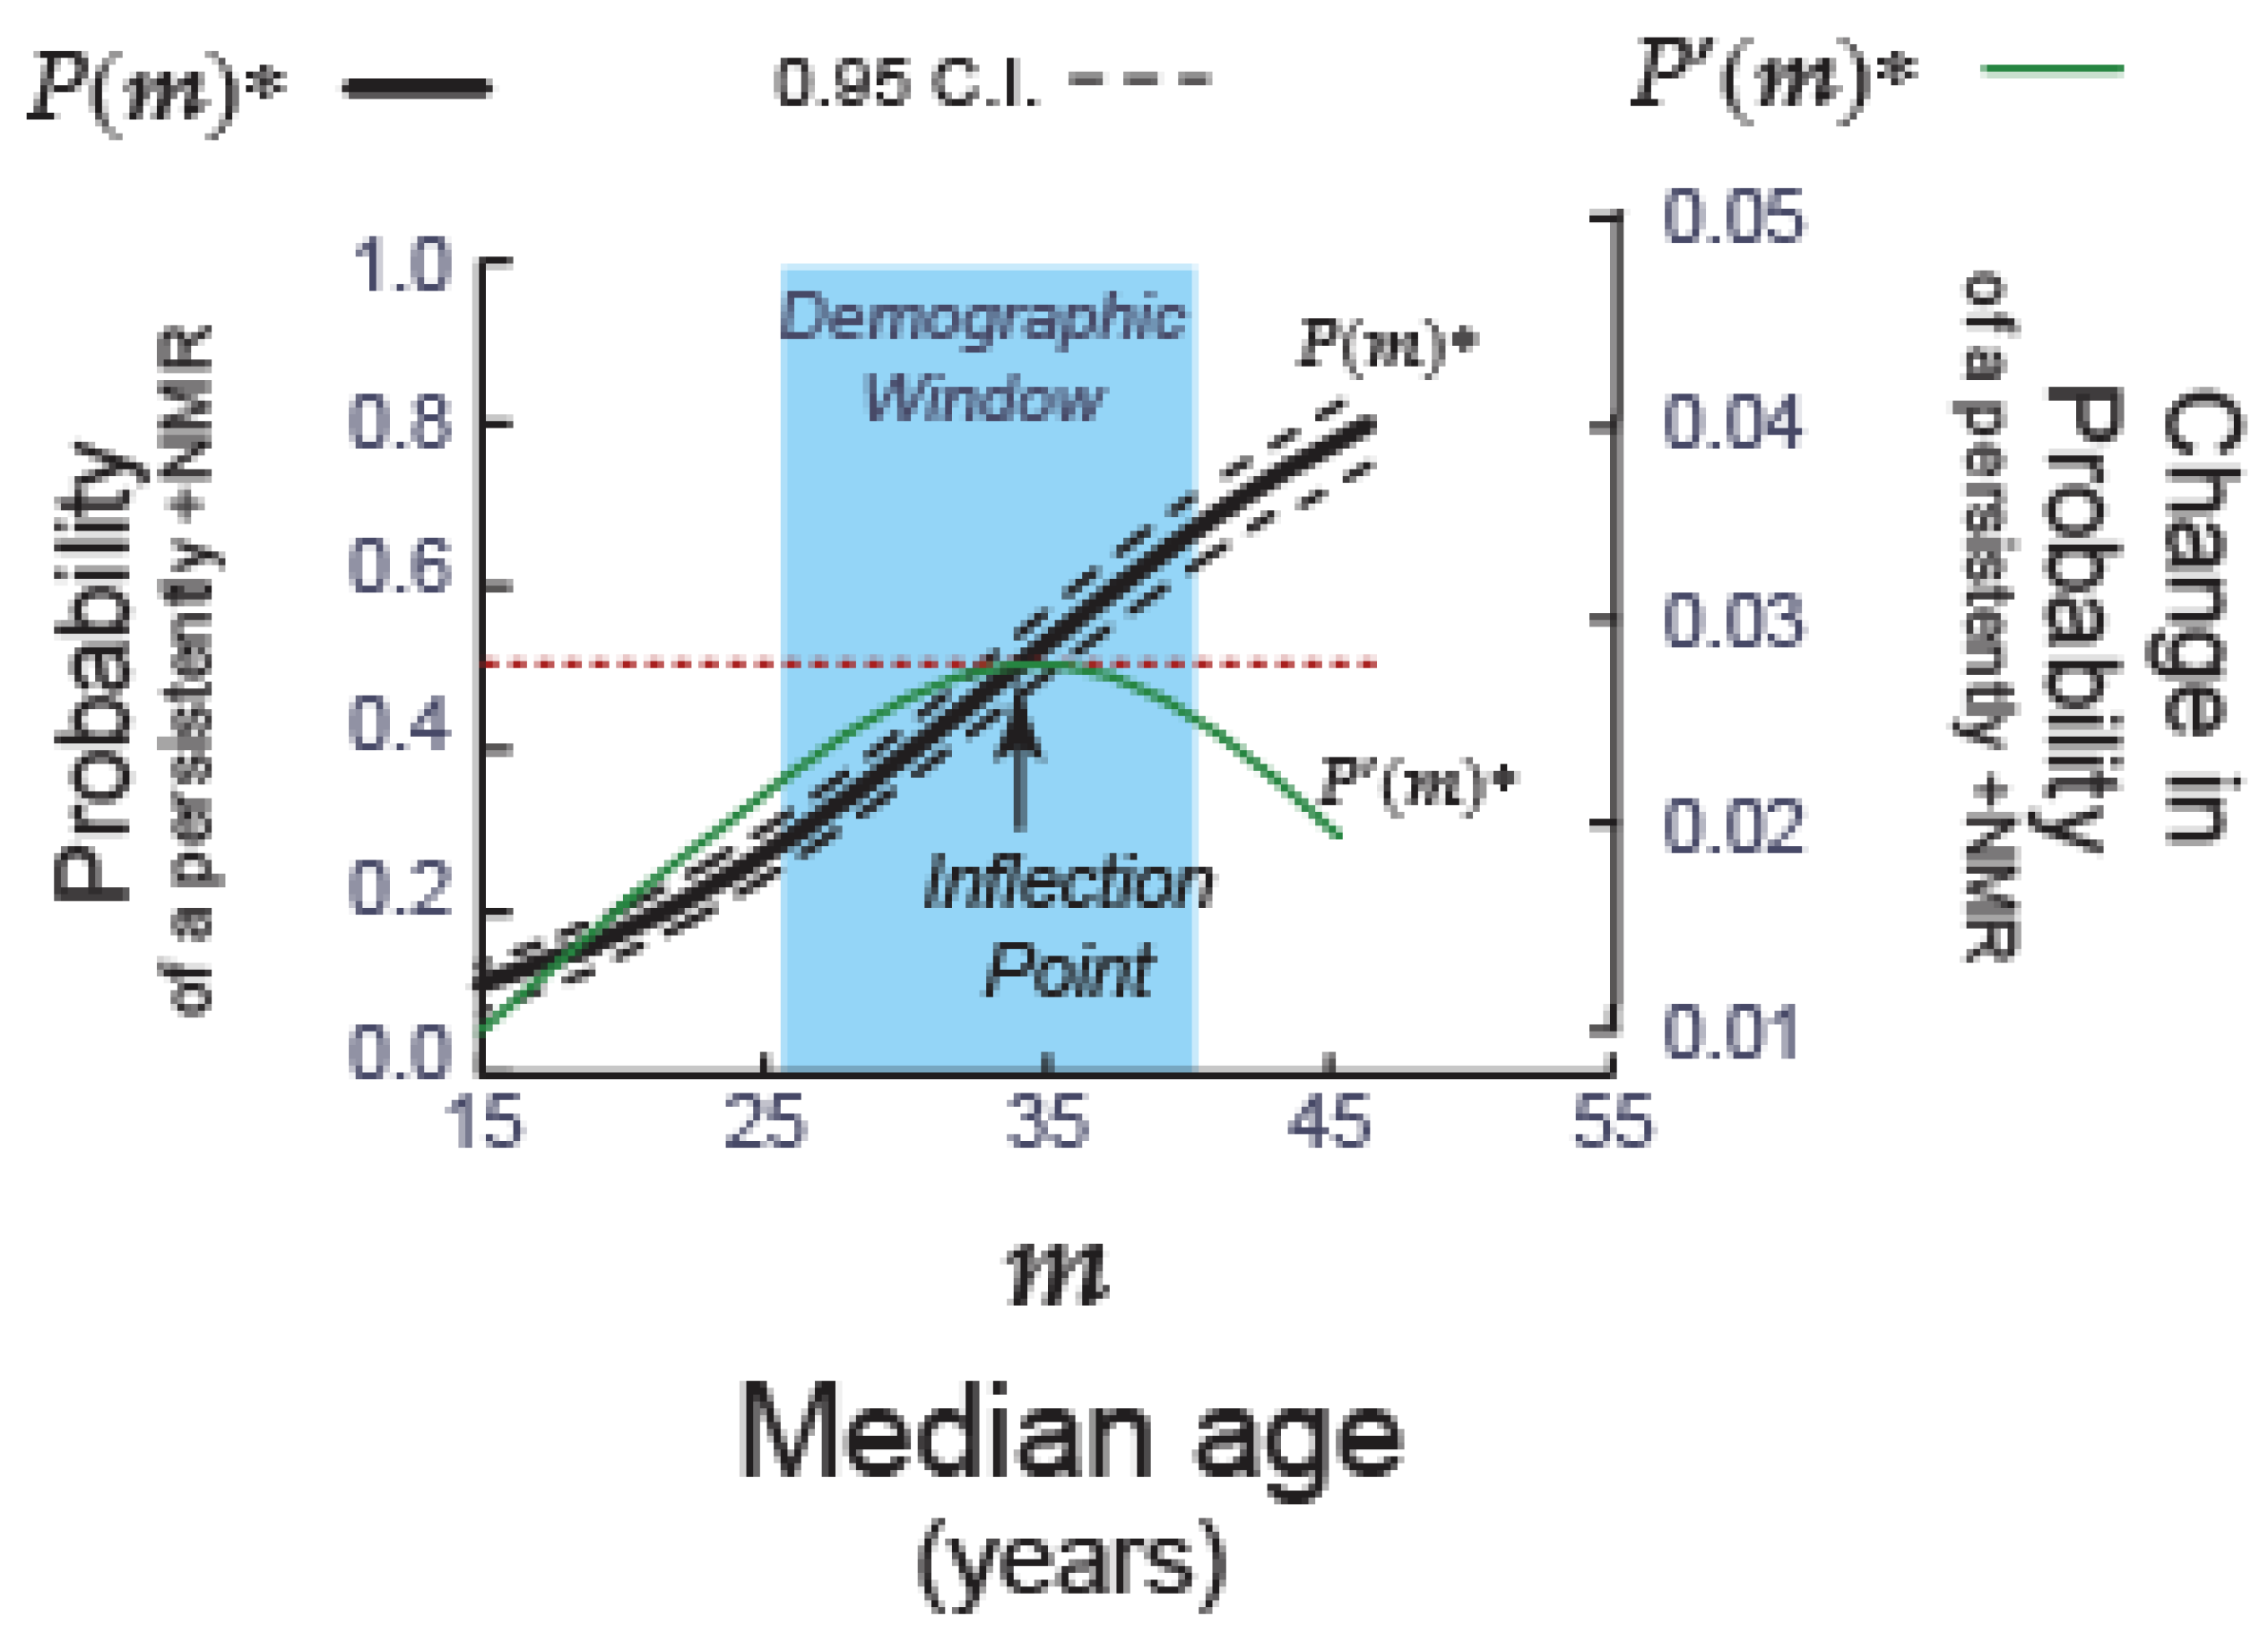
The standard age-structural function estimating the probability of persistently +NMRs and 0.95 confidence intervals (scale on left vertical axis) and its first derivative (scale on right vertical axis), identifying the theoretical peak of the shift to persistently +NMRs.
Figure A2.
The standard age-structural function estimating the probability of persistently +NMRs and 0.95 confidence intervals (scale on left vertical axis) and its first derivative (scale on right vertical axis), identifying the theoretical peak of the shift to persistently +NMRs.
References
- Cincotta, R. The age-structural theory of state behavior. In Oxford Research Encyclopedia of Politics. Oxford University Press: Oxford, 2017; https://oxfordre.com/politics/view/10.1093/acrefore/9780190228637.001.0001/acrefore-9780190228637-e-327.
- Cincotta, R.; Weber, H. Youthful age structures and the risks of revolutionary and separatist conflicts. In Global Political Demography: The Politics of Population Change, Goerres, A., Vanhuysse, P., Eds.; Palgrave Macmillan: London, 2021; pp. 57-92.
- Cincotta, R. Population age structure and the vulnerability of states to coups d’état. Stat. Politics Policy 2023, 14(3), 331-355.
- United Nations, Department of Economic and Social Affairs, Population Division. World Population Prospects, the 2024 Revision. POP/DB/WPP/Rev.2024/GEN/F01. New York: United Nations, 2024.
- Zelinsky, W. The hypothesis of the mobility transition. Geogr. Rev. 1971, 61(2), 219-249.
- Abel, G.J., Cohen, J.E. Bilateral international migration flow estimates for 200 countries. Scientific Data 2019, 6(82), 1-13. [CrossRef]
- Héran, F. Demography and migration: The wildcard in population dynamics. In Migration Theory: Talking Across Disciplines, 4th ed.; Brettell, C.B., Hollifield, J.F., Eds.; Routledge: New York, 2023; pp. 78-129.
- United Nations, Department of Economic and Social Affairs, Population Division. World Population to 2300. ST/ESA/SER.A/236, New York: United Nations, 2004, pp. 70-73.
- (U.S.) National Intelligence Council. Global Trends 2030: Alternative Worlds. Office of the Director of National Intelligence, Washington, DC, 2012.
- Azose, J.; Raftery, A.E. Bayesian probabilistic projection of international migration. Demography 2015, 52(5), 1627-1650. [CrossRef]
- United Nations, Department of Economic and Social Affairs, Population Division. World Population Prospects 2024: Methodology of the United Nations Population Estimates and Projections. UNDESA/POP/2022/DC/NO. 10. New York: United Nations, 2024, pp. 1-86.
- Menard, S. Applied Logistic Regression Analysis. Sage: Thousand Oaks, CA, USA, 2002.
- World Bank. World Development Indicators, Total Natural Resource Rents (NY.GDP.TOTL.RT.ZS), Database. Washington, DC: World Bank, 2024. Available online: https://databank.worldbank.org/source/world-development-indicators# (accessed on 12 May 2025).
- Freedom House. Country and territory ratings and statuses, FIW, 1973-2020. Washington, DC: Freedom House, 2025. Available online: https://freedomhouse.org/report/freedom-world (accessed on 12 May 2025).
- World Bank. World Bank country and lending groups. Washington, DC: IBRD, 2025. Available online: https://datahelpdesk.worldbank.org/knowledgebase/articles/906519-world-bank-country-and-lending-groups (accessed on 12 May 2025).
- Abel, G.J., Cohen, J.E. Bilateral international migration flow estimates for 200 countries. Sci. Data 2019, 6(82). [CrossRef]
- Martin, P. Economic aspects of migration. In Migration Theory: Talking Across Disciplines, 4th ed.; Brettell, C.B., Hollifield, J.F., Eds.; Routledge: New York, 2023; pp. 130-159.
- Goldstone, J.A. The case for international migration. Wilson Quarterly 2024, (Summer), Available at: https://www.wilsonquarterly.com/quarterly/the-great-population-shakeup/the-case-for-international-migration (accessed January 8, 2024).
- Guriev, S. Immigration and populism. Policy Brief 10. Luxembourg: Luxembourg Institute of Socio-economic Research, 2020.
Figure 1.
The ranges of median ages of five phases of the age-structural transition. This categorization expands on a schema published by the (U.S.) National Intelligence Council [9]. Whereas the age-structural transition is a continuous and varied process, this schema’s categories (and their iconic graphic age structures) are made artificially discrete to facilitate mapping and discussion.
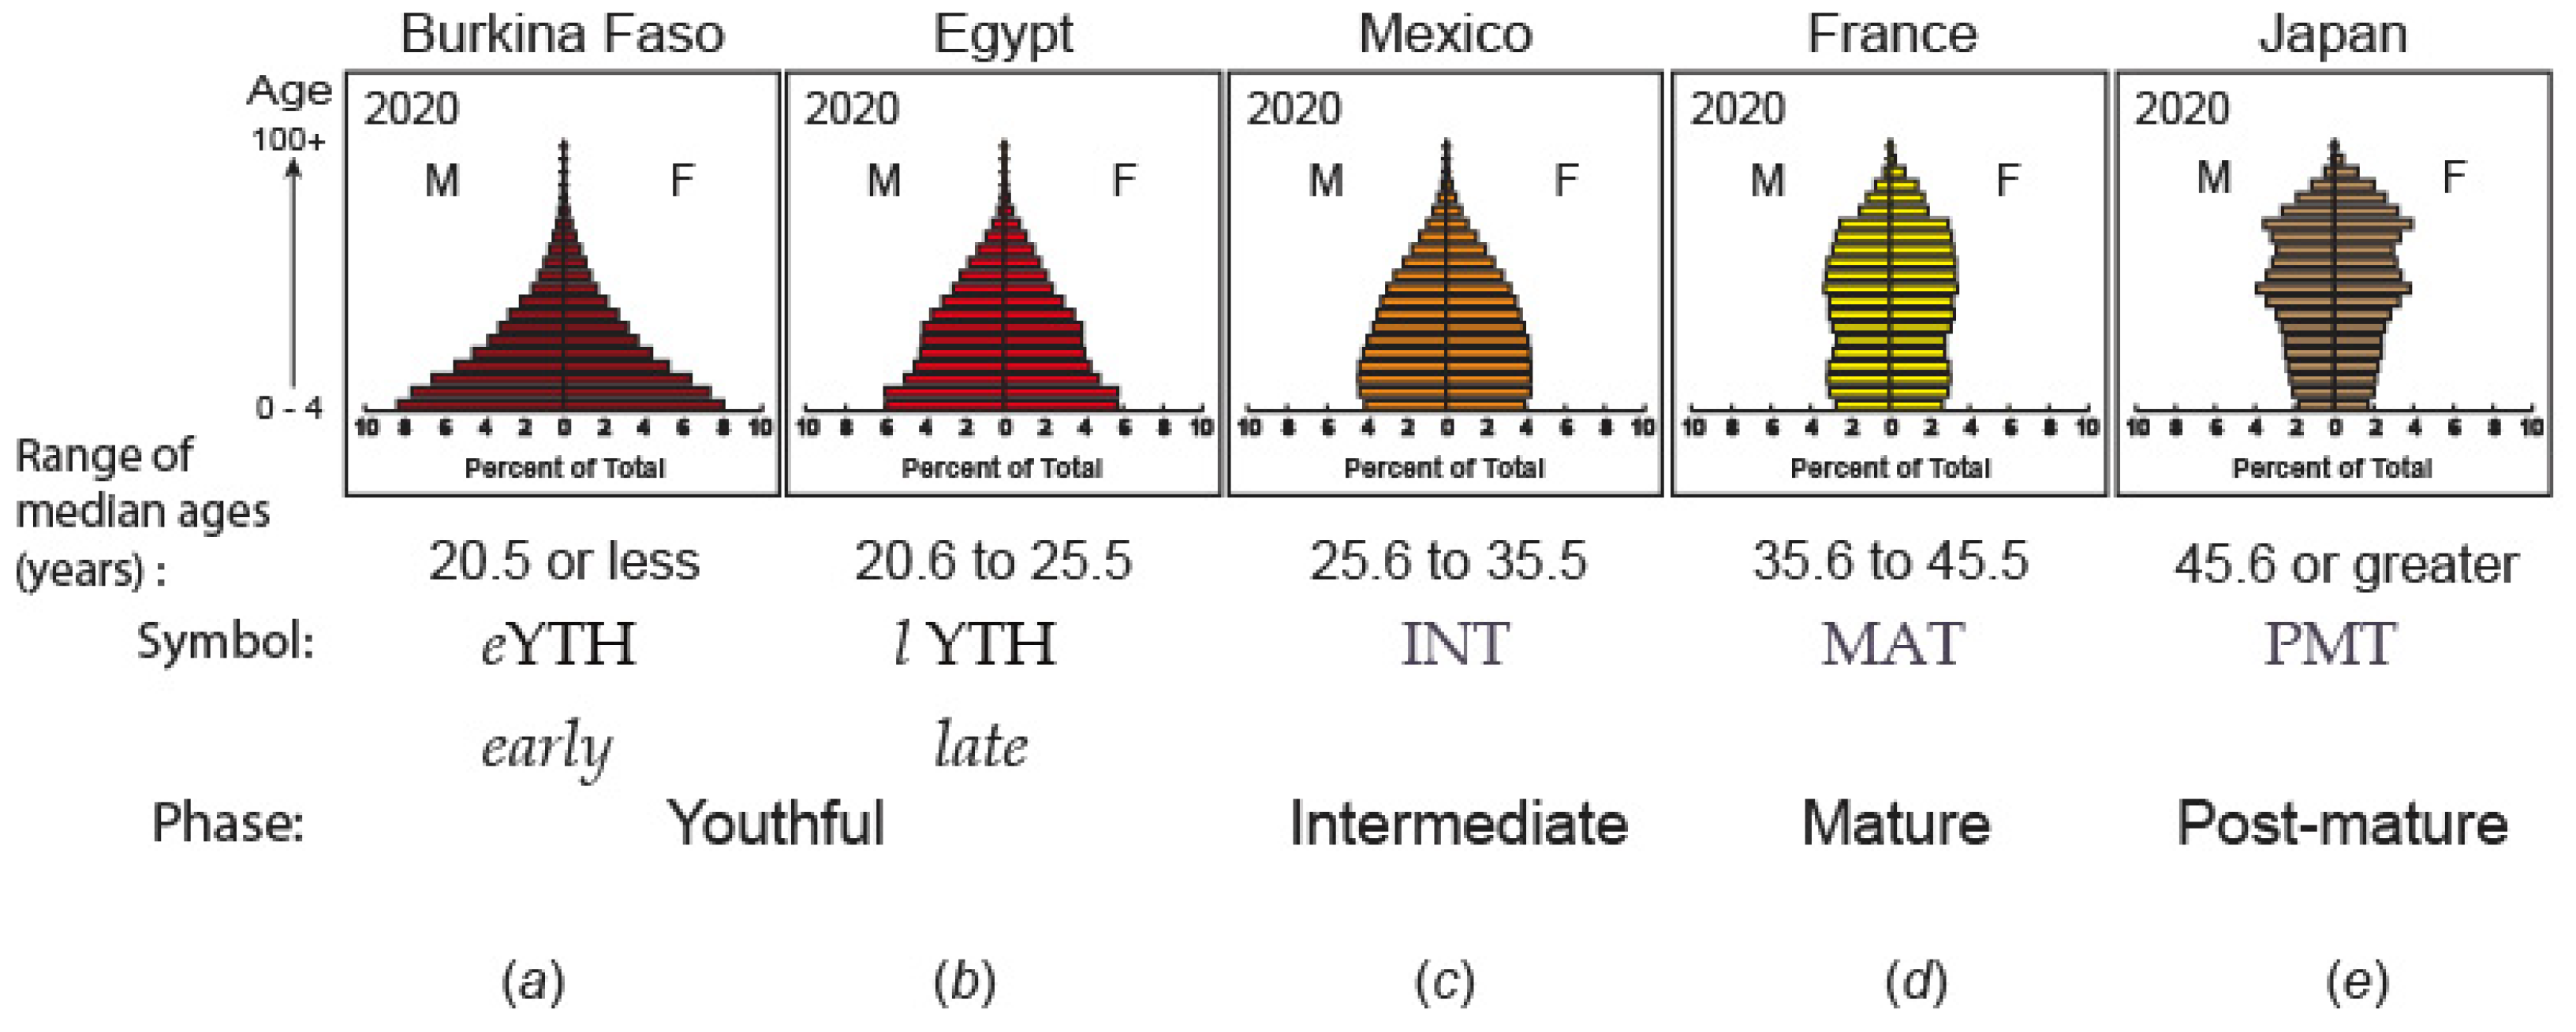
Figure 2.
Five-year averages of the international net migration rate (NMR) for 30 selected countries (five in each of six regions; two-letter country abbreviations are ISO2 Alpha Codes). Data are UN estimates [4] from 1980-85 to 2015-19. Regions are: (a) North and South America, (b) Europe, (c) East Asia, (d) North Africa and the Middle East, (e) sub-Saharan Africa, and (f) South Asia. The demographic window outlines a central portion of the age-structural transition during which states typically encounter a set of fiscally advantageous and development-favorable age structures [1,8].
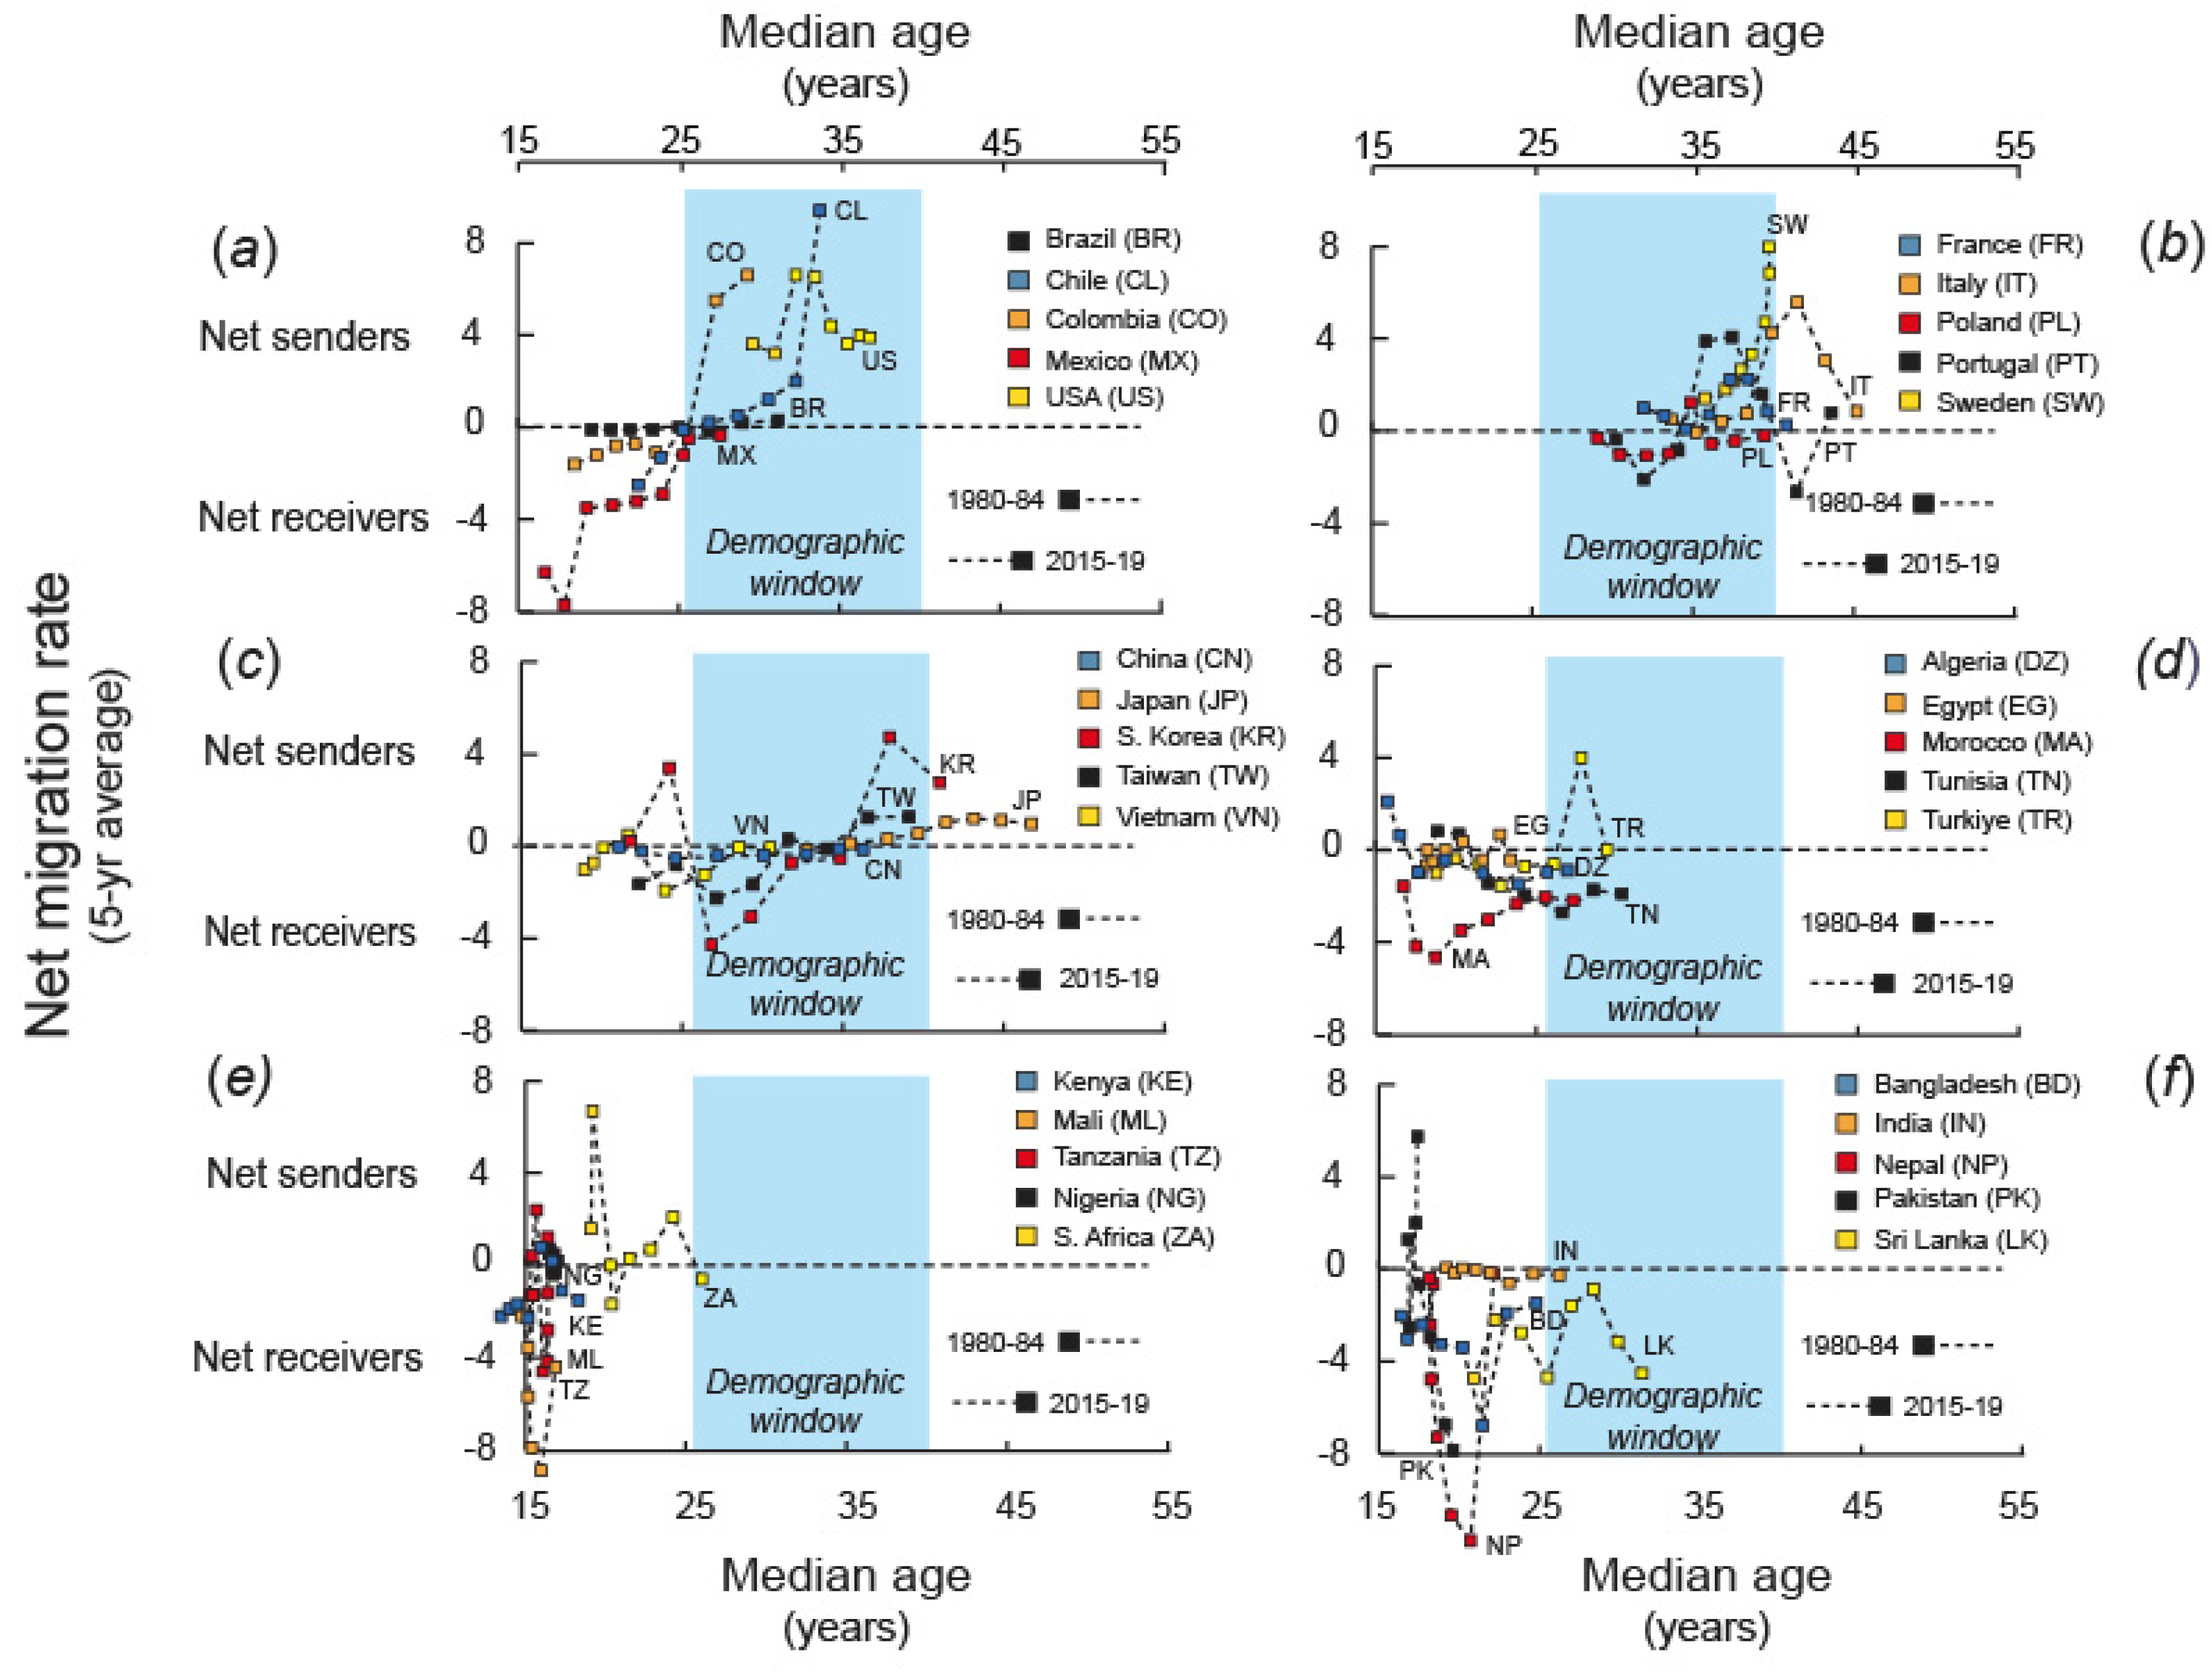
Figure 3.
Annual proportions of (a) +NMRs, and (b) persistently +NMRs (defined as a year with a +NMR immediately followed by five consecutive years of +NMRs) in each of four phases of the age-structural transition: early-youthful, late-youthful, intermediate, and mature (see Figure 1 for definitions). Data are from the 2024 revision of the UN demographic estimates [4], from 1970 to 2015 at five-year intervals.
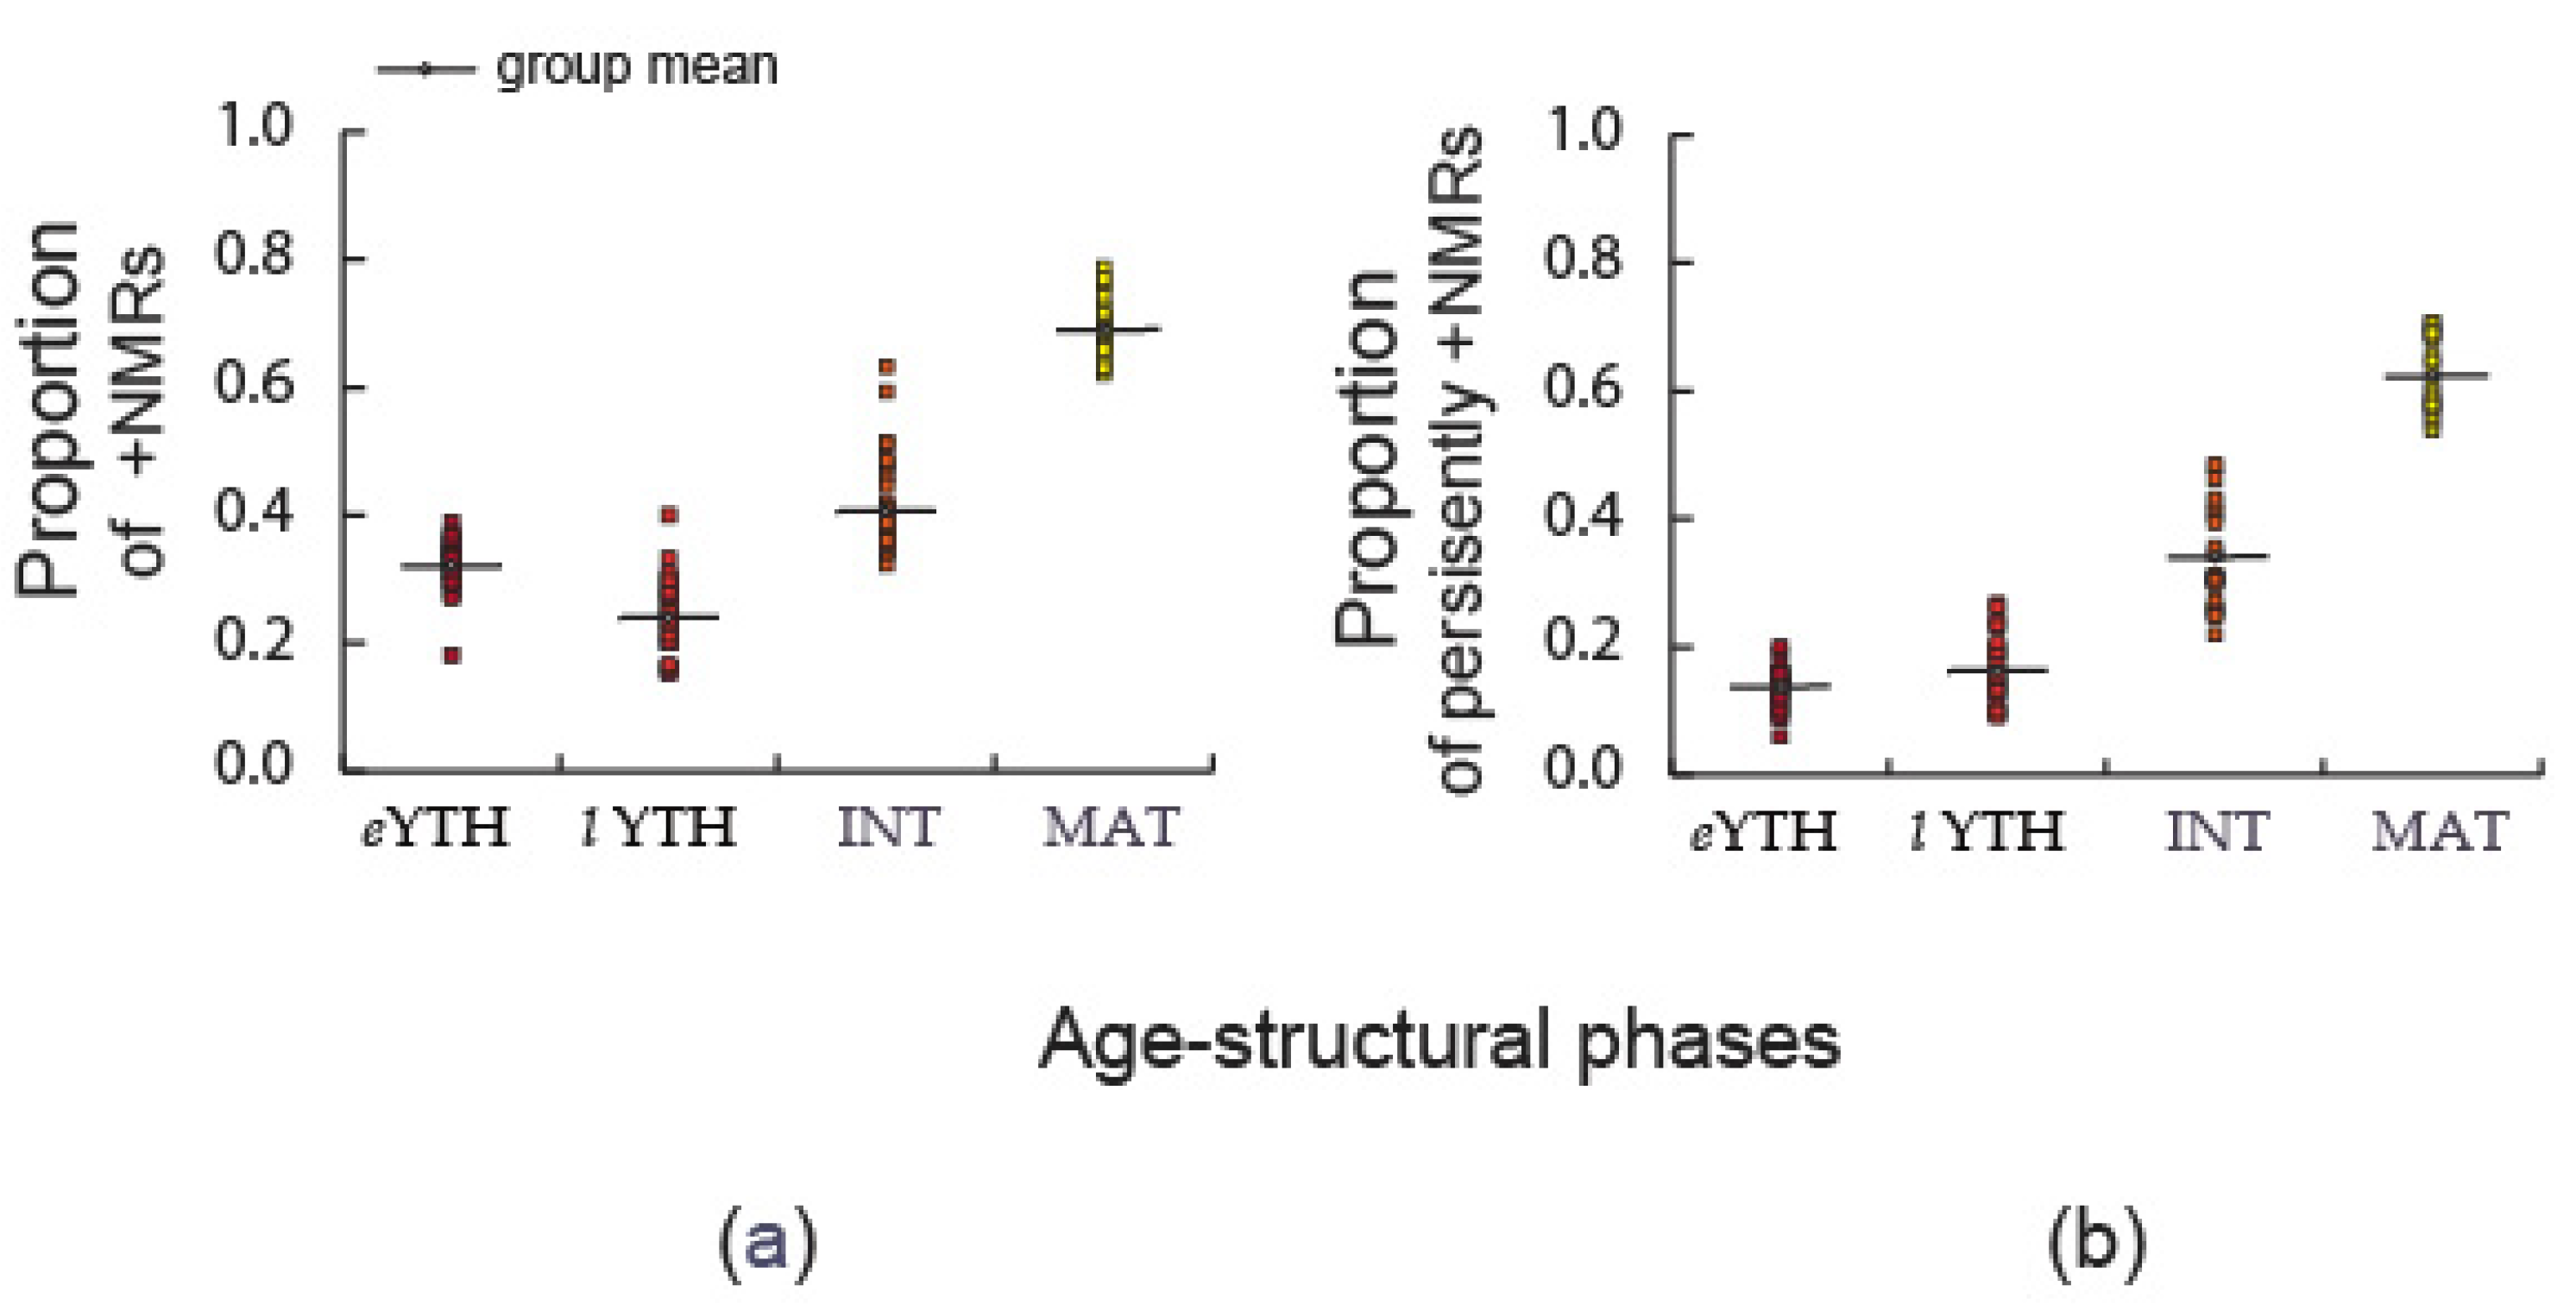
Figure 4.
The (a) probability of a persistently +NMR, P(m)*, generated by the standard model (controlling for resource-reliant states and the least populated states); and (b) a categorical within-sample validation and out-of-sample (2016 to 2018) test of that function. In (b), the calculated proportions of persistently +NMRs are positioned at the mid-points of four discrete categories: early youthful, late youthful, intermediate, and mature (see Figure 1).
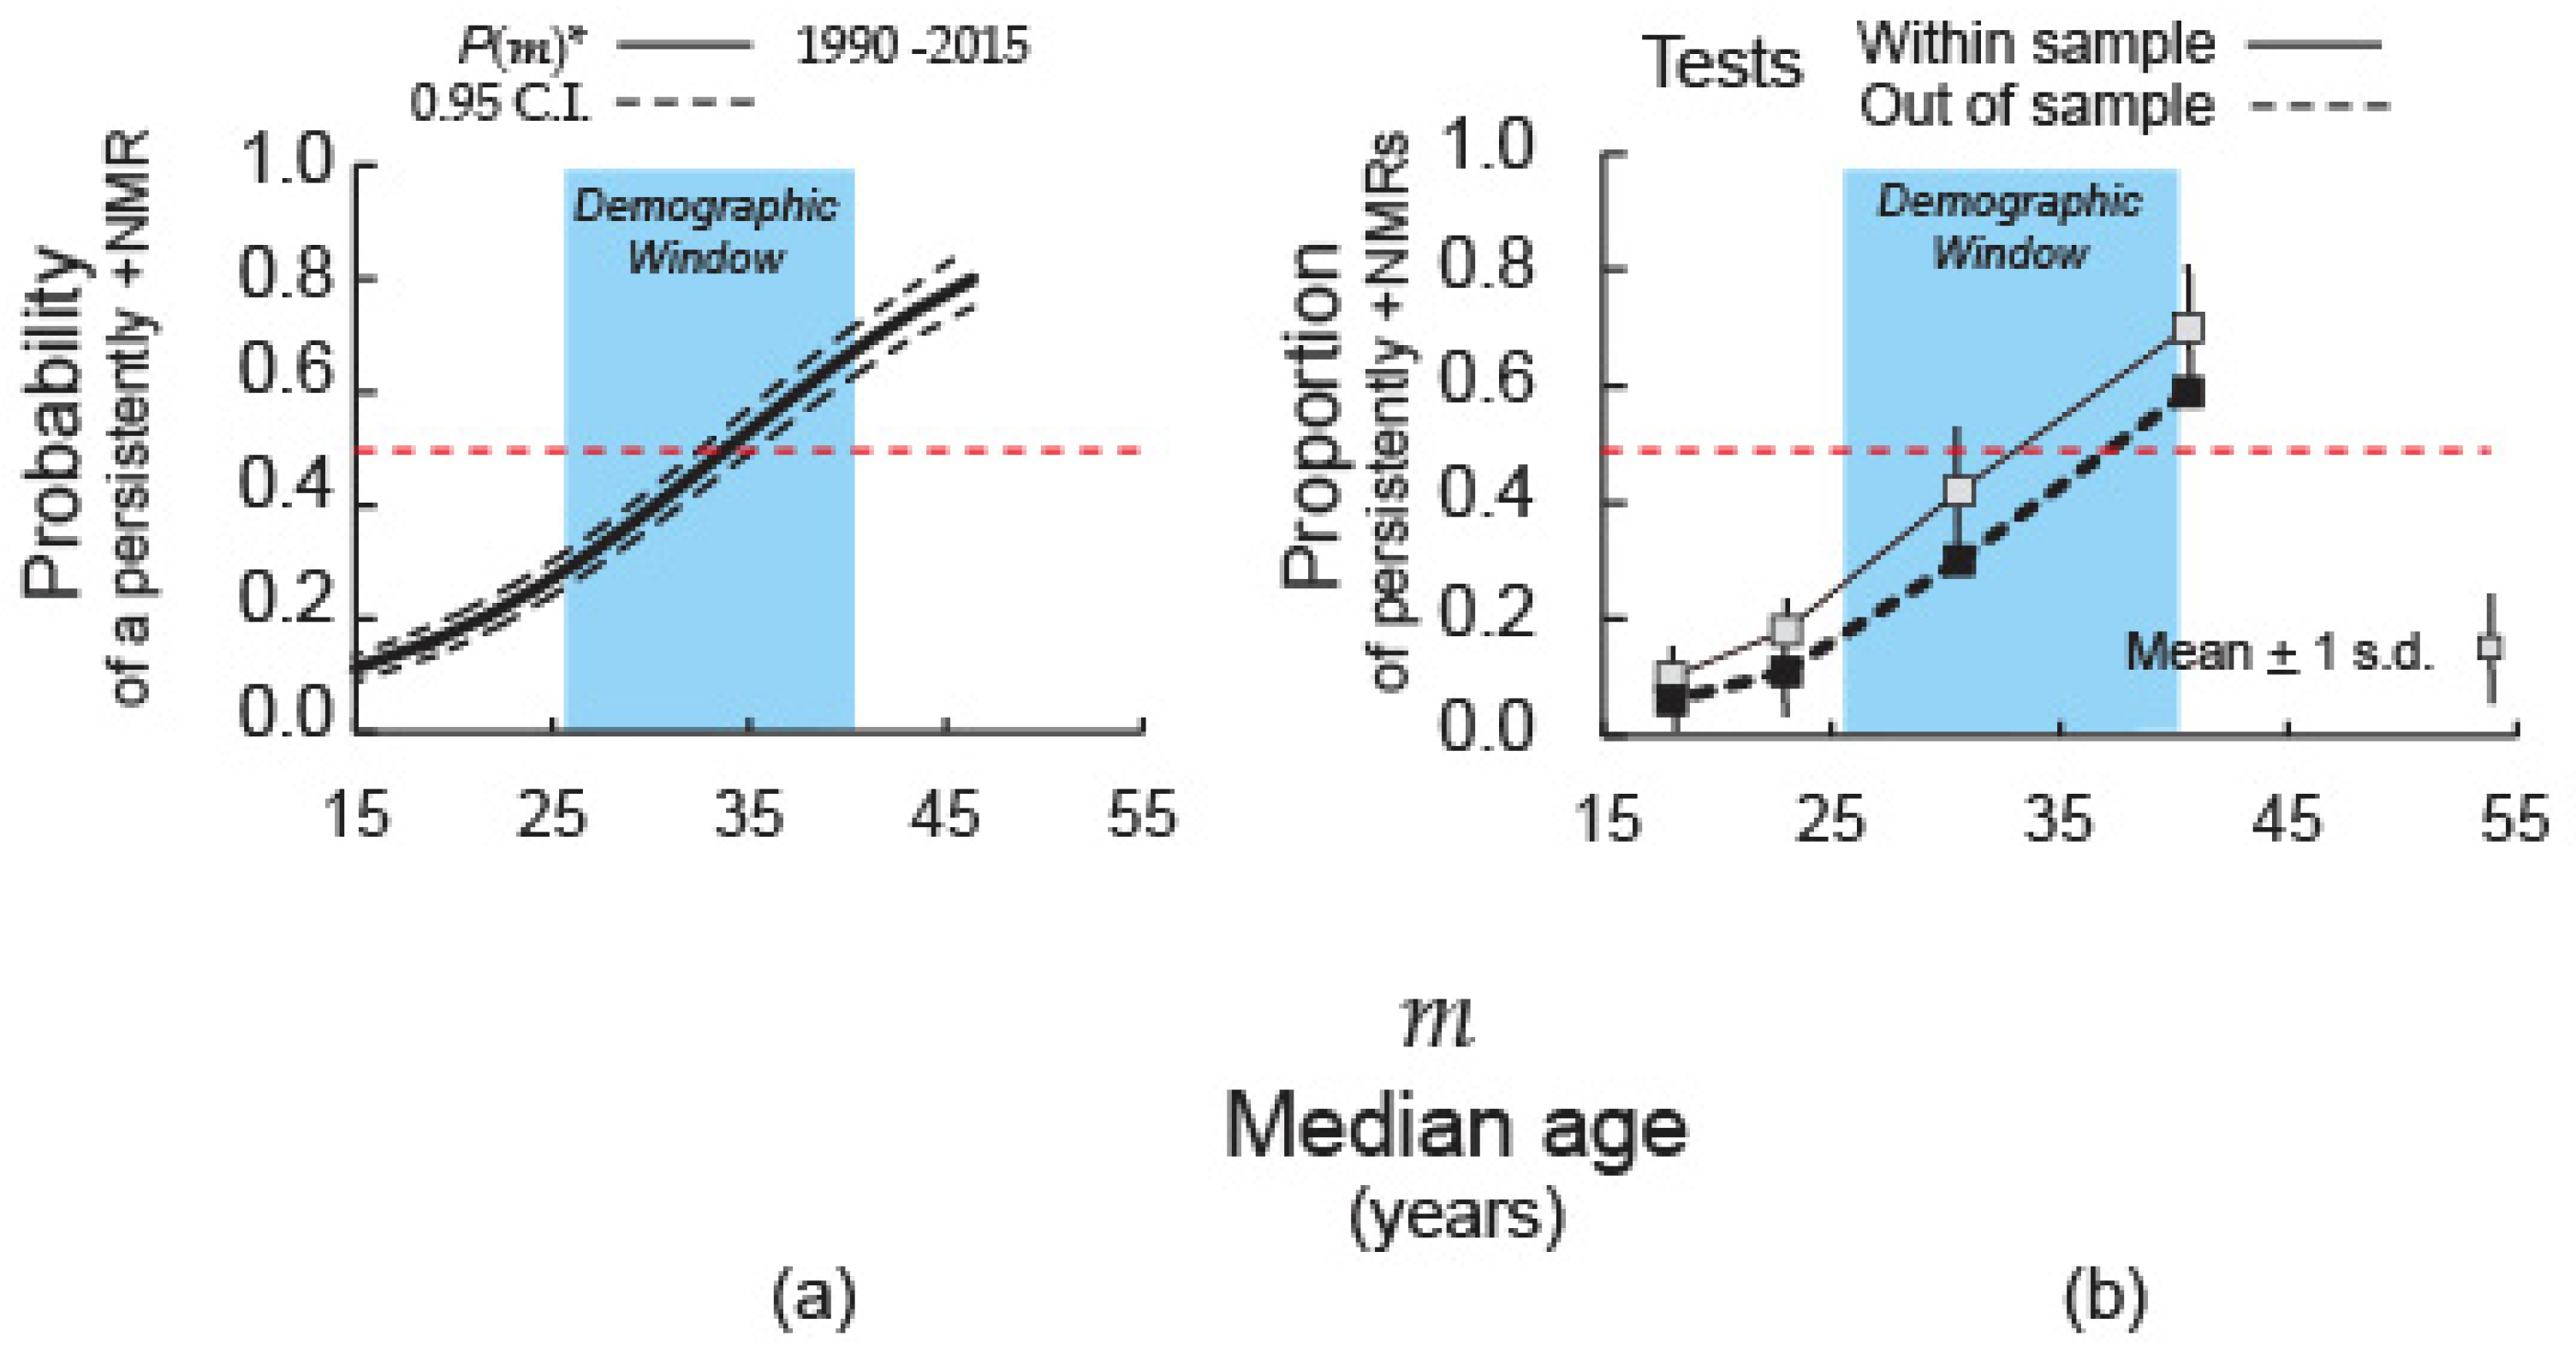
Figure 5.
The median age at which 23 countries (identified by their ISO3 Alpha Code) have shifted from a −NMR to a string of 10 consecutive +NMRs since 1970. Darkened segments indicate that the country failed to retain its +NMR status in the latest year (2023) of the most recent UN estimates [4].
Figure 5.
The median age at which 23 countries (identified by their ISO3 Alpha Code) have shifted from a −NMR to a string of 10 consecutive +NMRs since 1970. Darkened segments indicate that the country failed to retain its +NMR status in the latest year (2023) of the most recent UN estimates [4].
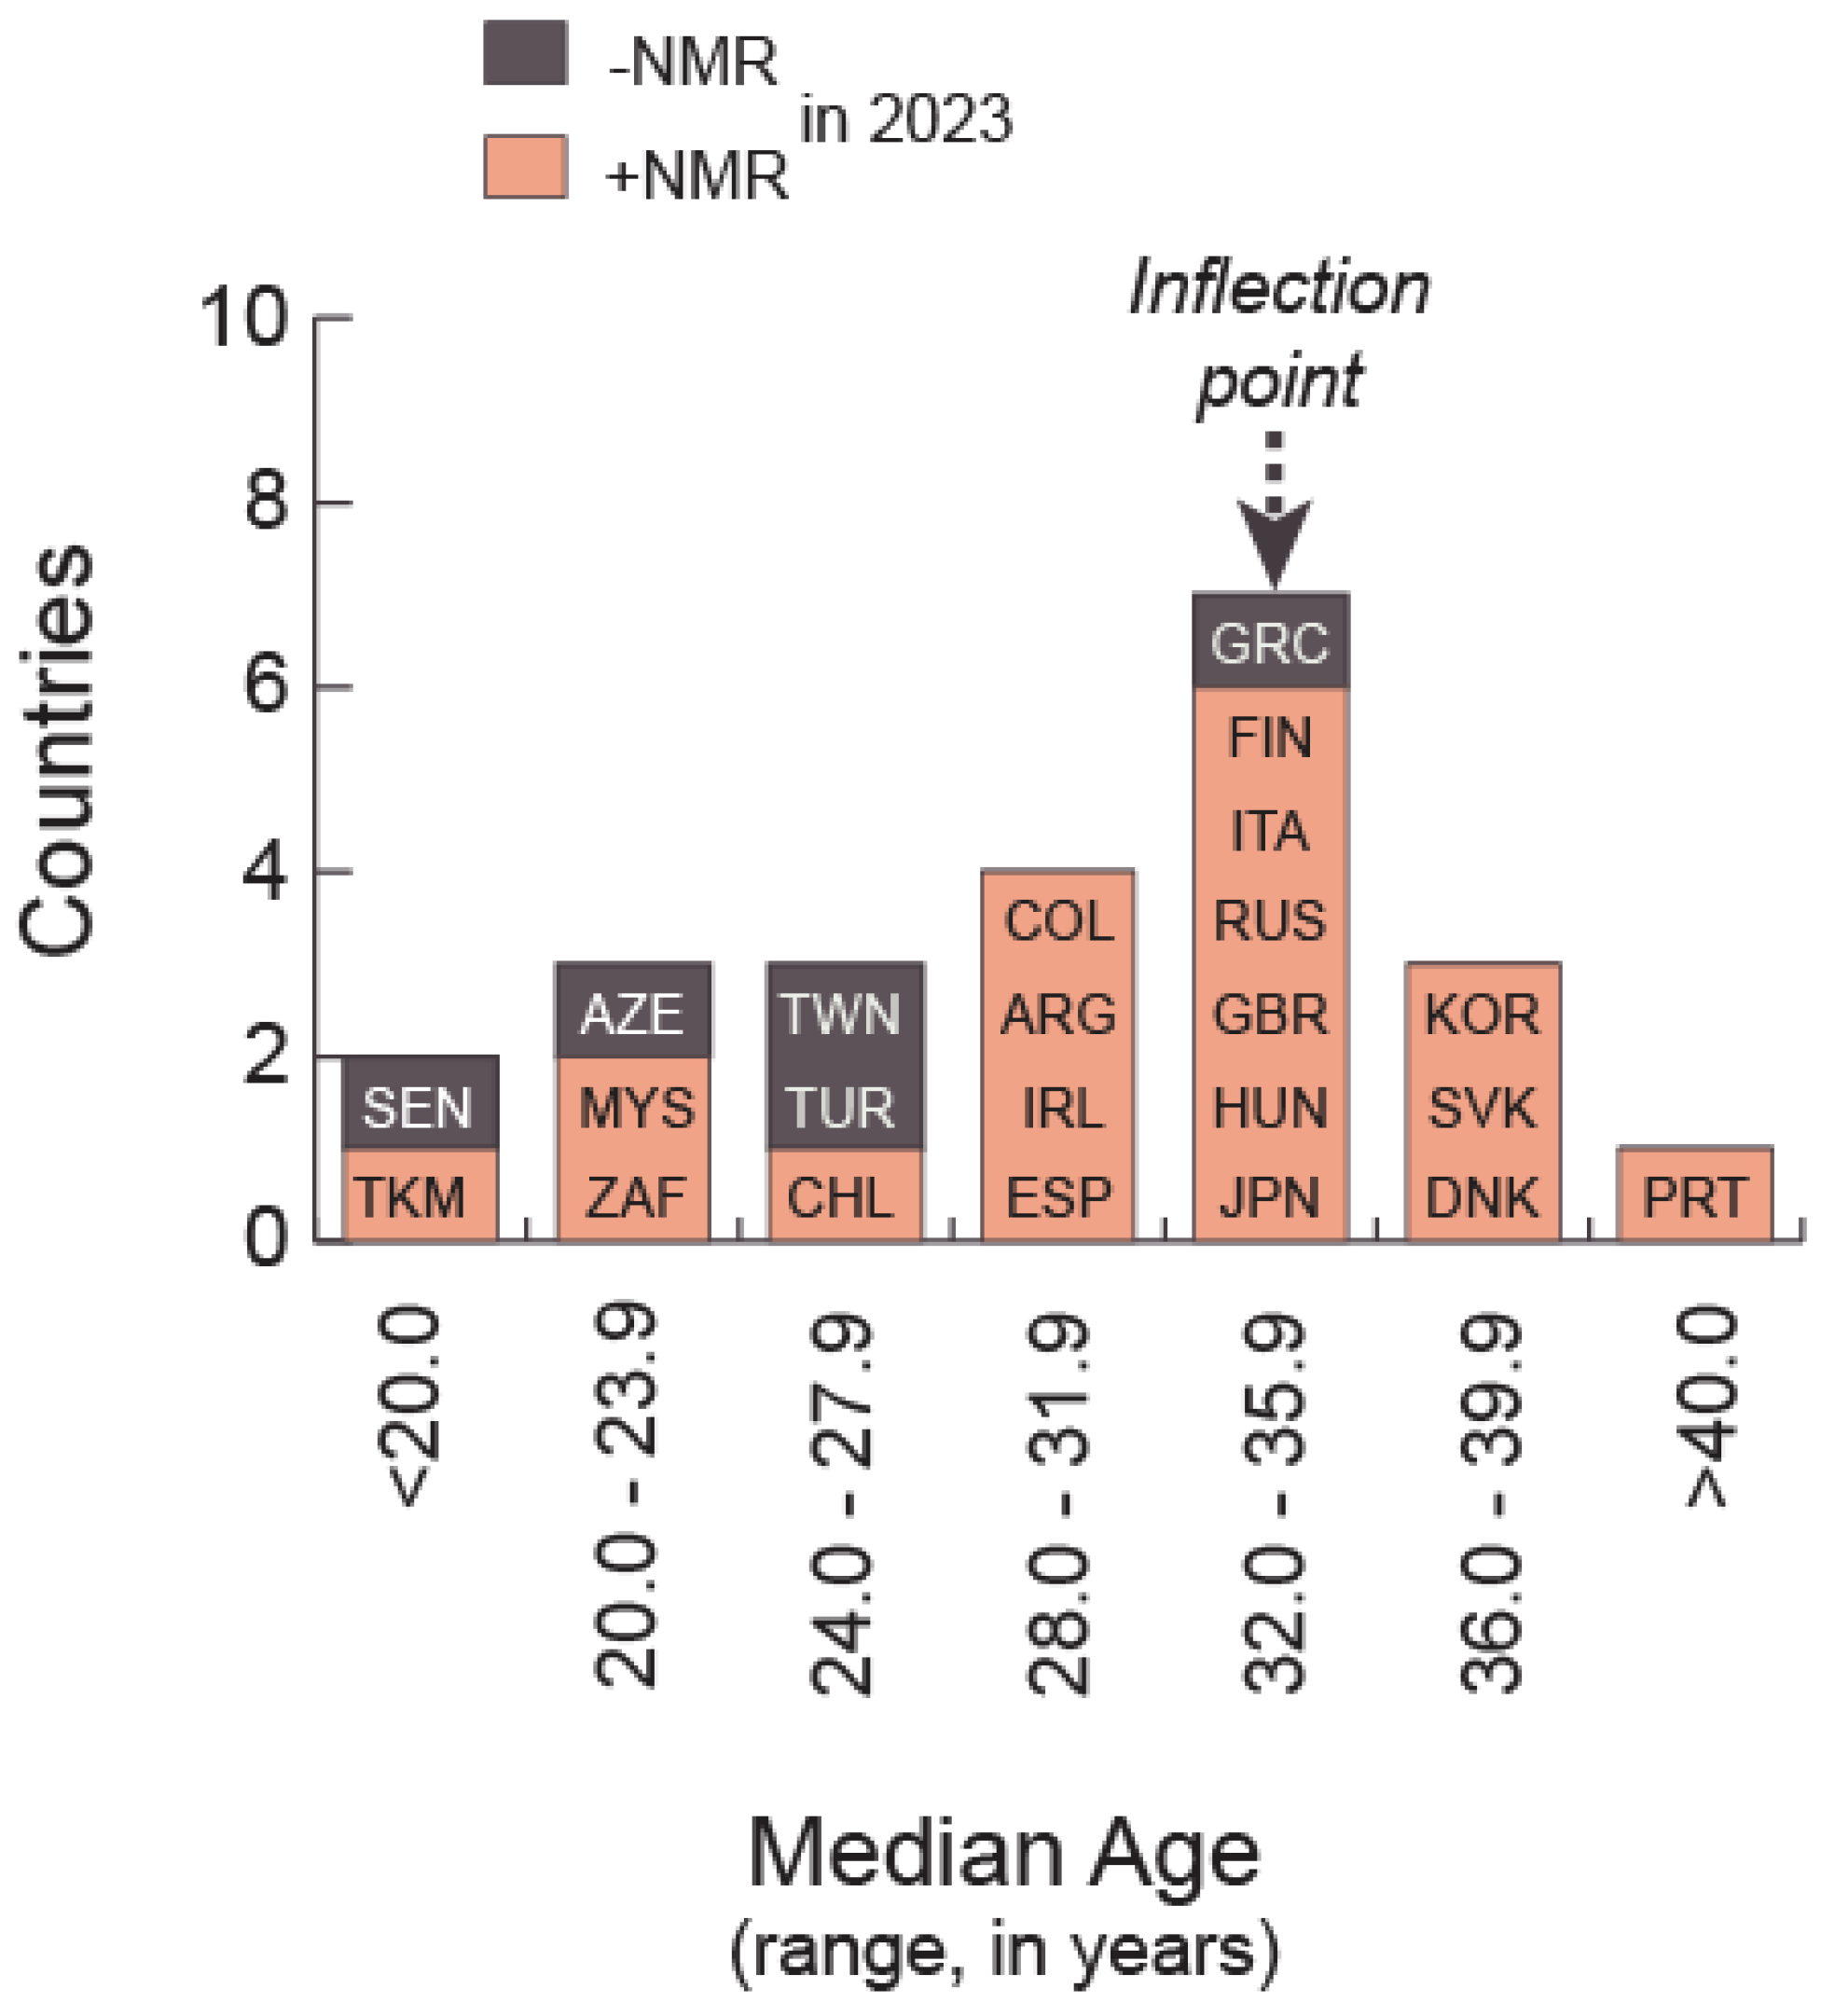
Figure 6.
The standard model’s theoretical (a) and empirically determined (b) proportion of +NMRs correctly predicted (left vertical axis) and odds ratio of correct-to-incorrect +NMRs (right vertical axis) at median ages greater than the selected cut point (horizontal axis). The smooth theoretical results (a) are due to assumptions of evenly distributed data, unlimited n, and a precise fit to the age-structural function. Empirical results (b) are averages from three years of reserve data (2021 to 2023) for years when n≥15.
Disclaimer/Publisher’s Note: The statements, opinions and data contained in all publications are solely those of the individual author(s) and contributor(s) and not of MDPI and/or the editor(s). MDPI and/or the editor(s) disclaim responsibility for any injury to people or property resulting from any ideas, methods, instructions or products referred to in the content. |
© 2025 by the authors. Licensee MDPI, Basel, Switzerland. This article is an open access article distributed under the terms and conditions of the Creative Commons Attribution (CC BY) license (http://creativecommons.org/licenses/by/4.0/).
Copyright: This open access article is published under a Creative Commons CC BY 4.0 license, which permit the free download, distribution, and reuse, provided that the author and preprint are cited in any reuse.


