
Submitted:
05 August 2025
Posted:
07 August 2025
You are already at the latest version
Abstract
As operational emissions decrease due to improved energy efficiency, reducing embodied carbon in buildings has become increasingly important. Life Cycle Assessment (LCA) is a widely used method to quantify these impacts. However, its implementation often remains data-intensive and time-consuming due to the need for detailed material inventories. This study analyzed 100 LCA reports submitted for G-SEED certification in South Korea to identify a core set of construction materials that accounts for the majority of total material mass. The findings revealed 12 key material categories—such as ready-mixed concrete, cement-based products, structural steel, wood, and interior finishes—that dominate embodied carbon contributions, with concrete alone comprising over 85% of the total mass. Based on these results, a material classification framework was developed according to functional role and carbon impact. By focusing on these high-impact materials, future LCA efforts can be significantly streamlined without compromising accuracy. This approach offers data-driven guidance for LCA practitioners, designers, and green building certification bodies aiming for efficient and reliable carbon assessments.
Keywords:
embodied carbon
; building materials
; LCA
; material mass threshold
; G-SEED
; classification
; carbon neutrality
1. Introduction
The building sector is responsible for nearly 37% of global greenhouse gas (GHG) emissions, with a significant portion originating from the production, transportation, and installation of construction materials—commonly referred to as embodied carbon [1]. As operational carbon emissions decline due to high-performance insulation and energy-efficient systems, embodied carbon has become a critical focus in the pursuit of carbon-neutral buildings [2].
Life Cycle Assessment (LCA) is widely recognized as a robust methodology for evaluating the environmental performance of buildings across their entire life cycles. Numerous studies have shown that a small number of materials—such as concrete, steel, and insulation—account for the majority of a building’s embodied carbon [3,4]. Despite this, current LCA practices typically require exhaustive material inventories, many of which have minimal impact on the overall environmental footprint.
International certification systems such as LEED, BREEAM, and DGNB have incorporated LCA into their frameworks, and countries like France and the Netherlands have mandated LCA submissions for new buildings [5,6]. However, the lack of practical guidance on which materials to prioritize in carbon assessments limits both the efficiency and applicability of LCA in design and policy contexts.
In South Korea, the G-SEED certification system currently includes LCA as part of its evaluation criteria and plans to strengthen these requirements after 2025. Yet, no studies have systematically analyzed LCA data submitted under G-SEED to identify material contribution patterns. This evidence gap hampers efforts to streamline LCA practices and integrate embodied carbon considerations into routine design workflows.
To address this gap, this study analyzed 100 LCA reports submitted for G-SEED certification to identify the construction materials that collectively represent over 99% of the total material mass. Based on this analysis, we developed a simplified classification framework comprising 12 core material categories, organized by functional role and carbon impact. The aim is to support practical LCA simplification by focusing on essential components while preserving sufficient accuracy for carbon assessment and certification purposes.
2. Materials and Methods
2.1. Literature Review
An extensive literature review was conducted to establish a conceptual foundation for material classification in building LCA, focusing on the following four domains.
- Global trends in embodied carbon and life cycle assessment methodologies;
- Material-level impact studies (e.g., concrete, steel, insulation);
- Prior approaches to material ranking, classification, and prioritization;
- The integration of LCA into green building certifications and policy mechanisms.
2.2. Data Collection and Analysis
The primary dataset comprised 100 LCA reports submitted for G-SEED certification in the Republic of Korea between 2017 and 2024. These reports covered diverse building typologies (residential, office, school, and retail) and structural systems (reinforced concrete, composite, and steel-reinforced concrete).
The analysis proceeded as follows:
- Bill of Quantities (BoQ) Review: Each report’s BoQ was examined to determine the total number of materials listed.
- Mass Contribution Calculation: For material group, the percentage contribution to the total mass was computed.
- Material Ranking: Materials were ranked based on their frequency of occurrence across projects, cumulative mass contribution, and relative carbon impact potential.
- Classification Framework: Materials were grouped into 12 categories based on their functional roles and potential integration into certification systems.
3. Literature Review
3.1. Overview of LCA in Buildings
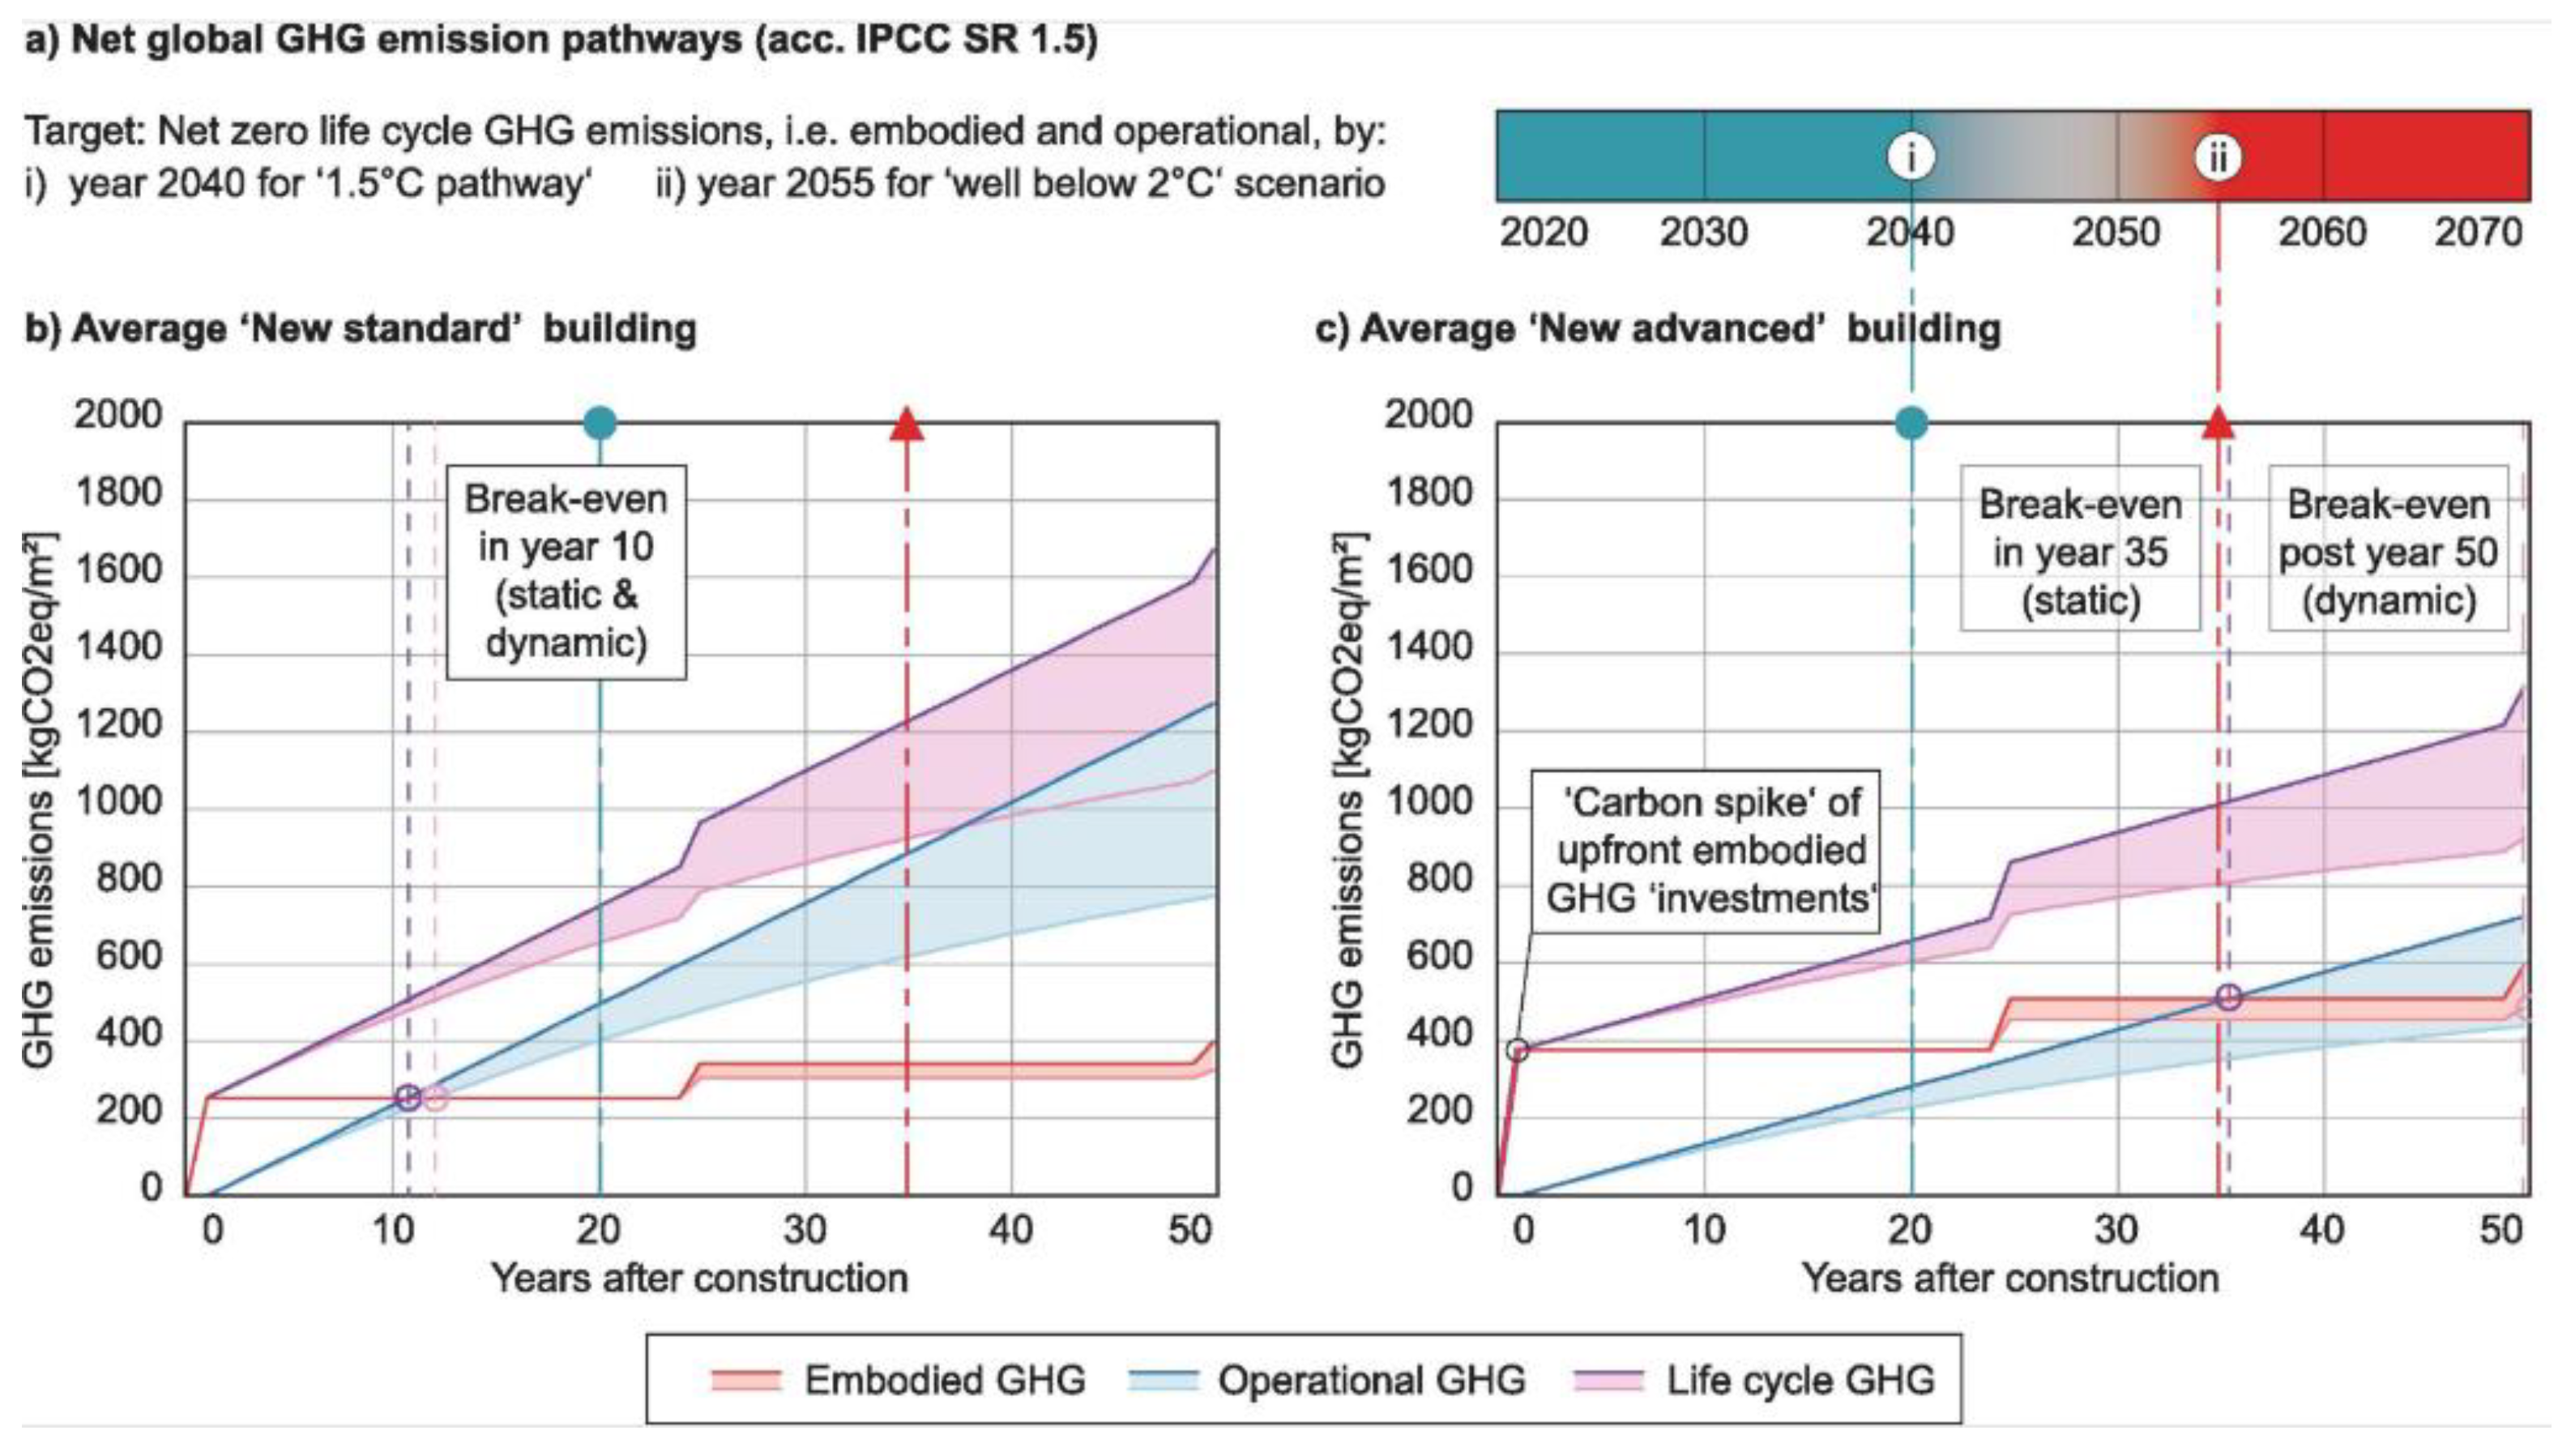
LCA has become a standardized methodology for evaluating the environmental impacts of buildings across their entire life cycle—from the extraction of raw materials to end-of-life disposal [7,8]. In highly energy-efficient buildings, embodied carbon—emissions resulting from the production and construction of materials—can account for 30–70% of total greenhouse gas (GHG) emissions [2,3]. As such, emissions from the material phase have become increasingly central to achieving carbon neutrality in the built environment.
Figure 1.
Importance of material-phase emissions has become increase [2].
Figure 1.
Importance of material-phase emissions has become increase [2].
3.2. Embodied Carbon and Material Contributions
Embodied carbon refers to the GHG emissions associated with all life cycle stages of construction materials, including raw material extraction, manufacturing, transportation, and installation. International standards such as ISO 14040/14044 and EN 15978 provide methodological frameworks for conducting building LCAs, defining system boundaries and modules [9].
Figure 2.
Building’s LCA stages according to EN 15978.
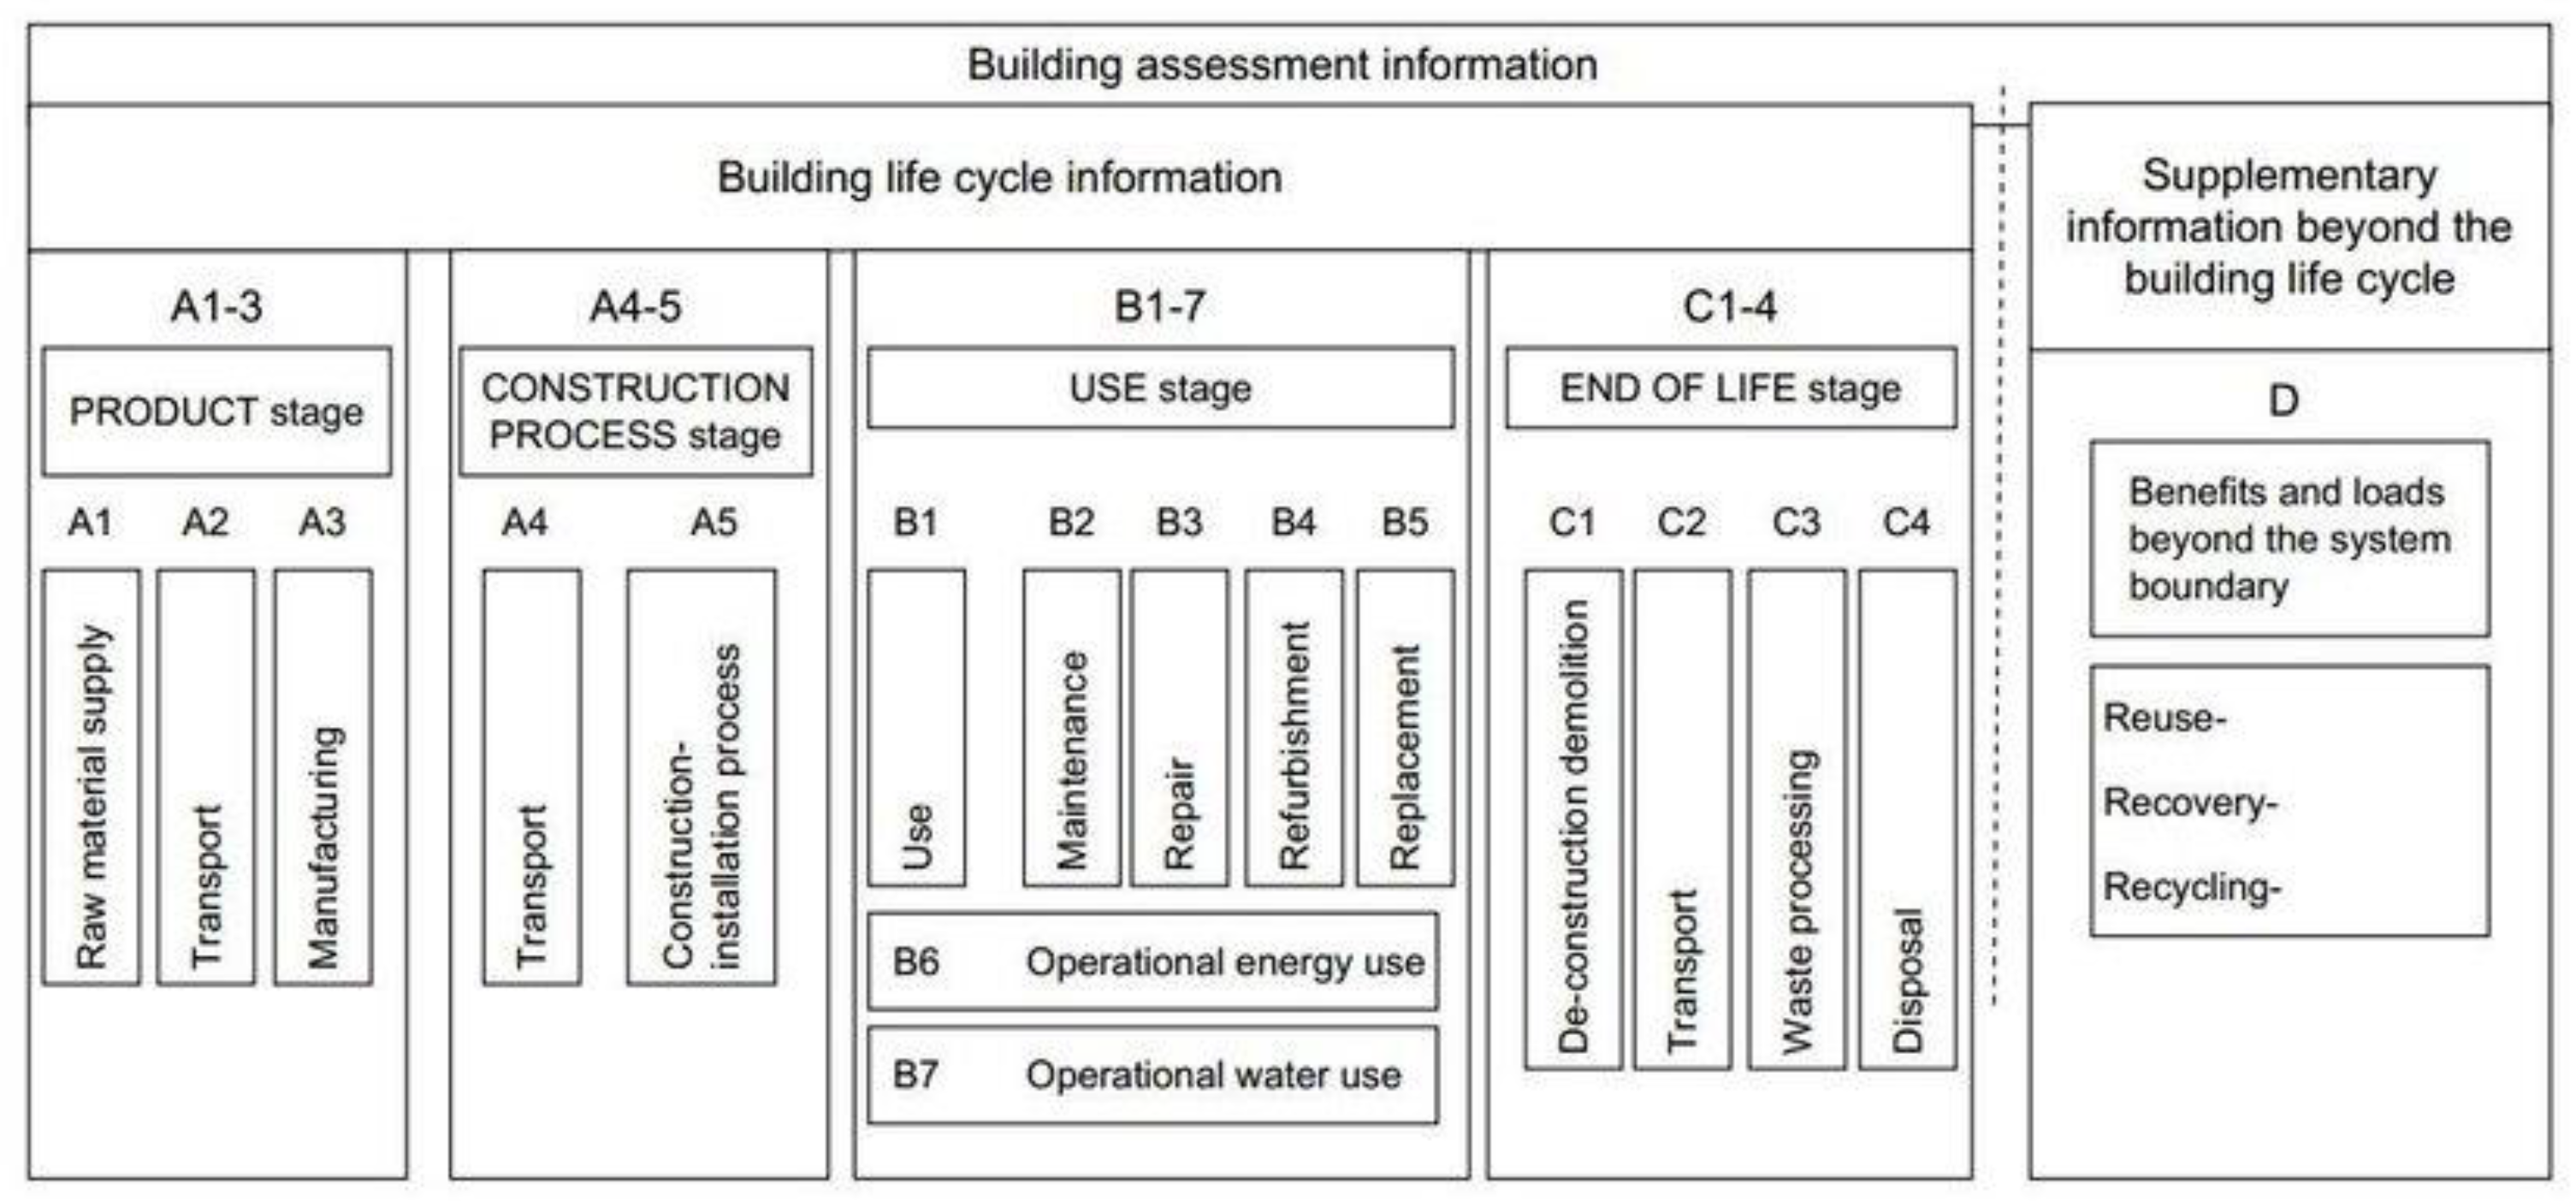
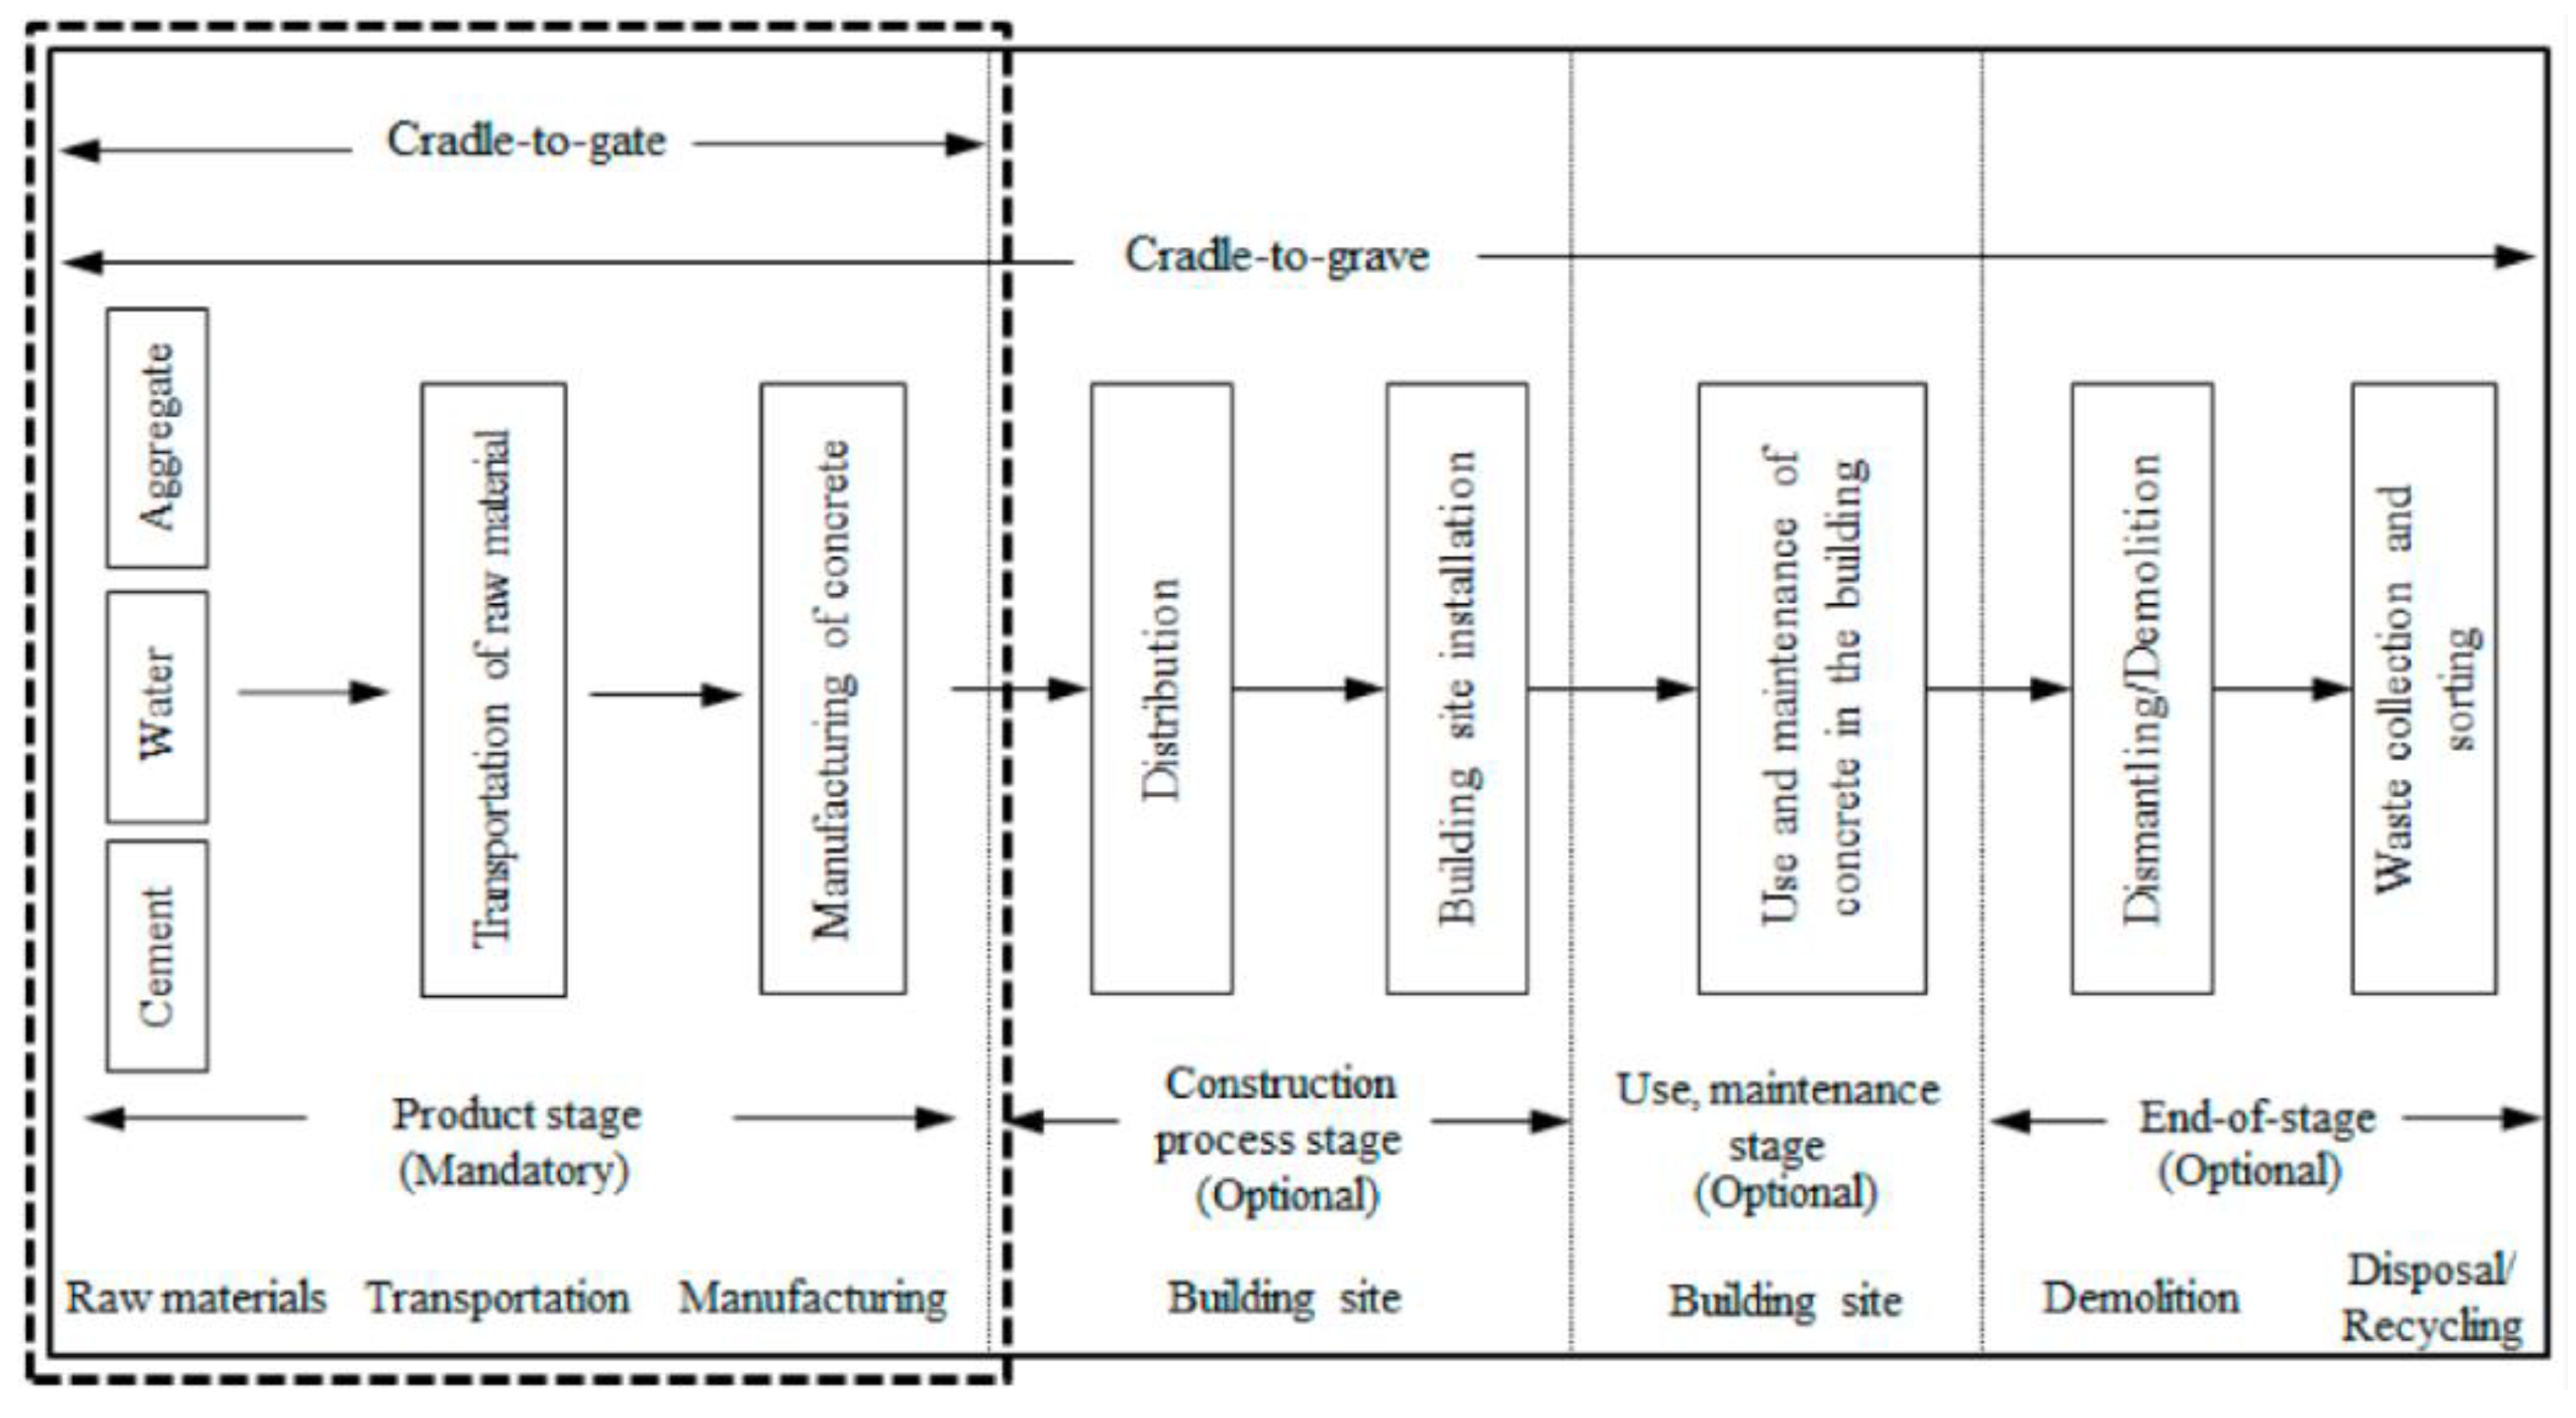
According to EN 15978, the building life cycle is typically segmented into Modules A (product and construction stages), B (use stage), C (end-of-life stage), and D (benefits beyond the system boundary). Within this framework, Modules A1–A3 (Product Stage: raw material supply, transport, and manufacturing) are considered critical, as they account for the majority of embodied carbon in buildings [10]. Numerous studies have confirmed that emissions from these stages dominate the overall environmental impact of construction materials, particularly for structural components [2,3].
Figure 3.
System boundary of building materials [10].
Figure 3.
System boundary of building materials [10].
Furthermore, A persistent challenge in LCA implementation lies in the exhaustive material inventories traditionally required by standards. While typical Bills of Quantities (BoQs) may include hundreds of material entries, research indicates that a small subset of materials—such as concrete, steel, and insulation—often represents over 90–95% of the total mass and carbon impact [12,13]. To improve LCA efficiency without compromising accuracy, recent approaches have proposed a cumulative mass-based threshold—commonly set at 99%—to limit detailed assessments to high-impact materials [13,14]. This method aligns with the Pareto principle, ensuring that the most significant contributors are fully captured while omitting negligible components. Meta-analyses have further validated that materials with high production volumes or energy-intensive manufacturing processes—such as cement, rebar, and aluminum—are primary contributors to environmental impacts [15,16].
In practice, calculating cumulative mass contributions and excluding the bottom 1% of materials enables substantial reductions in data entry and modeling complexity while maintaining robust carbon estimates for Modules A1–A3. This approach is increasingly recognized as a viable strategy for simplifying LCA processes in certification systems and early-stage design decision-making [12,17].
3.3. Material Classification and Prioritization
Despite growing awareness of the importance of embodied carbon at the material level, standardized frameworks for classifying and prioritizing construction materials remain underdeveloped [13,18]. Discrepancies in classification criteria—such as functional roles (e.g., structural vs. non-structural), spatial location (e.g., envelope vs. interior), or database conventions—undermine consistency and comparability across LCA studies.
3.4. Role of LCA in Certification and Policy
Leading international green building certification systems—such as LEED, BREEAM, and DGNB—have formally incorporated LCA as an evaluation criterion and offer credits for reducing life cycle environmental impacts [20,21]. In Europe, countries such as Denmark, France, and the Netherlands have gone further by mandating LCA submissions as part of the permitting process for new buildings [6].
3.5. Practical Challenges in LCA implementation
Although LCA is widely recognized as a robust and standardized methodology, its implementation in design workflows remains challenging. Studies have identified three key barriers that limit the broader adoption of LCA beyond specialized expert groups.
First, LCA is heavily dependent on expert knowledge and specialized tools, posing high entry barriers for general practitioners—especially during the early design stage [13,18]. Expertise is required to define system boundaries, interpret results, and apply complex databases, leading to the concentration of LCA tasks within consultancy firms and reducing its accessibility to architects and engineers.
Second, uncertainty in input data and variability across databases (e.g., emission factors, EPDs) pose significant challenges [12,17]. Inconsistent data quality and the lack of region-specific values compromise both comparability and reliability, reducing confidence in LCA outputs for design decision-making.
Third, there is a lack of clear, actionable guidance for material selection based on environmental impact—particularly in early design phases. While standards such as EN 15978 and ISO 14040 provide methodological structures, they do not specify how to prioritize materials within practical time and budget constraints [14,25].
Finally, while cumulative mass-based thresholds (e.g., 99%) offer conceptual simplicity, their application in practice can be burdensome. Calculating and verifying cumulative contributions requires detailed quantity take-offs and reliable inventory data—information often unavailable during early design stages [13]. As a result, the intended simplification may become impractical without digital integration (e.g., BIM-LCA automation) or standardized material grouping.
These limitations highlight the need for user-friendly, streamlined frameworks that enable practitioners to focus on high-impact materials without requiring exhaustive analysis or exclusive reliance on expert workflows.
3.6. National Context and Research Contribution
In the Republic of Korea, the G-SEED certification system incorporates LCA reporting and is set to strengthen these requirements after 2025. However, little effort has been made to synthesize accumulated LCA data to identify consistent material contribution patterns. This lack of analysis hampers the development of a context-specific framework for classifying materials by environmental impact and limits the practical use of LCA in Korean design practice.
To address this gap, the present study analyzed 100 LCA reports submitted under G-SEED to identify 12 key materials that accounted for the majority of total material mass. Based on their functional roles, this study proposes a systematic classification framework aimed at improving embodied carbon management in both domestic and international contexts.
4. Data Collection and Analysis Result
4.1. Status of Green Building Certification and Life Cycle Assessment Reports in Korea
Similar to international green building certification systems such as LEED, BREEAM, and DGNB, South Korea has implemented its own green building certification program—G-SEED—in operation since 2002. G-SEED certification is mandatory for public buildings and is promoted in the private sector through incentives such as acquisition tax reductions and building regulation relaxations. As a result, the system has been widely adopted, with approximately 25,000 buildings certified as of 2024.
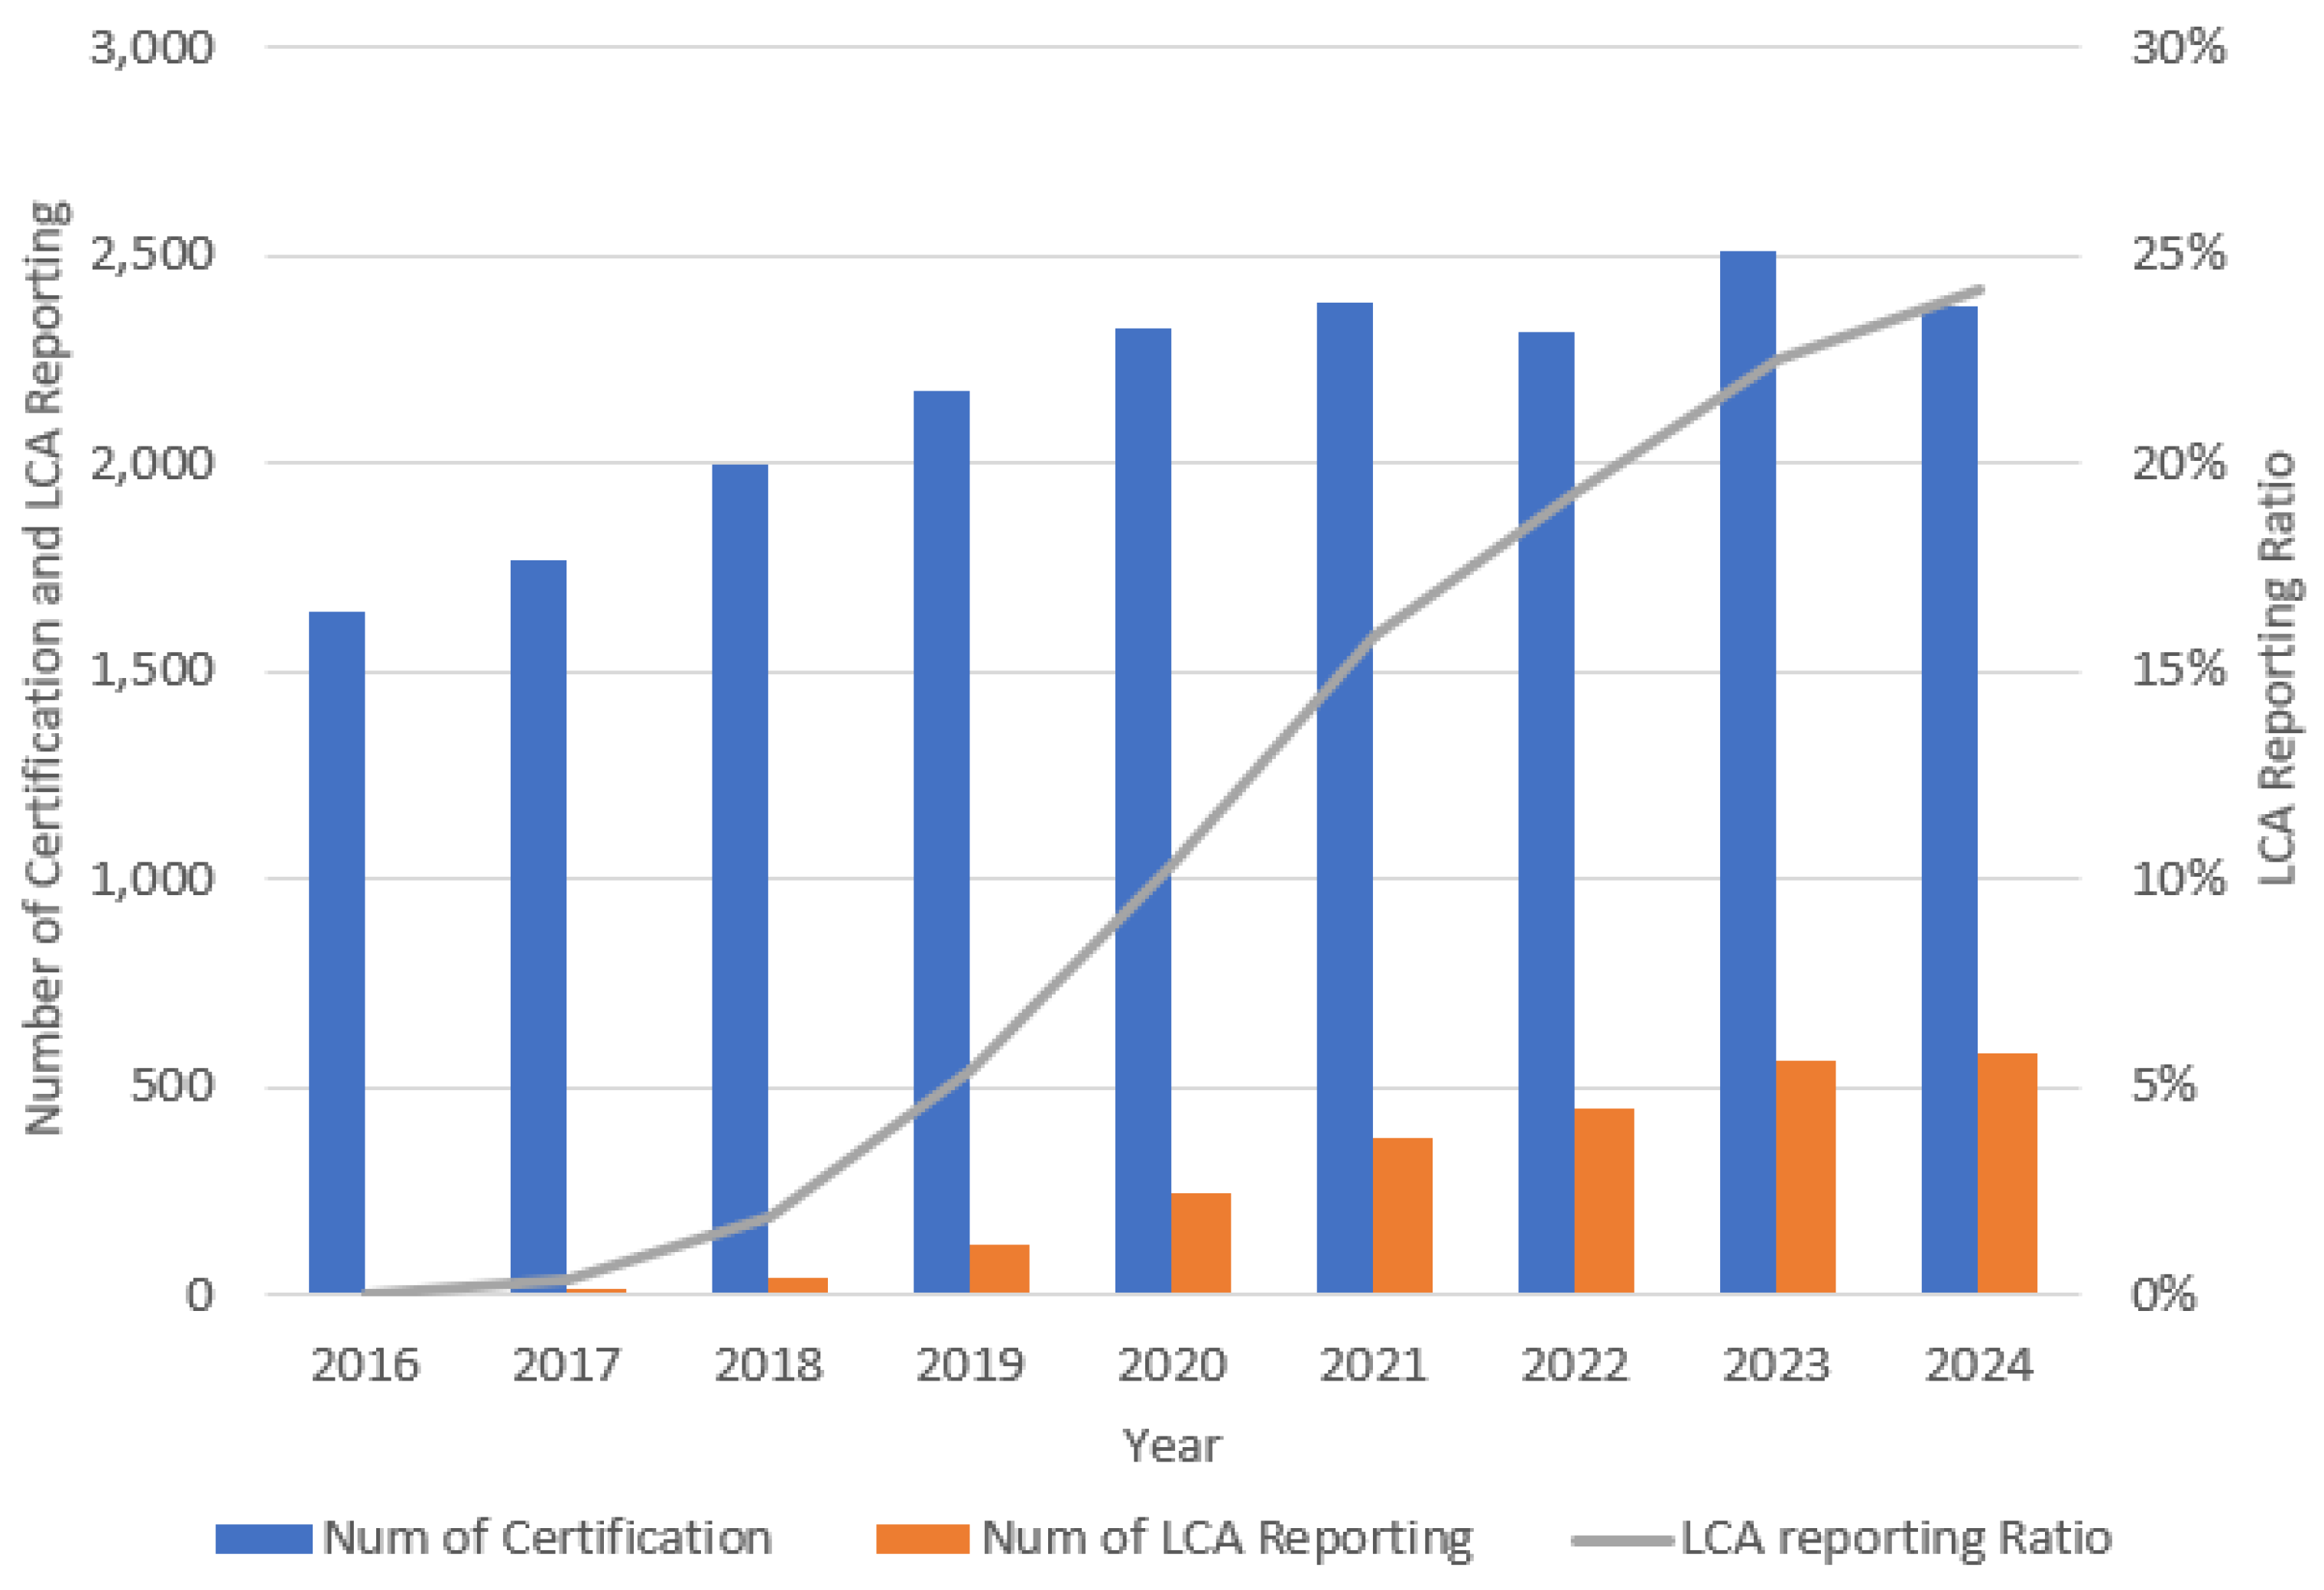
A major revision of the G-SEED framework took place in 2016, during which Life Cycle Assessment (LCA) was introduced as a formal evaluation criterion. Since then, the use of LCA in certification has gradually expanded. Table 1 presents the number of LCA reports submitted annually since the criterion’s introduction.
In the first three years, LCA adoption was limited to around 2% of certified buildings. However, this uptake has steadily increased, reaching 24% by 2024—reflecting the growing emphasis on embodied carbon assessments within Korean green building practices.
Figure 4.
Comparative certified and LCA reported buildings ratio.
As LCA reporting becomes more prevalent, a foundation for comprehensive life-cycle carbon management in buildings is being established. However, G-SEED still has several limitations inherent to LCA, including the complexity of conducting a 99% cumulative mass analysis, limited integration with LCI databases and EPDs, and insufficient verification of data completeness and consistency.
To address one of these critical limitations, this study proposes an alternative approach by identifying key construction materials using existing LCA reports. The objective is to provide a practical basis for material selection that could substitute for full cumulative mass analysis during LCA implementation. The dataset analyzed consisted of 100 LCA reports submitted under G-SEED certification (Appendix A). As shown in Table 2, the building typologies included residential, office, school, hotel, retail, and other non-residential types such as research centers, warehouses, and data centers. The structural systems are categorized as reinforced concrete(RC), RC+steel composites (RC + S), and steel-reinforced concrete (SRC).
4.2. LCA Data Analysis
A review of the BoQs for the 100 buildings was conducted. The number of BoQ items ranged from 110 to 6,259, while the number of materials actually used in the LCA reports varied from 38 to 2,473. On average, each BoQ contained 990 items, whereas the average number of materials included in the LCA was 319, representing 35.24% of total BoQ items.
However, the correlation between the total number of BoQ items and the number of LCA-selected materials was relatively weak (R² = 0.4673), indicating that variations are largely influenced by BoQ composition and the level of detail applied by LCA practitioners during material selection.
As Typically, preparing an LCA report involves: (1) An initial quantity analysis of around 990 BoQ items; (2) Selection of approximately 319 materials that cumulatively account for 99% of total material mass;(3) Collection of environmental data for each selected material.
This cumulative mass analysis presents a significant initial hurdle, which likely contributes to the limited practical adoption of LCA in design and certification workflows.
To address this challenge, this study aims to classify essential materials from the BoQ that should be prioritized in LCA, providing a more practical alternative to full cumulative mass calculations. Figure 5 illustrates the proposed simplified approach.
4.3. Quantity Breakdown in LCA
All 100 LCA reports performed a 99% cumulative mass analysis to identify which materials were assessed (Appendix B). The number of selected materials ranged from 38 to 2,473, with an average of 319 items. Collecting and linking environmental data for each material—potentially over 2,473 data points per project—is impractical. Therefore, it is common practice to group similar materials into representative categories and assign shared environmental data.
In the analyzed reports, materials were typically grouped into 5 to 12 categories, with an average of eight material groups. These groupings are outlined in Table 3.
An analysis was conducted on the frequency of use of 12 major construction material categories across 100 LCA reports (Table 4). The results indicated that Concrete and Structural Steel were included in all 100 reports. Cement and Insulation were used in 98 reports, whereas Sand and Gravel were used in 95. Stone and gypsum boards were included in 63 reports, whereas Glass Products were included in 57 reports. Metal Finishes were reported in 45 cases, tiles in 35 cases, and Paints and Wall Coverings and Wood were the least frequently included, appearing in five and four reports, respectively (Figure 6).
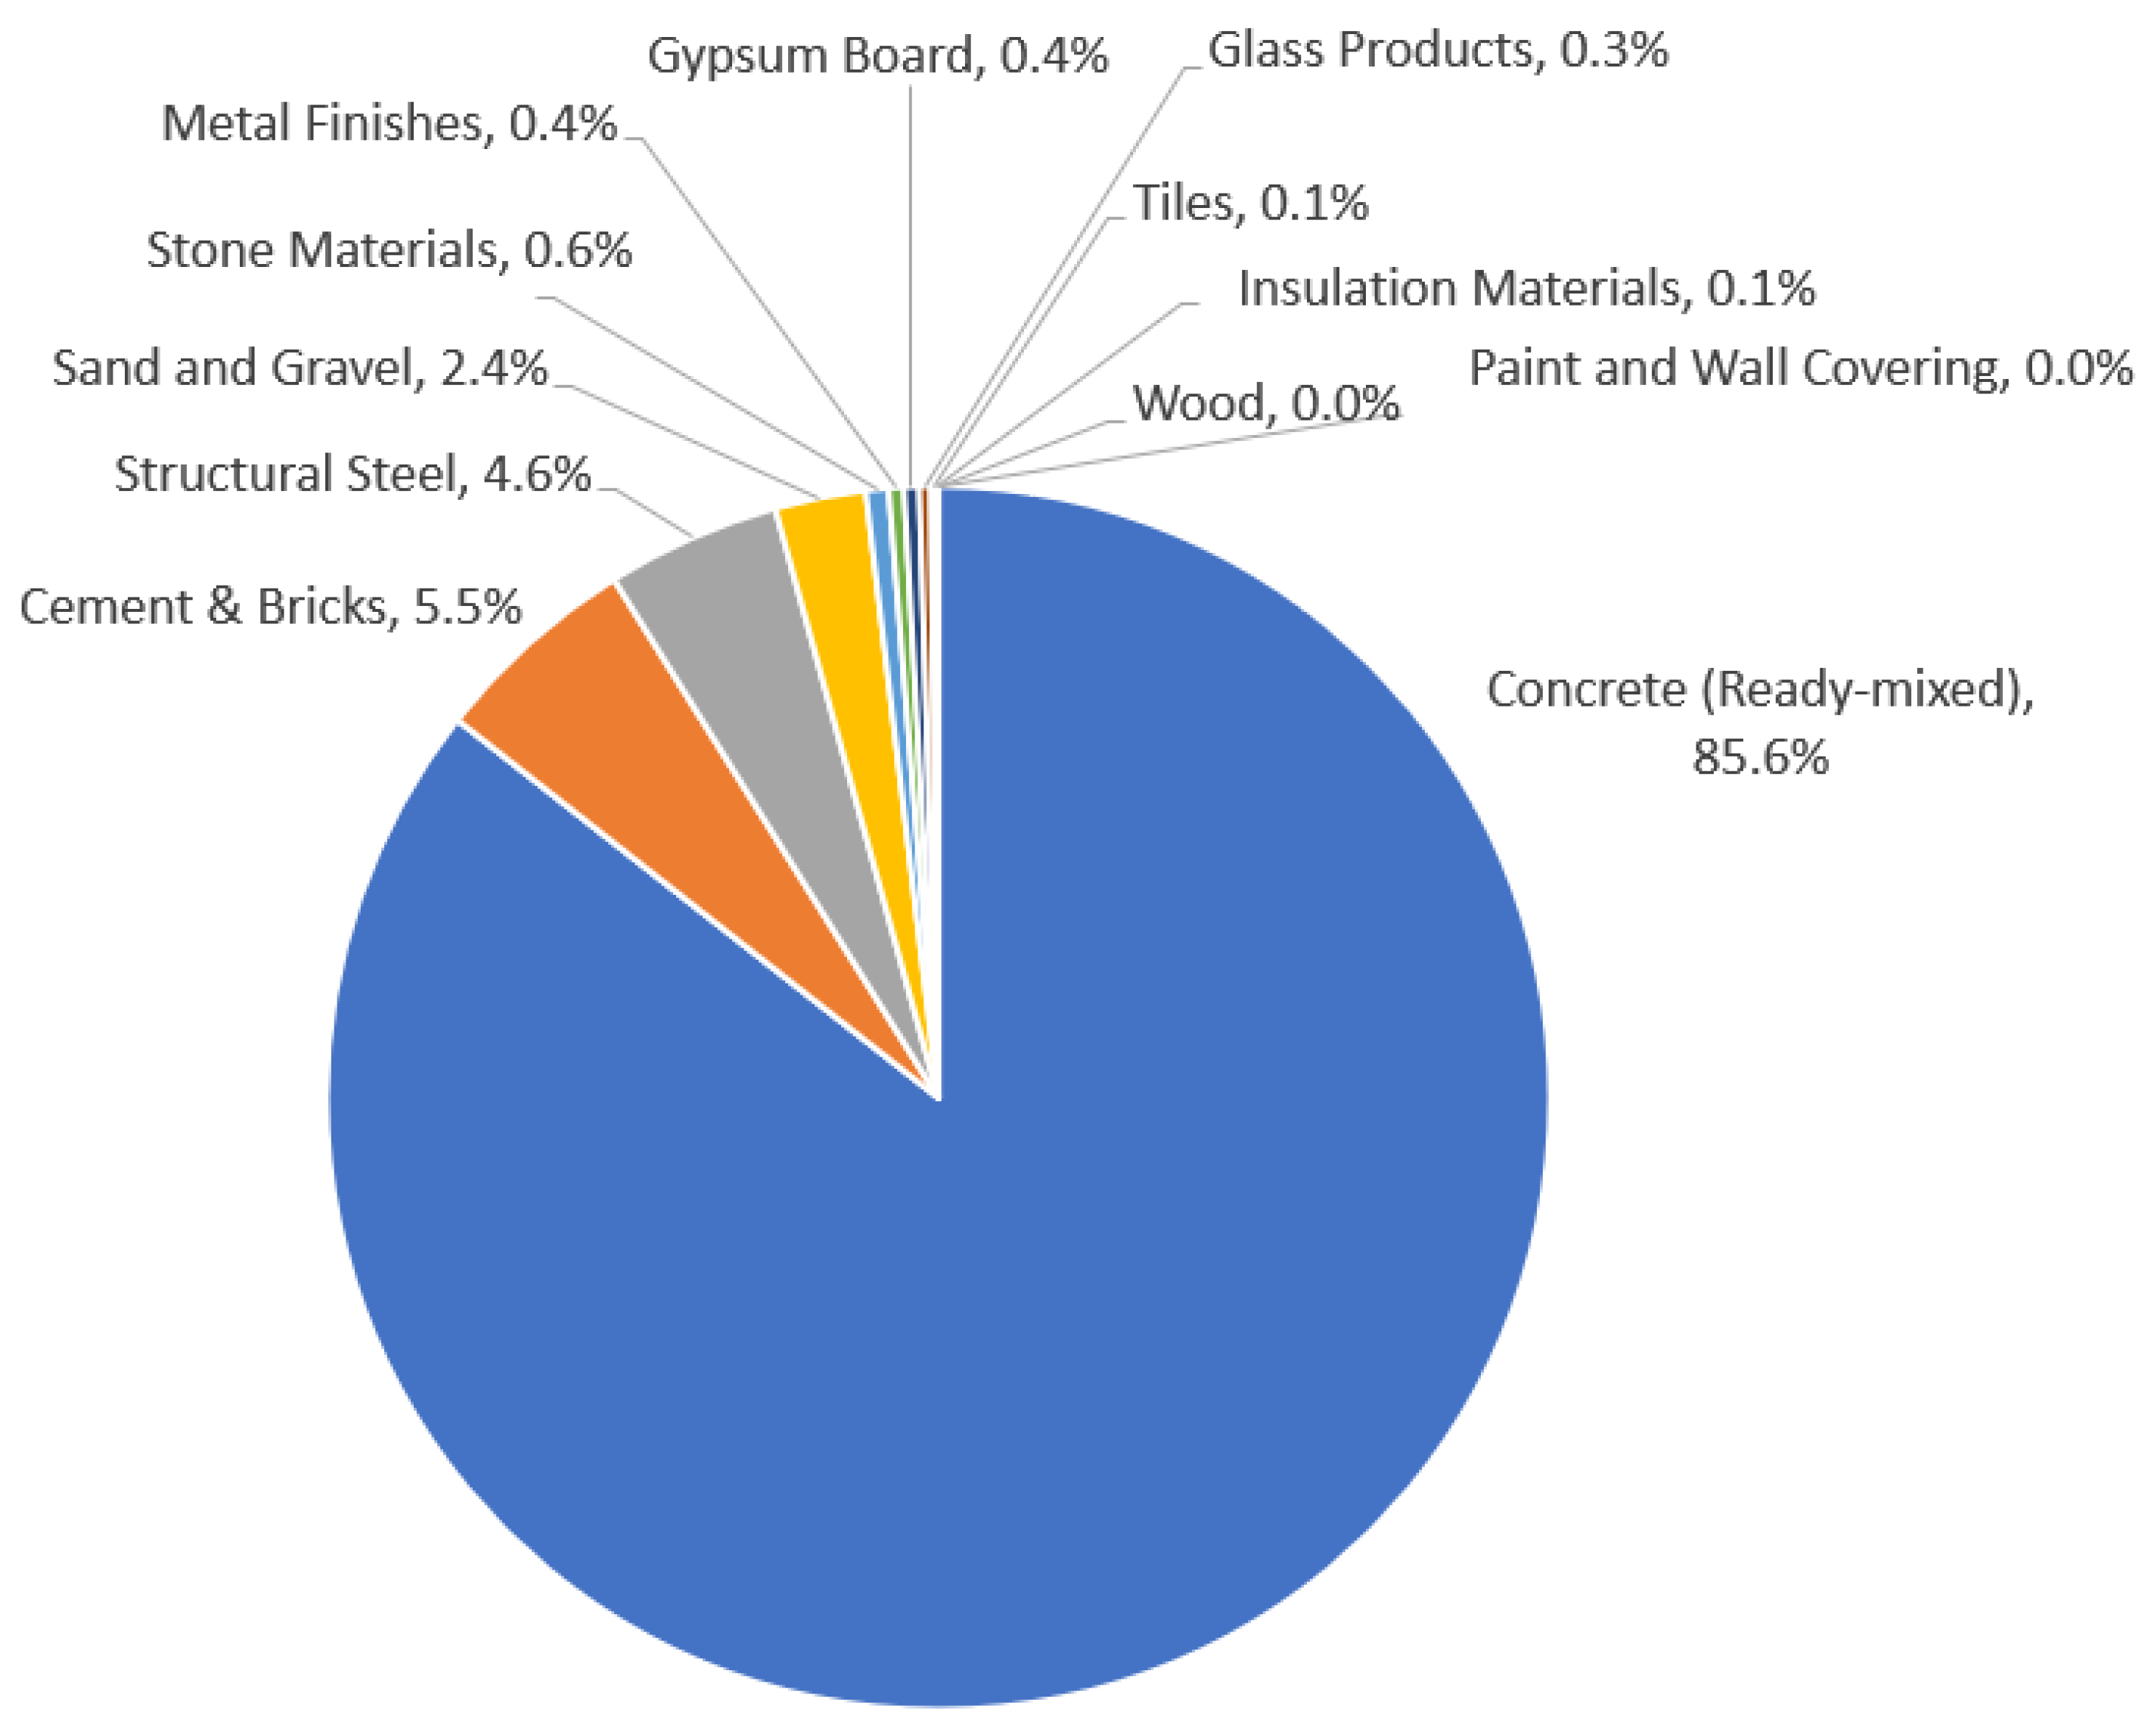
When analyzed by quantity contribution, concrete accounted for 85.6% of the total mass, followed by cement and brick (5.5%), Structural Steel (4.6%), and Sand and Gravel (2.4%), whereas all other material categories represented less than 1% each (Figure 7).
Figure 8.
Number of LCA reports using the material category .
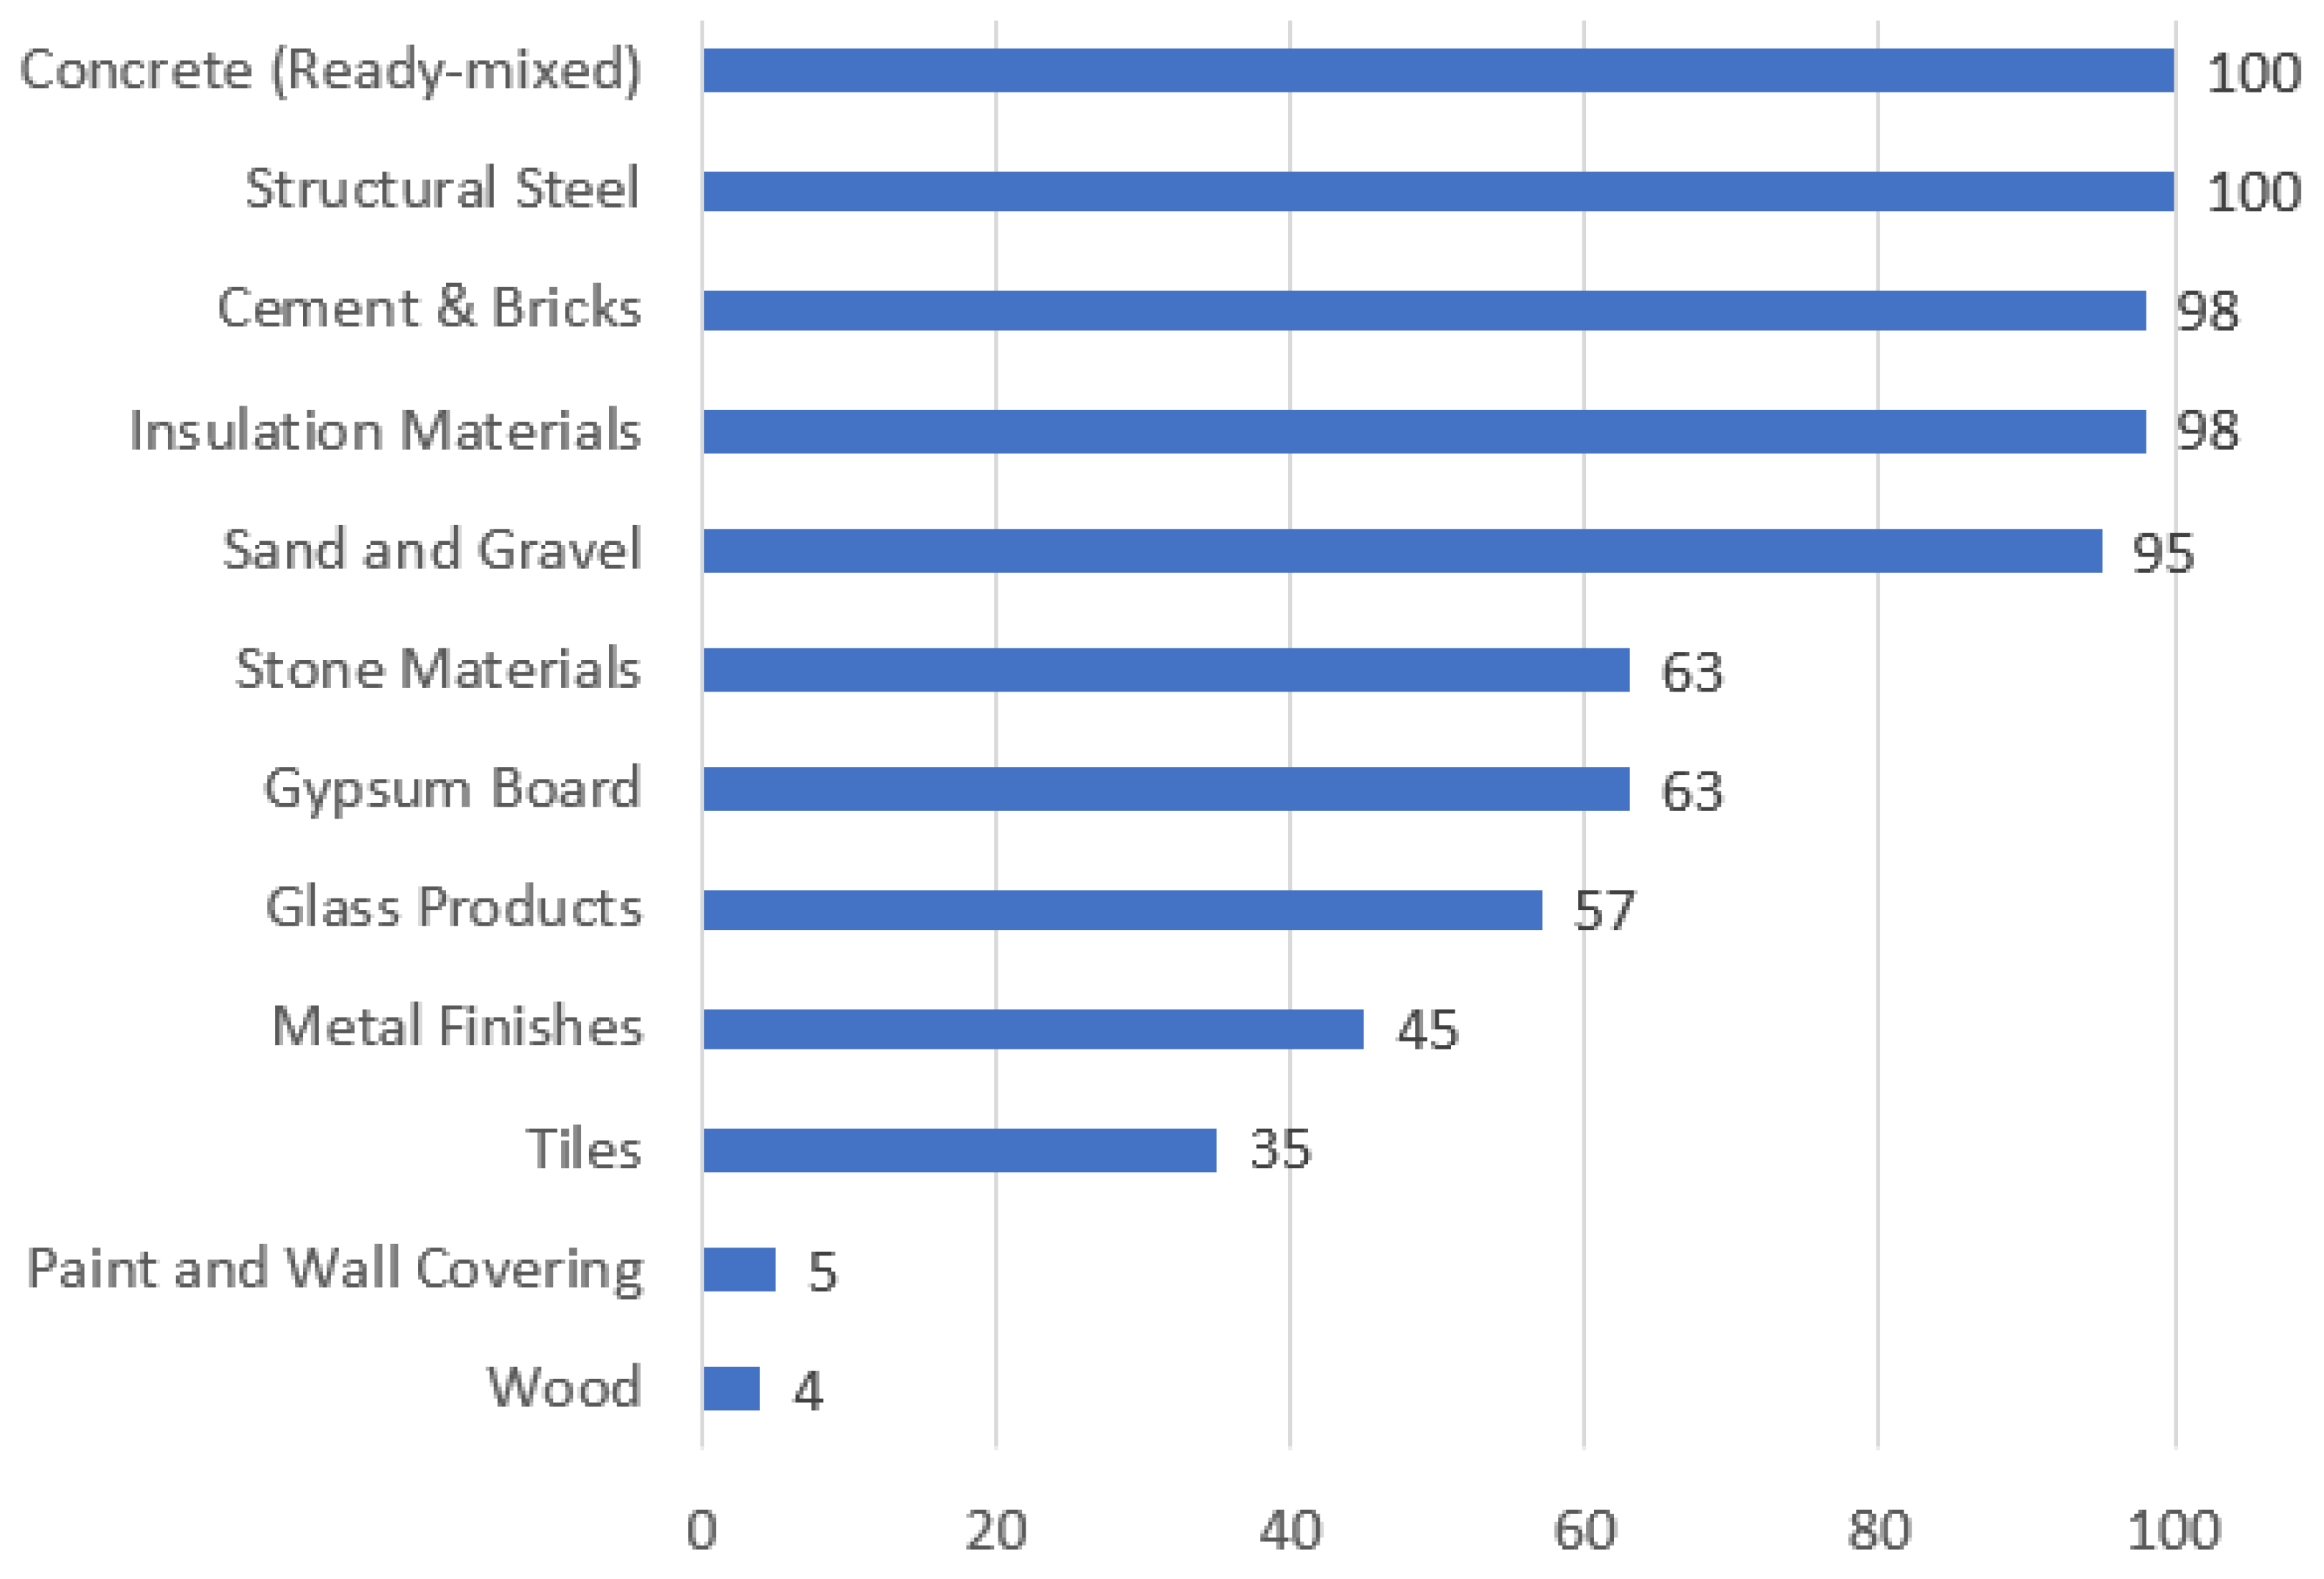
Figure 9.
Mass balance average Ratio by material category.
5. Discussion
The findings of this study underscore the practical challenges and potential opportunities associated with implementing Life Cycle Assessment (LCA) within South Korea’s building sector under the G-SEED certification framework. Although LCA adoption has grown significantly—from just 2% of certifications in 2016 to 24% by 2024—its effective application remains constrained by complex data requirements and methodological hurdles.
5.1. Practical Barriers to LCA Implementation
The analysis highlights major barriers to LCA adoption in Korean building projects. While a typical BoQ includes nearly 990 items, the average LCA report includes only 319 items, accounting for roughly 35% of the BoQ. This illustrates the resource-intensive and time-consuming nature of conducting a comprehensive 99% cumulative mass analysis.
The weak correlation between BoQ size and LCA material count (R² = 0.4673) suggests a lack of standardization in material selection, often relying on practitioner discretion rather than objective criteria—echoing findings from international literature [13,14]. This complexity, especially during early design phases when detailed take-offs and environmental datasets are unavailable, discourages broader adoption of LCA. Similar limitations have been observed in LEED and BREEAM systems, where early-stage tools lack guidance for practical material prioritization [27,28].
5.2. Dominance of Key Material Categories
The frequency analysis confirms a strong Pareto effect: a small number of materials accounts for the majority of environmental impacts. Concrete alone contributes 85.6% of total mass, followed by cement and bricks (5.5%), structural steel (4.6%), and aggregates (2.4%). Other materials—such as glass, insulation, and finishes—each contribute less than 1% by mass, although they may exhibit high environmental intensity per unit mass. These results are consistent with international studies on embodied carbon distributions [10,14].
5.3. Implication for G-SEED and Global Certification Frameworks
The current G-SEED requirement for a 99% cumulative mass analysis could be effectively replaced by assessing 12 predefined material categories. This simplification would significantly reduce data demands, supporting wider adoption of LCA in both certification workflows and early design phases.
This approach is aligned with international trends promoting streamlined LCA protocols, as advocated by recent European initiatives and ISO-based guidelines. For instance, EN 15978 permits scenario-based assessments when detailed data are unavailable, while LEED v5 emphasizes early-stage carbon considerations via predefined assemblies. By incorporating similar principles, G-SEED could improve comparability with global standards while maintaining methodological robustness.
5.4. Policy and Industry Recommendations
The analysis highlights the significant barriers to LCA adoption within the Korean building sector. A typical BoQ includes approximately 990 items, whereas an LCA report averages 319 items, reflecting an approximate
6. Conclusions
This study analyzed 100 LCA reports submitted under the G-SEED certification system to identify patterns in material contributions and develop a simplified classification framework to support LCA implementation. The results revealed that 12 material categories, dominated by concrete, structural steel, and cement, consistently represented over 99% of the total material mass.
By predefining these categories, the proposed framework reduces the complexity of cumulative mass analysis and facilitates broader adoption of LCA across the industry. Beyond improving methodological efficiency, this framework enables more targeted applications of low-carbon materials across both structural and non-structural components, including building envelopes and finishes.
Such targeted material strategies are essential for achieving national and global carbon neutrality goals, especially as embodied emissions increasingly dominate the life cycle impacts of high-performance buildings.
However, a key limitation remains: current LCA practices in Korea are largely confined to building structures, excluding civil engineering works and MEP (Mechanical, Electrical, and Plumbing) systems. Future efforts should focus on integrating these components into a comprehensive sector-wide assessment to realize full life cycle carbon reductions.
By combining empirical evidence with a practical classification model, this study contributes to the advancement of LCA as a strategic tool supporting policy development, certification system enhancement, and industry-wide adoption of sustainable, low-carbon materials.
Author Contributions
Conceptualization, S.S.; methodology, S.S.; validation, S.S.; investigation, K.T.; resources, K.T.; data curation, S.S.; writing—original draft preparation, S.S.; writing—review and editing, K.T.; visualization, S.S.; supervision, P.J.; project administration, C.C.; funding acquisition, C.C. All authors have read and agreed to the published version of the manuscript.
Funding
This work was supported by the Korea Institute of Energy Technology Evaluation and Planning (KETEP) grant funded by the Korea government (MOTIE) (No.RS-2021-KP002462).
Data Availability Statement
The original contribution presented in this study are included in the article. Further inquiries can be directed to the corresponding author.
Acknowledgments
We acknowledge the suggestions of two anonymous supporters who helped to improve this manuscript. The analysis and results described in this paper are part of the PhD research of Sungmo Seo at Chung-ang University and Korea institute of Civil Engineering and Building Technology, supervised by J. Park. And C. Chae. The authors would like to thank N. Kim for providing help with data support.
Conflicts of Interest
The authors declare no conflicts of interest.
Abbreviations
| LCA | Life Cycle Assessment |
| G-SEED | Green Standard for Energy and Environmental Design |
| GHG | Green House Gas |
| LEED | Leadership in Energy and Environmental Design |
| BREEAM | Building Research Establishment Environmental Assessment Method |
| DGNB | Deutsche Gesellschaft für Nachhaltiges Bauen |
| BoQ | Bill of Quantities |
| EPD | Environmental Product Declaration |
| LCI | Life Cycle Inventory |
Appendix A. Detail Information of 100 LCA Projects
| 9 | Structure type | Gross Floor Area | Number of Materials in Bills of Quantity | Number of Materials used in LCA Reporting | Reporting Ratio |
| R1 | RC | 3,881 | 1,958 | 444 | 22.68% |
| R2 | RC | 4,240 | 567 | 82 | 14.46% |
| R3 | RC | 7,919 | 1,129 | 424 | 37.56% |
| R4 | RC | 8,689 | 405 | 132 | 32.59% |
| R5 | RC | 11,793 | 464 | 158 | 34.05% |
| R6 | RC | 18,918 | 717 | 273 | 38.08% |
| R7 | RC | 35,128 | 601 | 426 | 70.88% |
| R8 | RC | 40,330 | 750 | 160 | 21.33% |
| R9 | RC | 42,725 | 821 | 438 | 53.35% |
| R10 | RC | 44,925 | 702 | 316 | 45.01% |
| R11 | RC | 48,073 | 985 | 453 | 45.99% |
| R12 | RC | 68,601 | 1,093 | 313 | 28.64% |
| R13 | RC | 97,490 | 6,259 | 2,473 | 39.51% |
| R14 | RC | 111,278 | 1,317 | 495 | 37.59% |
| R15 | RC | 180,254 | 5,984 | 602 | 10.06% |
| R16 | RC | 181,976 | 570 | 175 | 30.70% |
| R17 | RC | 292,294 | 1,093 | 306 | 28.00% |
| R18 | RC | 466,221 | 2,056 | 825 | 40.13% |
| R19 | RC | 70,872 | 2,582 | 762 | 29.51% |
| R20 | RC | 86,905 | 2,047 | 750 | 36.64% |
| Non-R1 | SRC | 2,218 | 110 | 38 | 34.55% |
| Non-R2 | RC | 2,307 | 180 | 86 | 47.78% |
| Non-R3 | SRC | 3,058 | 515 | 132 | 25.63% |
| Non-R4 | SRC | 3,666 | 697 | 255 | 36.59% |
| Non-R5 | RC | 5,196 | 609 | 207 | 33.99% |
| Non-R6 | RC | 5,296 | 434 | 116 | 26.73% |
| Non-R7 | RC | 6,039 | 711 | 224 | 31.50% |
| Non-R8 | SRC | 6,110 | 295 | 111 | 37.63% |
| Non-R9 | RC | 6,529 | 1,702 | 796 | 46.77% |
| Non-R10 | RC | 6,529 | 473 | 182 | 38.48% |
| Non-R11 | SRC | 6,691 | 747 | 290 | 38.82% |
| Non-R12 | SRC | 6,876 | 769 | 261 | 33.94% |
| Non-R13 | RC | 7,022 | 444 | 153 | 34.46% |
| Non-R14 | RC | 7,198 | 523 | 150 | 28.68% |
| Non-R15 | SRC | 7,225 | 751 | 232 | 30.89% |
| Non-R16 | RC | 7,450 | 399 | 104 | 26.07% |
| Non-R17 | SRC | 8,029 | 617 | 182 | 29.50% |
| Non-R18 | RC | 8,592 | 693 | 236 | 34.05% |
| Non-R19 | RC | 15,155 | 1,105 | 278 | 25.16% |
| Non-R20 | SRC | 15,258 | 981 | 448 | 45.67% |
| Non-R21 | RC | 17,621 | 572 | 199 | 34.79% |
| Non-R22 | RC | 19,680 | 328 | 95 | 28.96% |
| Non-R23 | RC | 20,099 | 522 | 89 | 17.05% |
| Non-R24 | SRC | 22,126 | 333 | 133 | 39.94% |
| Non-R25 | RC | 28,104 | 663 | 191 | 28.81% |
| Non-R26 | SRC | 32,635 | 897 | 350 | 39.02% |
| Non-R27 | SRC | 36,501 | 451 | 122 | 27.05% |
| Non-R28 | RC | 40,476 | 437 | 136 | 31.12% |
| Non-R29 | RC | 55,391 | 1,327 | 443 | 33.38% |
| Non-R30 | SRC | 55,887 | 817 | 241 | 29.50% |
| Non-R31 | RC | 56,633 | 638 | 134 | 21.00% |
| Non-R32 | RC | 57,559 | 3,171 | 1,009 | 31.82% |
| Non-R33 | RC | 59,402 | 326 | 121 | 37.12% |
| Non-R34 | RC | 70,628 | 896 | 168 | 18.75% |
| Non-R35 | SRC | 130,144 | 2,116 | 393 | 18.57% |
| Non-R36 | RC | 205,243 | 658 | 298 | 45.29% |
| Non-R37 | RC | 216,096 | 1,495 | 568 | 37.99% |
| Non-R38 | RC | 259,223 | 632 | 228 | 36.08% |
| Office1 | RC | 3,677 | 433 | 138 | 31.87% |
| Office2 | RC | 4,078 | 128 | 44 | 34.38% |
| Office3 | RC | 4,243 | 302 | 285 | 94.37% |
| Office4 | SRC | 4,449 | 878 | 345 | 39.29% |
| Office5 | RC | 4,993 | 489 | 118 | 24.13% |
| Office6 | RC | 5,601 | 514 | 209 | 40.66% |
| Office7 | RC | 5,757 | 897 | 363 | 40.47% |
| Office8 | RC | 8,904 | 423 | 162 | 38.30% |
| Office9 | RC | 9,467 | 986 | 572 | 58.01% |
| Office10 | RC | 10,103 | 487 | 120 | 24.64% |
| Office11 | RC | 11,466 | 623 | 247 | 39.65% |
| Office12 | RC | 13,019 | 849 | 408 | 48.06% |
| Office13 | RC | 15,328 | 682 | 250 | 36.66% |
| Office14 | RC | 17,226 | 759 | 198 | 26.09% |
| Office15 | RC | 17,881 | 374 | 111 | 29.68% |
| Office16 | RC | 18,601 | 779 | 222 | 28.50% |
| Office17 | RC | 18,945 | 580 | 164 | 28.28% |
| Office18 | RC | 19,171 | 626 | 103 | 16.45% |
| Office19 | RC | 21,554 | 1,285 | 341 | 26.54% |
| Office20 | RC | 21,736 | 1,043 | 456 | 43.72% |
| Office21 | RC | 25,653 | 941 | 377 | 40.06% |
| Office22 | RC | 25,694 | 1,091 | 469 | 42.99% |
| Office23 | RC | 25,950 | 457 | 221 | 48.36% |
| Office24 | SRC | 31,785 | 1,861 | 748 | 40.19% |
| Office25 | SRC | 33,420 | 1,242 | 433 | 34.86% |
| Office26 | RC | 38,361 | 880 | 305 | 34.66% |
| Office27 | SRC | 41,723 | 1,120 | 240 | 21.43% |
| Office28 | RC | 44,991 | 728 | 321 | 44.09% |
| Office29 | RC | 47,919 | 959 | 381 | 39.73% |
| Office30 | RC | 53,705 | 902 | 417 | 46.23% |
| Office31 | RC | 58,089 | 854 | 434 | 50.82% |
| Office32 | SRC | 197,057 | 2,145 | 345 | 16.08% |
| Office33 | SRC | 302,472 | 5,984 | 784 | 13.10% |
| School1 | RC | 8,941 | 537 | 259 | 48.23% |
| School2 | SRC | 9,657 | 577 | 165 | 28.60% |
| School3 | SRC | 17,261 | 406 | 114 | 28.08% |
| School4 | RC | 18,724 | 494 | 305 | 61.74% |
| School5 | RC | 30,380 | 715 | 190 | 26.57% |
| School6 | SRC | 61,464 | 387 | 161 | 41.60% |
| Hotel1 | RC | 10,890 | 519 | 248 | 47.78% |
| Hotel2 | RC | 14,740 | 791 | 296 | 37.42% |
| Retail | SRC | 125,563 | 1,114 | 464 | 41.65% |
| Average | - | 48,030 | 990 | 319 | 35.24% |
| *R: Residential building, Non-R: Non-residential building. | |||||
Appendix B. Detail Quantity of Major Construction Components
| Building Type | Number of Major Components | Quantity of Major Construction Components in LCA Building (ton) | |||||||||||
| Concrete | Structural Steel | Metal Finish | Cement & Brick | Wood | Glass | Insulation | Gypsum | Sand & Gravel | Stone Material | Tiles | Paint & Cover | ||
| R1 | 7 | 11,550.6 | 627.4 | - | 629.0 | - | - | 3.0 | 72.7 | 160.0 | 273.9 | - | - |
| R2 | 8 | 10,419.6 | 379.2 | - | 212.0 | - | 160.0 | 33.2 | 84.5 | 636.4 | 148.6 | - | - |
| R3 | 7 | 19,798.4 | 915.6 | - | 1,444.2 | - | 85.7 | 115.5 | - | 654.4 | 115.3 | - | - |
| R4 | 6 | 26,949.1 | 1,298.8 | - | 631.9 | - | - | 130.3 | - | 848.0 | 588.4 | - | - |
| R5 | 7 | 24,603.1 | 1,054.7 | - | 3,324.6 | - | - | 246.0 | 162.1 | 193.6 | 262.9 | - | - |
| R6 | 8 | 45,047.8 | 1,697.0 | - | 4,166.8 | - | - | 429.8 | 171.9 | 3,127.0 | 277.5 | 144.7 | - |
| R7 | 5 | 44,584.1 | 1,420.6 | - | 3,470.1 | - | - | 122.2 | - | 5,018.0 | - | - | - |
| R8 | 8 | 66,019.6 | 2,710.9 | - | 5,476.0 | - | 272.4 | 185.5 | 741.8 | 2,270.4 | - | 326.8 | - |
| R9 | 6 | 106,936.2 | 3,047.0 | - | 3,297.0 | - | - | 139.2 | 477.6 | 2,775.9 | - | - | - |
| R10 | 6 | 117,832.7 | 4,608.4 | - | 5,737.6 | - | - | 49.9 | 515.3 | 8,566.3 | - | - | - |
| R11 | 7 | 103,184.2 | 5,358.6 | - | 7,000.8 | - | 350.1 | 114.7 | 427.5 | 2,298.1 | - | - | - |
| R12 | 7 | 131,556.2 | 4,010.5 | - | 14,148.6 | - | - | 165.7 | 974.5 | 8,616.0 | 813.3 | - | - |
| R13 | 8 | 216,451.9 | 7,411.4 | - | 12,819.0 | 643.7 | 711.8 | 302.1 | - | 1,504.5 | 1,408.2 | - | - |
| R14 | 8 | 268,557.2 | 9,030.0 | - | 24,973.0 | 281.5 | 983.1 | 2,354.4 | - | 6,915.2 | - | 1,302.2 | - |
| R15 | 6 | 412,359.1 | 13,917.4 | - | 26,788.0 | - | - | 518.5 | 1,607.6 | 22,974.8 | - | - | - |
| R16 | 7 | 409,249.9 | 13,770.6 | - | 24,153.5 | - | 3,008.8 | 507.6 | - | 11,779.7 | 1,886.3 | - | - |
| R17 | 6 | 542,944.9 | 24,678.0 | - | 79,196.1 | - | 3,627.5 | 536.2 | - | 11,951.3 | - | - | - |
| R18 | 8 | 869,306.9 | 28,692.0 | - | 82,918.1 | - | - | 546.9 | 4,498.9 | 13,686.4 | 27,523.5 | 4,033.1 | - |
| R19 | 8 | 21,044.1 | 1,180.2 | - | 1,206.5 | - | 129.2 | 72.0 | 203.1 | 341.2 | - | 150.4 | - |
| R20 | 6 | 42,638.3 | 1,992.5 | - | 3,106.8 | - | - | 267.6 | - | 2,073.6 | 398.0 | 156.2 | - |
| Non-R1 | 5 | 7,054.2 | 447.4 | 43.7 | 456.5 | - | - | 34.4 | 47.5 | 244.2 | 38.0 | - | - |
| Non-R2 | 6 | 8,823.5 | 409.4 | 46.1 | 345.1 | - | 31.2 | 45.9 | 73.0 | 1,212.7 | 440.7 | - | - |
| Non-R3 | 8 | 11,168.8 | 495.6 | - | 717.4 | - | - | 31.8 | 56.9 | 800.8 | 214.0 | - | - |
| Non-R4 | 9 | 11,824.3 | 552.2 | - | 1,392.3 | - | 37.7 | 14.1 | - | 576.0 | 42.2 | 44.9 | - |
| Non-R5 | 7 | 12,472.9 | 743.9 | - | 410.5 | - | - | 41.2 | 75.6 | 468.8 | 263.6 | - | - |
| Non-R6 | 8 | 14,768.3 | 837.2 | - | 655.5 | - | - | 22.0 | - | 317.4 | - | - | - |
| Non-R7 | 7 | 35,229.1 | 2,785.2 | 408.9 | 464.0 | - | - | 195.2 | - | 278.9 | - | - | - |
| Non-R8 | 5 | 12,263.6 | 925.1 | 179.6 | 217.8 | - | - | 67.4 | 223.1 | 116.6 | - | - | - |
| Non-R9 | 6 | 18,593.2 | 2,309.8 | 216.6 | 1,184.5 | - | 303.1 | 36.0 | - | 920.0 | 261.4 | - | - |
| Non-R10 | 7 | 14,277.9 | 1,230.6 | 164.6 | 497.3 | - | 52.4 | 45.5 | 66.7 | 304.6 | 316.7 | - | - |
| Non-R11 | 8 | 16,353.2 | 911.3 | - | 1,161.1 | - | 68.9 | 26.3 | - | 869.7 | 438.3 | - | - |
| Non-R12 | 9 | 15,963.9 | 797.3 | 98.5 | 637.5 | - | 103.7 | 51.7 | 70.9 | 594.4 | 216.0 | - | - |
| Non-R13 | 7 | 27,460.6 | 1,325.9 | - | 2,196.3 | - | - | 61.4 | 94.7 | 915.2 | 128.7 | - | - |
| Non-R14 | 9 | 12,826.1 | 501.3 | 76.2 | 1,968.2 | - | - | 22.5 | - | 2,779.8 | 72.2 | - | - |
| Non-R15 | 7 | 15,262.2 | 931.9 | - | 1,184.0 | - | 60.2 | 72.3 | 44.9 | 203.6 | - | 49.2 | - |
| Non-R16 | 7 | 21,953.5 | 1,094.1 | - | 1,241.8 | - | - | 38.4 | - | 1,043.0 | 145.8 | - | - |
| Non-R17 | 8 | 30,581.4 | 1,803.7 | 222.9 | 1,554.5 | - | - | 27.2 | 205.4 | 1,451.0 | 466.9 | - | - |
| Non-R18 | 6 | 20,902.6 | 2,394.1 | 344.6 | 527.0 | - | 237.9 | 80.3 | 631.3 | 543.8 | - | 108.1 | - |
| Non-R19 | 8 | 54,409.8 | 2,724.1 | 268.0 | 1,853.5 | - | 134.3 | 94.6 | 300.5 | 1,596.8 | 907.3 | - | - |
| Non-R20 | 9 | 45,001.8 | 1,964.7 | - | 2,841.5 | - | 589.3 | 45.1 | - | 1,507.2 | - | 151.6 | - |
| Non-R21 | 9 | 43,828.0 | 1,992.0 | - | 828.4 | - | 267.6 | 42.0 | - | - | 189.6 | - | - |
| Non-R22 | 7 | 47,842.3 | 3,489.4 | 727.3 | 1,230.2 | - | - | 51.4 | 229.7 | 2,149.4 | 644.6 | 226.9 | - |
| Non-R23 | 6 | 48,619.7 | 2,203.3 | 154.1 | 2,692.2 | - | 652.8 | 85.9 | 177.3 | 2,052.8 | - | - | - |
| Non-R24 | 9 | 35,431.5 | 10,630.2 | 9,690.3 | - | - | - | 180.3 | 210.4 | - | - | - | - |
| Non-R25 | 8 | 56,449.0 | 2,938.1 | - | 16,758.5 | - | 422.8 | 33.2 | 604.3 | 1,176.9 | - | - | - |
| Non-R26 | 5 | 135,944.0 | 5,755.1 | - | 1,553.2 | - | 774.4 | 76.2 | - | - | - | - | - |
| Non-R27 | 7 | 107,169.5 | 6,978.1 | 627.7 | 5,702.3 | - | 1,191.4 | 131.6 | 1,131.0 | - | - | 645.3 | - |
| Non-R28 | 5 | 103,074.5 | 7,067.0 | 584.7 | 3,274.0 | - | 593.1 | 216.5 | 1,640.9 | 2,714.2 | - | 2,712.3 | - |
| Non-R29 | 8 | 132,595.0 | 5,895.5 | - | 3,290.1 | - | 939.9 | 361.3 | - | 1,705.6 | 1,106.6 | - | - |
| Non-R30 | 9 | 108,638.2 | 5,625.1 | 704.6 | 6,960.6 | - | 523.1 | 349.2 | 1,286.7 | 1,460.6 | 1,287.0 | - | - |
| Non-R31 | 7 | 106,763.7 | 4,619.6 | - | 4,035.6 | - | 461.2 | 123.6 | 1,115.7 | 1,064.0 | - | - | - |
| Non-R32 | 9 | 113,287.6 | 5,595.1 | 485.5 | 4,547.9 | - | 998.3 | 192.6 | 946.3 | 5,569.8 | - | - | - |
| Non-R33 | 7 | 732,707.5 | 27,328.7 | 7,758.8 | 6,647.4 | - | 150.5 | 321.2 | 516.1 | 3,284.0 | 273.7 | 92.8 | 220.4 |
| Non-R34 | 8 | 274,087.3 | 11,228.3 | 2,576.6 | 21,412.3 | - | 2,783.1 | 198.0 | - | 11,253.6 | 4,311.9 | - | - |
| Non-R35 | 11 | 362,299.6 | 16,355.9 | 2,164.4 | 26,466.6 | - | 3,504.6 | 396.4 | 2,649.8 | - | 2,276.1 | - | - |
| Non-R36 | 8 | 430,010.4 | 14,272.2 | - | 22,665.4 | - | 2,496.1 | 661.7 | 1,557.1 | 10,345.6 | 3,770.5 | - | - |
| Non-R37 | 8 | 174,096.0 | 4,757.5 | - | 16,766.6 | - | - | 458.2 | 1,071.3 | 1,092.5 | 1,492.2 | 577.7 | - |
| Non-R38 | 8 | 285,569.5 | 17,882.7 | - | 9,675.2 | - | - | 464.7 | - | 9,514.2 | - | 684.2 | - |
| Office1 | 7 | 10,591.5 | 513.2 | - | 151.3 | - | 33.3 | 21.8 | - | 313.6 | 127.1 | - | - |
| Office2 | 6 | 9,427.7 | 638.7 | 177.3 | 1,043.1 | - | 44.6 | 46.5 | 74.9 | 609.6 | 81.9 | - | - |
| Office3 | 7 | 11,115.8 | 587.7 | 23.9 | 752.4 | - | 77.4 | 30.2 | 7.6 | 1,446.0 | 260.3 | 10.8 | 3.7 |
| Office4 | 9 | 14,989.1 | 756.3 | - | 1,394.2 | - | 108.2 | 20.6 | 59.1 | 523.2 | 838.1 | 102.5 | - |
| Office5 | 11 | 13,615.0 | 622.6 | 100.3 | 417.4 | - | - | 52.1 | 59.4 | 435.2 | 281.0 | - | - |
| Office6 | 9 | 20,511.5 | 1,213.9 | - | 538.0 | - | - | 10.0 | 115.6 | 829.3 | 474.3 | - | - |
| Office7 | 8 | 17,355.8 | 902.4 | 305.2 | 153.3 | - | 92.7 | 122.7 | 275.3 | 306.9 | 182.2 | - | - |
| Office8 | 7 | 22,065.6 | 1,125.8 | 79.6 | 803.5 | - | 100.2 | 24.9 | 77.3 | 881.6 | 244.0 | - | - |
| Office9 | 9 | 25,601.3 | 1,288.3 | - | 1,998.9 | - | 103.0 | 62.1 | - | 1,180.4 | 258.6 | - | - |
| Office10 | 9 | 24,872.2 | 1,558.9 | - | 2,480.0 | - | - | 78.1 | 138.9 | 1,305.6 | - | 143.6 | - |
| Office11 | 7 | 25,893.4 | 1,503.9 | - | 3,419.7 | - | 121.8 | 63.3 | 205.1 | 1,260.8 | 254.9 | - | - |
| Office12 | 7 | 31,783.2 | 1,638.8 | 178.3 | 1,537.2 | - | 283.7 | 55.8 | - | 941.0 | - | 164.9 | - |
| Office13 | 8 | 31,203.0 | 1,905.3 | - | 2,669.8 | - | - | 31.1 | - | 1,481.3 | 463.7 | 180.7 | - |
| Office14 | 8 | 39,456.0 | 2,274.8 | 305.0 | 2,390.9 | - | 304.7 | 97.9 | 242.0 | 1,759.8 | 274.5 | 206.6 | - |
| Office15 | 7 | 39,139.1 | 2,154.5 | - | 1,689.7 | - | 197.5 | 47.7 | - | 1,022.4 | 325.5 | 151.2 | - |
| Office16 | 10 | 39,869.2 | 1,843.6 | - | 1,489.1 | - | - | 9.0 | 163.7 | 1,252.3 | 256.3 | - | - |
| Office17 | 8 | 50,418.8 | 2,157.1 | - | 3,707.5 | - | - | 155.7 | 211.8 | 1,230.4 | 216.1 | - | - |
| Office18 | 7 | 52,069.7 | 3,227.6 | 343.0 | 2,908.1 | - | 136.5 | 107.1 | 1,185.4 | 522.6 | - | 136.5 | - |
| Office19 | 7 | 42,688.0 | 2,414.1 | - | 1,879.4 | - | 187.4 | 38.3 | - | 1,545.3 | 346.9 | - | - |
| Office20 | 9 | 34,138.9 | 1,906.1 | 1,260.9 | 3,190.8 | - | 158.0 | 78.5 | 377.7 | 184.1 | - | 170.1 | - |
| Office21 | 7 | 50,075.6 | 2,242.6 | 101.5 | 2,121.0 | 25.7 | 310.5 | 140.6 | 119.2 | 3,316.2 | 105.8 | 3.4 | 13.3 |
| Office22 | 9 | 91,913.9 | 9,807.3 | 1,486.8 | 3,376.7 | - | - | 128.9 | 391.0 | 1,901.2 | 827.3 | - | - |
| Office23 | 12 | 123,315.9 | 34,110.4 | 509.3 | - | - | 799.8 | 191.9 | 1,061.0 | 759.0 | - | - | - |
| Office24 | 8 | 82,631.6 | 5,514.8 | 568.4 | 1,736.8 | - | 979.2 | 162.6 | 857.7 | 2,063.4 | - | 276.2 | - |
| Office25 | 7 | 60,687.6 | 6,413.7 | 422.0 | 2,099.5 | - | 975.9 | - | 483.9 | 1,500.0 | 434.0 | 81.5 | 18.0 |
| Office26 | 9 | 71,364.4 | 3,984.7 | 1,160.8 | 3,642.5 | - | - | 102.6 | 1,290.2 | 2,017.6 | - | 337.7 | - |
| Office27 | 10 | 74,342.9 | 6,220.0 | 321.8 | 1,132.5 | - | 226.1 | - | - | 758.4 | - | 218.0 | - |
| Office28 | 8 | 71,319.7 | 4,180.0 | 495.9 | 12,801.0 | - | 334.0 | 213.6 | - | 336.1 | - | 272.2 | - |
| Office29 | 7 | 100,580.6 | 3,794.2 | 386.7 | 17,226.8 | - | 444.3 | 291.9 | - | 469.6 | 411.1 | 474.6 | - |
| Office30 | 8 | 260,850.6 | 18,801.1 | 2,625.8 | 6,393.8 | - | - | 403.5 | 2,344.2 | 5,796.0 | 1,878.0 | - | - |
| Office31 | 9 | 451,917.6 | 48,016.3 | 6,475.1 | 37,597.1 | - | - | 774.3 | 3,994.6 | 13,536.3 | 3,892.2 | - | - |
| Office32 | 8 | 4,961.3 | 289.3 | - | 354.1 | - | - | 0.6 | - | 266.5 | - | - | - |
| Office33 | 8 | 4,491.9 | 205.9 | 15.5 | 225.4 | - | - | 20.4 | - | 122.7 | - | - | - |
| School1 | 8 | 15,010.6 | 794.4 | - | 1,363.3 | 16.7 | 62.7 | 35.7 | - | 430.7 | 482.0 | - | - |
| School2 | 6 | 117,108.4 | 5,445.8 | 396.2 | 4,676.4 | - | - | 200.4 | - | 2,353.6 | - | - | - |
| School3 | 6 | 35,410.8 | 1,758.4 | - | 7,088.5 | - | - | 61.1 | - | 2,670.4 | 229.4 | - | - |
| School4 | 7 | 30,123.1 | 1,490.8 | - | 1,457.5 | - | - | 168.1 | 618.6 | 2,774.4 | 139.0 | - | - |
| School5 | 11 | 18,092.0 | 1,078.7 | 77.7 | 236.5 | - | 44.0 | 23.7 | 19.9 | 1,063.3 | 347.2 | 12.4 | 19.4 |
| School6 | 8 | 143,970.8 | 11,197.3 | - | 4,451.6 | - | 658.2 | 209.9 | - | 7,821.4 | 607.6 | 531.5 | - |
| Retail | 8 | 246,470.6 | 19,598.9 | 2,373.2 | 5,098.0 | - | - | 354.8 | 2,548.4 | 30,070.3 | - | 894.3 | - |
| Hotel1 | 8 | 9,671.5 | 482.6 | - | 352.9 | - | - | 23.8 | 24.7 | 395.2 | 155.9 | - | - |
| Hotel2 | 7 | 8,803.2 | 487.0 | - | 597.7 | - | - | 5.2 | - | 743.7 | 46.8 | - | - |
| Average | 8 | 98,265.6 | 5,237.5 | 477.3 | 6,293.6 | 9.7 | 334.9 | 169.0 | 419.1 | 2,767.2 | 674.4 | 157.8 | 2.7 |
References
- IEA & UNEP. (2025). Not just another brick in the wall: The solutions exist-Scaling them will build on progress and cut emissions fast. Global Status Report for Building and Construction 2024/2025: https://globalabc.org. https://wedocs.unep.org/20.500.11822/47214, (accessed on 28.07.2025.).
- Röck, M.; Saade, M.R.M.; Balouktsi, M.; Rasmussen, F.N.; Birgisdottir, H.; Frischknecht, R.; Habert, G.; Lützkendorf, T.; Passer, A. Embodied GHG emissions of buildings – The hidden challenge for effective climate change mitigation. Appl. Energy 2019, 258, 114107. [CrossRef]
- Moncaster, A.; Symons, K. A method and tool for ‘cradle to grave’ embodied carbon and energy impacts of UK buildings in compliance with the new TC350 standards. Energy Build. 2013, 66, 514–523. [CrossRef]
- Guggemos, A.A.; Horvath, A. Comparison of Environmental Effects of Steel- and Concrete-Framed Buildings. J. Infrastruct. Syst. 2005, 11, 93–101. [CrossRef]
- Comparison of the certification systems for buildings DGNB, LEED and BREEAM. ICDLI (International Committee of the Decorative Laminates Industry) 2019. www.icdli.com (assessed on 28.07.2025.).
- Barjot, Z.; Malmqvist, T. Limit values in LCA-based regulations for buildings – System boundaries and implications on practice. Build. Environ. 2024, 259. [CrossRef]
- Cabeza, L.F.; Rincón, L.; Vilariño, V.; Pérez, G.; Castell, A. Life cycle assessment (LCA) and life cycle energy analysis (LCEA) of buildings and the building sector: A review. Renew. Sustain. Energy Rev. 2014, 29, 394–416. [CrossRef]
- Dixit, M.K. Life cycle embodied energy analysis of residential buildings: A review of literature to investigate embodied energy parameters. Renew. Sustain. Energy Rev. 2017, 79, 390–413. [CrossRef]
- Obrecht, T.P.; Kunič, R.; Jordan, S.; Legat, A.; Roles of the reference service life (RSL) of buildings and the RSL of building components in the environmental impacts of buildings. SBE19 Graz 2019, 323, 012146. [CrossRef]
- Kim, T.; Lee, S.; Chae, C.U.; Jang, H.; Lee, K. Development of the CO2 Emission Evaluation Tool for the Life Cycle Assessment of Concrete. Sustainability 2017, 9, 2116. [CrossRef]
- Asdrubali, F.; Baldassarri, C.; Fthenakis, V. Life cycle analysis in the construction sector: Guiding the optimization of conventional Italian buildings. Energy Build. 2013, 64, 73–89. [CrossRef]
- Bribián, I.Z.; Capilla, A.V.; Usón, A.A. Life cycle assessment of building materials: Comparative analysis of energy and environmental impacts and evaluation of the eco-efficiency improvement potential. Build. Environ. 2011, 46, 1133–1140. [CrossRef]
- Wang, S.; Tae, S. Assessment of Carbon Neutrality Performance of Buildings Using EPD-Certified Korean Construction Materials. Appl. Sci. 2025, 15, 6533. [CrossRef]
- Kim, H.; Jang, H.; Tae, S.; Kim, H.; Jo, K. Life-Cycle Assessment of Apartment Buildings Based on Standard Quantities of Building Materials Using Probabilistic Analysis Technique. Materials 2022, 15, 4103. [CrossRef]
- Akbarnezhad, A.; Xiao, J. Estimation and Minimization of Embodied Carbon of Buildings: A Review. Buildings 2017, 7, 5. [CrossRef]
- Passer, A.; Kreiner, H.; Maydl, P. Assessment of the environmental performance of buildings: A critical evaluation of the influence of technical building equipment on residential buildings. Int. J. Life Cycle Assess. 2012, 17, 1116–1130. [CrossRef]
- Buyle, M.; Braet, J.; Audenaert, A. Life cycle assessment in the construction sector: A review. Renew. Sustain. Energy Rev. 2013, 26, 379–388. [CrossRef]
- Lasvaux, S.; Schiopu, N.; Habert, G.; Chevalier, J.; Peuportier, B. Influence of simplification of life cycle inventories on the accuracy of impact assessment: application to construction products. J. Clean. Prod. 2014, 79, 142–151. [CrossRef]
- Barbhuiya, S.; Das, B.B. Life Cycle Assessment of construction materials: Methodologies, applications and future directions for sustainable decision-making. Case Stud. Constr. Mater. 2023, 19. [CrossRef]
- Collinge, W.; Thiel, C.; Campion, N.; Al-Ghamdi, S.; Woloschin, C.; Soratana, K.; Landis, A.; Bilec, M. Integrating Life Cycle Assessment with Green Building and Product Rating Systems: North American Perspective. Procedia Eng. 2015, 118, 662–669. [CrossRef]
- Ferreira, A.; Pinheiro, M.D.; de Brito, J.; Mateus, R. A critical analysis of LEED, BREEAM and DGNB as sustainability assessment methods for retail buildings. J. Build. Eng. 2023, 66. [CrossRef]
- Pomponi, F.; Moncaster, A. Embodied carbon mitigation and reduction in the built environment – What does the evidence say?. J. Environ. Manag. 2016, 181, 687–700. [CrossRef]
- Onososen, A.; Musonda, I. Barriers to BIM-Based Life Cycle Sustainability Assessment for Buildings: An Interpretive Structural Modelling Approach. Buildings 2022, 12, 324. [CrossRef]
- Ebeh, C. O.; Okwandu, A. C.; Abdulwaheed, S. A.; Iwanyanwu, O. Life Cycle Assessment (LCA) in Construction: Methods, Applications, and Outcomes. International Journal of Engineering Research and Development 2024, 20(8), 350-358. https://ijerd.com/paper/vol20-issue8/2008350358.pdf,(accessed on 28.07.2025.).
- Parece, S.; Resende, R.; Rato, V. Stakeholder Perspectives on BIM–LCA Integration in Building Design: Adoption, Challenges, and Future Directions. Build. Environ. 2025. [CrossRef]
- Dodoo, A.; Gustavsson, L.; Sathre, R. Lifecycle carbon implications of conventional and low-energy multi-storey timber building systems. Energy Build. 2014, 82, 194–210. [CrossRef]
- Kumar, D.; Maurya, K.K.; Mandal, S.K.; Mir, B.A.; Nurdiawati, A.; Al-Ghamdi, S.G. Life Cycle Assessment in the Early Design Phase of Buildings: Strategies, Tools, and Future Directions. Buildings 2025, 15, 1612. [CrossRef]
- Anyanya, D.; Paulillo, A.; Fiorini, S.; Lettieri, P. Evaluating sustainable building assessment systems: a comparative analysis of GBRS and WBLCA. Front. Built Environ. 2025, 11. [CrossRef]
Figure 5.
LCA reporting material ratio from BoQ.
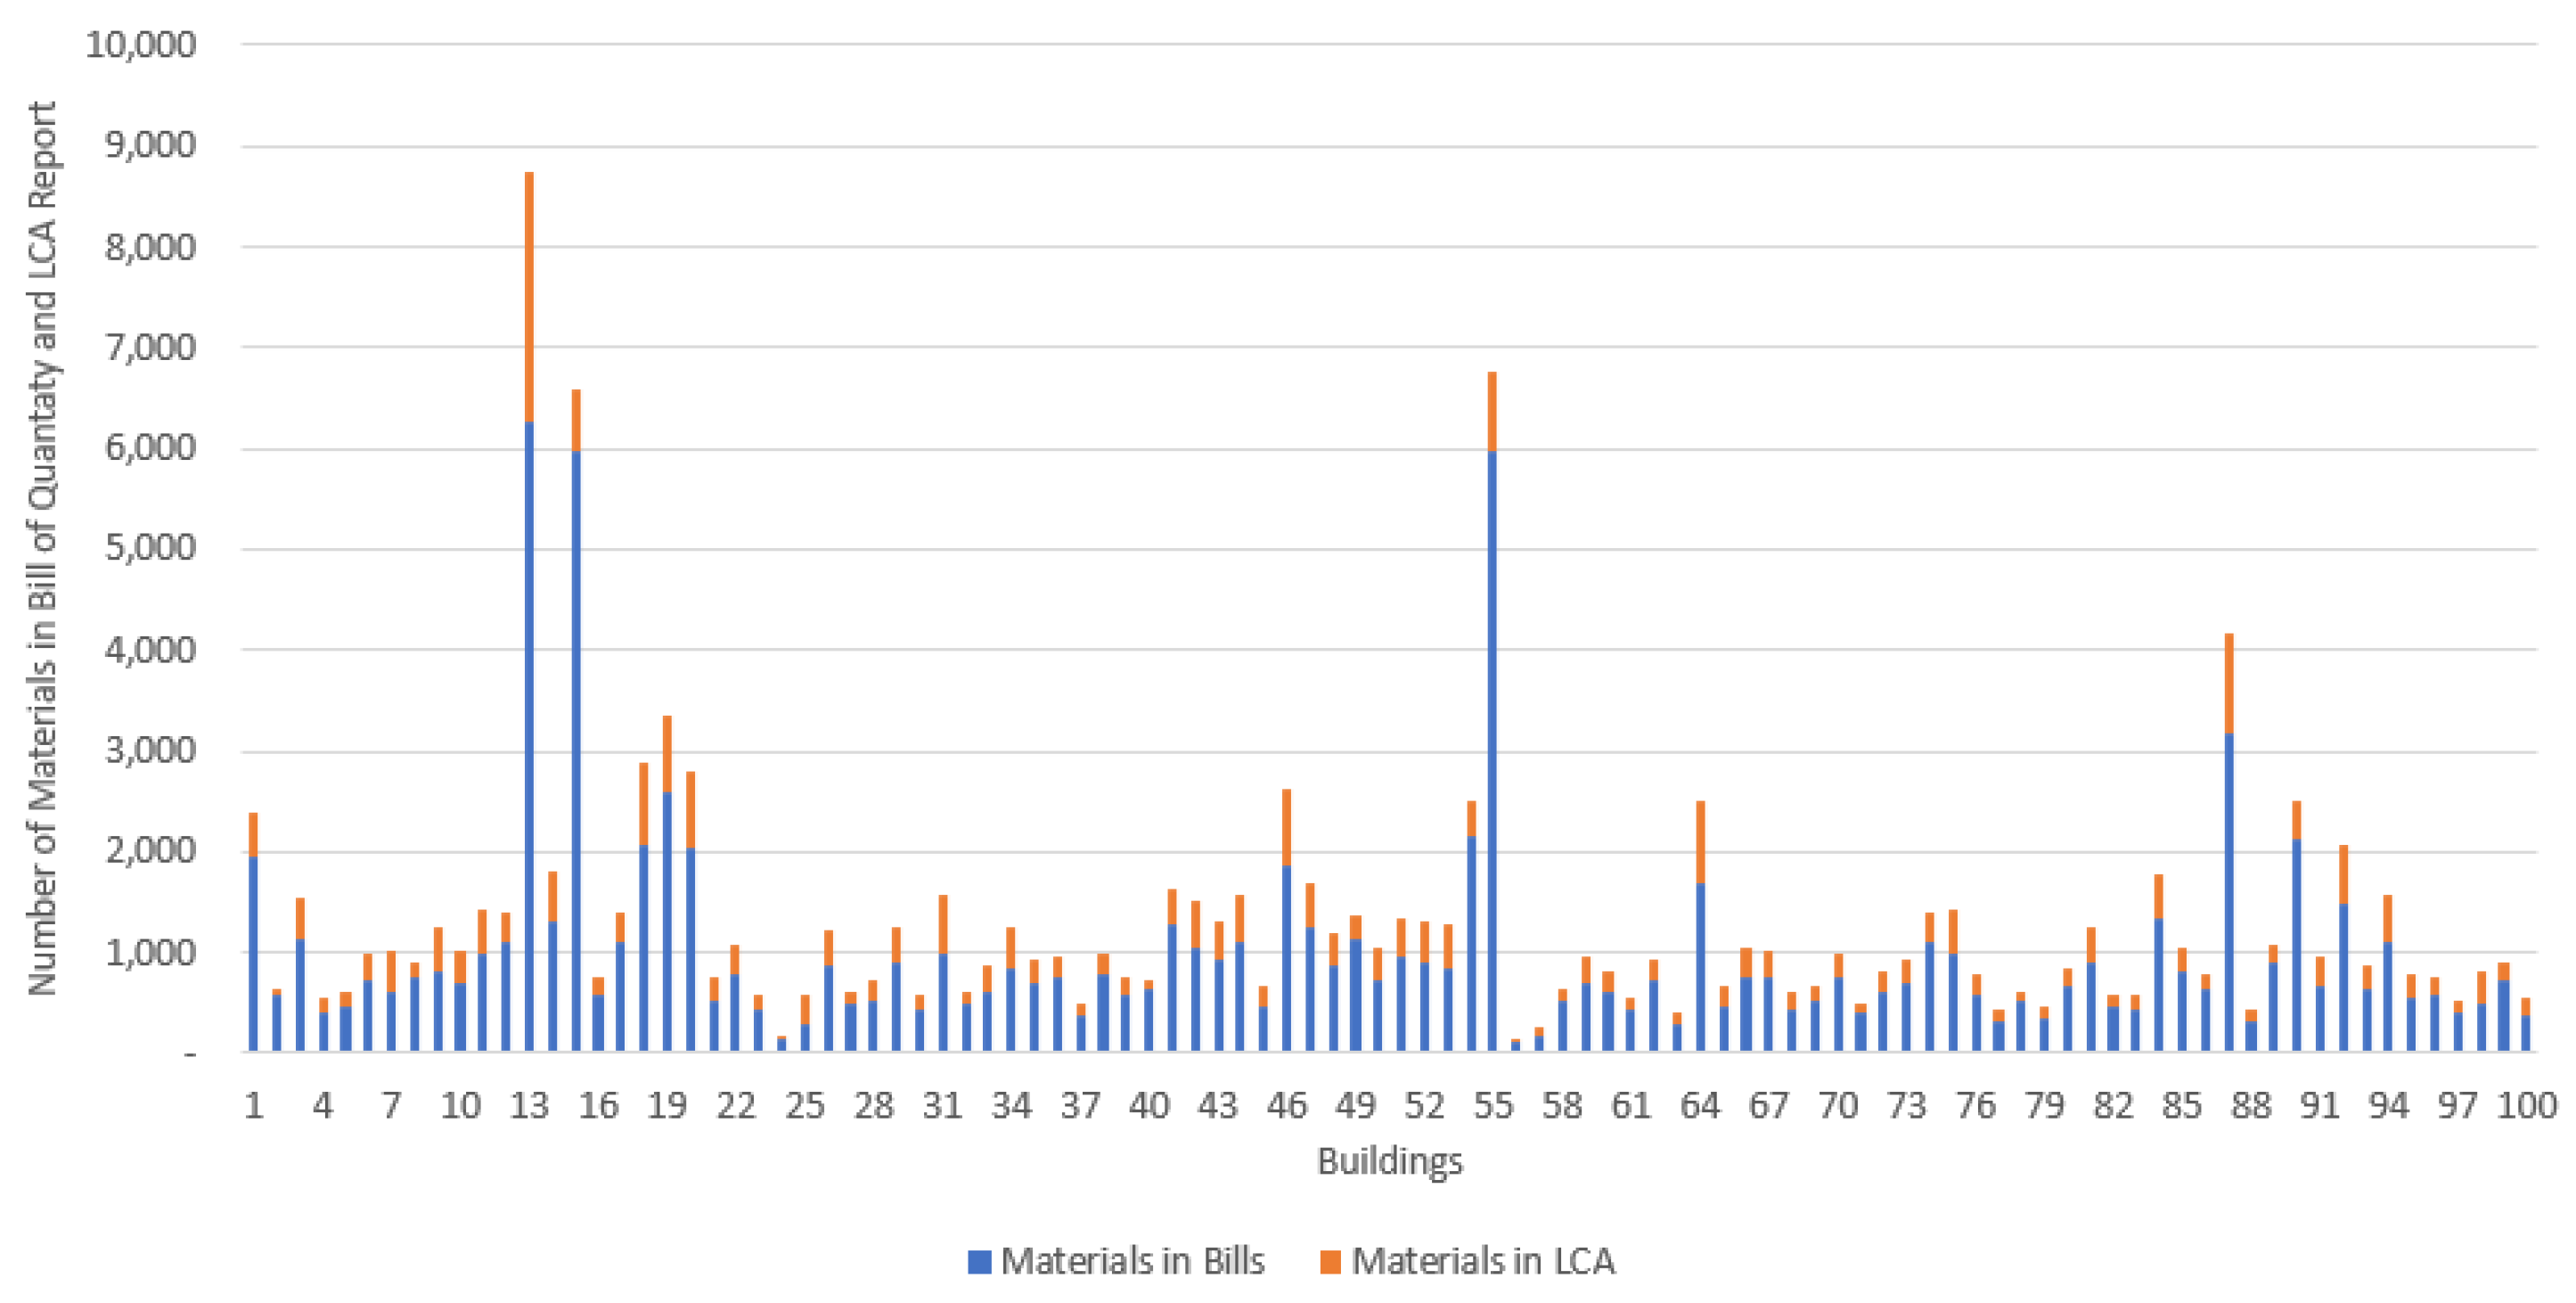
Figure 6.
Correlation between BoQ and LCA materials.
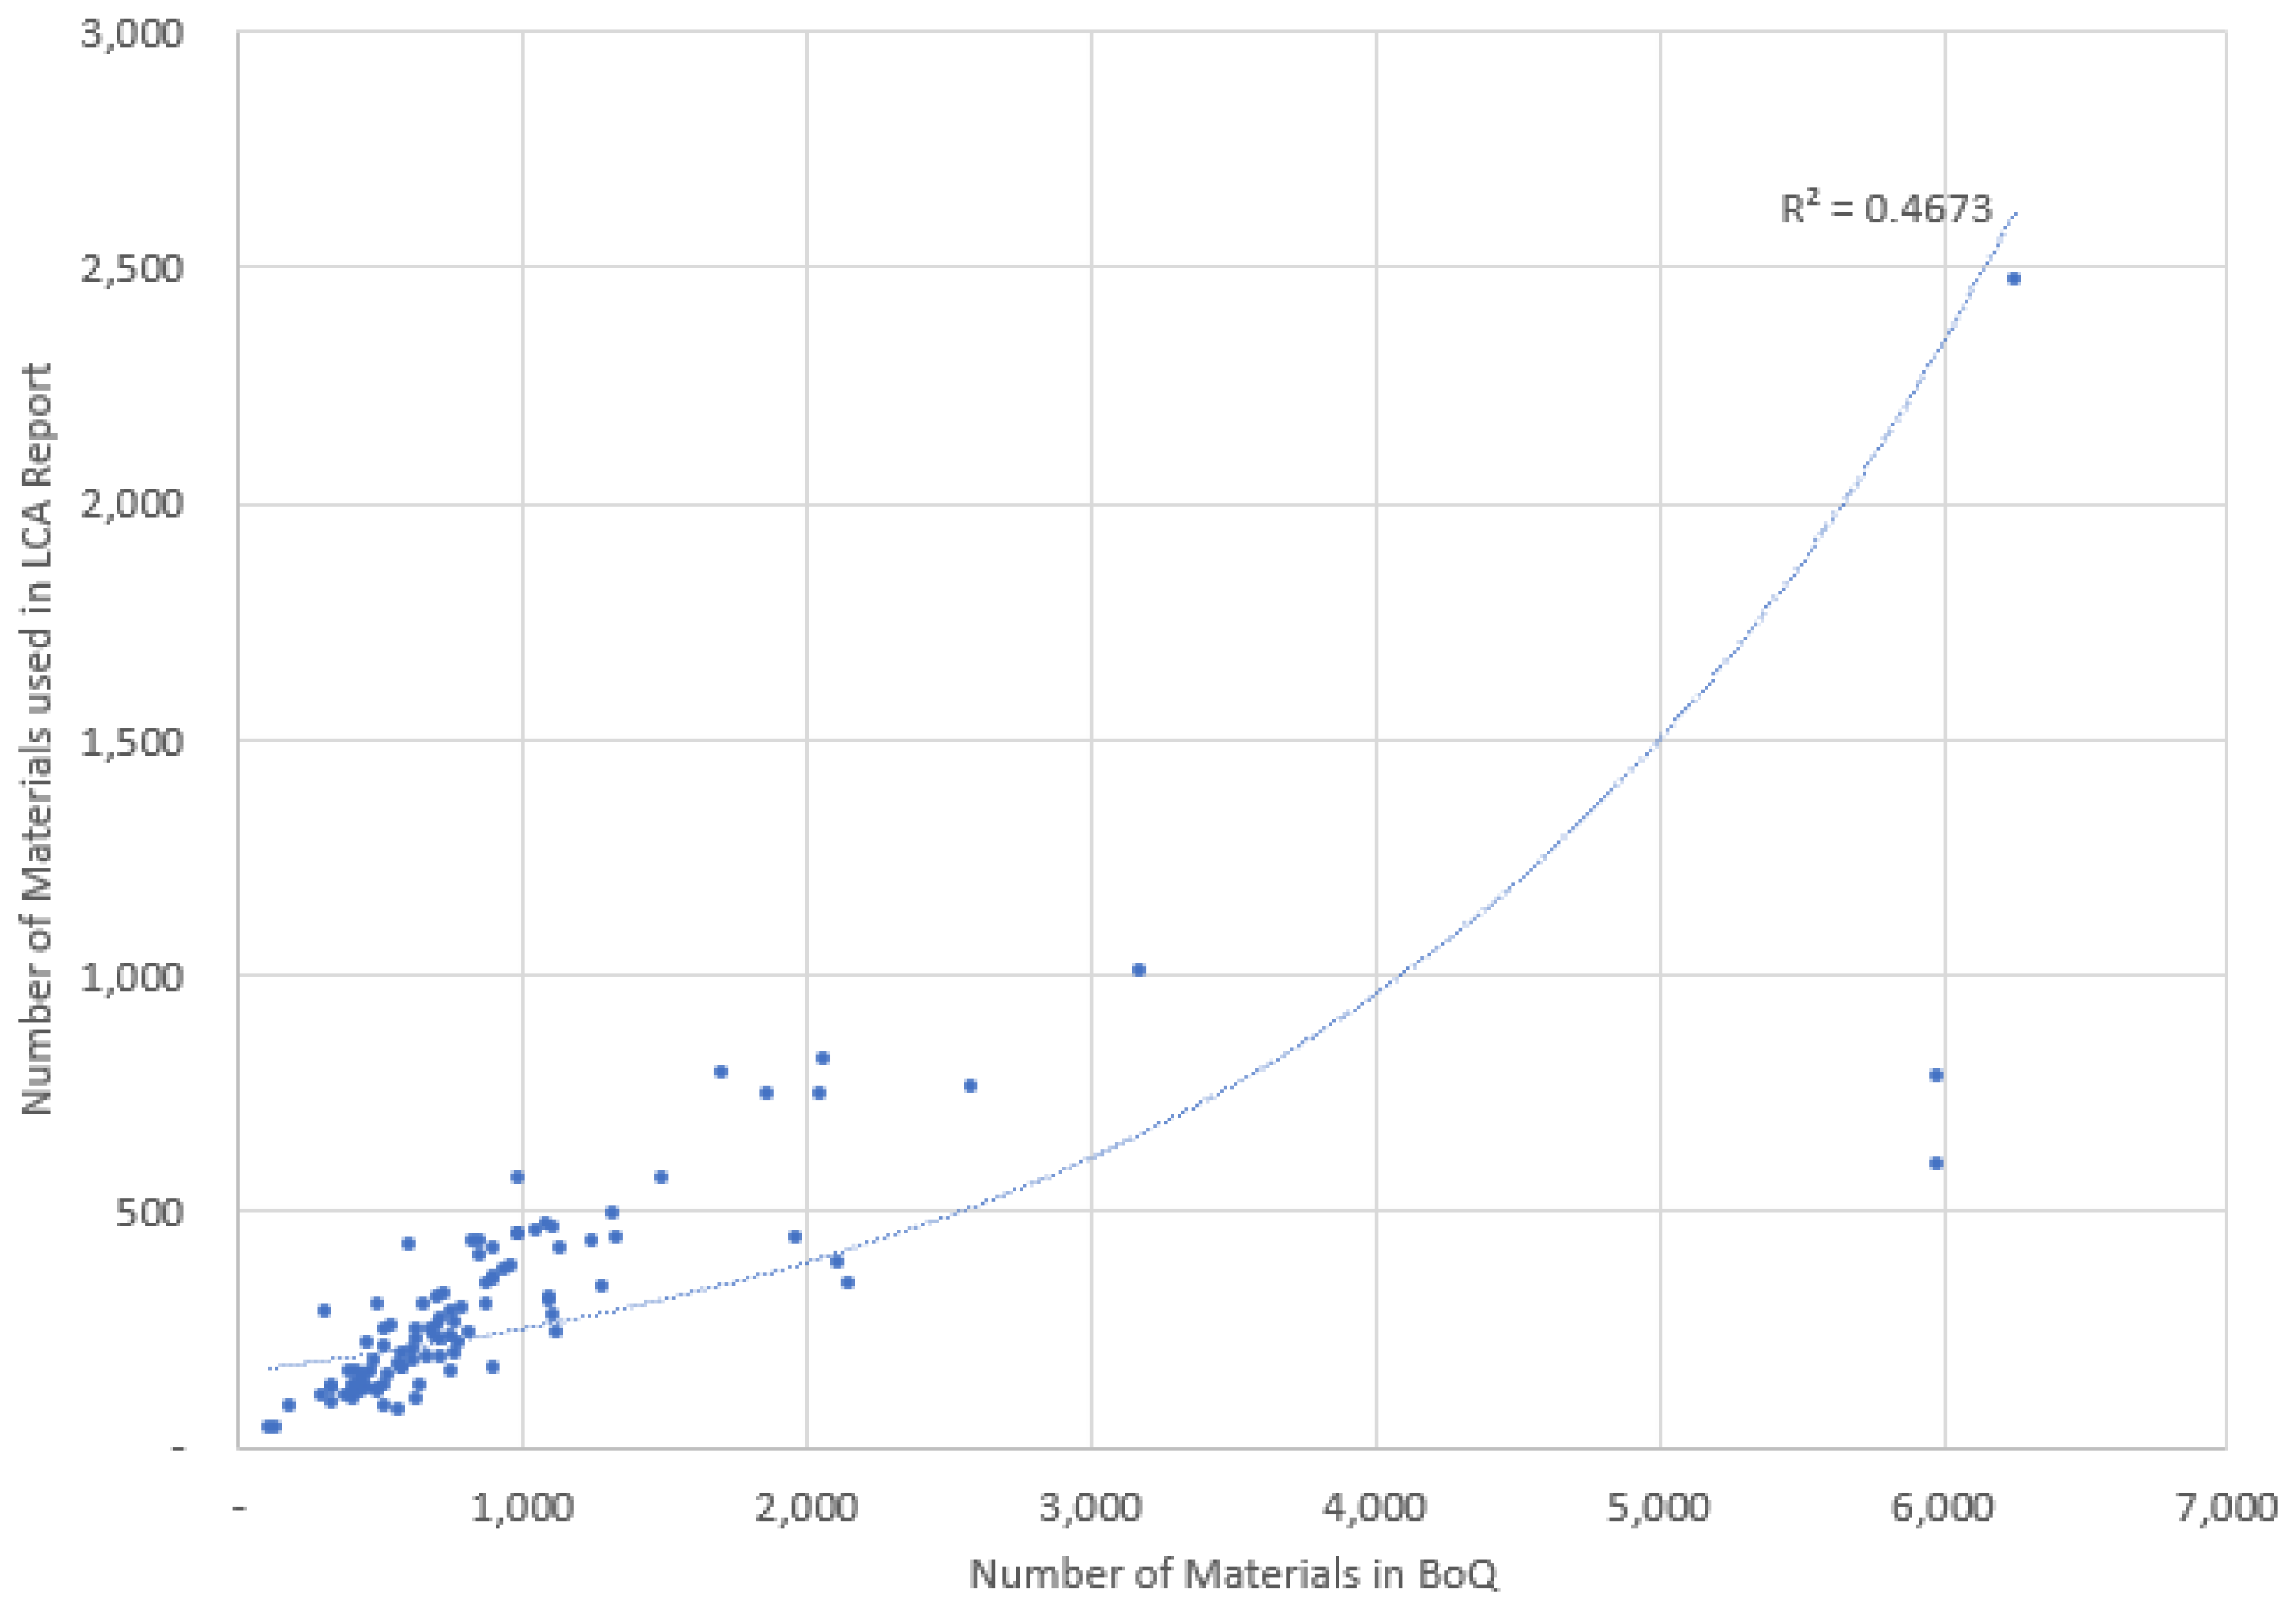
Figure 7.
Proposed workflow diagram.
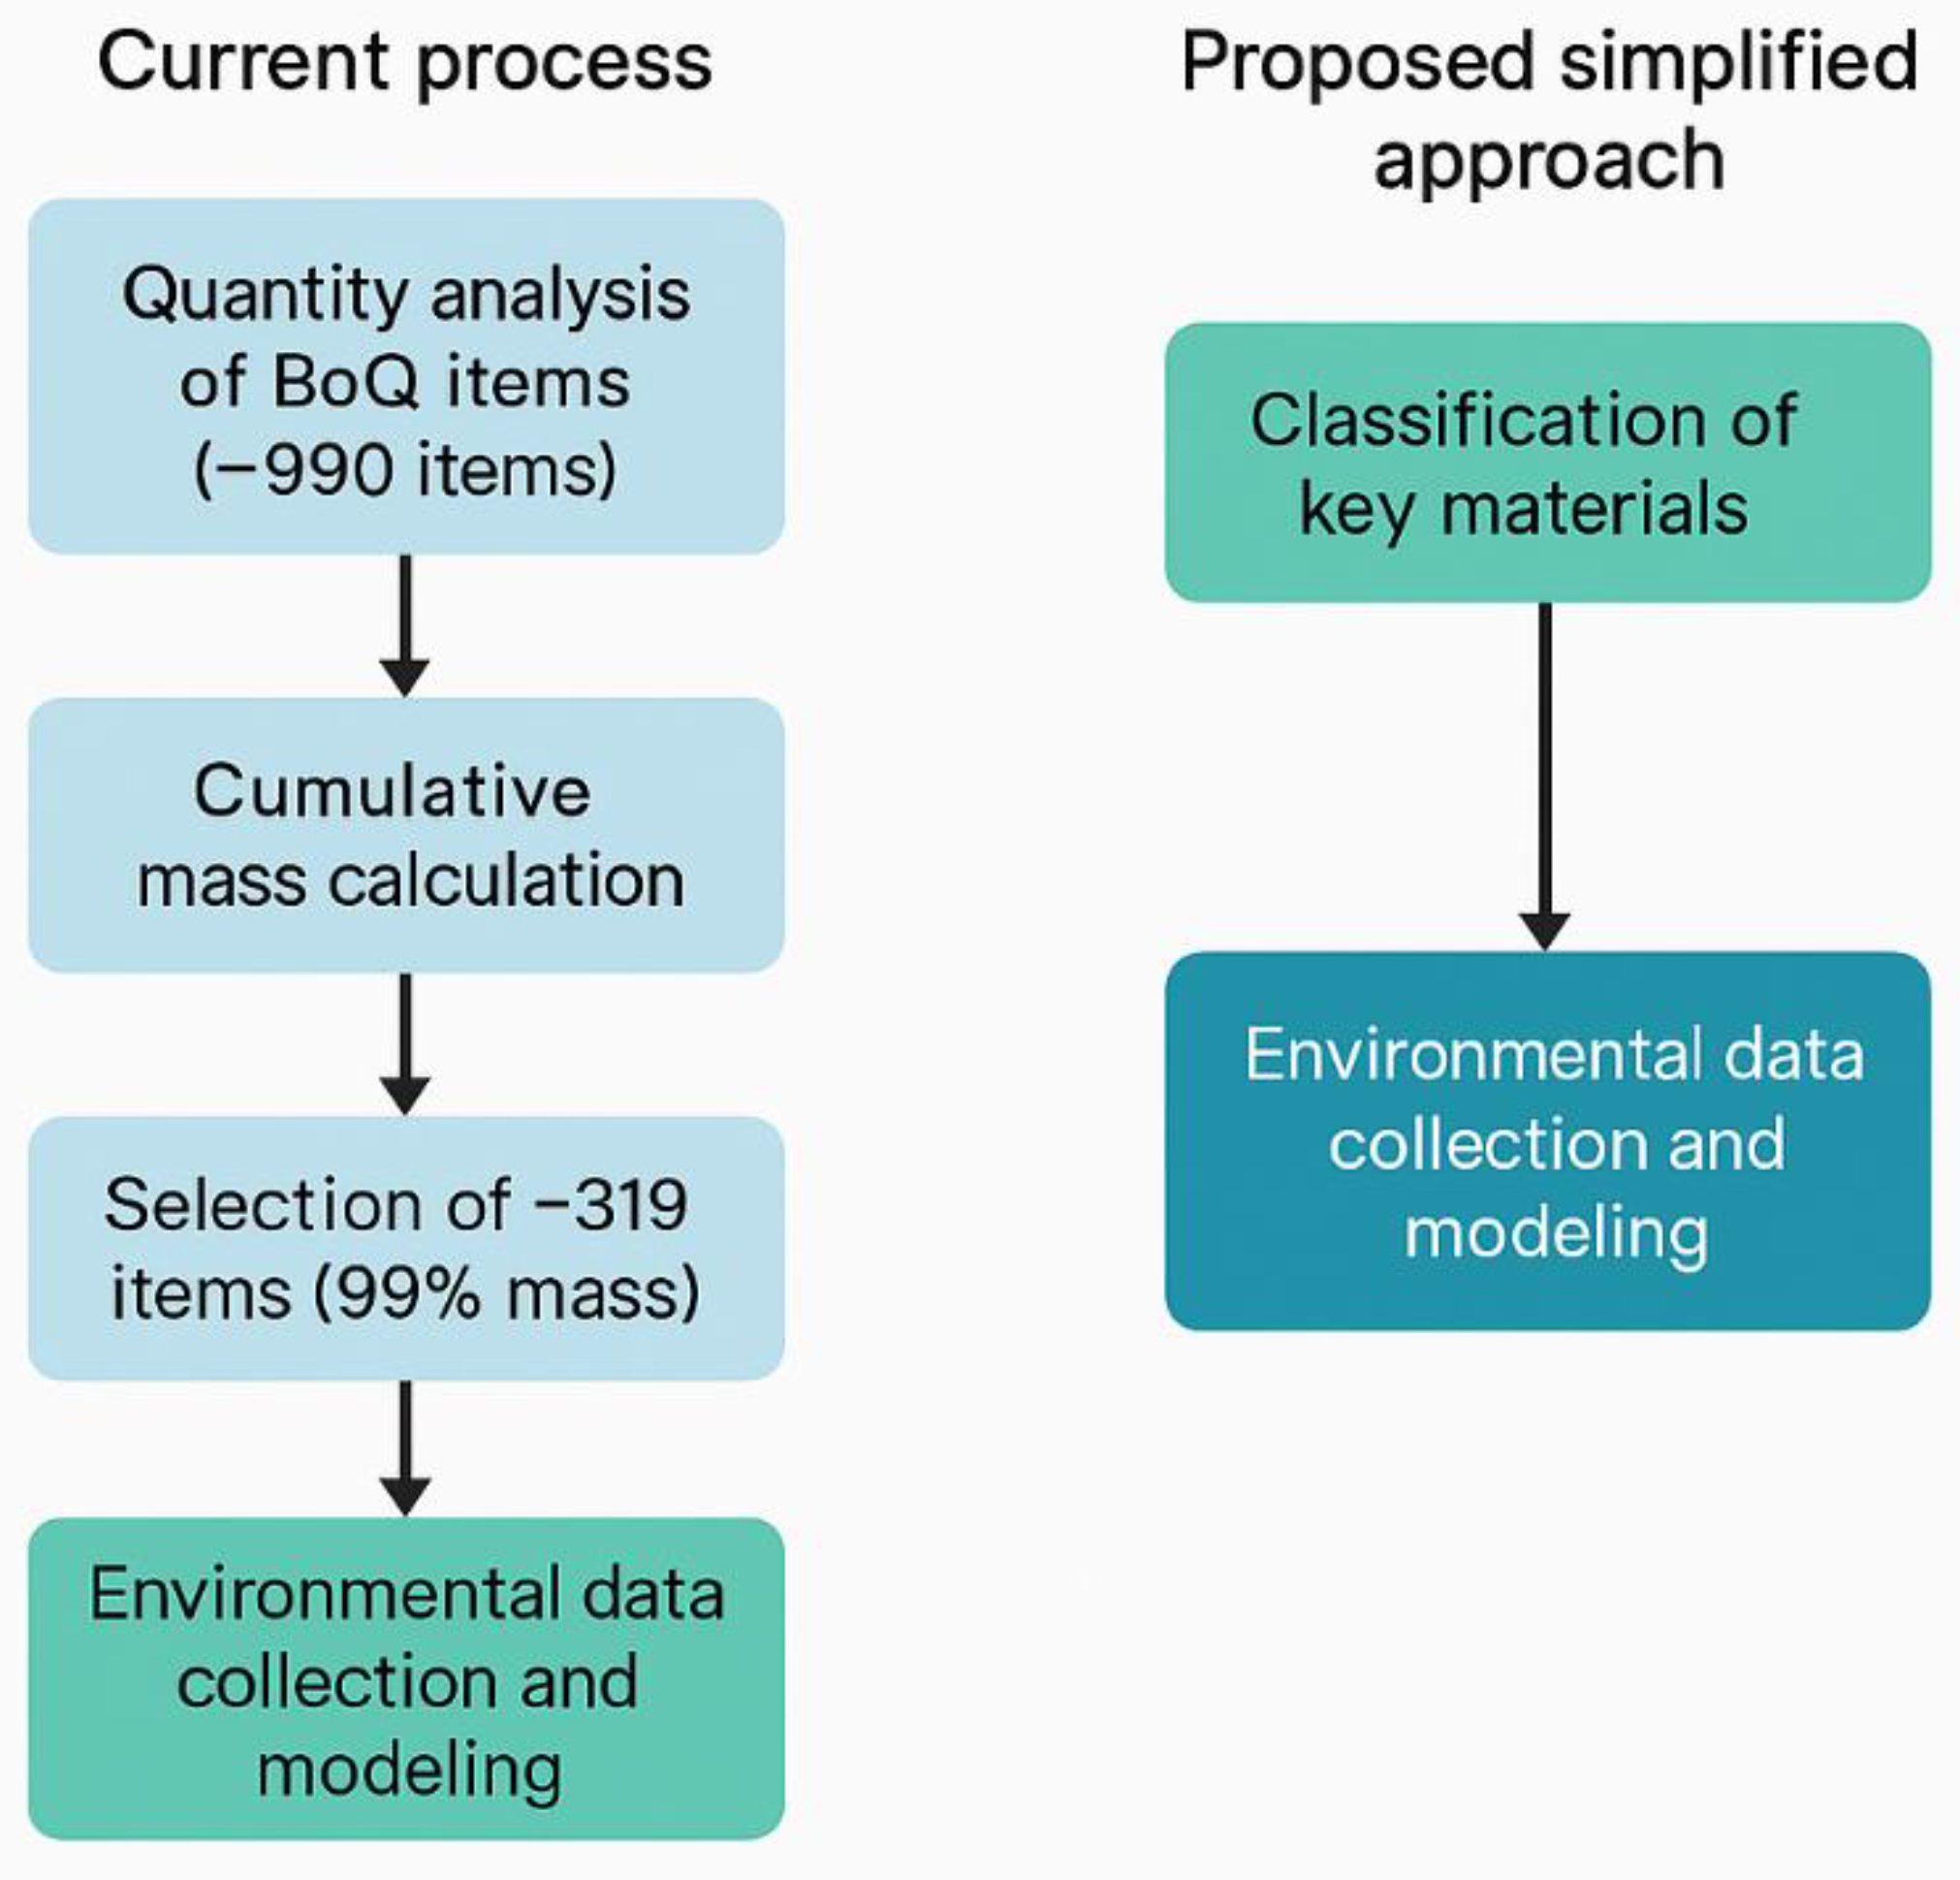

Table 1.
G-SEED certification and LCA reporting status.
| Year | Num of Certification | Num of LCA Reporting | LCA reporting Ratio |
| 2016 | 1,639 | - | - |
| 2017 | 1,765 | 6 | 0.34% |
| 2018 | 2,000 | 38 | 1.90% |
| 2019 | 2,169 | 118 | 5.44% |
| 2020 | 2,324 | 241 | 10.37% |
| 2021 | 2,383 | 377 | 15.82% |
| 2022 | 2,319 | 448 | 19.32% |
| 2023 | 2,509 | 565 | 22.52% |
| 2024 | 2,381 | 576 | 24.19% |
| Total | 19,489 | 2,369 | 12.16% |
Table 2.
Analysis building case.
| Number of Buildings (Total 100) | ||
| Building Type | Residential | 20 |
| Non-residential | 38 | |
| Office | 33 | |
| School | 6 | |
| Hotel | 2 | |
| Retail | 1 | |
| Structural Type | RC | 76 |
| RC+S | 10 | |
| SRC | 14 | |
Table 3.
Categorize of major construction materials.
| Material Category | Examples | Functional Role |
| Concrete (Ready-mixed) | Normal-strength, high-strength concrete | Primary structural component |
| Structural Steel | Deformed bars, welded wire mesh, H-beams, columns, steel framing | Structural reinforcement and system (steel buildings) |
| Metal Finishes | Aluminum & steel plates | Non-structural finishes, facade |
| Cement & Bricks | Mortar cement, solid bricks | Masonry walls, partitions |
| Wood | Structural timber, plywood | Structural timber, Internal reinforcement, finishes |
| Glass Products | Single-pane, double-pane, Low-E glass | Windows, facades |
| Insulation Materials | EPS, XPS, glass wool, urethane foam | Thermal insulation |
| Gypsum Board | Drywall panels | Interior wall finishes |
| Sand and Gravel | Fine aggregate, coarse aggregate | Concrete mix, bedding material |
| Stone Materials | Natural stone, marble, granite | Exterior and interior finishes |
| Tiles | Ceramic tiles, porcelain tiles | Flooring, wet area finishes |
| Paint and Wall Covering | Emulsion paints, wallpapers | Interior finishing |
Table 4.
Adoption Ratio of Major Construction Materials.
| Material Category | Number of LCA Reports using the Material Category |
Mass Balance Average Ratio |
|
| 1 | Concrete (Ready-mixed) | 100 | 85.6% |
| 2 | Structural Steel | 100 | 4.6% |
| 3 | Metal Finishes | 45 | 0.4% |
| 4 | Cement & Bricks | 98 | 5.5% |
| 5 | Wood | 4 | 0.0% |
| 6 | Glass Products | 57 | 0.3% |
| 7 | Insulation Materials | 98 | 0.1% |
| 8 | Gypsum Board | 63 | 0.4% |
| 9 | Sand and Gravel | 95 | 2.4% |
| 10 | Stone Materials | 63 | 0.6% |
| 11 | Tiles | 35 | 0.1% |
| 12 | Paint and Wall Covering | 5 | 0.0% |
Disclaimer/Publisher’s Note: The statements, opinions and data contained in all publications are solely those of the individual author(s) and contributor(s) and not of MDPI and/or the editor(s). MDPI and/or the editor(s) disclaim responsibility for any injury to people or property resulting from any ideas, methods, instructions or products referred to in the content. |
© 2025 by the authors. Licensee MDPI, Basel, Switzerland. This article is an open access article distributed under the terms and conditions of the Creative Commons Attribution (CC BY) license (http://creativecommons.org/licenses/by/4.0/).
Copyright: This open access article is published under a Creative Commons CC BY 4.0 license, which permit the free download, distribution, and reuse, provided that the author and preprint are cited in any reuse.