Submitted:
05 August 2025
Posted:
07 August 2025
You are already at the latest version
Abstract
The long-term safety of high-level radioactive waste (HLW) disposal depends on understanding groundwater migration in complex, low-permeability rock environments. In particular, fractured rock formations may serve as potential pathways for radionuclide transport over geological timescales. This study investigates groundwater flow at the Beishan site in Gansu Province, a candidate HLW repository, using a three-dimensional sonar vector seepage field detection system. Applied to the Xinchang and Shiyuejing fault zones, the method measured seepage velocities of approximately 1×10⁻¹⁰ m/s, with dominant flow directions from northwest to southeast and northeast to southwest, respectively. Results show that variations in permeability closely follow regional structural fracture patterns, and the findings align with existing hydrogeological data indicating average rock mass permeability near 1×10⁻⁸ m/s. The detection system achieved a velocity resolution of 1×10⁻¹⁰ m/s and directional accuracy within 2°, confirming its precision and reliability. This work demonstrates a practical and accurate approach for identifying groundwater flow in hard, nearly impermeable rock masses, offering critical support for HLW repository evaluation and broader geotechnical applications such as dam monitoring, underground oil storage, and dewatering of deep excavations.
Keywords:
groundwater flow velocity and direction
; high-level radioactive waste disposal
; double-layer seismo-electric effect
; 3D sonar-based seepage field detection
; low-permeability rock mass
1. Introduction
The safe disposal of high-level radioactive waste (HLW) is a major scientific and engineering challenge with significant implications for long-term environmental and human health. A critical concern is the potential for radionuclide migration from deep geological repositories to the biosphere over timescales of thousands of years, primarily through groundwater transport mechanisms after repository closure and re-saturation [1,2,3]. Understanding and accurately quantifying groundwater seepage velocity and flow direction are therefore essential for assessing the safety and performance of HLW disposal systems. Numerous hydrogeological techniques have been developed to monitor groundwater movement under natural flow conditions [4,5,6]. Among them, isotope tracing methods are well-established, offering high precision in measuring groundwater seepage direction and velocity across a wide dynamic range [7,8,9,10,11]. For instance, Gao et al. reported velocity detection ranges from 0.01 to 100 m/d with directional measurement errors within ±3% [12]. Other recent advances include the use of hydrogeophysical approaches [13,14,15], and direct measurement tools such as the GFD4 seepage meter [16], and fiber-optic distributed temperature sensing for fractured rock masses [17]. Despite these developments, technical limitations remain in low-permeability, fractured, and hard rock environments, such as the Beishan area in Gansu Province, China, a candidate site for HLW disposal. Traditional methods often fail to provide accurate in-situ measurements of key hydrogeological parameters under such challenging conditions.
Sonar-based detection technologies, with a history spanning over a century, have demonstrated robust performance in underwater structural inspection and geological surveying [18,19,20]. Modern three-dimensional (3D) acoustic imaging sonar systems enable precise visualization of complex subsurface structures in turbid or low-visibility aquatic environments, making them highly applicable to hydraulic infrastructure assessment [21,22,23,24,25,26]. Concurrently, the coupling between seismic P-waves and the electrical double layer in saturated porous media, known as the double-layer seismo-electric effect—has gained attention as a novel geophysical tool for subsurface flow detection [27,28,29,30,31,32,33,34,35,36,37]. This effect forms the theoretical foundation of a newly developed 3D sonar vector seepage field detection technology. By integrating acoustic and electric field measurements, this method enables real-time, in-situ detection of groundwater flow velocity, direction, permeability coefficient, and seepage flux in fractured rock masses.
This technique has been successfully applied to a variety of engineering and environmental contexts, including dam seepage monitoring [38,39,40], deep foundation pits [41], and subway tunnels [42]. Given its high precision and adaptability to complex hydrogeological conditions, this technology presents a promising solution for the in-situ characterization of groundwater flow in HLW disposal site investigations. This study presents the principles, implementation, and results of applying the 3D sonar vector seepage field detection method—based on the double-layer seismo-electric effect—in the Beishan area. By evaluating its performance in detecting groundwater seepage under natural conditions, we aim to establish its scientific and technical validity for use in site selection and safety evaluation of HLW repositories.
2. Principles and Methods
To investigate the groundwater seepage field characteristics within the study area, field measurements were conducted at two representative fault zones, Fault F31 in Xinchang and the Shiyuejing fault zone. Given the structural orientation of these faults and their potential control on groundwater flow pathways, five surface boreholes were deployed along Fault F31, and three boreholes were installed within a deep tunnel intersecting the Shiyuejing fault. This configuration enabled the acquisition of seepage field parameters across a range of depths, from surface to subsurface, to capture the spatial variability of groundwater flow.
The double-layer seismo-electric effect arises from electrokinetic phenomena at the solid–liquid interfaces within fluid-saturated porous media. In their undisturbed state, these interfaces maintain an electrical double layer due to the differential adsorption of ions. Specifically, negatively charged clay particles or fracture surfaces in the rock matrix adsorb anions, while a layer of compensating cations accumulates in the adjacent pore fluid, forming a diffuse electric double layer (Figure 1a). Under natural seepage conditions, groundwater within interconnected fractures is not static. As pore water moves through these conduits—particularly under hydraulic gradients—it induces relative motion between the mobile ions in the fluid and the immobile charges on the mineral surfaces. This ion displacement causes localized perturbations in charge density, generating a microscale current and resulting in spatially varying electrical potentials across the porous medium. These oscillating charge distributions give rise to an alternating potential difference and a corresponding seismo-electric field. The generation and propagation of this field are influenced by the geometry, connectivity, and fluid content of the fracture network. The double-layer seismo-electric effect therefore provides a mechanism for in-situ detection of subsurface fluid movement and related hydrogeological parameters, and serves as the theoretical foundation for the applied 3D sonar vector seepage field detection method.
Double-Layer Seismic Electric Effect mainly exists at the solid-liquid interface of underground porous media containing fluid. In the initial state, the natural electric field is in balance, the fracture surface of the rock mass (especially the clay particles) usually adsorbs negative ions, and the positive ions are distributed on the filling solution interface in the pores, thus forming an electrical double layer between the solid and liquid (Figure 1b). Due to the connectivity between the fractures in the rock mass, the groundwater seepage field will not be in a static state. The movement of the solution filled in the pores of the rock mass generates vibration, causing the relative movement of the positive ions on the interface of the pore solution and the negative ions adsorbed on the fracture surface of the rock mass, resulting in fluctuations in charge density (Figure 1c). At this time, the pore liquid forms a micro current, and alternating potential difference and alternating electric field appear in different parts of the medium. This process is the basic principle of generating seismoelectric effects in the fluid channels of underground porous media.
Underground water bodies in a natural state produce vibrations while flowing through porous media, leading to the generation of a seepage field at the measuring point and an electrical double layer signal at the solid-liquid interface (Figure 1d). The size and distribution of the energy transfer of the electric signal in the fluid can be accurately measured by the array of sonar detectors, and the direction of the sound source can be shown according to the spatiotemporal distribution of the measurement data. Also, by utilizing the distance and phase difference between the top sonar detector A and the bottom detector B in the direction of the seepage sound source, the particle velocity equation of the continuous seepage field is established. Thus, the measurement of water velocity field is achieved (Equation (1)). The instrument of 3D sonar velocity vector data acquisition is shown in Figure 1e.
where, L is the length of the propagation path of the sound wave between sensors (m); X is the axial component of the propagation path (m); TBA, TAB is the propagation time from sensor B to A and from sensor A to B (s); U is the average seepage rate of the fluid through the sound channel between sensors A and B (m/s).
U=-L2/2X(1/TBA-1/TAB)
3. Hydrogeological Characteristics of the Study Area
The study area is located within the designated site selection zone for the Xinchang high-level radioactive waste (HLW) disposal facility in Beishan, Gansu Province, China. The Xinchang region spans approximately 94 km2, extending about 20 km in an east–west direction and approximately 5 km from north to south (Figure 2). The topography of the broader Beishan area is characterized by elevated terrain in the north and south, with a relatively lower central region. The northern boundary comprises the Beishan mountain range, while the southern margin is defined by the Qilian Mountains. The central portion corresponds to the Hexi Corridor, a low-relief zone trending east–west and dominated by low mountains and hills. The region lies within a high-altitude Gobi desert zone and exhibits a typical temperate continental climate, marked by arid and windy conditions, low precipitation, and high evaporation. The average annual temperature ranges from 4.4°C to 8.4°C, with annual precipitation between 55.1 mm and 73.1 mm, and average annual evaporation ranging from 2,380.9 mm to 3,538.0 mm.
Groundwater in the study area can be categorized into three distinct types based on geomorphological and lithological settings: mountain bedrock fissure water, valley depression pore–fissure water, and basin pore–fissure water. Among these, mountain bedrock fissure water is the dominant groundwater type, predominantly occurring in regions composed of metamorphic rocks and granites. This groundwater type primarily exists as phreatic water within the upper portions of the bedrock. The groundwater table depth exhibits significant spatial variability, strongly influenced by topographic relief. In low-lying areas, the water table is typically shallow, with depths less than 5 meters. In contrast, elevated terrains exhibit groundwater depths ranging from 10 to 40 meters. Water-bearing zones are mainly located within weathered and structurally fractured sections of the bedrock, which serve as the principal aquifer media (Figure 3). The depth of the weathered zone ranges from approximately 30 to 80 meters, depending on the degree of weathering and rock type. Groundwater yield in the region is largely controlled by geomorphology, lithological composition, and the density and orientation of structural fractures. These hydrogeological factors result in highly variable well yields, with single-well inflows ranging from as low as 10 m3/d to as high as 1000 m3/d. This variability reflects the heterogeneous nature of the fractured rock aquifer system in the study area.
In the inland region under study, groundwater recharge is primarily derived from atmospheric precipitation via vertical infiltration. The area is characterized by arid climatic conditions, with an annual average precipitation of approximately 60–80 mm. As a result, the volume of effective groundwater recharge from precipitation is limited, and its spatial distribution is highly uneven. Precipitation that infiltrates the subsurface percolates vertically through the vadose zone and accumulates preferentially in geomorphic features such as gullies, depressions, and structurally developed fracture zones. These zones serve as principal recharge and storage areas within the hydrogeological system. A portion of the infiltrated water is lost to evaporation, particularly in exposed or shallow groundwater zones. The remaining portion contributes to subsurface runoff and is transported downstream along preferential pathways formed by gullies, depressions, and fracture zones. Ultimately, groundwater discharges into larger basin areas or designated discharge points, completing a dynamic hydrological cycle. This cycle is characterized by alternating phases of recharge, storage, lateral flow, and discharge, forming a relatively closed and self-regulating groundwater circulation system typical of inland arid environments.
4. Results
4.1. Surface Boreholes Test in Xinchang Area
To identify the natural groundwater seepage vector field and hydraulic gradient field with unified boundary conditions in the site selection area, the results of big data analysis of sonar seepage measurement method are used to automatically generate 3D visualization of groundwater seepage velocity, direction, discharge and other hydrogeological elements on the measurement site, providing technical support for the most important groundwater dynamics parameters. Faults F31 and F32 in Xinchang are normal left-lateral strike-slip faults with northeastward strike. The overall strike of the fault is 60 degrees to the northeast, and the dip angle is southeast which is 70° to 80°. Based on the geological features of Xinchang, the structures of faults F31 and F32 are divided into different hydrogeological distribution units. Five hydrogeological deep holes within a 100 meter radius were selected for 3D sonar seepage hydrogeological tests (Figure 4).
As depicted in Figure 4, the five hydrogeological survey holes in the mountain area are symmetrically arranged along the upper and lower plates of the large dip angle of fault F31. And the vertical holes including holes BSQ05 and BSQ06 in the north, holes BSQ03 and BSQ03 in the south, and hole BSQ01 in the east of the fault F31. Six monitoring wells were deployed to characterize groundwater seepage across the study area. BSQ09–BSQ12 are located along the F32 fault zone, representing structurally influenced hydrogeological units, while BSQ14 and BSQ15 are situated in the candidate site, relatively undisturbed granite zone. This layout provides a representative comparison of seepage behavior in both fractured and intact rock, supporting the analysis of structural impacts on groundwater flow dynamics. These 100 meters deep hydrogeological measurement holes generally represent the seepage characteristics of various hydrogeological units in the fault tectonic belt and the eastern low-lying area of the measurement area, as well as the analysis results of three-dimensional spatial sonar big data on groundwater velocity, direction, and discharge in the study area.
In other words, there exists three-dimensional dynamic seepage cloud map of the natural seepage field of regional groundwater dynamics under unified hydrological boundary conditions. The numerical isocontour plane imaging map of XYZ triaxial velocity, seepage direction and discharge generated through a cloud-based process. Thus, the hydrogeological characteristics revealed by five boreholes in Beishan and the measurement results of groundwater seepage are displayed. Through the analysis of horizontal seepage velocity and seepage direction of groundwater well tests, the groundwater seepage field in each measurement hole is distinctly recognized, and the relationship between permeability characteristics and recharge and discharge in different geotechnical penetration sections becomes evident. Hence, the seepage distribution curves of each aquifer and groundwater are measured as shown in Figure 5a,b and Table 1.
As shown in Figure 5c,d, the distribution curve of the penetration velocity of the five measuring holes with respect to the measured elevation. It is evident that the seepage velocity of hole BSQ03 is the largest, followed by several instances where the velocity anomalies in hole BSQ01 are also significant. The order of the average penetration velocity in the test holes is as follows: BSQ03, BSQ01, BSQ06, BSQ02, BSQ05.
Figure 7a,b present visualized imaging results that compare bar charts of single-well seepage rates with spherical representations of three-dimensional spatial seepage rates for five measurement boreholes in the study area. The volumetric seepage flow at each measurement point was estimated by multiplying the measured seepage velocity by an assumed effective cross-sectional width of 50 meters per borehole. The total calculated seepage flow across the measured area is 9.87×104 cm³/s. The individual seepage contributions are as follows: 7.88×104 cm³/s for borehole BSQ03, 1.79×10⁴ cm³/s for BSQ01, 1.01×103 cm³/s for BSQ06, 6.00×102 cm³/s for BSQ05, and 3.81×102 cm³/s for BSQ04. Notably, BSQ03 alone accounts for approximately 79.8% of the total seepage, and its flow rate is two orders of magnitude greater than that of the lowest-flowing borehole, BSQ04, as illustrated in Figure 5a. These results indicate a highly uneven distribution of groundwater seepage across the study area, with lower seepage volumes observed in the northern and western zones, and higher volumes in the southern and eastern zones. Figure 5b provides detailed spatial seepage data, where sphere diameter denotes seepage volume and color indicates magnitude. Based on these results, the seepage rate contour map shown in Figure 6 was generated to delineate the boundary characteristics of the seepage field.
Figure 6.
Results of 3D sonar velocity vector measurement in Xinchang area. (a) Histogram distribution of seepage rates of sonar holes; (b) Spatial distribution map of seepage measured by sonar.
Figure 6.
Results of 3D sonar velocity vector measurement in Xinchang area. (a) Histogram distribution of seepage rates of sonar holes; (b) Spatial distribution map of seepage measured by sonar.
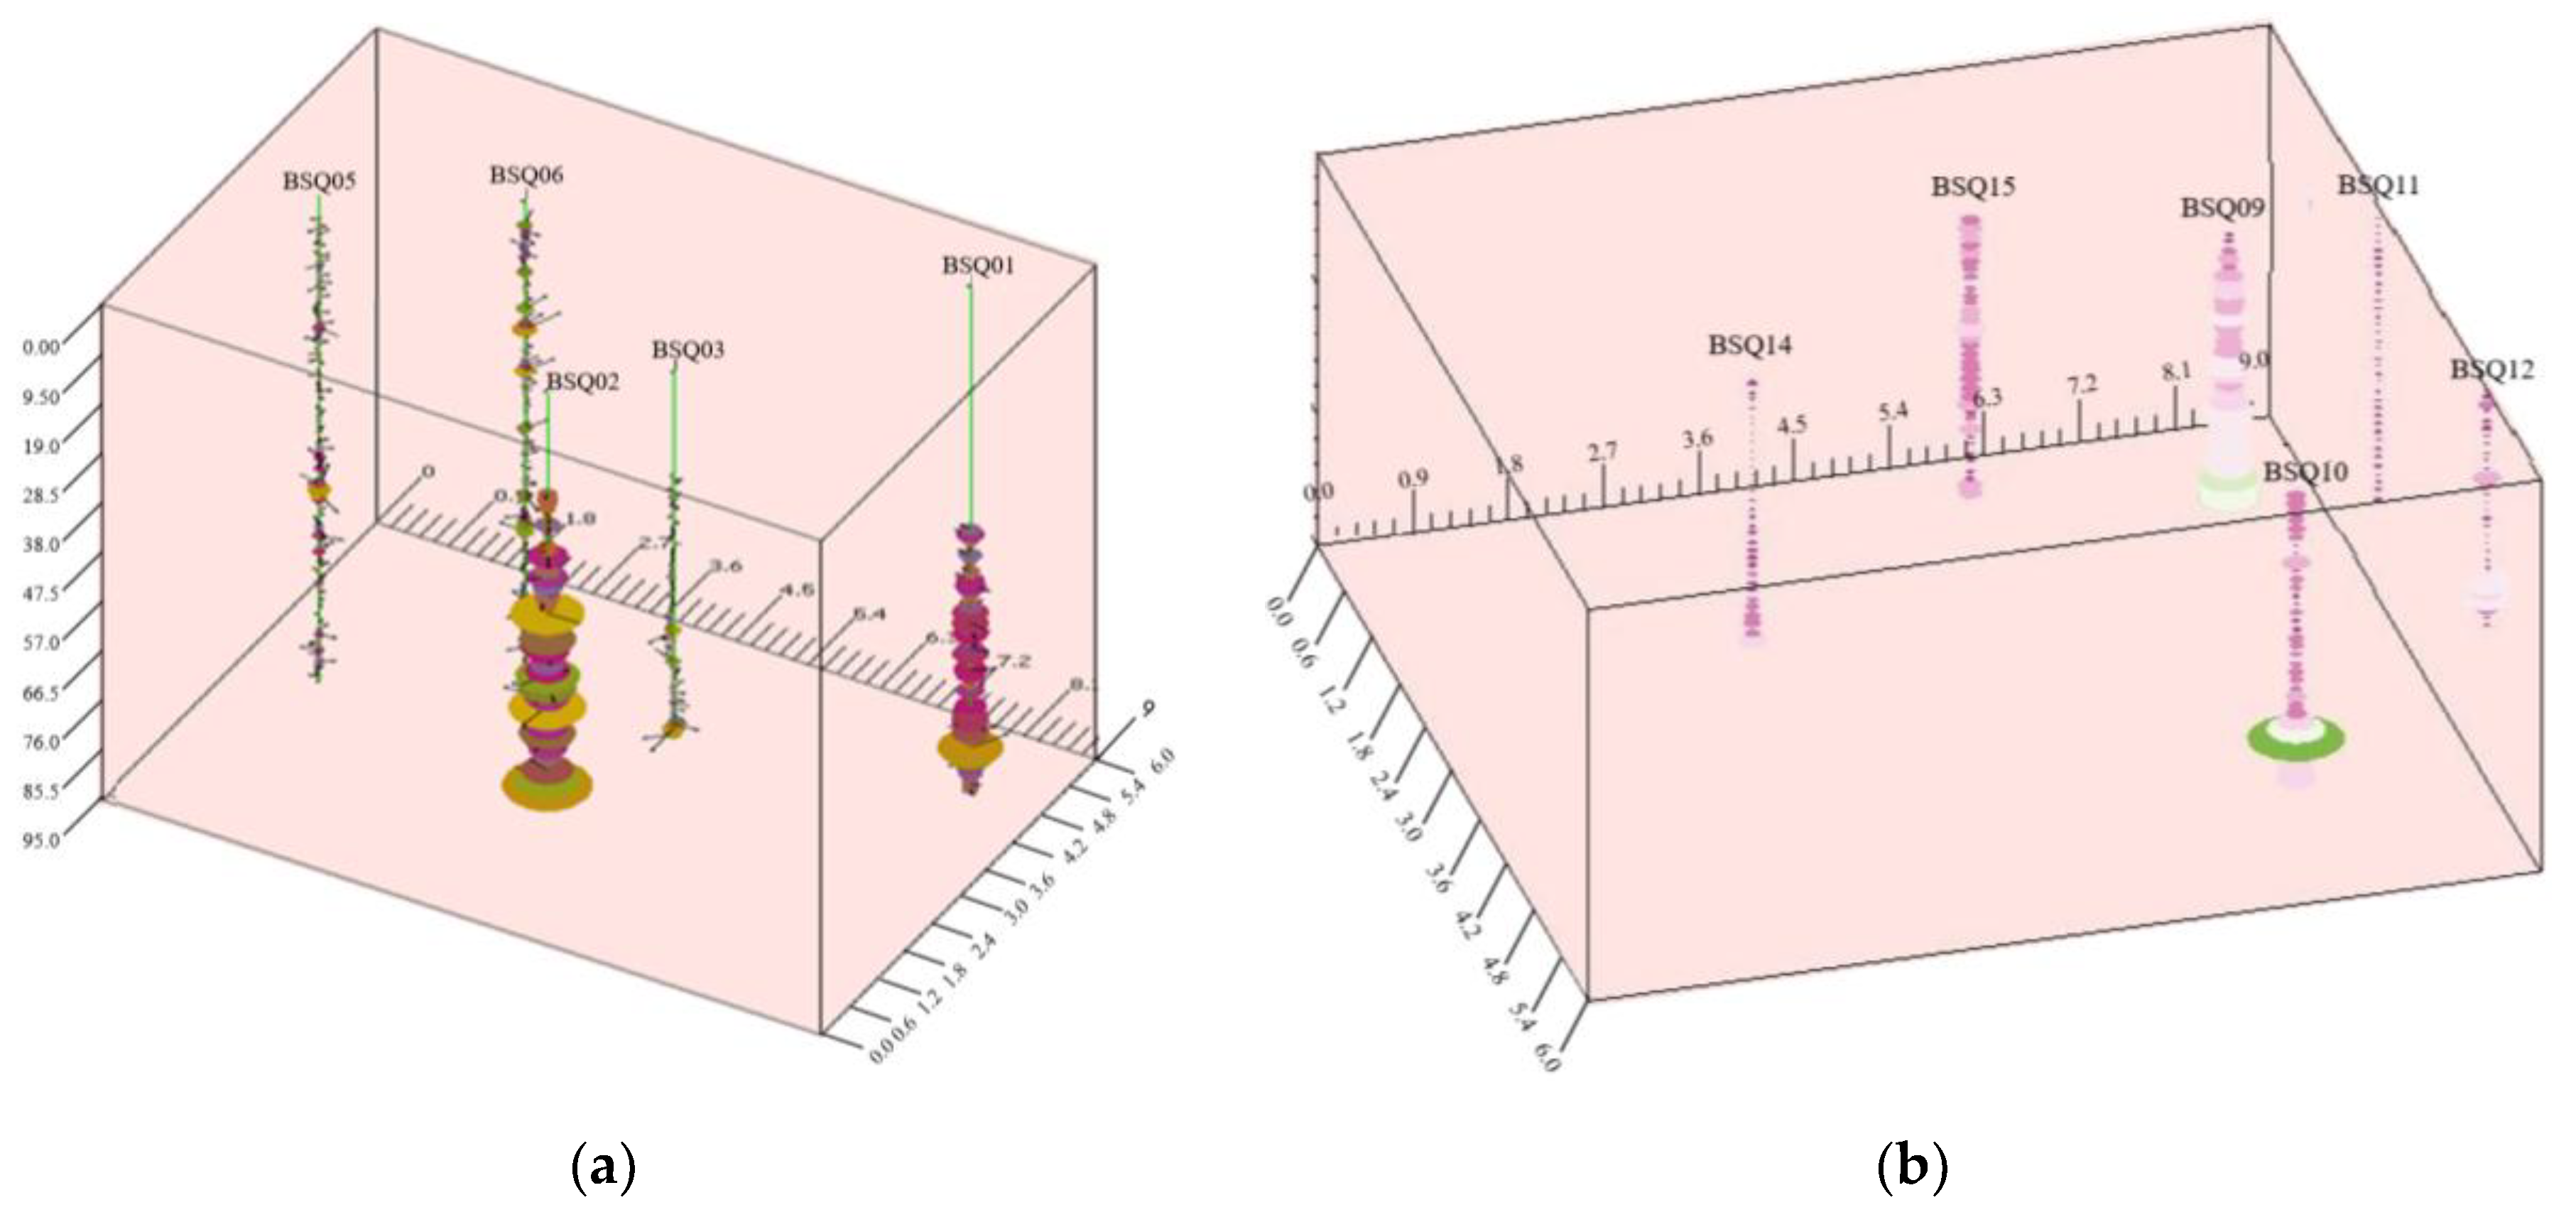
Figure 7.
Spatial distribution of measurement boreholes BSQ01-BSQ06 in the Xinchang area. (a) Seepage velocity map at the boundary of the seepage field; (b) Groundwater flow direction inferred from each measurement borehole.
Figure 7.
Spatial distribution of measurement boreholes BSQ01-BSQ06 in the Xinchang area. (a) Seepage velocity map at the boundary of the seepage field; (b) Groundwater flow direction inferred from each measurement borehole.
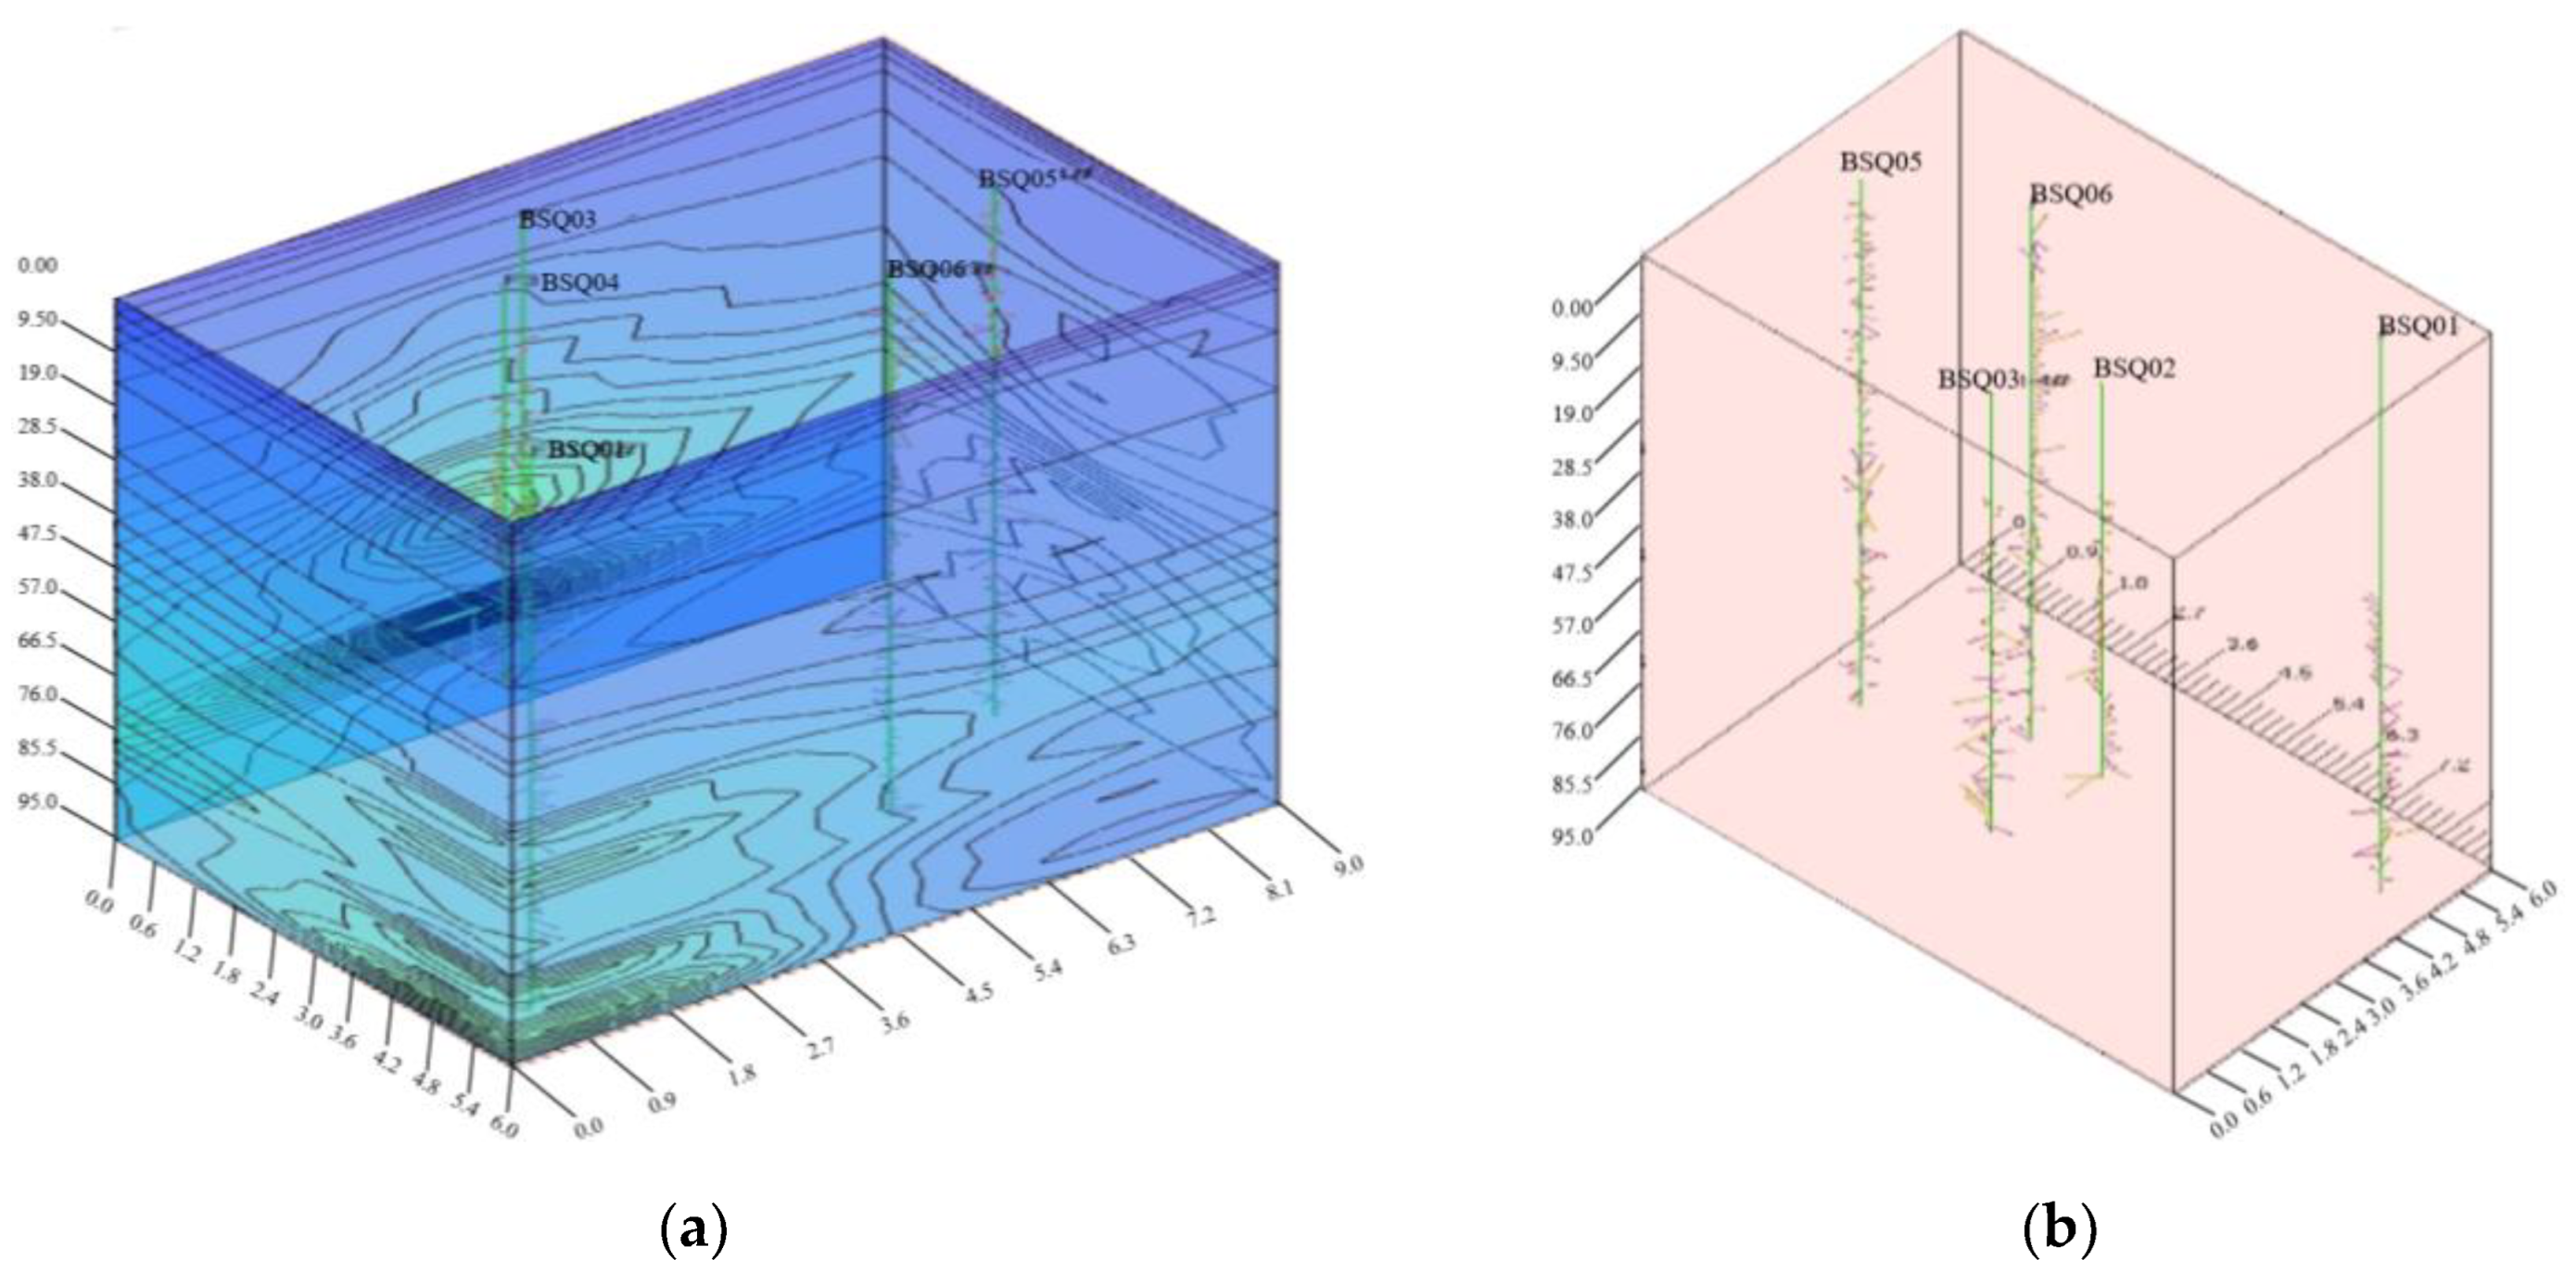
Figure 8 illustrates the primary direction of natural groundwater seepage across five boreholes, as inferred from hydrogeological logging conducted at the Beishan site. In the diagram, the length of each arrow represents the magnitude of seepage velocity, while the arrow orientation indicates the flow direction. The dominant seepage trend is observed to be from northwest to southeast. By integrating these results with fundamental drilling data, a more accurate and detailed characterization of the groundwater seepage field within the fracture zone can be achieved.
4.2. Underground Tunnel Testing in Shiyuejing Fault
The fault Shiyuejing shares similarities with the faults F31 and F32 in Xinchang, which are left-lateral strike-slip normal faults with a Northeastward strike (Figure 3 and Figure 9), with a general strike of 60 degree North-Eastern direction, dip to southeast, and dip angle of 70°-80°. The faults F31 and F32 tested in Xinchang represent the characteristics of groundwater seepage field within 100m of the surface, while exploration of Shiyuejing can represent the characteristics of groundwater seepage field deep underground. To investigate this further, three shallow hydrologic holes within 10m in the Shiyuejing borehole were selected for hydrogeological sonar seepage measurements. The positions of sonar measuring holes SW1, SW2, and SW3 are shown in Figure 9.
Figure 10 presents a column chart depicting the distribution of seepage flow rates across the three monitored boreholes, under a total measured flow of 1.77 cm3/s. As detailed in Table 2, borehole SW3 exhibits the highest individual seepage flow rate, indicating a relatively greater permeability or a more direct connection to the dominant flow pathways within the fractured rock mass. Borehole SW1 shows a moderate flow rate, while SW2 records the lowest seepage, suggesting comparatively lower permeability or a less favorable hydraulic connection. The observed variation in flow rates among the boreholes reflects heterogeneity in the local fracture network and rock mass characteristics. These differences may be influenced by factors such as fracture density, aperture, connectivity, and orientation relative to the regional hydraulic gradient. The consistency between the quantitative seepage measurements and the spatial arrangement of boreholes supports the reliability of the detection method and enhances the understanding of groundwater migration behavior in low-permeability fractured geological media.
Note: 2. In the Table 2, the velocity and direction in the table are measured in situ. 2. Section seepage rate is the sum of the penetration velocity of each measuring point multiplied by the width of the water passing section (with an assumed width of 50 meters for the water passing section). 3. The seepage direction is North-North.
As shown in Figure 11, the measured average seepage velocities for the boreholes exhibit a clear decreasing trend from SW2 to SW3. Specifically, the average velocity for borehole SW2 was 7.28×10⁻¹⁰ m/s, followed closely by SW1 at 6.72×10⁻¹⁰ m/s, while the lowest velocity was observed in SW3, at 1.02×10⁻¹⁰ m/s. These results suggest significant spatial heterogeneity in hydraulic conductivity across the tested boreholes. The markedly lower seepage velocity in SW3 may indicate a localized zone of reduced permeability, possibly due to less developed fracture networks or denser rock matrix conditions. In contrast, the higher velocities in SW1 and SW2 imply enhanced flow pathways, potentially associated with more extensive fracturing or increased porosity. These variations highlight the importance of site-specific hydrogeological characterization when evaluating groundwater migration in low-permeability fractured rock formations.
5. Conclusions
5.1. Comparison of Penetration Velocity Curve and Core of Boreholes
- (1) As illustrated in Figure 12, a comparative analysis of the permeability coefficients obtained from boreholes BSQ05 and BSQ06 with those derived from corresponding rock core samples reveals a notably higher permeability in the borehole sections as determined by well-logging measurements. This discrepancy is attributed to the relatively fractured and poorly cemented nature of the rock cores in the tested intervals. Such structural discontinuities are likely to facilitate enhanced groundwater migration, thereby increasing the local permeability. To further substantiate these findings, a comparison with micro-imagery data acquired via downhole micro-camera (micro TV) inspection is recommended. By correlating the observed seepage characteristics with the visual identification of fractures and discontinuities in situ, a more accurate and reliable interpretation of the subsurface seepage field and associated flow behavior can be achieved. This integrative approach would significantly improve the understanding of groundwater transport mechanisms in fractured rock masses and enhance the reliability of permeability estimations in low-permeability environments.
- (2) Figure 11a,11b present the three-dimensional distribution of seepage velocity vectors at spatial measurement points within the natural groundwater seepage field, derived from hydrogeological logging conducted in three boreholes along the Shiyuejing tunnel. Figure 11a illustrates the vector field in three-dimensional space, while Figure 11b displays the predominant planar seepage directions for each individual borehole. In both figures, the length of each arrow represents the magnitude of the seepage velocity, and its orientation indicates the flow direction. The results reveal a consistent trend in which the primary groundwater seepage direction is oriented from northeast to southwest. This directional pattern is indicative of the structural and hydraulic influence of regional faults and fracture networks, which appear to control preferential flow paths in the low-permeability rock mass. The uniformity of seepage direction across the boreholes also suggests a coherent regional hydraulic gradient and supports the reliability of the applied vector seepage detection method. These findings are crucial for understanding subsurface fluid dynamics in the Shiyuejing fault zone and provide valuable input for the long-term safety assessment of potential high-level radioactive waste disposal at the Beishan site.
- (3) By comparing and verifying the penetration velocity measured with depth by the TV imaging of the borehole and the three-dimensional sonar in the borehole SW1-WS3(Figure 13), it is evident that the penetration velocity value of the borehole ranges from 5.76×10⁻¹⁰m/s to 8.94×10⁻¹⁰m/s, with significant values observed at the depths of 1.5m, 4.5m, 7m and 9.5m respectively. A comparison of the TV data from the borehole reveals that fracture structural planes tend to develop at depths where groundwater velocity is high indicating a strong correlation.
5.2. Comparative Analysis of Geophysical Interpretation Results
Through the measurement of 5 deep holes and 3 shallow holes in Beishan area by three-dimensional sonar, the measured, calculated, and analyzed hydrogeological parameters of the groundwater seepage field show:
- (1) In the five deep holes measured in the Xinchang, the underground seepage velocity, direction and seepage chart measured by the natural seepage field indicate a highly uneven distribution on both plane and vertical sections, and its distribution matches the geological geomorphology, especially the abnormal mutation of the seepage velocity is consistent with the development of structural fractures here. There varies by two orders of magnitude between holes BSQ03 and BSQ03. The difference between the maximum velocity and the minimum velocity of vertical section hole BSQ03 is 4 orders of magnitude. The main percolation direction of each spatial measuring point of the natural groundwater as measured in hole BSQ01 is northwest to southeast.
- (2) According to the three-dimensional distribution diagram of the velocity vector direction of groundwater seepage field measured by boreholes SW1, SW2 and SW3 during the exploration of the fault Shiyuejing and the plane main seepage direction diagram of each hole, the seepage velocity of the three holes is 10−10m/s, and the main seepage direction is from northeast to southwest.
- (3) Based on the distribution maps of the seepage velocity and direction of groundwater seepage field detected by 5 boreholes in Xinchang and 3 boreholes in Shiyuejing exploration, the primary seepage directions of the groundwater in faults F31 and F32, Shiyuejing fault are all affected by the development trend of fractures formed by fault zones, particularly in F31 fault. At the same time, the groundwater velocity and discharge are higher at the depth of fracture development, which is consistent with the borehole data.
The permeability coefficient of the rock mass in the pre-selection area of the high-level waste disposal warehouse is approximately 1×10⁻¹⁰m/s. The hydrological data indicate that the hydraulic gradient of this section is 1%. According to Darcy’s law, the seepage velocity of groundwater can be calculated as 1×10⁻¹⁰m/s, which matches the experimentally measured groundwater seepage velocity, proving the method’s feasibility.
5.3. Sonar Logging Based on Double-Layer Seismo-Electric Effect
The permeability coefficient serves as a crucial hydrogeological parameter for assessing the migration of water flow within rock fissures. When the seepage exhibits laminar characteristics in these fractures, Darcy’s Law comes into play, indicating a direct proportionality between the seepage velocity (v) and the hydraulic gradient (i).
where, k is the permeability coefficient (cm/s), v is the seepage velocity (cm/s), i is the hydraulic gradient, i =Δh/L, Δh is the difference of water level (cm), L is the length of infiltration path (cm), q represents the volumetric seepage rate per unit time (cm3/s) and A is the cross-sectional area in the vertical seepage direction (cm2).
where, Q represents the section seepage rate (cm3/s), which is the seepage velocity (v) of each measuring point multiplied by the water passing section area (d) ; d is the water crossing section area (cm2).
v= k·i
v=q/A=k·i
q= kAΔh/l=kAi
Q=v·d
By substituting Equations (2) and (3) into Equations (4)–(6) can be deduced.
k=v·d·l/AΔh
Thus, by utilizing the seepage velocity (v) of water in the borehole fractures, which is obtained through a three-dimensional sonar logging device, along with the propagation time (T) of sonar waves within these fractures and considering the water seepage direction as described in equation (1), it can determine the parameters characterizing the groundwater seepage field observed in the borehole.
6. Discussion
The application of three-dimensional sonar vector measurement technology in the Xinchang pre-selected area has enabled the acquisition of key hydrogeological parameters, including groundwater seepage velocity and directional flow characteristics within both the shallow fractured rock mass and fault zones, particularly in Fault F31 and the Shiyuejing fault. These data provide a robust technical foundation for understanding groundwater dynamics in the context of high-level radioactive waste (HLW) disposal site evaluation.
Given that the majority of existing hydrogeological boreholes in the site extend to depths of approximately 100 meters, most current observations and measurements are limited to the shallow subsurface. However, preliminary regional geological and hydrogeological investigations have indicated that the lithology at greater depths (500-700 m) is predominantly massive granite, with minimal structural development and relatively homogeneous conditions. Based on these findings, the measured seepage parameters in the shallow section can be considered a reasonable approximation for deeper zones, offering a valuable reference for modeling subsurface flow conditions at potential repository depths.
Compared to conventional hydrogeological testing methods—such as packer (pressurized water) tests—the 3D sonar seepage field detection technology demonstrates notable advantages in operational efficiency, data richness, and interpretive capability. The method substantially reduces the logistical complexity and time required for fieldwork while enabling accurate in-situ determination of seepage velocity, flow direction, and fracture permeability coefficients. This capability enhances the quantitative assessment of subsurface flow regimes, particularly in low-permeability, fractured crystalline rock environments, where traditional methods often face significant limitations.
Furthermore, the technology facilitates the spatial mapping of seepage fields across multiple boreholes, supporting a more integrated understanding of hydrogeological processes and anisotropy in fracture-dominated aquifers. These results confirm that the 3D sonar-based approach is not only technically feasible but also scientifically valuable for the detailed characterization of groundwater systems in HLW disposal site investigations. As such, it offers a promising tool for improving the precision of seepage field analysis and informing safety assessments for long-term waste containment.
Author Contributions
Conceptualization, J.F. and SC.W.; methodology, J.F.; software, J.F.; validation, J.F., M.Y. and GP.D.; formal analysis, J.F.; investigation, J.F.; resources, S.W.; data curation, J.F.; writing—original draft preparation, J.F.; writing—review and editing, S.W.; visualization, J.F.; supervision, S.W.; project administration, S.W.; funding acquisition, M.Y. All authors have read and agreed to the published version of the manuscript.
Funding
This research was funded by the General Project of the Scientific Research Fund of the Department of Education of Yunnan Province (grant number 2024J1071), the 2024 Joint Special Project for Basic Research of Undergraduate Colleges and Universities in Yunnan Province – Youth Project (grant number 202401BA070001-008), the 2025 Outstanding Young Talent Project of the “Xingzhao Talent Support Program” of Zhaotong City, and Yunnan Finance and Education [2024] No. 104 – Support from the Central Government’s High-level Talent Research Start-up Fund (grant number S106240004). The APC was funded by the General Project of the Scientific Research Fund of the Department of Education of Yunnan Province (2024J1071).
Data Availability Statement
The datasets generated during and/or analyzed during the current study are available from the corresponding author on reasonable request.
Acknowledgments
The authors would like to thank the administrative staff of Kunming University of Science and Technology and Zhaotong University for their logistical support throughout the field investigation. Technical assistance provided by the Beijing Research Institute of Uranium Geology (BRIUG) during data acquisition is also gratefully acknowledged. The authors also appreciate the collaboration of Nanjing Emperor-dam Engineering Technology Co., Ltd. for providing access to borehole equipment and support during field operations. During the preparation of this manuscript, the authors used ChatGPT (OpenAI, GPT-4, August 2025 version) for assistance with language refinement and editorial clarity. The authors have reviewed and edited the AI-generated outputs and take full responsibility for the content of this publication.
Conflicts of Interest
The authors declare no conflicts of interest. The funders had no role in the design of the study; in the collection, analyses, or interpretation of data; in the writing of the manuscript; or in the decision to publish the results.
Abbreviations
The following abbreviations are used in this manuscript:
| HLW | High-level radioactive waste |
| BSQ | 100-meter-deep borehole in the Beishan mountainous region |
| SW | Hydrogeological boreholes in the Shiyuejing Fault exploratory trench |
| 3D | Three-dimensional |
Appendix A
Appendix A.1
The appendix is an optional section that can contain details and data supplemental to the main text—for example, explanations of experimental details that would disrupt the flow of the main text but nonetheless remain crucial to understanding and reproducing the research shown; figures of replicates for experiments of which representative data is shown in the main text can be added here if brief, or as Supplementary data. Mathematical proofs of results not central to the paper can be added as an appendix.

Table A1.
This is a statistical table of seepage parameter measurements from boreholes BSQ01 to BSQ06 at the Beishan site: flow velocity (cm/s) and flow rate (cm³/s).
Table A1.
This is a statistical table of seepage parameter measurements from boreholes BSQ01 to BSQ06 at the Beishan site: flow velocity (cm/s) and flow rate (cm³/s).
| Depth/m | BSQ01 | BSQ02 | BSQ03 | BSQ05 | BSQ06 |
|---|---|---|---|---|---|
| 50 | 1.21E-05 | 9.66E-05 | 3.47E-03 | 1.14E-05 | 8.52E-07 |
| 51 | 3.53E-06 | 5.21E-06 | 1.96E-03 | 1.84E-05 | 5.95E-07 |
| 52 | 3.94E-04 | 2.89E-06 | 7.49E-04 | 1.56E-06 | 9.85E-07 |
| 53 | 6.46E-05 | 9.52E-07 | 1.17E-03 | 2.66E-05 | 9.54E-06 |
| 54 | 9.69E-06 | 9.91E-07 | 3.14E-03 | 8.50E-07 | 6.90E-06 |
| 55 | 1.11E-04 | 1.90E-06 | 7.96E-03 | 6.90E-06 | 5.37E-06 |
| 56 | 3.42E-05 | 6.79E-05 | 2.54E-04 | 4.90E-05 | 5.34E-06 |
| 57 | 7.90E-04 | 7.02E-06 | 6.14E-03 | 4.51E-04 | 8.93E-05 |
| 58 | 8.60E-04 | 1.38E-06 | 4.62E-03 | 1.80E-04 | 3.13E-06 |
| 59 | 3.41E-04 | 3.68E-06 | 3.29E-03 | 3.80E-05 | 1.04E-06 |
| 60 | 7.16E-05 | 1.37E-06 | 1.31E-03 | 4.75E-07 | 8.97E-06 |
| 61 | 6.76E-05 | 6.67E-06 | 1.22E-02 | 9.48E-07 | 2.56E-05 |
| 62 | 4.25E-04 | 4.06E-06 | 3.10E-04 | 7.16E-07 | 8.07E-05 |
| 63 | 1.66E-03 | 3.75E-06 | 1.81E-03 | 8.05E-07 | 9.65E-05 |
| 64 | 7.83E-05 | 9.63E-06 | 1.40E-03 | 9.97E-06 | 1.02E-04 |
| 65 | 1.70E-03 | 4.11E-06 | 2.58E-03 | 9.66E-06 | 6.75E-06 |
| 66 | 6.84E-04 | 5.81E-06 | 5.58E-03 | 4.95E-05 | 9.60E-07 |
| 67 | 1.44E-03 | 7.84E-06 | 4.08E-03 | 4.39E-07 | 1.25E-06 |
| 68 | 5.64E-05 | 5.48E-05 | 9.34E-05 | 3.04E-06 | 6.07E-07 |
| 69 | 1.11E-05 | 3.54E-04 | 2.02E-03 | 4.01E-05 | 4.70E-06 |
| 70 | 7.30E-04 | 7.80E-05 | 6.18E-04 | 9.79E-07 | 4.84E-07 |
| Average velocity (cm/s) | 7.01E-04 | 1.50E-05 | 2.63E-03 | 1.33E-05 | 2.23E-05 |
| Maximum velocity (cm/s) | 8.37E-03 | 3.54E-04 | 3.31E-02 | 4.51E-04 | 5.33E-04 |
| Minimum velocity (cm/s) | 3.53E-06 | 5.29E-07 | 6.24E-06 | 4.12E-07 | 4.28E-07 |
| Average Permeability coefficient (cm/s) | 8.09E-07 | 3.53×10⁻⁸ | 6.36E-06 | 2.30E-07 | 4.90E-07 |
| Maximum Permeability coefficient (cm/s) | 9.66E-06 | 8.34E-07 | 8.01E-05 | 7.76E-06 | 1.17E-05 |
| Minimum Permeability coefficient (cm/s) | 3.95E-09 | 1.25E-09 | 1.51E-08 | 7.09E-09 | 9.4E-09 |
| Seepage section | 1.79E+04 | 3.81E+02 | 7.88E+04 | 6.00E+02 | 1.01E+03 |
| Seepage direction | 97-156 | 151-245 | 152-246 | 125-216 | 135-223 |
Table A2.
This is a statistical table of seepage parameter measurements from boreholes BSQ09 to BSQ15 at the Beishan site: flow velocity (cm/s) and flow rate (cm³/s).
Table A2.
This is a statistical table of seepage parameter measurements from boreholes BSQ09 to BSQ15 at the Beishan site: flow velocity (cm/s) and flow rate (cm³/s).
| Depth(m) | BSQ09 | BSQ10 | BSQ11 | BSQ12 | BSQ14 | BSQ15 |
|---|---|---|---|---|---|---|
| 15 | 7.44E-08 | |||||
| 16 | 3.46E-08 | |||||
| 17 | 1.49E-08 | |||||
| 18 | 5.32E-08 | |||||
| 19 | 6.87E-08 | |||||
| 20 | 5.37E-08 | |||||
| 21 | 1.59E-08 | |||||
| 22 | 2.43E-08 | |||||
| 23 | 8.19E-08 | |||||
| 24 | 2.47E-08 | |||||
| 25 | 3.83E-08 | |||||
| 26 | 2.19E-08 | |||||
| 27 | 1.61E-08 | |||||
| 28 | 4.37E-08 | |||||
| 29 | 1.73E-08 | |||||
| 30 | 5.19E-08 | |||||
| 31 | 3.32E-08 | |||||
| 32 | 7.41E-08 | 7.7E-08 | ||||
| 33 | 5.41E-08 | 2.09E-08 | 9.94E-08 | |||
| 34 | 8.44E-08 | 3.27E-08 | 2.73E-08 | 4.06E-08 | 1.09E-07 | |
| 35 | 5.16E-08 | 5.68E-08 | 1.95E-08 | 5.25E-08 | 5.41E-08 | |
| 36 | 3.91E-08 | 3.05E-08 | 1.48E-08 | 2.1E-08 | 1.06E-07 | |
| 37 | 6.71E-08 | 3.1E-08 | 2.09E-08 | 3.67E-08 | 1.55E-07 | |
| 38 | 5.17E-08 | 2.59E-08 | 2.01E-08 | 5.41E-08 | 8.06E-08 | |
| 39 | 4.86E-08 | 4.27E-08 | 2.03E-08 | 3.85E-08 | 5.39E-08 | |
| 40 | 8.54E-08 | 1.32E-07 | 2.34E-08 | 3.58E-08 | 1.15E-07 | |
| 41 | 7.53E-08 | 1.42E-07 | 3.54E-08 | 7.06E-08 | 1.64E-07 | |
| 42 | 6.64E-08 | 2.59E-08 | 2.86E-08 | 7.47E-08 | 9.21E-08 | |
| 43 | 7.76E-08 | 5.95E-08 | 3.14E-08 | 1.43E-07 | 1.1E-07 | |
| 44 | 1.34E-08 | 5.85E-08 | 3.29E-08 | 6.41E-08 | 8.87E-08 | |
| 45 | 9.09E-08 | 2.86E-08 | 2.65E-08 | 6.63E-08 | 7.1E-08 | |
| 46 | 7.42E-08 | 3.02E-08 | 2.19E-08 | 4.6E-08 | 4.46E-08 | 7.21E-08 |
| 47 | 7.91E-08 | 9.51E-08 | 3.32E-08 | 2.81E-08 | 4.19E-08 | 8.79E-08 |
| 48 | 7.36E-08 | 8.2E-08 | 4.04E-08 | 4.46E-08 | 1.07E-07 | 1.38E-07 |
| 49 | 7.53E-08 | 6.45E-08 | 4.56E-08 | 2.18E-08 | 1.08E-07 | 1.26E-07 |
| 50 | 7.57E-08 | 1.62E-08 | 2.41E-08 | 1.73E-08 | 9.56E-08 | 4.48E-08 |
| 51 | 7.73E-08 | 1.59E-08 | 2.13E-08 | 3.1E-08 | 1.42E-07 | 1.03E-07 |
| 52 | 7.52E-08 | 8.4E-09 | 2.73E-08 | 2.15E-08 | 1.02E-07 | 7.98E-08 |
| 53 | 7.35E-08 | 6.19E-08 | 2.03E-08 | 8.04E-08 | 1.77E-07 | 8.43E-08 |
| 54 | 7.69E-08 | 2.72E-08 | 2.6E-08 | 2.87E-08 | 1.83E-07 | 3.31E-07 |
| 55 | 7.29E-08 | 6.56E-08 | 3.92E-08 | 6.61E-08 | 1.5E-07 | 1.06E-07 |
| 56 | 7.43E-08 | 4.48E-08 | 2.1E-08 | 1.78E-08 | 1.96E-07 | 2.2E-07 |
| 57 | 6.9E-08 | 3.74E-08 | 4.99E-08 | 3.45E-08 | 1.38E-07 | 1.21E-07 |
| 58 | 6.85E-08 | 1.17E-08 | 3.94E-08 | 3.5E-08 | 1.26E-07 | 2.9E-07 |
| 59 | 7.42E-08 | 1.75E-08 | 1.9E-08 | 4.19E-08 | 1.83E-07 | 2.78E-07 |
| 60 | 6.63E-08 | 1.4E-08 | 2.86E-08 | 6.44E-08 | 1.21E-07 | 1.55E-07 |
| 61 | 6.78E-08 | 1.35E-08 | 4.18E-08 | 3.67E-08 | 9.63E-08 | 1.36E-07 |
| 62 | 7.27E-08 | 2.79E-08 | 3.71E-08 | 4.12E-08 | 2.35E-07 | 1.09E-07 |
| 63 | 6.77E-08 | 1.46E-08 | 3.27E-08 | 4.15E-08 | 1.84E-07 | 9.09E-08 |
| 64 | 6.47E-08 | 1.53E-08 | 2.33E-08 | 5.02E-08 | 6.57E-08 | 1.34E-07 |
| 65 | 6.4E-08 | 3.51E-08 | 2.4E-08 | 2.84E-08 | 1.02E-07 | 8.79E-08 |
| 66 | 5.54E-08 | 3.04E-08 | 2.04E-08 | 4.47E-08 | 7.25E-08 | 1.44E-07 |
| 67 | 5.42E-08 | 9.3E-09 | 3.45E-08 | 9.01E-08 | 2.09E-07 | 2.26E-07 |
| 68 | 4.9E-08 | 1.18E-08 | 2.62E-08 | 4.79E-08 | 3.18E-07 | 1.32E-07 |
| 69 | 4.37E-08 | 1.19E-08 | 2.33E-08 | 1.94E-08 | 1.36E-07 | 2.38E-07 |
| 70 | 6.76E-08 | 3.03E-08 | 2.41E-08 | 2.51E-08 | 1.08E-07 | 1.68E-07 |
| 71 | 6.01E-08 | 5.07E-08 | 3.06E-08 | 6.19E-08 | 2.27E-07 | 1.42E-07 |
| 72 | 5.06E-08 | 1.25E-08 | 6E-08 | 4.87E-08 | 2.1E-07 | 2.24E-07 |
| 73 | 6.61E-08 | 2.96E-08 | 5.51E-08 | 3.05E-08 | 2.17E-07 | 2.33E-07 |
| 74 | 4.71E-08 | 1.28E-08 | 6.08E-08 | 4.4E-08 | 1.96E-07 | 1.16E-07 |
| 75 | 5.7E-08 | 1.94E-08 | 4E-08 | 3.17E-08 | 1.34E-07 | 2.72E-07 |
| 76 | 4.59E-08 | 1.51E-08 | 2.46E-08 | 8.88E-08 | 1.28E-07 | 7.98E-08 |
| 77 | 3.23E-08 | 3.55E-08 | 4.09E-08 | 3.57E-07 | 6.25E-08 | |
| 78 | 2.04E-08 | 7.46E-08 | 4.16E-07 | 5.91E-08 | ||
| 79 | 1.88E-08 | 2.19E-08 | 2.65E-07 | |||
| 80 | 1.47E-08 | 3.08E-08 | 1.21E-07 | |||
| 81 | 1.82E-08 | 3.61E-08 | 9.07E-08 | |||
| 82 | 1.43E-08 | 2.6E-08 | 2.35E-07 | |||
| 83 | 1.14E-08 | 1.31E-07 | 1.58E-07 | |||
| 84 | 8.4E-09 | 4.2E-08 | 1.43E-07 | |||
| 85 | 2.63E-08 | 3.9E-08 | 8.38E-08 | |||
| 86 | 1.89E-08 | 1.45E-08 | 8.35E-08 | |||
| 87 | 5.54E-08 | 3.68E-08 | 1.35E-07 | |||
| 88 | 3.29E-08 | 2.39E-08 | 1.69E-07 | |||
| 89 | 2.89E-08 | 4.68E-08 | 1.2E-07 | |||
| 90 | 1.61E-08 | 6.98E-08 | 1.42E-07 | |||
| 91 | 1.54E-08 | 3.21E-08 | 8.26E-08 | |||
| 92 | 9.72E-08 | 7.71E-08 | 1.19E-07 | |||
| 93 | 1.6E-08 | 6.55E-08 | 1.24E-07 | |||
| 94 | 1.08E-08 | 1.93E-08 | 3.24E-07 | |||
| 95 | 2.05E-08 | 2.3E-08 | 1.46E-07 | |||
| 96 | 2.15E-08 | 3.88E-08 | 5.36E-08 | |||
| 97 | 1.22E-08 | 6.06E-08 | 2.74E-07 | |||
| 98 | 2.44E-08 | 6.61E-08 | 9.82E-08 | |||
| 99 | 3.78E-08 | 1.27E-07 | ||||
| 100 | 3.24E-08 | 9.9E-08 | ||||
| 101 | 1.51E-08 | |||||
| 102 | 2.17E-08 | |||||
| 103 | 2.5E-08 | |||||
| 104 | 3.2E-08 | |||||
| 105 | 4.73E-08 | |||||
| 106 | 2.37E-08 | |||||
| 107 | 2.06E-08 | |||||
| 108 | 1.64E-08 | |||||
| 109 | 1.43E-08 | |||||
| 110 | 1.51E-08 | |||||
| 111 | 2.1E-08 | |||||
| 112 | 2.18E-08 | |||||
| 113 | 1.07E-08 | |||||
| 114 | 1.15E-08 | |||||
| 115 | 1.37E-08 | |||||
| 116 | 1.28E-08 | |||||
| 117 | 1.43E-08 | |||||
| 118 | 1.18E-08 | |||||
| Average velocity (cm/s) | 6.49E-08 | 3.22E-08 | 3.07E-08 | 4.61E-08 | 1.61E-07 | 1.37E-07 |
| Maximum velocity (cm/s) | 9.09E-08 | 1.42E-07 | 6.08E-08 | 1.43E-07 | 4.16E-07 | 3.31E-07 |
| Minimum velocity (cm/s) | 1.34E-08 | 8.4E-09 | 1.48E-08 | 1.45E-08 | 4.19E-08 | 4.48E-08 |
| Average Permeability coefficient (cm/s) | 3.9E-07 | 4.65E-08 | 1.84E-07 | 2.77E-07 | 9.55E-08 | 1.18E-07 |
| Maximum Permeability coefficient (cm/s) | 5.46E-07 | 2.06E-07 | 3.65E-07 | 8.55E-07 | 2.46E-07 | 2.84E-07 |
| Minimum Permeability coefficient (cm/s) | 8.04E-08 | 1.19E-08 | 8.88E-08 | 8.7E-08 | 2.48E-08 | 3.84E-08 |
| Seepage section | 1.38E+00 | 1.70E+00 | 6.83E-01 | 1.55E+00 | 2.73E+00 | 4.78E+00 |
| Seepage direction | 175-224 | 108-155 | 187-231 | 126-168 | 160-214 | 145-193 |
Table A3.
This is a statistical table of seepage parameter measurements from boreholes SW1 to SW3 at the Beishan site: flow velocity (cm/s) and flow rate (cm³/s).
Table A3.
This is a statistical table of seepage parameter measurements from boreholes SW1 to SW3 at the Beishan site: flow velocity (cm/s) and flow rate (cm³/s).
| Depth (m) | SW1 | SW2 | SW3 |
|---|---|---|---|
| 1 | 7.68E-08 | 6.08E-08 | 6.02E-08 |
| 1.5 | 8.94E-08 | 6.47E-08 | 5.91E-08 |
| 2 | 6.42E-08 | 6.15E-08 | 6.01E-08 |
| 2.5 | 6.42E-08 | 6.03E-08 | 1.28E-07 |
| 3 | 5.83E-08 | 6.28E-08 | 1.57E-07 |
| 3.5 | 6.28E-08 | 6.82E-08 | 1.63E-07 |
| 4 | 5.92E-08 | 6.64E-08 | 1.05E-07 |
| 4.5 | 8.63E-08 | 6.96E-08 | 1.20E-07 |
| 5 | 6.16E-08 | 1.26E-07 | 1.57E-07 |
| 5.5 | 6.37E-08 | 8.69E-08 | 9.16E-08 |
| 6 | 5.76E-08 | 7.94E-08 | 9.85E-08 |
| 6.5 | 6.28E-08 | 7.22E-08 | 6.05E-08 |
| 7 | 8.13E-08 | 6.67E-08 | 5.98E-08 |
| 7.5 | 6.11E-08 | -- | -- |
| 8 | 6.03E-08 | -- | -- |
| 8.5 | 6.67E-08 | -- | -- |
| 9 | 6.00E-08 | -- | -- |
| 9.5 | 7.66E-08 | -- | -- |
| 10 | 6.42E-08 | -- | -- |
| Average velocity (cm/s) | 6.72E-08 | 7.27E-08 | 1.02E-07 |
| Maximum velocity (cm/s) | 8.94E-08 | 1.26E-07 | 1.63E-07 |
| Minimum velocity (cm/s) | 5.76E-08 | 6.03E-08 | 5.91E-08 |
| Seepage Section (cm/s) | 6.39E-01 | 4.73E-01 | 6.60E-01 |
| Seepage direction | 200-326 | 138-251 | 176-271 |
References
- Moore H E , Comas X , Briggs M A , et al. Indications of preferential groundwater seepage feeding northern peatland pools. Journal of Hydrology, 2024, 638, 1-16. [CrossRef]
- Joris C. S., Sjoerd E.A.T.M van der Zee, Thomas K. T., et al. Groundwater seepage causes surface runoff and erosion during snowmelt in a tile-drained agricultural catchment: Field observations and modelling analysis, CATENA, 2023, 220, 106680. [CrossRef]
- Deng Long-chuan, Li Xiao-zhao, Wu Yun, et al. Study on water conductivity characteristics of different scale structure surfaces in beishan site area. Journal of Engineering Geology, 2021, 29(1), 77-85. [CrossRef]
- Wang T., He Y., Wu Z., et al. A study on impacts of groundwater seepage on artificial freezing process of gravel strata. Railway Sciences, 2023, 2(1), 1–12. [CrossRef]
- Zhou Zhi-fang, Wang Zhe, Li Ya-bing, et al. Calculating the permeability parameters of the staggered zone based on the nonlinear flow simulation of the high pressure packer test. Journal of Engineering Geology, 2021, 29(1), 197-204. [CrossRef]
- Bae J., Sherman D. J.. Microscale Morphologic Changes Caused by Groundwater Seepage on a Macrotidal Beach. Journal of Coastal Research, 2025, 41(1), 16–26. [CrossRef]
- Duan Lei. Wang Wen-ke. Water Isotope Technology for Tracing Groundwater Movement. Ground Wate, 2006, 28(2), 33-36.
- Povinec P. P., Bokuniewicz H., Burnett W. C., et al. Isotope tracing of submarine groundwater discharge offshore Ubatuba, Brazil: results of the IAEA-UNESCO SGD project. Journal of Environmental Radioactivity, 2008, 99(10), 1596-1610. [CrossRef]
- Chen, J., Dong, H. Study of fissured-rock seepage flow with isotope tracer method in single borehole. Science in China Series E: Technological Sciences. 2001, 44 (Suppl 1), 108–113. [CrossRef]
- Paul W. Reimus, Bill W. Arnold. Evaluation of multiple tracer methods to estimate low groundwater flow velocities, Journal of Contaminant Hydrology, 2017, 199, 1-13. [CrossRef]
- Hamed Y., Ahmadi R., Demdoum A., et al. Use of geochemical, isotopic, and age tracer data to develop models of groundwater flow: A case study of Gafsa mining basin-Southern Tunisia. Journal of African Earth Sciences, 2014, 100(6), 418-436. [CrossRef]
- Gao Zheng-xia, Xu Jun-hai, Wang Jian-ping, et al. Isotope technology and its application to measurement of groundwater velocity. Journal of Hehai University(Natural Sciences), 2003, 31(6), 655-658.
- J.F. Devlin, P.C. Schillig, I. Bowen, et al. Applications and implications of direct groundwater velocity measurement at the centimetre scale. Journal of Contaminant Hydrology, 2012, 127(1–4), 3-14. [CrossRef]
- Makhlouf I., Guellala R., Lasmar R. B., et al. Contribution to Groundwater Research in the World’s Largest Hot Desert: Hydrogeophysical Study for the Apprehension of the Jurassic Aquifer in the Tunisian “Sahara”. Natural Resources Research, 2024, 33(4), 1549-1571. [CrossRef]
- Vilarinho G. X., Borges W. R., Santos M. H. L., et al. Groundwater level variation analysis using hydrogeophysical methods in an area of campo sujo in cerrado, chapada dos veadeiros region, gois. Brazilian Journal of Geophysics, 2023, 41(1), 1-25.
- Fan Jing-long, Xu Xin-wen, Lei Jia-qiang, et al. Measuring the velocity and direction of groundwater along Tarim Desert Highway. Geotechnical Investigation & Surveying, 2009, 37(8), 51-55. [CrossRef]
- Fu Yun-mei, Dong Yan-hui, Xie Yue-qing, et al. Characterizing groundwater flow in fractured rock using fiber-optic distributed temperature sensing and numerical modeling. Journal of Engineering Geology, 2022, 30(4), 1257-1265. [CrossRef]
- Hasan M. J., Kannan S., Rohan A., et al. Exploring the feasibility of affordable sonar technology: object detection in underwater environments using the ping 360. arXiv, 2024, [eess.IV]. [CrossRef]
- Sternlicht D., Pesaturo J. F.. Synthetic aperture sonar: Frontiers in underwater imaging. Sea Technology, 2004, 45(11), 27-32. [CrossRef]
- Al-Khatib H., Antonelli G., Caffaz A., et al. Navigation, guidance and control of underwater vehicles within the widely scalable mobile underwater sonar technology project: An overview. IFAC-PapersOnLine, 2015, 48, 189-193. [CrossRef]
- Gerlotto F., Georgakarakos S., Peter K. E.. The application of multibeam sonar technology for quantitative estimates of fish density in shallow water acoustic surveys. Aquatic Living Resources, 2001, 13(5), 385-393. [CrossRef]
- Z. Yoshida, A. Asada, Y. Ikeda, et al. High precision survey by the multibeam sonar in the dam site. IEEE Techno-Ocean ‘04 (IEEE Cat. No.04CH37600), Kobe, Japan, 2004, 2, 1133-1138. [CrossRef]
- Koshiba T., Kiyono Y., Murakami K., et al. Possibility of Driftwood Detection in a Dam Reservoir with a Narrow Multi-Beam Sonar System. Journal of Japan Society of Dam Engineers, 2022, 32(1), 4-15. [CrossRef]
- Tan J., Wang M., Tian J., et al. Research on dam leakage detection based on visual and acoustic integration: a case study of CFRD. IOP Conference Series Earth and Environmental Science, 2020, 525, 012053. [CrossRef]
- Cao Y., Xu C., Li J., et al. Underwater Gas Leakage Flow Detection and Classification Based on Multibeam Forward-Looking Sonar. Journal of Marine Science and Application, 2024, 23(3), 674-687. [CrossRef]
- Ma Y., Wang S., Xin G., et al. A state-of-the-art-review of underground concrete sewage pipelines detection technologies. Measurement, 2025, 242, Part E, 116268. [CrossRef]
- Fujimoto T., Awaga K.. Electric-double-layer field-effect transistors with ionic liquids. Physical Chemistry Chemical Physics, 2013, 15(23), 8983-9006. [CrossRef]
- Ishikawa M., Sakamoto A., Morita M., et al. Effect of treatment of activated carbon fiber cloth electrodes with cold plasma upon performance of electric double-layer capacitors. Journal of Power Sources, 1996, 60(2), 233-238. [CrossRef]
- SHI Kunfa. Seismo-electric effect theory and preliminary experimental results. Chinese Journal of Geophysics, 2001, 44(5), 720-728. [CrossRef]
- Das S., Chakraborty S.. Effect of conductivity variations within the electric double layer on the streaming potential estimation in narrow fluidic confinements. Langmuir, 2010, 26(13), 11589-11596. [CrossRef]
- Lu F , Yang J , Kwok D Y . Flow Field Effect on Electric Double Layer during Streaming Potential Measurements. Journal of Physical Chemistry B, 2004, 108(39), 14970-14975. [CrossRef]
- Du Guo-ping, Du Jia-jia, Song Xiao-feng, et al. 3D Velocity Vector Sonar Measurement System. Chinese Journal of Engineering Geophysics, 2019, 16(3), 359-367.
- Mingyao Yu, Suo Zhong Chen, Chu Yu Chen. Study on function zoning and evaluation of shallow groundwater in Jinjiang city. Applied Mechanics and Materials, 2015, 675-677, 830-841. [CrossRef]
- Du Jia-jia, Lu Jian-feng, Wang Zhen, et al. Control Technology of Sonar Seepage in Deep Foundation Excavation of Wuhan Green Land International Financial Center. Construction Technique, 2018, 47(1), 6-10.
- Cao Xiao-yuan, Hou De-yi, Hu Li-tang. Gansu beishan area groundwater flow numerical simulation study. Hydrogeology engineering geology, 2020, 47(2), 9-16. [CrossRef]
- Guo Yong-hai, Yang Tian-xiao, Liu Shu-fen. Hydrogeological characteristics of Beishan preselected area, Gansu province for China’s high-level radioactive waste repository. Uranium Geology, 2001, 17(3), 184-189.
- Su Wei, Liu Cai, Chen Chen. Progress of seism electric in theory and research. Chinese Journal of Geophysics, 2006, 21(2), 379-385.
- Wu Xiao-rong, Zhu Xuan. Application of Micro-seepage Field Detection in Reservoir Leakage Treatment. 8th International Conference on Hydraulic and Civil Engineering: Deep Space Intelligent Development and Utilization Forum (ICHCE), Xi’an, China, 2022, 366-369. [CrossRef]
- Tan Jie-xiong, Du Guo-ping, Gao Da-shui, et al. Application of sonar in seepage detection of Baiyun Hydropower Station. Yangtze River, 2013, 43(1), 36-37.
- Gao Da-shui, Chen Yan, Du Guo-ping. Application of sonar-seepage detection technology in sluices projects. Yangtze River, 2016, 47(5), 73-75.
- Zhu Min, Guo Xiao-gang, Deng Zhi-chao. Application of 3D sonar seepage detecting technology in deep foundation pit projects: Case of anchorage base of Miaozui Yangtze River Bridge at Yichang, Hubei. Yangtze River, 2015, 46(17), 43-45.
- Yin Chao-fan, Feng Yan-ling, Gu Jun, et al. Construction Technology of the Sonar Detection for Diaphragm Wall Joints before Excavation. Construction Technology, 2016, 45(s1), 71-75.
Figure 1.
Schematic diagram of Double-Layer Seismic Electric Effect. (a) P-wave propagation in homogeneous porous media; (b) Water flow transport at the grain scale; (c) Seismoelectric effects at the pore scale; (d) Surface charge characteristics of rock grains; (e) Electrical double-layer structure.
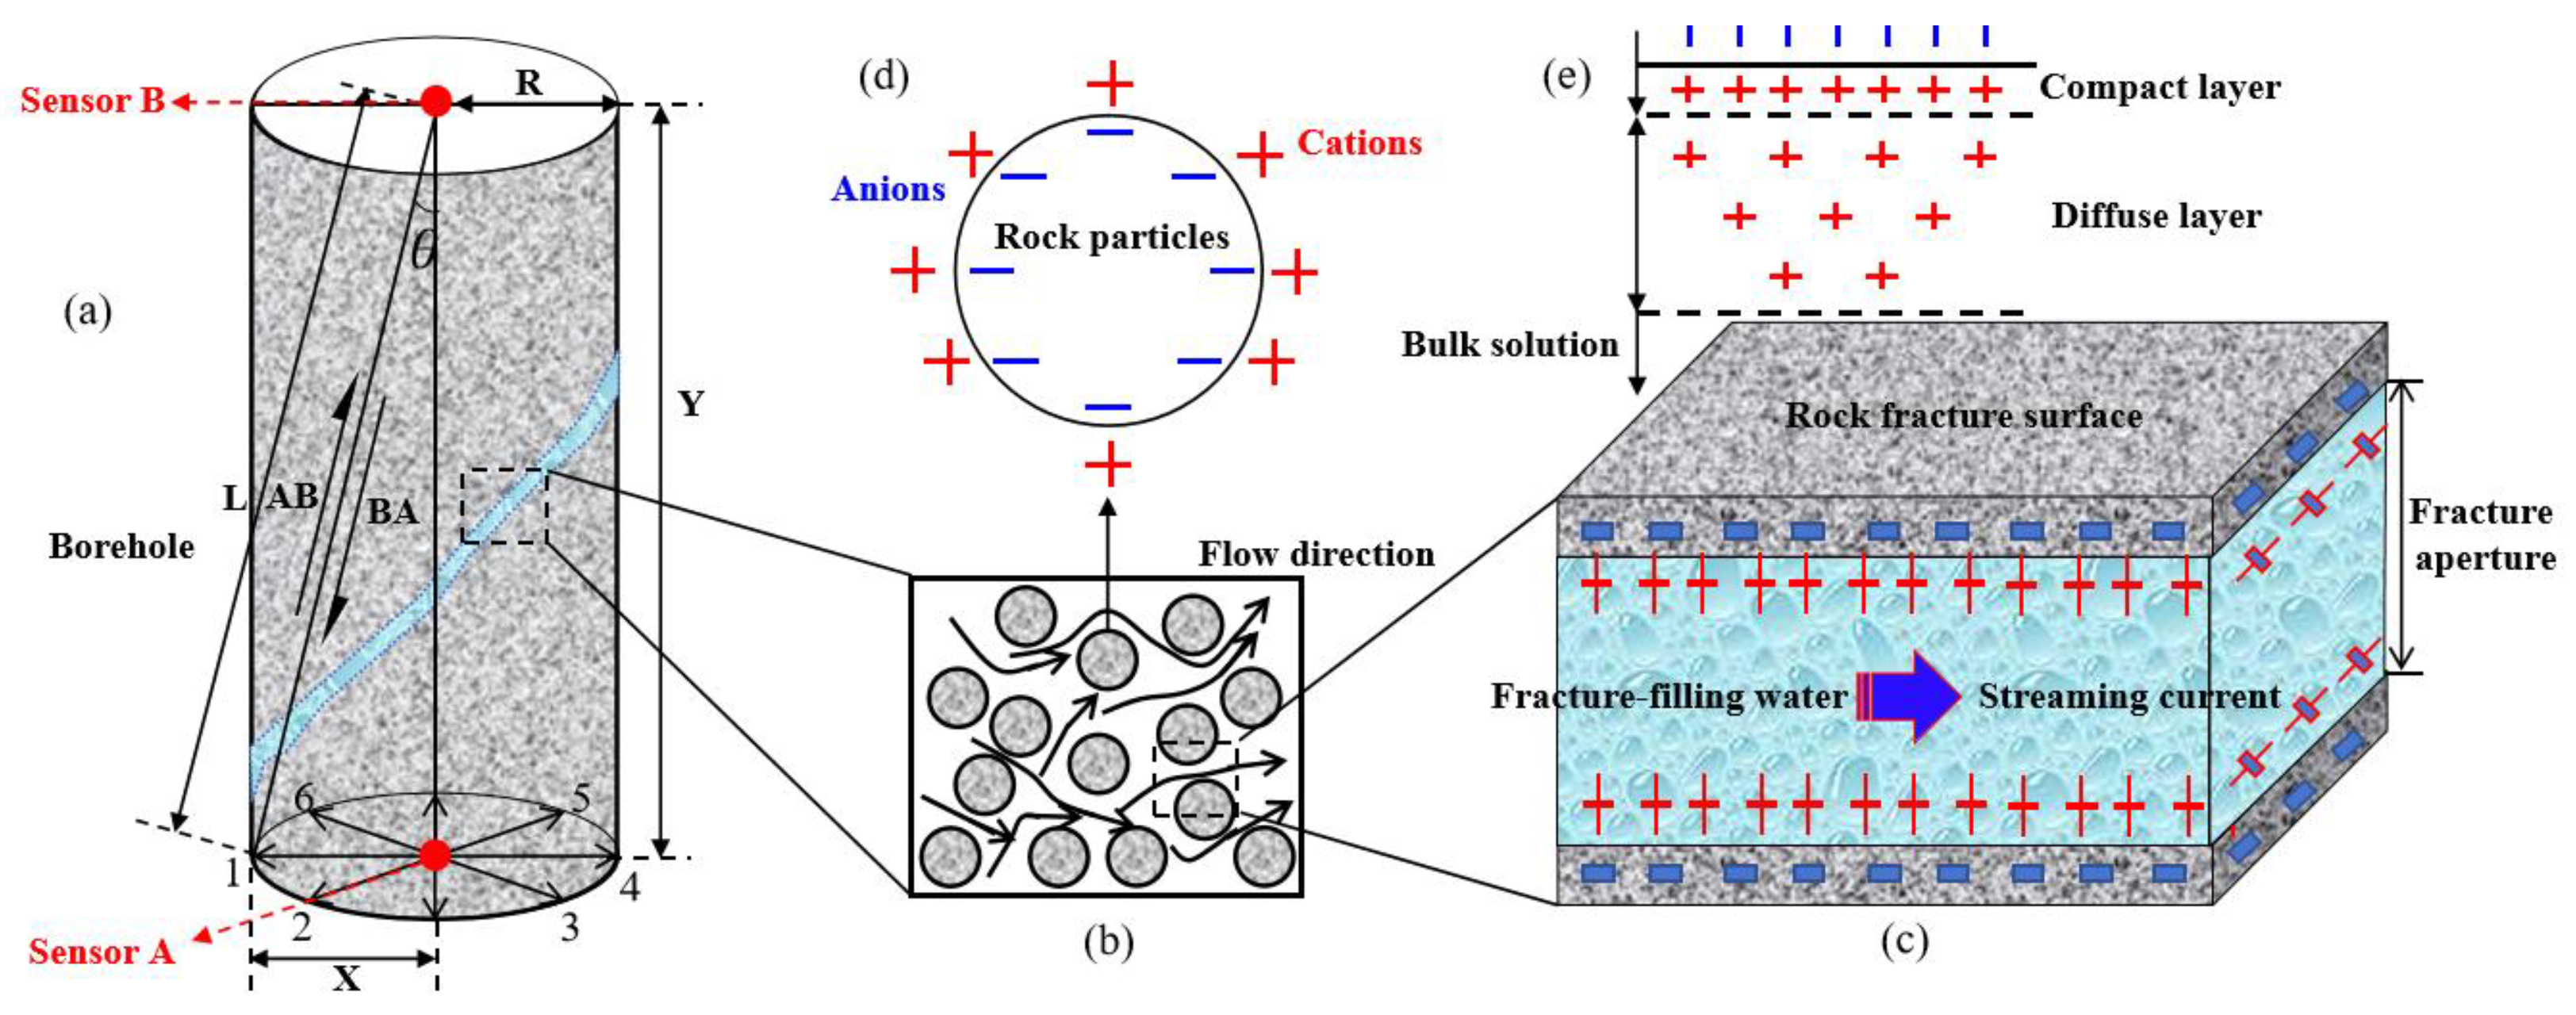
Figure 2.
Digital elevation and hydrographic distribution map of the xinchang site for the underground research laboratory of the high-level radioactive waste repository in Beishan mountain, Yumen city, Jiuquan city, Gansu province.
Figure 2.
Digital elevation and hydrographic distribution map of the xinchang site for the underground research laboratory of the high-level radioactive waste repository in Beishan mountain, Yumen city, Jiuquan city, Gansu province.
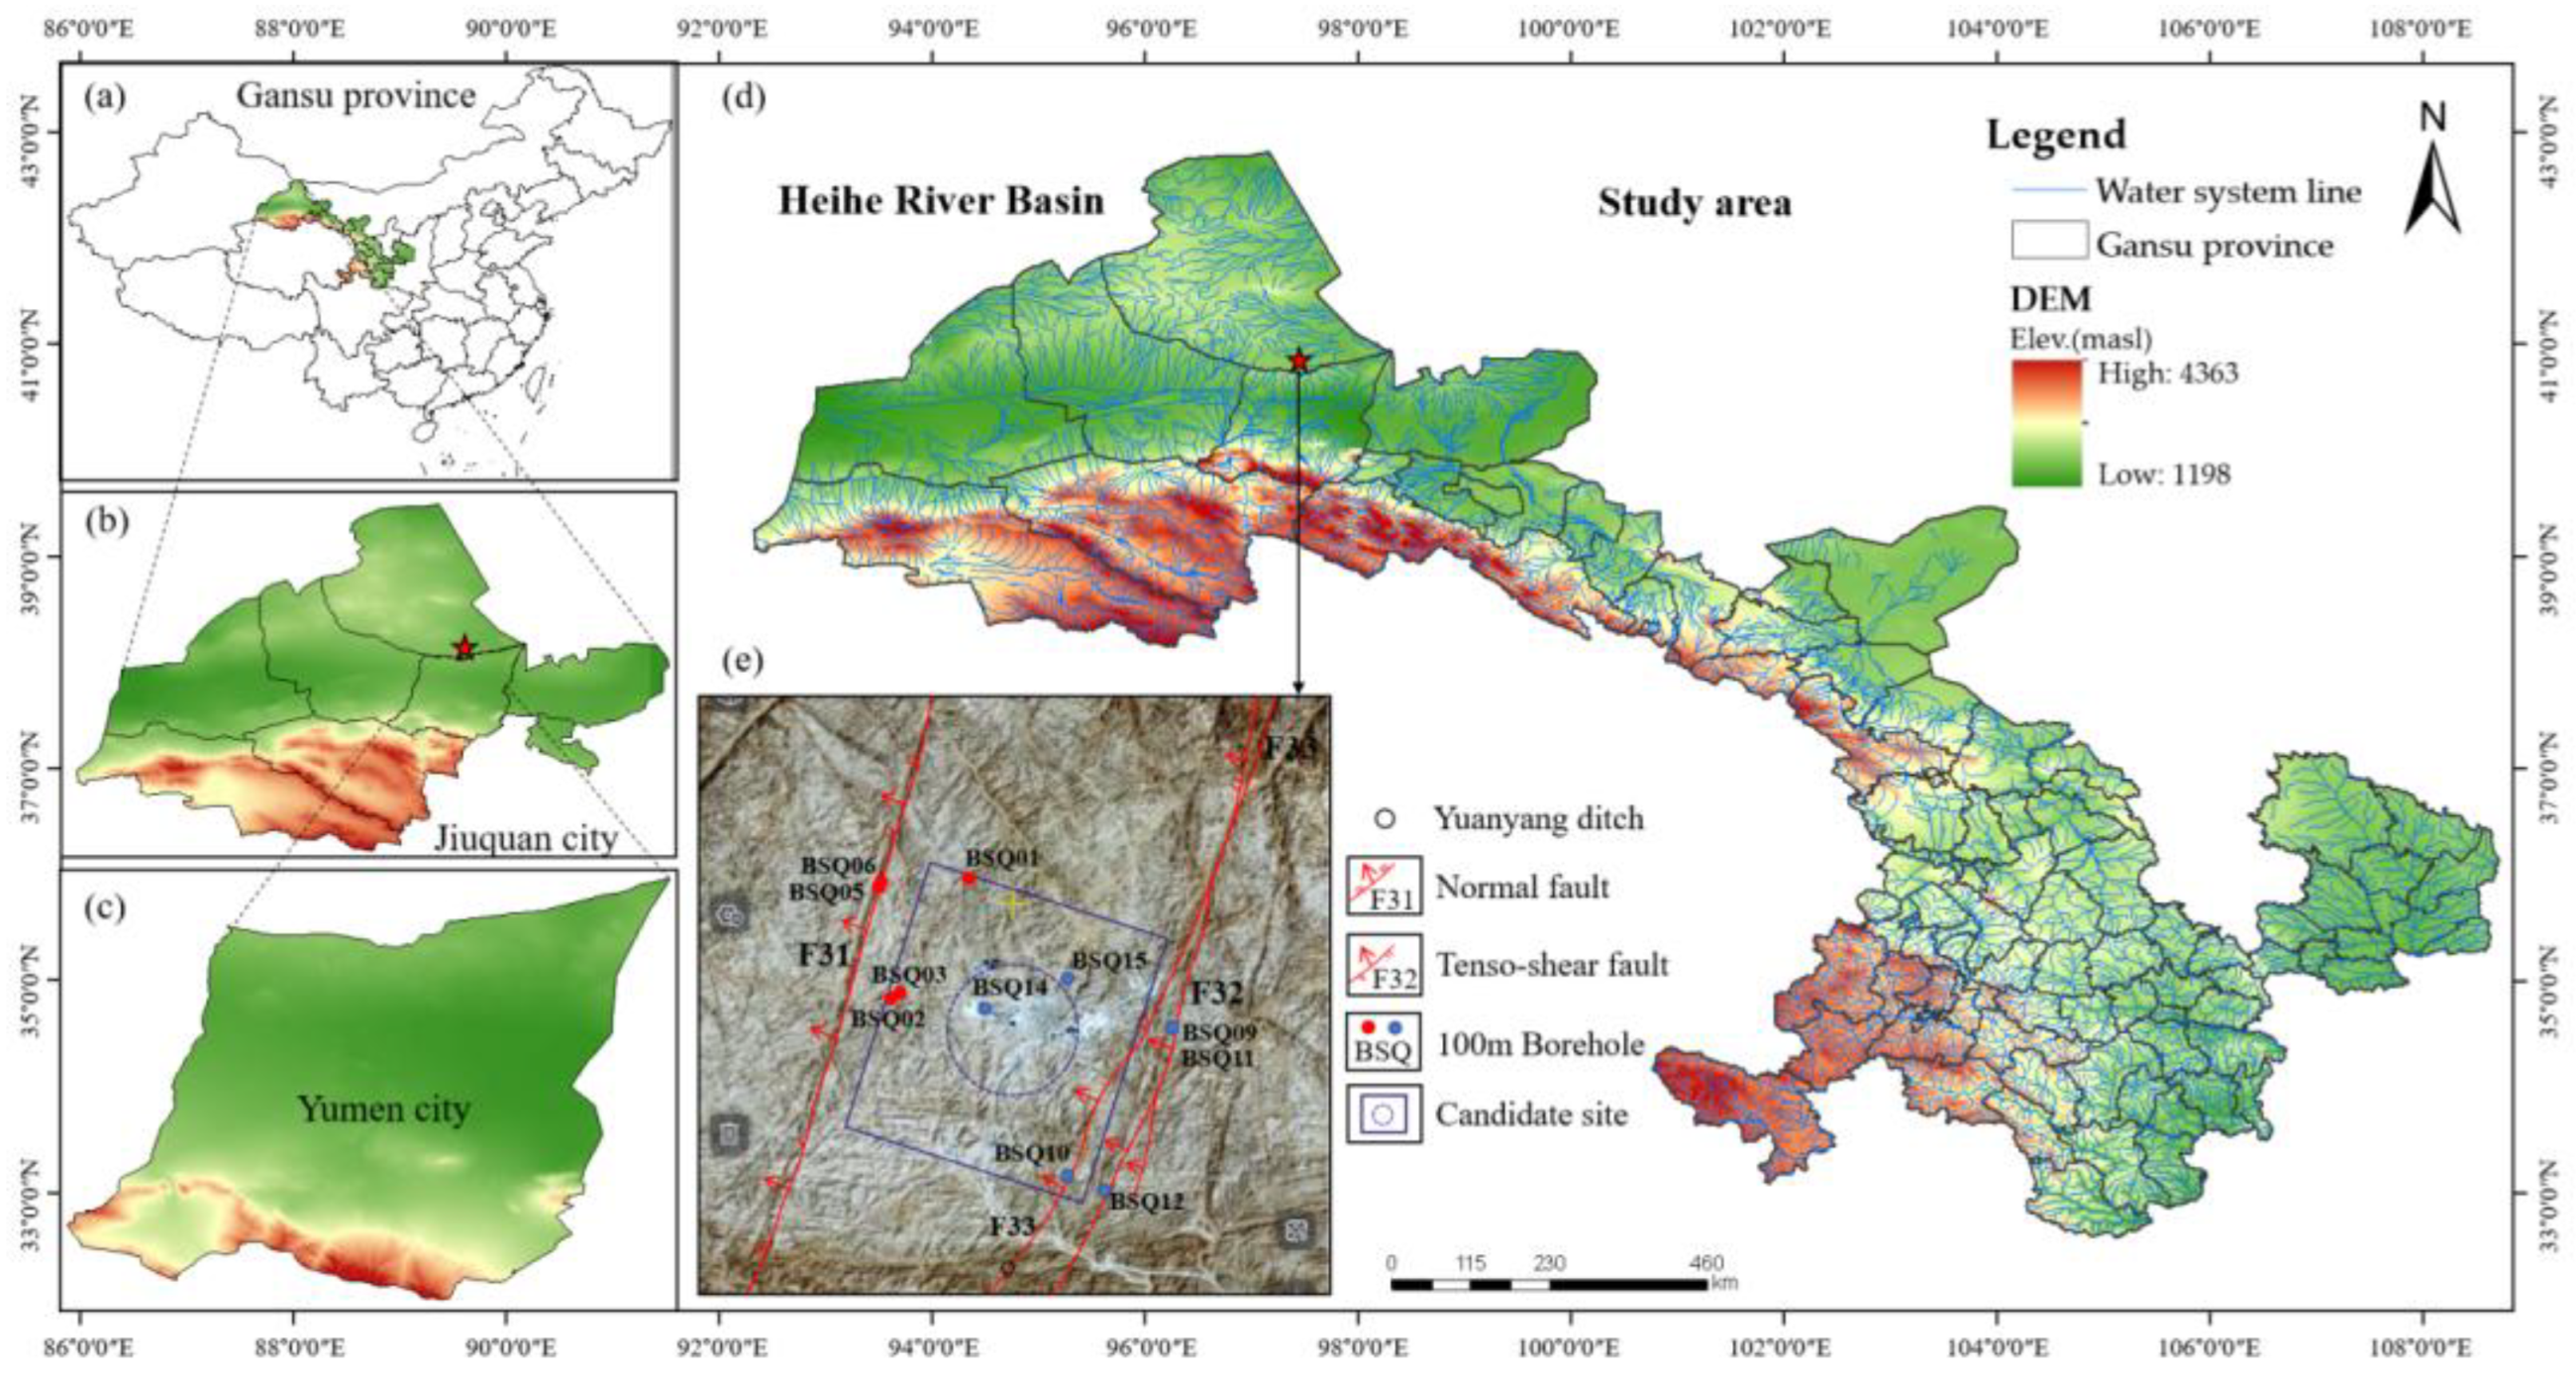
Figure 3.
This is a figure of hydrological conditions of Xinchang site (accroding to Guo et al. [36]). (a) Planation Surface: A broad, nearly level geomorphic surface formed under long-term tectonic stability of the crust; (b) Knick Point: A location on a river’s longitudinal profile where the gradient abruptly increases, typically indicating tectonic uplift or lithological variation; (c) Erosion Mountains: Mountain landforms primarily shaped by long-term erosional processes; (d) Qp: Pleistocene sedimentary deposits; (e) Qh: Holocene sedimentary deposits; (f) Inj: Intrusive igneous body.
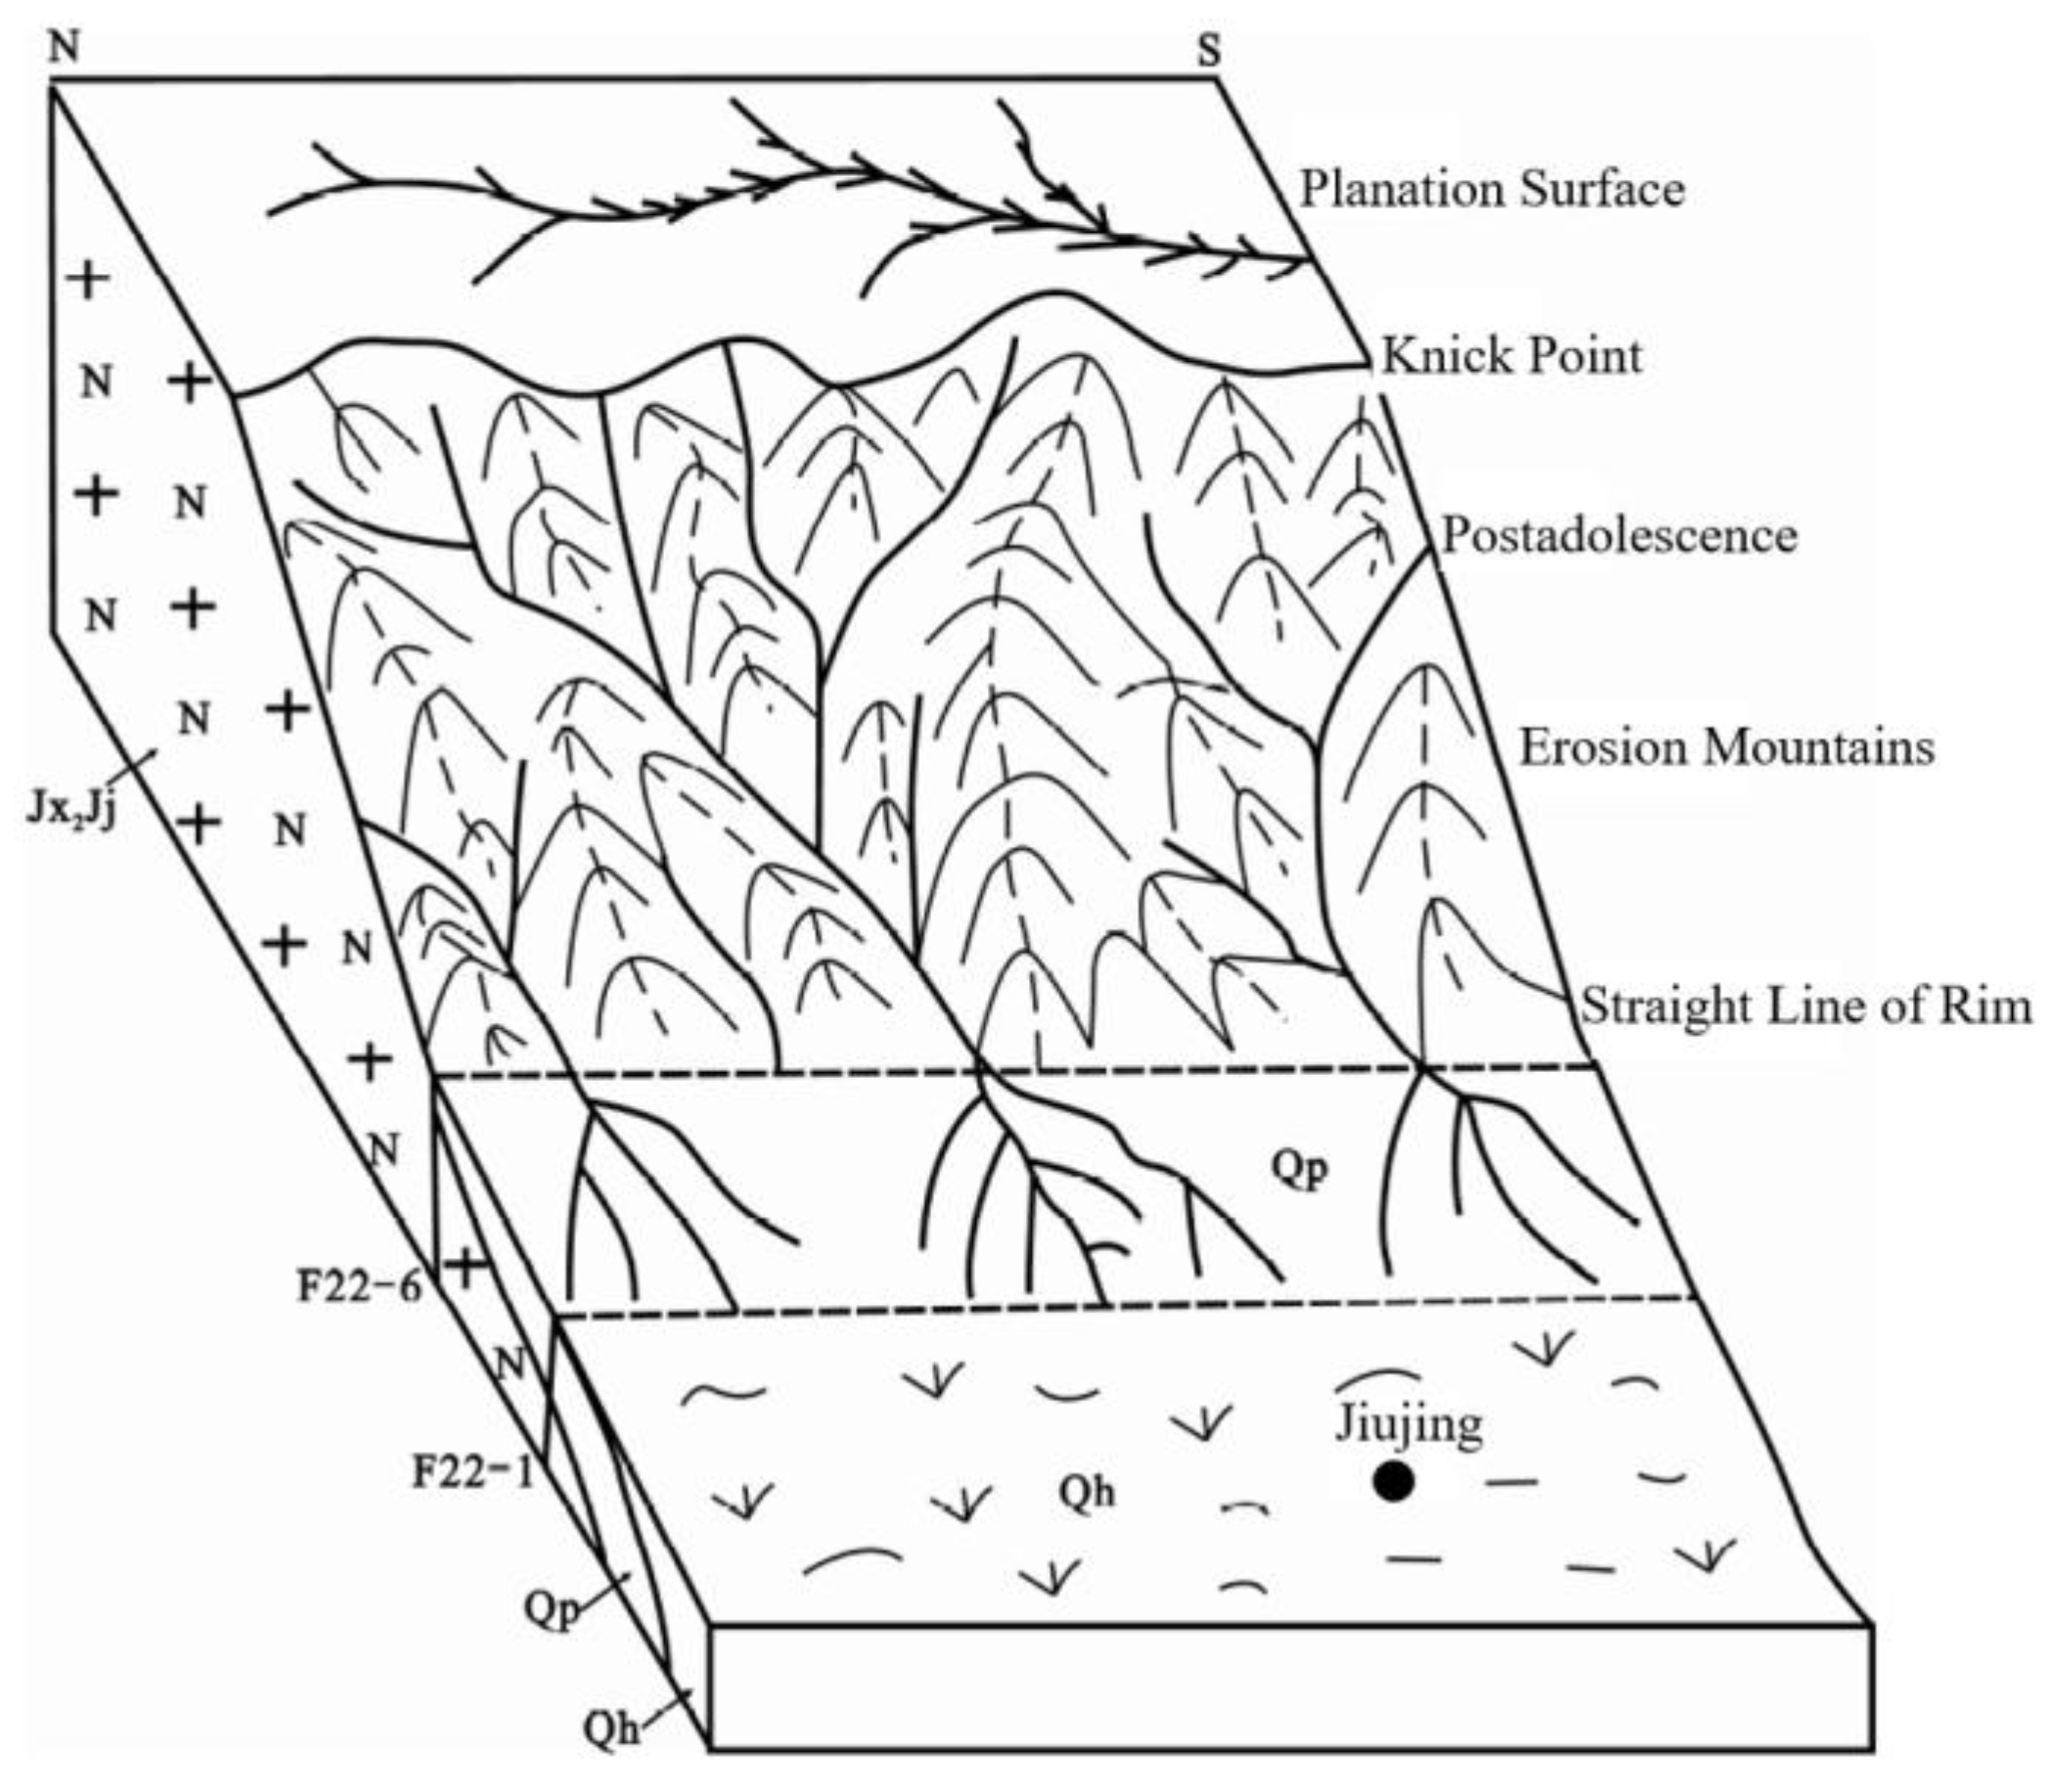
Figure 4.
Location of 3D sonar testiong boreholes in Xinchang area.
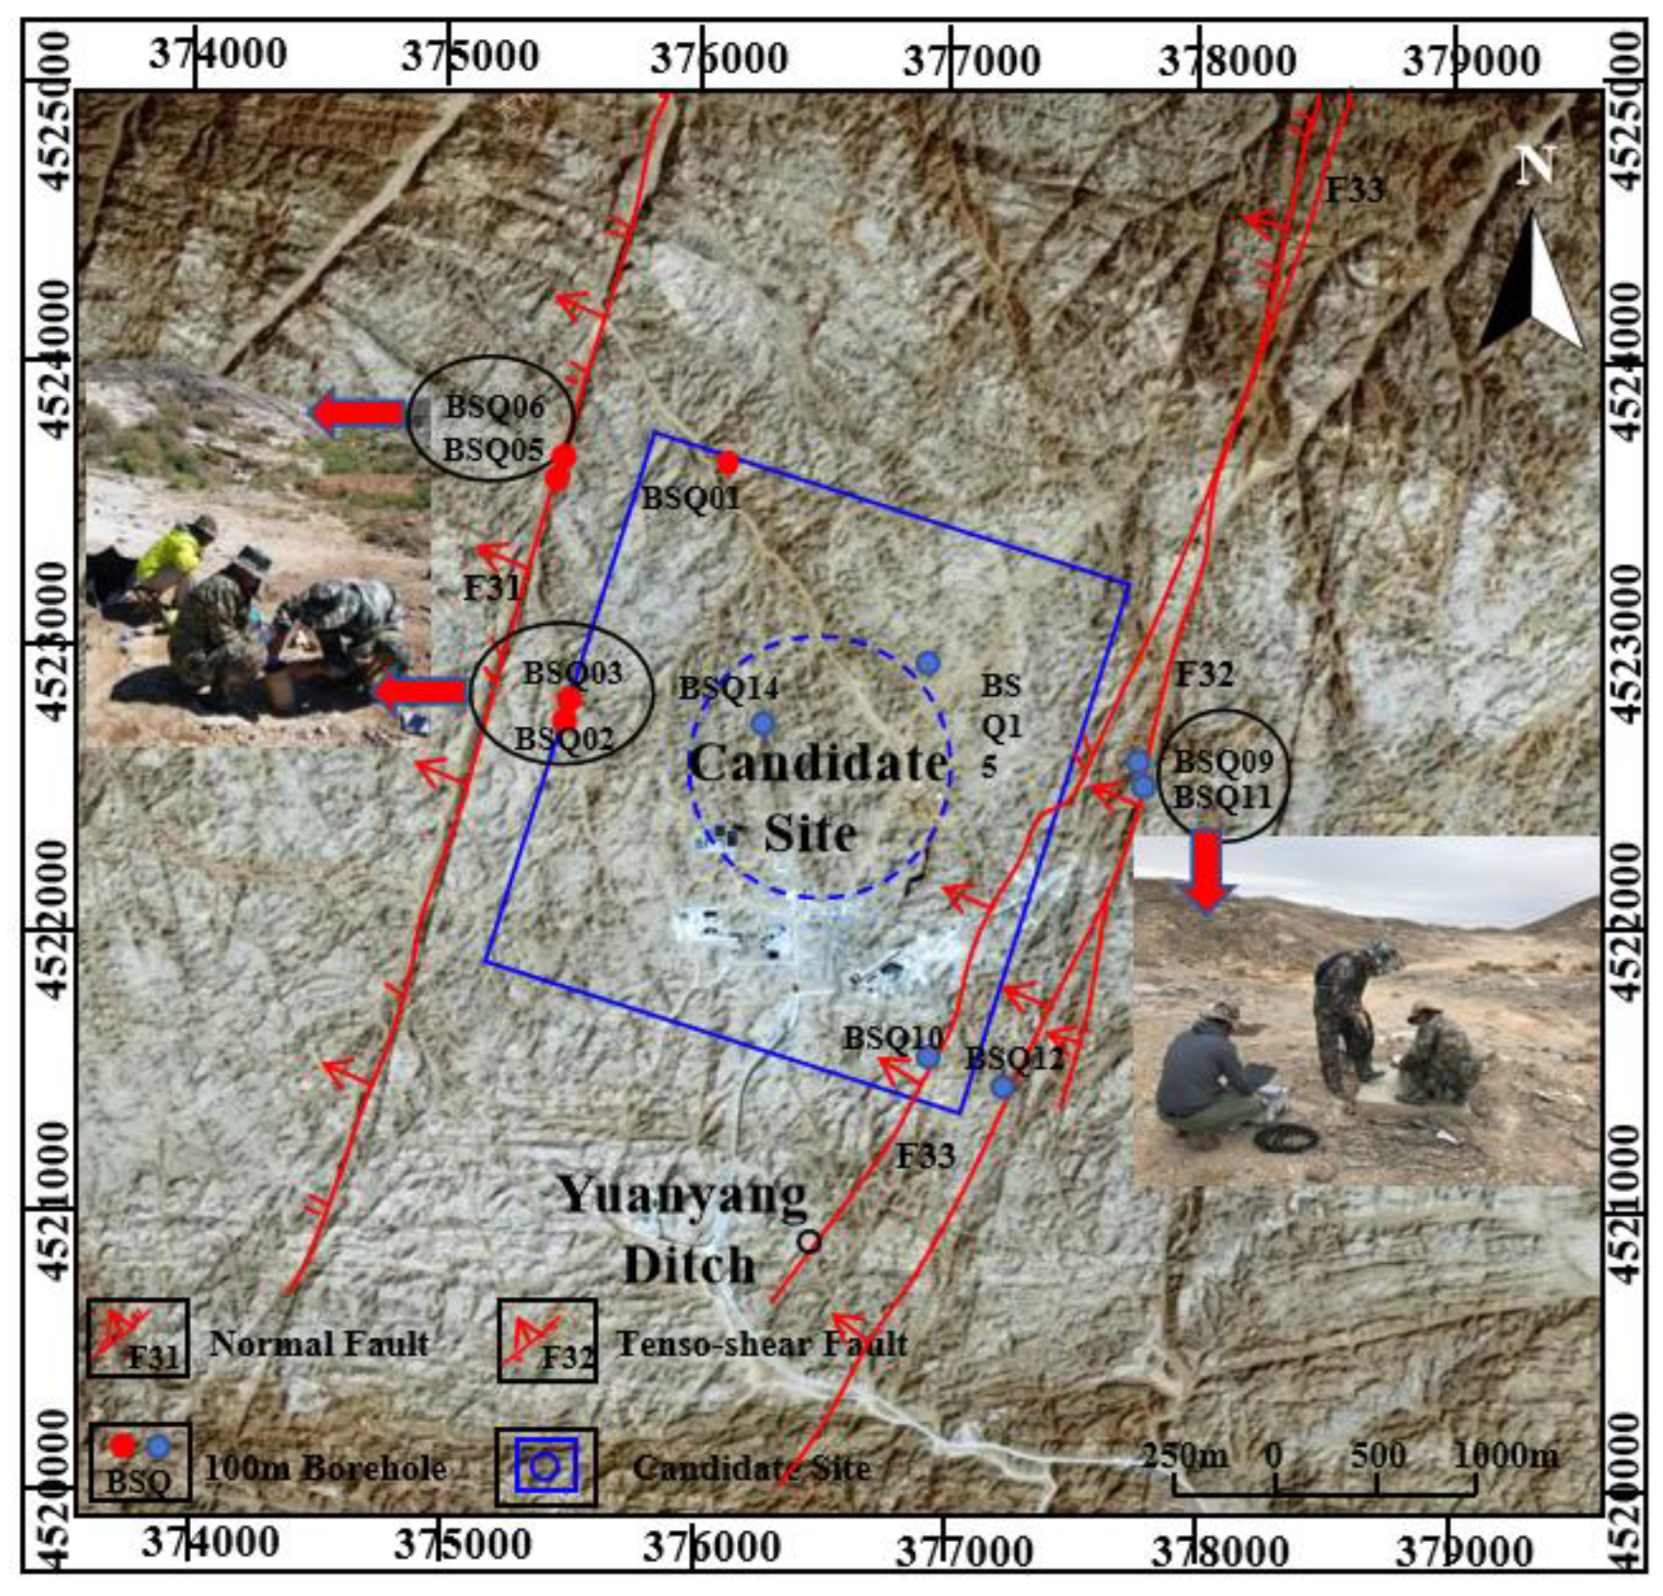
Figure 5.
Penetration velocity curve and depth distribution curve of sonar holes in Beishan. (a) Distribution of seepage velocity curves from 3D sonar measurements at boreholes BSQ01–BSQ06; (b) Distribution of seepage velocity curves from 3D sonar measurements at boreholes BSQ09–BSQ15; (c) Cross-sectional flow rates at boreholes BSQ01–BSQ06 from 3D sonar measurements; (d) Cross-sectional flow rates at boreholes BSQ09–BSQ15 from 3D sonar measurements.
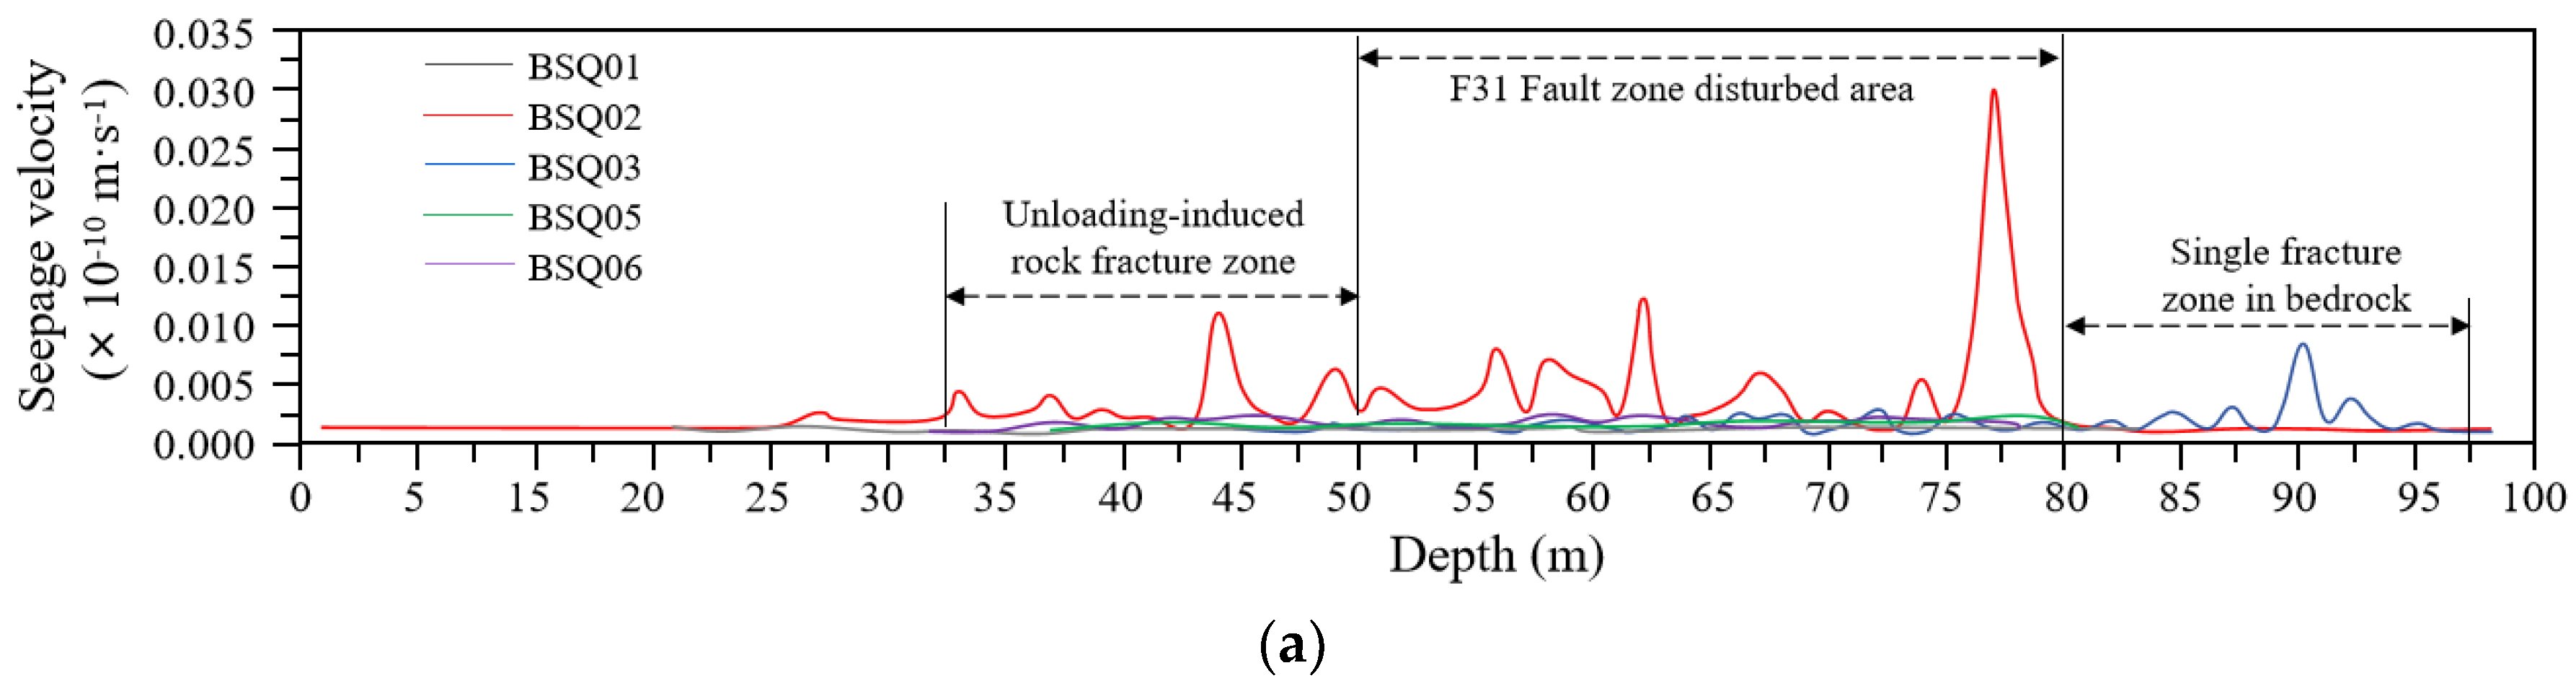
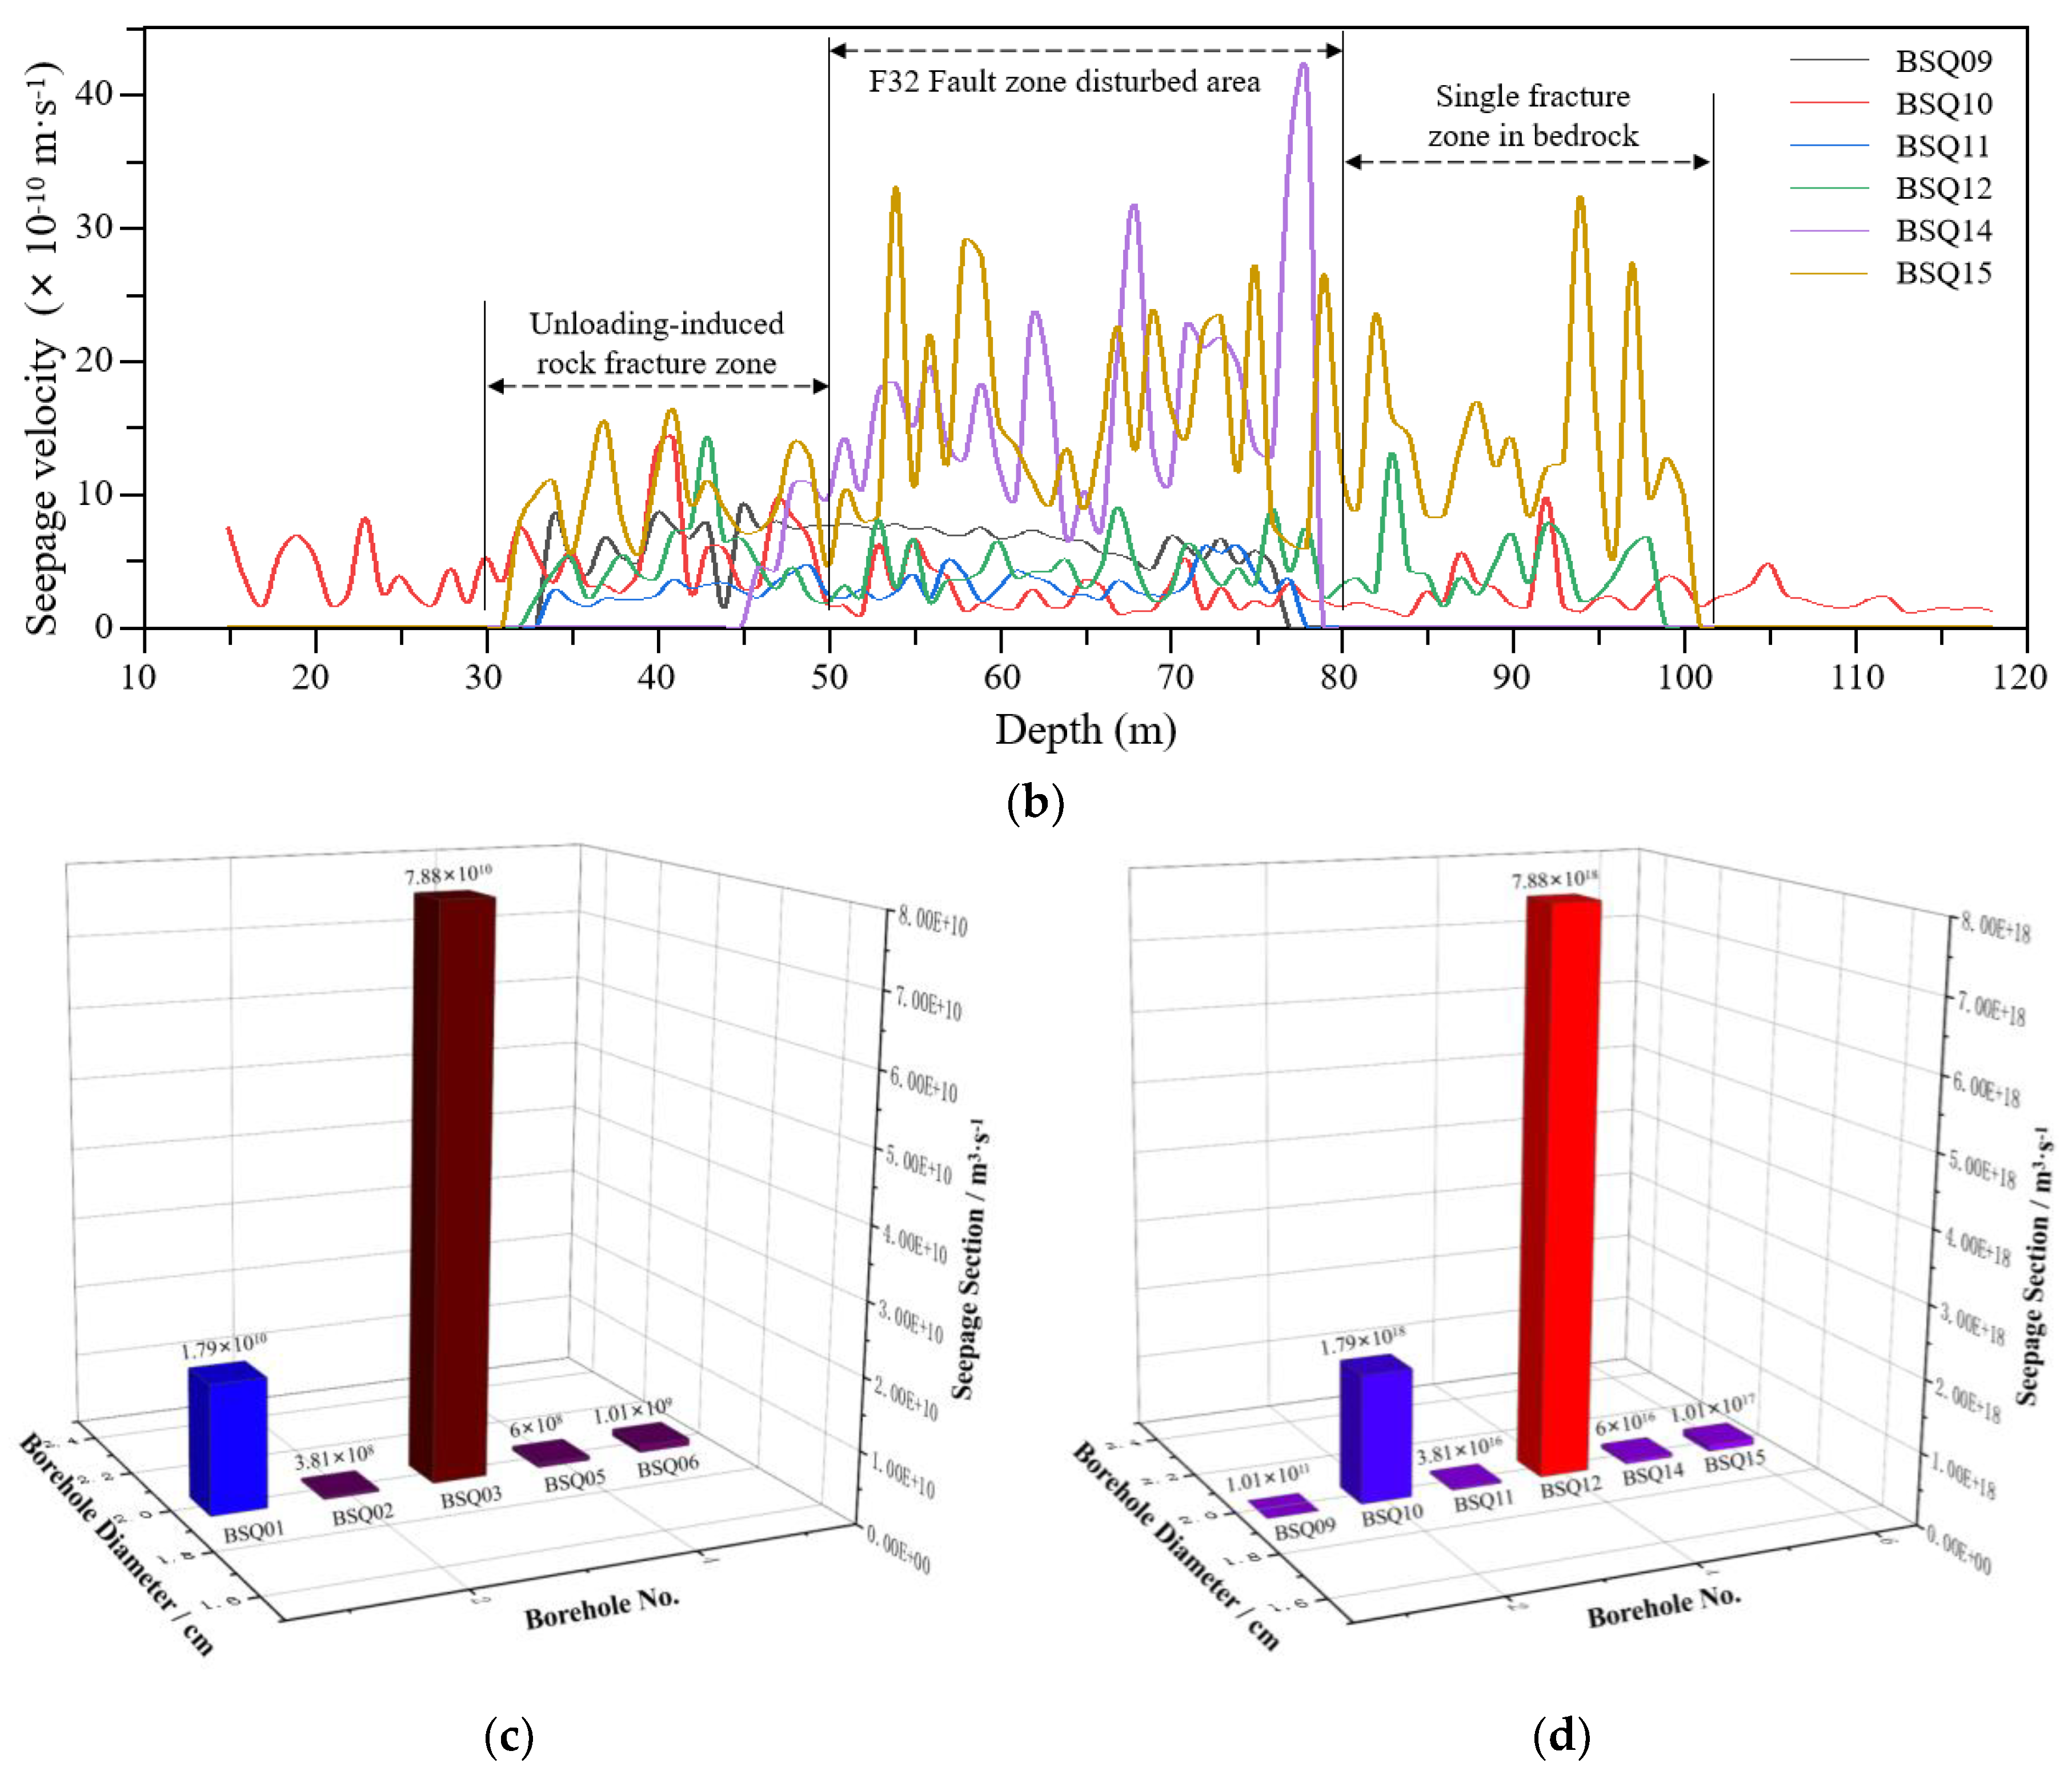
Figure 8.
Ichnography of groundwater seepage direction in Xinchang area.
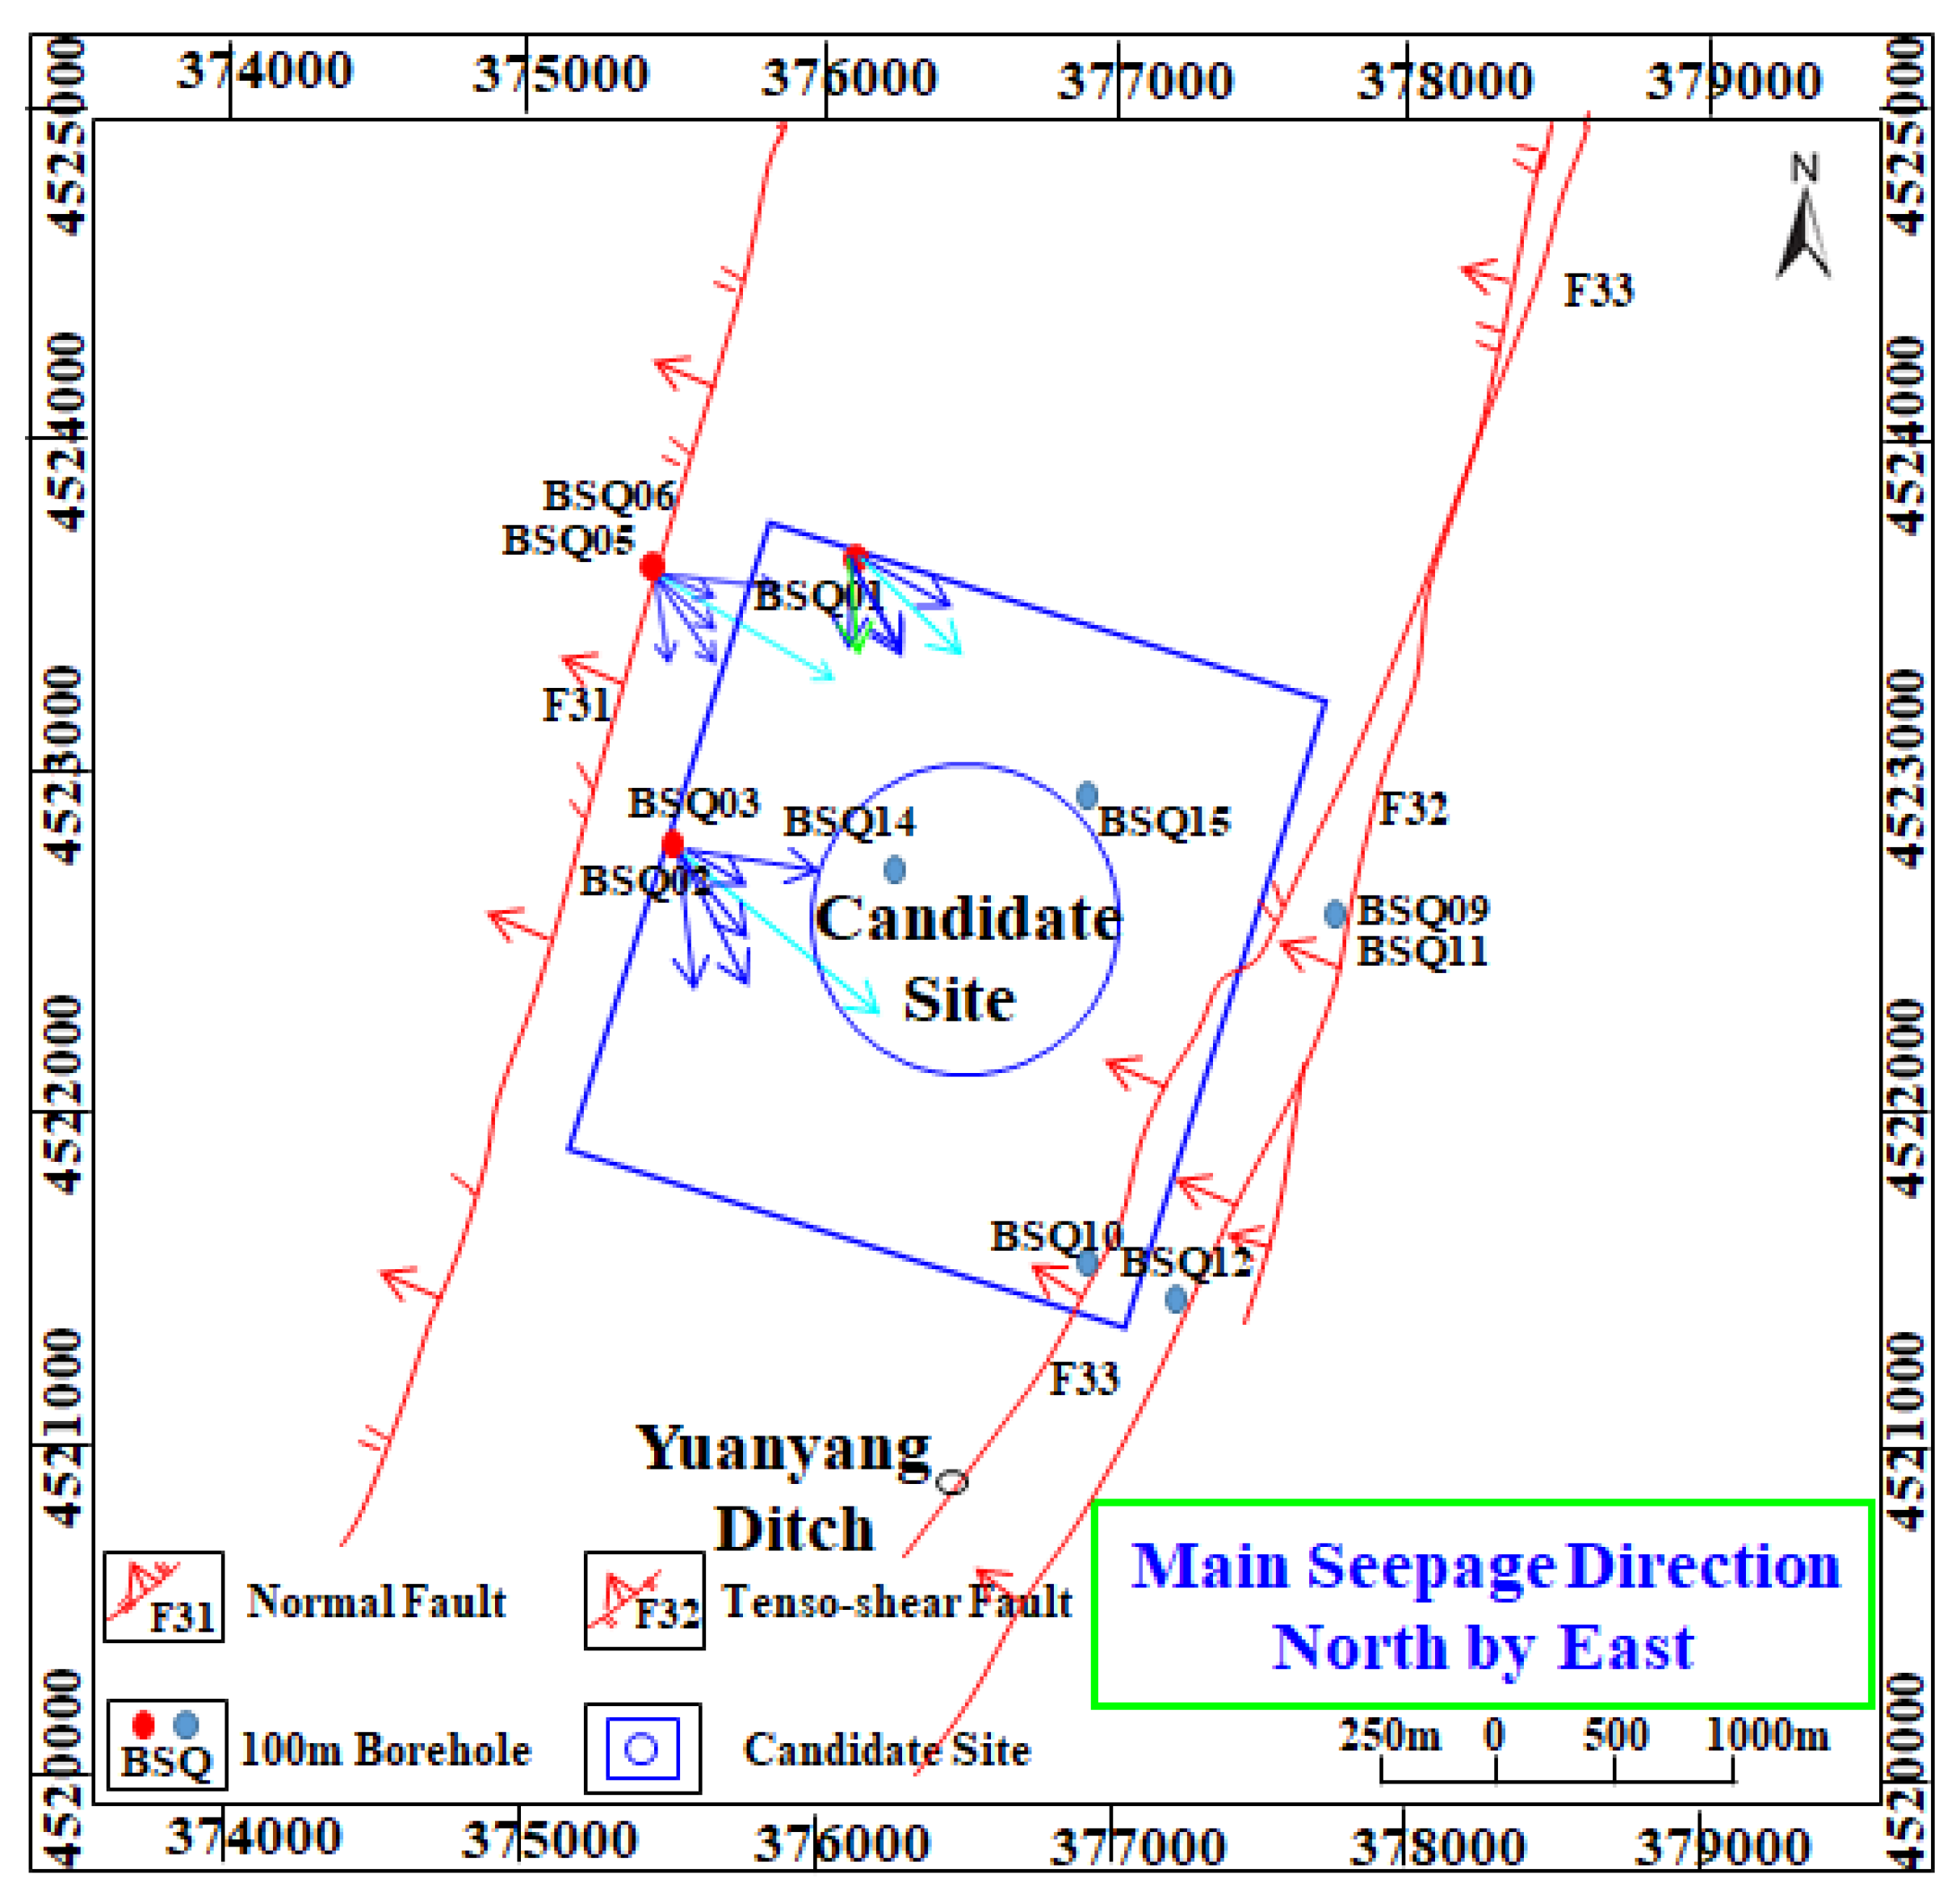
Figure 9.
Location of 3D sonar testing boreholes in Shiyuejing fault.

Figure 10.
Cross seepage section and permeability coefficient of testing holes in fault Shiyuejing. (a) Seepage velocity distribution of sonar boreholes; (b) Seepage section and velocity curve.
Figure 10.
Cross seepage section and permeability coefficient of testing holes in fault Shiyuejing. (a) Seepage velocity distribution of sonar boreholes; (b) Seepage section and velocity curve.
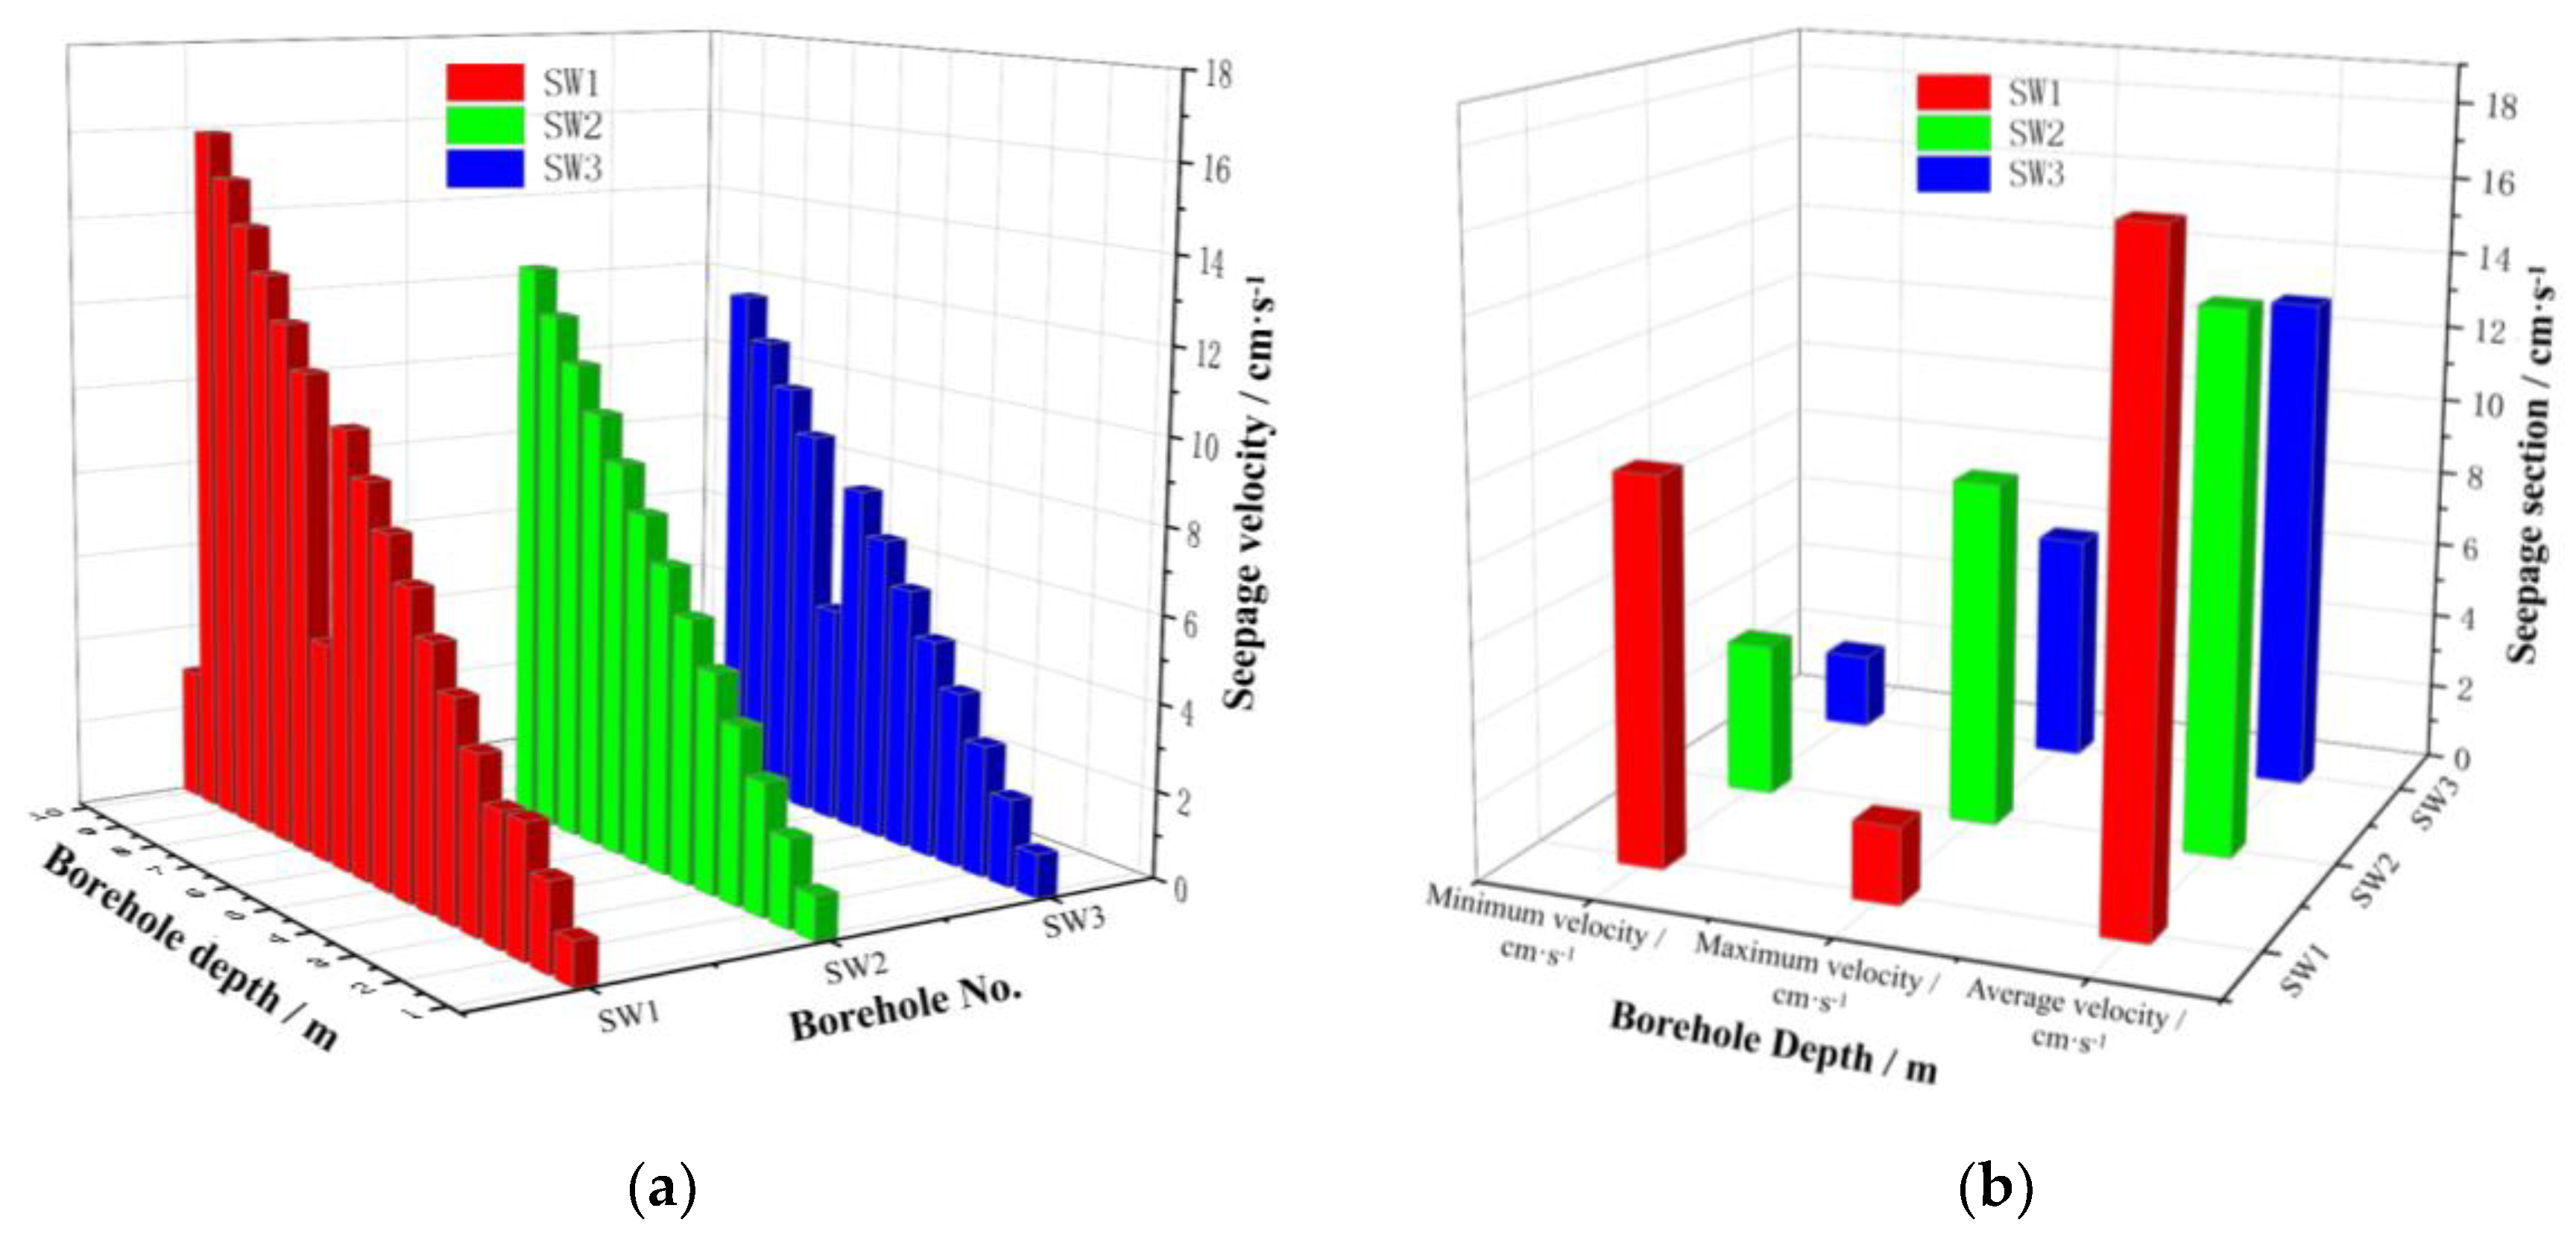
Figure 11.
Velocity contour maps and seepage direction distributions for each monitoring borehole in the Shiyuejing fault zone: (a) Three-dimensional contour map of the seepage velocity field; (b) Detailed three-dimensional spatial distribution of groundwater flow directions.
Figure 11.
Velocity contour maps and seepage direction distributions for each monitoring borehole in the Shiyuejing fault zone: (a) Three-dimensional contour map of the seepage velocity field; (b) Detailed three-dimensional spatial distribution of groundwater flow directions.
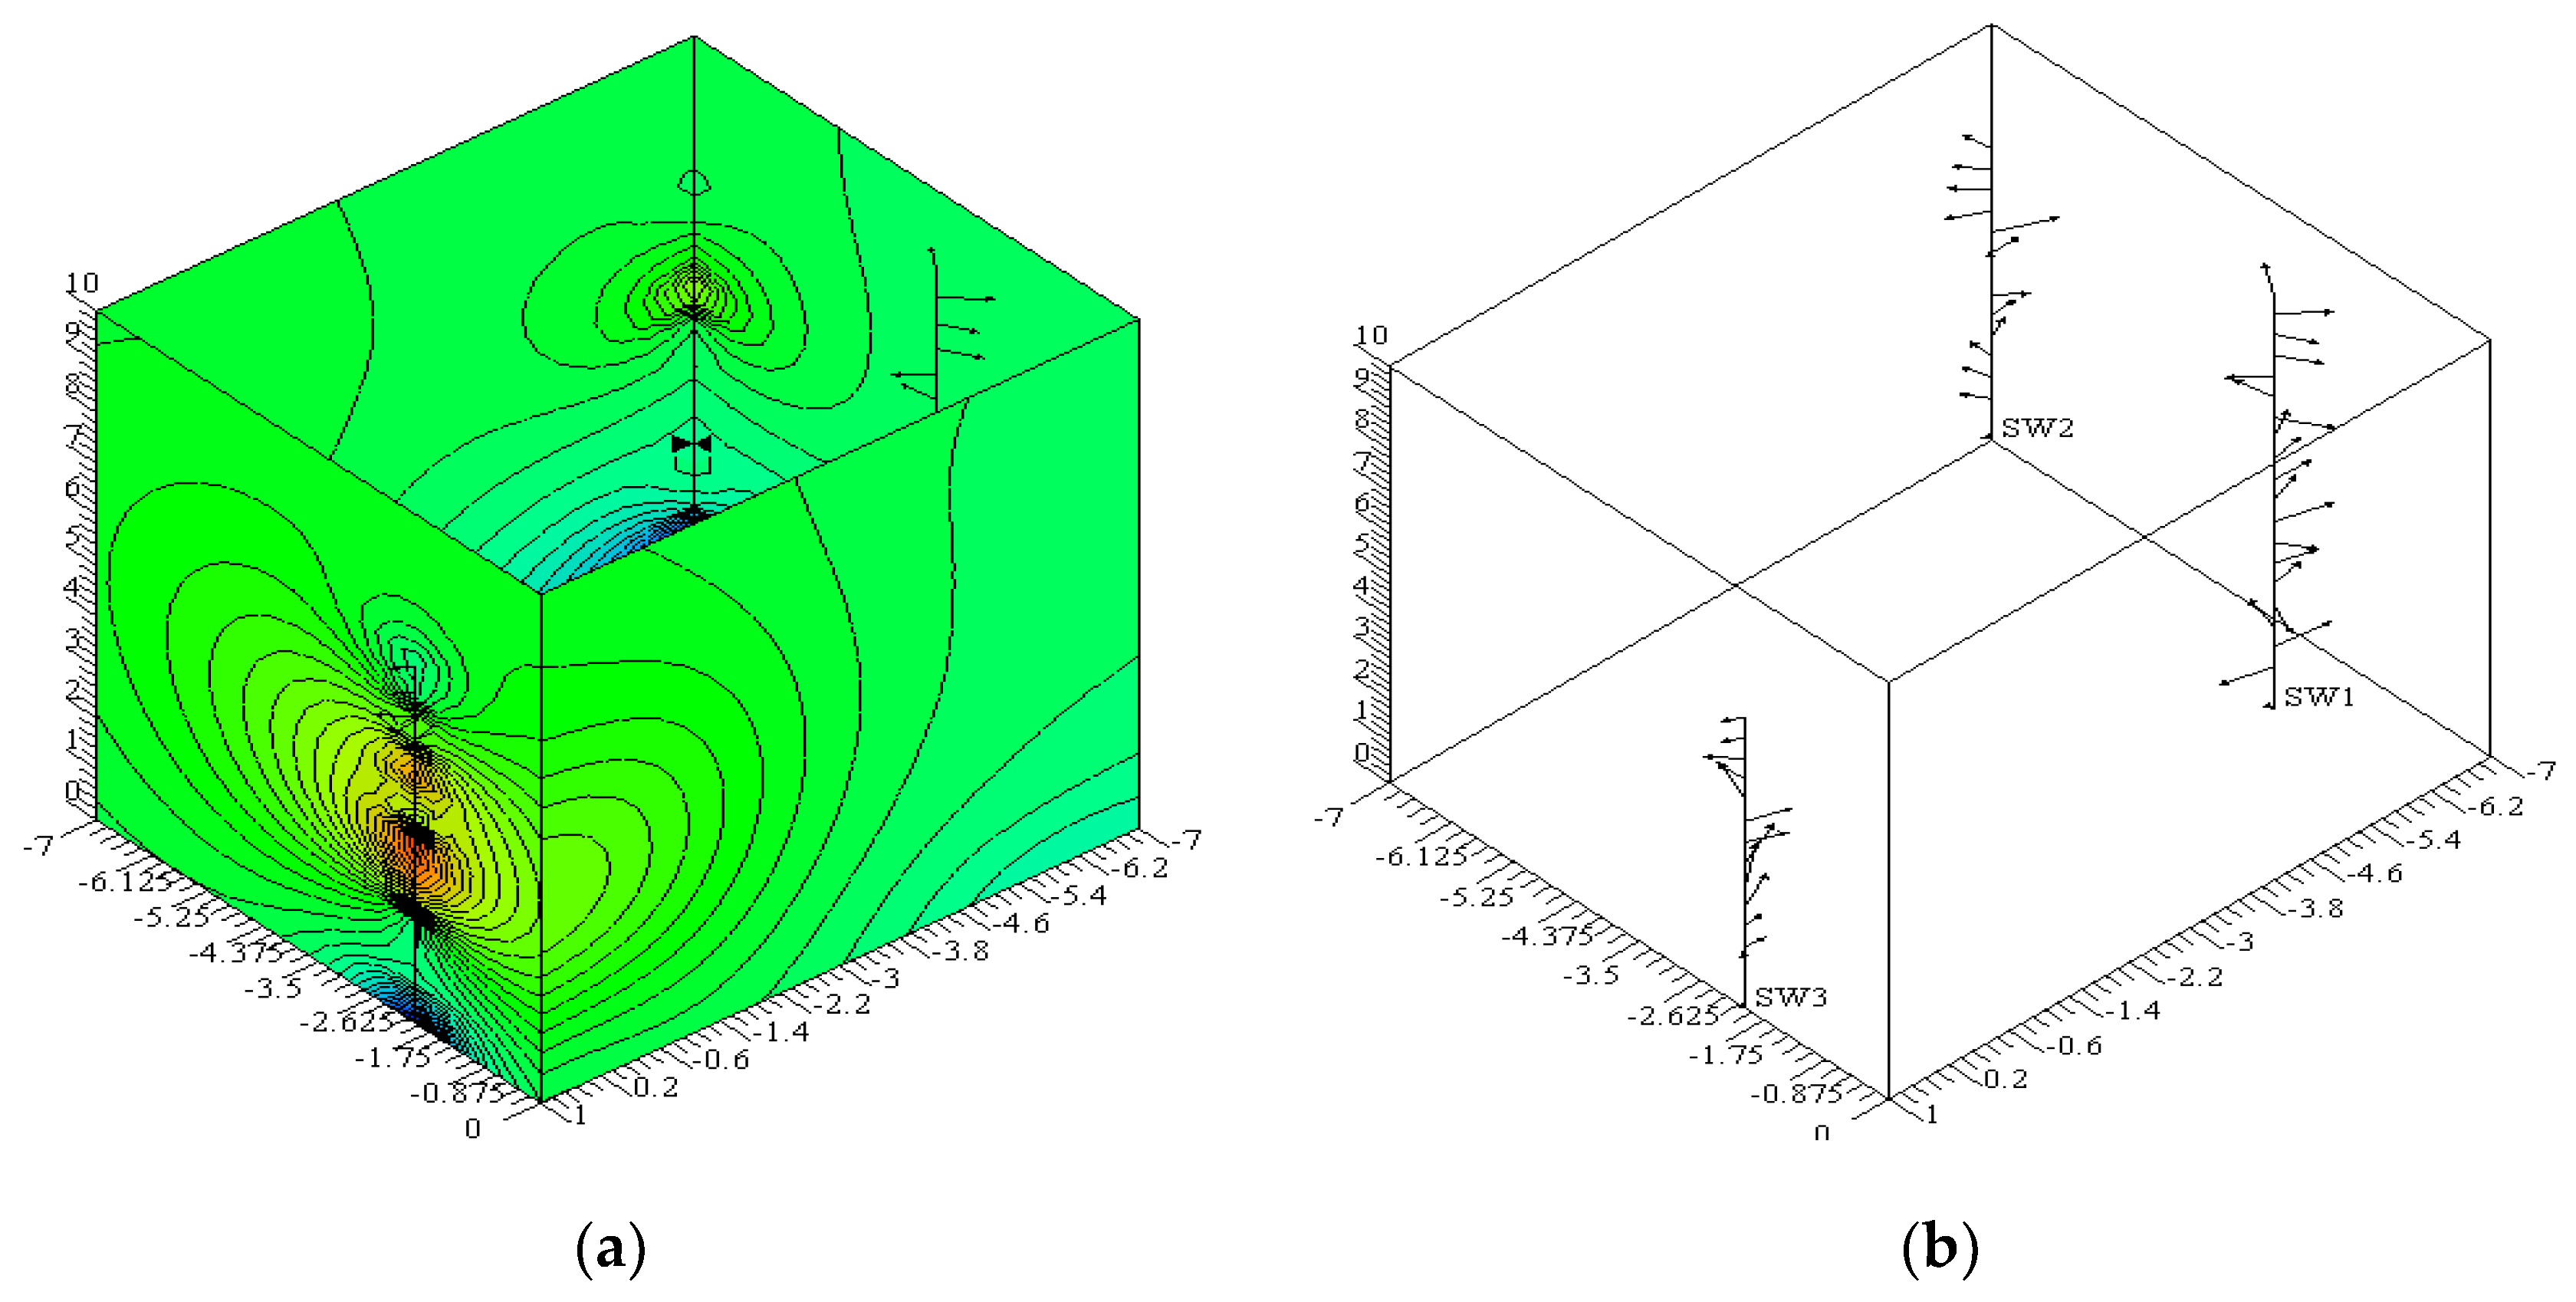
Figure 12.
Comparison of permeability coefficient and core of holes BSQ05 and BSQ06.
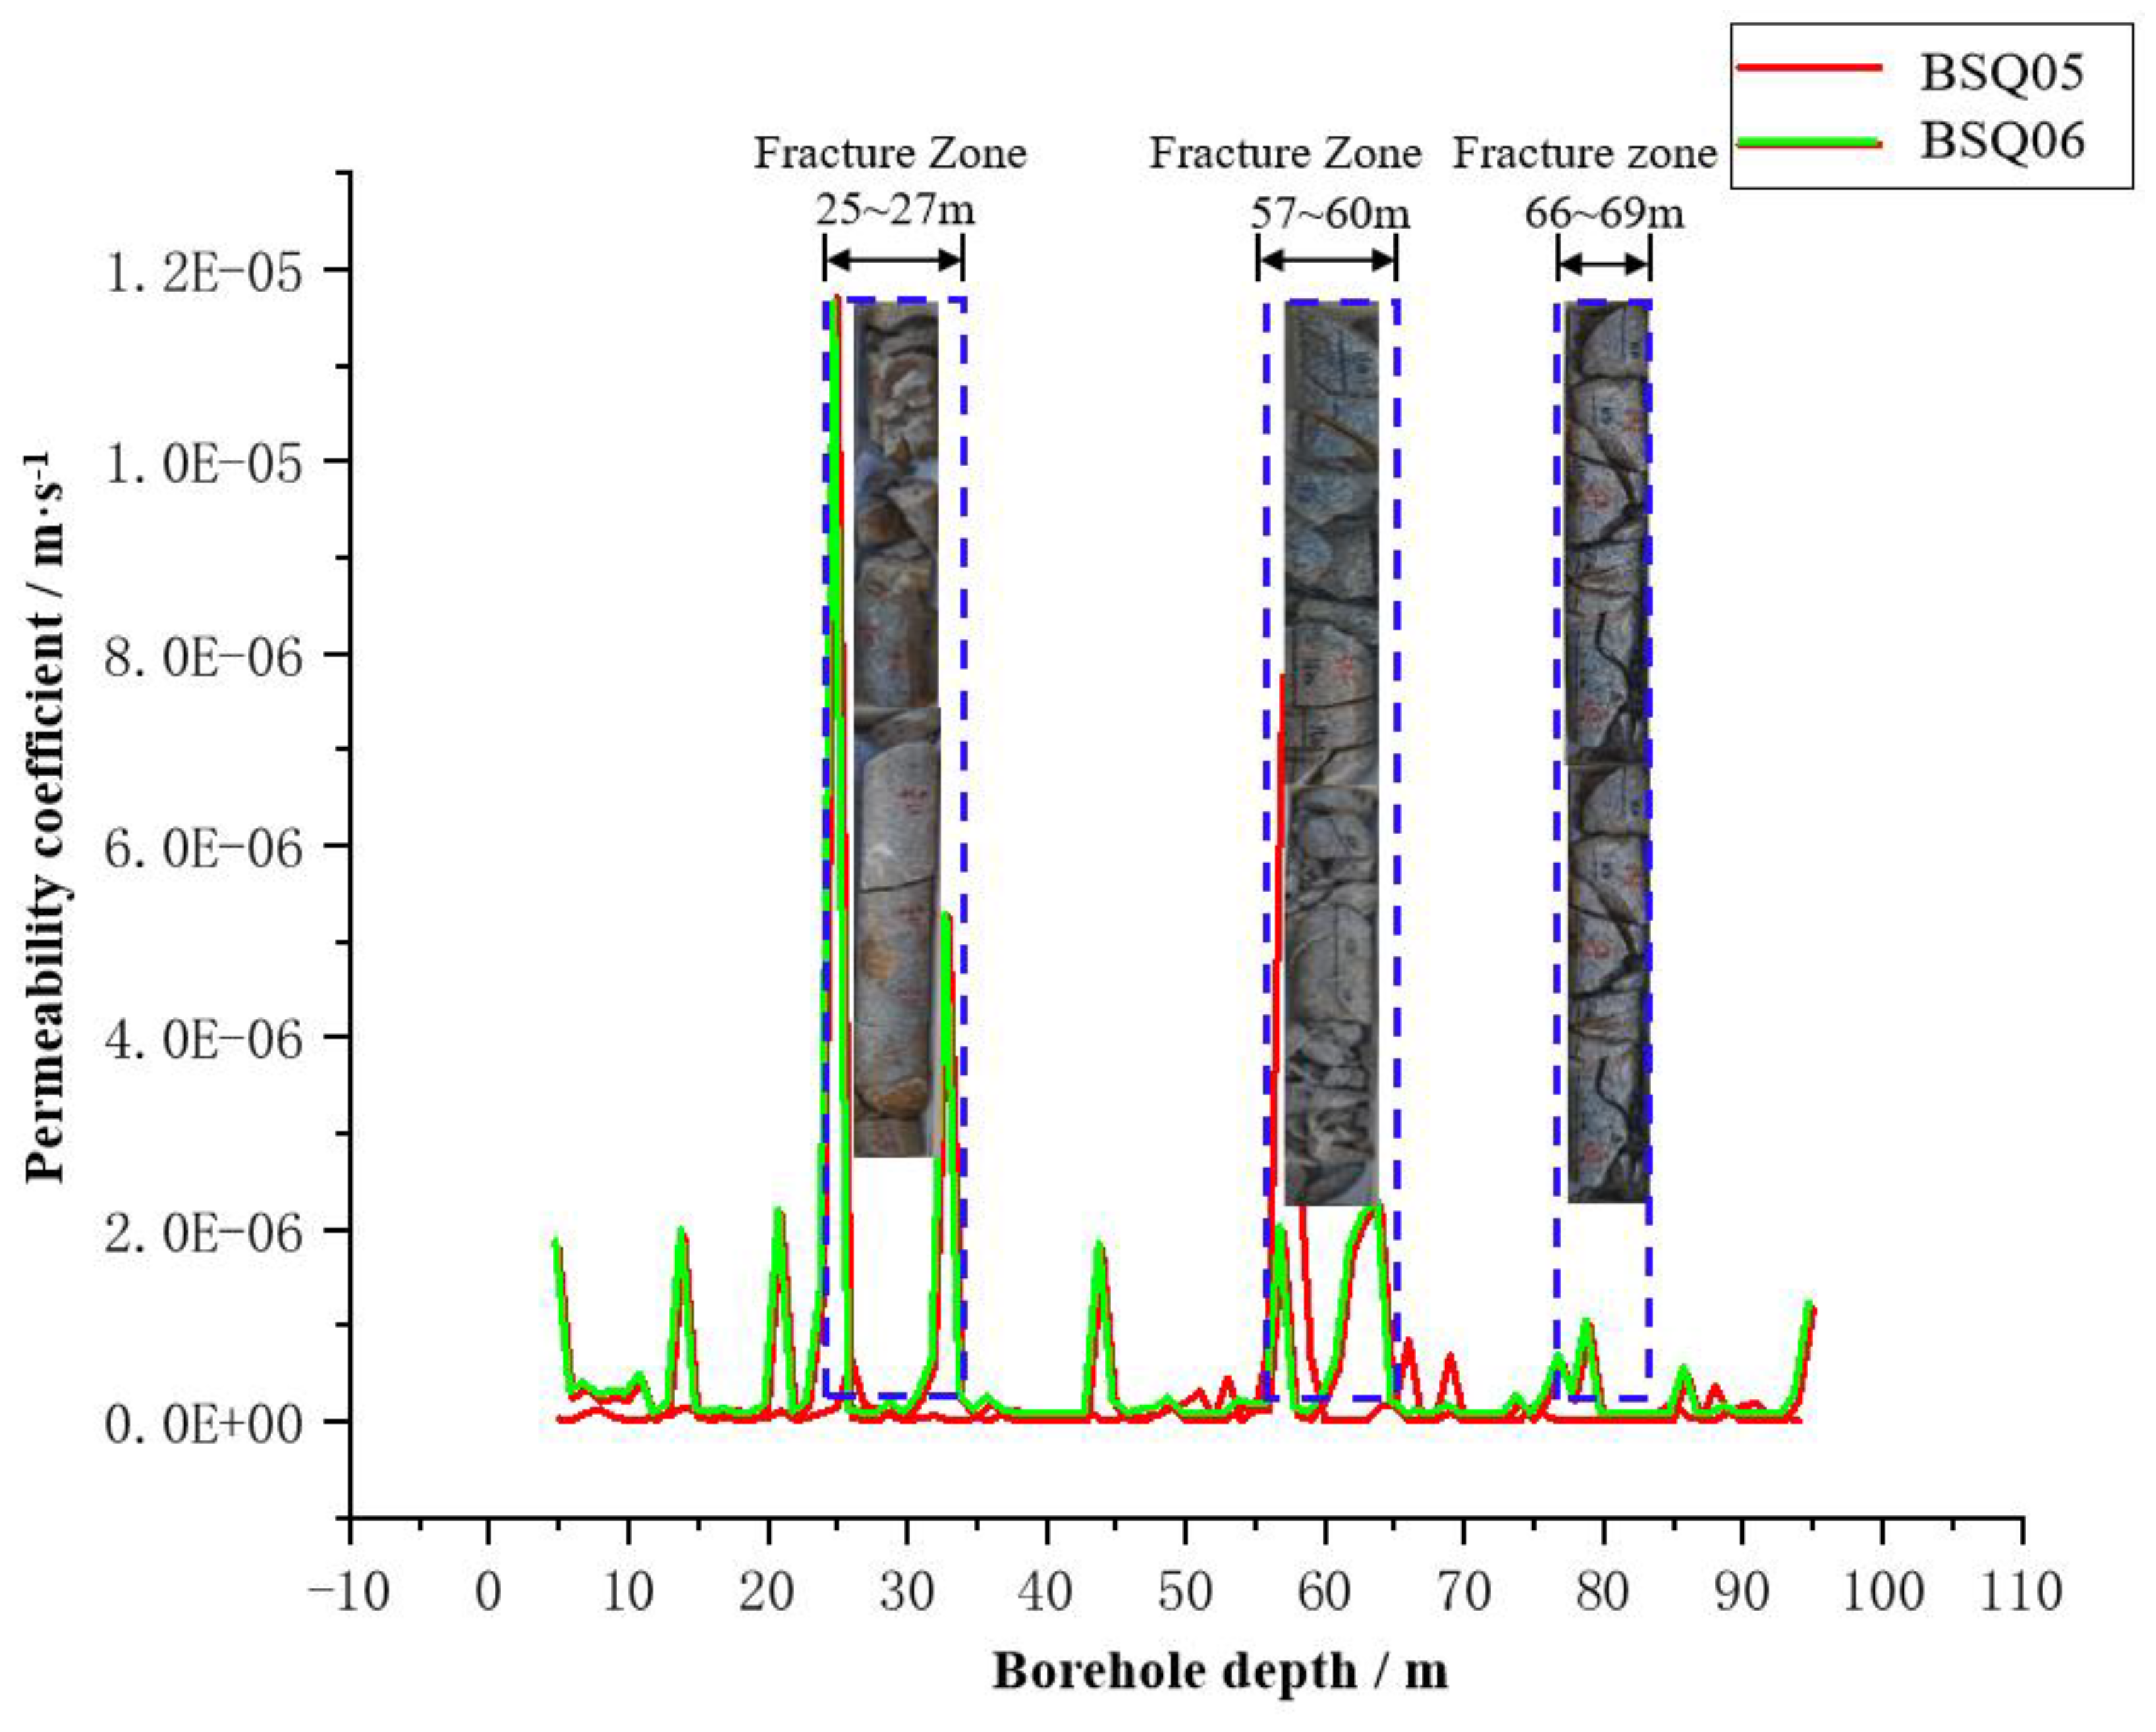
Figure 13.
Comparison of penetration velocity curve and core of borehole SW1-SW3 in Shiyuejing fault.
Figure 13.
Comparison of penetration velocity curve and core of borehole SW1-SW3 in Shiyuejing fault.
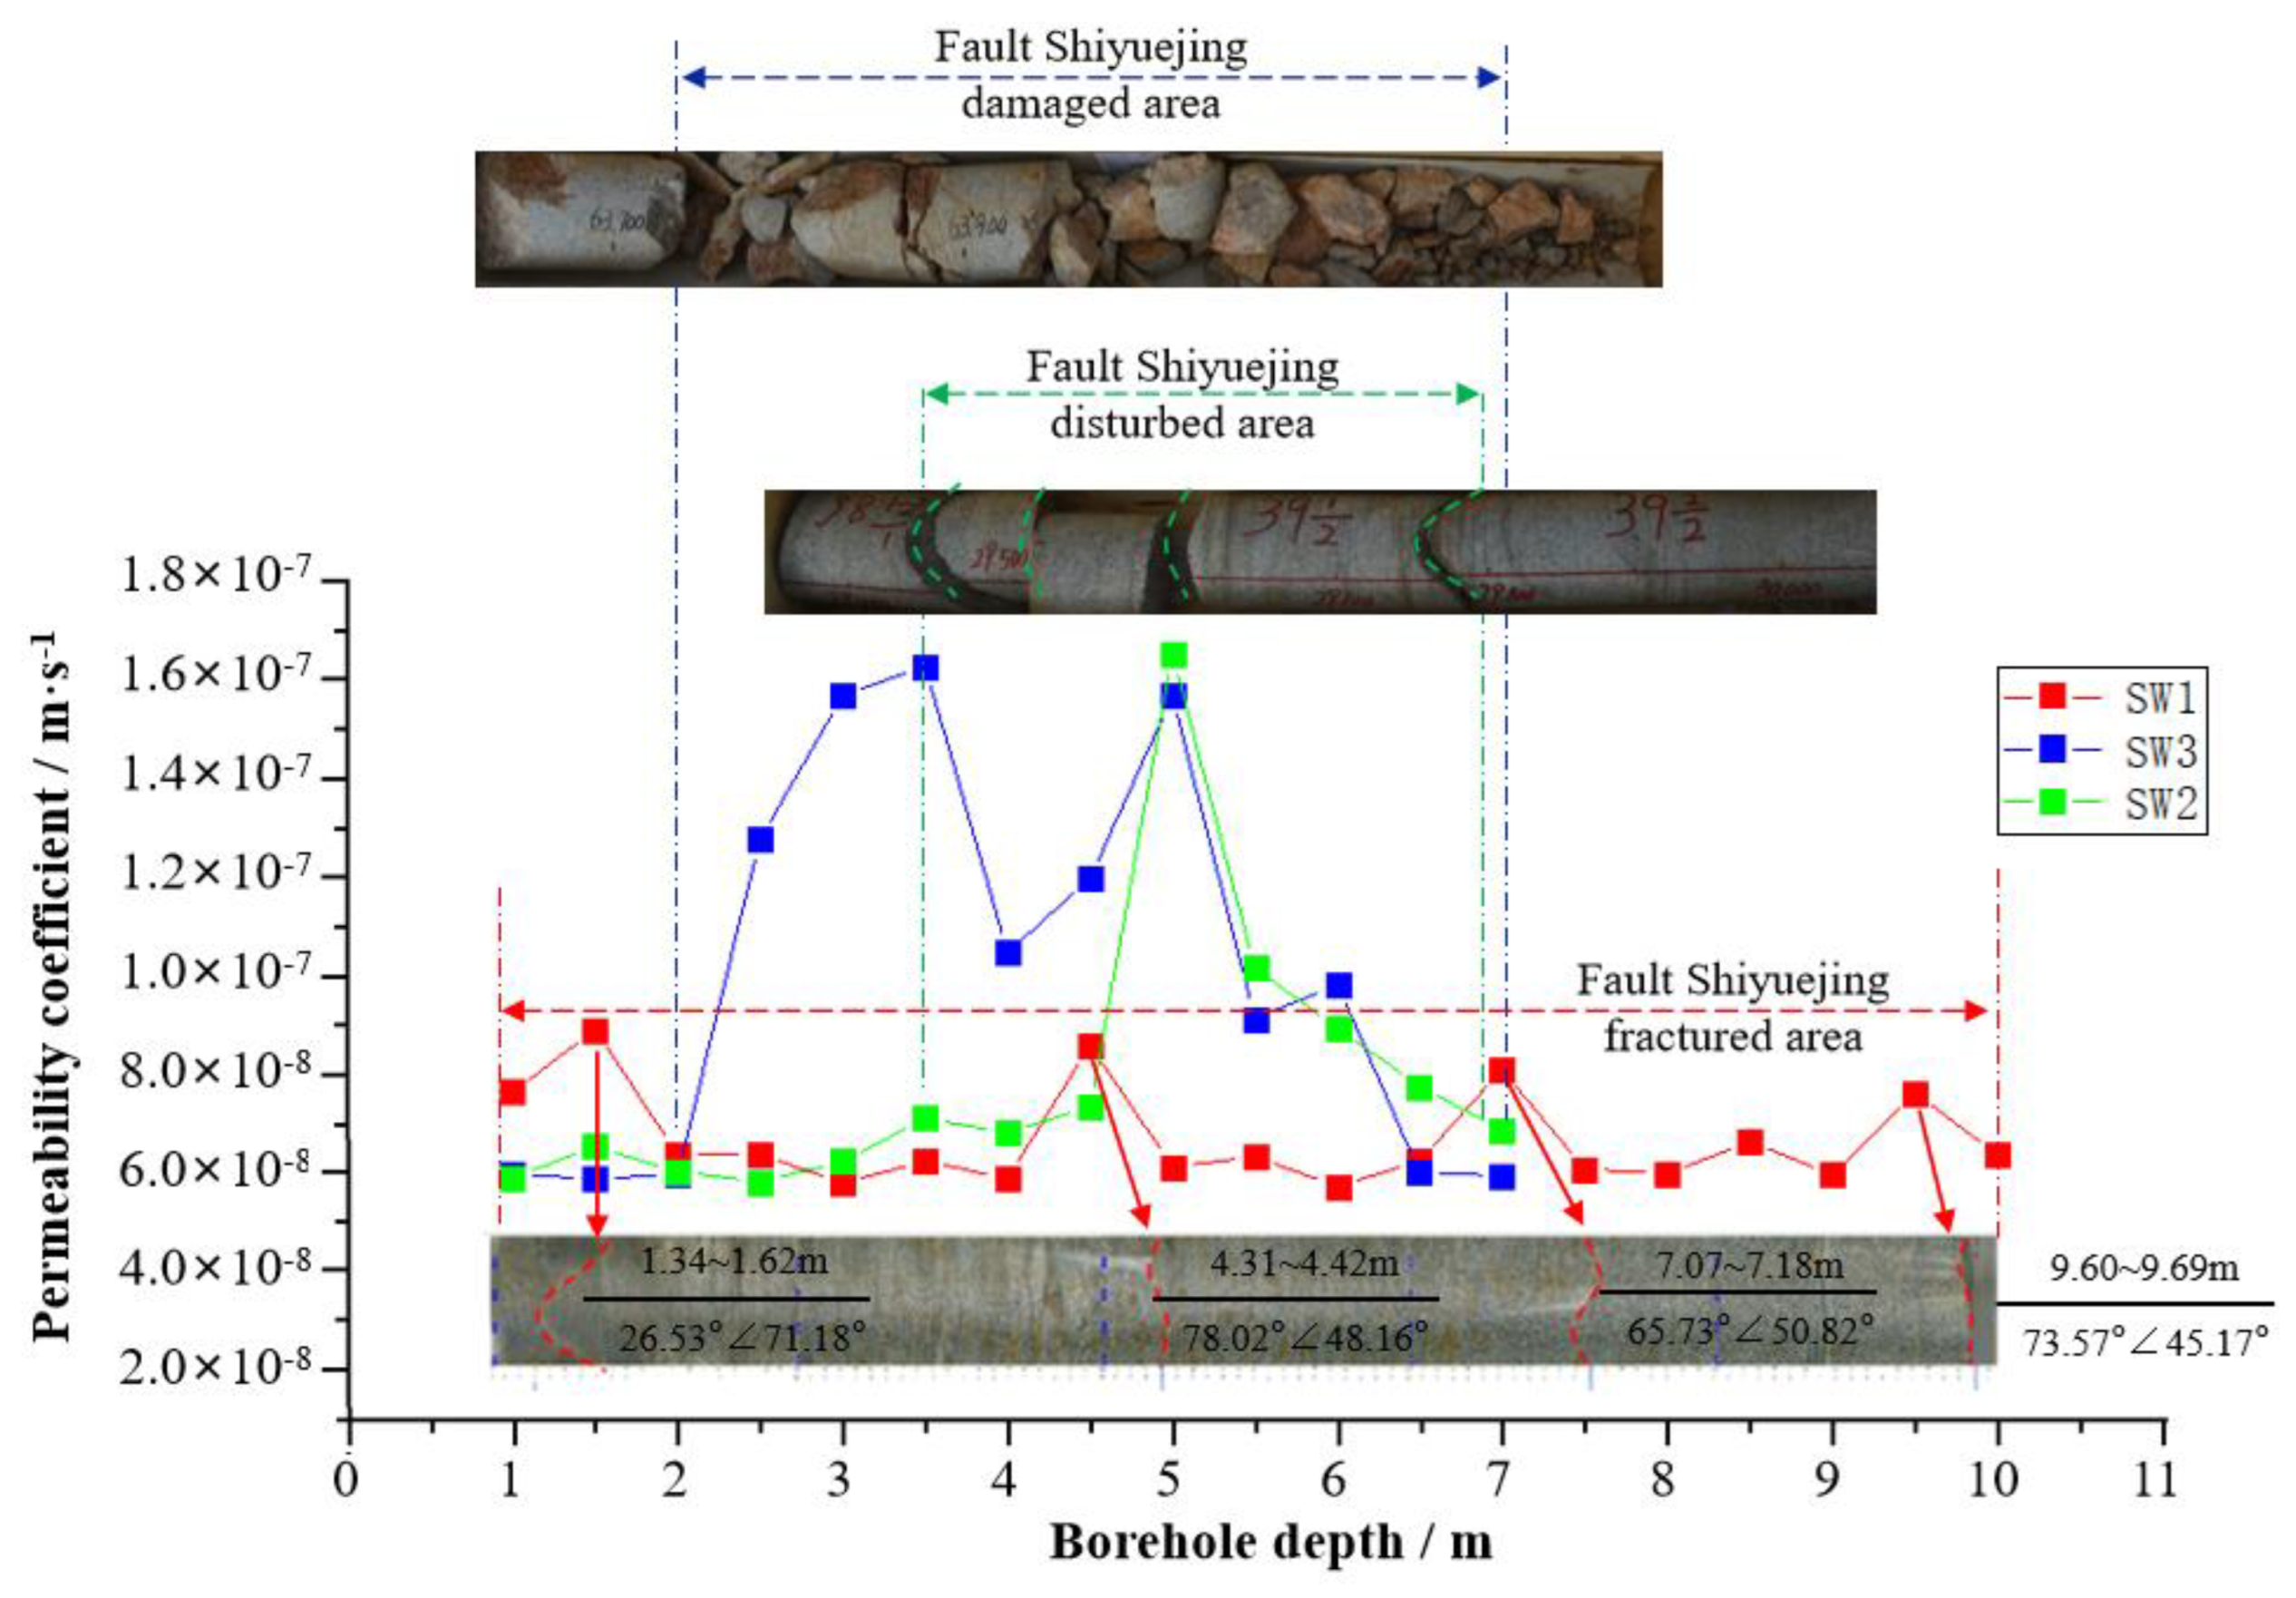
Table 1.
Data of 3D sonar test boreholes in Beishan site.
| Borehole No. | BSQ01 | BSQ02 | BSQ03 | BSQ05 | BSQ06 |
|---|---|---|---|---|---|
| Average velocity (cm/s) | 7.01×10⁻⁴ | 1.50×10⁻⁵ | 2.63×10⁻³ | 1.33×10⁻⁵ | 2.23×10⁻⁵ |
| Maximum velocity (cm/s) | 8.37×10⁻³ | 3.54×10⁻⁴ | 3.31×10⁻² | 4.51×10⁻⁴ | 5.33×10⁻⁴ |
| Minimum velocity (cm/s) | 3.53×10⁻⁶ | 5.29×10⁻⁷ | 6.24×10⁻⁶ | 4.12×10⁻⁷ | 4.28×10⁻⁷ |
| Average Permeability coefficient |
8.09×10⁻⁷ | 3.53×10⁻⁸ | 6.36×10⁻⁶ | 2.30×10⁻⁷ | 4.90×10⁻⁷ |
| Maximum Permeability coefficient | 9.66×10⁻⁶ | 8.34×10⁻⁷ | 8.01×10⁻⁵ | 7.76×10⁻⁶ | 1.17×10⁻⁵ |
| Minimum Permeability coefficient |
3.95×10⁻⁹ | 1.25×10⁻⁹ | 1.51×10⁻⁸ | 7.09×10⁻⁹ | 9.4×10⁻⁹ |
| Seepage section | 1.79×10⁴ | 3.81×10² | 7.88×10⁴ | 6.00×10² | 1.01×10³ |
| Seepage direction | 97-156 | 151-245 | 152-246 | 125-216 | 135-223 |
Note: 1. In the Table 1, v-seepage velocity (cm/s); k-permeability (cm/s); q-seepage rate (cm3/s). 2. The velocity and direction in the table are measured on-site. 3. Seepage section rate is the sum of the penetration velocity of each measuring point multiplied by the width of the water passing section (assuming a uniform section width of 50 meters). 4. The seepage direction is NN (North-North) direction.
Table 2.
Data of 3D sonar test boreholes in Shiyuejing fault.
| Borehole No. | SW1 | SW2 | SW3 |
|---|---|---|---|
| Average velocity (m/s) | 6.72×10⁻¹⁰ | 7.27×10⁻¹⁰ | 1.02×10⁻⁹ |
| Maximum velocity (m/s) | 8.94×10⁻¹⁰ | 1.26×10⁻⁹ | 1.63×10⁻⁹ |
| Minimum velocity cm/s) | 5.76×10⁻¹⁰ | 6.03×10⁻¹⁰ | 5.91×10⁻¹⁰ |
| Seepage Section (m/s) | 6.39×10⁻¹ | 4.73×10⁻¹ | 6.60×10⁻¹ |
| Seepage direction | 200-326 | 138-251 | 176-271 |
Disclaimer/Publisher’s Note: The statements, opinions and data contained in all publications are solely those of the individual author(s) and contributor(s) and not of MDPI and/or the editor(s). MDPI and/or the editor(s) disclaim responsibility for any injury to people or property resulting from any ideas, methods, instructions or products referred to in the content. |
© 2025 by the authors. Licensee MDPI, Basel, Switzerland. This article is an open access article distributed under the terms and conditions of the Creative Commons Attribution (CC BY) license (http://creativecommons.org/licenses/by/4.0/).
Copyright: This open access article is published under a Creative Commons CC BY 4.0 license, which permit the free download, distribution, and reuse, provided that the author and preprint are cited in any reuse.


