Submitted:
04 August 2025
Posted:
06 August 2025
You are already at the latest version
Abstract
The early detection and continuous monitoring of brain tumors is critical for effective treatment and improved patient outcomes. This project presents AI Assisted Web Application for Brain Tumor Diagnosis named Tumor Track utilizing deep learning techniques to enhance diagnostic accuracy and streamline patient follow-up procedures. Our system leverages advanced neural networks to analyze medical imaging data, enabling precise identification and classification of brain tumors. Additionally, we have integrated a user-friendly patient follow-up system designed to facilitate seamless communication between healthcare providers and patients, ensuring timely updates and personalized care plans. The project not only improves diagnostic efficiency but also promotes proactive patient management, ultimately contributing to better healthcare outcomes. Preliminary results demonstrate the system's potential in achieving high accuracy in brain tumor detection and providing a robust framework for ongoing patient care. Future work will focus on further refining the deep learning models and expanding the system's capabilities to support a broader range of medical conditions.
Keywords:
brain tumor diagnosis
; artificial intelligence in healthcare
; Convolutional Neural Networks (CNNs)
; AI-powered clinical decision support
; neuroimaging classification
; web-based diagnostic system
; deep learning
; machine learning
Chapter One Introduction
The management of brain tumors poses significant challenges in the realm of medical diagnostics and patient care, necessitating innovative solutions that can enhance accuracy and efficiency. Traditional methods of detecting and tracking brain tumors often suffer from limitations in precision and timeliness, which can adversely affect treatment outcomes. In response to these challenges, this project introduces AI Assisted Web Application for Brain Tumor Diagnosis named Tumor Track web application. By harnessing the capabilities of advanced neural networks, our system aims to improve the accuracy of brain tumor detection and classification from medical imaging data. Furthermore, the integration of a streamlined patient follow-up system addresses the need for continuous and personalized patient care, facilitating effective communication between healthcare providers and patients. This dual approach not only optimizes the diagnostic process but also ensures that patients receive timely and tailored care plans, thereby enhancing overall healthcare delivery. Through this innovative system, we aim to contribute to the field of medical diagnostics and patient management, paving the way for improved outcomes in the treatment of brain tumors.
1.1. Background Information
Brain tumors are a significant health concern, affecting millions of people worldwide. Early detection and accurate diagnosis are crucial for effective treatment and improved patient outcomes. Traditional methods of brain tumor detection rely on manual interpretation of medical images, which can be time-consuming, subjective, and prone to errors. The integration of artificial intelligence (AI) and deep learning techniques has revolutionized the field of medical imaging, offering innovative solutions for brain tumor detection.
Patient follow-up is a crucial aspect of healthcare, as it allows healthcare providers to monitor patient progress, identify potential complications, and adjust treatment plans as needed. Traditional methods of patient follow-up rely on manual tracking and communication, which can be time-consuming, labor-intensive, and prone to errors. The integration of technology, such as Telemedicine, has the potential to streamline patient follow-up, improve patient outcomes, and reduce healthcare costs.
1.2. Statement of the Problem
The current landscape of brain tumor detection and patient follow-up is fraught with significant challenges that hinder effective and timely healthcare delivery. Traditional methods of detecting brain tumors rely heavily on the manual interpretation of medical images, which is not only time-consuming but also prone to limited accuracy and false positives. The subjectivity inherent in manual interpretation can lead to varying opinions among radiologists, further complicating the diagnostic process. These methods often lack the sensitivity required to detect small or early-stage brain tumors, potentially delaying critical treatment.
In addition to diagnostic challenges, the existing patient follow-up system is inefficient and place undue responsibility on patients to maintain communication with their healthcare providers. This can result in delayed or missed appointments, compromising patient care. Inefficient communication methods and siloed patient data further exacerbate these issues, making it difficult to track patient progress and identify trends. Moreover, inadequate patient education about their treatment plans and medications often leads to non-adherence and poor health outcomes. Together, these gaps highlight an urgent need for a more accurate, efficient, and integrated system for brain tumor detection and patient management.
1.3. Objective of the Project
1.3.1. General Objective
To develop an integrated brain tumor diagnosing system using deep learning to improve diagnostic accuracy and efficiency. Additionally, to streamline patient follow-up processes for better communication and healthcare outcomes.
1.3.2. Specific Objective of the Project
The specific objectives of the project are:
- To study different deep learning models.
- To design and implement user management functionalities, allowing different roles (patients, medical professionals, administrators) to access the system securely.
- To develop modules for documenting patient histories and initial diagnoses, ensuring comprehensive and accurate record-keeping.
- To implement a referral system for MRI scans, enabling medical professionals to refer patients seamlessly and track the status of referrals.
- To integrate deep learning model for brain tumor classification and segmentation, enhancing diagnostic accuracy.
- To establish a specialist referral system, enabling medical professionals to seek expert opinions for complex cases and manage specialist responses efficiently.
- To conduct comprehensive testing and evaluation of Brain tumor Track to ensure usability, reliability, and effectiveness in real-world clinical settings.
- To enhance the accuracy of brain tumor detection using deep learning algorithms.
- To reduce the time required for diagnosing brain tumors by automating image analysis.
- To integrate patient follow-up features which facilitate timely communication between patients and healthcare providers.
- To provide educational resources to improve patient understanding and adherence to treatment plans.
1.4. Scope of the Project
The scope of this study covers a comprehensive brain tumor detection and management system that leverages deep learning techniques to improve the accuracy and efficiency of brain tumor detection, while also providing a user-friendly platform for patient data management and follow-up. The project will focus on the following specific areas:
- Brain tumor Detection: The project will focus on developing a deep learning- based brain tumor detection model that can accurately identify and classify brain tumors in MRI images.
- Patient Data Follow Up: The project will develop a patient data management system that can store and manage patient data, including medical history, treatment plans, and test results.
1.5. Significance of the Project
The significance of this study lies in its potential to:
- Improve brain tumor detection accuracy and reduce false positives.
- Enhance patient outcomes and quality of life through timely and accurate diagnosis.
- Reduce the burden on radiologists and doctors through automation.
- Contribute to the development of innovative deep learning and deep learning techniques in medical imaging.
- Facilitate the communication of specialists with doctors or radiologists (technician) which found in rural areas.
The project has the potential to make a significant impact on the field of medical imaging and patient care, and its findings can be used to improve the diagnosis and treatment of brain tumors.
1.6. Outline of the Project
In the following chapters will go through
Chapter 2: Literature Review
In this chapter some existing research on brain tumor detection using deep learning and patient follow up will be reviewed and in the current research identified.
Chapter 3: Method and Design (Logic)
This chapter will go through the methods used for brain tumor detection system using deep learning and patient follow up system. The design considerations for the patient follow up system will also be discussed.
Chapter 4: Results and Discussion
In this chapter the results will be presented based on the specific objectives and discuss the performance metrics and accuracy of the brain tumor detection system
Chapter 5: Conclusion and Recommendations
Finally in this section the key findings from the project will be summarized , concluding remarks on the effectiveness of AI in brain tumor detection and recommend our project for health providers to use the web application. Future works for future research and improvements to the system.
Chapter Two Literature Review
- Introduction
This literature review aims to provide a comprehensive overview of the current state of knowledge on Brain tumor Track and Patient Follow Up. By examining the existing research in this field, this review aims to identify key findings, trends, and gaps in the literature, ultimately informing future research directions and contributing to a deeper understanding of Brain tumor Track and Patient Follow Up.
2.1. Theoretical Review
Currently there are around 28 public medical schools and colleges in Ethiopia which train medicine to the level of medical doctorate degree. In addition, there are three teaching hospitals training professionals with medical or related background to the MD level. Of these colleges, schools and hospitals, only five provide residency training in Radiology. Till date there are around 350 radiologists in Ethiopia that is around 1 radiologist to 350,000 population.[1]
Absence and shortage of well-trained staffs in making appropriate standardized use of the availed imaging equipment and providing training is another challenge in the already running and in planned expansions of radiology residency training programs. Staff retention and availability for a longer working hours at training institutions can be achieved through private public partnerships formulated in a manner that stimulate the staff for providing more public and private radiology service while conducting training at the same time.[1]
The most complex and crucial task in many medical image applications is detecting and segmenting tumors because it often requires much data and information. Tumors come in a variety of shapes and sizes. Automatic or semiautomatic detection/segmentation, helped by AI, is currently crucial in medical diagnostics. The medical professionals must authenticate the boundaries and areas of the brain cancer and ascertain where precisely it rests and the exact impacted locations before therapies such as chemotherapy, radiation, or brain surgery. This review examines the output from various algorithms that are used in segmenting and detecting tumors.[2]
Sixteen years ago, Ethiopia started expanding access to primary health care through community health extension programs and health centers. Despite this, health care service access is a problem, especially in remote or rural areas, because of the high population growth rate, increased demand for health care, slow economic growth, and rising health costs. An additional problem is the shortage of medical specialists. This requires that patients travel long distances where specialists are located. In contrast, the waiting time for treatment after arriving may take more than a week. Inadequate transportation and hard-to-reach geographical locations make access to health care services quite difficult in Ethiopia, where >79% of the population live in rural areas. An option to allow access to health care services in a developing country such as Ethiopia is implementing telemedicine services and ensuring sustainability.[3]
2.2. Empirical Review
This empirical review focuses on recent studies conducted in the past 3-5 years regarding the development and implementation of patient follow-up web applications and tumor detection using deep learning. The aim is to provide insights into the latest empirical research in these areas to understand the current trends and advancements.
2.1.1. Patient Follow-up Web Applications Study on Patient Engagement and Usability:
Empirical review on [4] assessed the impact of a web-based patient follow-up application on patient engagement and usability. Results showed a significant increase in patient engagement levels and high usability ratings, indicating the effectiveness of the application in enhancing patient involvement in their care.
- Research on Healthcare Utilization and Cost Reduction:
Recent research by [5] investigated the impact of a patient follow-up web application on healthcare utilization and cost reduction. Findings revealed a decrease in hospital readmission and emergency department visits, leading to substantial cost savings for healthcare providers.
2.1.2. Tumor Detection Using Deep Learning Application of Deep Learning in Tumor Detection:
A study by [6] explored the application of deep learning techniques in tumor detection from MRI images. The research demonstrated significant improvements in accuracy and efficiency compared to traditional methods, showcasing the potential of deep learning in enhancing diagnostic capabilities.
- Study on Image Segmentation and Classification:
Recent work by [7] focused on image segmentation and classification algorithms for tumor detection. Their findings highlighted the importance of precise segmentation techniques and accurate classification models in improving the overall performance of tumor detection systems.
2.3. Research Gap
A significant research gap in brain tumor detection using deep learning is the lack of standardized criteria and protocols for delivering follow-up care, particularly in developing countries like Ethiopia that face challenges in access to specialized medical services. This gap is characterized by the absence of established criteria for determining who should receive follow-up care, the timing of follow-up, and the frequency of follow-up appointments. Additionally, there are wide variations in how follow-up services are provided across different geographical locations in Ethiopia, which can lead to inconsistencies in patient care. Identifying who is most likely to benefit from follow-up care, as well as when and how follow-up care should be delivered through innovative approaches like telemedicine, are important next steps in improving outcomes and addressing these gaps in the Ethiopian healthcare system.
The literature review provided a comprehensive understanding of the existing knowledge and gaps in the field, which informs the method and design of the current project. By synthesizing the findings from the literature, key themes and concepts were identified that guided the development of our project questions, data collection methods, and data analysis procedures.
Chapter Three Method and Design
3.1. Introduction
This chapter outlines the methods and design approaches employed in the development of Tumor Track web application. It details the procedures for data collection, the overall approach to testing hypotheses, and the rationale behind the chosen methodologies. Additionally, this section discusses the design and implementation process, highlighting the uniqueness of our approach and its benefits in solving the identified problem.
3.2. Data Collection
Data collection is the process of gathering and measuring information on variables of interest, in an established systematic fashion that enables one to answer stated research questions, test hypotheses, and evaluate outcomes.
3.2.1. Methods Used to Collect Data
The data collection process was a critical initial step, involving the gathering of relevant datasets necessary for both the software and AI components of the project. We utilized the following methods for data collection:
Public Datasets: We sourced large, publicly available datasets from platforms such as ImageNet, which provided a rich repository of labeled images required for training our AI models.
Web Scraping: For additional data, we implemented web scraping techniques using Python libraries like BeautifulSoup and Scrapy to collect images from various websites.
Data Augmentation: To enhance the dataset and ensure robustness, we applied data augmentation techniques, such as rotation, scaling, and flipping, using the ImageDataGenerator class from TensorFlow.
3.2.2. Data Sources
The primary datasets used in this project include:
ImageNet Dataset: Provided a vast collection of labeled images for the classification task.
Custom Dataset: Created through web scraping and manual annotation to cover specific requirements not met by public datasets.
3.4. Software Development
3.4.1. Software Development Method
The Waterfall method was chosen for this project due to its structured and sequential approach, which aligns well with our project’s needs. This methodology allows for thorough documentation and clear stages, ensuring that each phase is completed before the next begins. This is particularly advantageous for projects with well- defined requirements and objectives.
Figure 1.
Waterfall diagram.
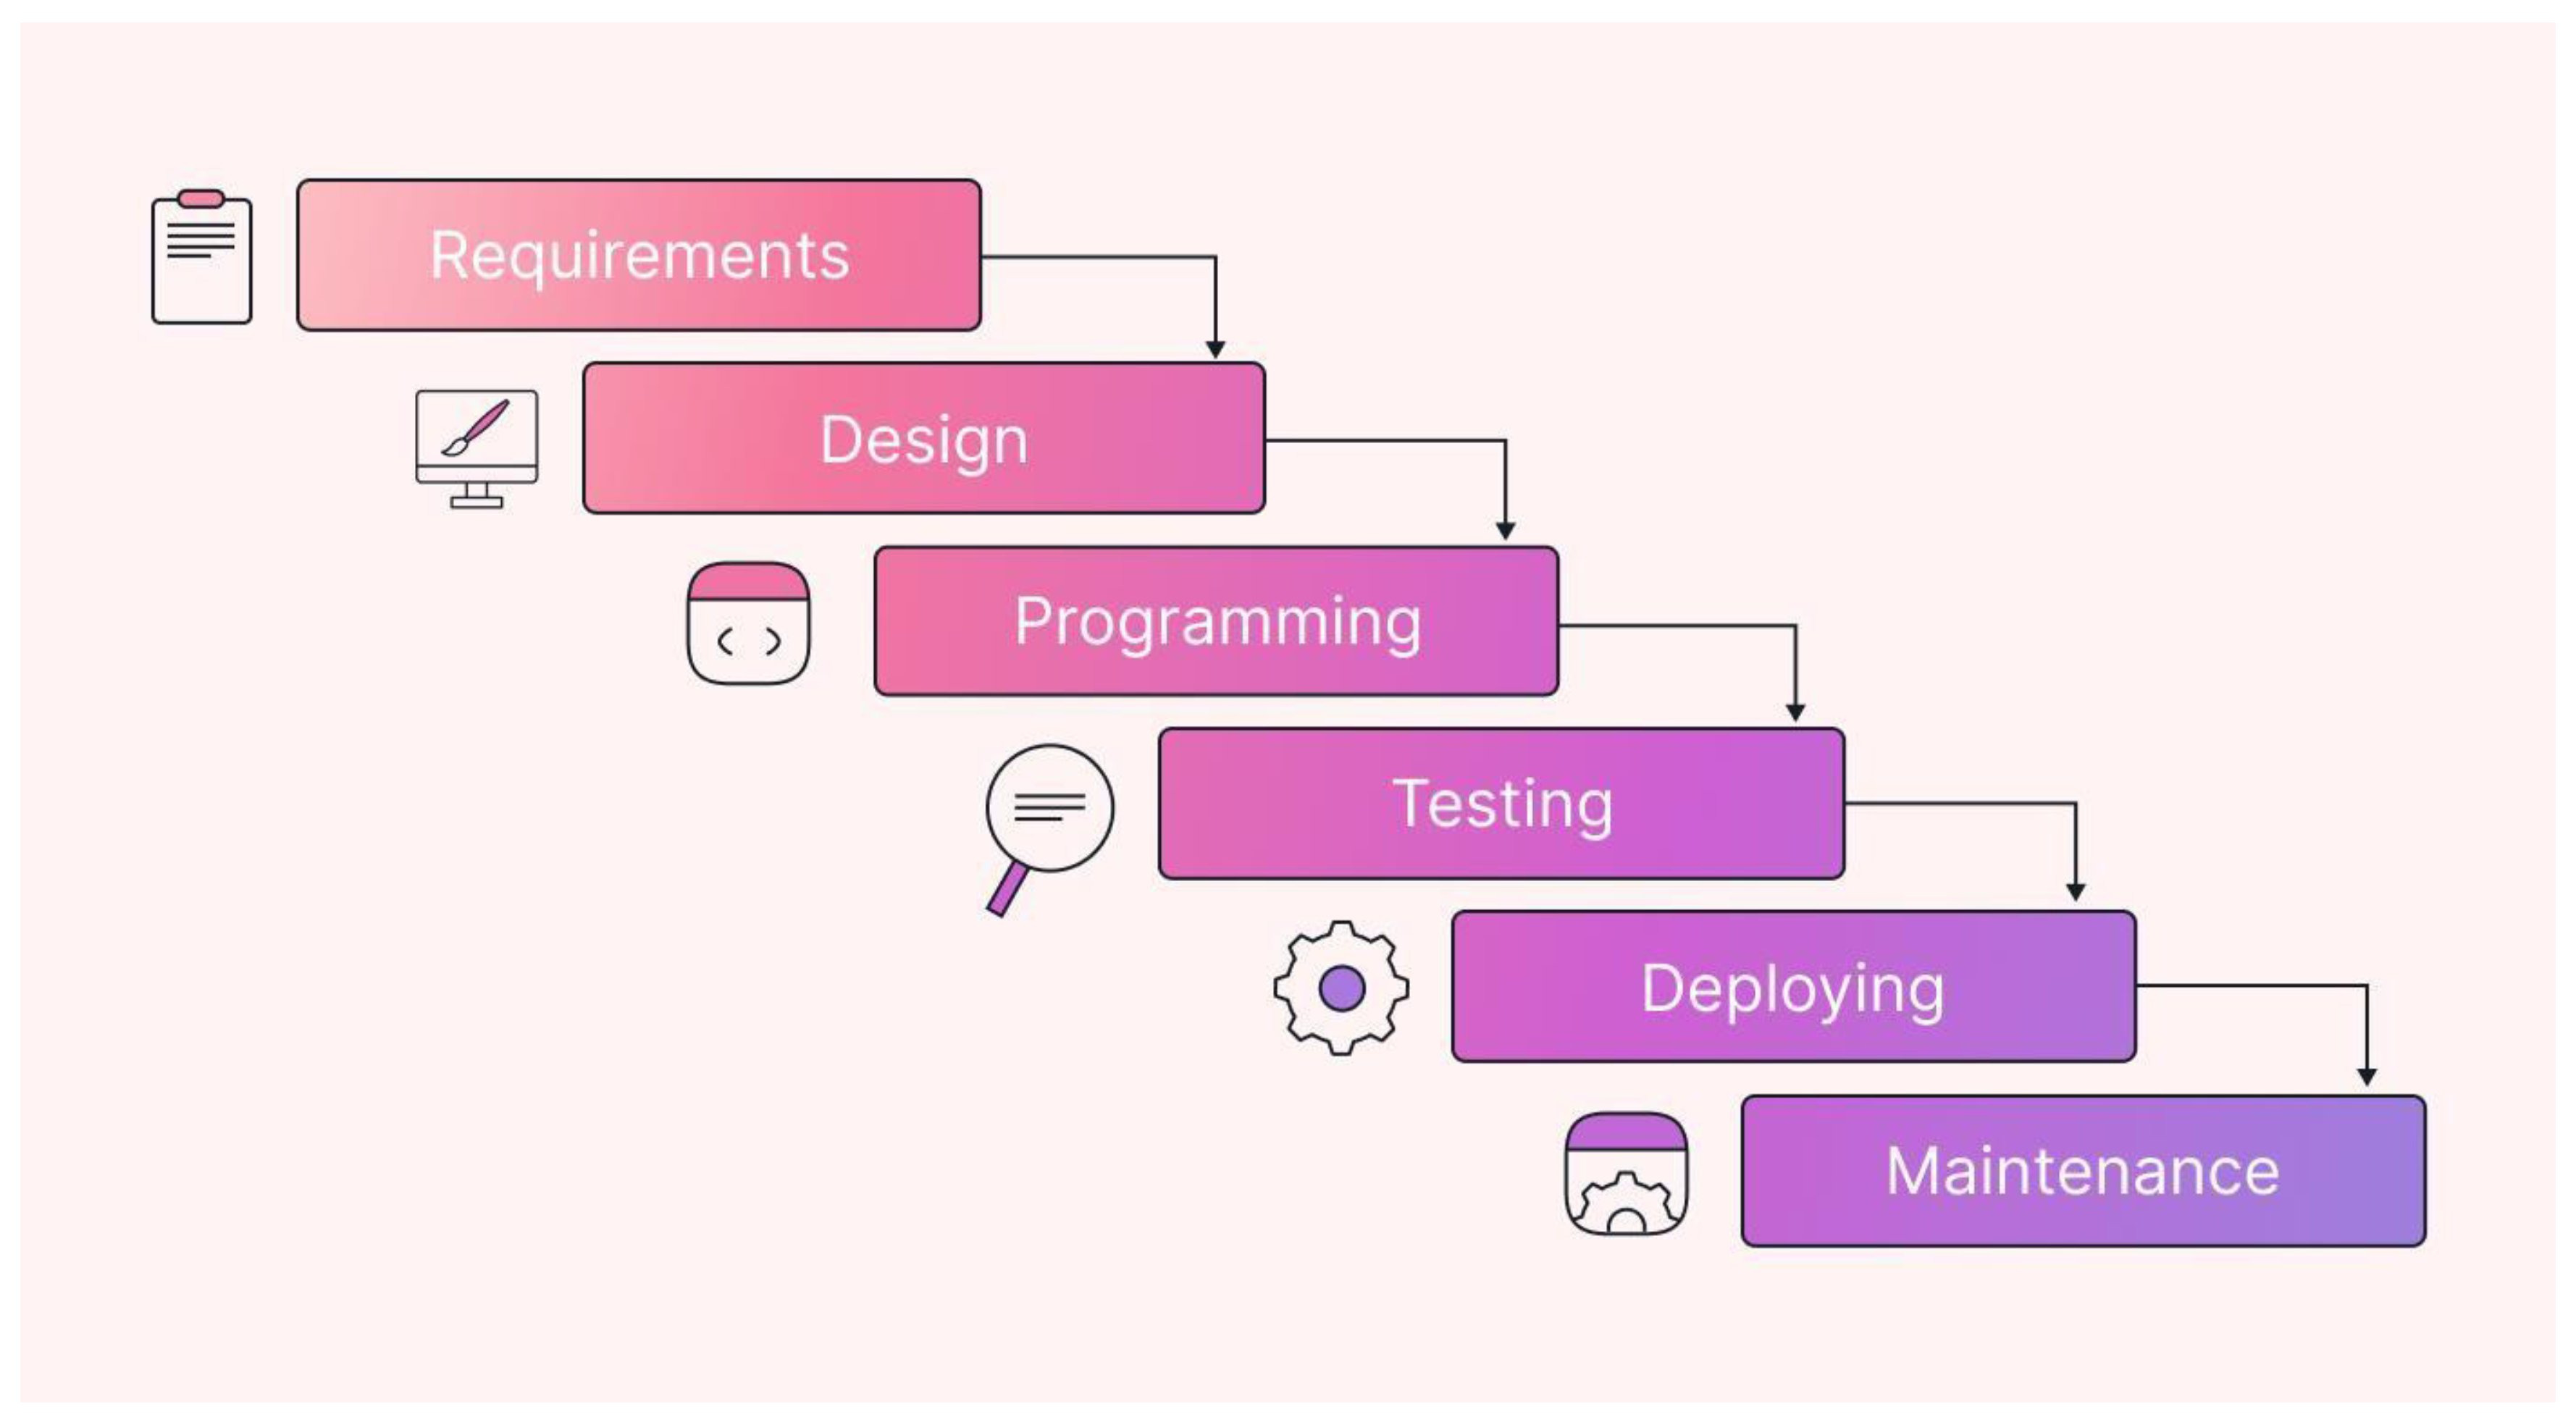
Although due to time and budget constraints Tumor Track web application is not deployed yet and we hope to deploy it in the near future. So the next sections will go through all the phases one by one.
3.4.2. Requirements Analysis
The first step in the software development process for Tumor Track was to gather and analyze the requirements. The requirements were categorized into functional and non- functional requirements.
Functional Requirements:
- User Authentication: The system must allow users to register, log in, and manage their accounts.
- Role-Based Access Control: Different roles (patient, medical receptionist, doctor, radiologist, specialist, and admin) must have appropriate access levels and functionalities.
- Patient History Documentation: Doctors must be able to document patient history and diagnosis.
- MRI Referral: Doctors must be able to refer patients to radiologists for MRI scans.
- MRI Result Upload: Radiologists must be able to upload MRI results and their diagnosis.
- Secure Communication: Communication between users must be compliant with relevant healthcare regulations and standards.
- Specialist Consultation: Doctors must be able to consult specialists or refer patients to them if needed.
- Notifications: The system must notify users about anything that might require their response or concern them.
Non-Functional Requirements:
- Security and Privacy: The system must ensure the confidentiality, integrity, and availability of patient data.
- Usability: The interface must be user-friendly and accessible.
- Performance: The system must be responsive and handle multiple user requests efficiently.
- Scalability: The system must be able to scale to accommodate a growing number of users and data.
To effectively capture and communicate these requirements, we utilized various modeling techniques, including use case diagrams, activity diagrams, and sequence diagrams. These visual tools will help in illustrating the interactions between different system components, user roles, and workflows, providing a clear and comprehensive understanding of the system's behavior and requirements.
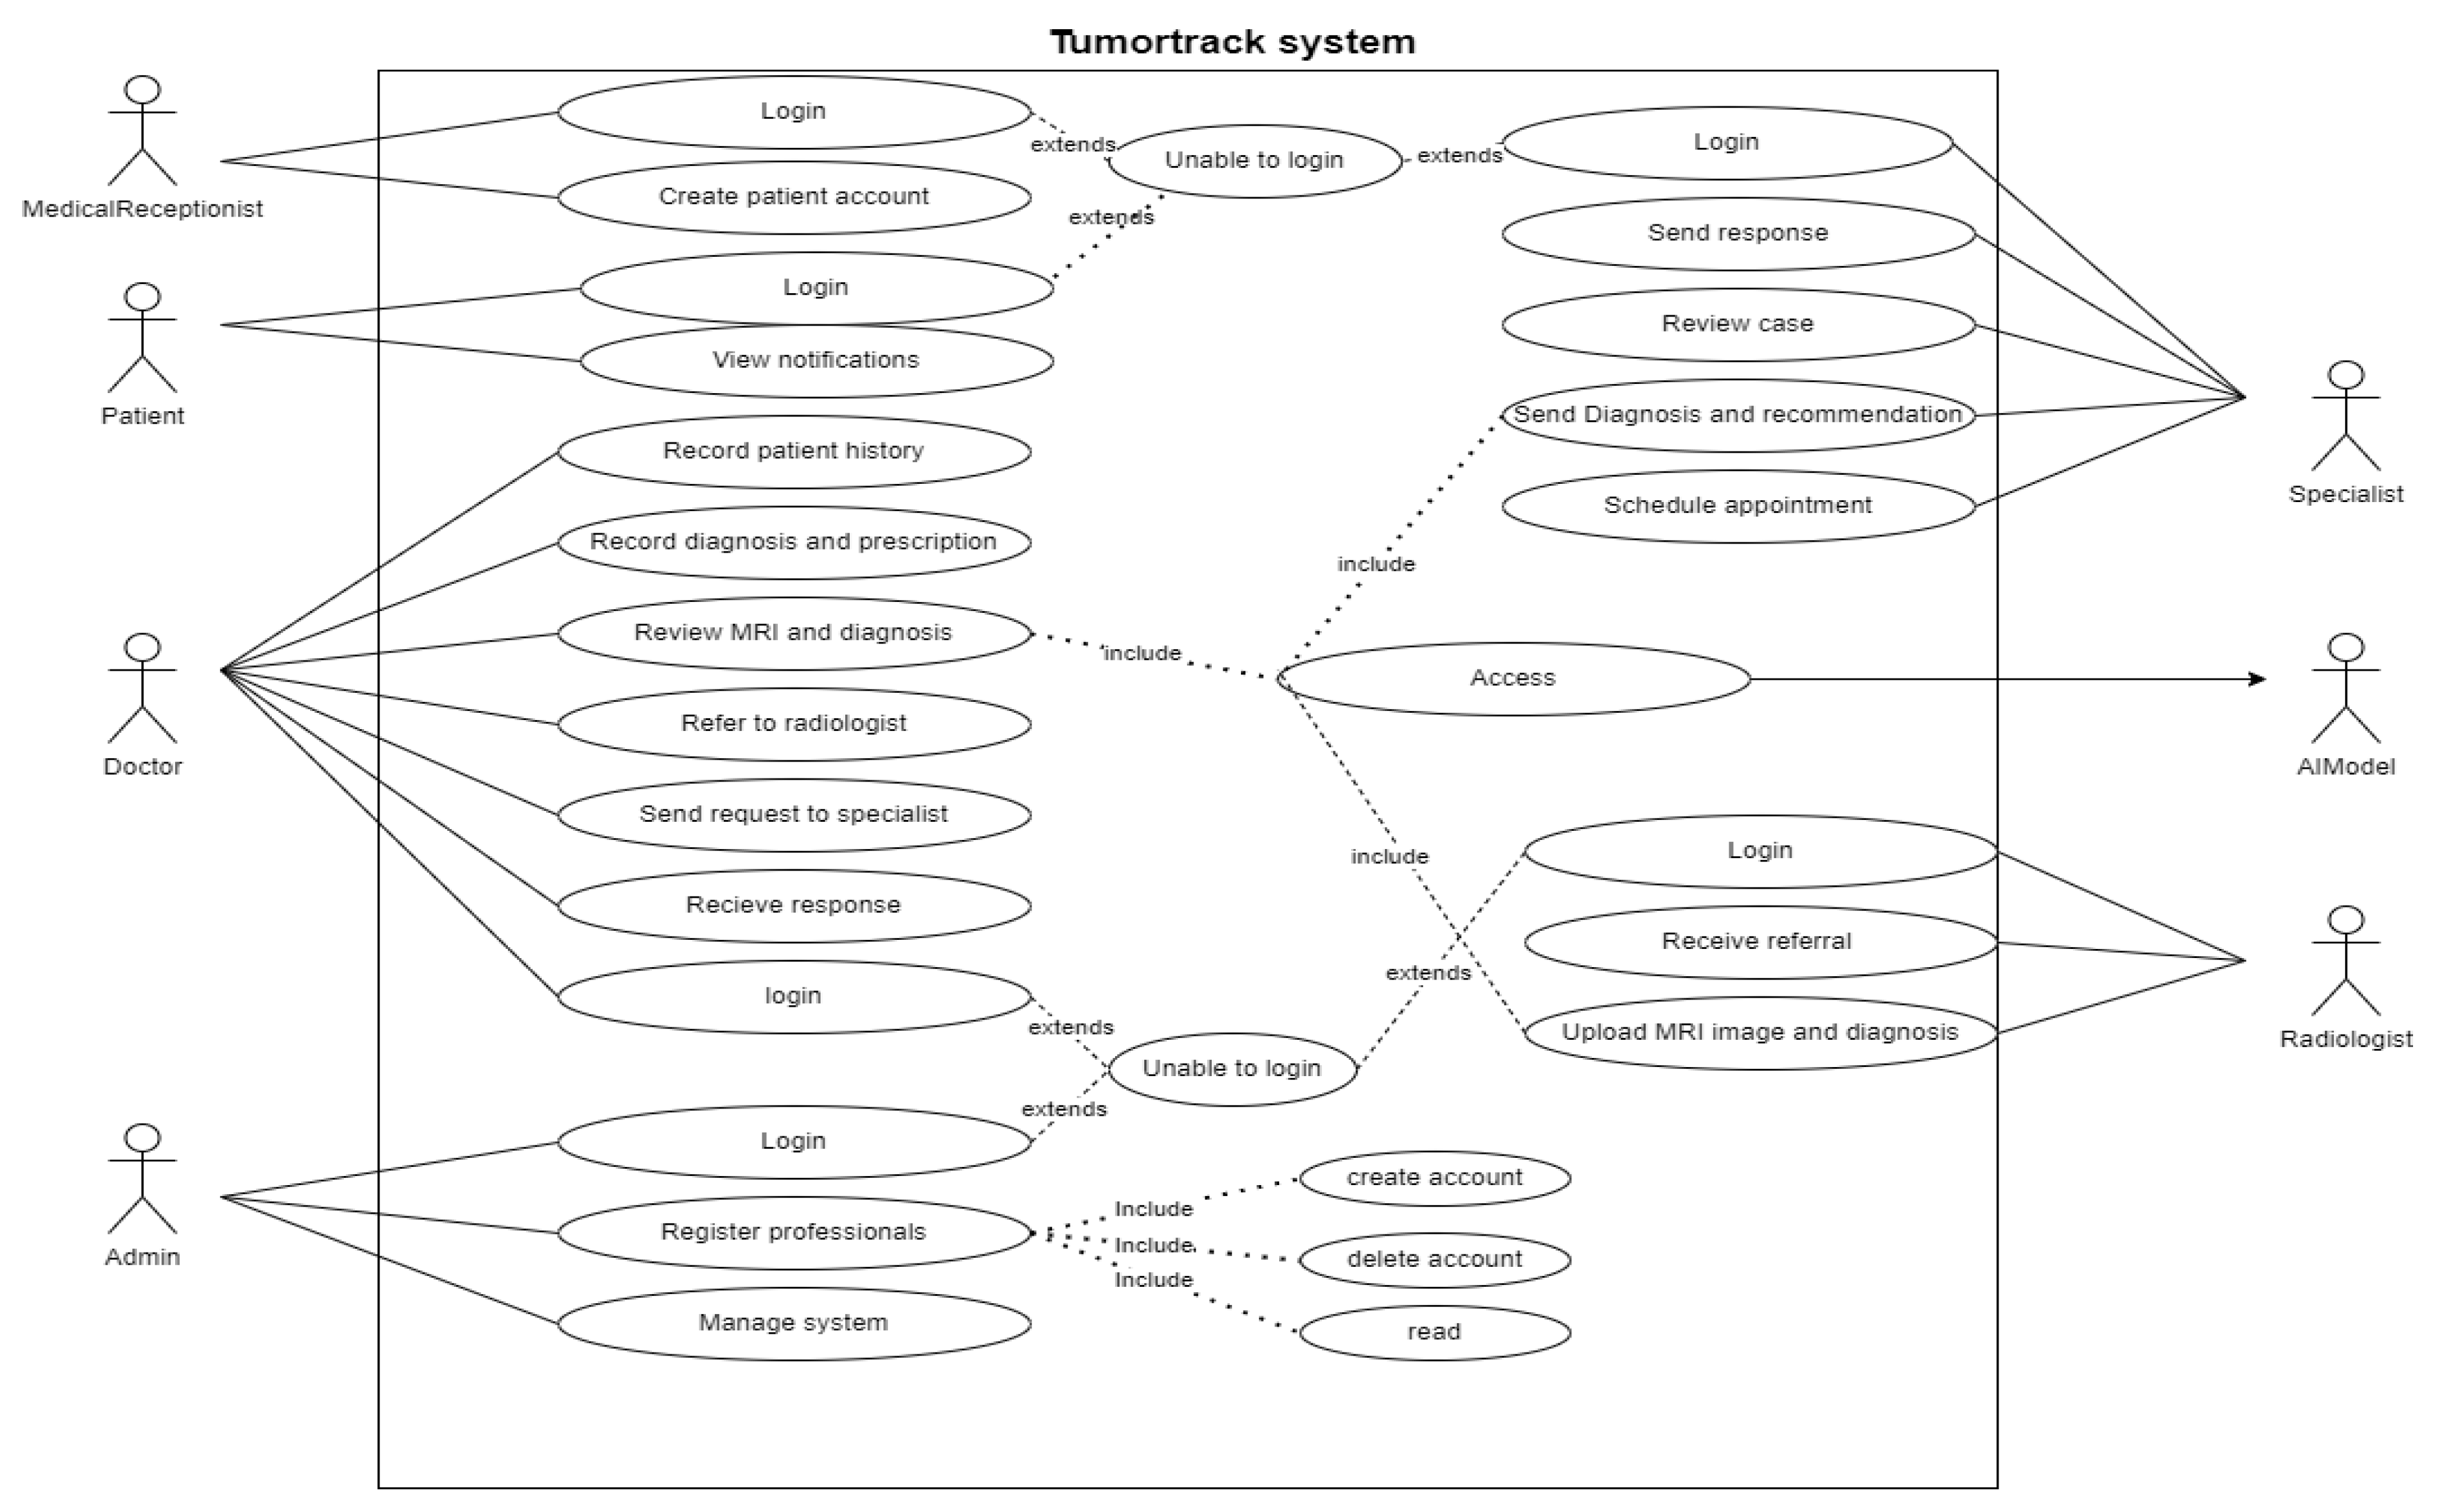
3.4.2.1. UML Use Case Model UML Use Case Diagram
The use case diagram highlights the interactions between users and the system, detailing the various functionalities the software offers.
Figure 2.
Use case diagram
- UML Use Case Table

Table 1.
login use case table.
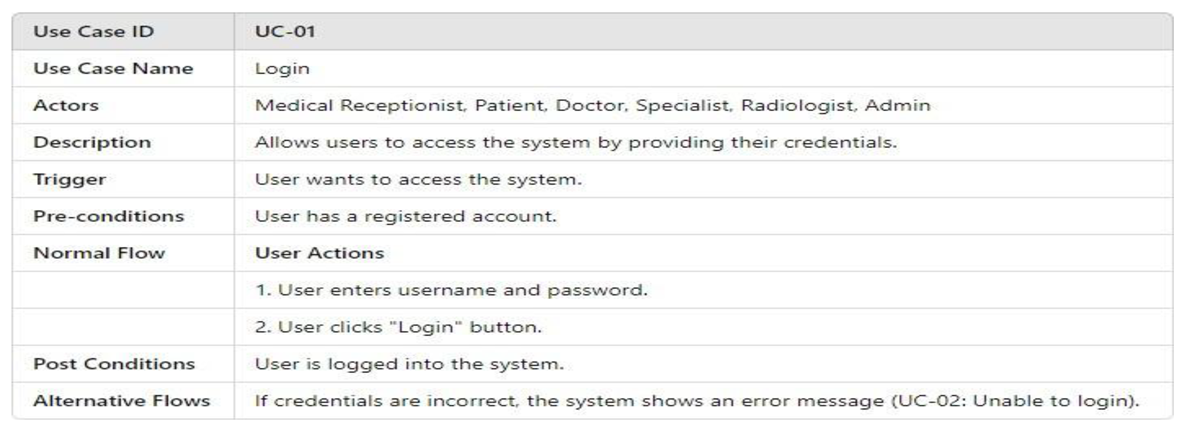
Table 2.
Create patient use case table.
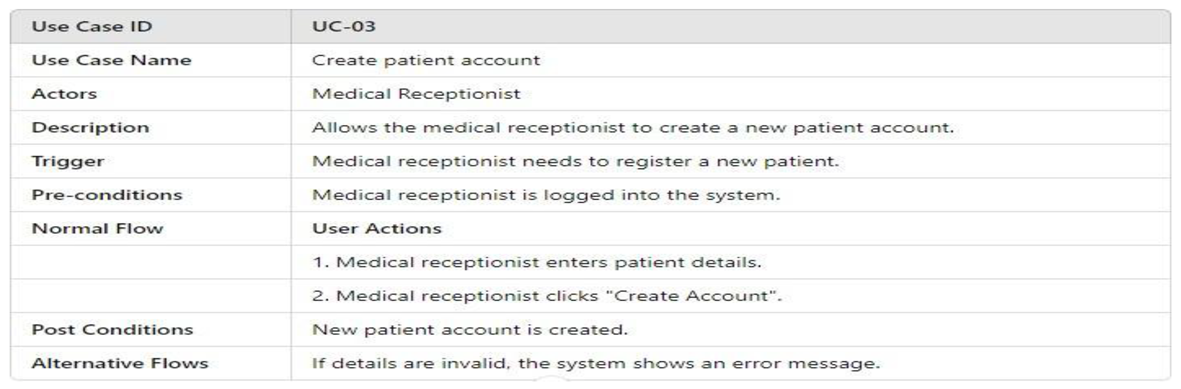
Table 3.
View notification use case table.
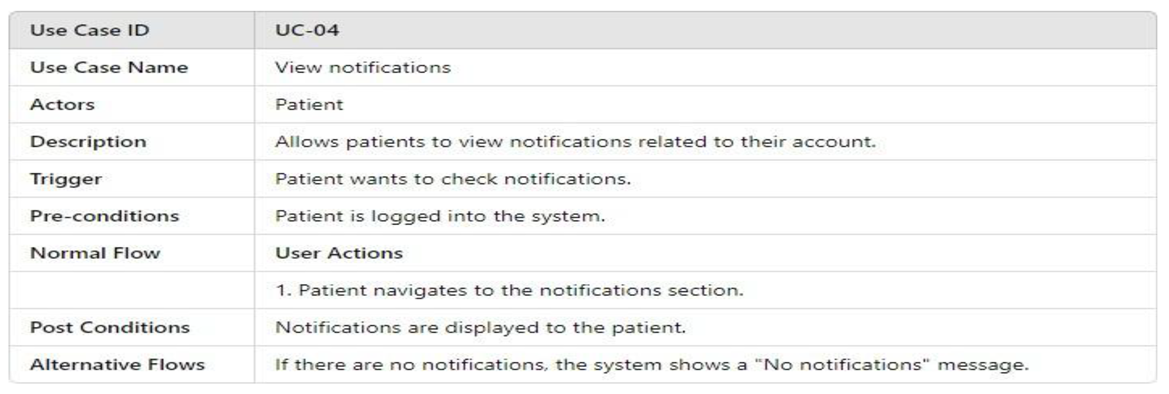
Table 4.
Record patient use case table.
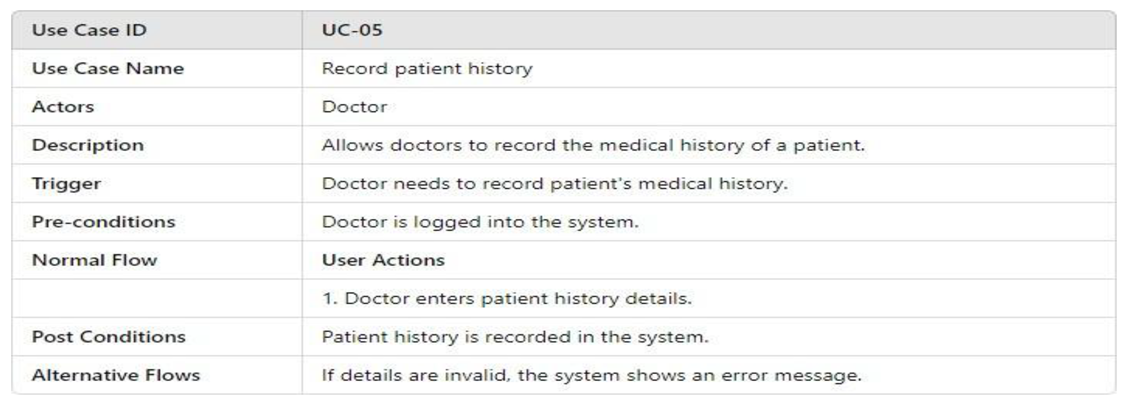
Table 5.
Record diagnosis and prescription.
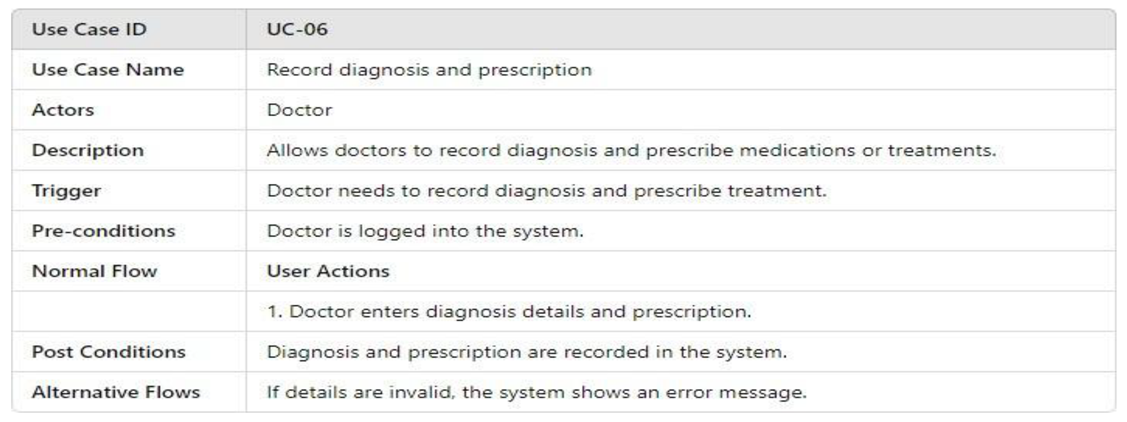
Table 6.
Review MRI and diagnosis use case table.
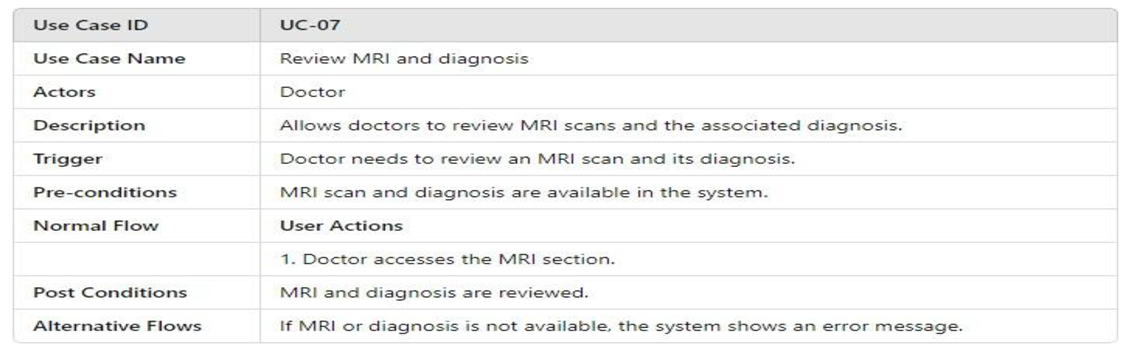
Table 7.
Refer to radiologist use case table.
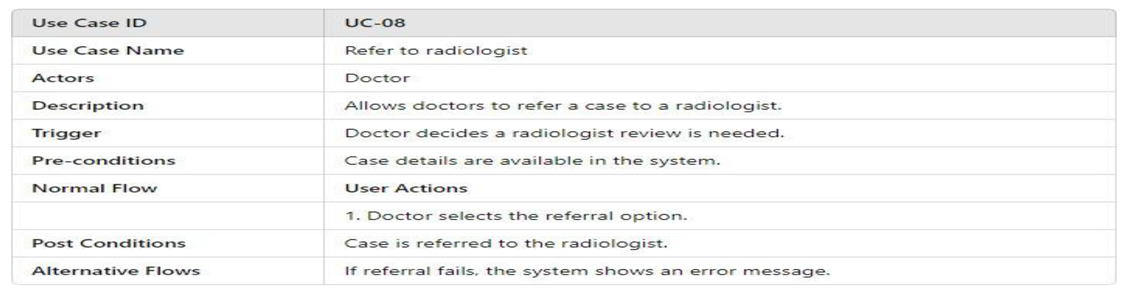
Table 8.
Send request to specialist use case table.
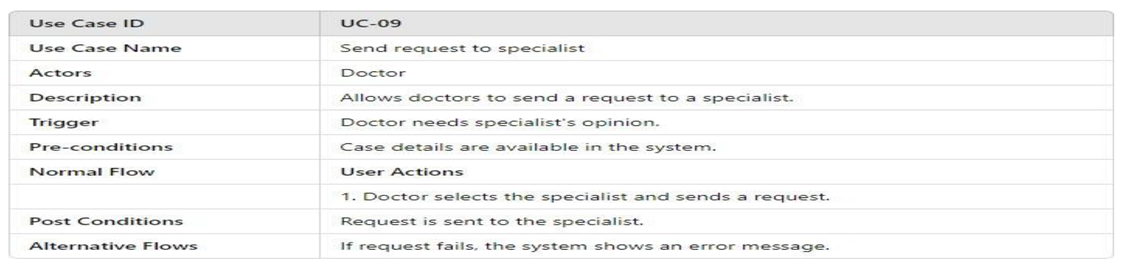
Table 9.
Receive response use case table.
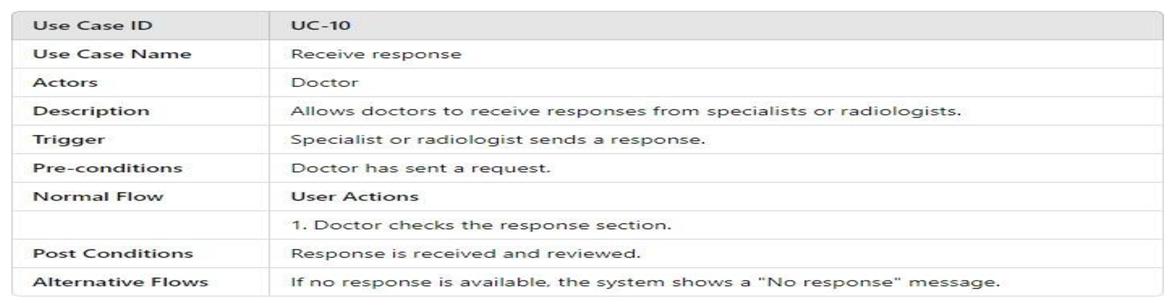
Table 10.
Register professionals use case table.
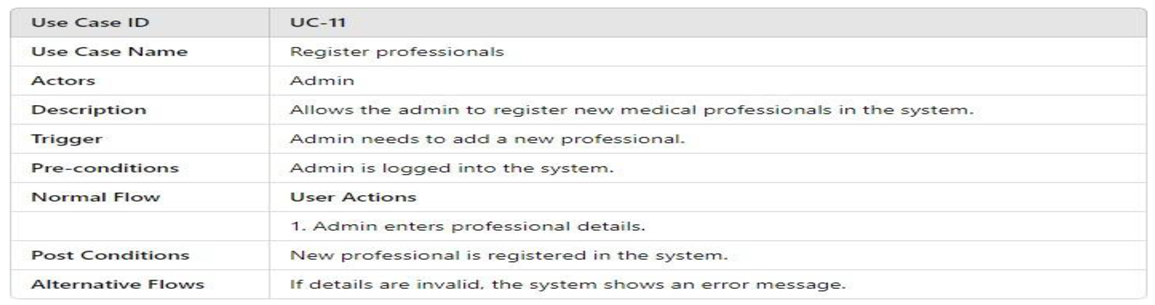
Table 11.
Manage system use case table.
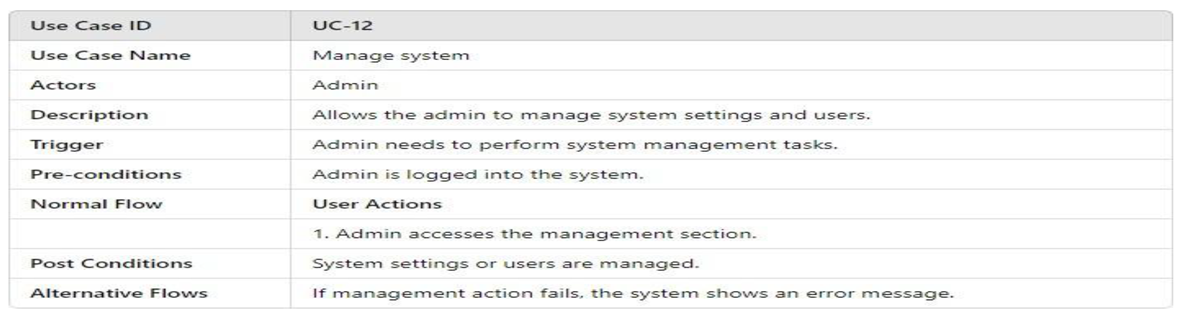
Table 12.
Send response use case table.
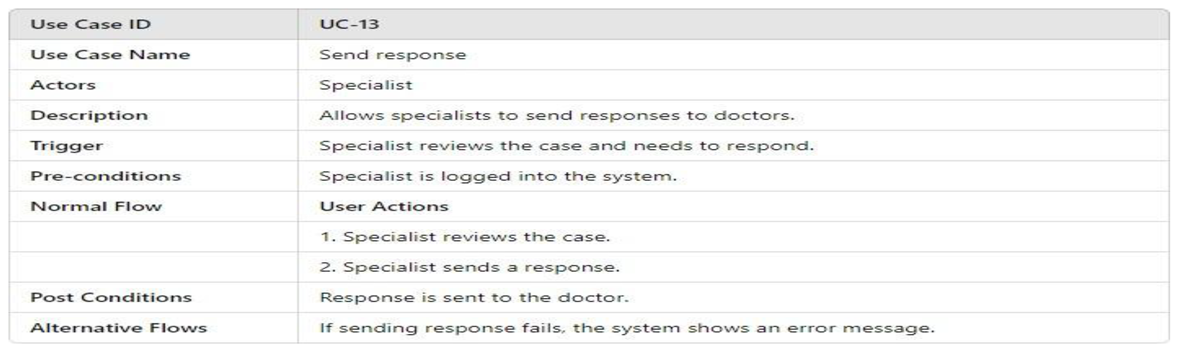
Table 13.
Review case use case table.
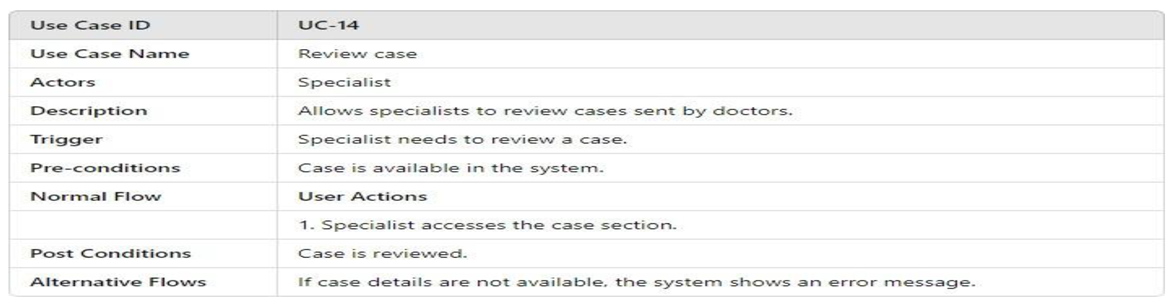
Table 14.
Send diagnosis and recommendation use case table.
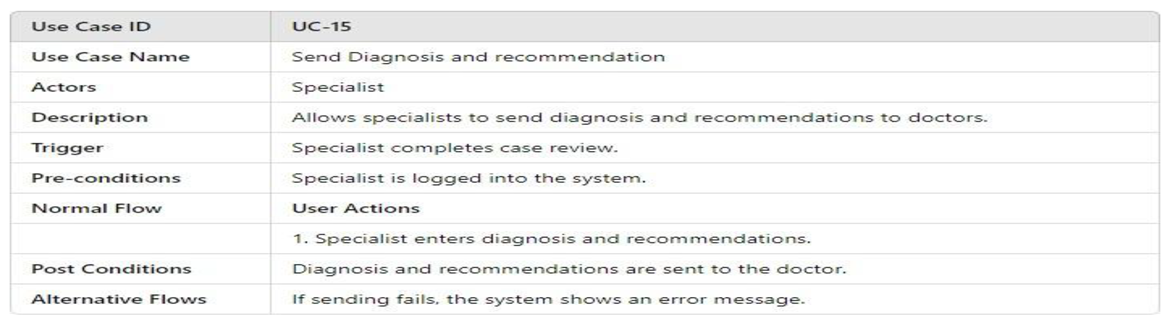
Table 15.
Schedule appointment use case table.
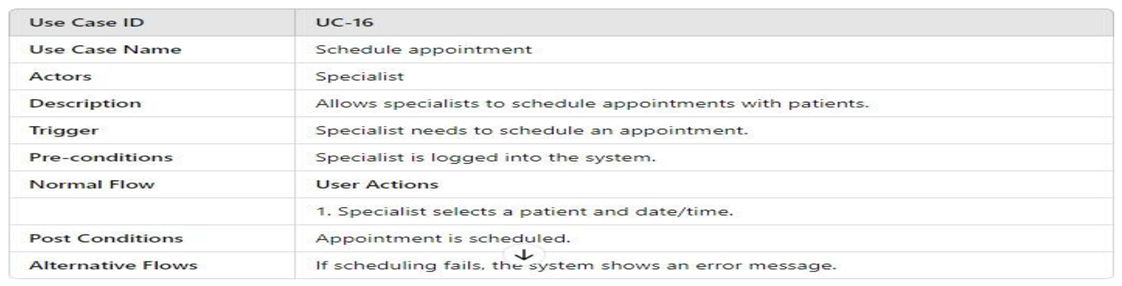
Table 16.
Receive referral use case table.
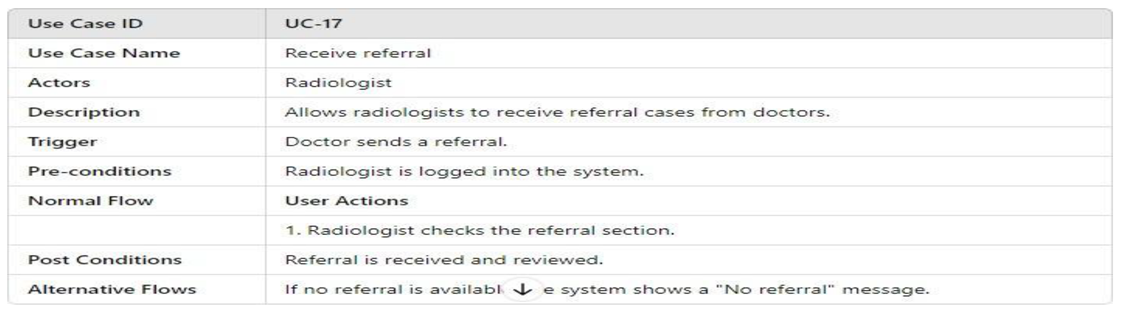
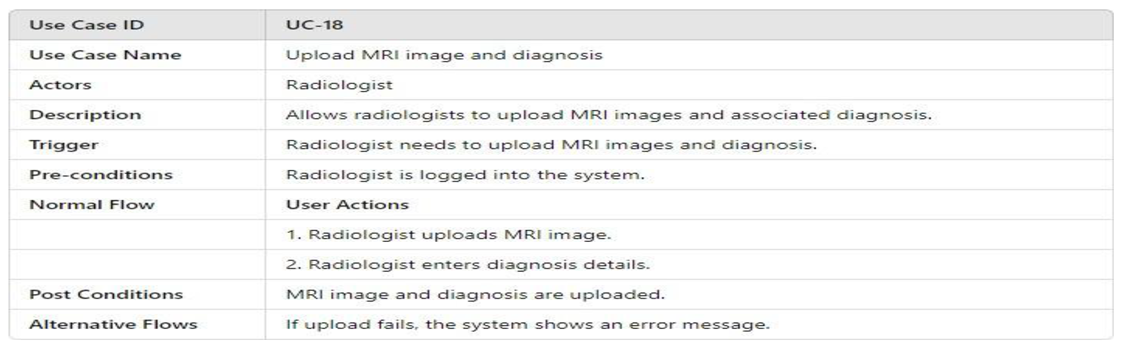
Table 17.
Upload MRI Image and diagnosis.
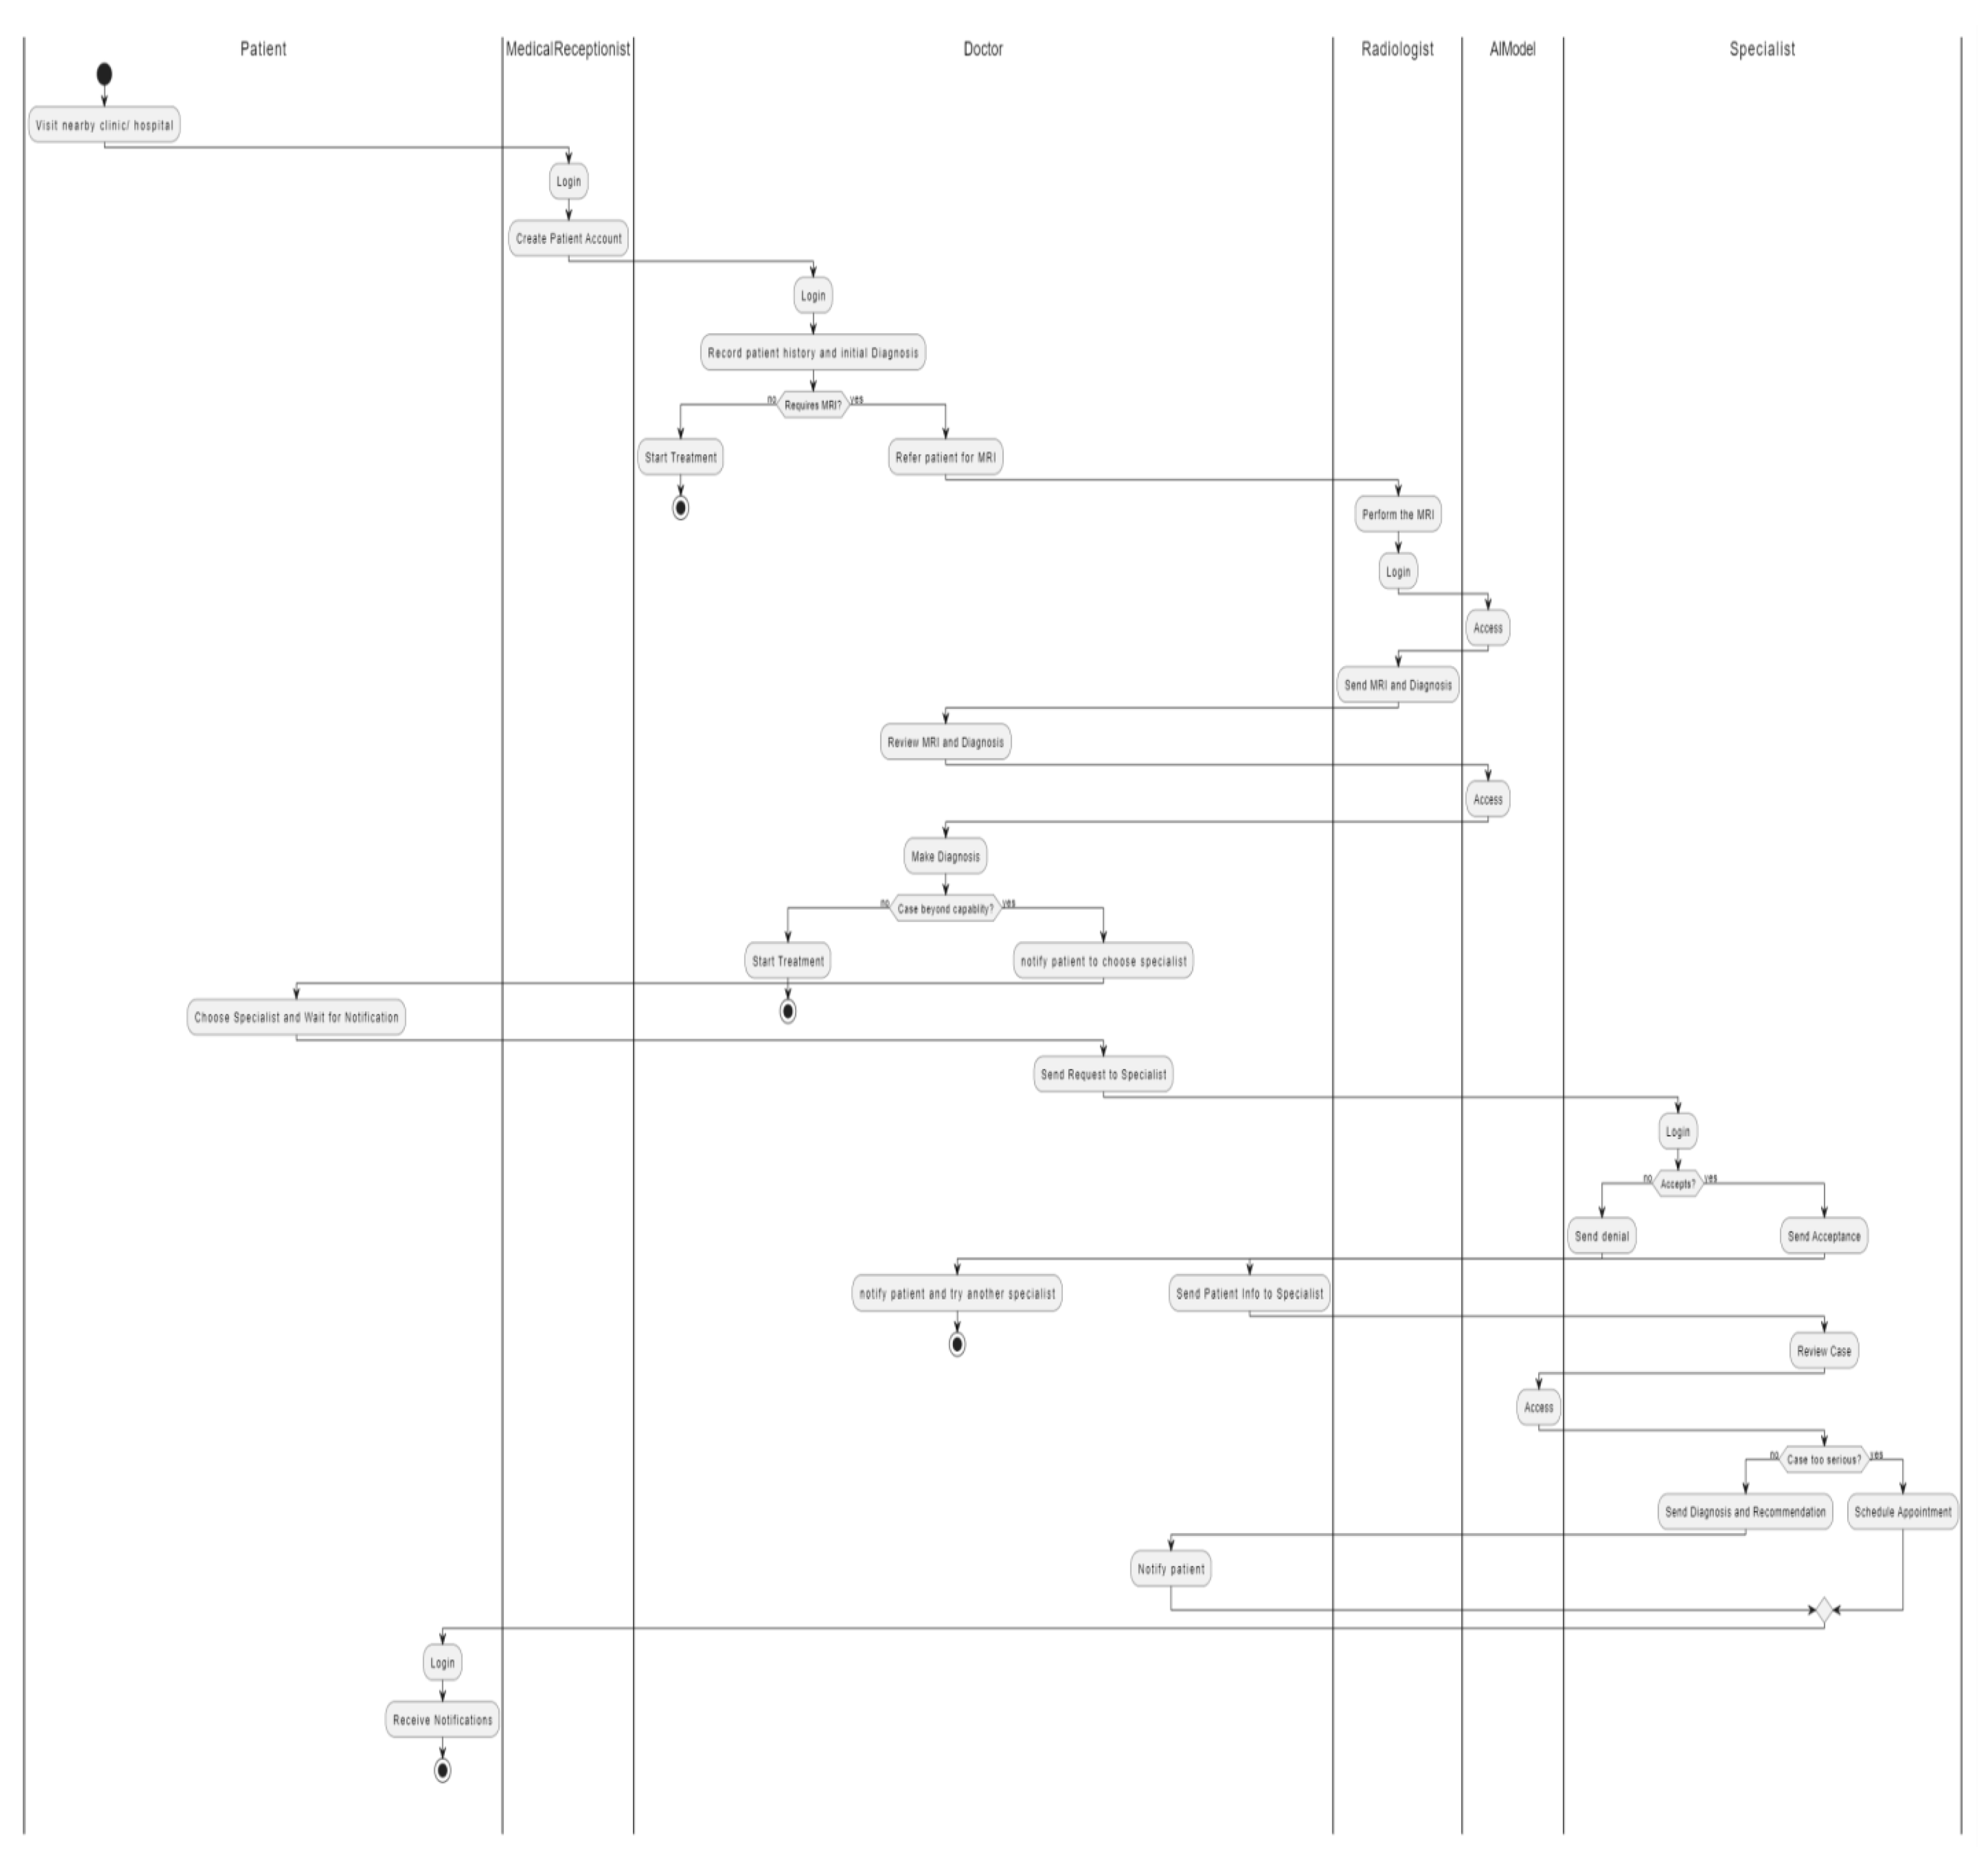
3.4.2.2. Activity Model
Activity Diagrams are used to illustrate the flow of control in a system and refer to the steps involved in the execution of a use case. The activity diagram focuses on the condition of flow and the sequence in which it happens. Here are the activity diagrams for Tumor Track web application:
Figure 3.
Admin Activity diagram.
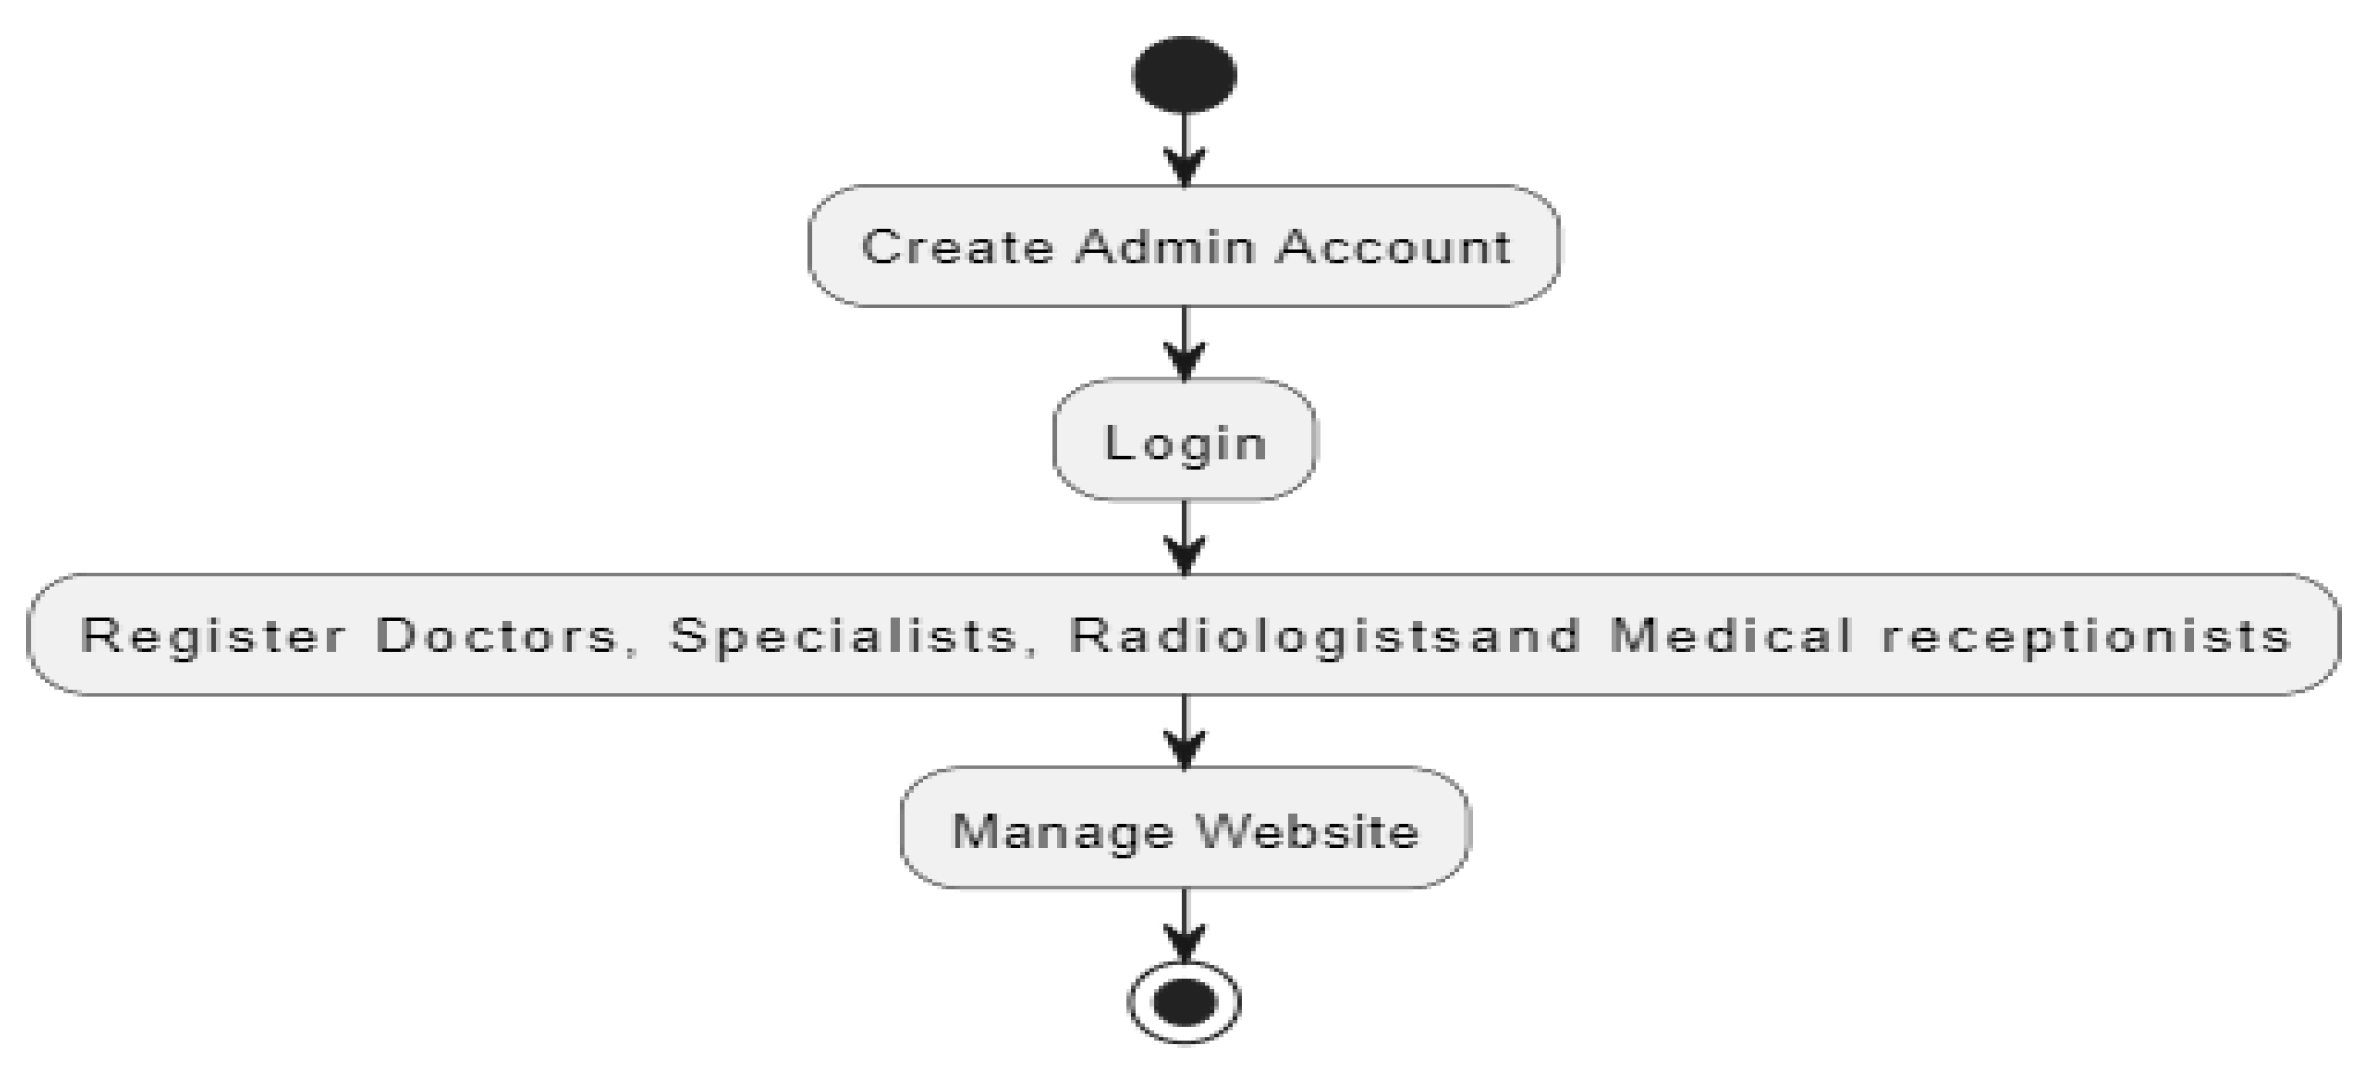
Figure 4.
User Activity diagram.
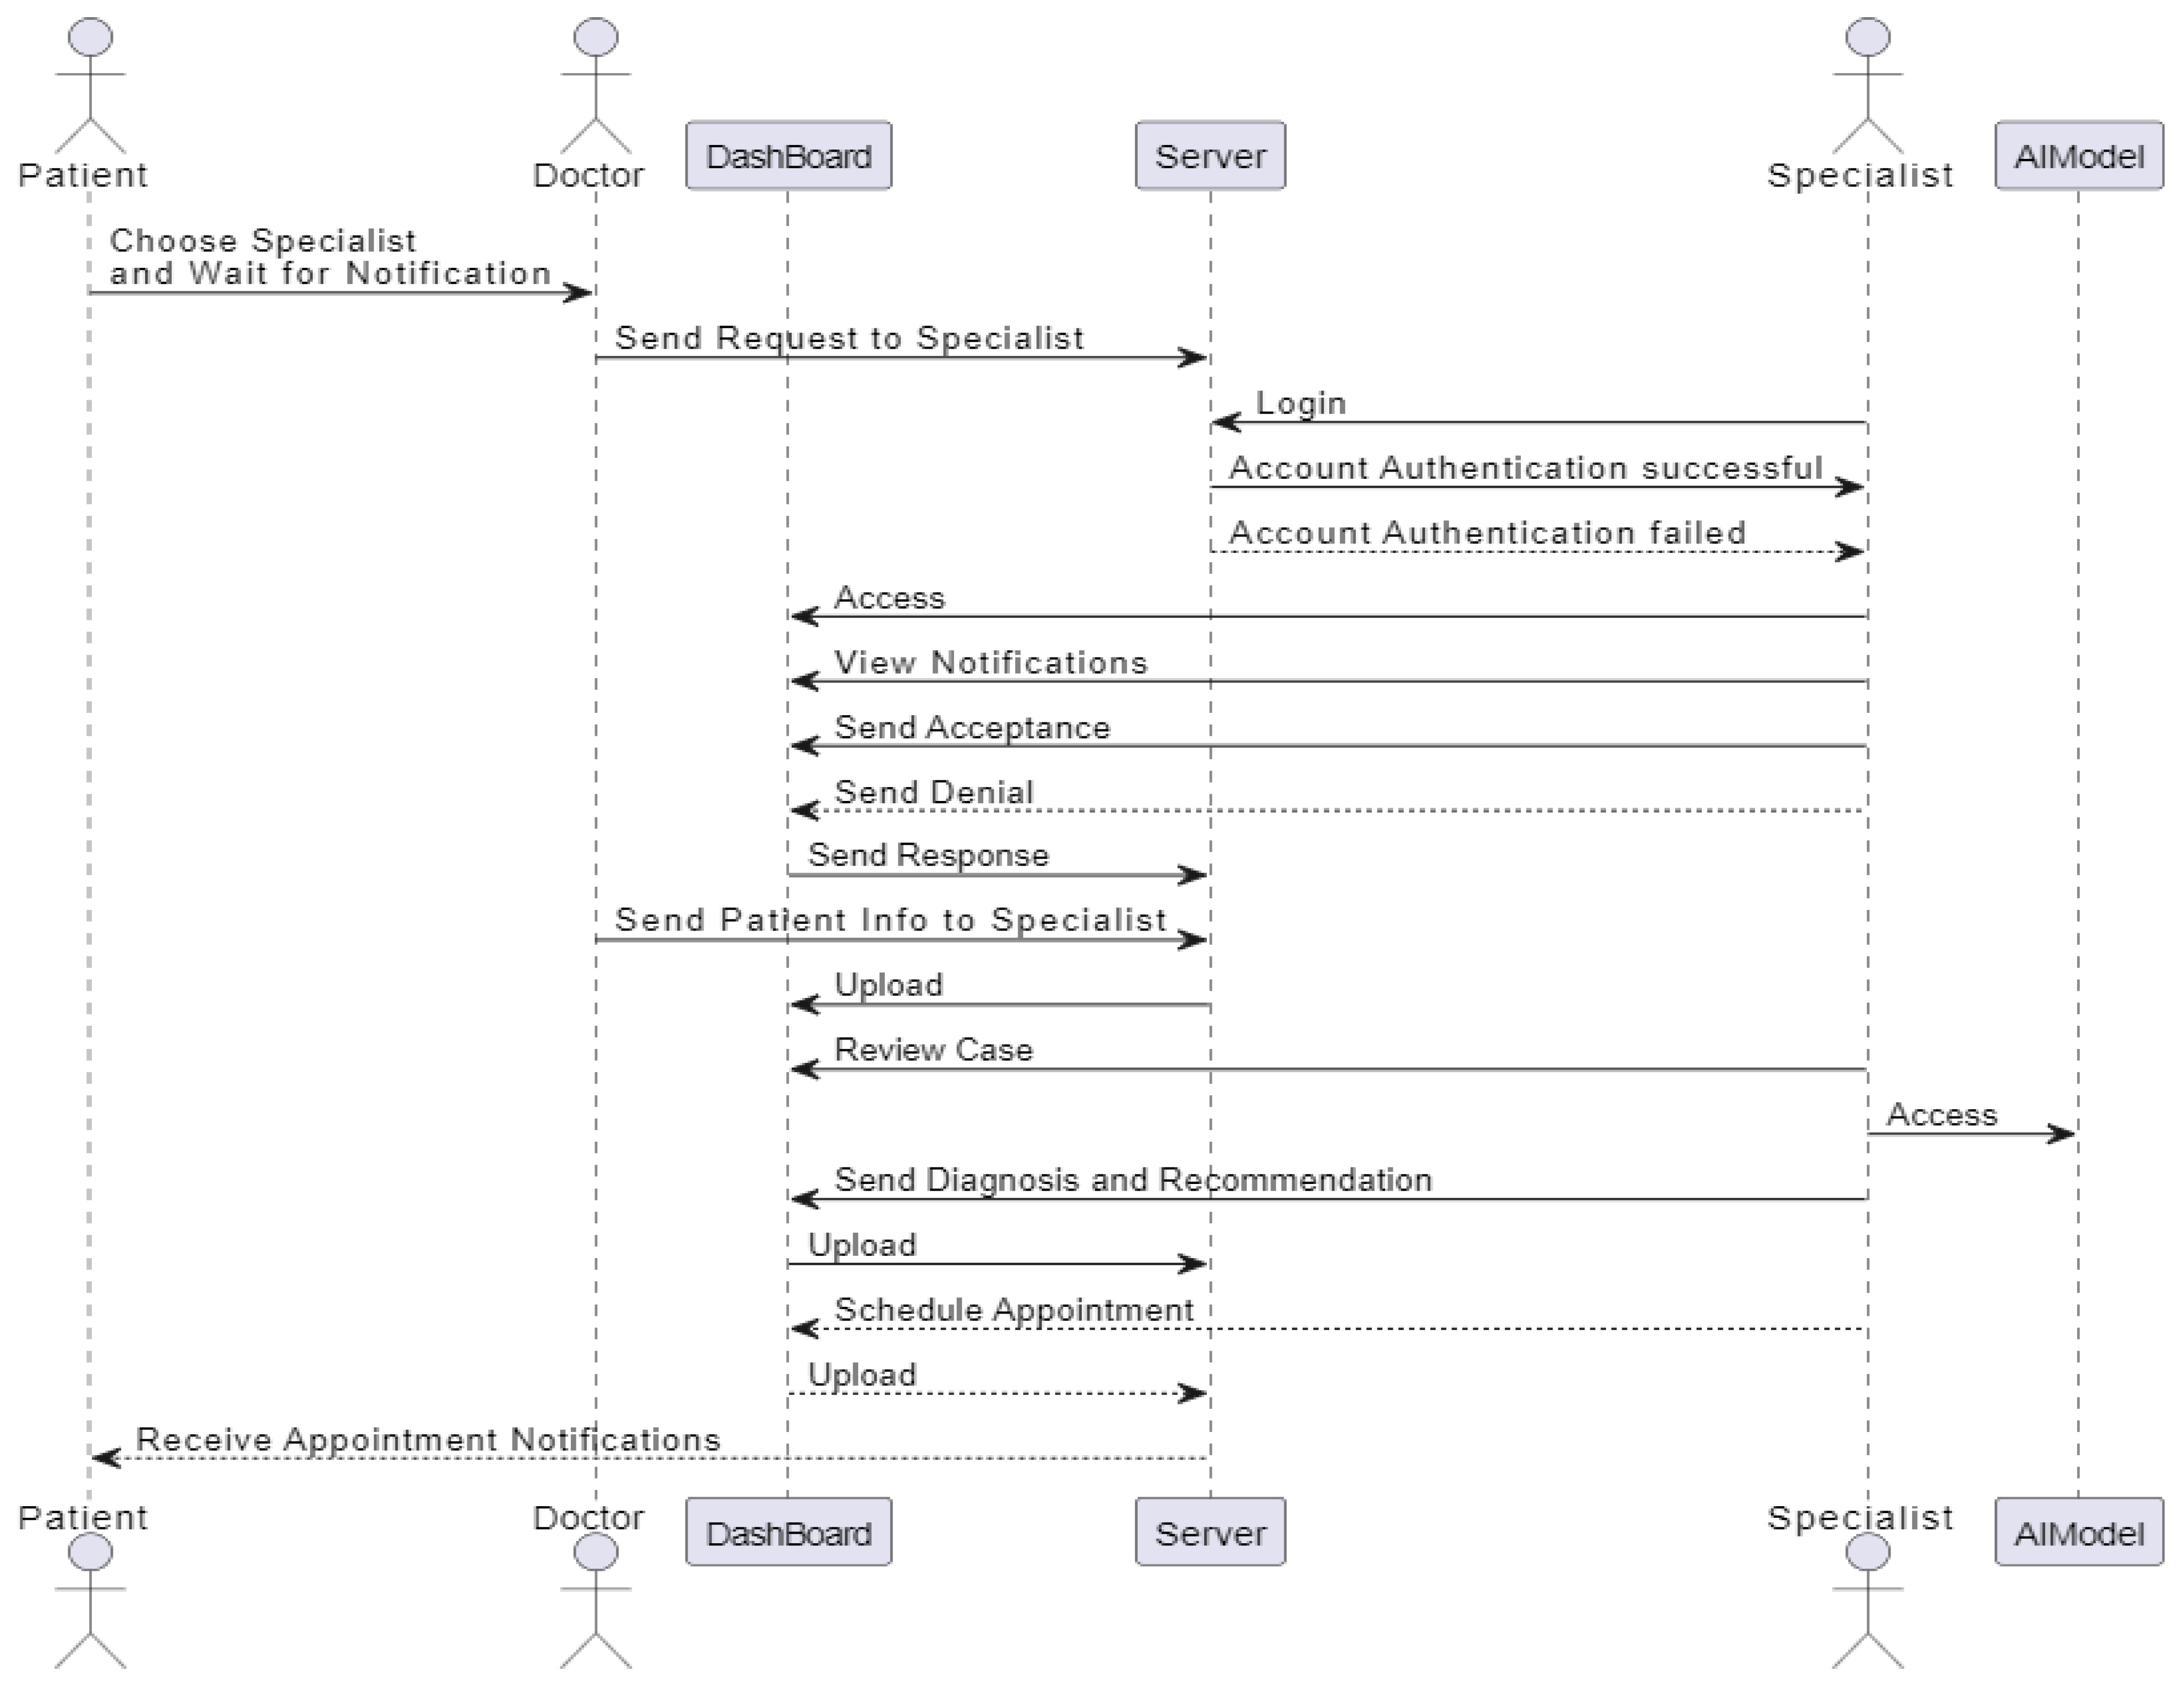
3.4.2.3. Sequence Diagram
A sequence diagram is an interaction diagram that shows object interactions arranged in time sequence. It depicts the objects and classes involved in the scenario and the sequence of messages exchanged between the objects needed to carry out the functionality of the scenario. Here are the sequence diagrams:
Figure 5.
Doctor Sequence diagram.
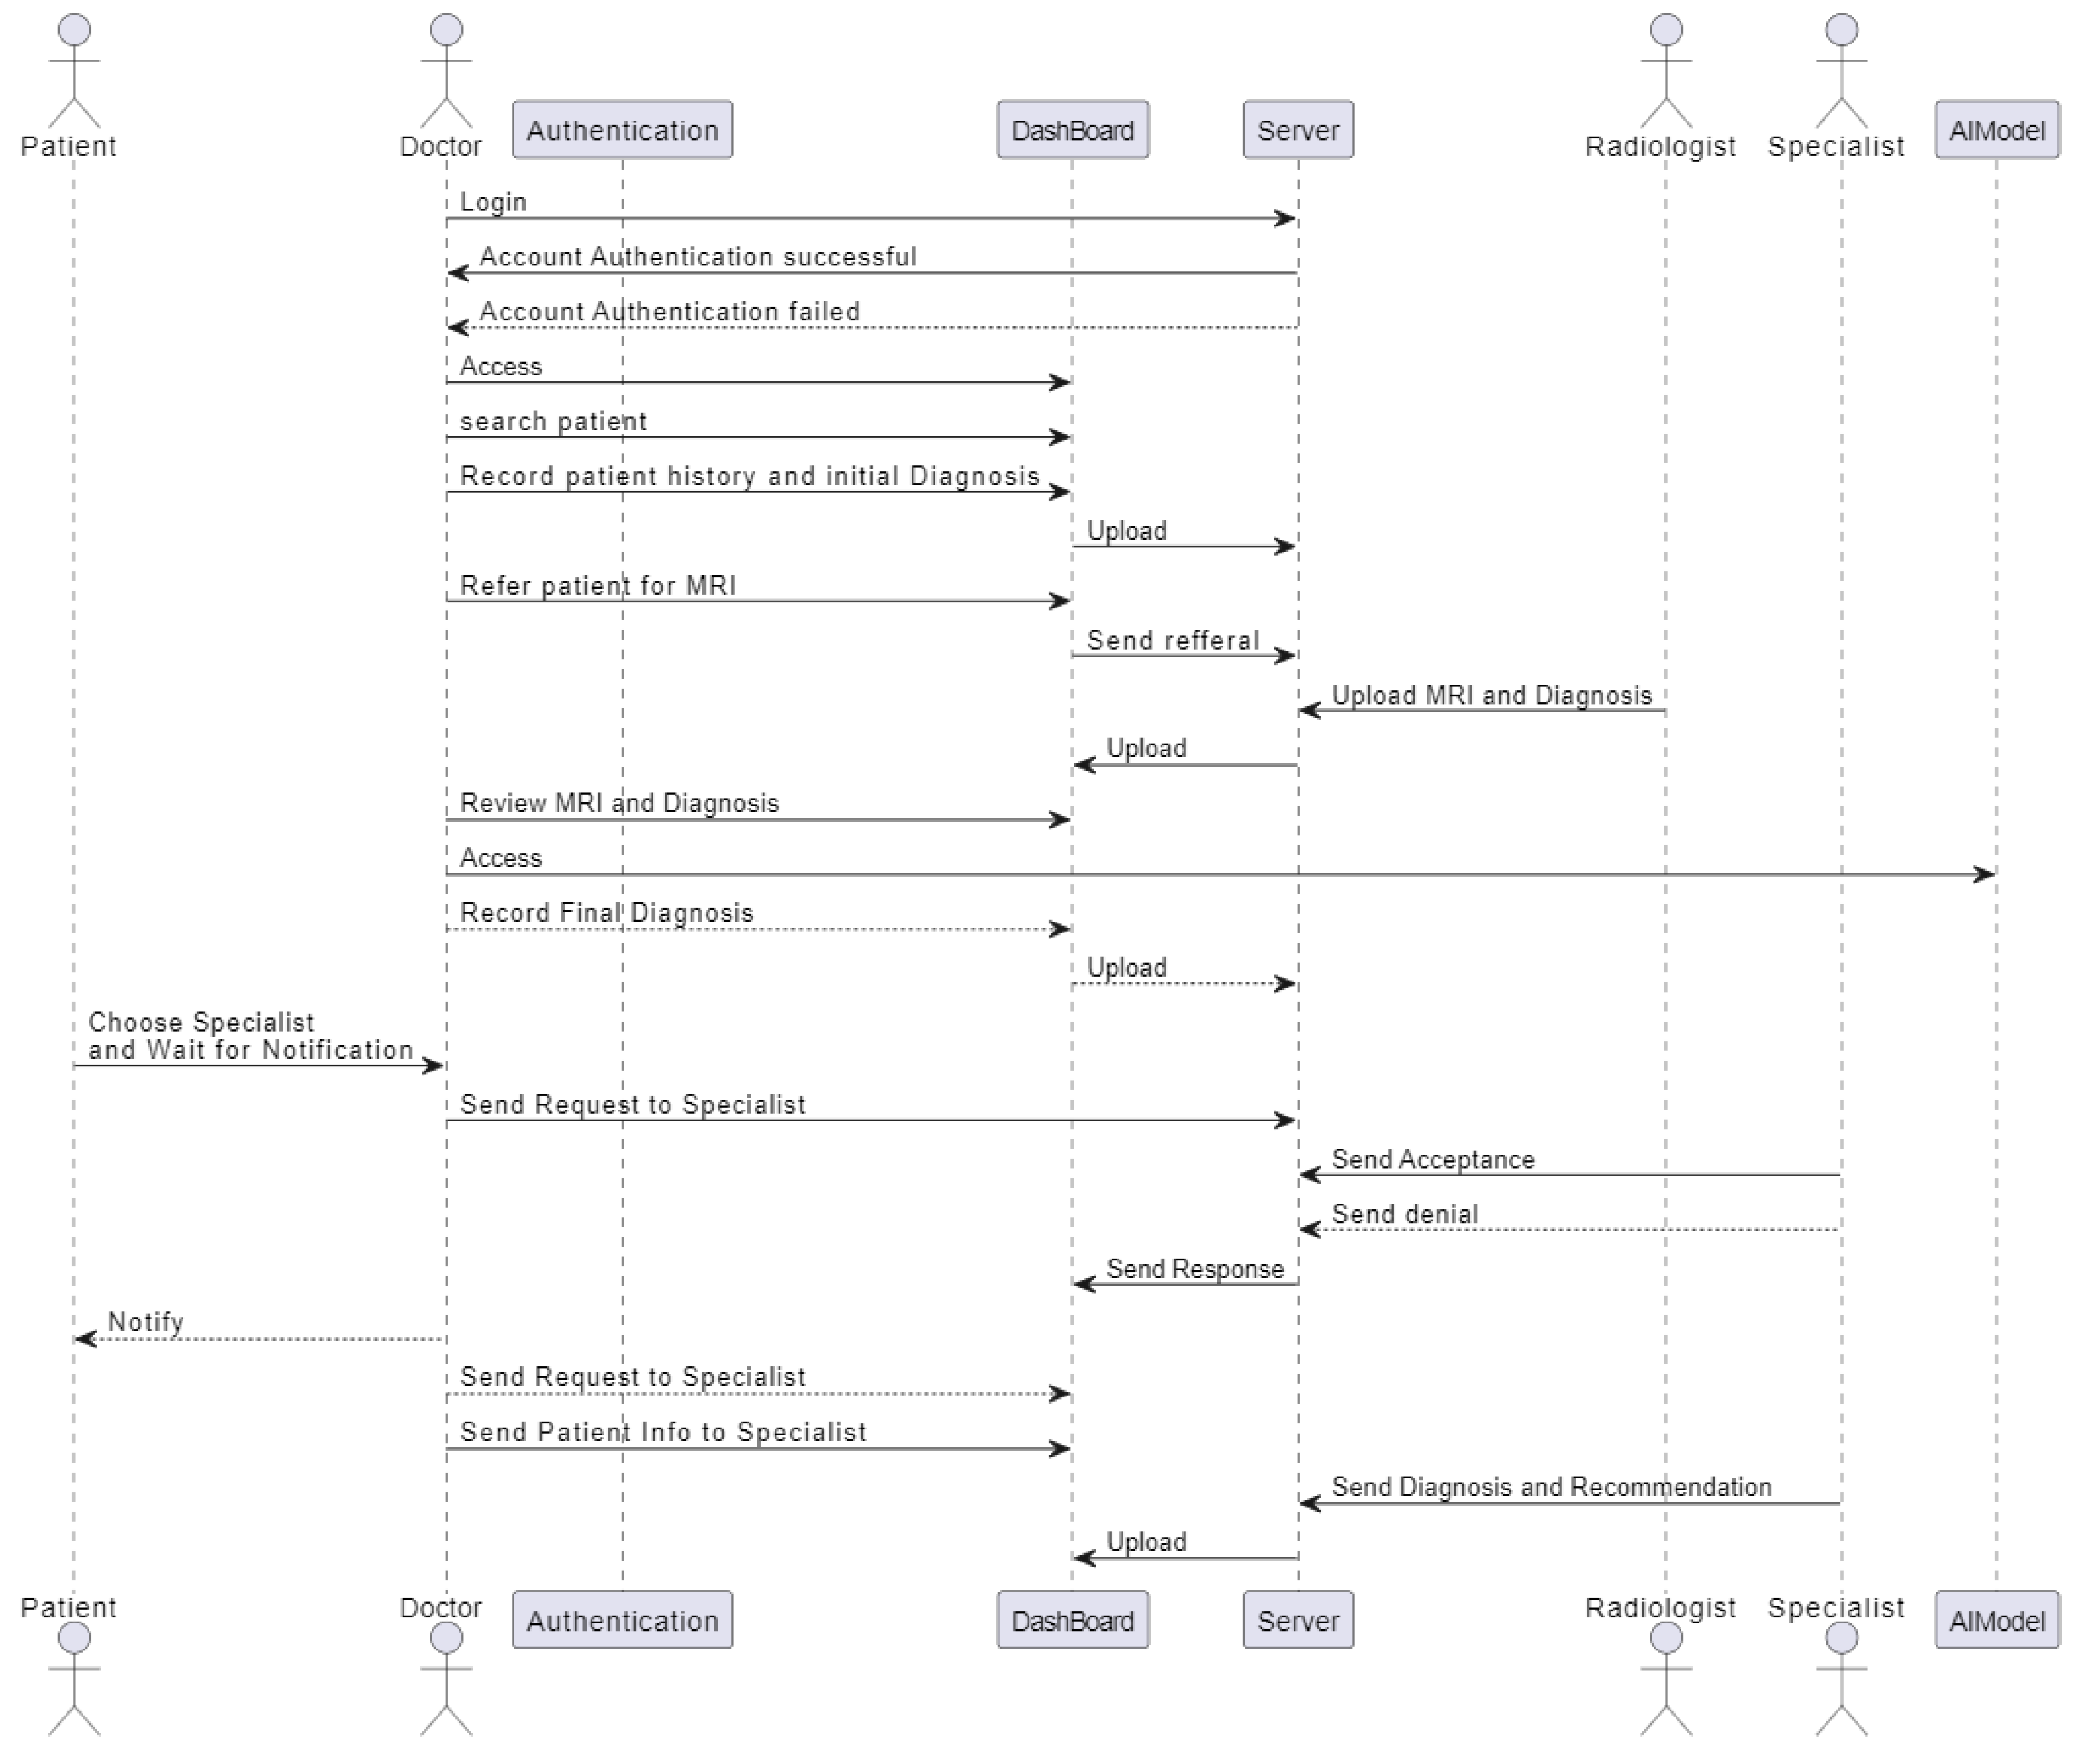
Figure 6.
Radiologist Sequence diagram.
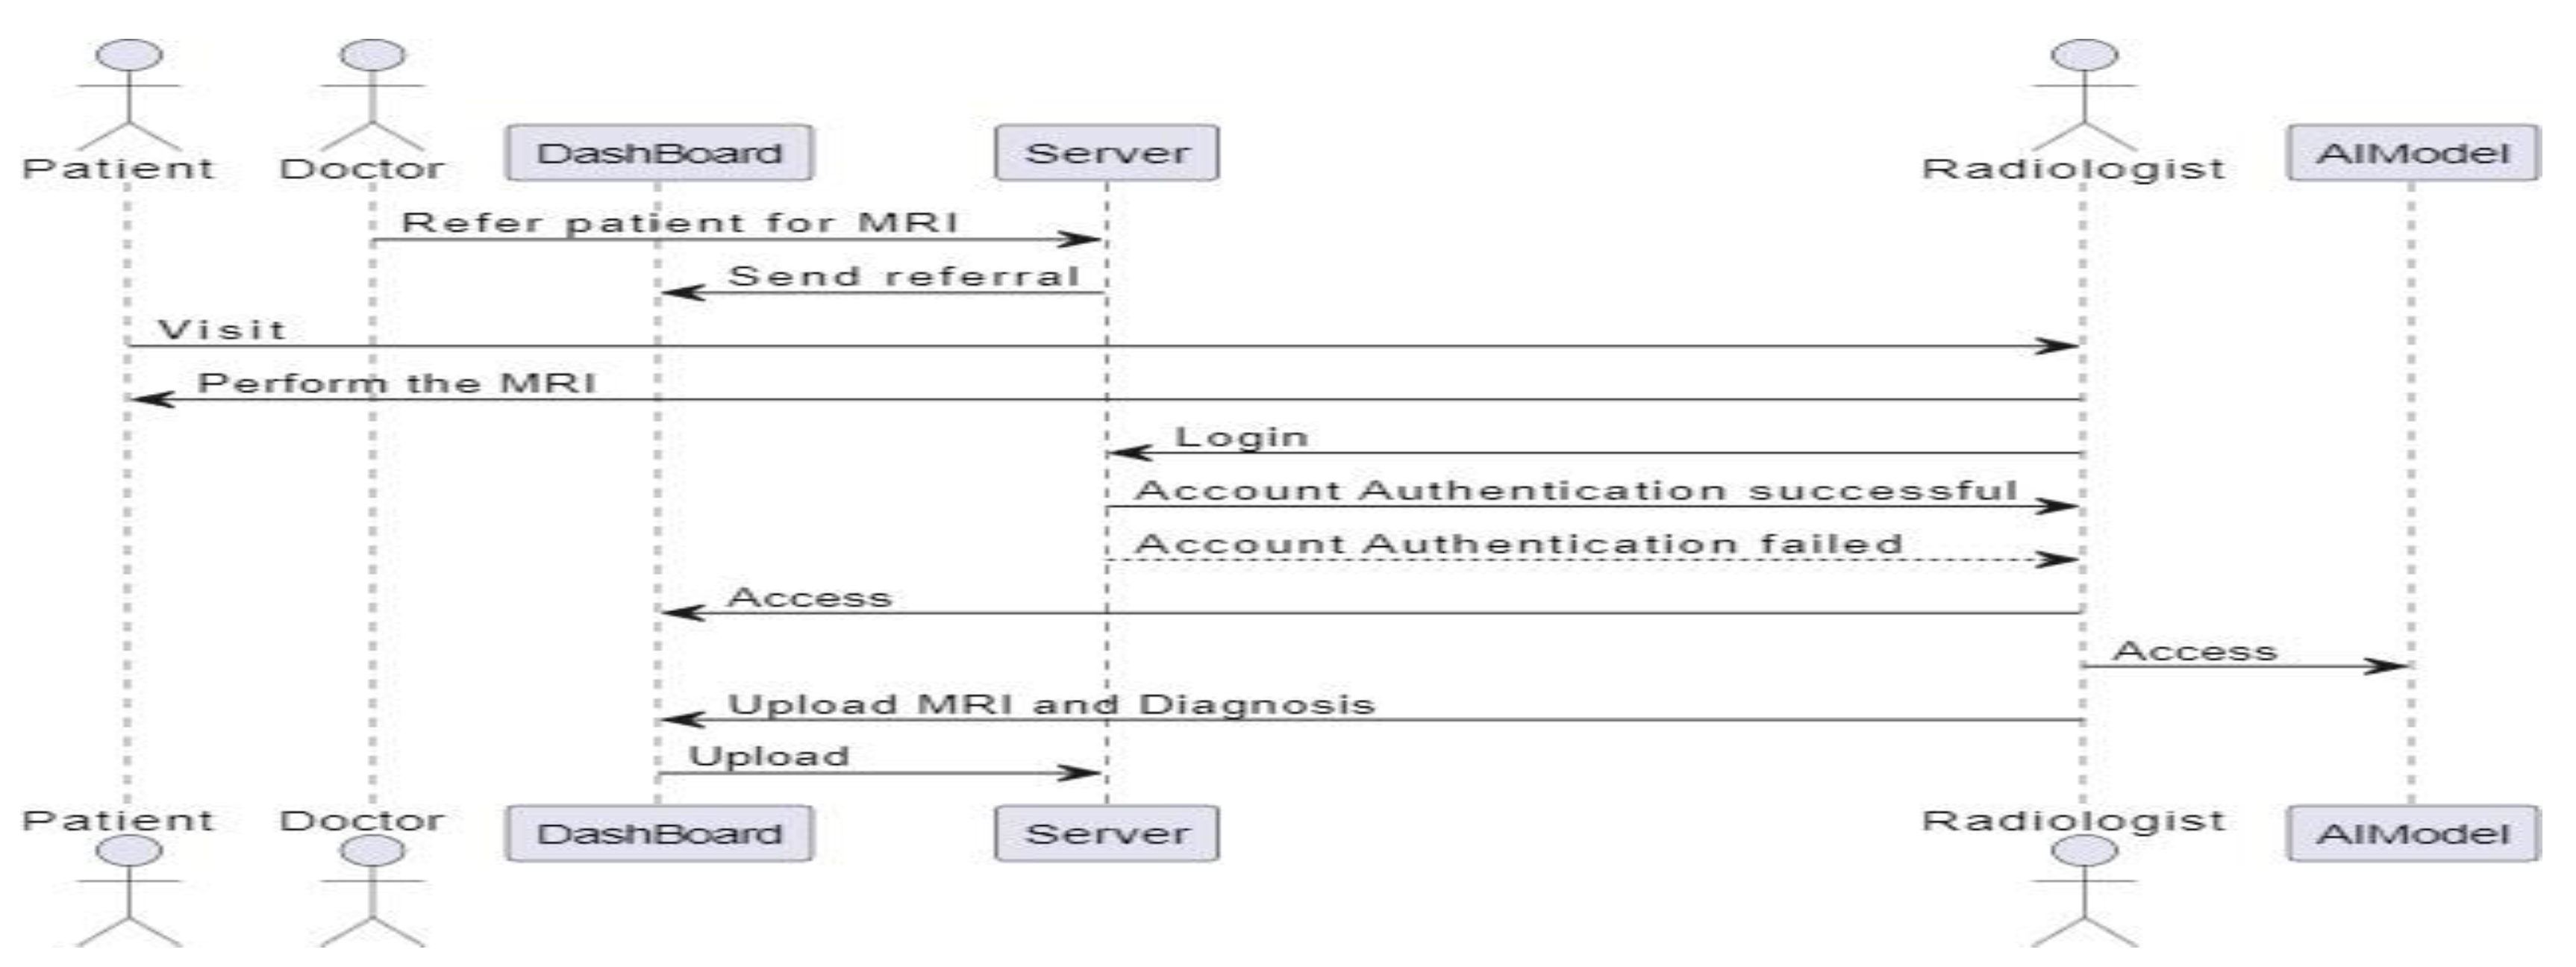
Figure 7.
Patient Sequence diagram.
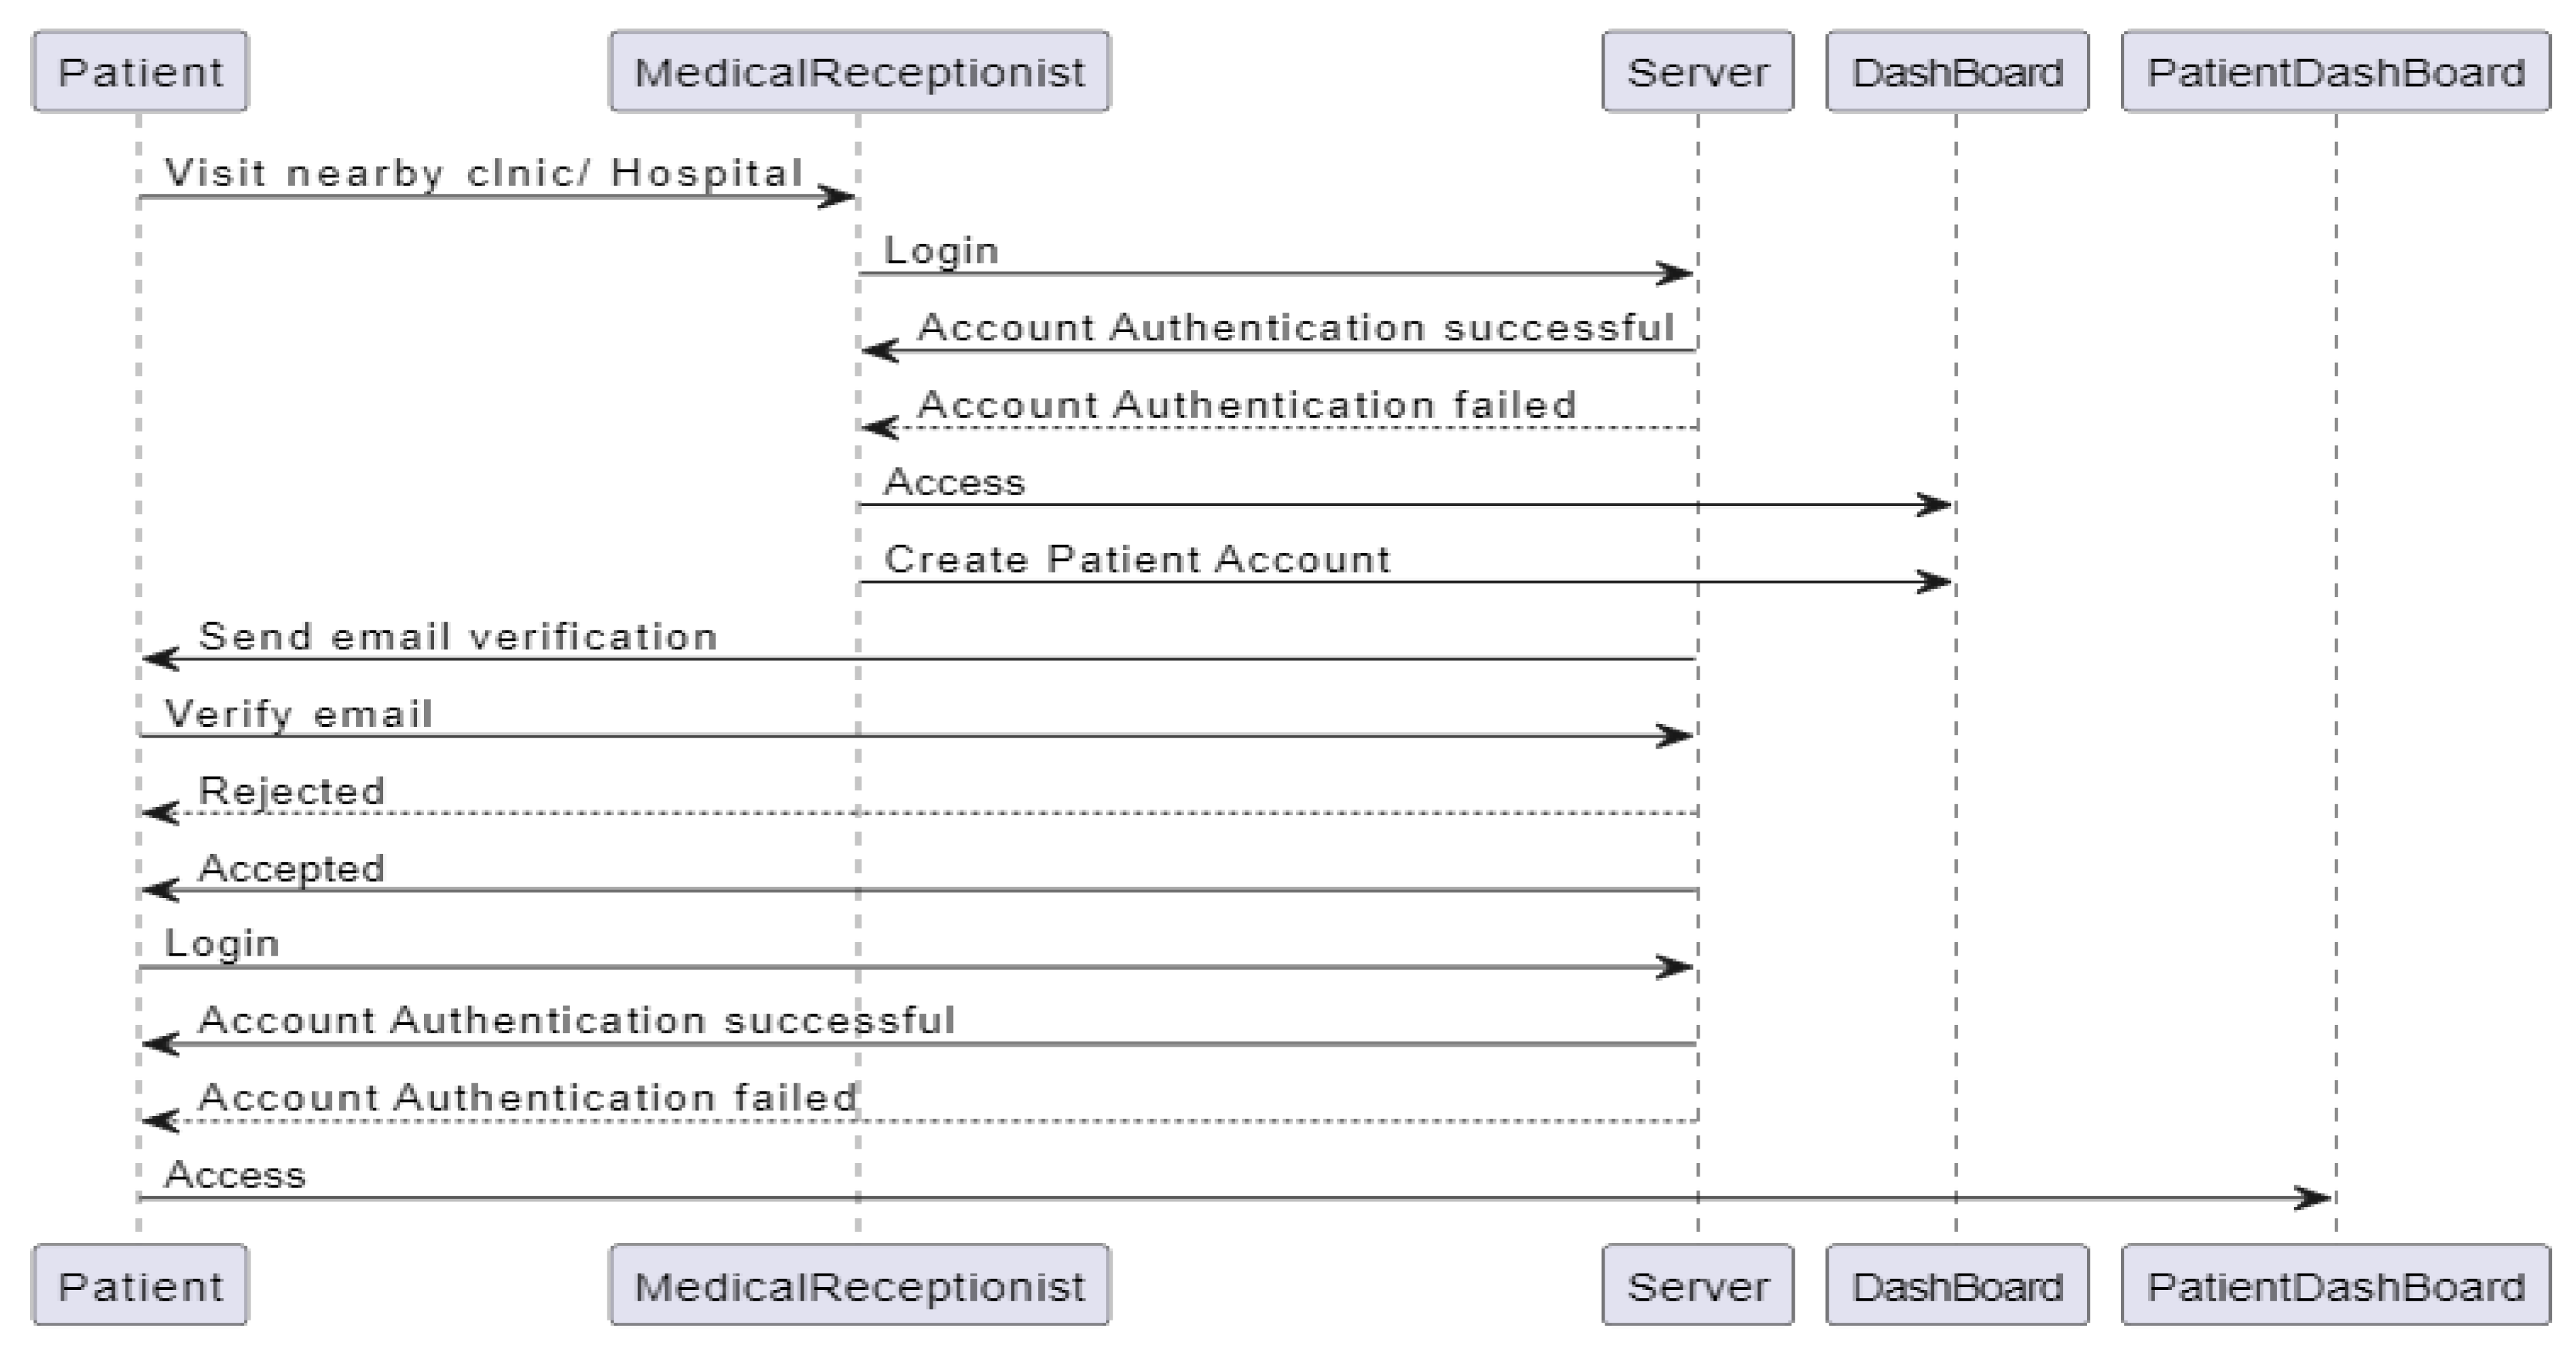
Figure 8.
Specialist Sequence diagram.
3.4.3. Software Design
The Software Design section outlines the architectural and design elements of the Tumor Track web application. This includes an overview of the system architecture, database design, class diagrams, and user interface design.
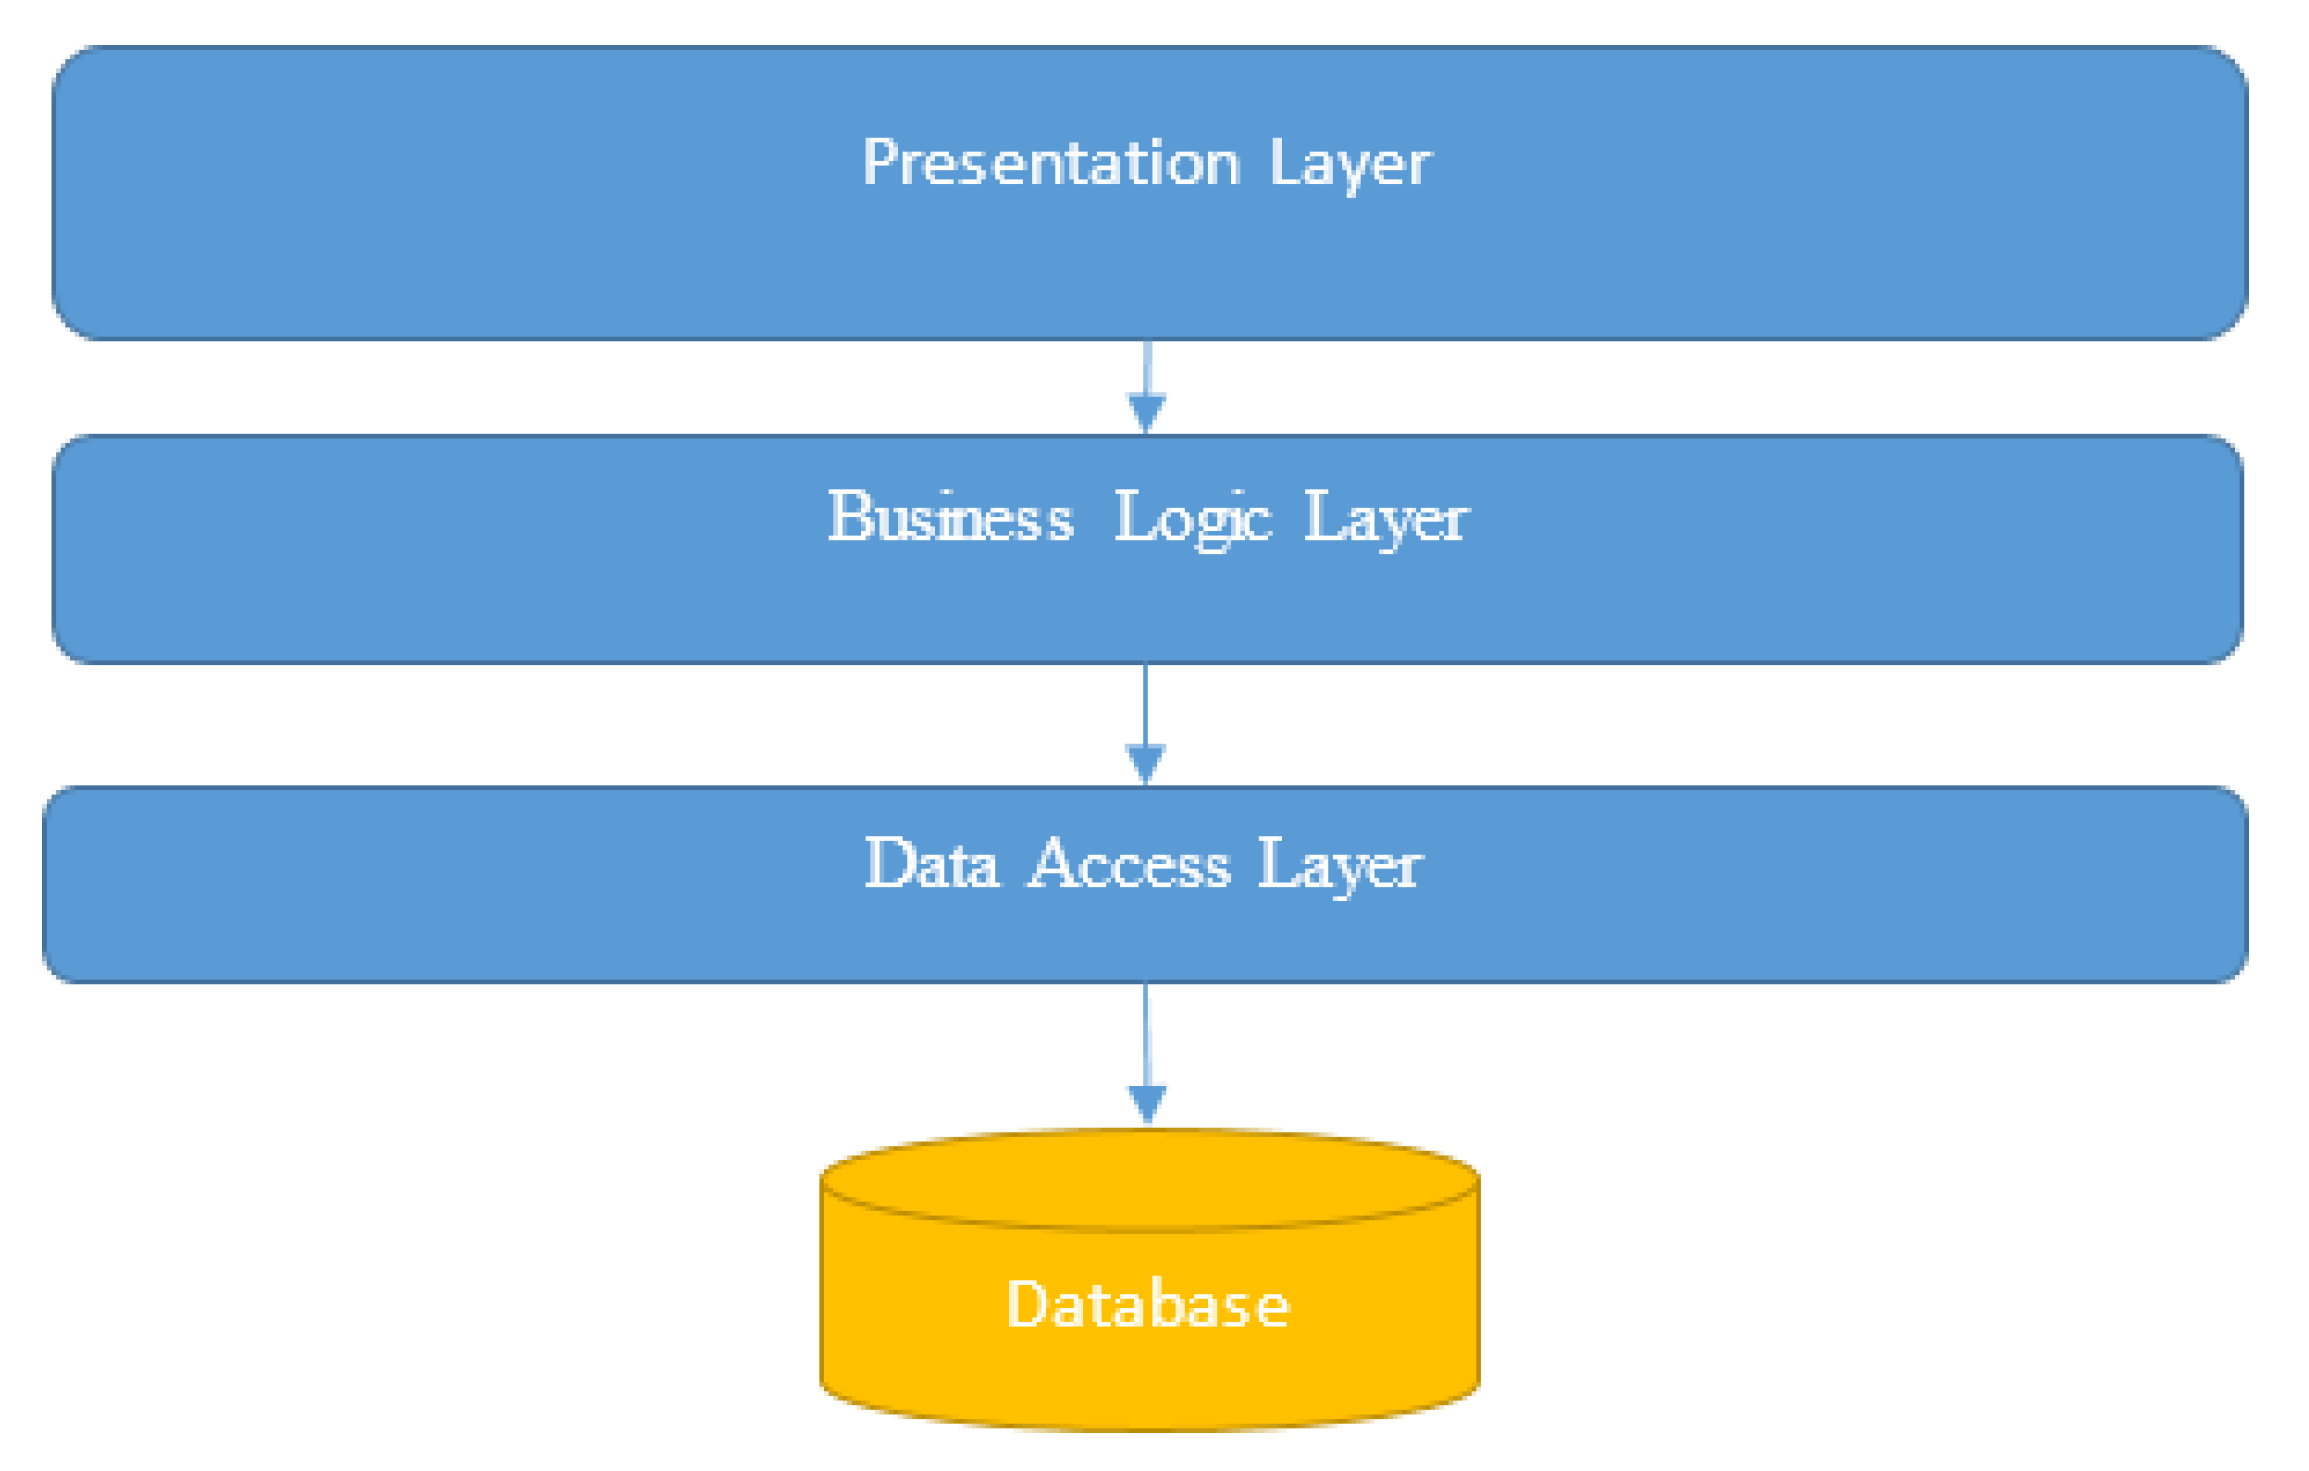
3.4.3.1. System Architecture
The Tumor Track web application follows a multi-tier architecture to ensure scalability, maintainability, and security.
Architectural Overview
- ➢
- Presentation Layer: This layer includes the user interface components for patients, doctors, radiologists, specialists, medical receptionists, and admins.
- ➢
- Business Logic Layer: This layer contains the core application logic, including patient management, diagnosis workflows, and communication between different actors.
- ➢
- Data Access Layer: This layer handles the interaction with the database, including CRUD operations for patient records, user accounts, and system configurations.
- ➢
- Database Layer: This layer consists of the database which stores all the persistent data required by the system.
Figure 9.
System architecture diagram.
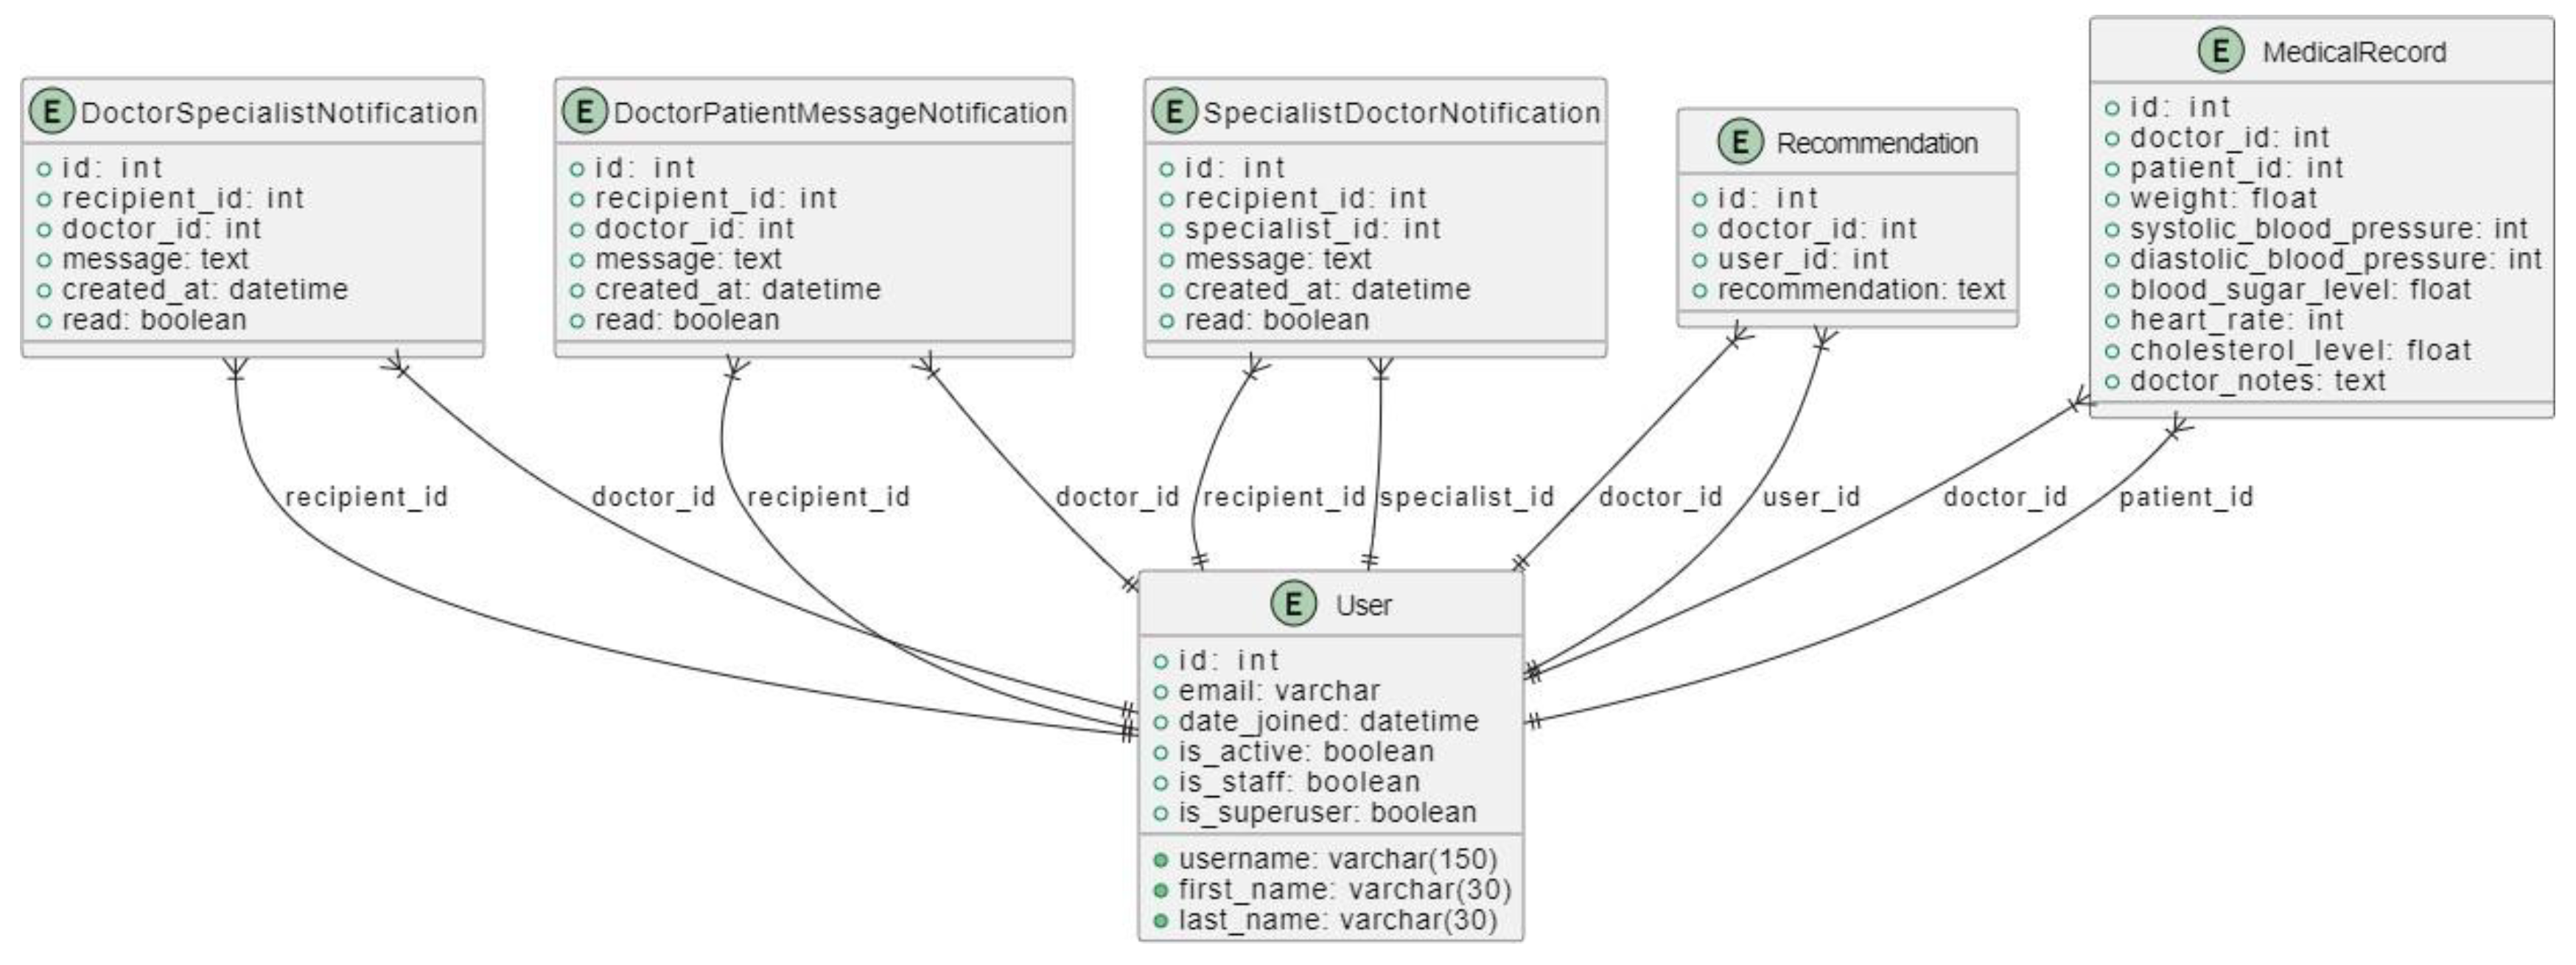
3.4.3.2. Database Design
The database design includes the schema for storing patient information, user accounts, medical history, MRI scans, and other related data.
Entity-Relationship Diagram (ERD)
Figure 10.
ER Diagram 1.
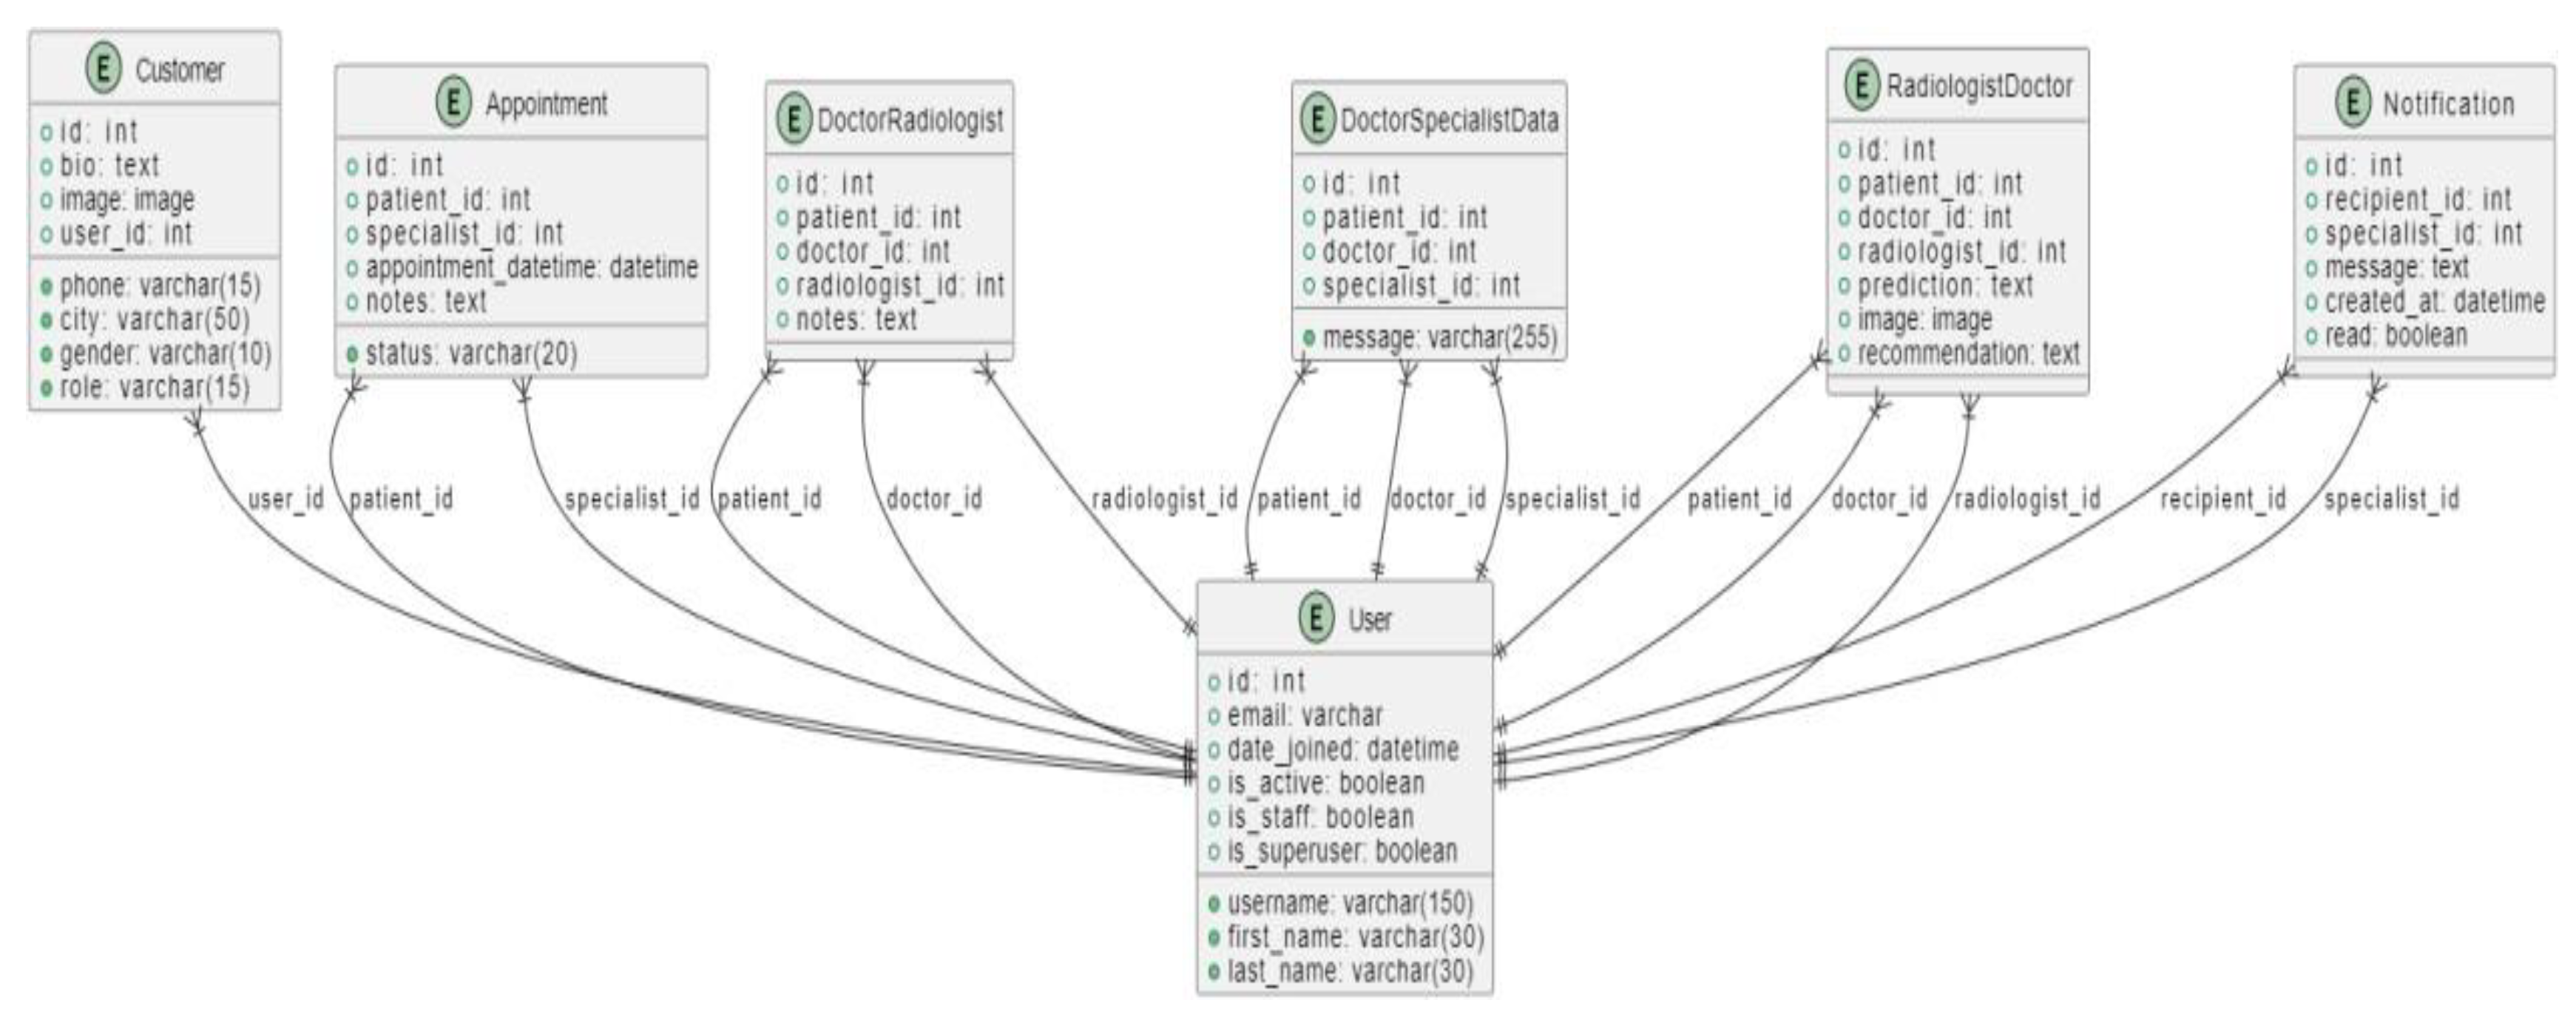
Figure 11.
ER Diagram 2.
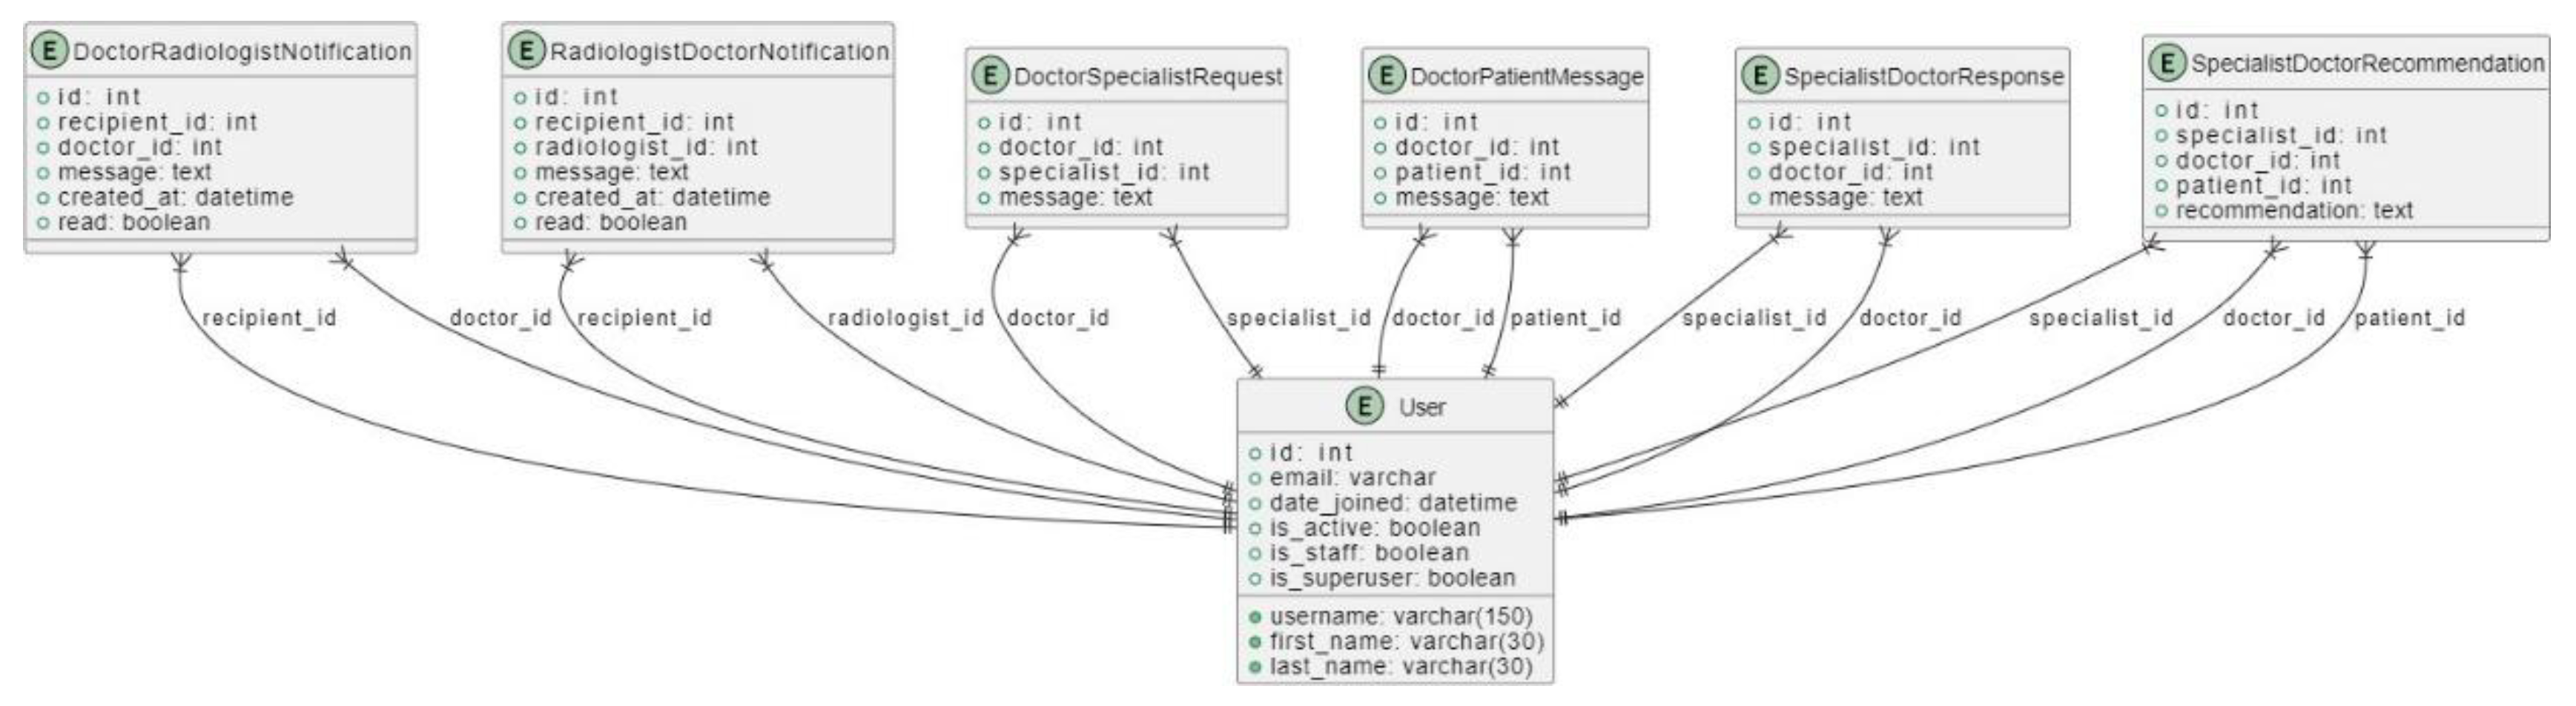
Figure 12.
ER Diagram 3.
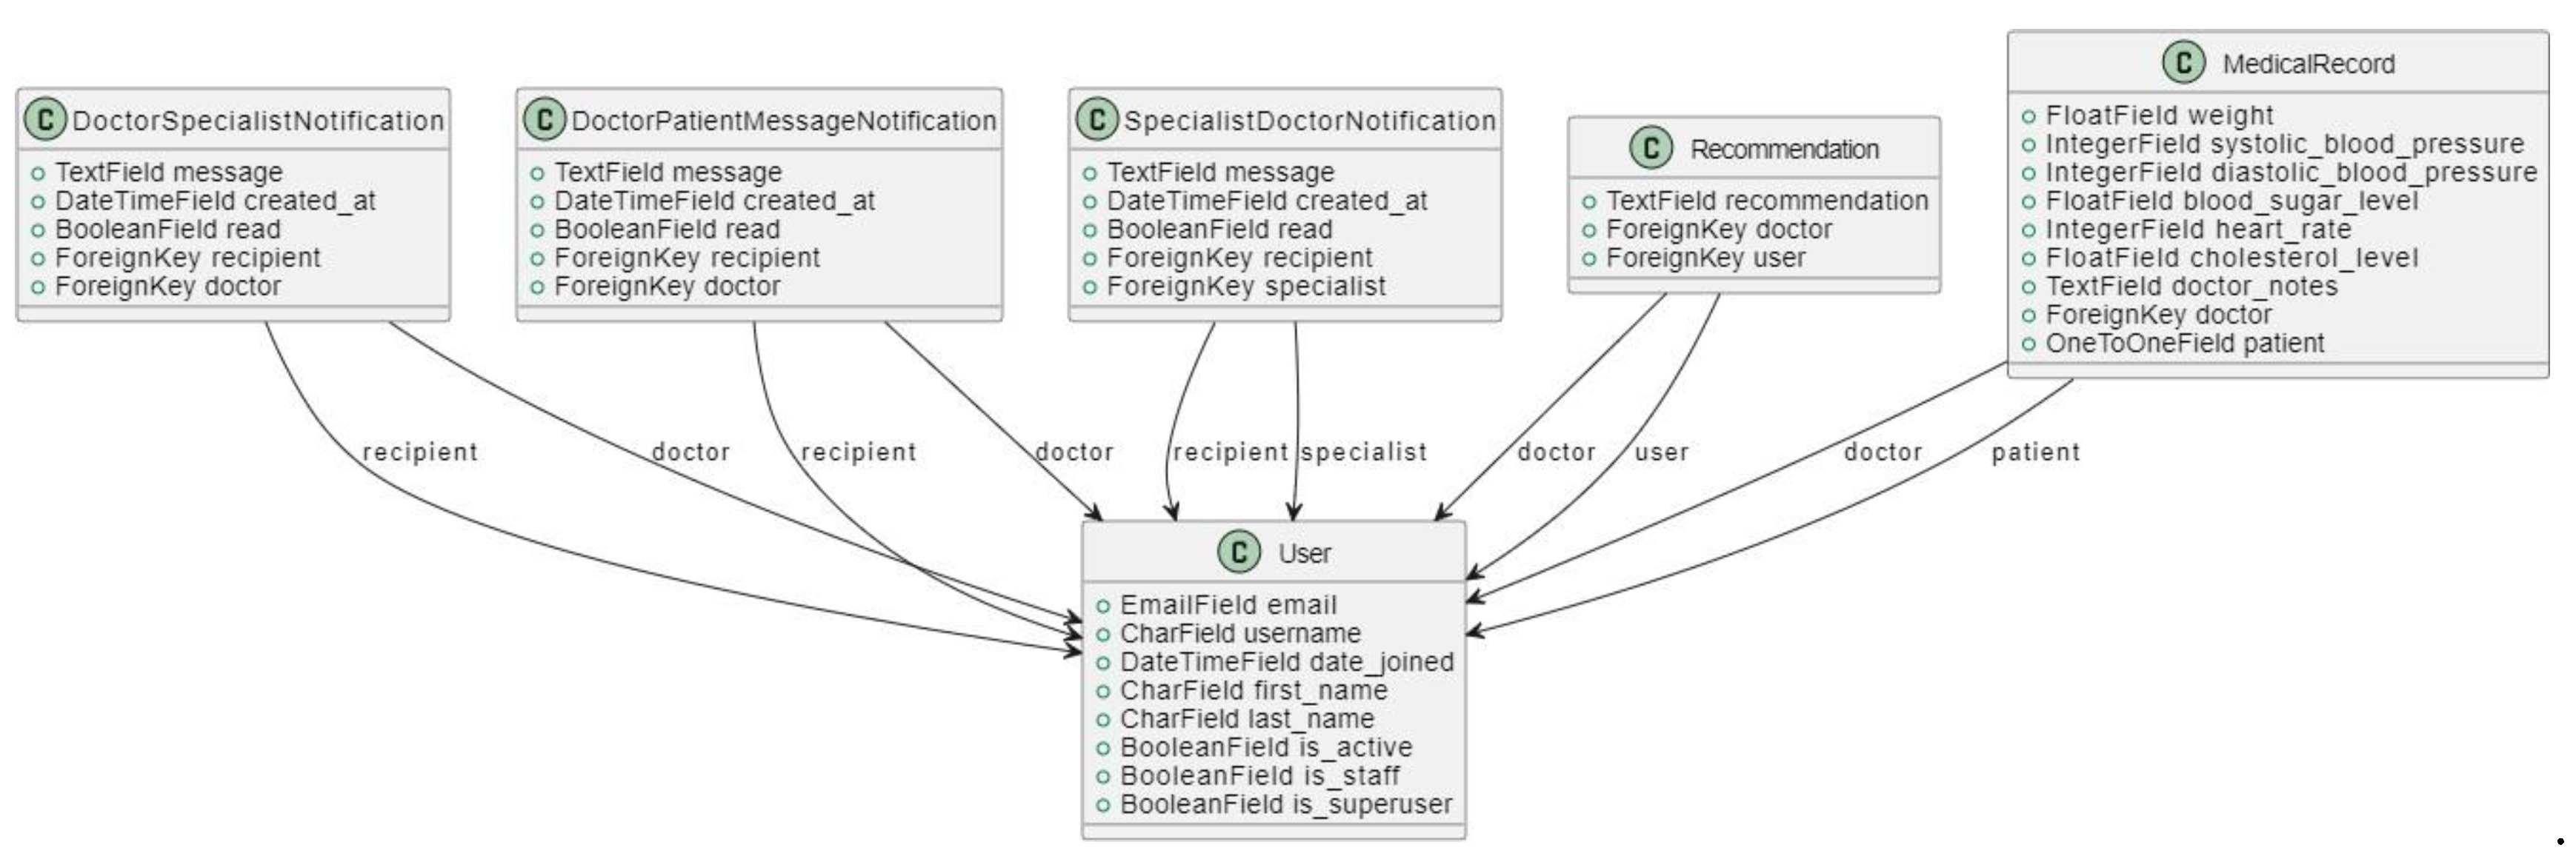
3.4.3.2. Class Diagram
The following UML class diagrams represent the main classes in the Tumor Track web application and their relationships.
Figure 13.
Class Diagram 1.
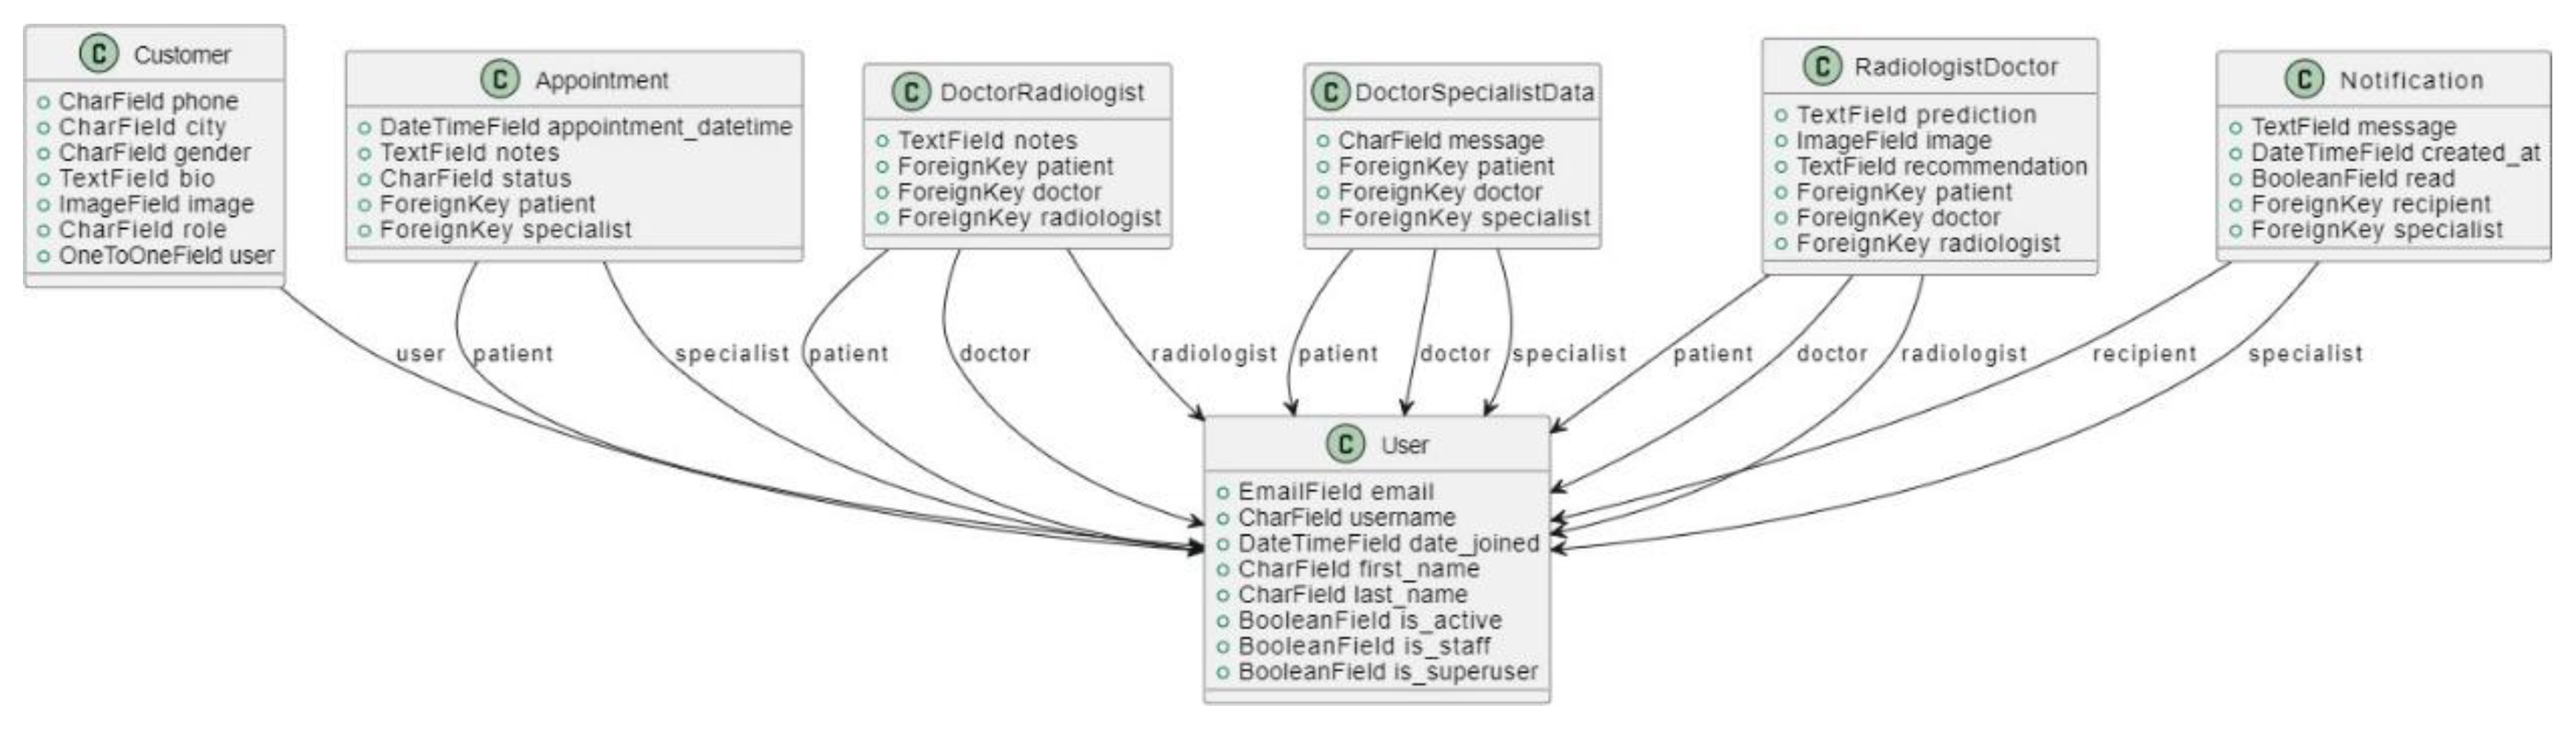
Figure 14.
Class Diagram 2.
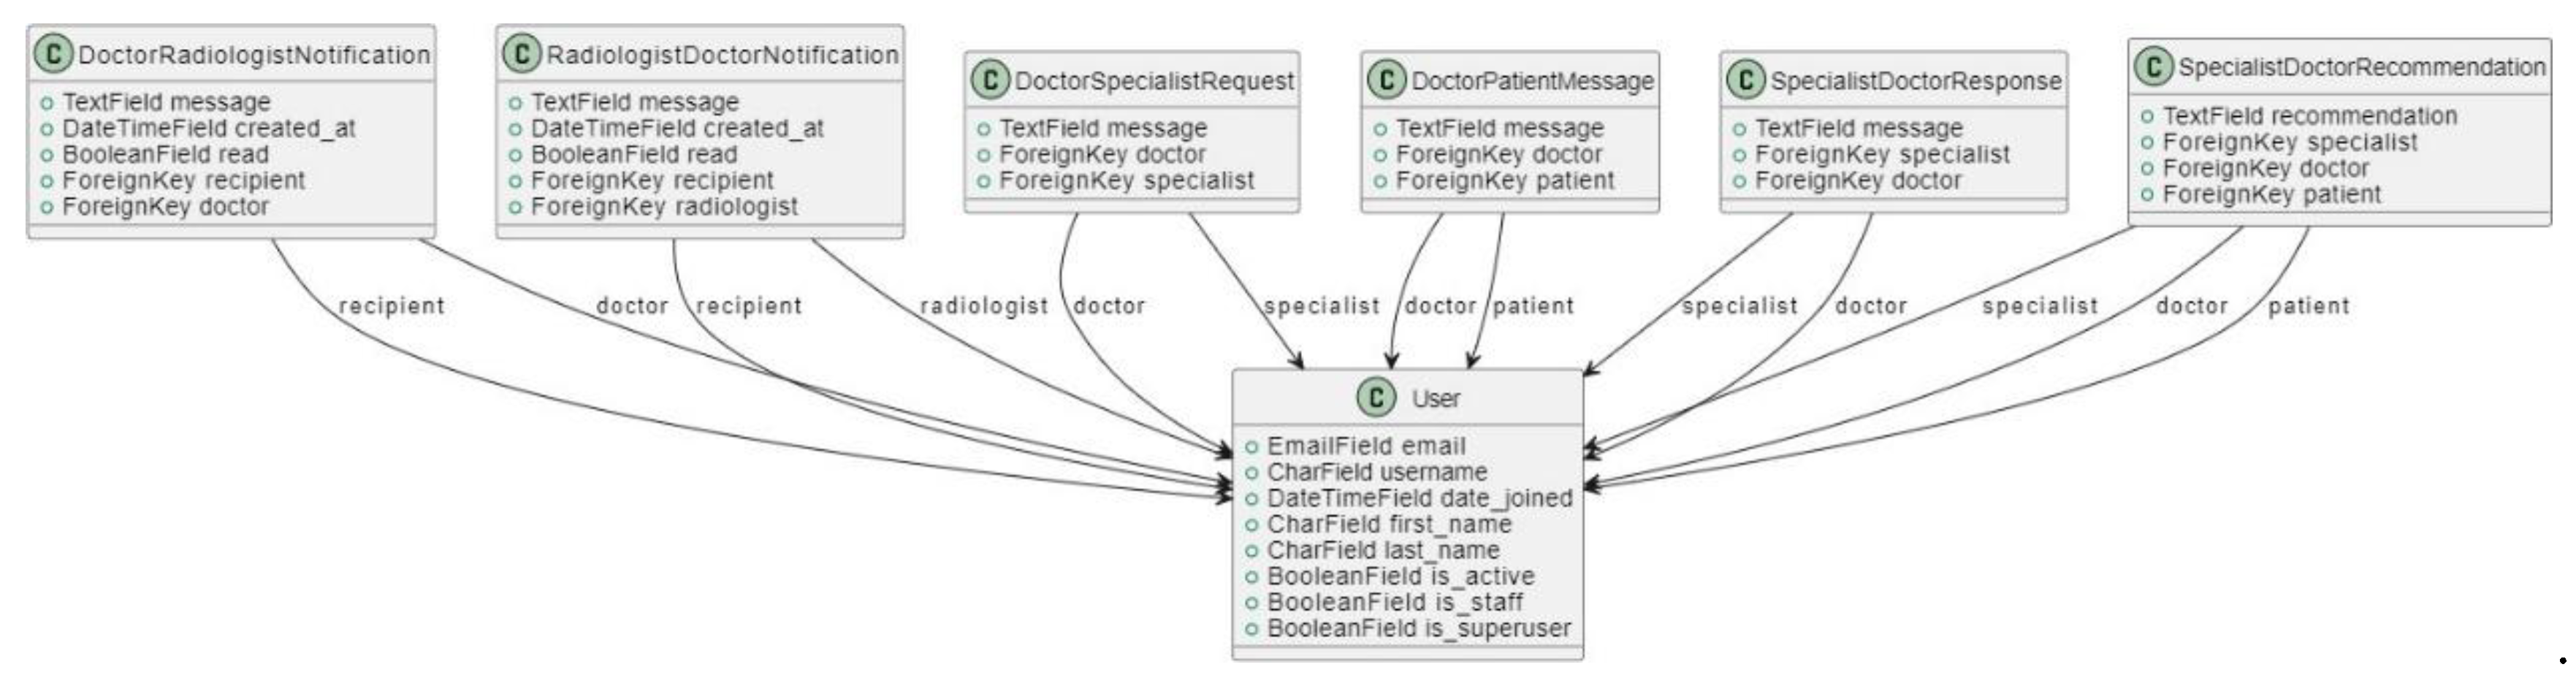
Figure 15.
Class Diagram 3.
3.4.3.4. User Interface Design
The user interface (UI) design of the Tumor Track web application is a crucial aspect of the project, aiming to provide an intuitive, accessible, and efficient interaction experience for all users. The primary users of the system include medical receptionists, doctors, patients, specialists, radiologists, and administrative staff. The design focuses on creating a seamless and user-friendly experience while ensuring that all necessary functionalities are easily accessible.
Design Principles
- 1.
-
User-Centered Design:
- User Research: Conducted surveys and interviews with potential users to understand their needs, preferences, and pain points.
- Personas: Developed user personas to guide design decisions, ensuring the interface meets the specific needs of each user group.
- 2.
-
Simplicity and Consistency:
- Minimalistic Design: Emphasized a clean and simple layout to reduce cognitive load and make the interface intuitive.
- Consistency: Used consistent design elements, such as color schemes, fonts, and button styles, throughout the application to create a cohesive experience.
- 3.
-
Accessibility:
- Responsive Design: Ensured the interface is responsive and works well on various devices, including desktops, tablets, and smartphones.
- Accessibility Standards: Followed WCAG (Web Content Accessibility Guidelines) to make the interface accessible to users with disabilities.
- 4.
-
Visual Hierarchy:
- Prioritization of Information: Organized information and functionalities based on their importance and frequency of use.
- Highlighting Key Actions: Used visual cues, such as contrasting colors and icons, to draw attention to critical actions and information.
Key Interface Components
- 1.
-
Dashboard:
- Overview: Provides a summary of important information and quick access to common functionalities.
- User-Specific Data: Displays relevant data based on the user's role (e.g., upcoming appointments for specialists, patient records for doctors).
- 2.
-
Navigation:
- Top Navigation Bar: Includes links to different sections of the application, such as patient records, appointment scheduling, diagnostic tools, user profile settings, notifications, and
- 3.
-
Forms and Data Entry:
- Intuitive Forms: Designed forms for tasks such as patient registration, diagnostic input, and appointment scheduling to be straightforward and easy to fill out.
- Validation and Feedback: Implemented real-time validation and feedback to guide users in providing correct and complete information.
- 4.
-
Patient Records:
- Detailed View: Allows doctors and medical staff to view comprehensive patient records, including medical history, diagnostic reports, and treatment plans.
- Edit and Update: Provides functionality for authorized users to edit and update patient information as needed.
- 5.
-
Appointment Scheduling:
- Calendar View: Displays a calendar for scheduling and managing appointments, with the ability to view by day, week, or month.
- Automated Reminders: Sends automated reminders to patients and staff about upcoming appointments.
- 6.
-
Diagnostic Tools:
- Image Viewer: Integrates with AI tools for viewing and analyzing medical images, such as MRI scans.
- Notes: Allows doctors to add notes for reference and collaboration.
- 7.
-
Notifications and Alerts:
- Real-Time Alerts: Provides real-time notifications for critical updates, such as new patient records, appointment changes, and diagnostic results.
- Notification Center: Centralizes all alerts and messages, allowing users to manage and review them efficiently.
Below are some samples of Tumor Track web application user interface:
Figure 16.
Home page.
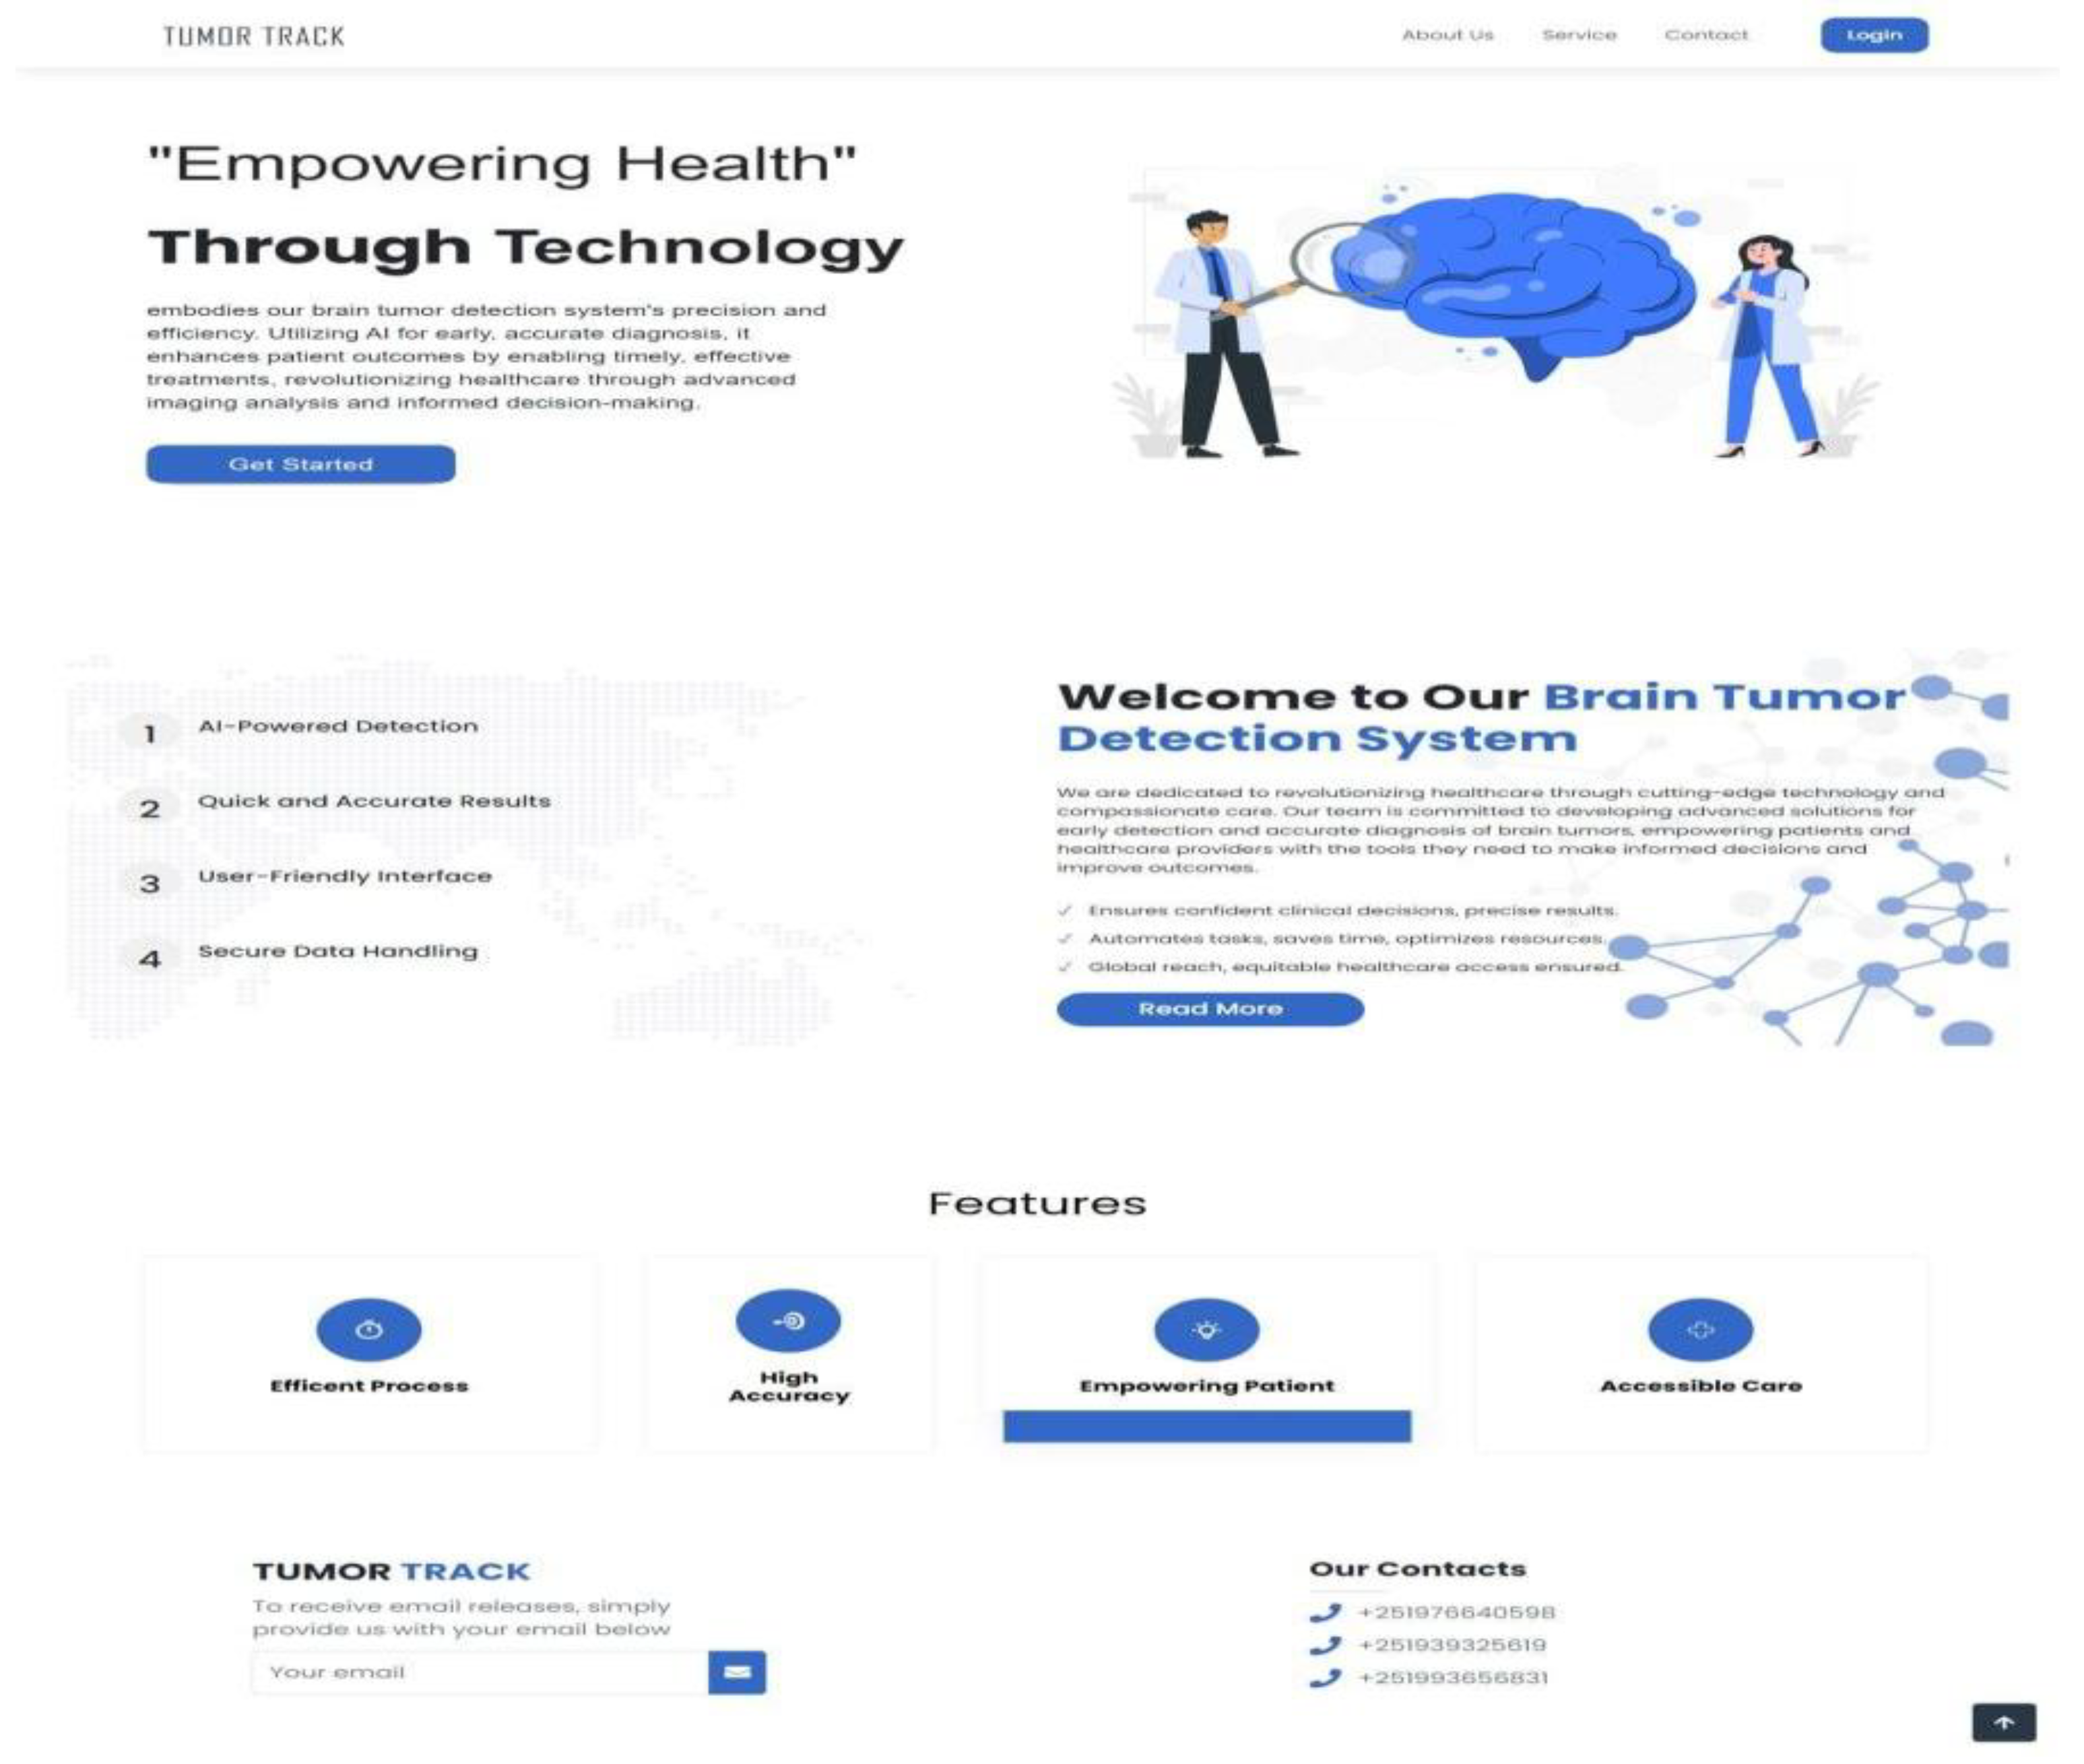
Figure 17.
About page.
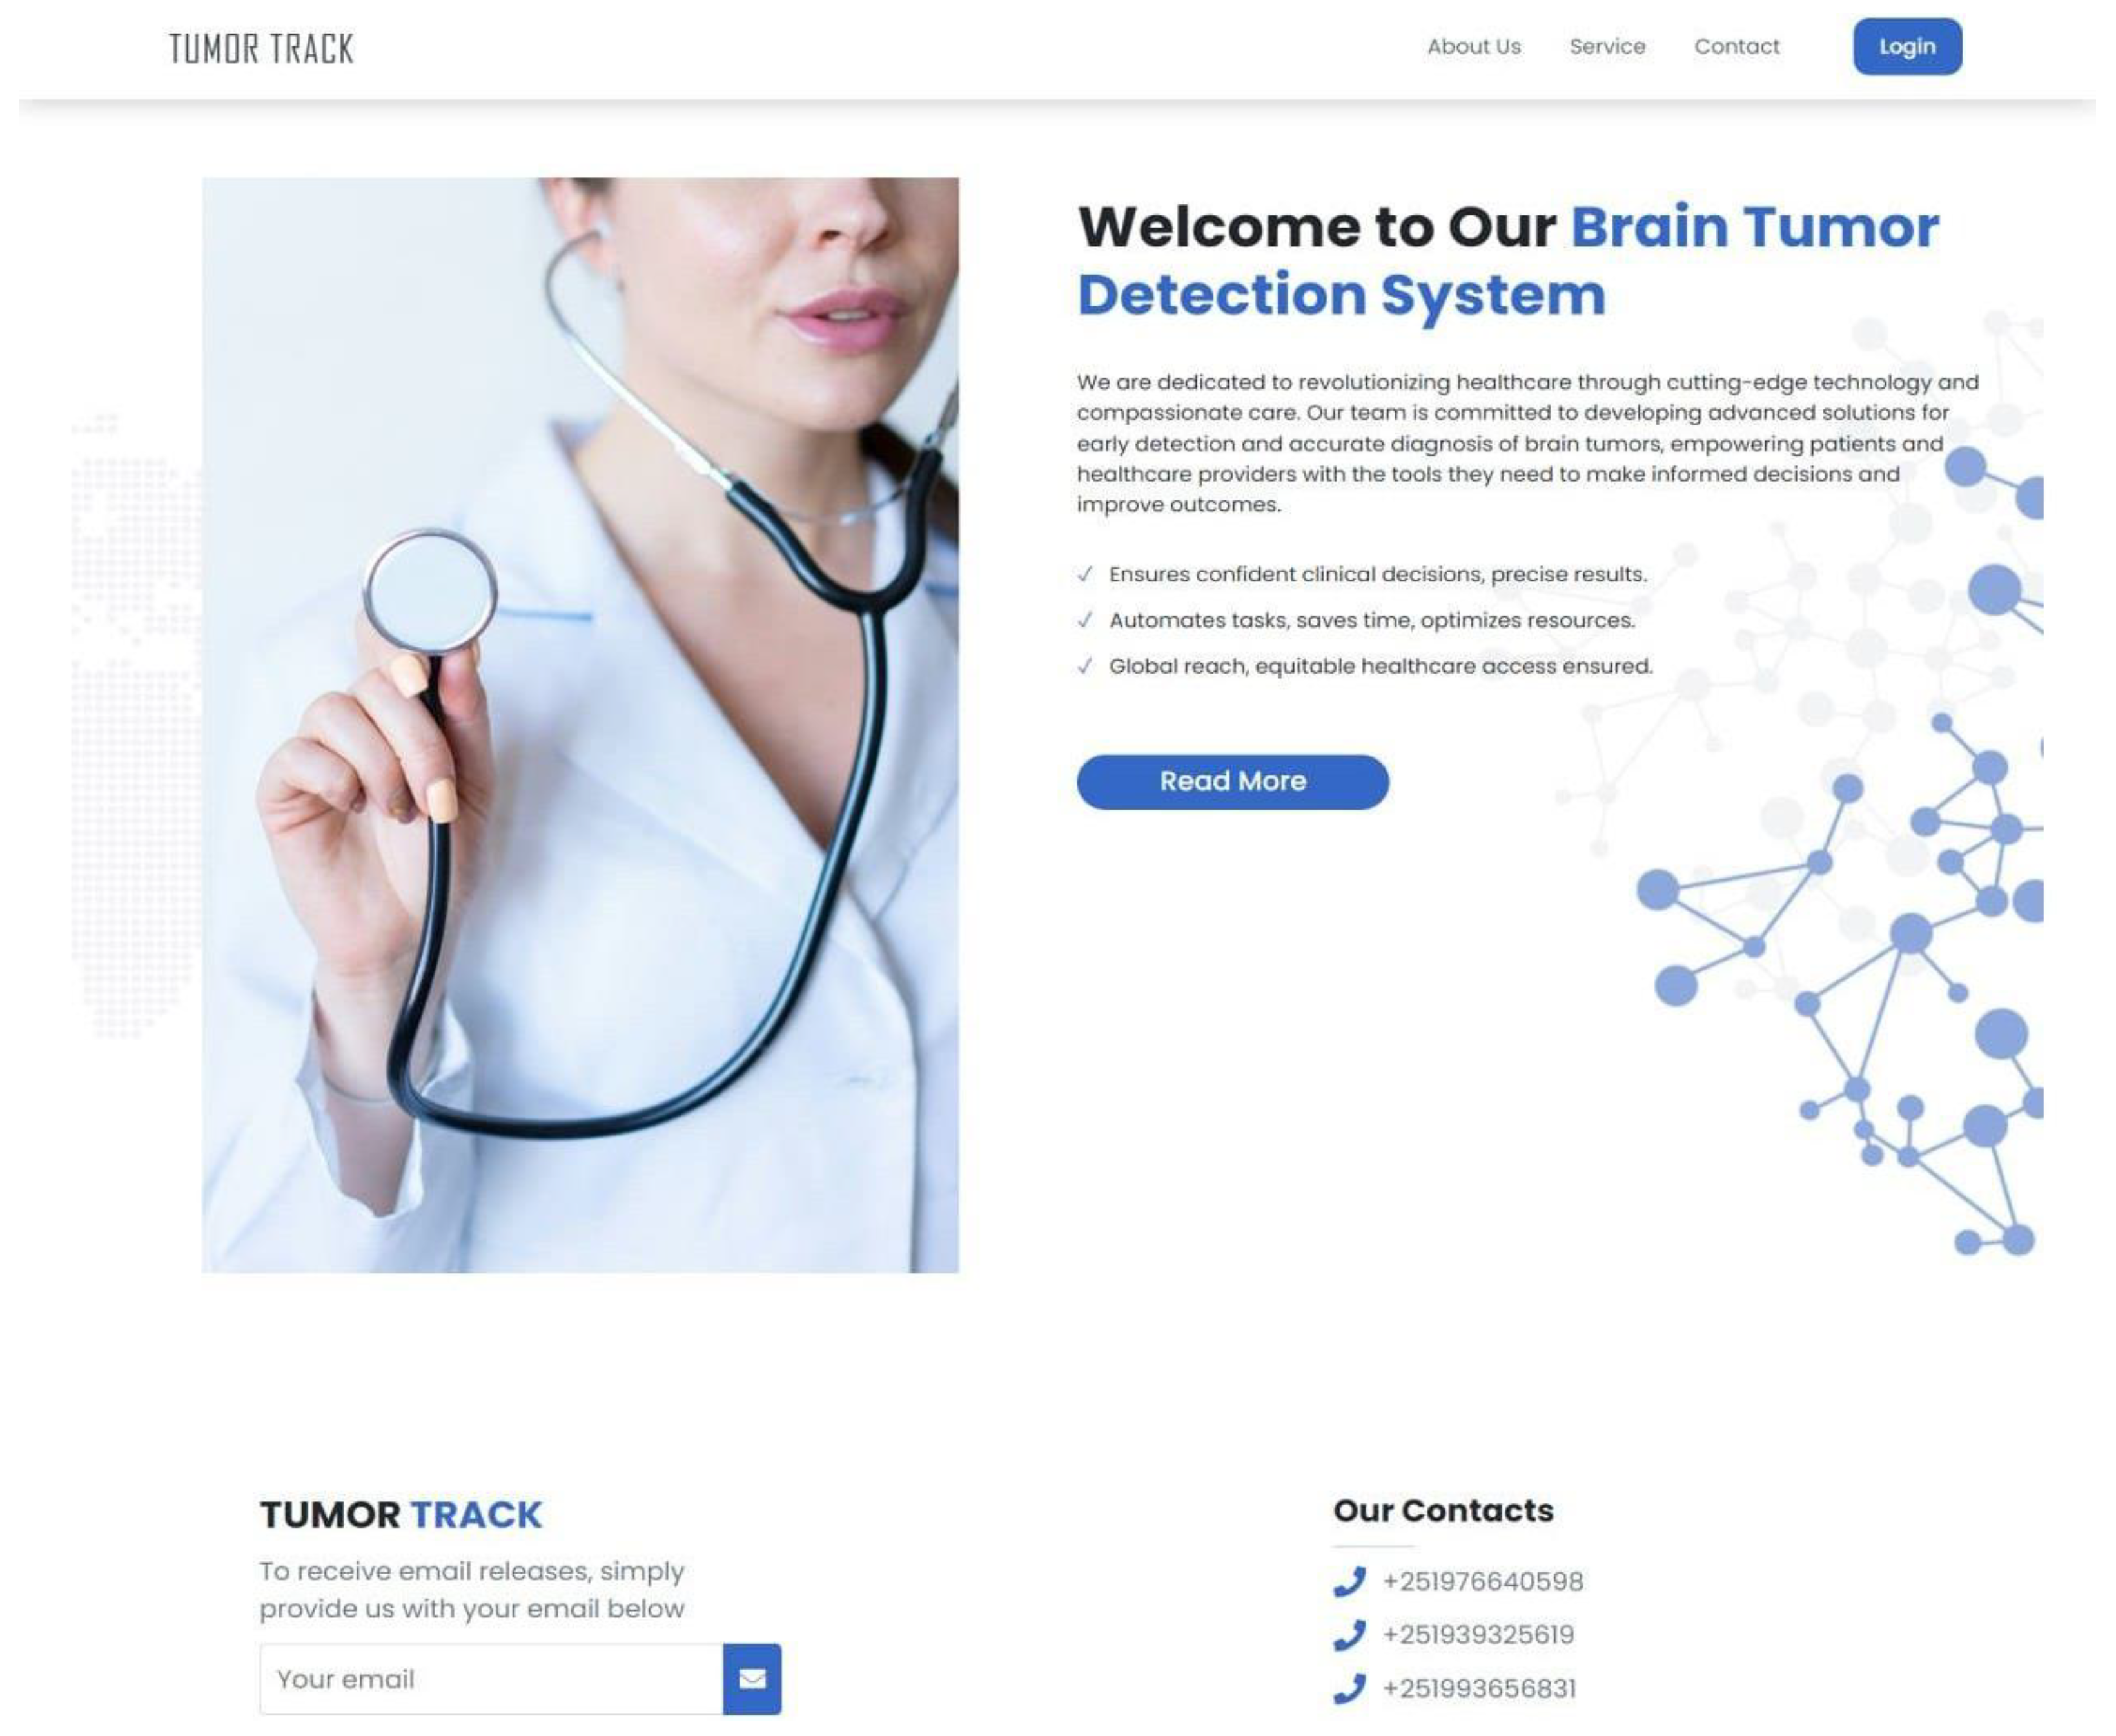
Figure 18.
Service page.
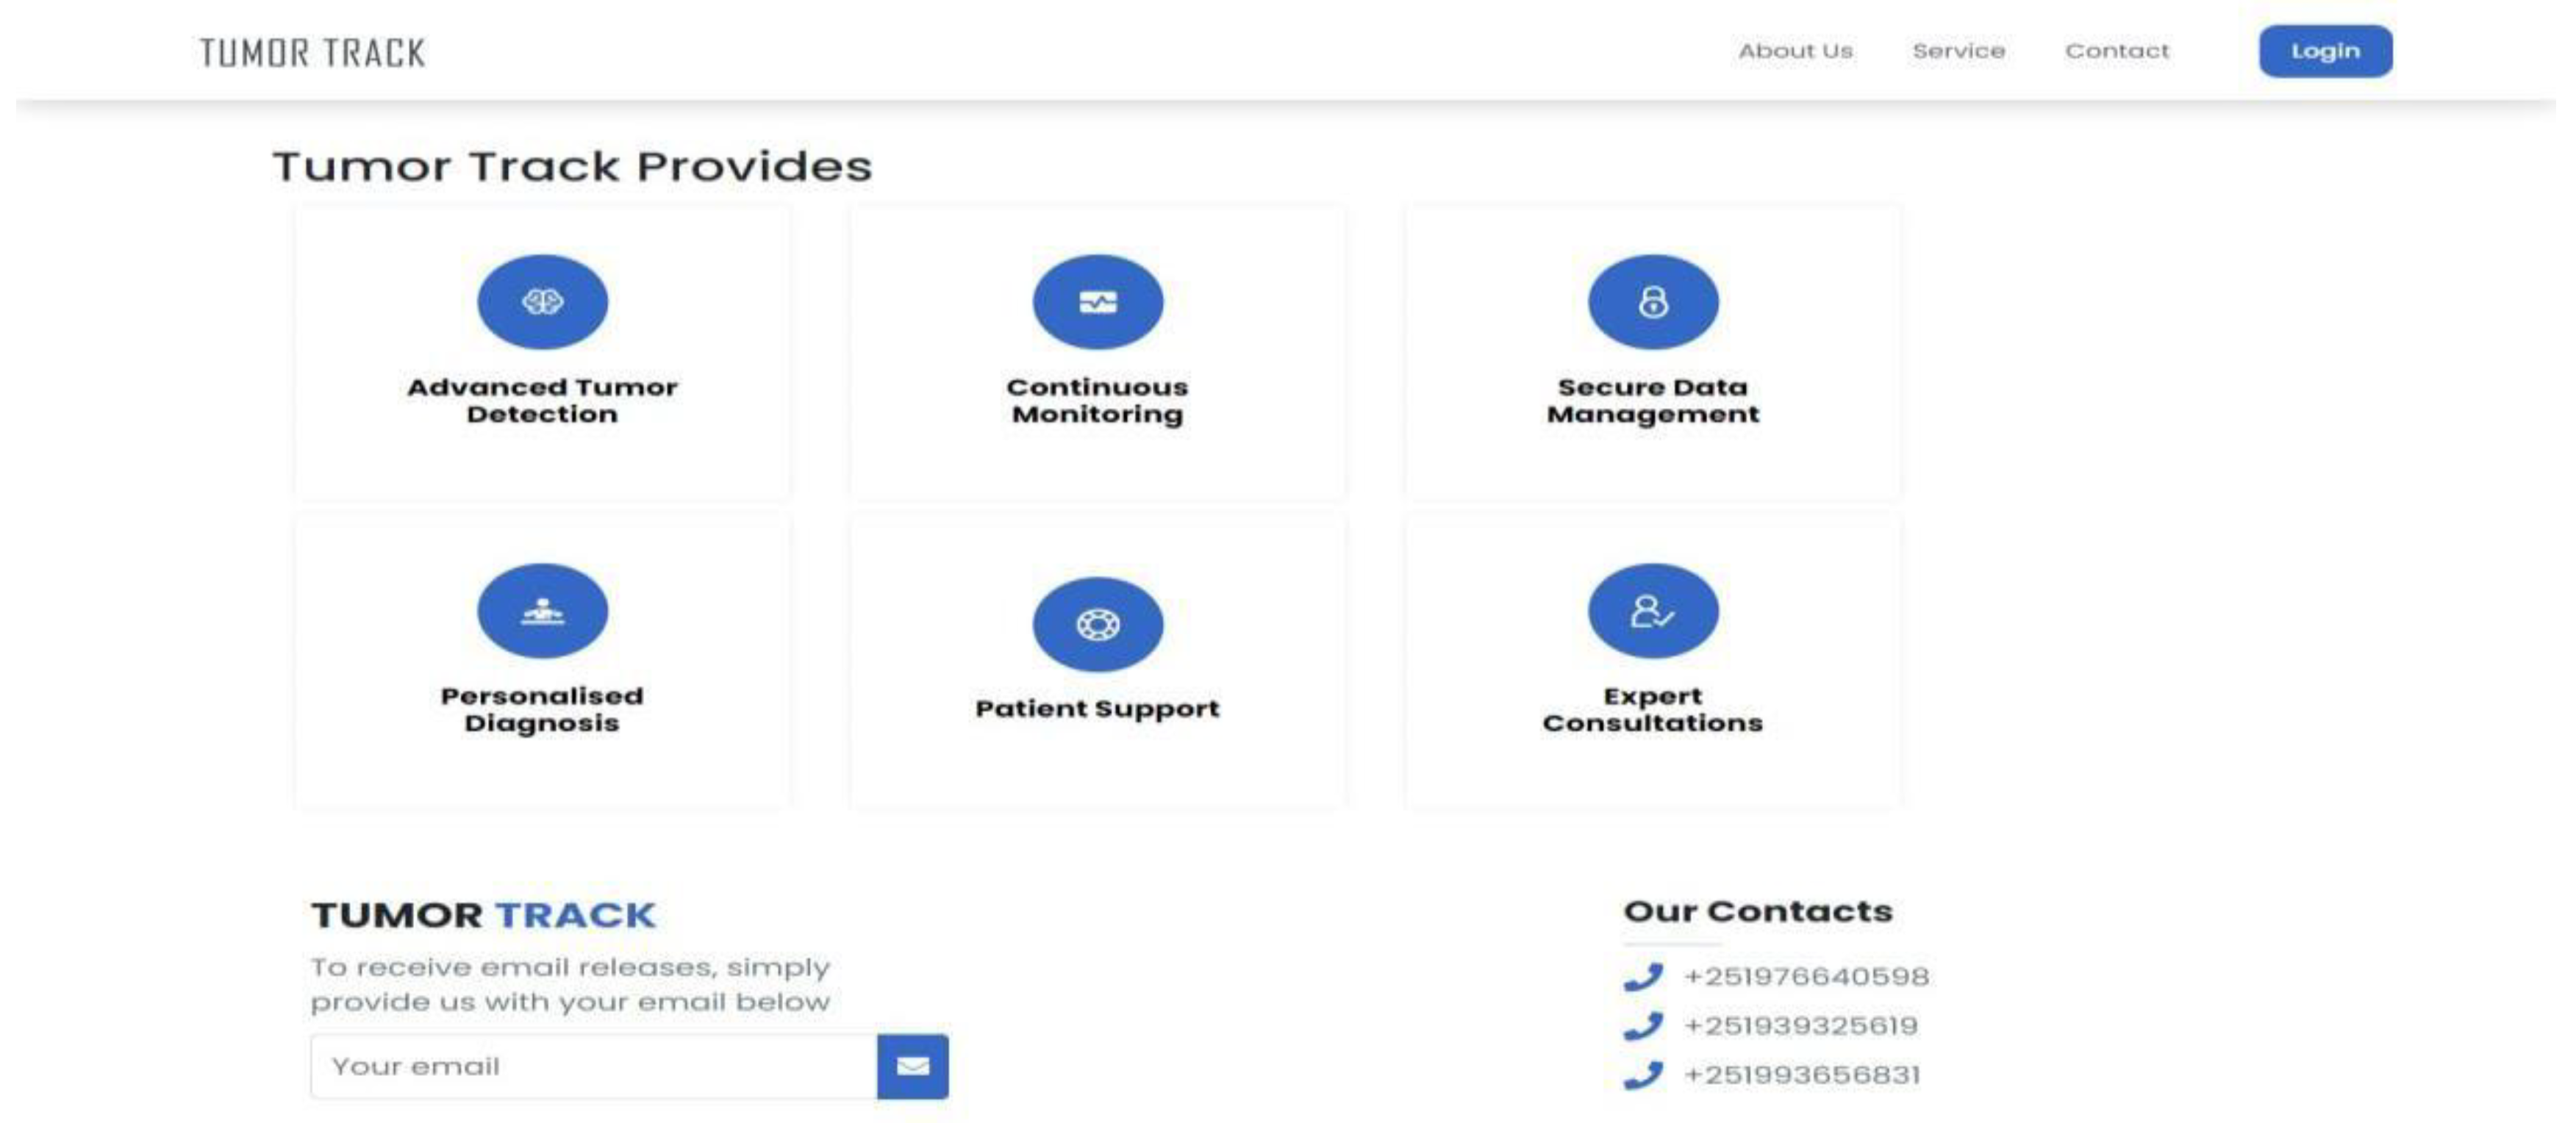
Figure 19.
Contact page.
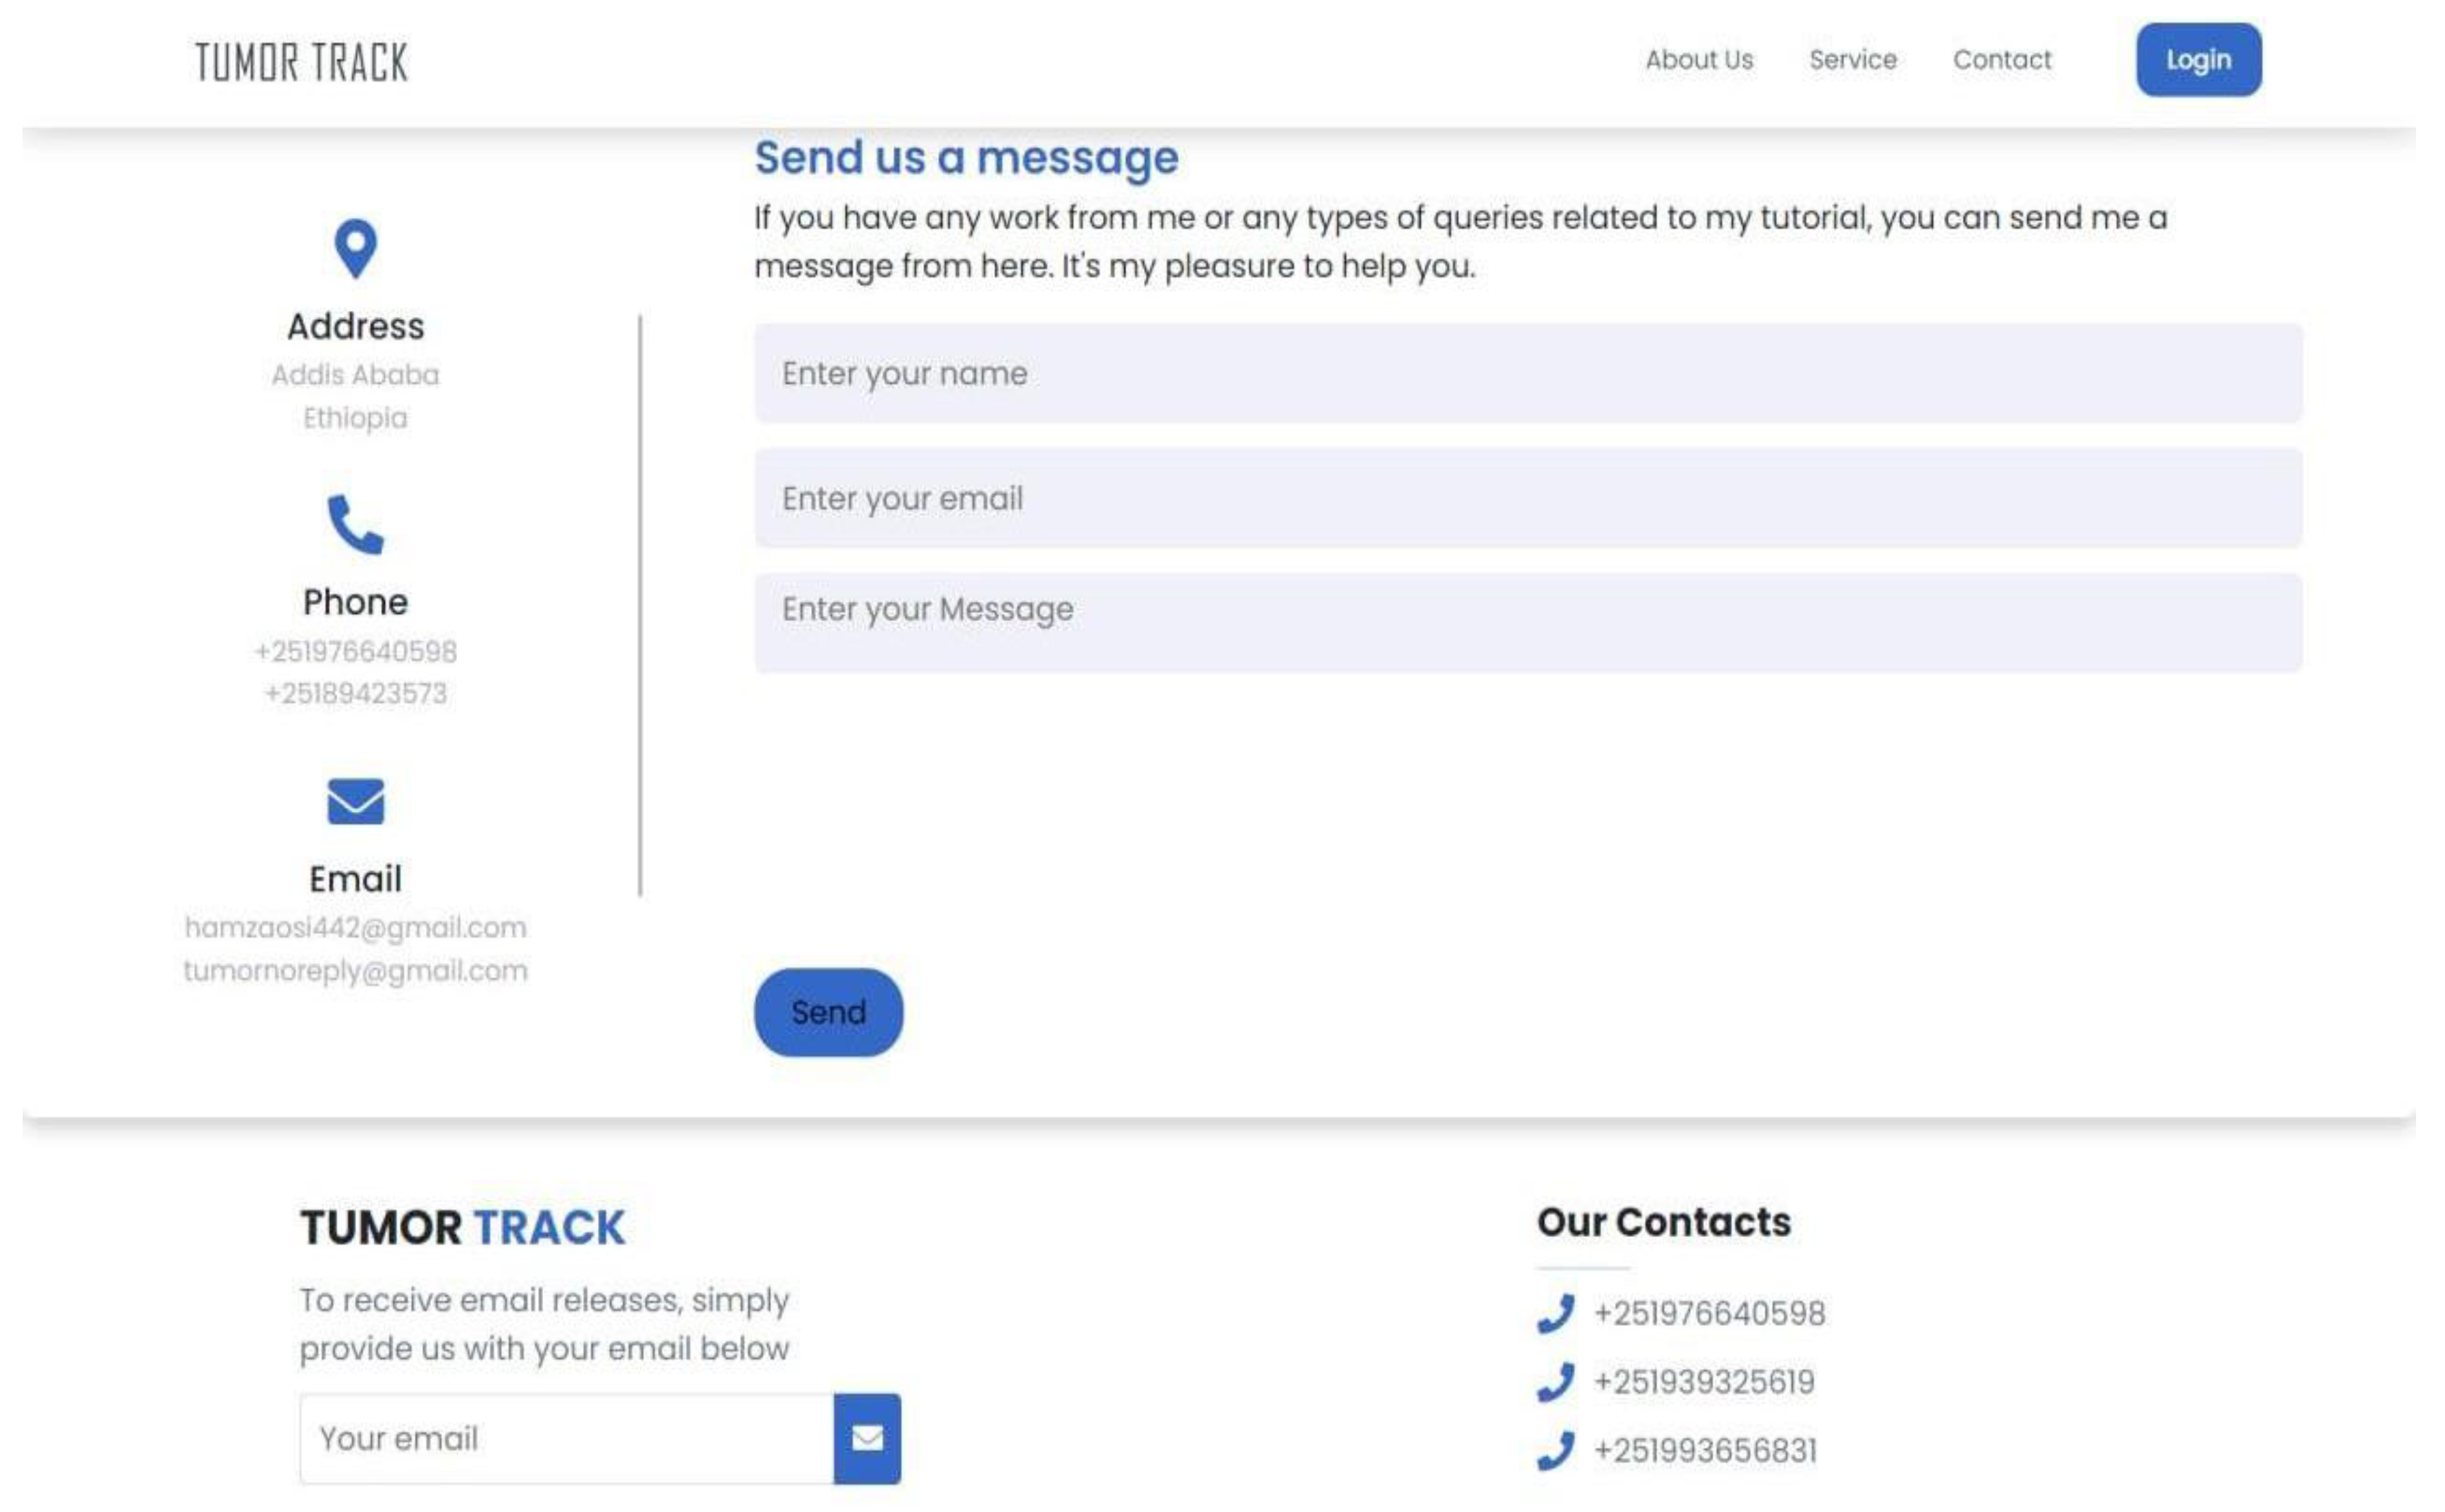
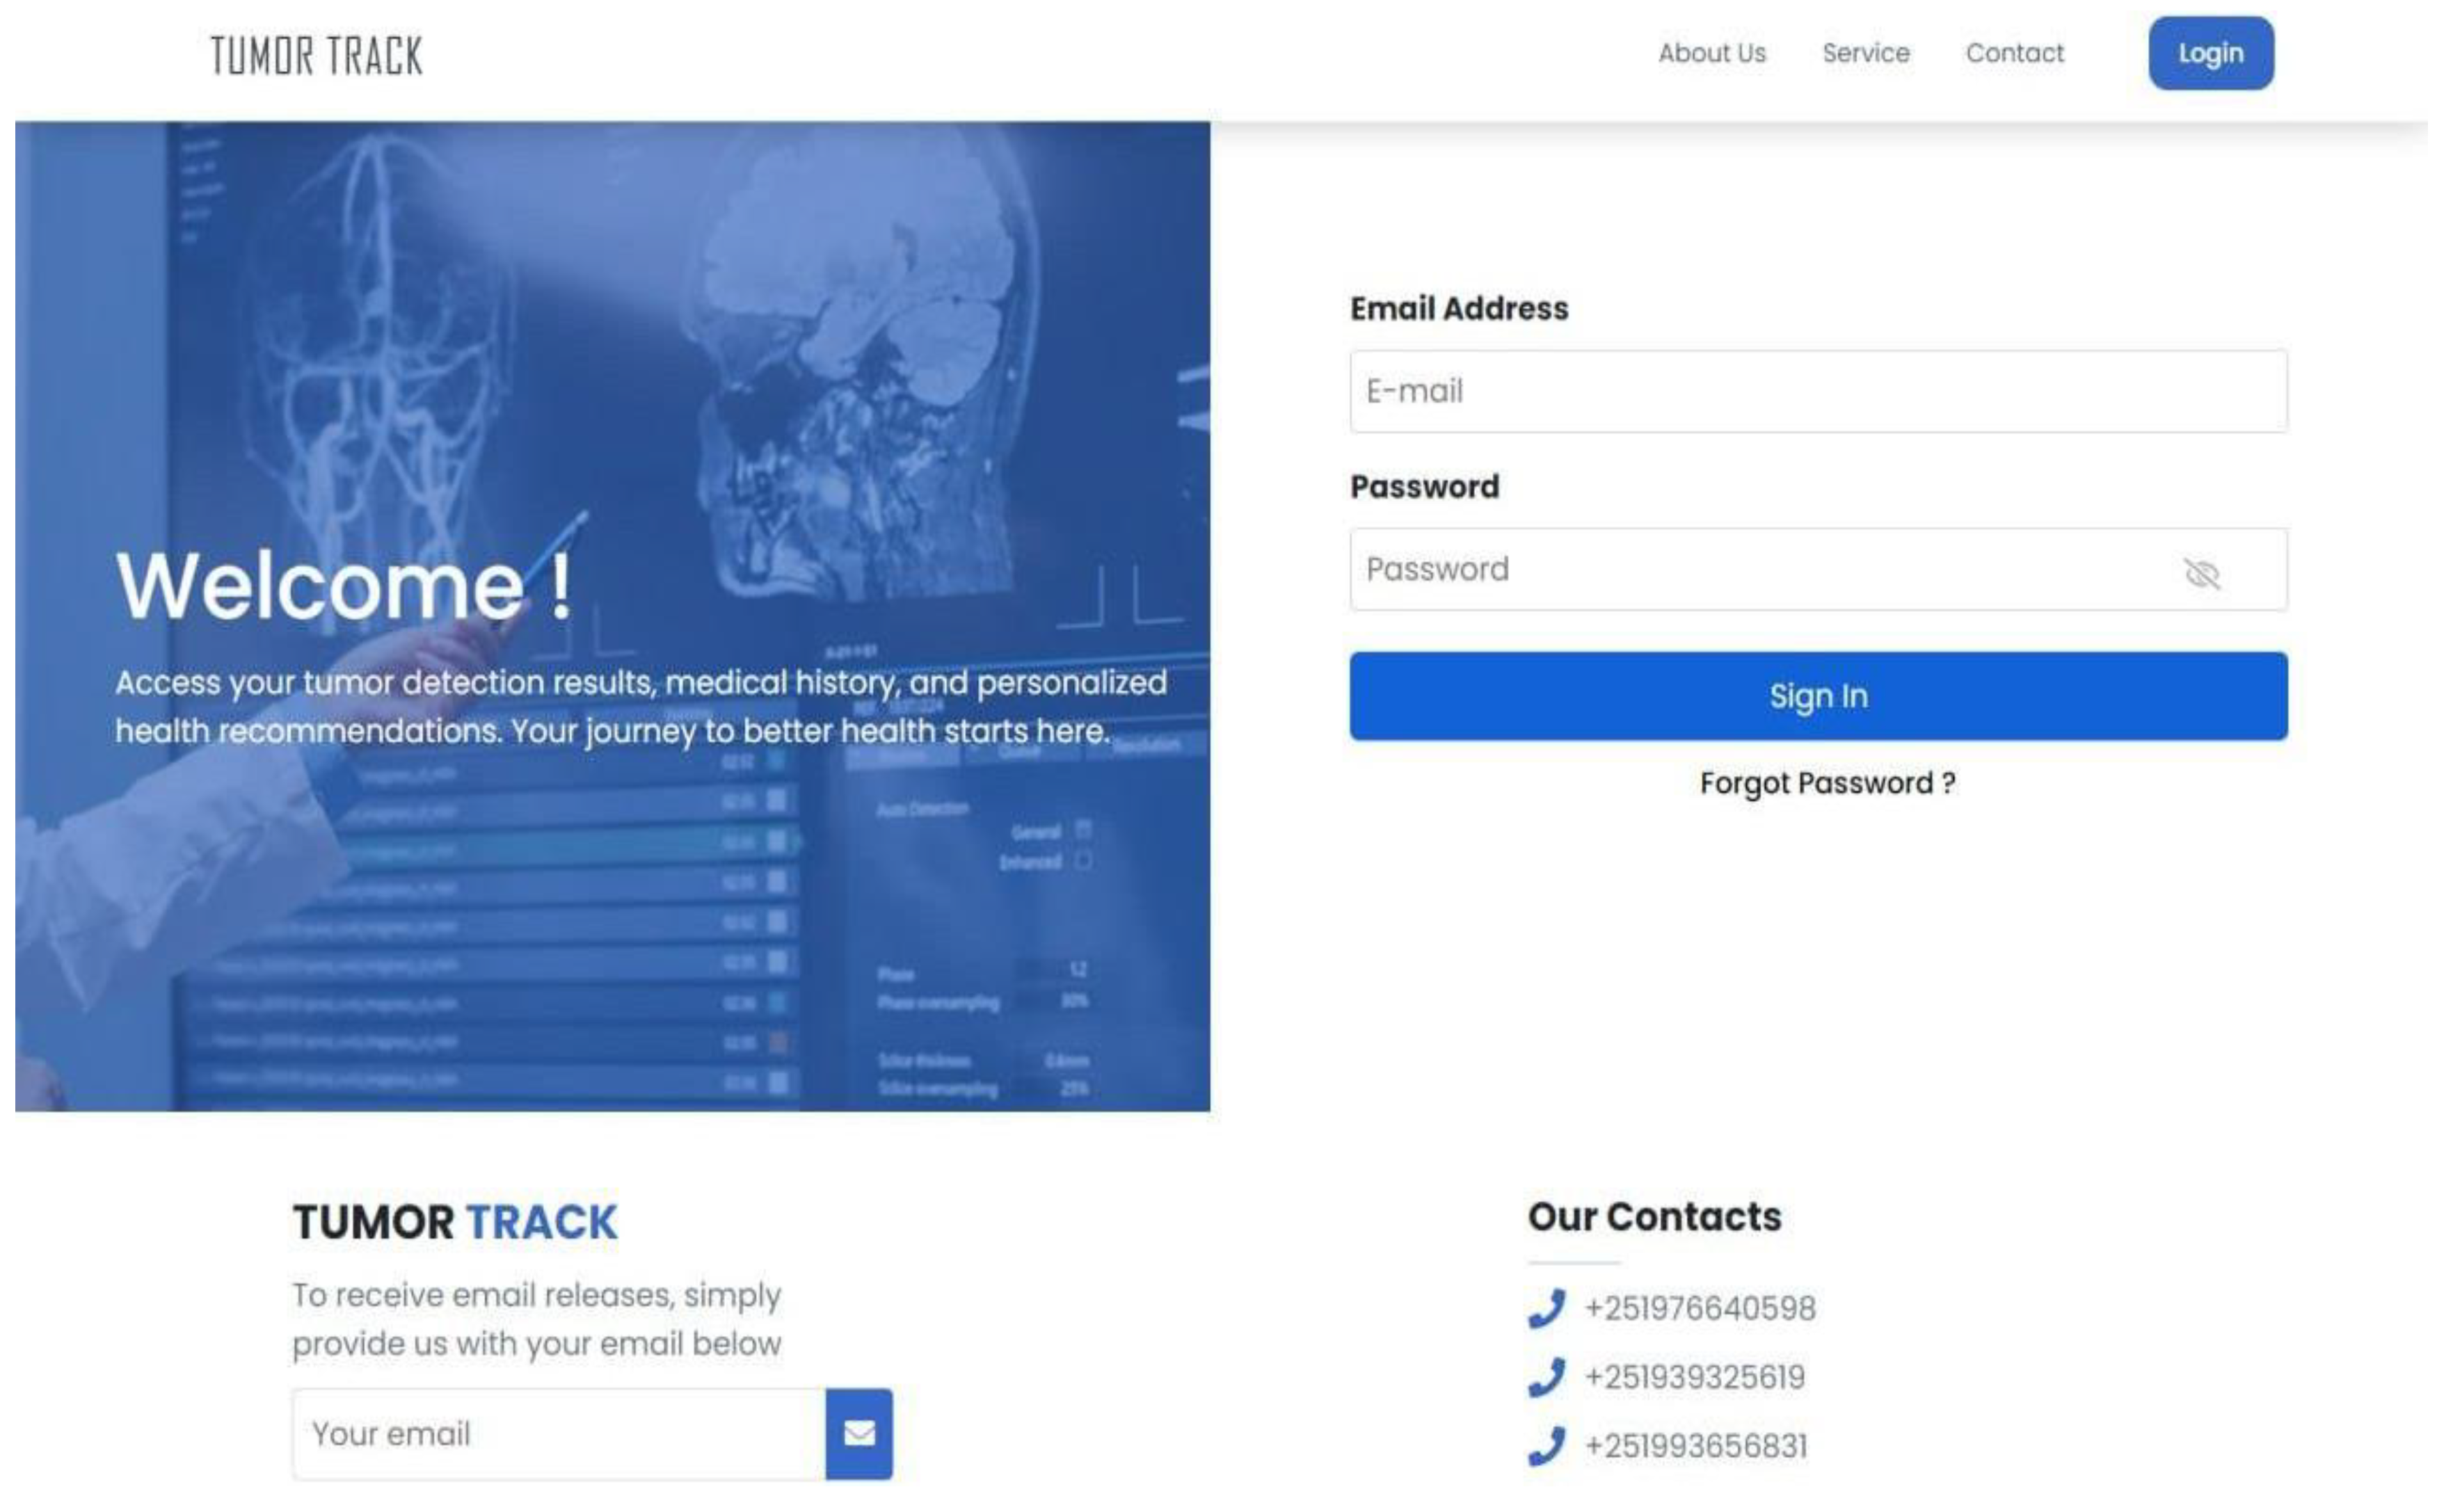
Figure 20.
Login page.
3.4.4. Implementation
The Tumor Track web application is designed to streamline the diagnosis and treatment process for brain tumors using modern web technologies and advanced deep learning models. The system integrates a user-friendly front-end interface, a robust back-end server, a reliable database, and sophisticated deep learning models for brain tumor classification and segmentation.
3.4.4.1. Frontend Implementation
React: Chosen for its component-based architecture, making the UI highly reusable and maintainable. Enhances development efficiency and code reuse.
React Router DOM: Facilitates seamless navigation within the application. Improves user experience through smooth transitions.
AXIOS: Handles API requests efficiently, ensuring smooth communication between frontend and backend. Simplifies data fetching and error handling.
React Toastify: Provides easy-to-use notifications, improving user experience. Enhances user interaction with real-time feedback.
Bootstrap: Ensures responsive design, making the application accessible on various devices. Ensures a consistent look and feel across different devices.
JWT Decoder: Helps manage JSON Web Tokens for user authentication. Secures user sessions and protects sensitive data.
React Bootstrap and React Icons: Enhance the UI with pre-built components and icons. Speeds up development and improves aesthetics.
3.4.4.2. Backend Implementation:
Django: Chosen for its robustness, scalability, and secure nature. It provides a reliable framework for developing complex web applications.
Djoser: Simplifies the authentication process, providing out-of-the-box support for JWT. It streamlines user management and authentication.
MySQL and SQLite: Used for database management. MySQL handles large-scale data efficiently, while SQLite is suitable for development and testing.
Pillow: Used for image processing, particularly for handling medical images. It enhances image manipulation capabilities.
Django Rest Framework (DRF): Facilitates the development of RESTful APIs. It makes the backend more flexible and easier to integrate with the frontend.
Django Cors Headers: Ensures smooth cross-origin requests. It enables seamless communication between frontend and backend.
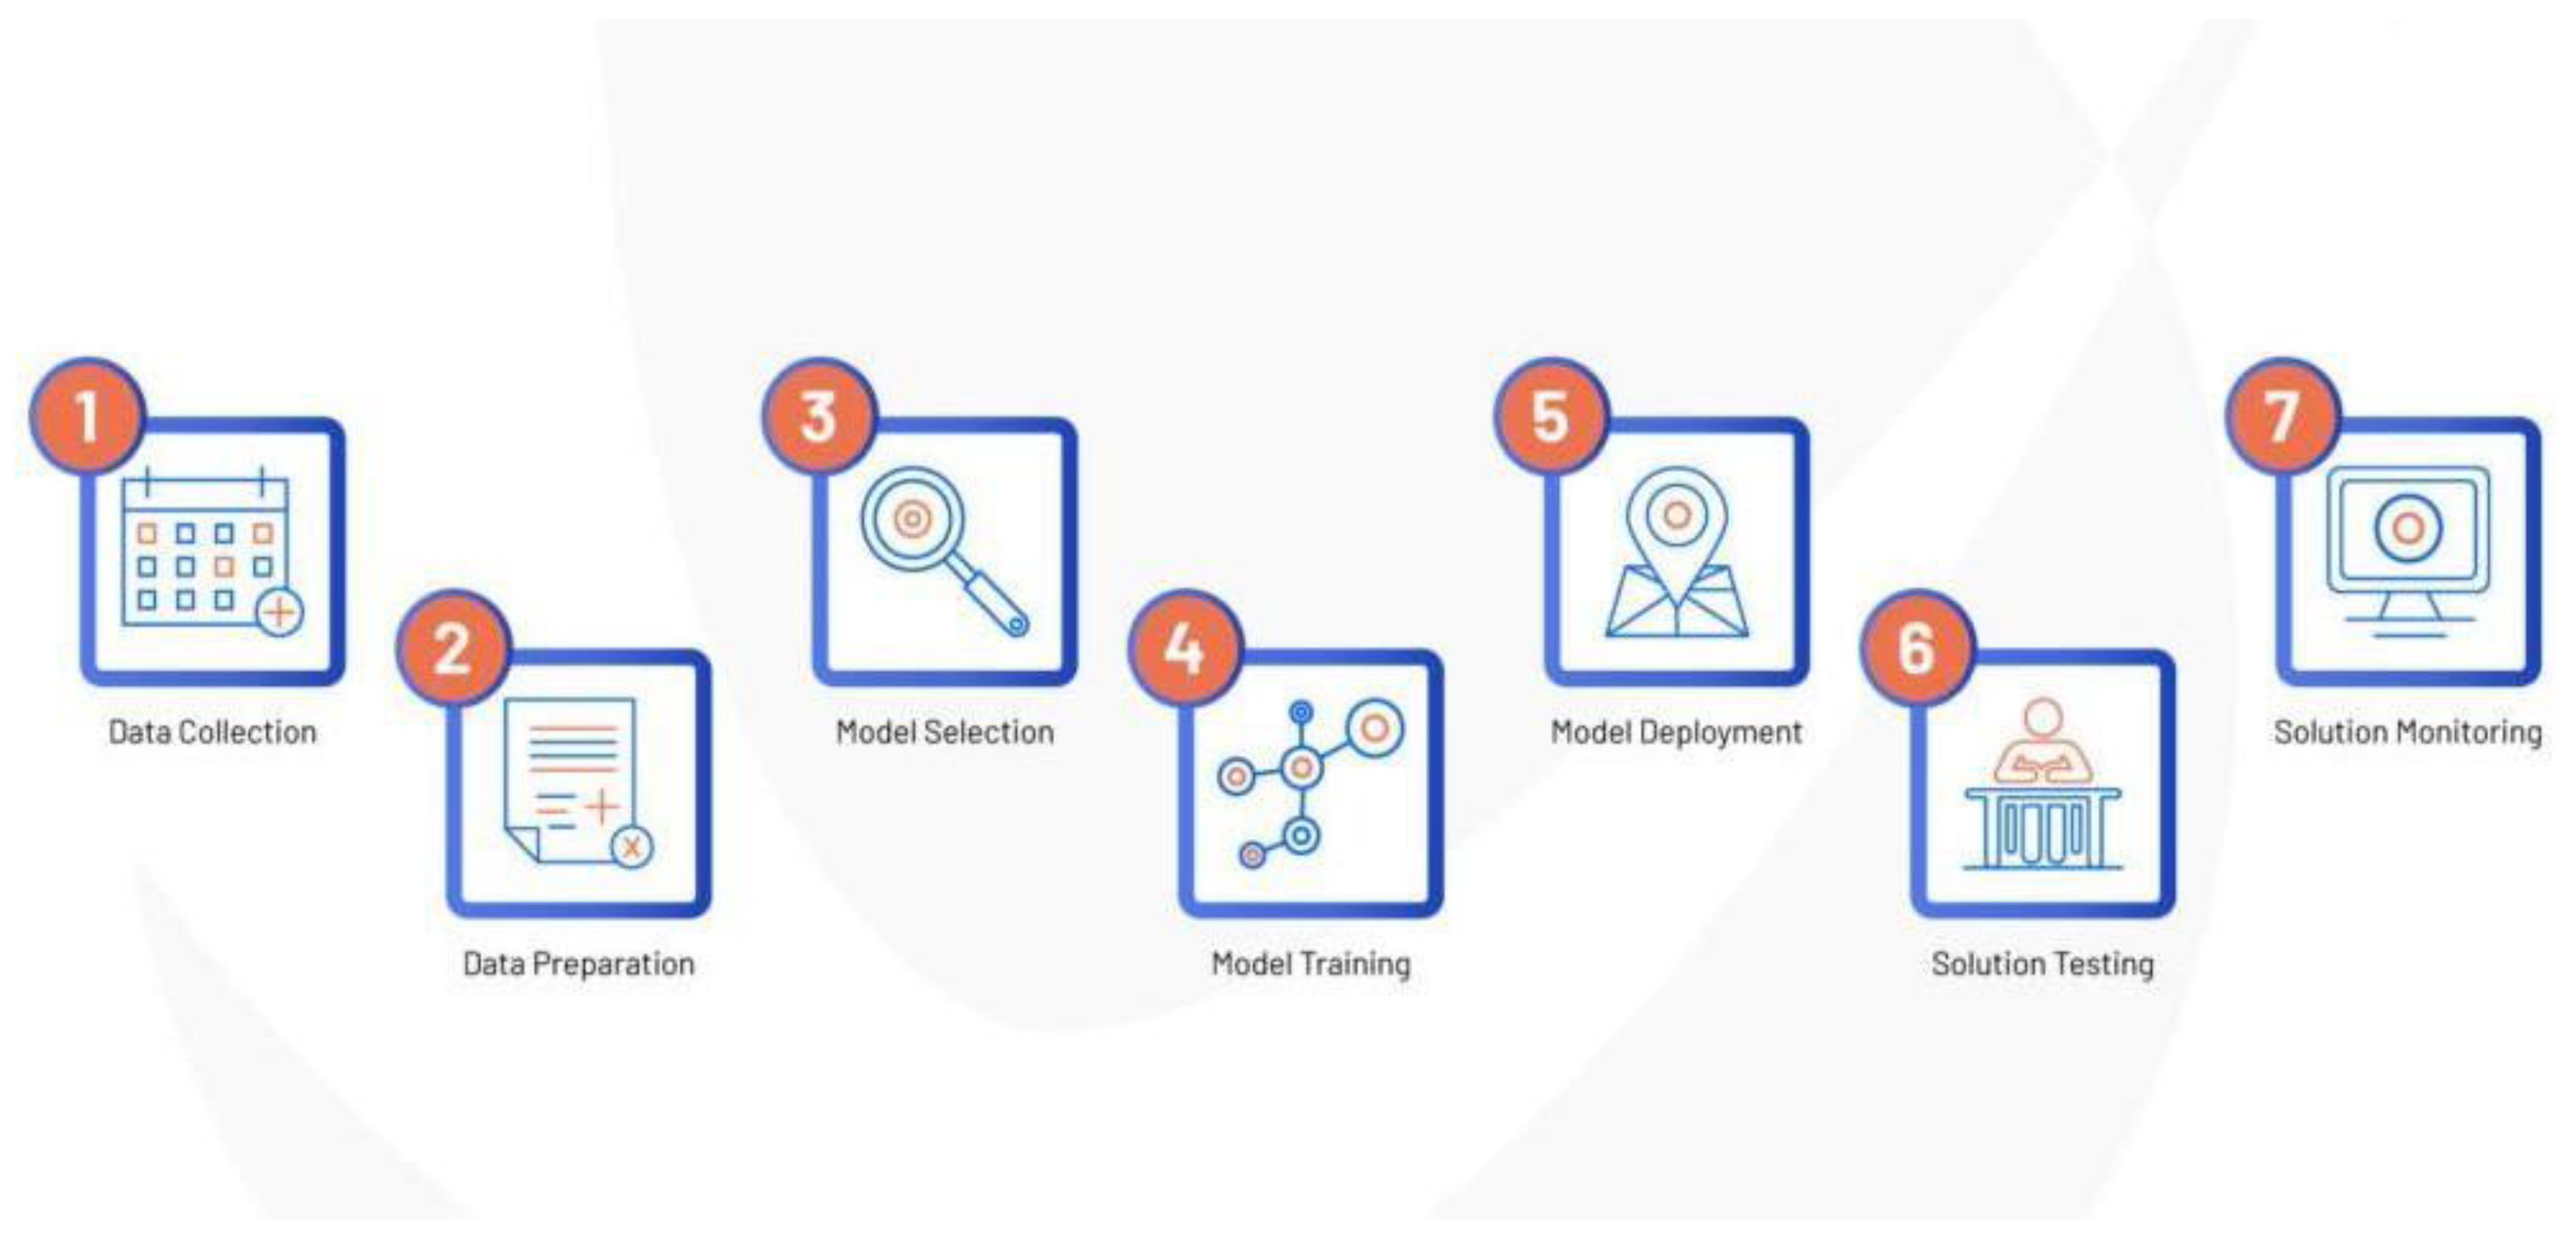
3.5. Model Development
We used two CNN architectures called ResNet 50 and U-Net for classifying and segmenting MRI images for reliable and accurate diagnosis of brain tumor. This part will cover the development process of the deep learning models.
Figure 21.
Model development process.
3.5.1. Brain Tumor Classification Model
3.5.1.1. Data Acquisition and Preparation
Detected Brain tumors in Brain MRI images using Fine-tuned ResNet-50 model with 5712 training images of which 1321 images for Glioma, 1339 images for Meningioma, 1457 images for Pituitary, and 1595 for No Tumor/Healthy. For classifying Glioma, Meningioma, Pituitary and Normal class architecture of pretrained network ResNet50 was utilized.
Table 18.
the dataset for training and testing the model.
| Classes | Number of Images |
|---|---|
| Glioma | 1321 images |
| Meningioma | 1339 images |
| Pituitary | 1457 images |
| Healthy | 1595 images |
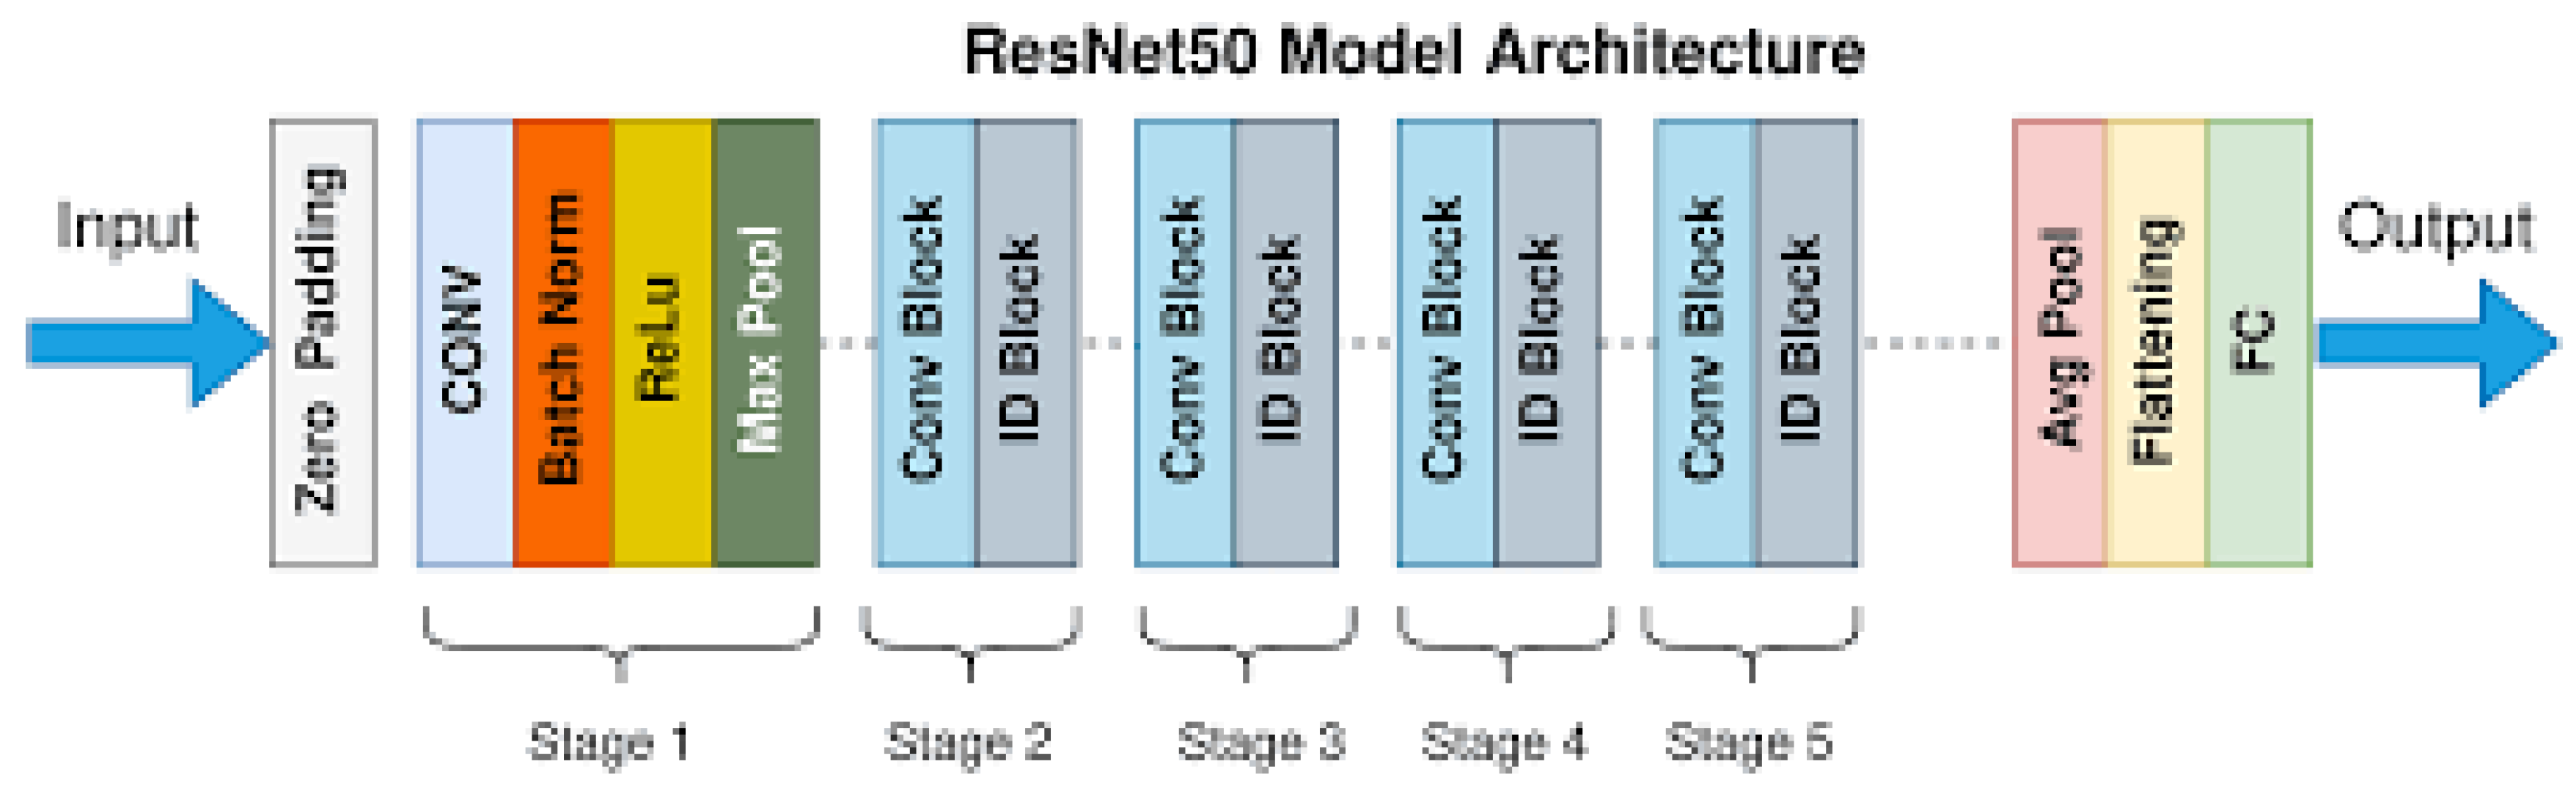
3.5.1.2. Model Selection
ResNet 50, a 50-layer deep CNN, was selected for its proven performance in image classification tasks, particularly in medical imaging. The key innovation of ResNet-50 lies in its use of residual connections, or "shortcut connections," which allow for the training of very deep networks (up to 50 layers) without suffering from vanishing gradient problems.
These shortcuts skip one or more layers and add the output from an earlier layer to the output of a later layer, enabling the network to learn residual functions rather than directly learn underlying mapping functions. This approach facilitates the training of deeper networks by mitigating the degradation problem, where accuracy saturates and then degrades with increasing depth.
ResNet-50 comprises 50 convolutional layers, including convolutional, pooling, and fully connected layers. The architecture includes residual blocks with skip connections, consisting of multiple convolutional layers with shortcut connections. It employs batch normalization and ReLU activation functions to improve training stability and efficiency.
Figure 22.
ResNet 50 Model Architecture.
Layer Details:
- Input Layer: Receives the input image.
- Convolutional Layers: Initial layers that perform feature extraction through convolution operations.
- Residual Blocks:
- Core building blocks of ResNet.
- Each block contains two convolutional layers with batch normalization and ReLU activation.
- Introduces skip connections to facilitate the learning of residual mappings.
- Pooling Layers: Subsequent layers that reduce the spatial dimensions of feature maps while preserving important information.
- Fully Connected Layers: Layers near the end of the network responsible for classification.
- Output Layer: Final layer that produces output predictions.
- Typically uses softmax activation for classification tasks.
3.5.1.3. Training Procedure
- The dataset was splitted into training, validation, and test sets (80% training, 20% testing).
- The model was trained for 50 epochs with early stopping based on validation loss to prevent overfitting.
- Batch normalization was used to stabilize and accelerate the training process.
3.5.2. Segmentation
3.5.2.1. Data Acquisition Data Set Selection:
We use a data set containing 3064 T1-weighted contrast-enhanced MRI images from 233 patients, featuring three types of brain tumors: meningioma (708 slices), glioma (1426 slices), and pituitary tumor (930 slices).
The data is organized into four subsets, each containing 766 slices, and is provided in MATLAB format (.mat files).
Table 19.
Organization of T1-weighted contrast-enhanced MRI images.
| Parameter | Values |
|---|---|
| Labels | 3064 |
| Images | 3064 |
| Masks | 3064 |
| Augmented images | 4902 |
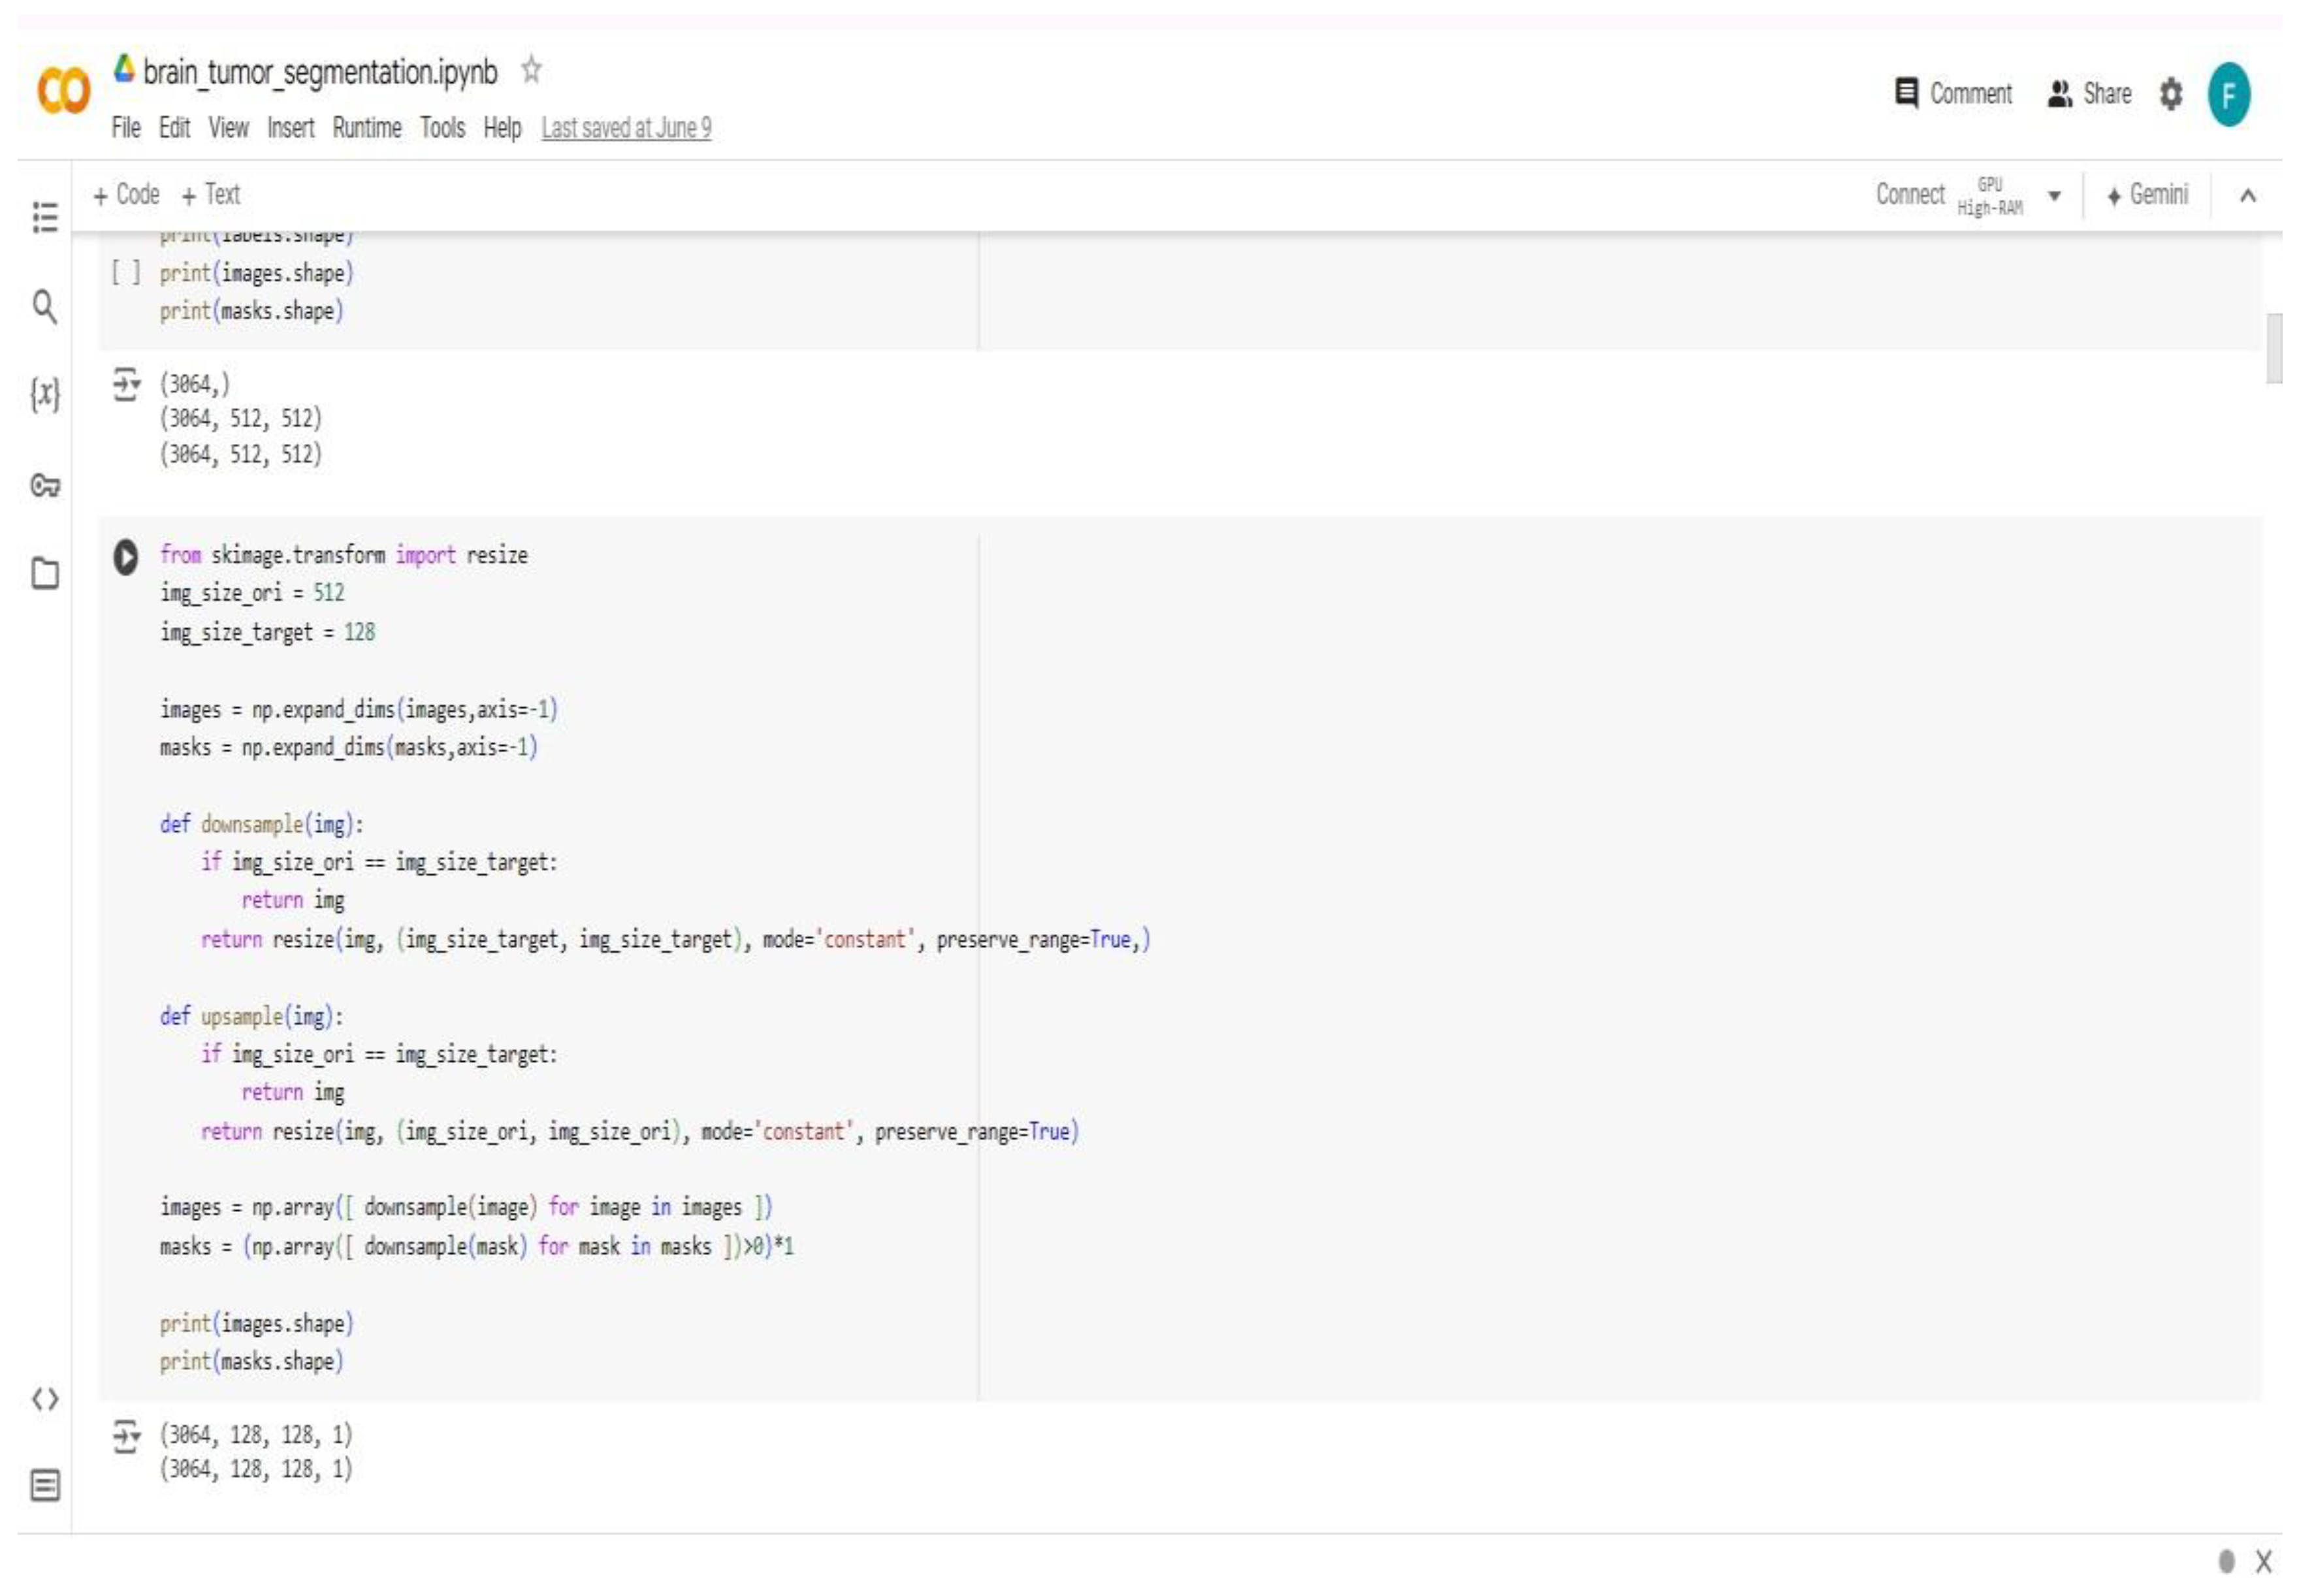
3.5.2.2. Data Pre Processing
Normalization: The MRI images were normalized to have zero mean and unit variance.
Re-sizing: Images and masks were resized to a consistent size suitable for U-Net input, typically 128x128 pixels.
Data Augmentation: data augmentation techniques such as horizontal flipping to increase the diversity of the training data and prevent over-fitting were applied.
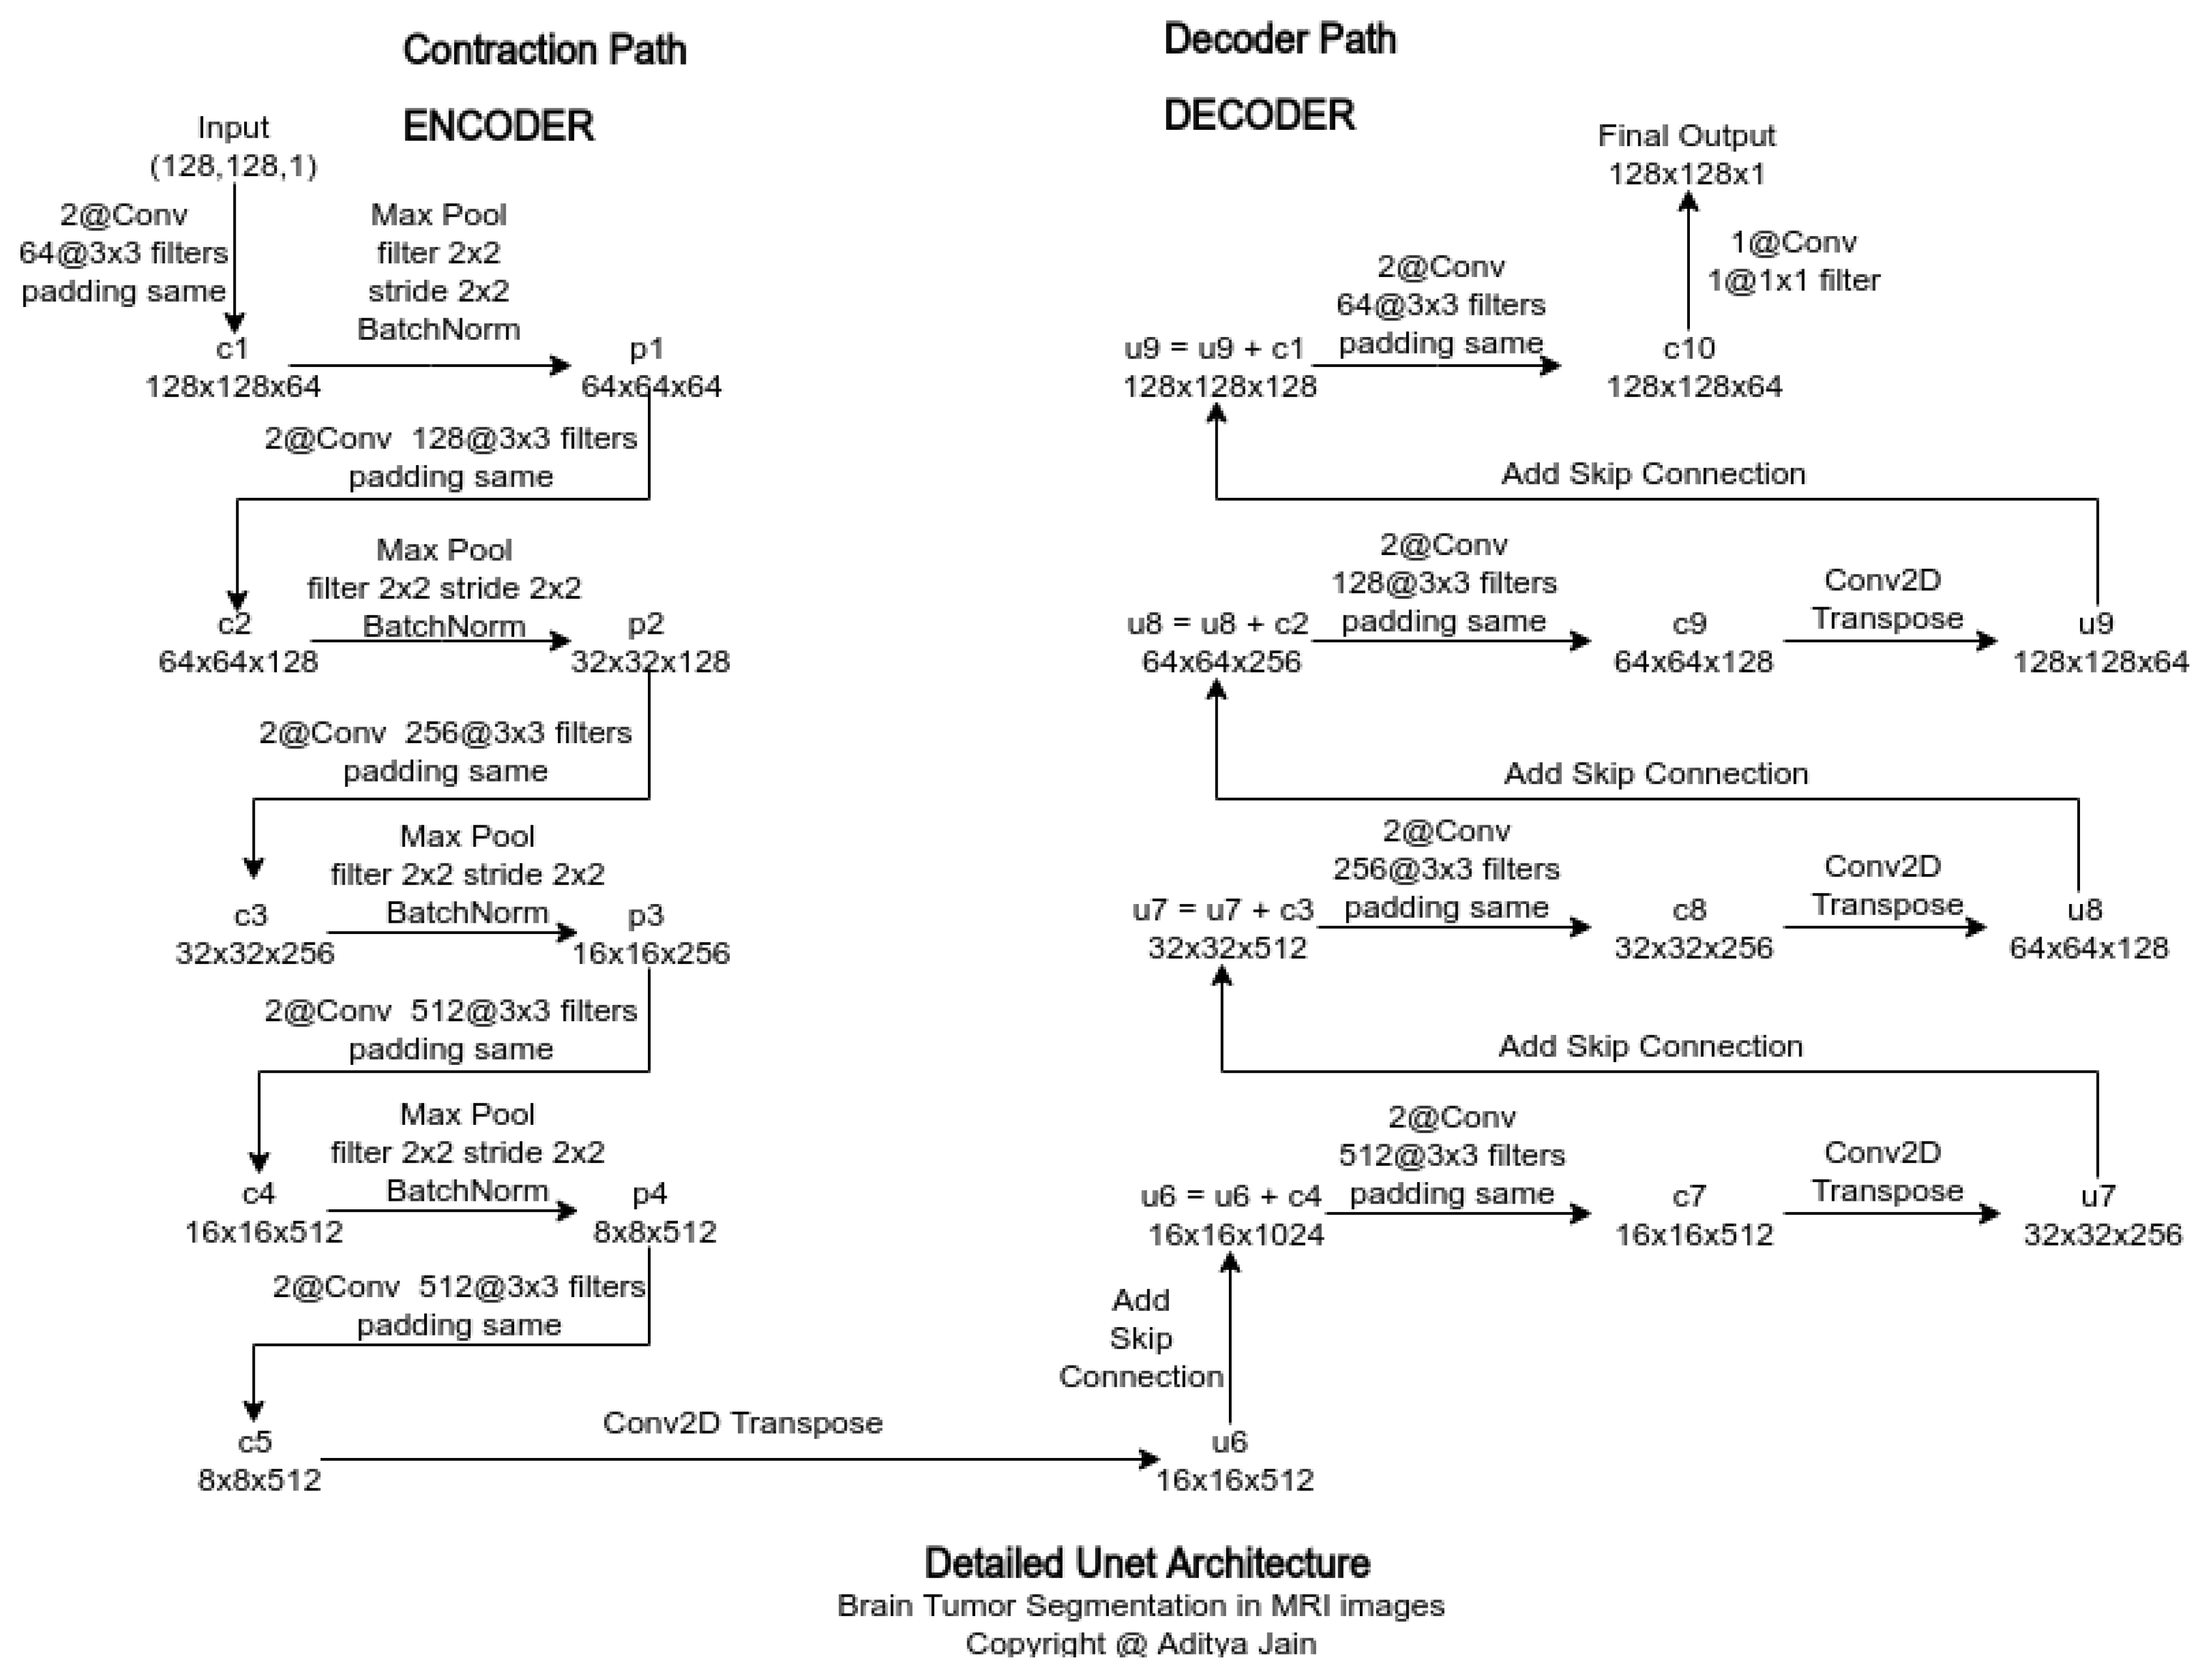
3.5.2.3. Model Architecture
UNet, known for its U-shaped architecture, was chosen for medical image segmentation due to its efficacy in capturing both spatial and contextual information.
Its design facilitates precise localization and high-quality segmentation, which is crucial for identifying tumor boundaries.
Contracting Path: Construct the encoder part of the U-Net with convolutional layers followed by ReLU activation's and max-pooling layers to capture context.
Bottleneck: Implement the bottleneck part where the features are highly abstracted.
Expansive Path: Construct the decoder part with up-convolution (transposed convolution) layers and concatenation from corresponding layers in the contracting path to recover spatial information and enable precise localization.
Figure 23.
U-Net Architecture.
Layer Details:
- Use 3x3 convolutional layers with padding to preserve spatial dimensions.
- Employ ReLU activation functions after each convolution.
- Use max-pooling layers with a pool size of 2x2 for down-sampling.
- Use transposed convolutions for up-sampling in the decoder part.
- Apply dropout layers where necessary to prevent over-fitting.
Loss Function: We use a combination of binary cross-entropy loss and Dice coefficient loss to handle class imbalance and ensure better segmentation accuracy.
Optimizer: We use the Adam optimizer with an initial learning rate set to 1e-4.
3.5.2.4. Training Procedure
- We split the data set into training, and test sets (80% training, 20% validation).
- We train the model for 100 epochs with early stopping based on validation loss to prevent over fitting.
- We use batch normalization to stabilize and accelerate the training process.
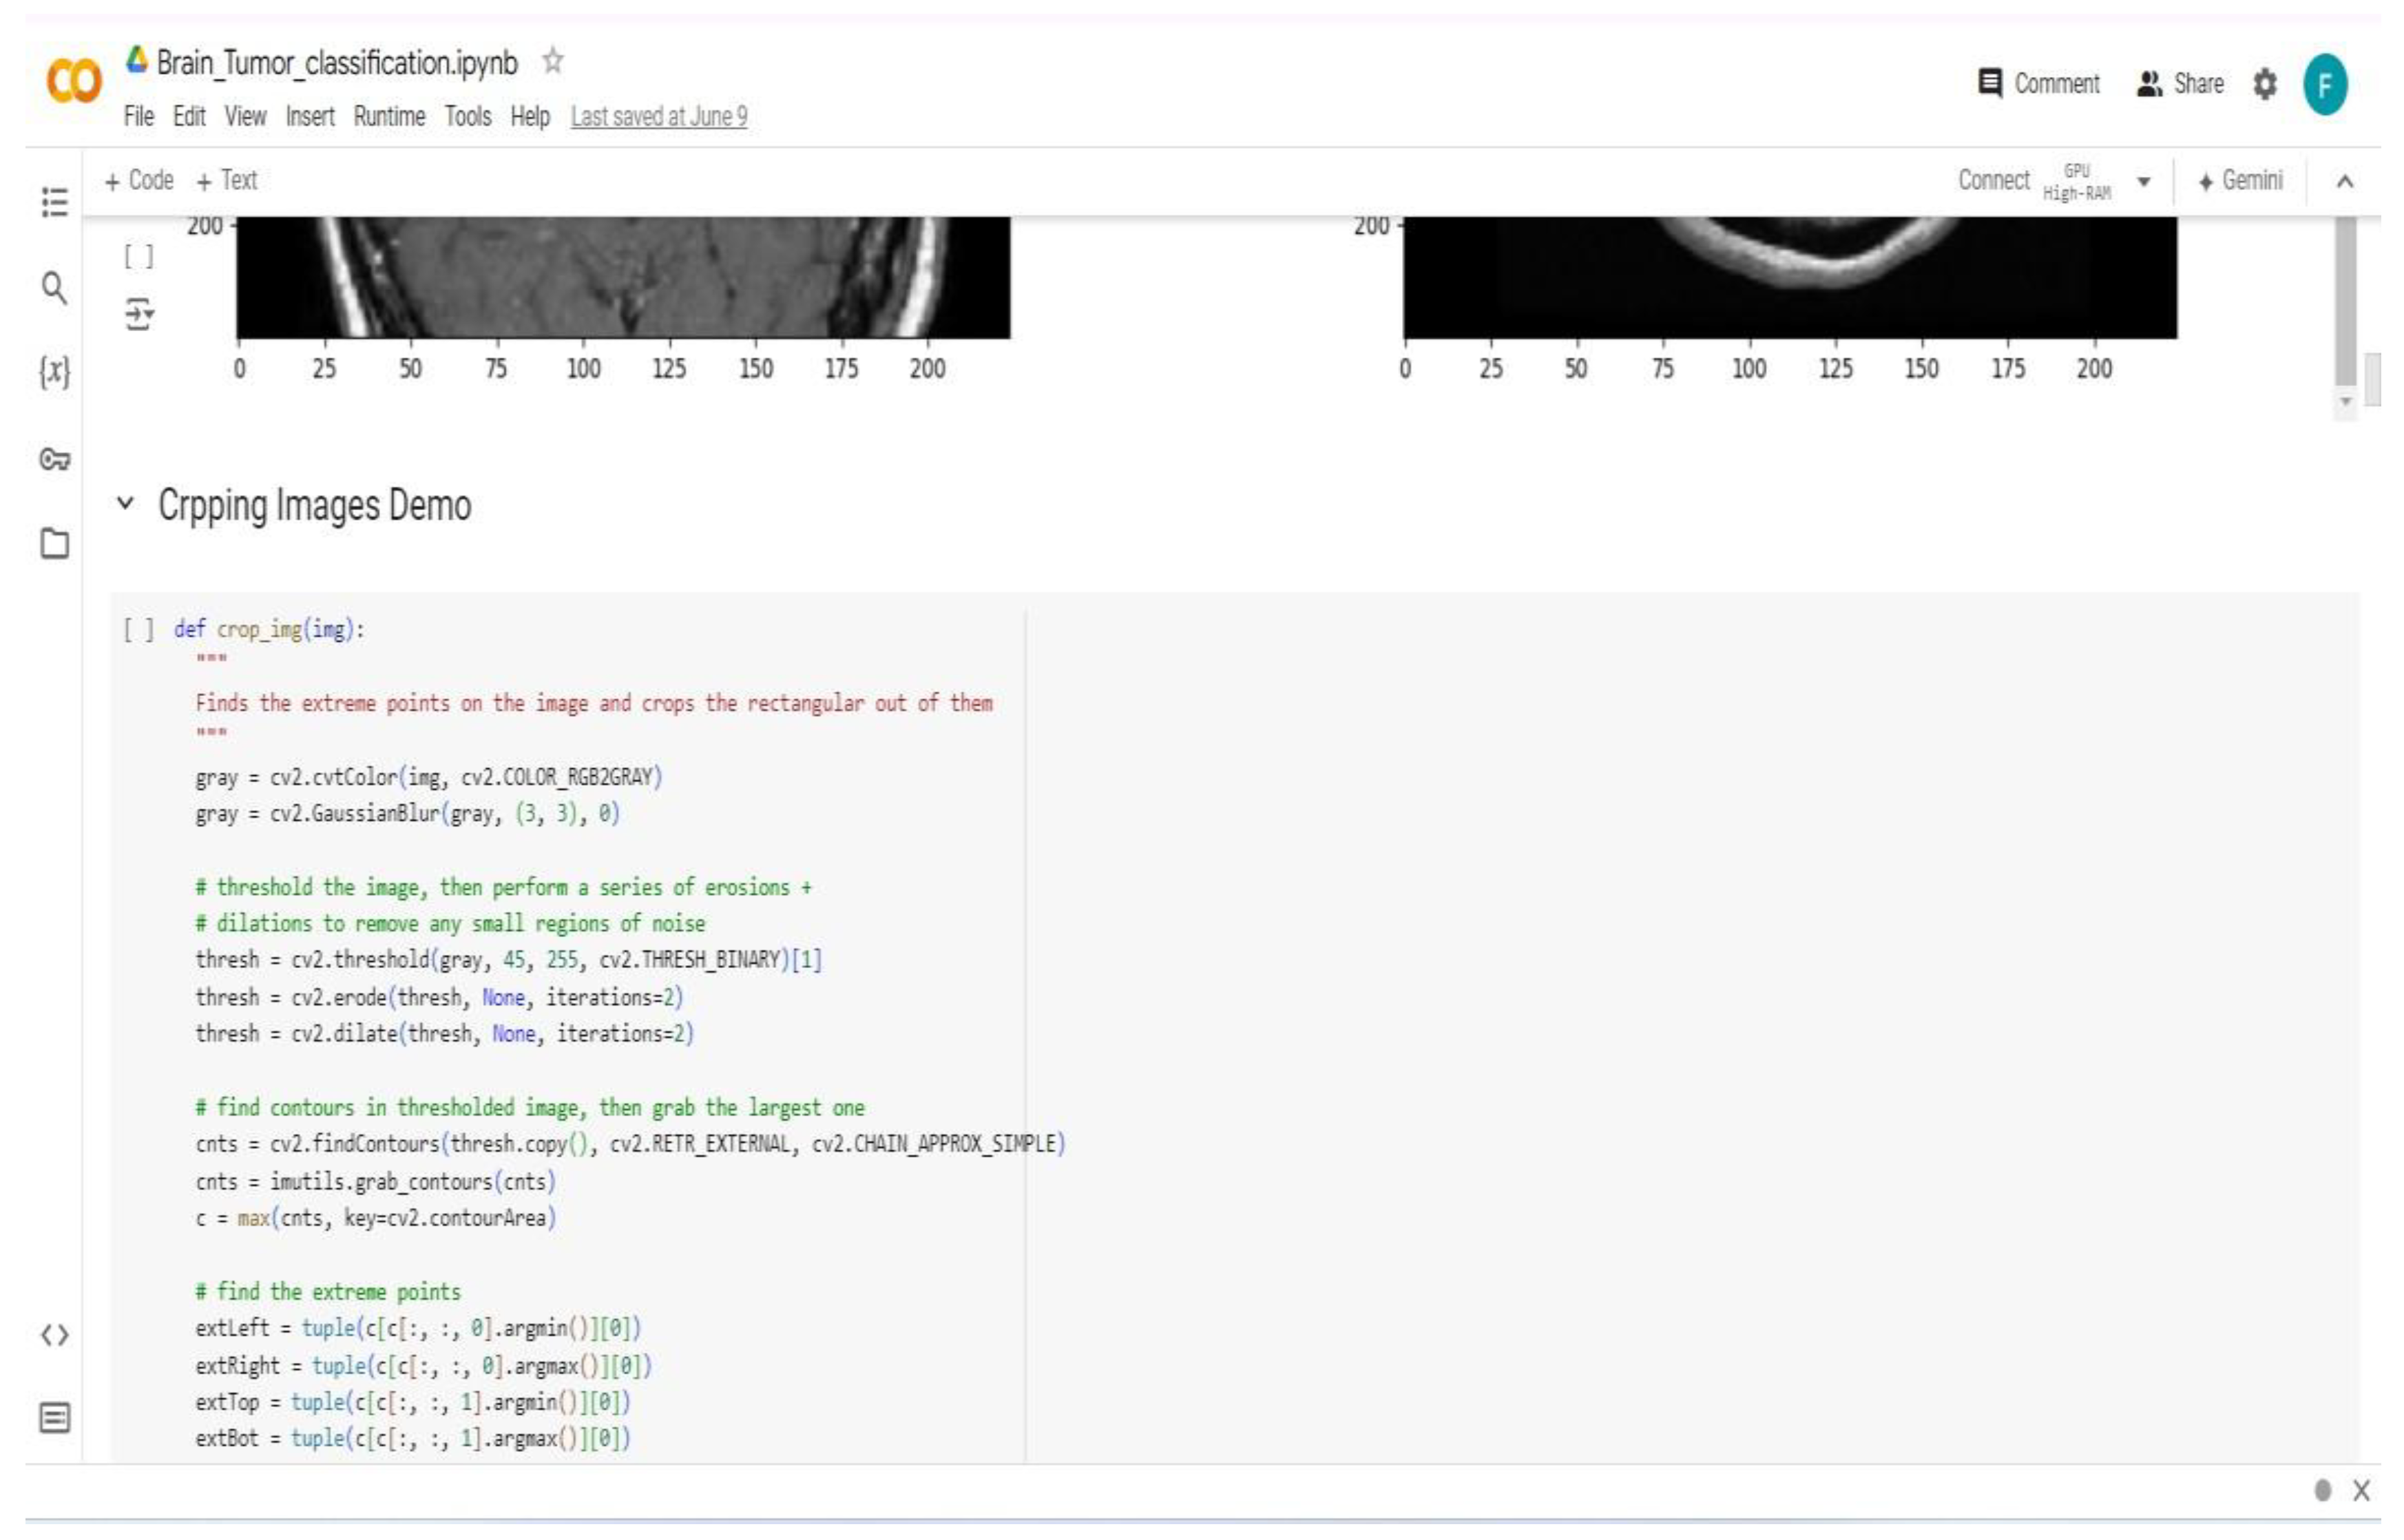
3.5.2.5. Data Post-Processing
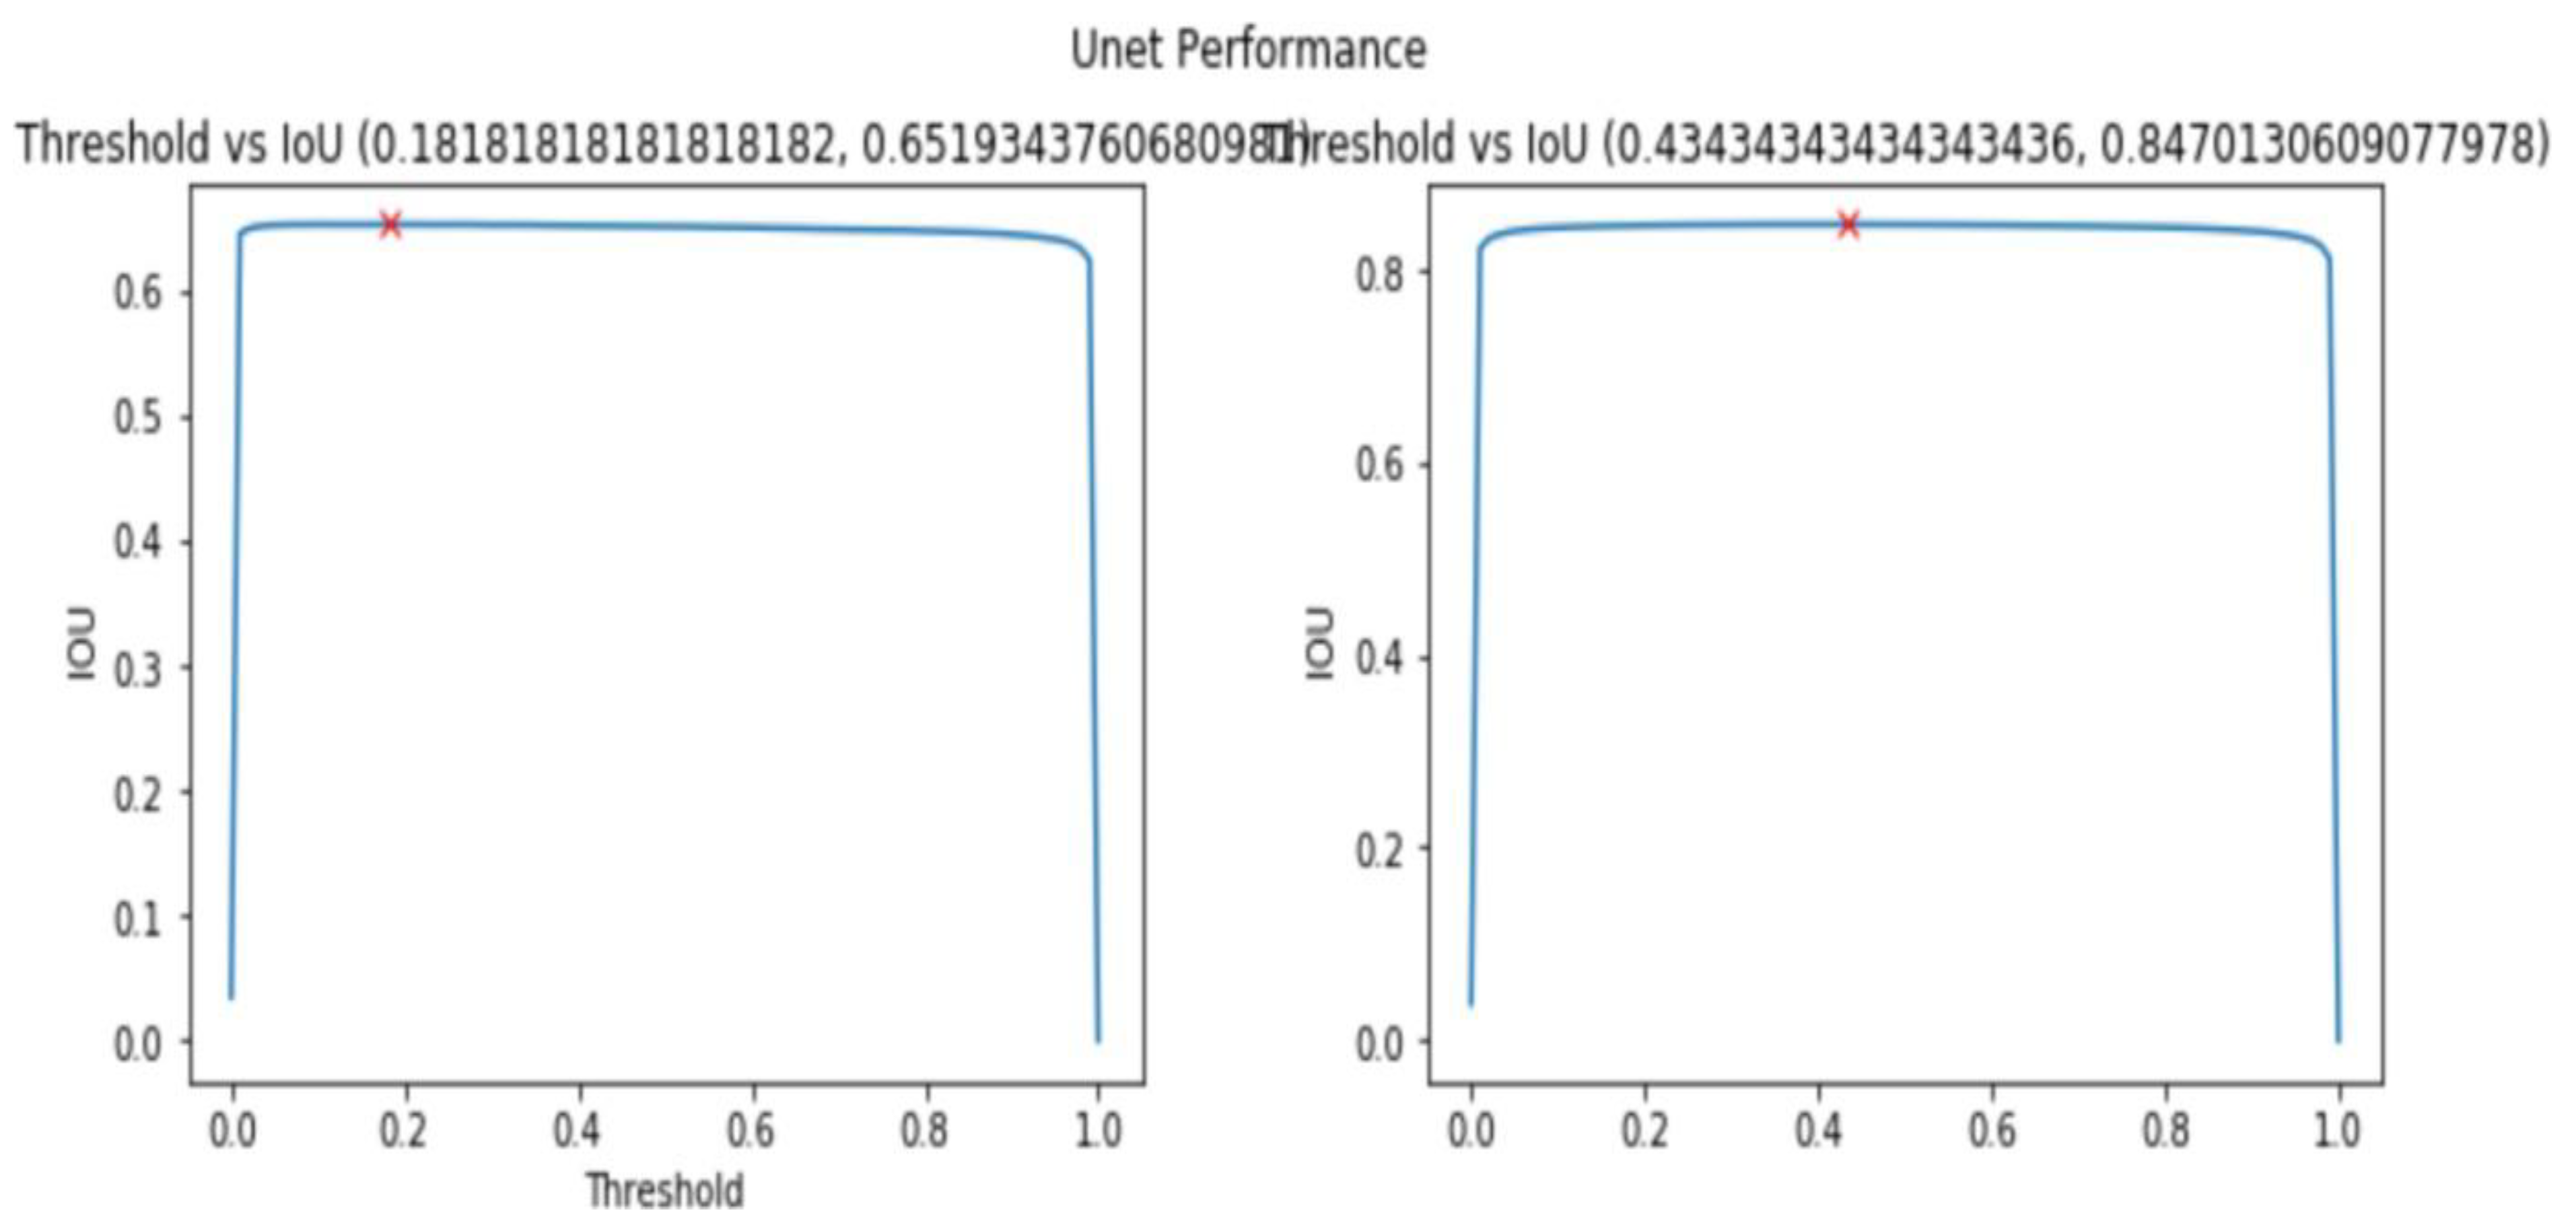
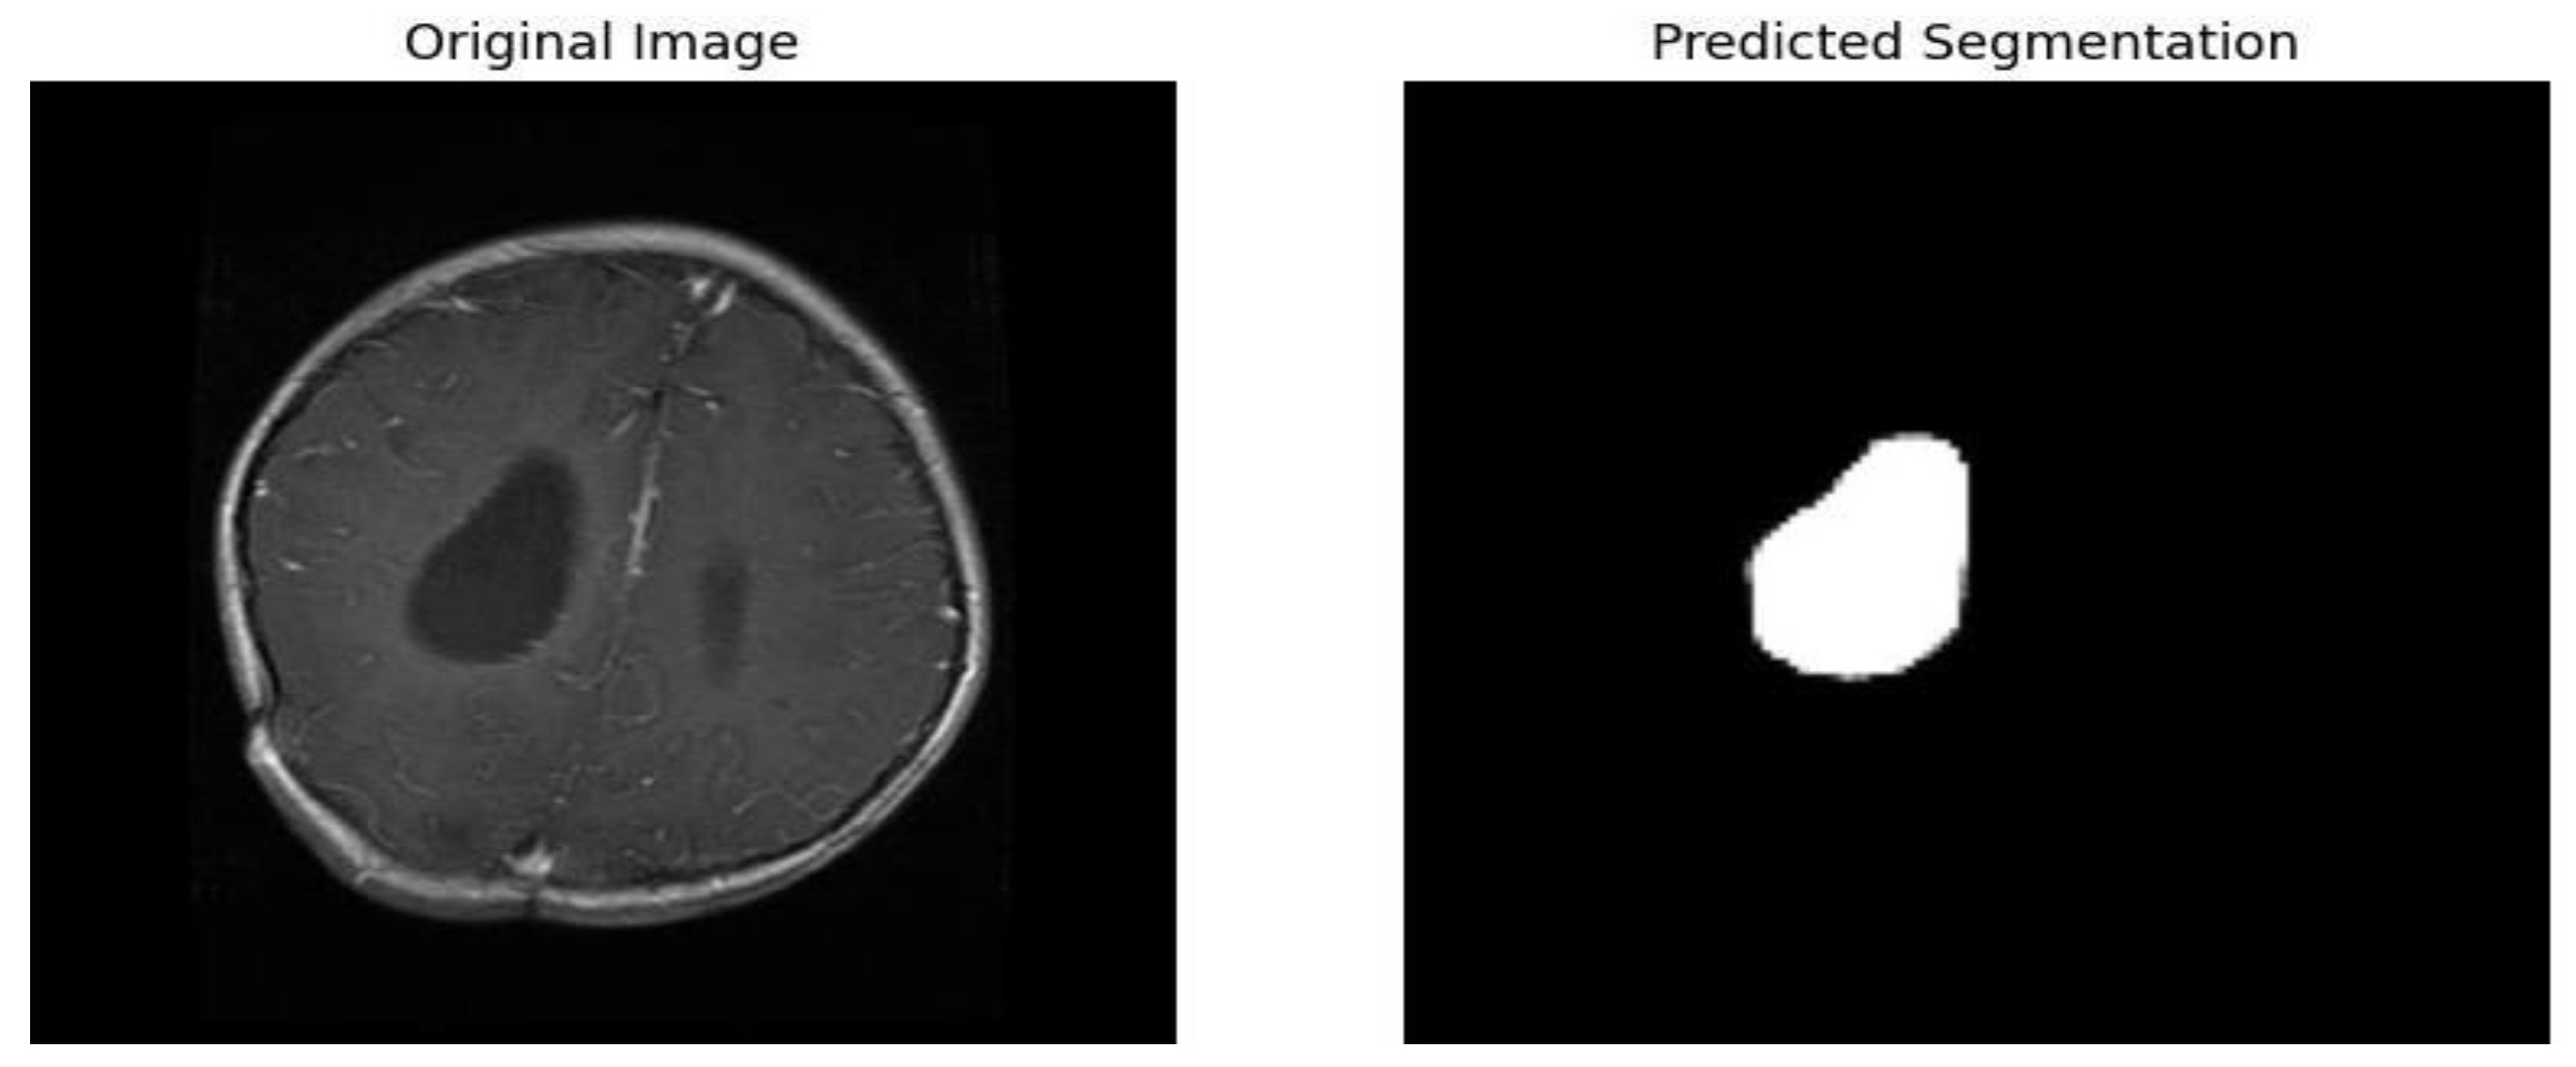
Thresholding: We apply thresholding on the predicted probability maps to obtain binary segmentation masks.
Figure 24.
Threshold Vs IOU graphs.
Google Colab Pro
Google Colab Pro is a paid subscription service that offers advanced features and resources for users of the free Google Colab platform. Here are some key points about why Google Colab Pro is used:
- Improved Performance: Colab Pro provides faster GPUs and more memory, which improves the performance of resource-intensive tasks.
- Increased Flexibility: Colab Pro offers longer runtimes and background execution, which increases flexibility and control over resource allocation.
- Enhanced Debugging: Colab Pro's terminal access and continuous execution enhance debugging capabilities and ensure that users can resume their work seamlessly.
- Cost-Effective: Colab Pro is priced at $9.99 per month, making it a cost-effective option for users who require advanced features and resources.
- Community Support: Colab Pro has a large and active community of users and developers who contribute to its development and provide support through various resources.
3.6. Integration
To integrate our trained model into the software, creating a powerful image processing pipeline we used OpenCV-Python and TensorFlow.
OpenCV-Python, known for its computer vision prowess, took center stage for image loading. It efficiently handled tasks like reading the image from disk and potentially preprocessing it to match the model's input requirements, such as resizing or normalization.
Meanwhile, TensorFlow, the deep learning powerhouse, played a critical role in loading the trained model. It provided the necessary functions to import the model. Once loaded, TensorFlow facilitated the crucial step of inference, where the model analyzed the preprocessed image and generated predictions.
This seamless collaboration between OpenCV-Python for image manipulation and TensorFlow for deep learning empowered the software to leverage the model's capabilities for brain tumor detection and classification.
The subsequent sections discuss the outcomes of these implementations, analyzing the system's performance, the accuracy of the AI-assisted diagnoses, and user feedback. We will further discuss the challenges encountered, their implications on the overall system functionality, and potential areas for future enhancement. The results and discussion section provide a thorough evaluation of how effectively the Tumor Track web application meets its objectives and the value it adds to the medical diagnostic process.
Chapter Four Result and Discussion
4.1. Introduction
In this chapter, we present the results of our research and discuss the implications of our findings. The primary focus will be on the outcomes of our software development, AI model training, and the integration of these components into the Tumor Track web application. We will also address the experimental setup used to obtain these results, and provide a thorough discussion on the challenges faced, contributions made, and limitations encountered during the project.
4.2. Experimental Setup
4.2.1. Introduction
Objective: To evaluate Tumor Track system, a medical website designed to streamline patient management, diagnosis, and specialist consultations using both manual input and AI-based brain tumor classification and segmentation.
Hypothesis: Tumor Track system will improve the efficiency and accuracy of patient management and diagnosis in a clinical setting.
4.2.2. Materials and Equipment Hardware:
- Computers: For development, testing, and user access.
Software:
- 2.
- Development Tools: IDE (Visual Studio Code and Google Colab), version control (Git), web server (XAMPP).
- 3.
- Programming Languages: React for frontend and Django framework for backend development.
- 4.
- Database: SQL-based database (MySQL) for storing user data, patient records, MRI images, and other necessary information.
- 5.
- AI Model: Pre-trained deep learning models for brain tumor classification andsegmentation using ResNet 50 and U-Net respectively.
- 6.
- Testing Tools: Manual testing scripts.
4.2.3. Testing Strategy
- 1.
- Unit Testing: Test individual components of the system to ensure they function correctly.
- 2.
- Integration Testing: Verify that different modules of the system work together as expected.
- 3.
- System Testing: Conduct end-to-end testing to ensure the entire system operates correctly under various scenarios.
4.2.4. Test Procedure
The system will be tested in a controlled environment simulating a real clinical setting. User access will be tested from different locations to simulate remote access scenarios.
- 1.
- Develop System Tests: Write test cases that cover all functional and non- functional requirements.
- 2.
- Execute Tests: Conduct the tests to validate overall system behavior.
- 3.
- Analyze Results: Review test results to ensure the system meets all specified requirements.
4.2.5. Safety Considerations
Data Privacy: Ensure all patient data is encrypted and access is restricted to authorized personnel only.
System Security: Implement robust security measures to protect against cyber threats and data breaches.
By following this detailed experimental setup, we aim to develop a robust and efficient medical web application that enhances the workflow of patient management, diagnosis, and specialist consultation, leveraging both manual input and advanced AI capabilities. This setup ensures thorough testing and validation to achieve a reliable and user-friendly system.
4.3. Result
Testing and evaluation of Tumor Track is divided in to three sections the software, AI model, and integration.
4.3.1. Software Testing and Evaluation
To test the proper functioning of the software we will be using scenarios that can test the software performance.
Table 20.
Test scenario 1.
| Scenario Id | 01 |
| Scenario Name | Patient with severe Tumor case |
| Participant Actor | Patient (Girma Worku), Medical receptionist (Sara Bilew), Doctor (Dr. Yonas Geda), Radiologist (Leole Masresha), Specialist (Dr. Hana Asfaw) |
| Flow of events |
|
Figure 25.
Medical receptionist creating patient account.
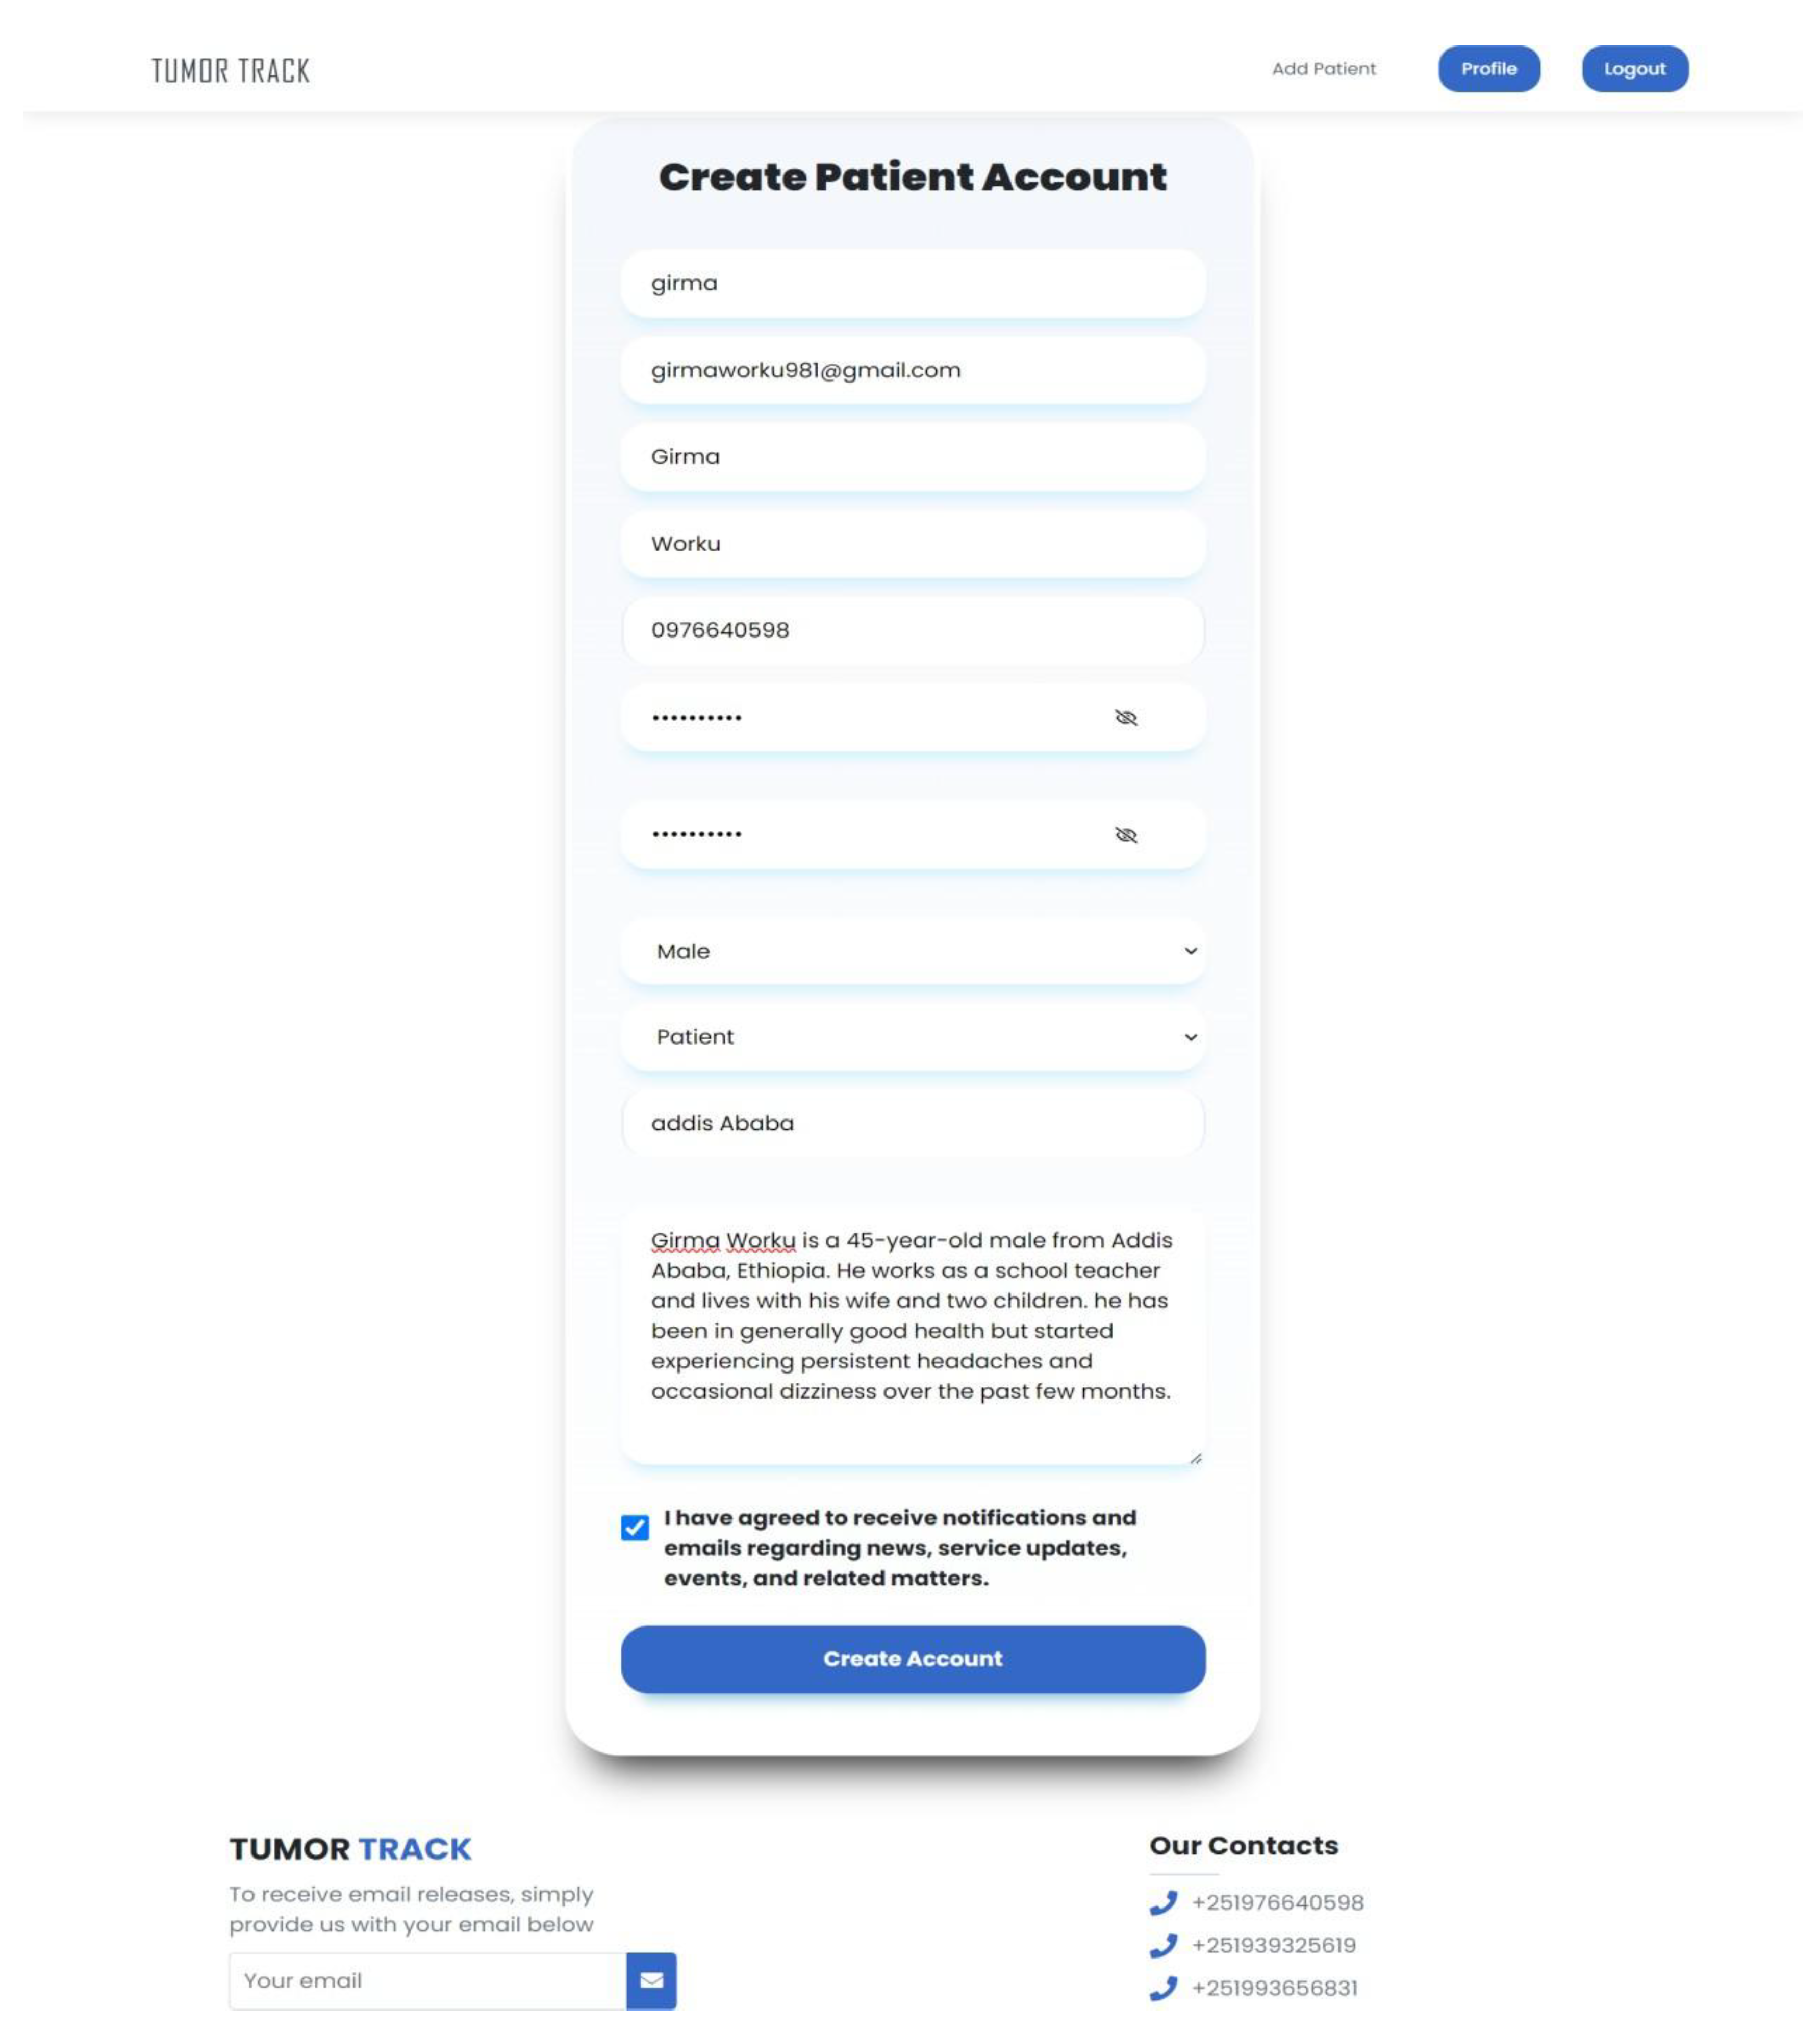
Figure 26.
Patient receive email for verification.
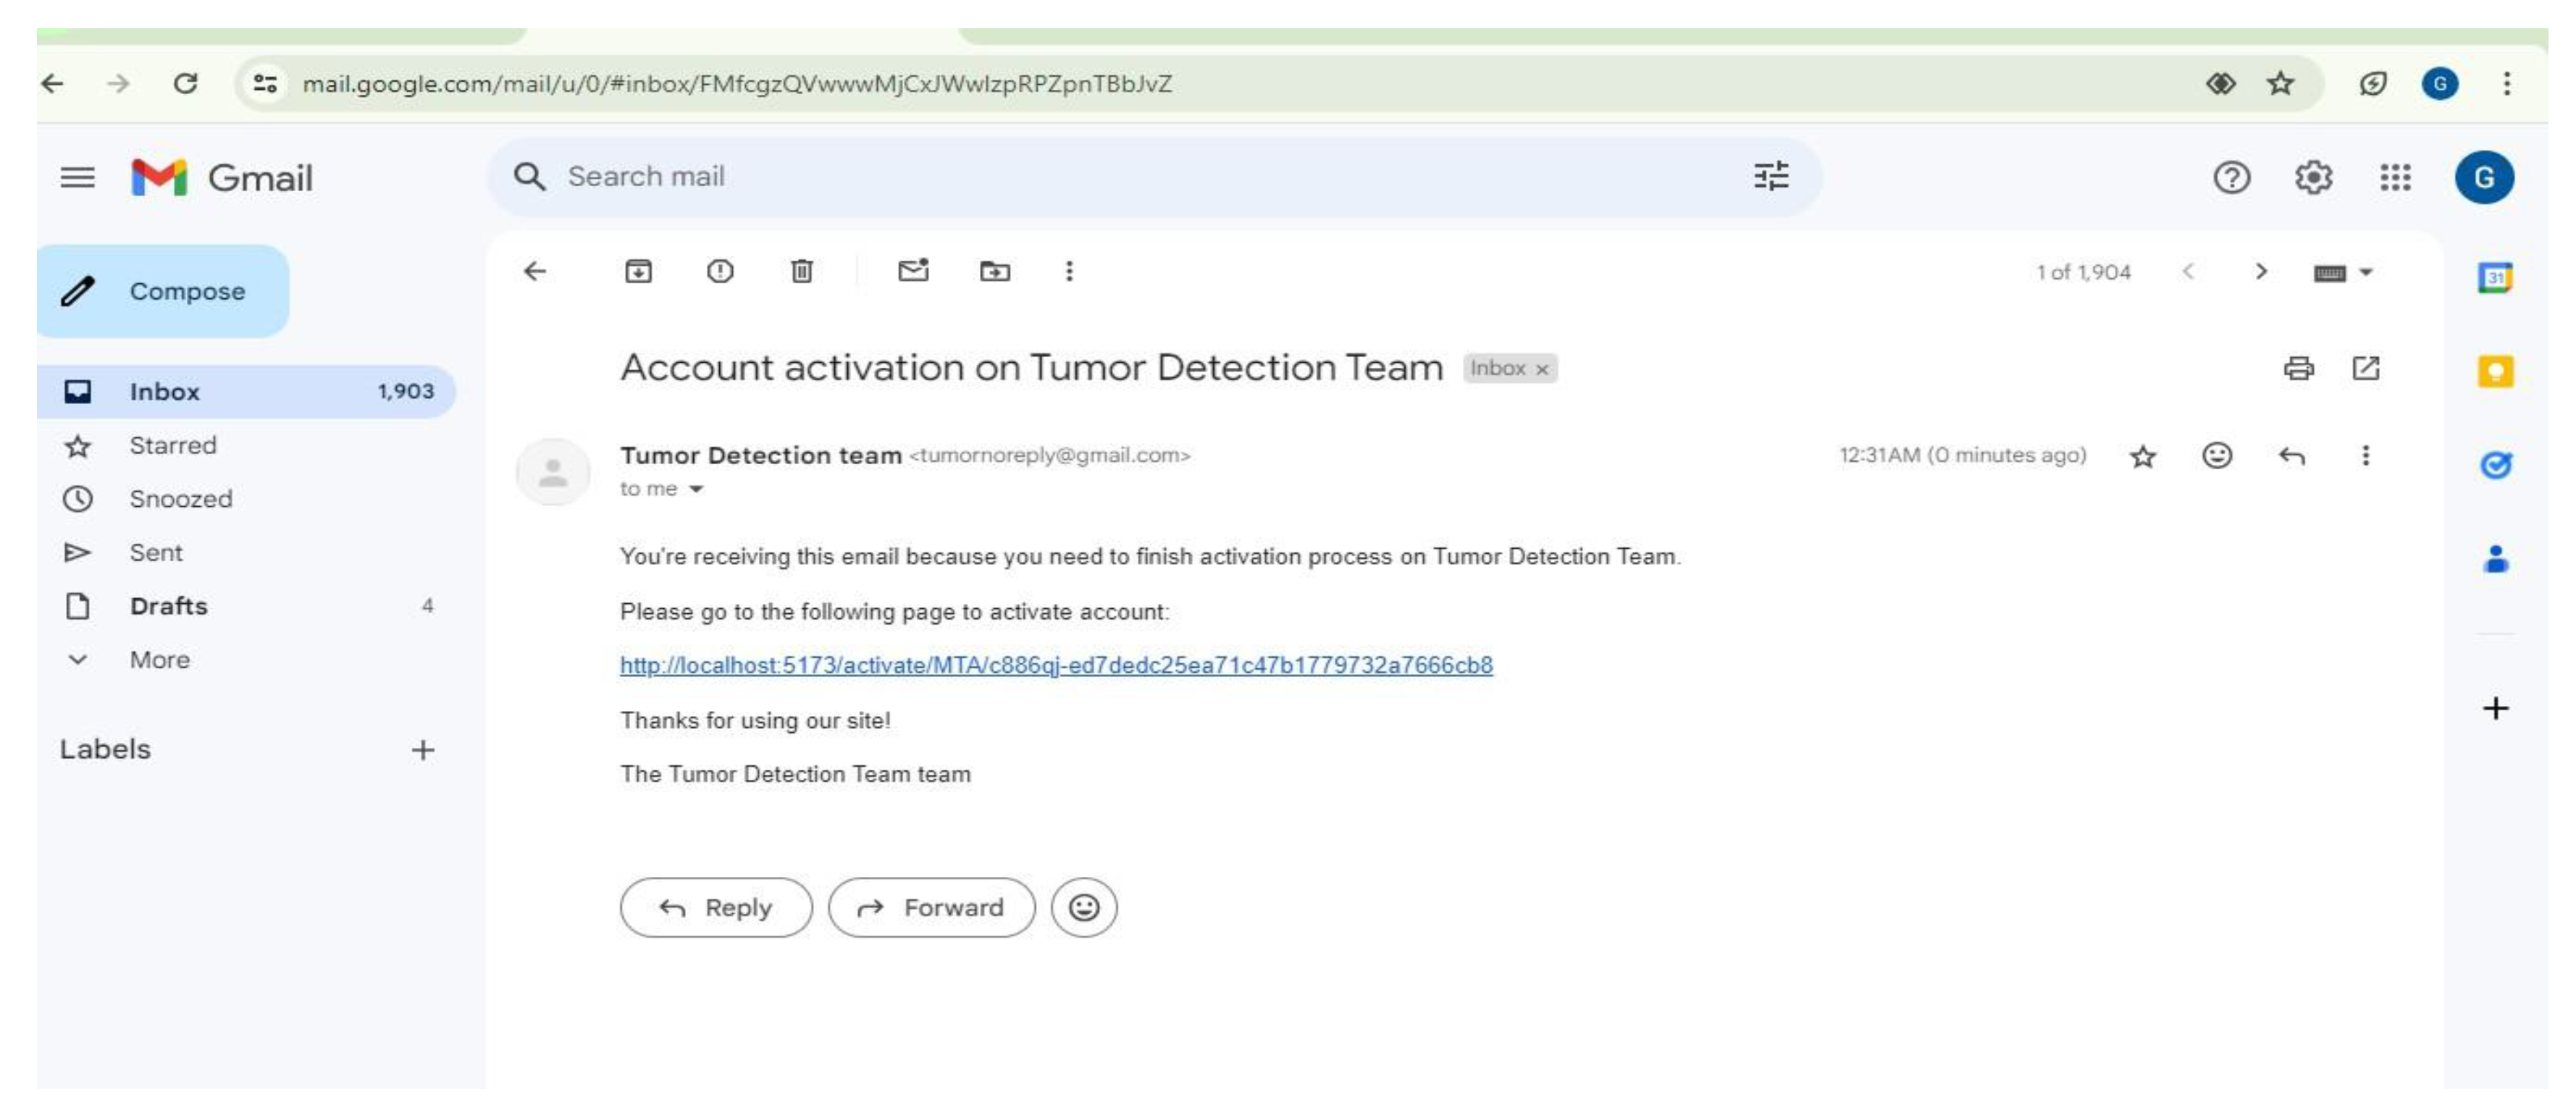
Figure 27.
Doctor searching patient by user name.
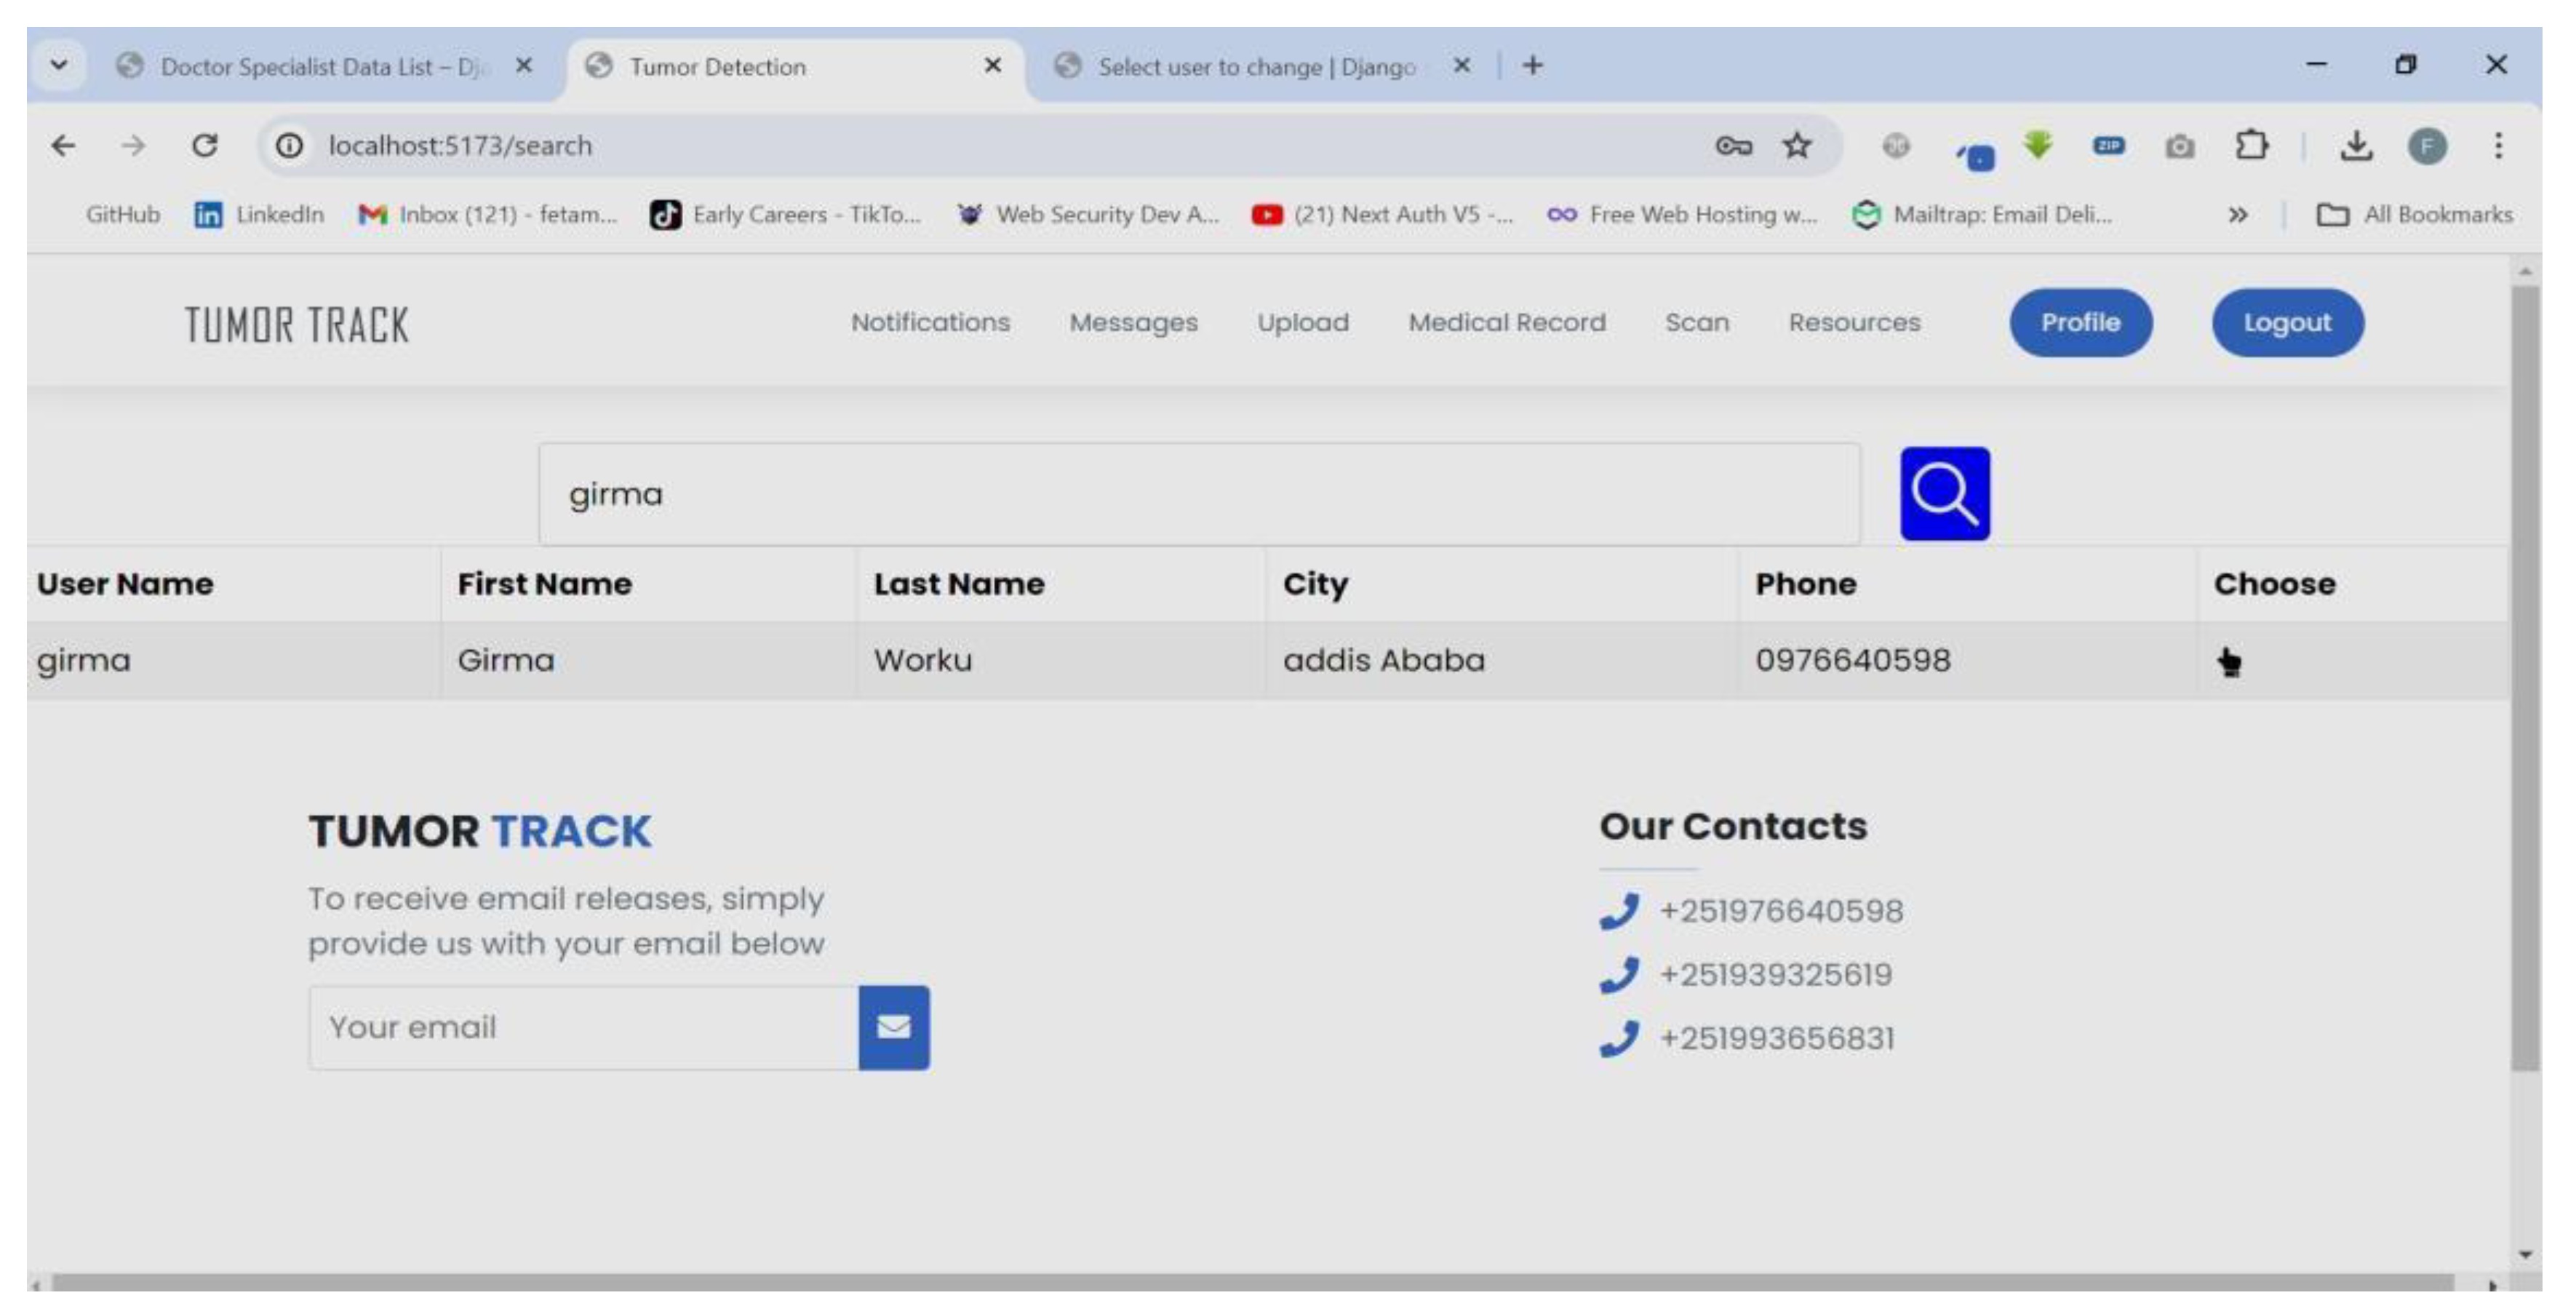
Figure 28.
Doctor recording patient history.
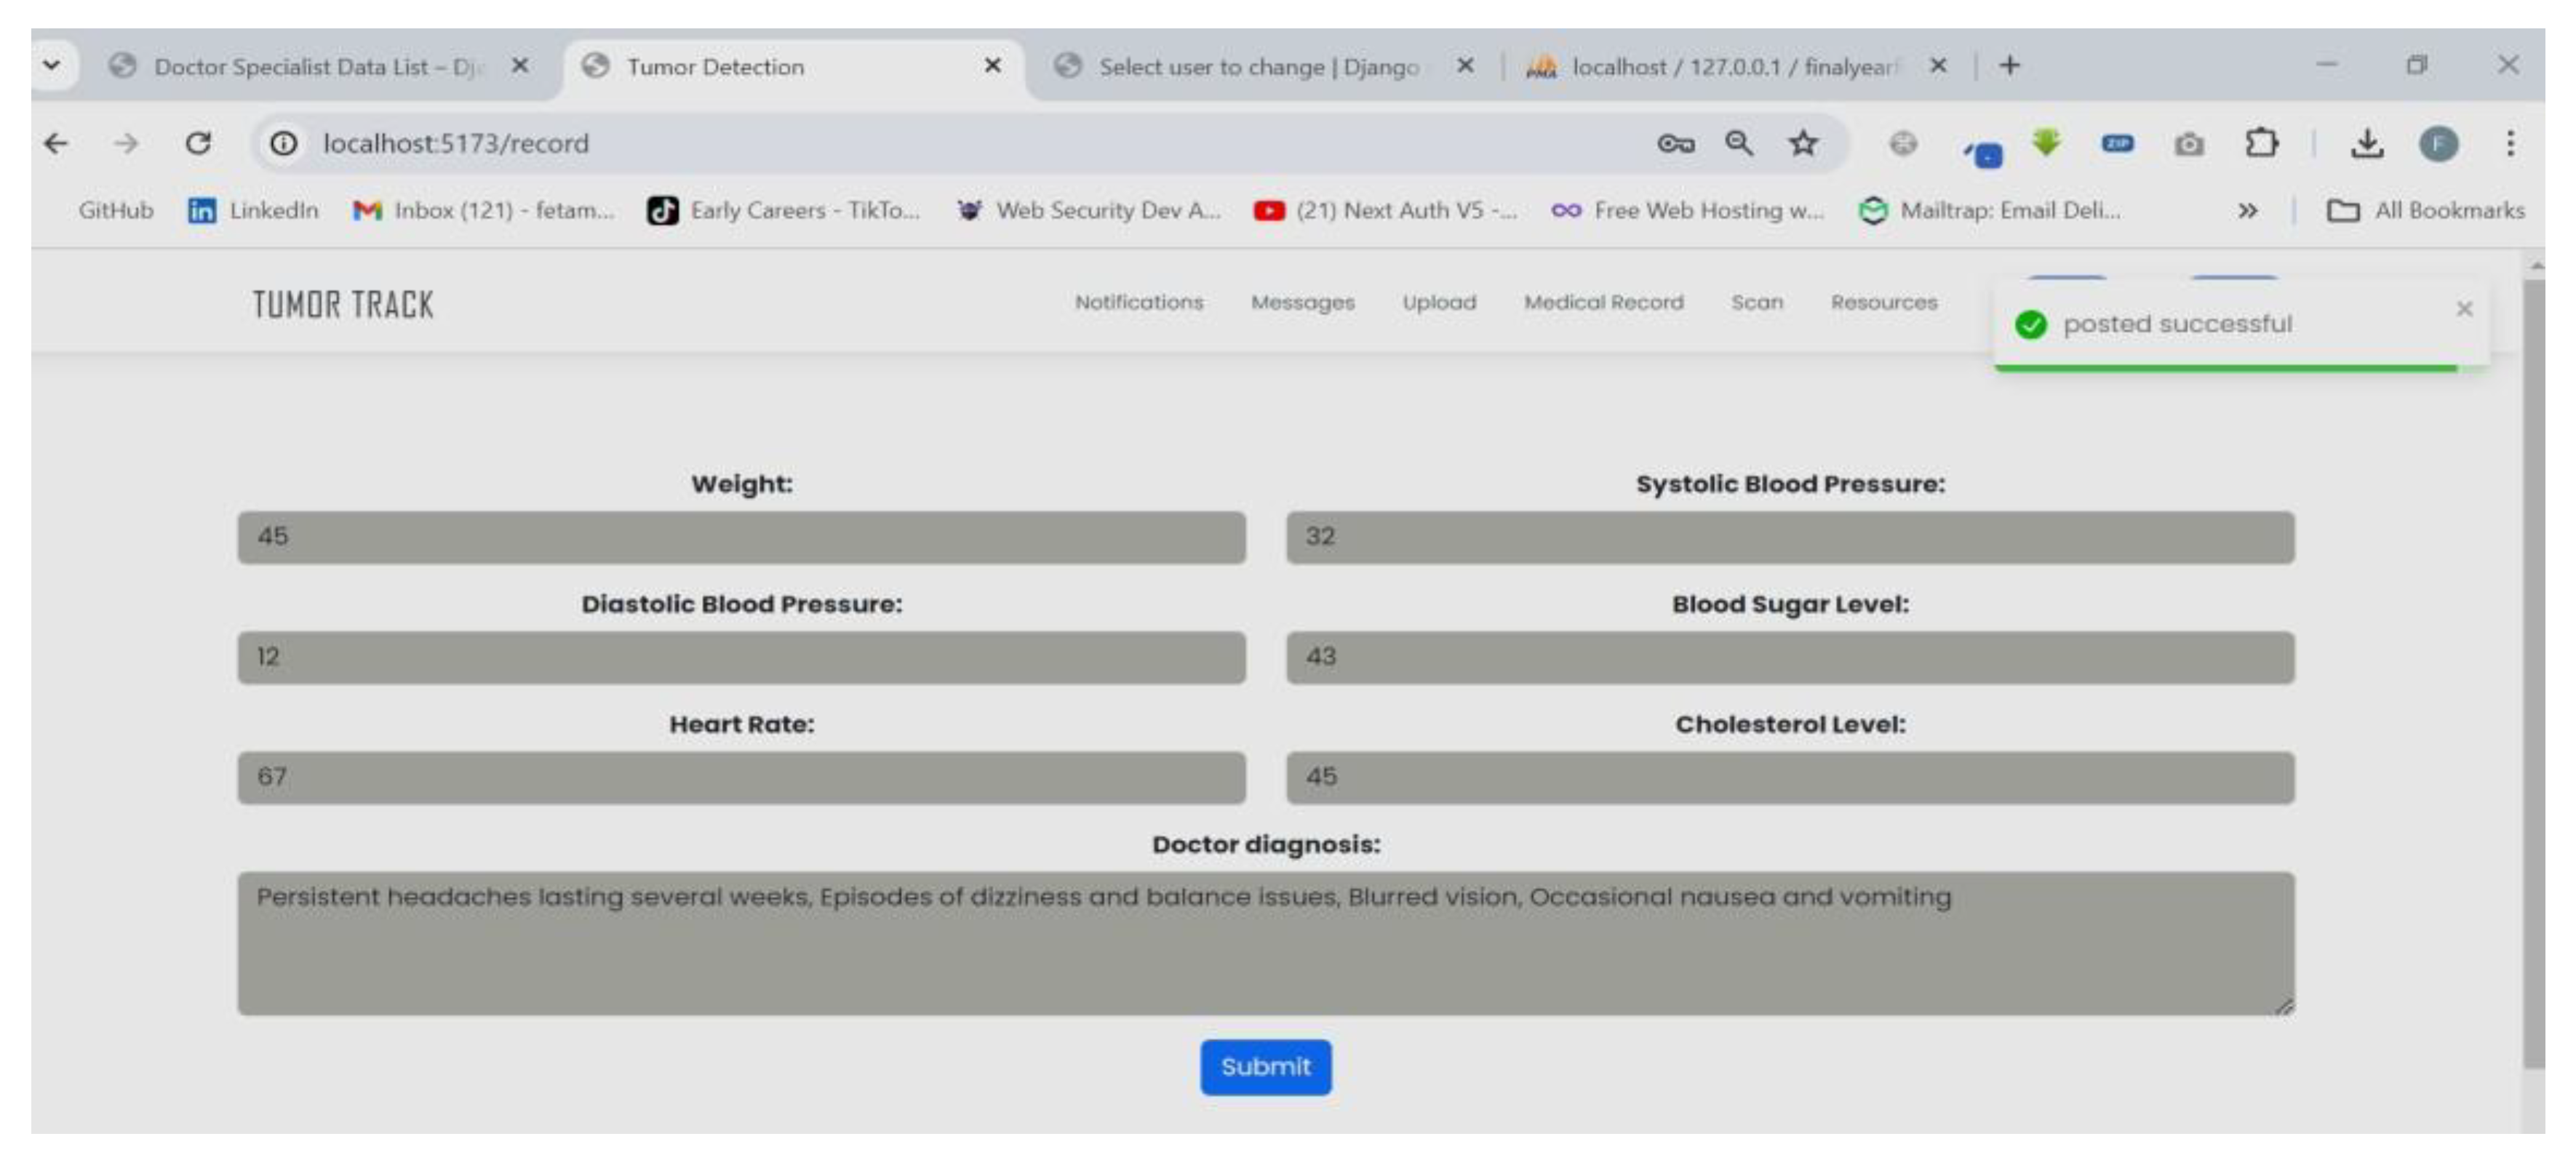
Figure 29.
Doctor referring to the Radiologist.
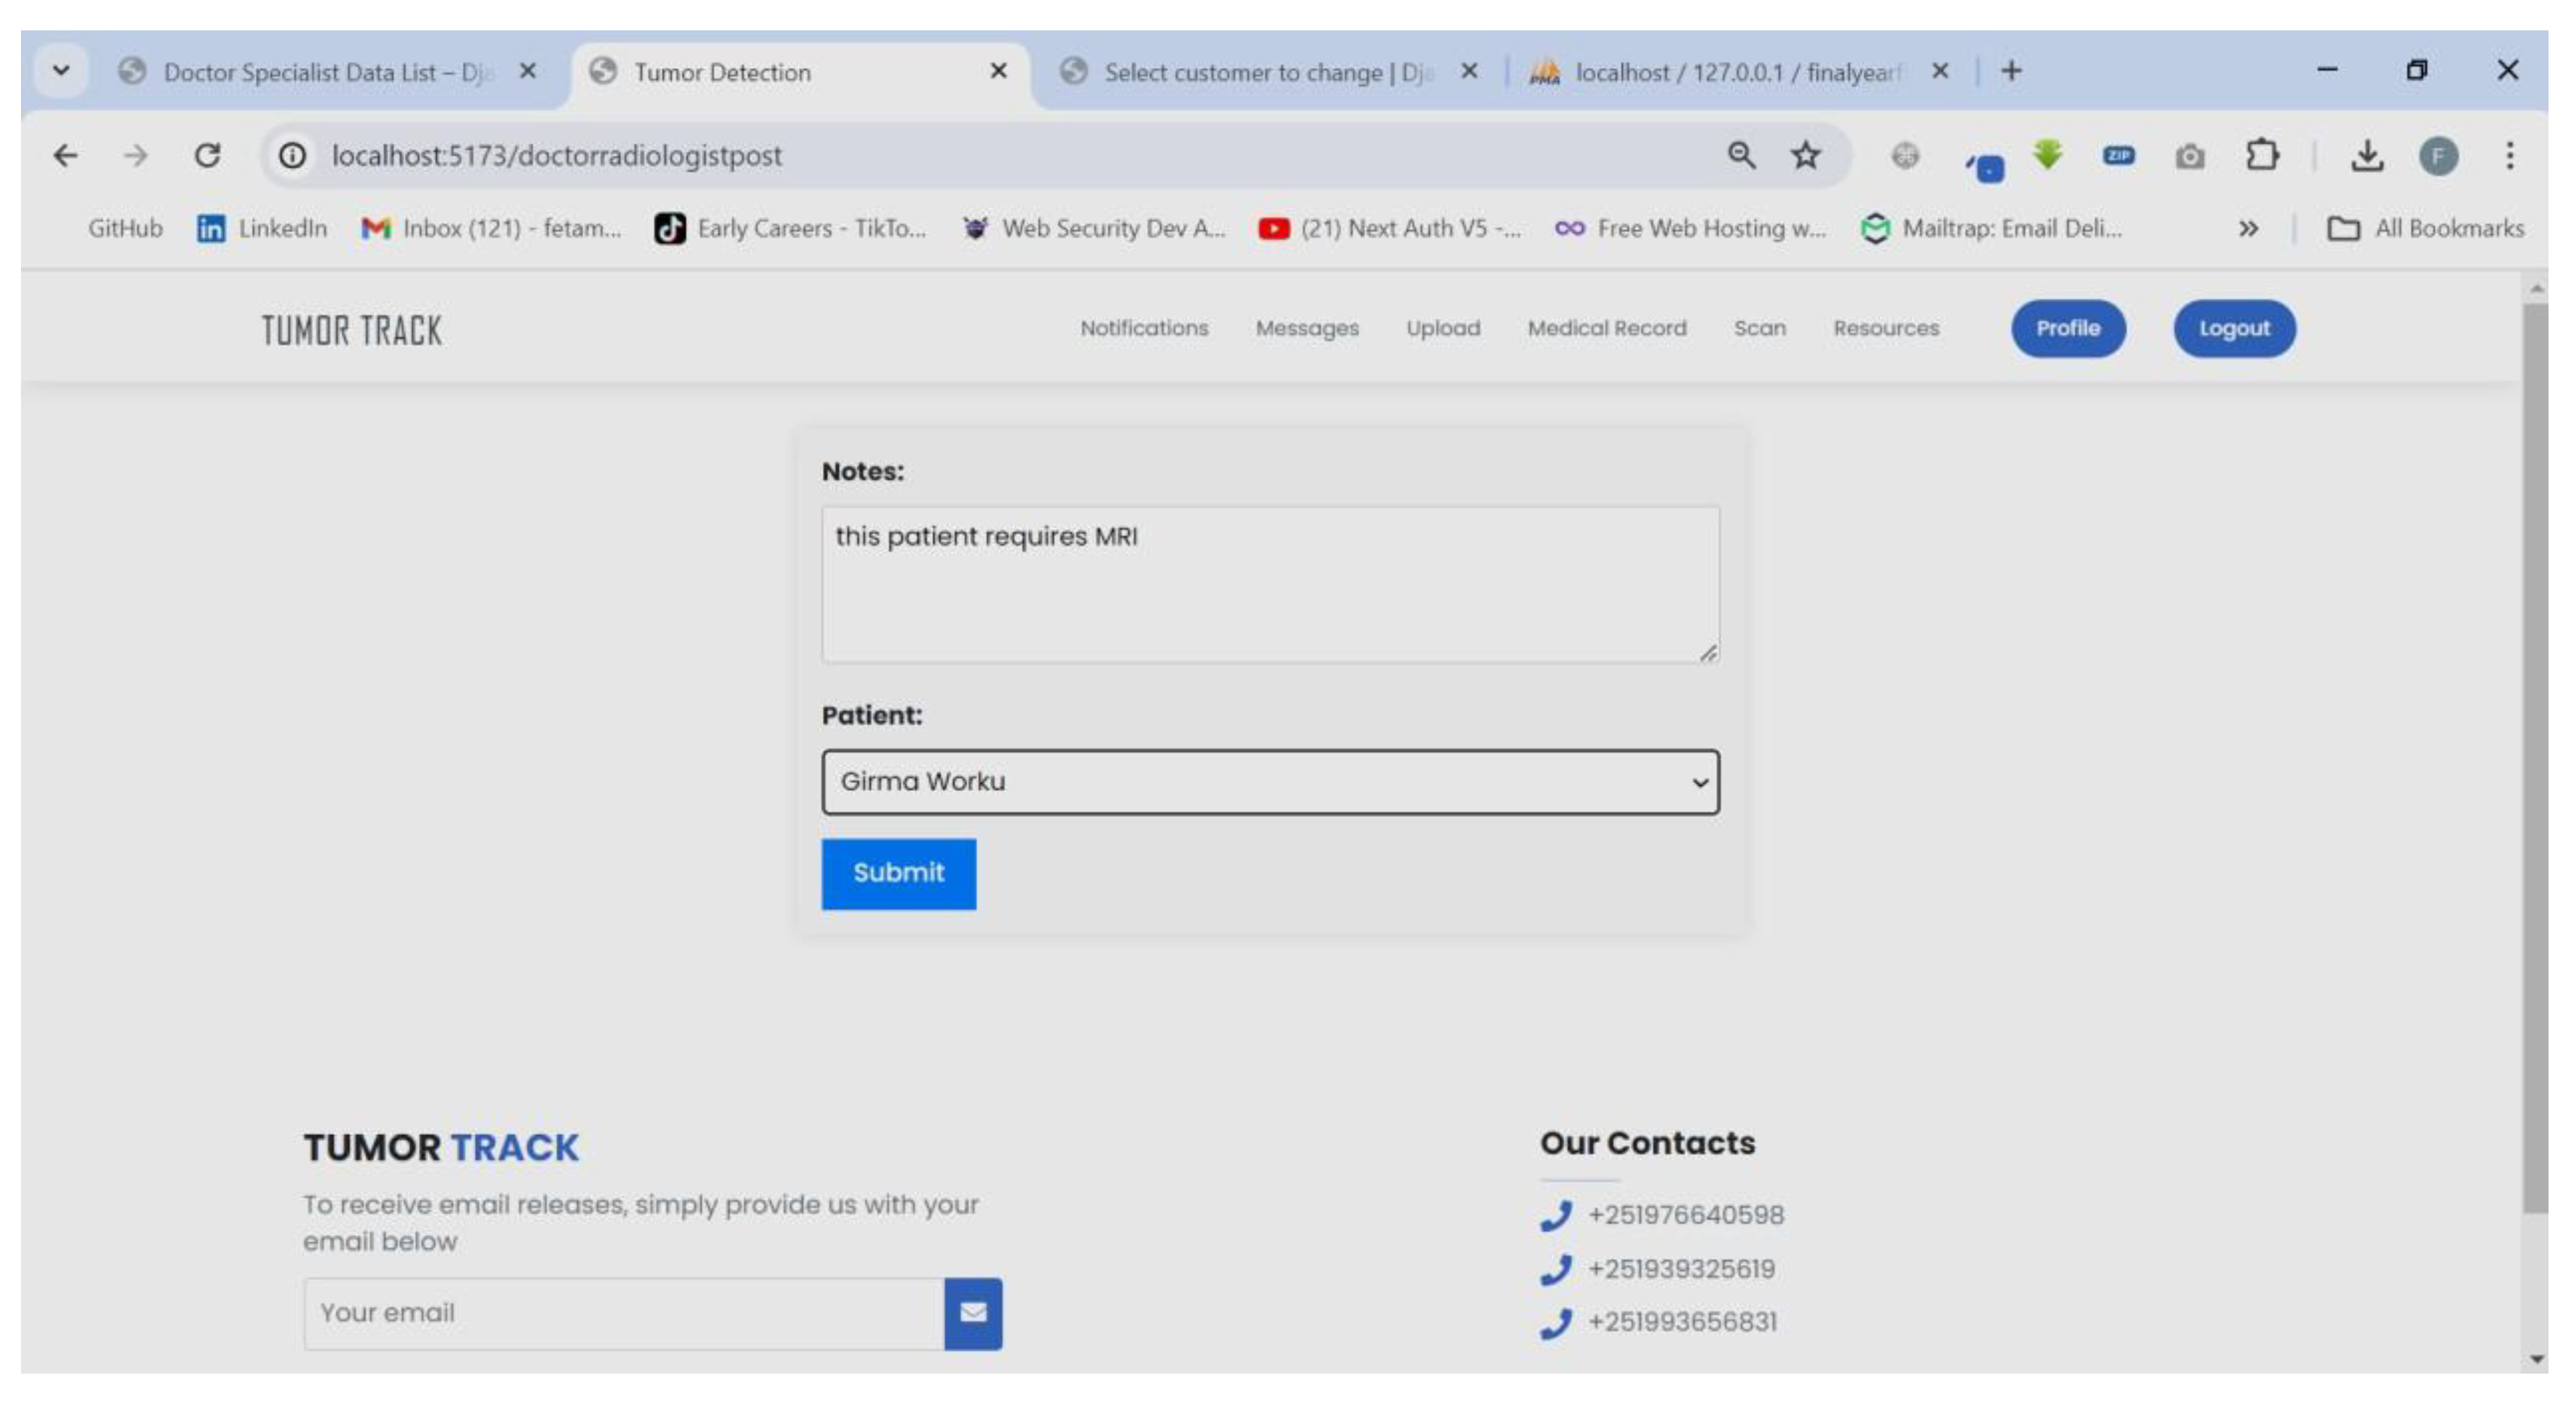
Figure 30.
Radiologist receive notification.
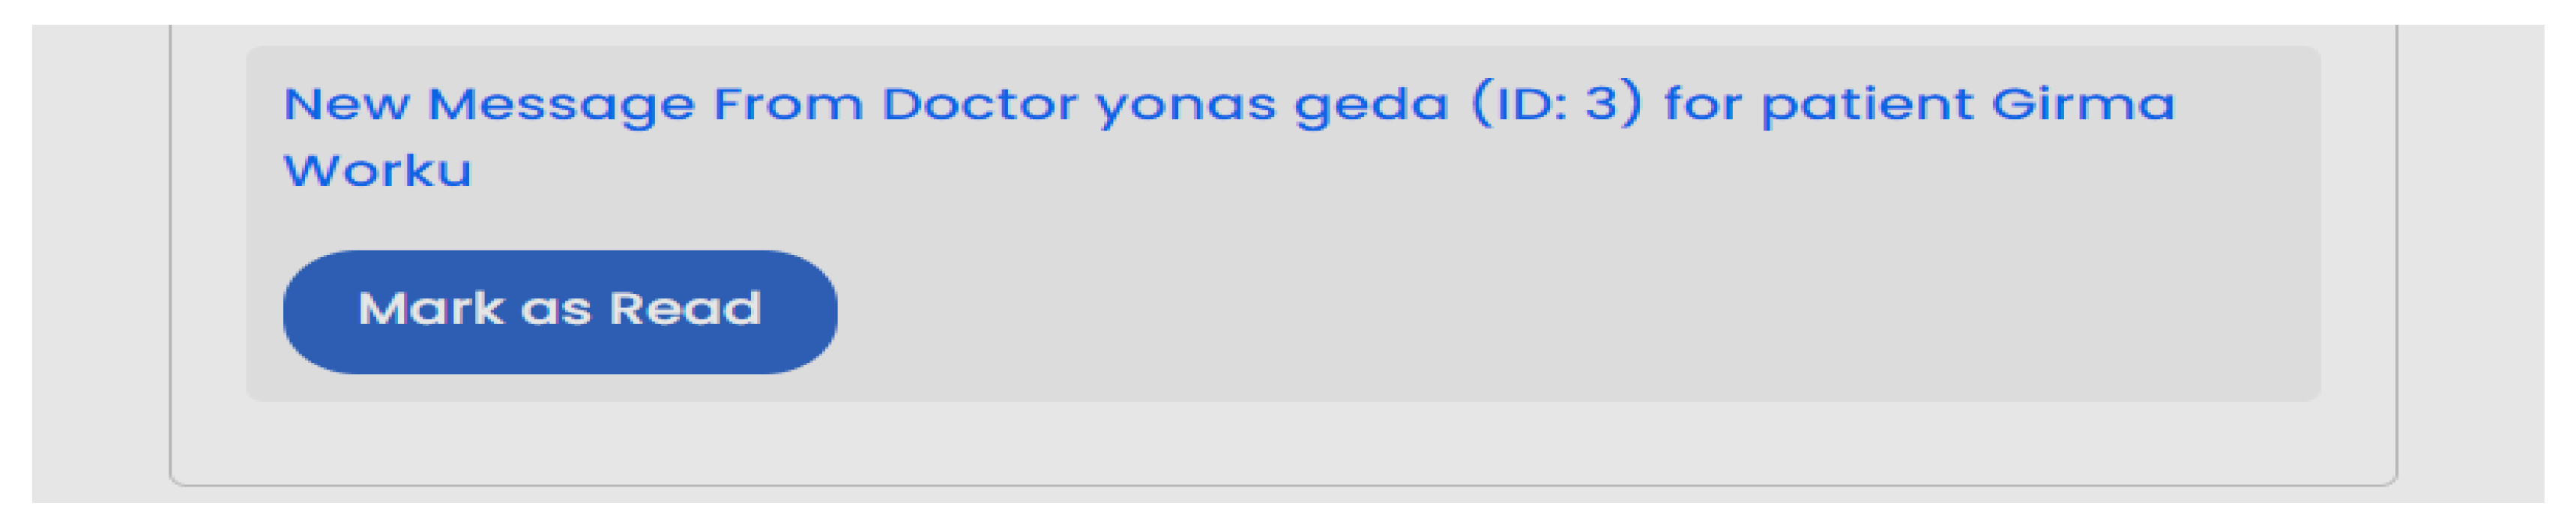
Figure 31.
Radiologist uploading MRI result.
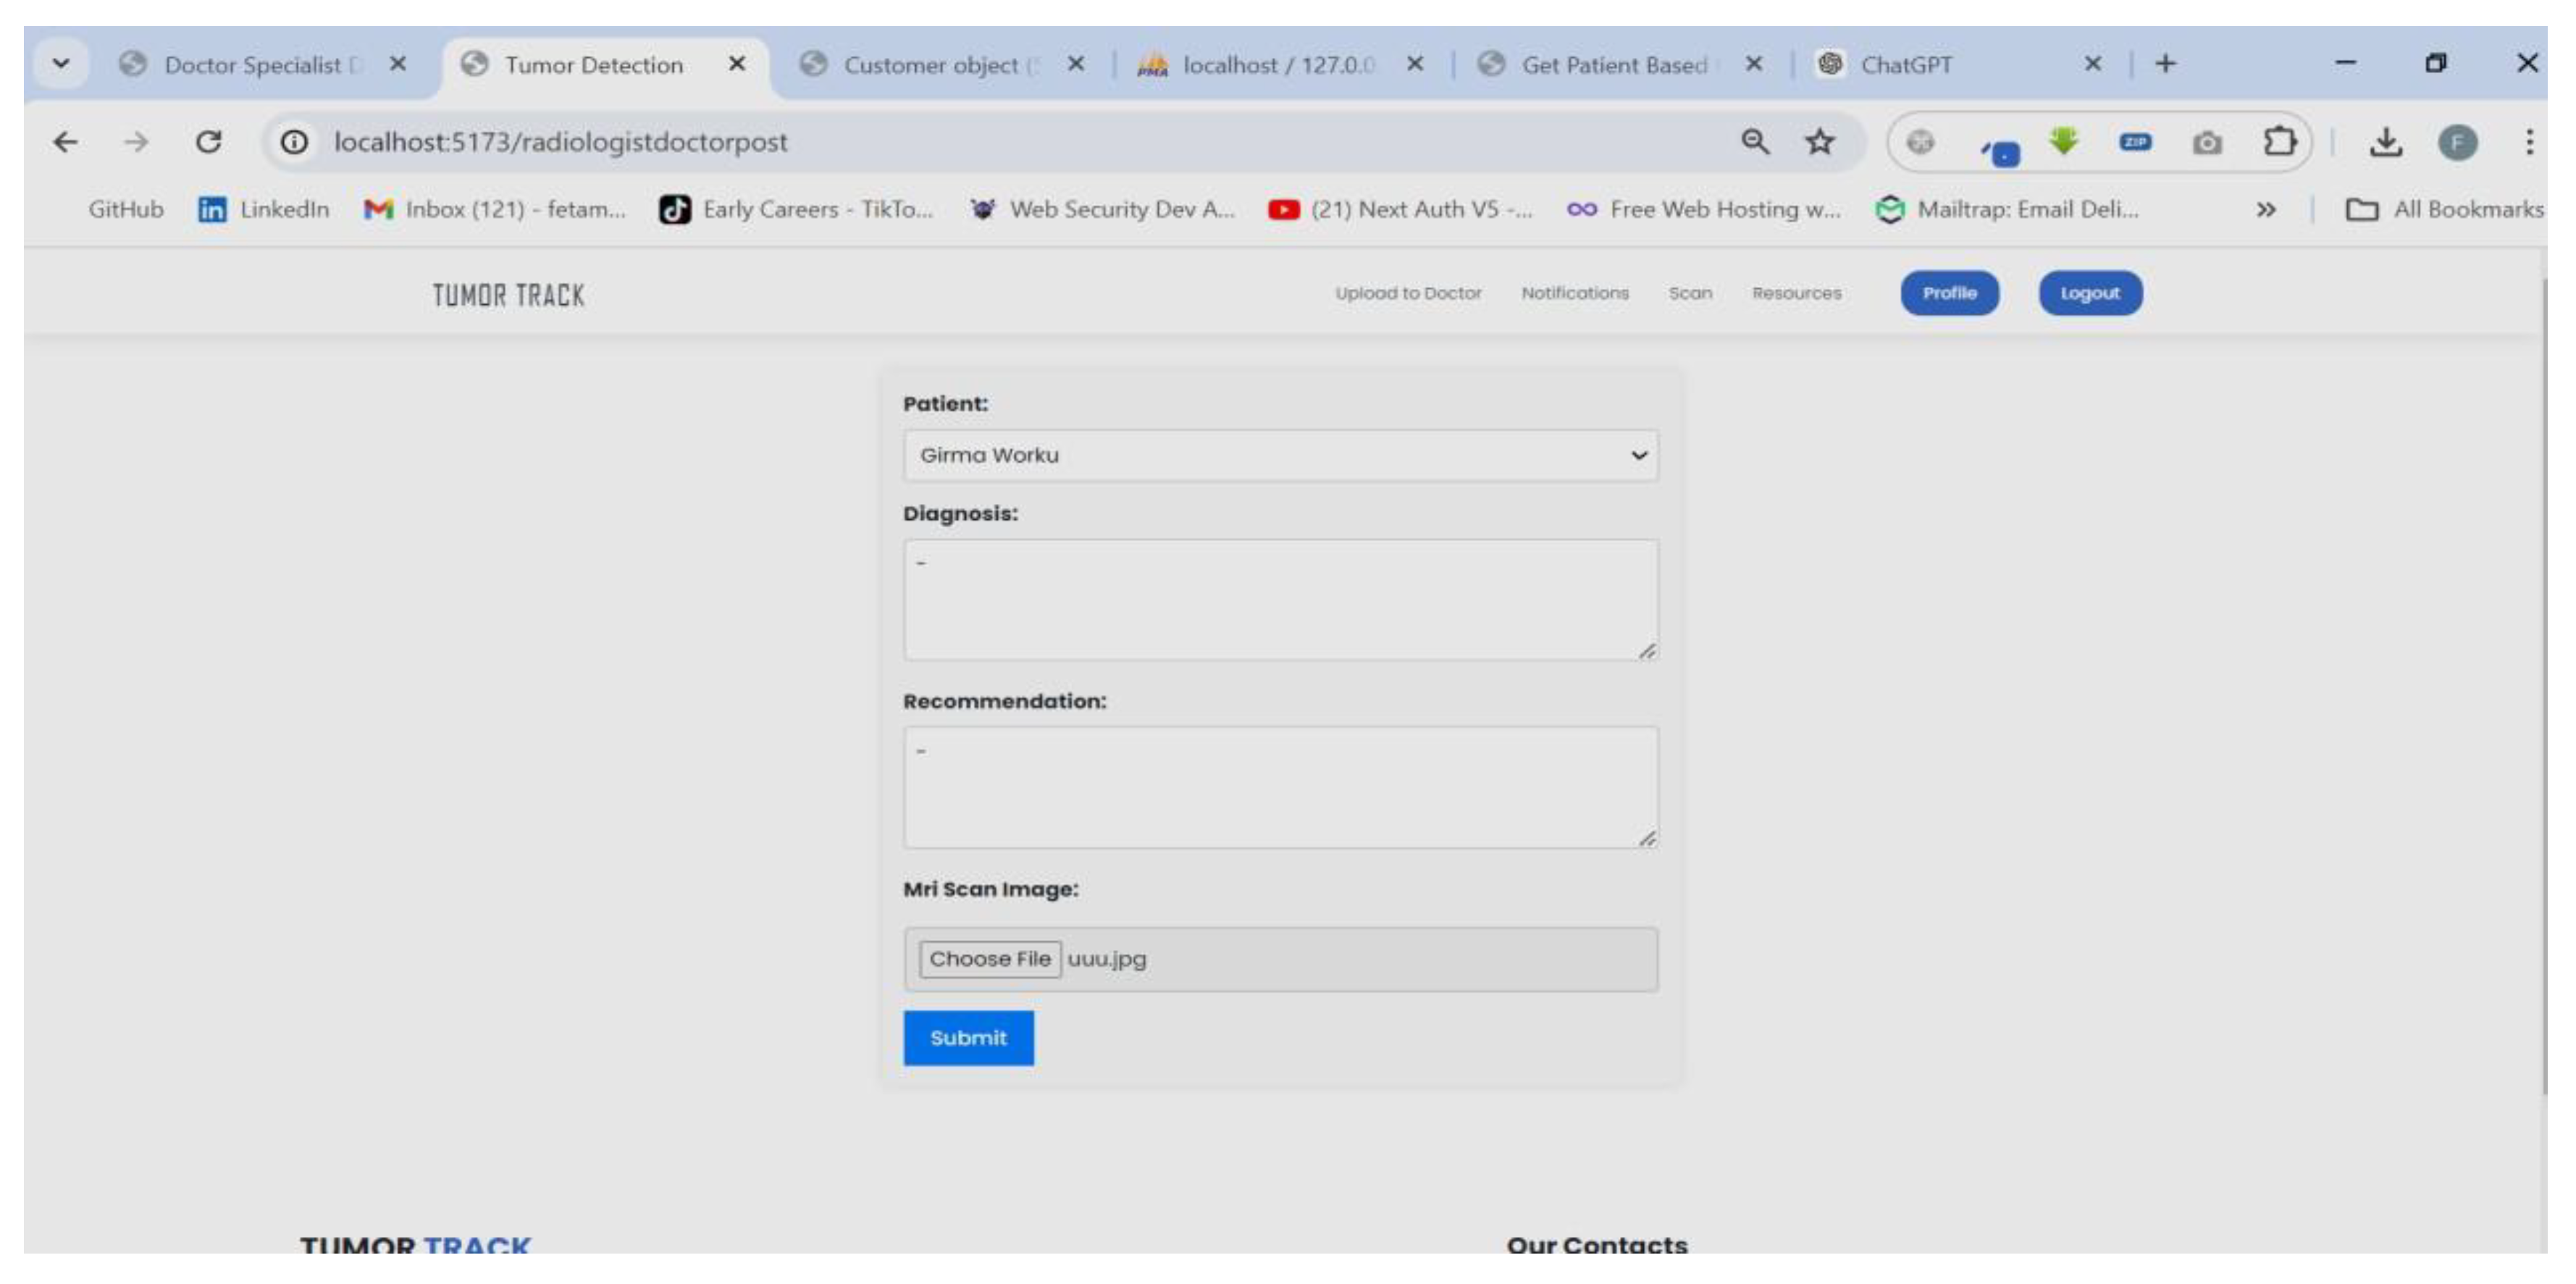
Figure 32.
Doctor receive notification.
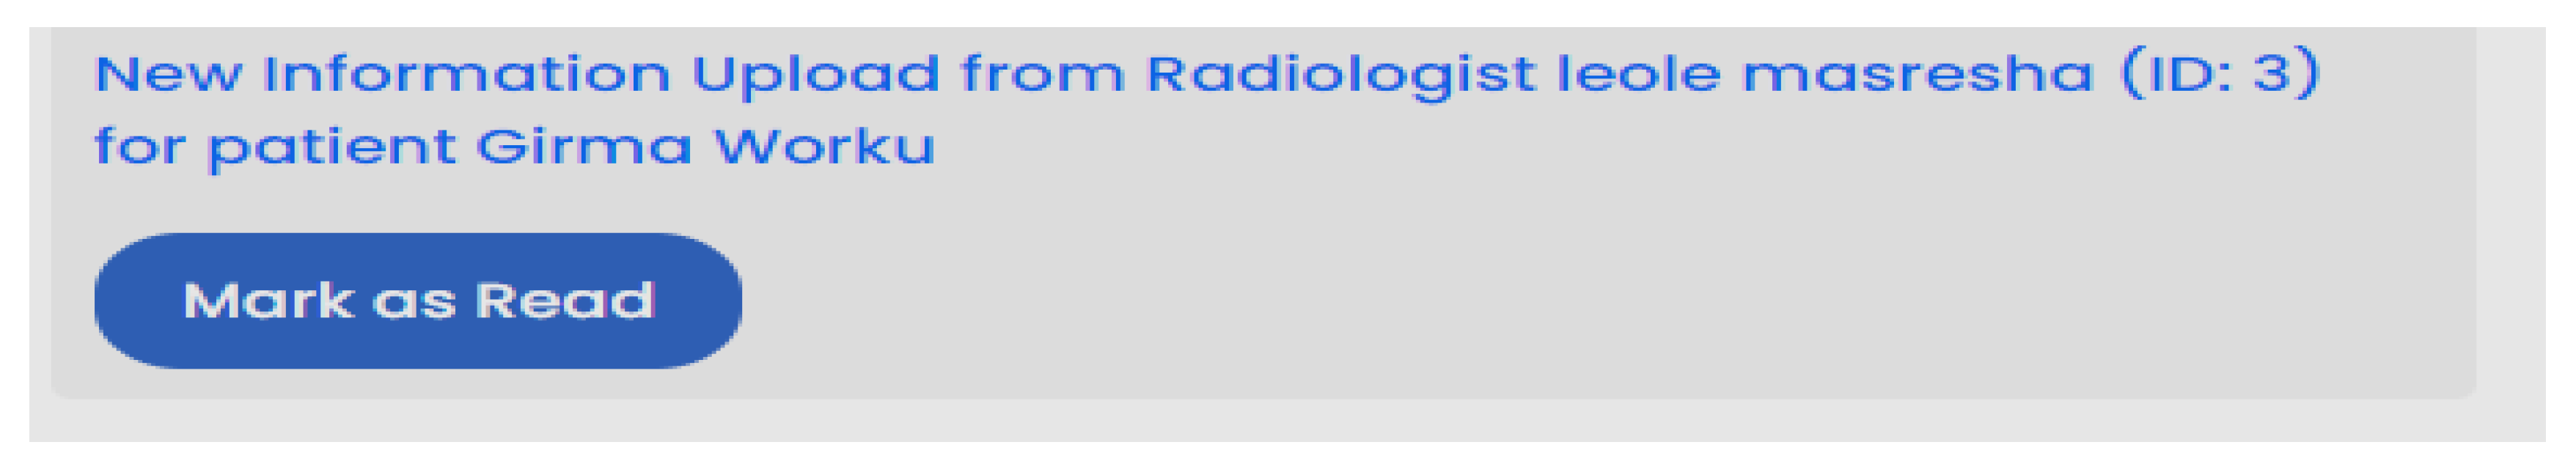
Figure 33.
Doctor viewing patient medical record.
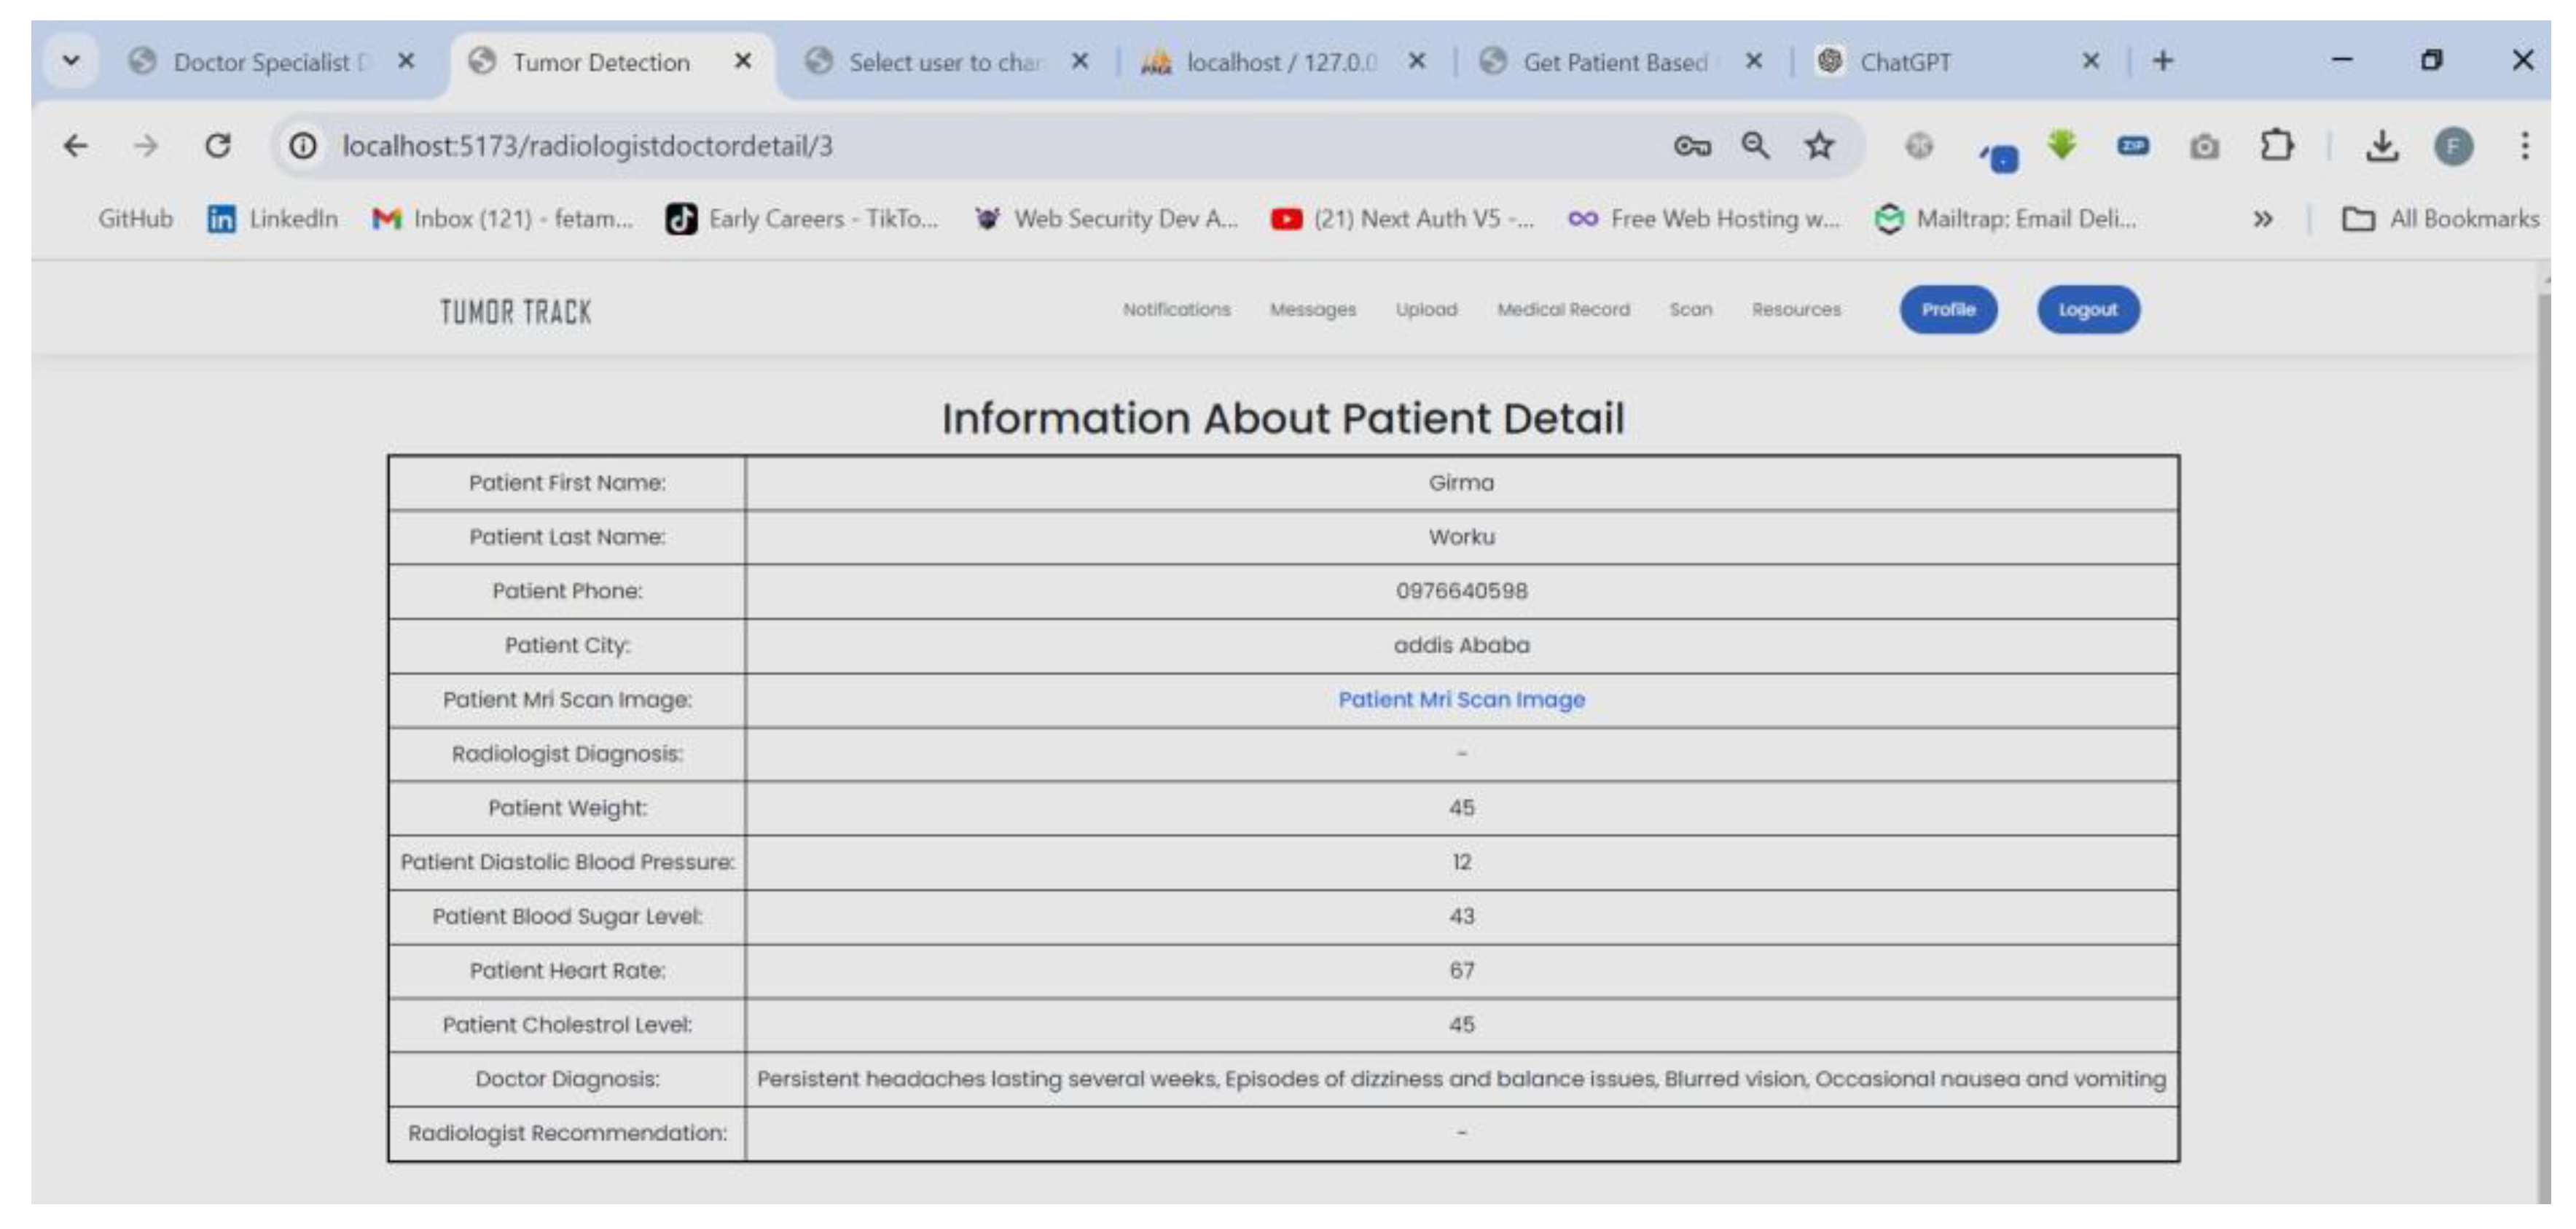
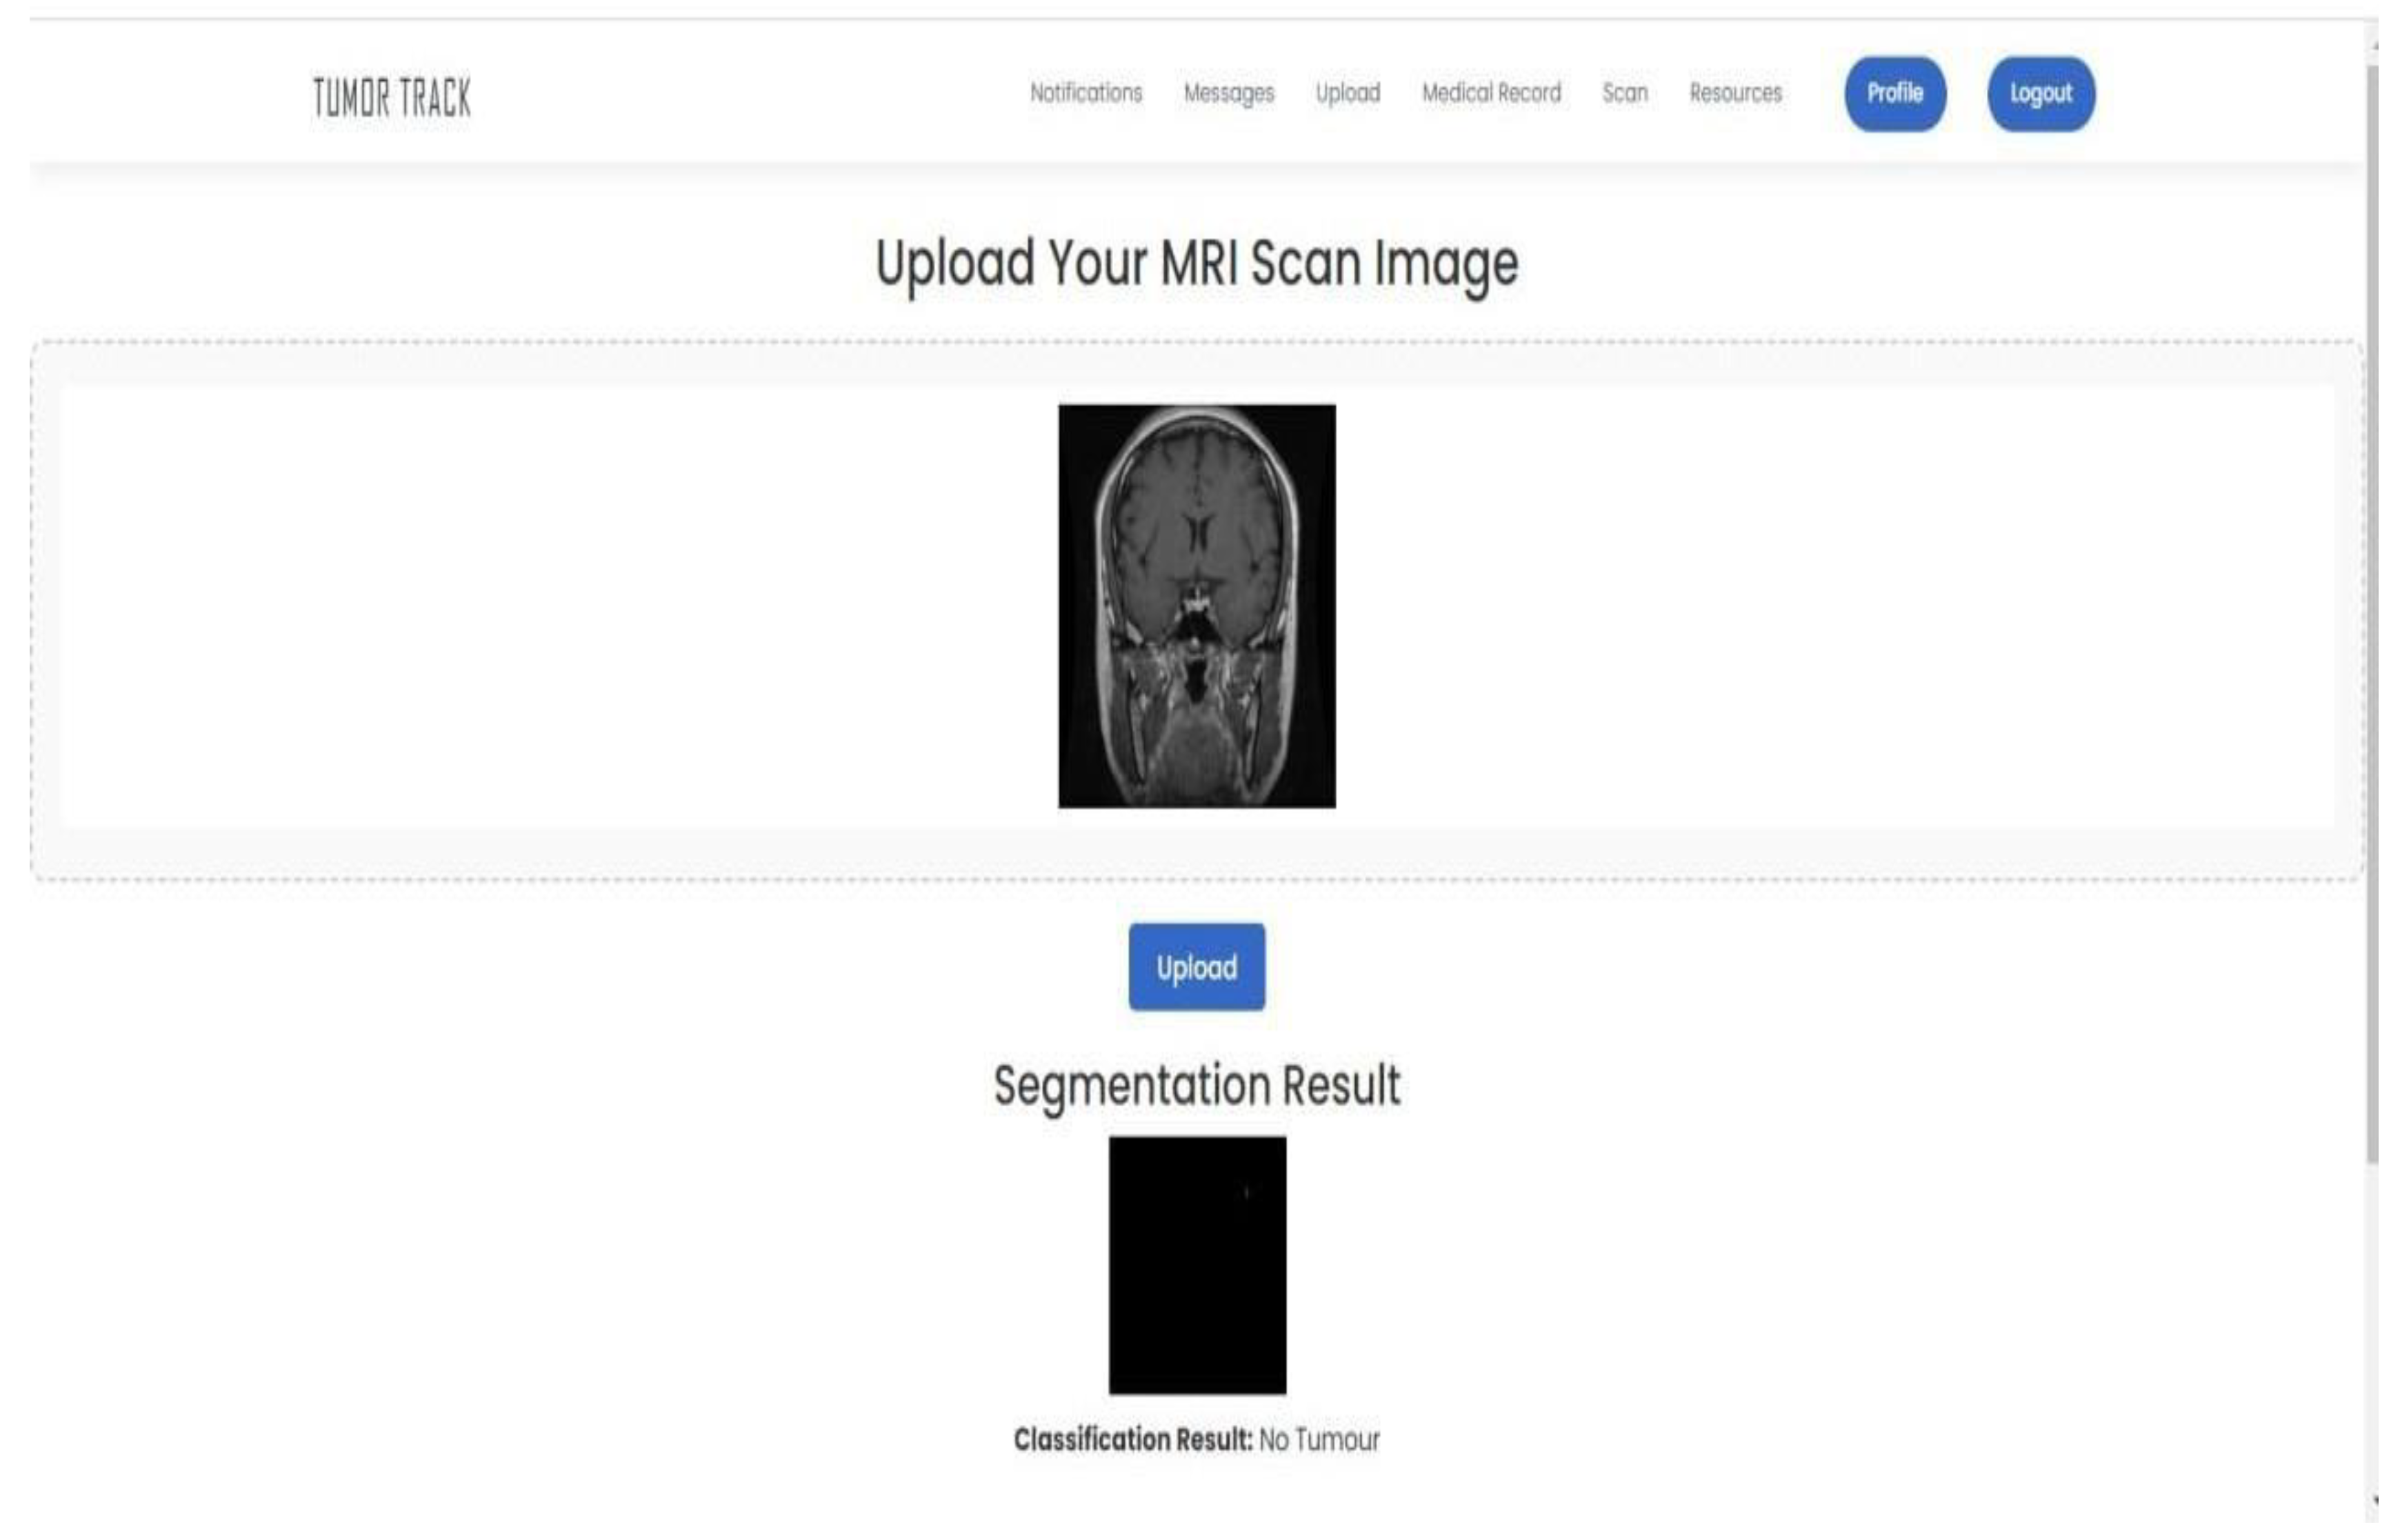
Figure 34.
Doctor uploading MRI image to the AI model.
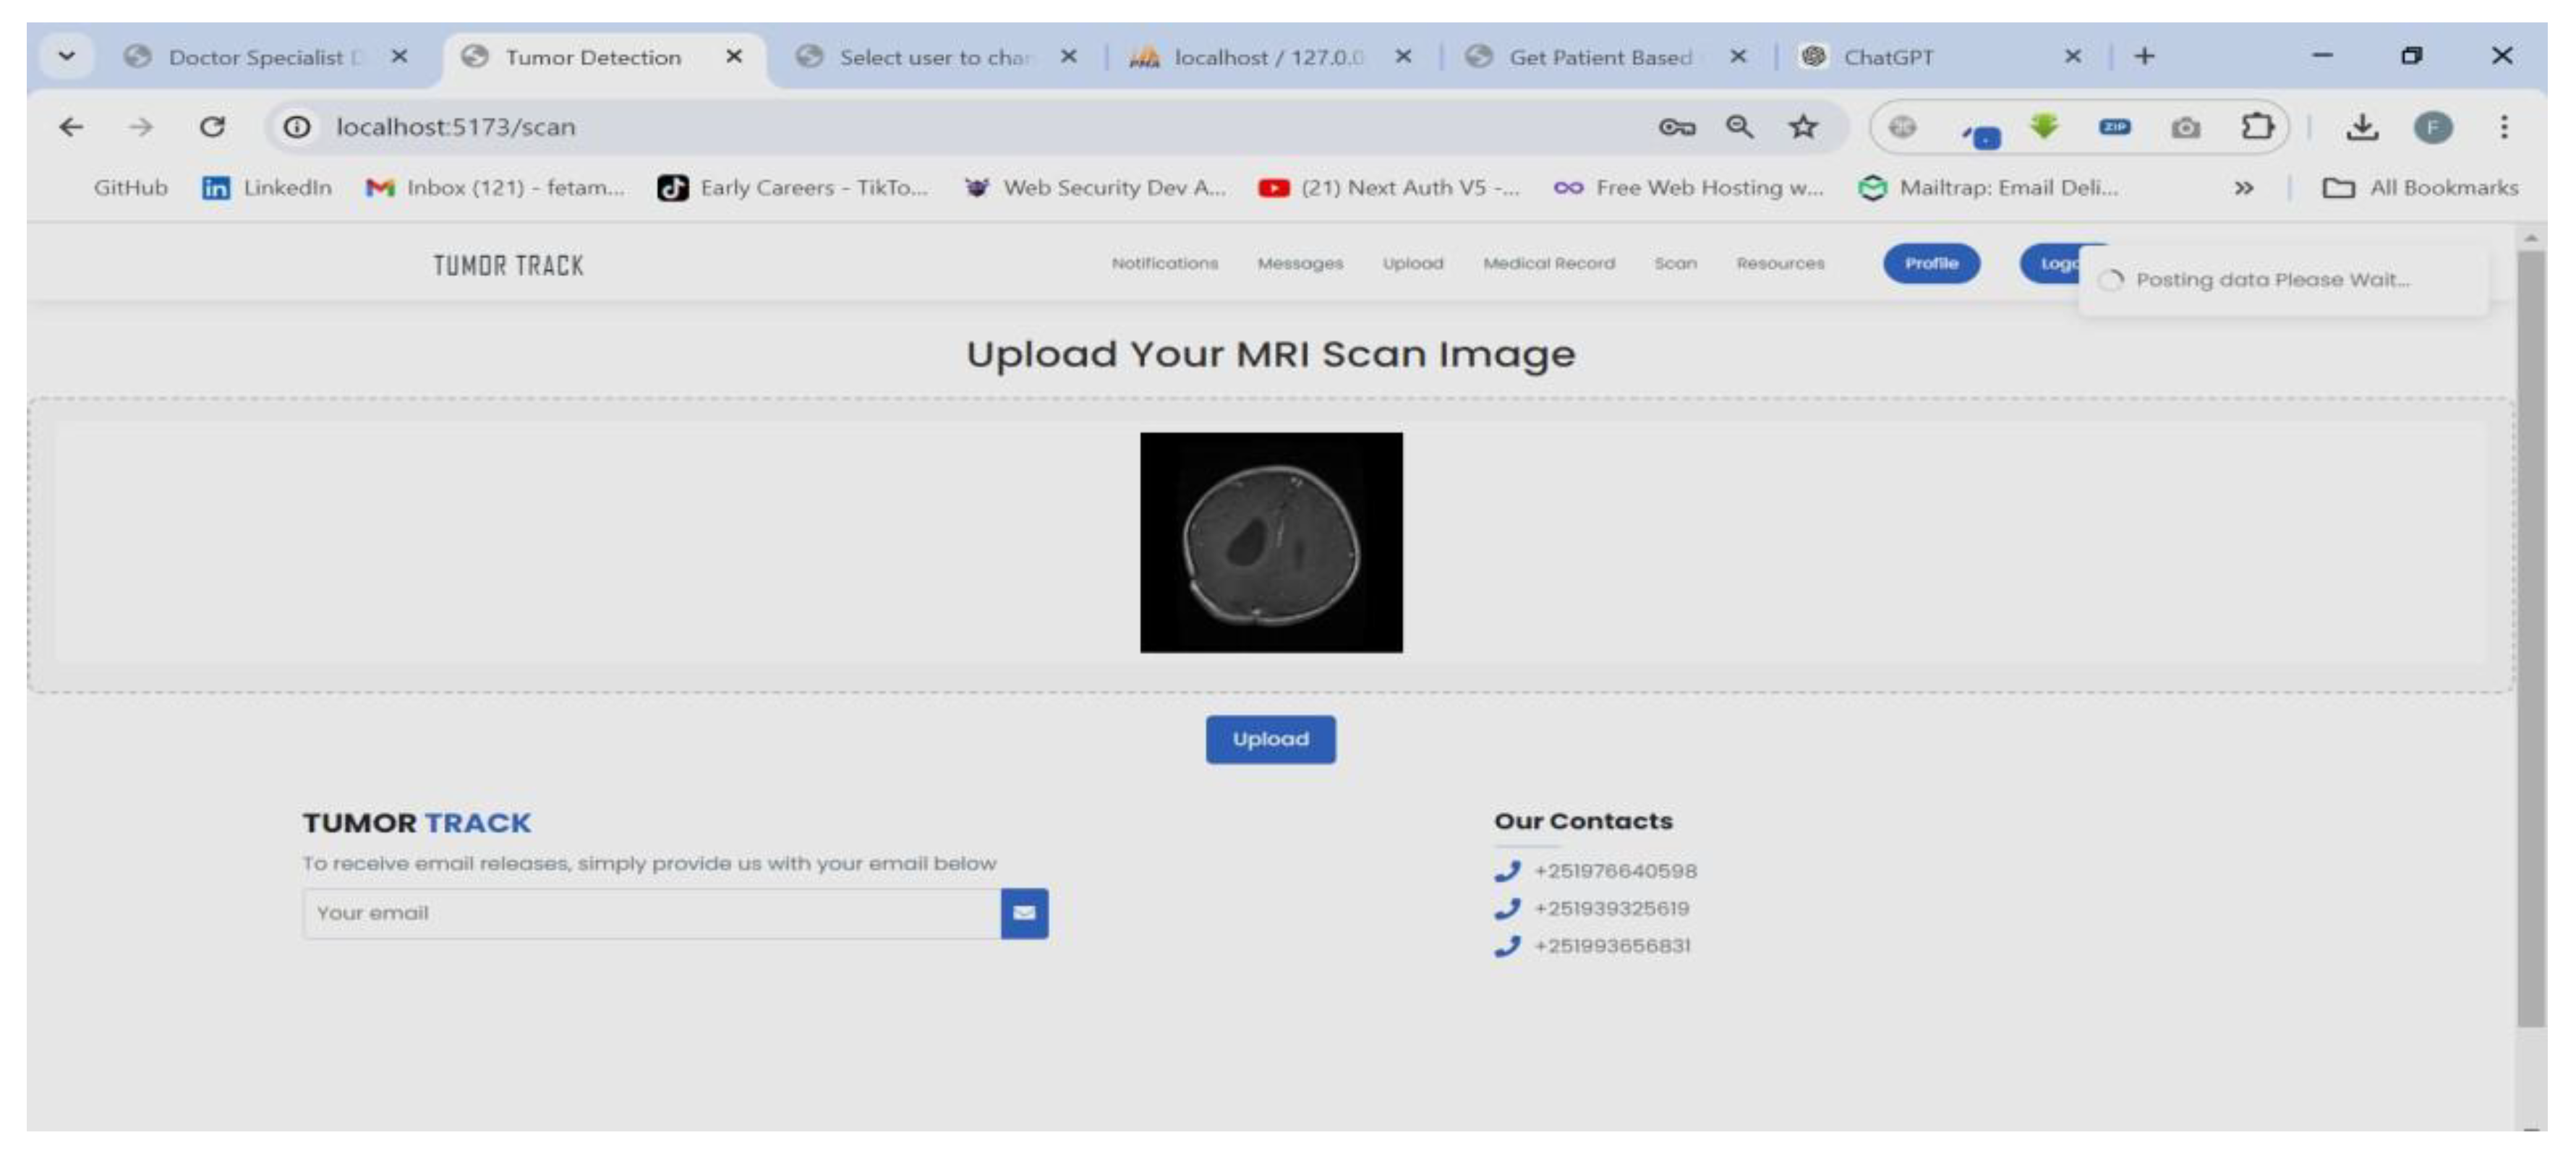
Figure 35.
AI model result.
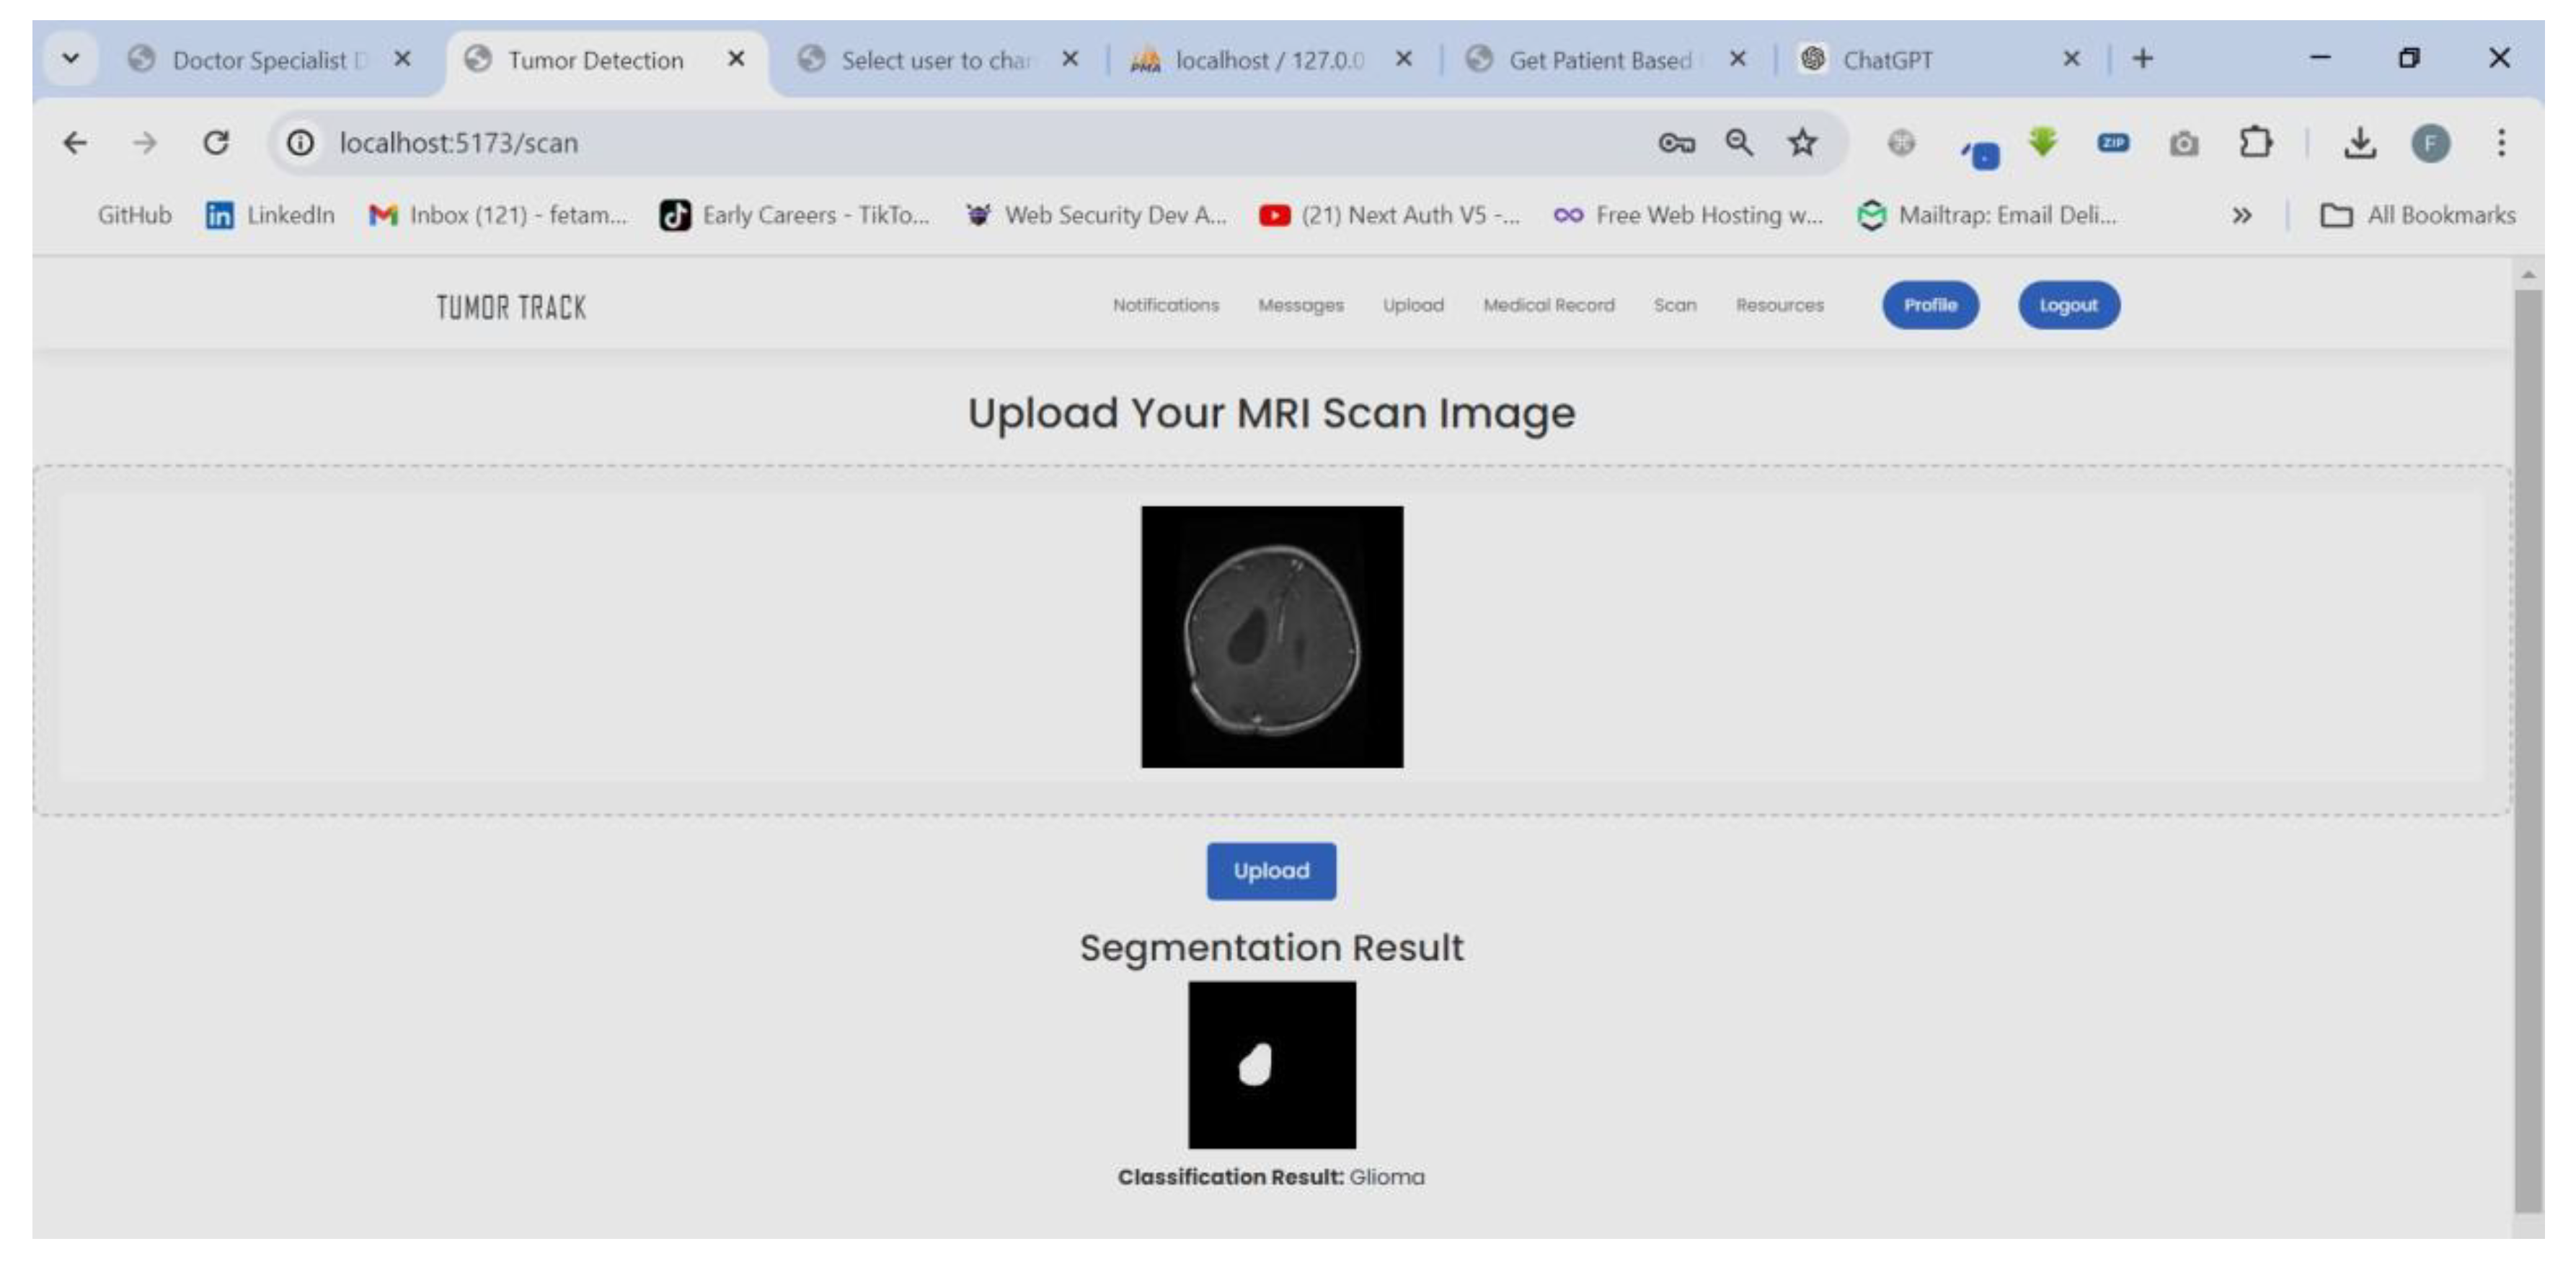
Figure 36.
Doctor show patient Specialists list to choose from.
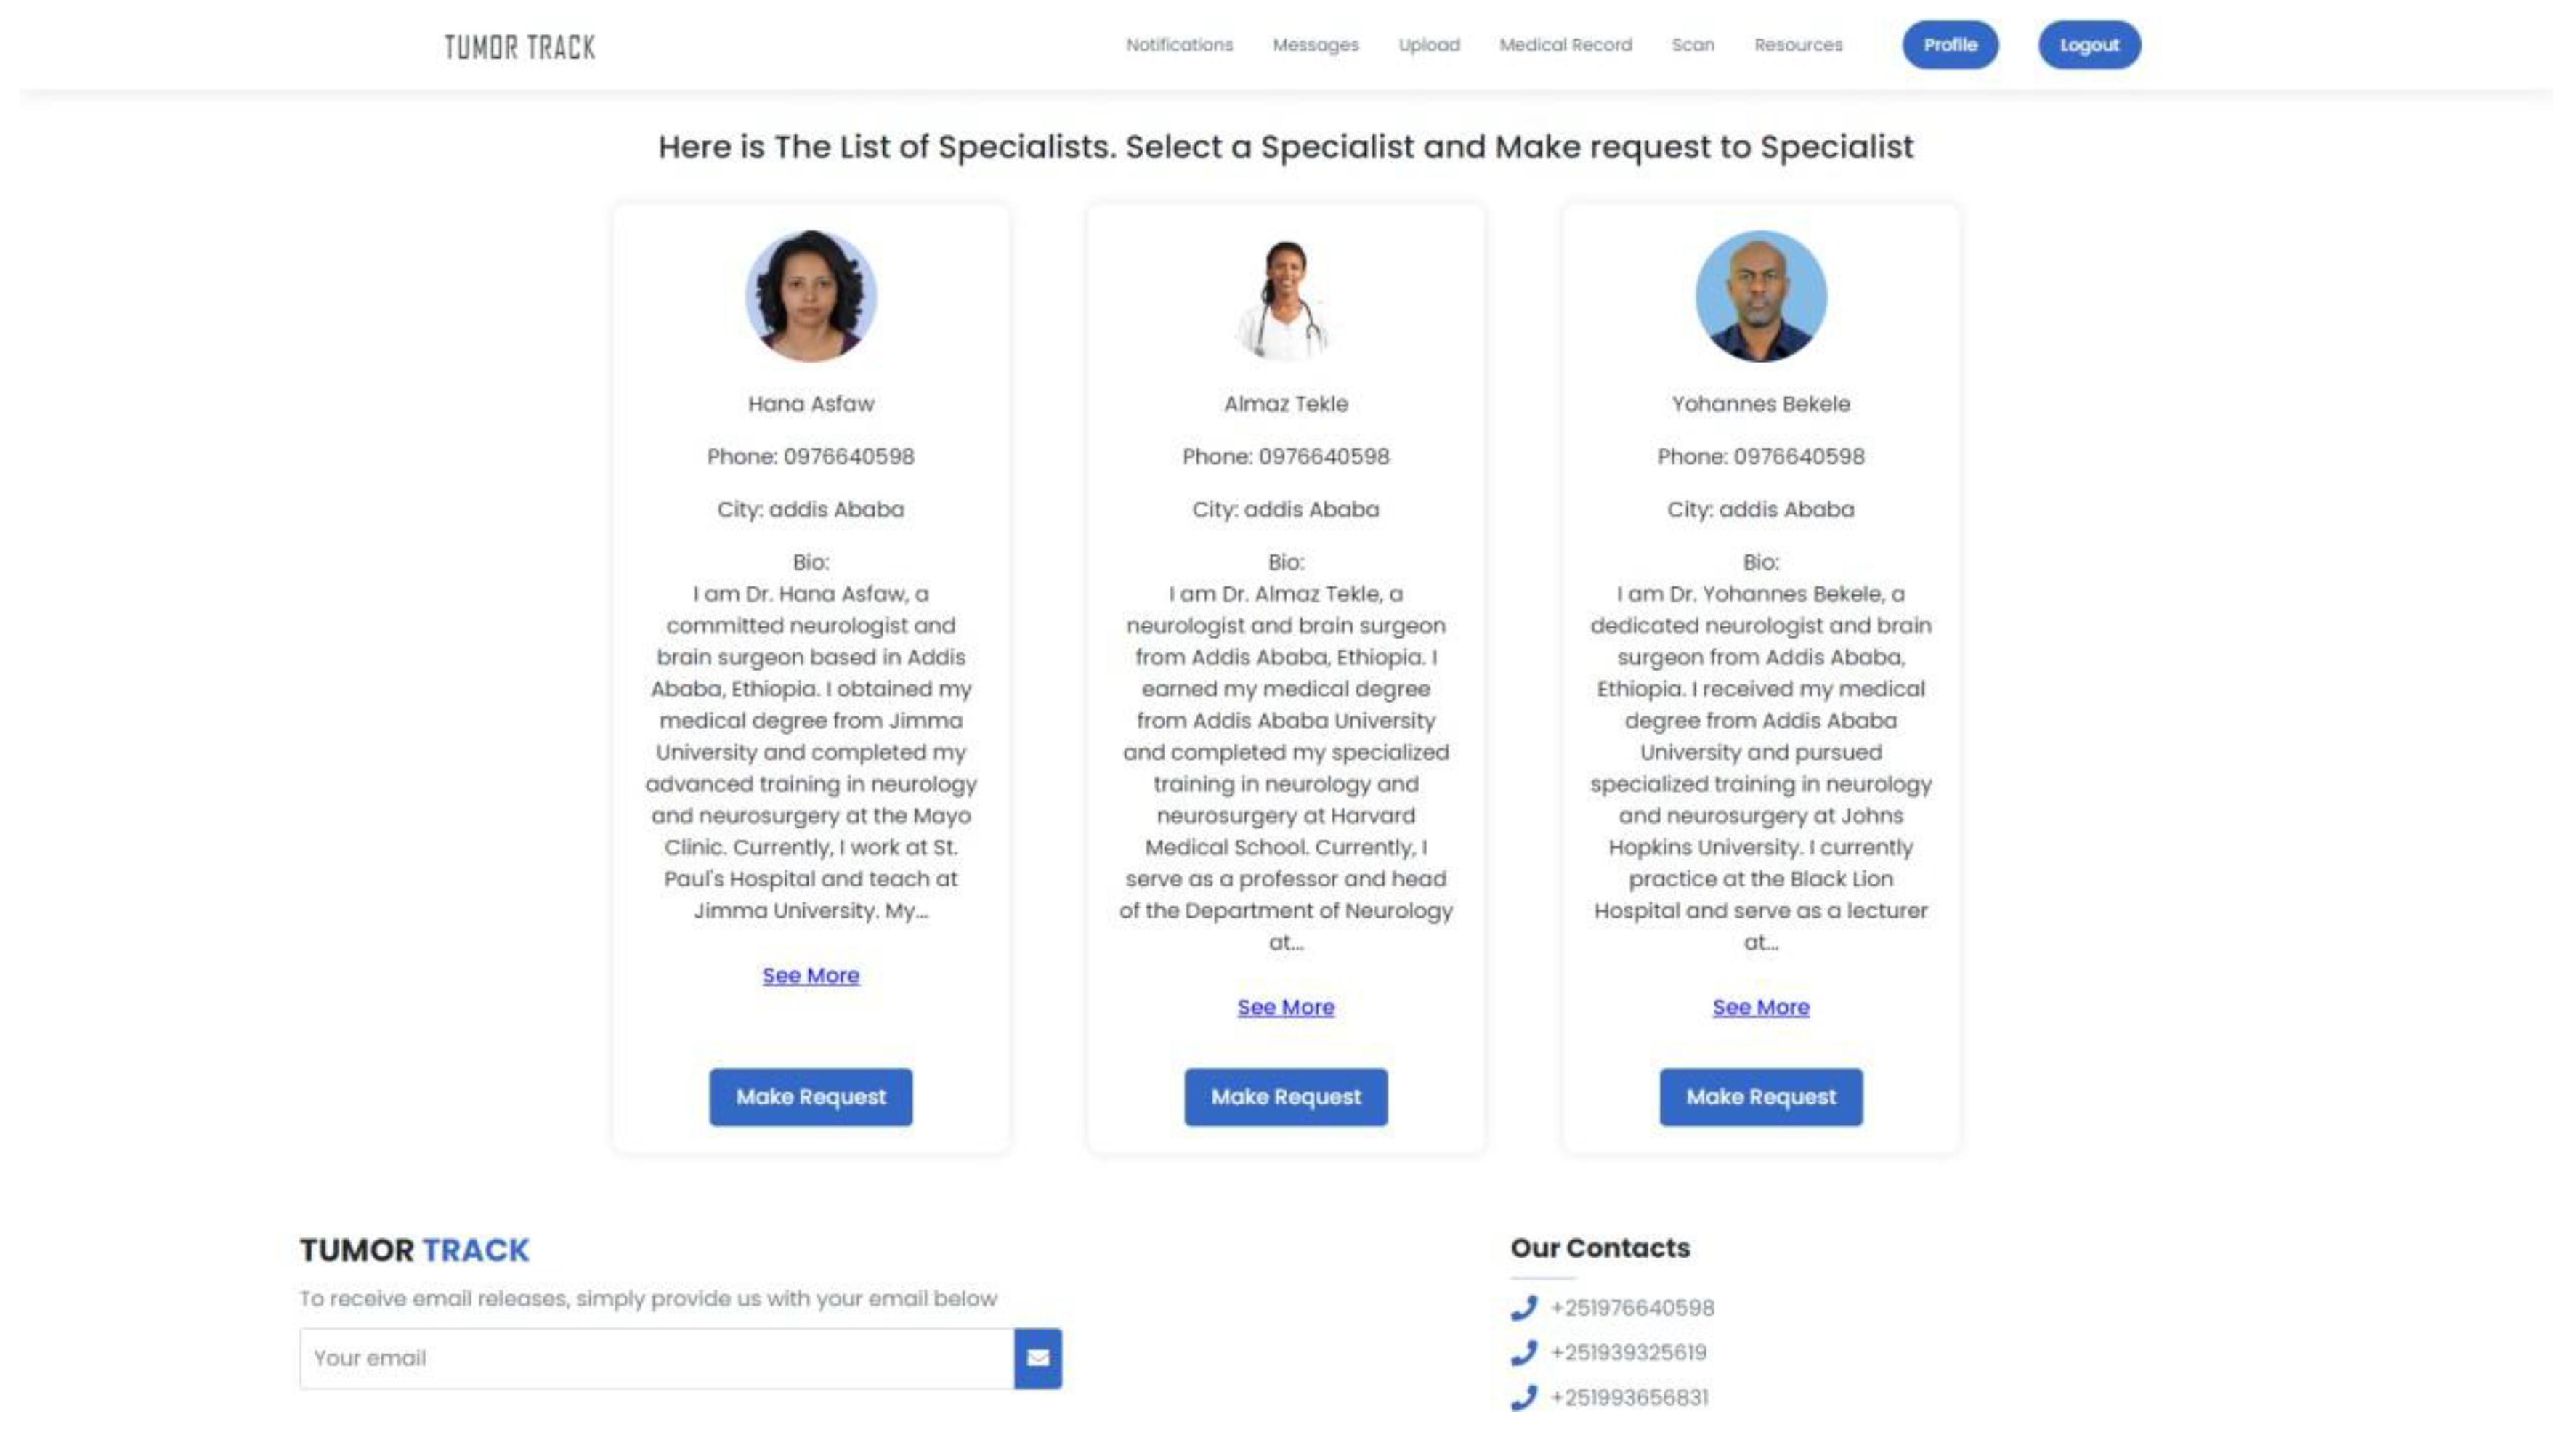
Figure 37.
Doctor sending request to Specialist.
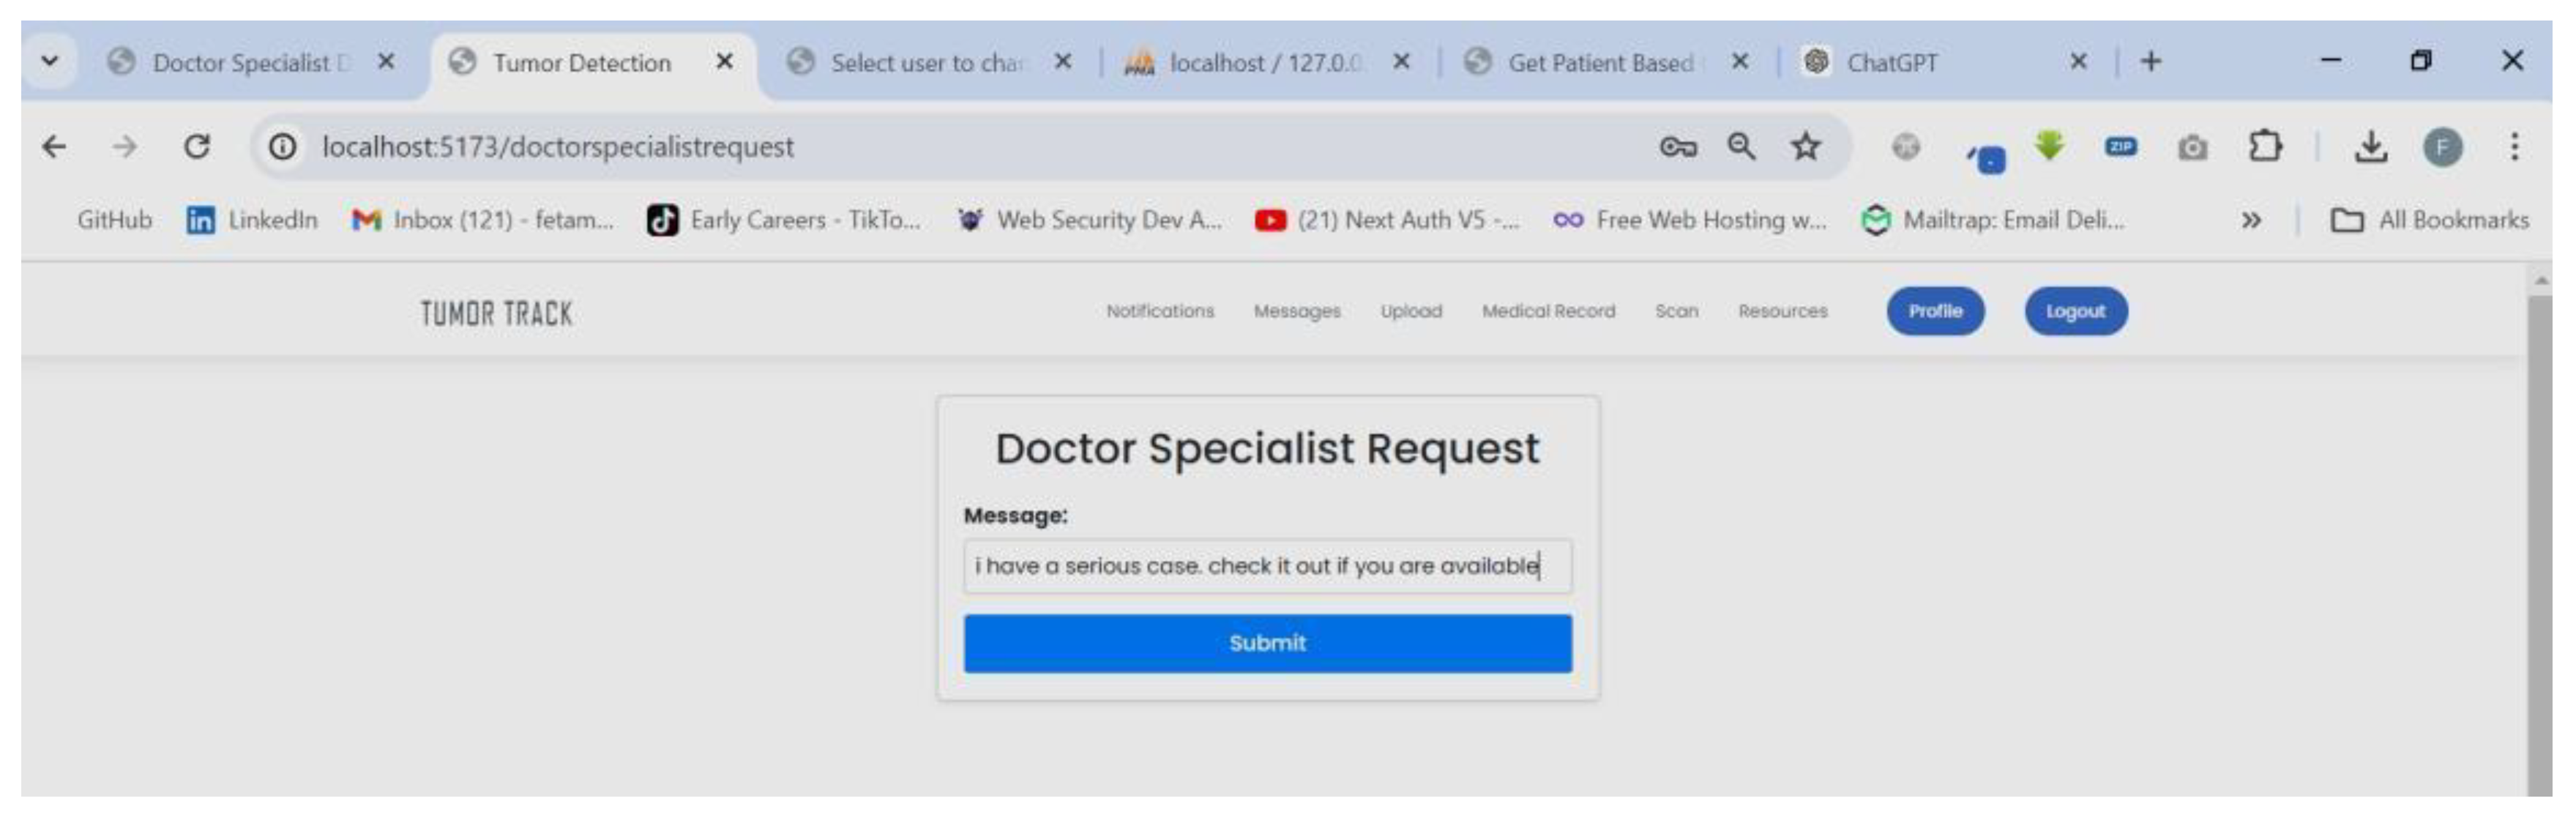
Figure 38.
Specialist receive request notification.
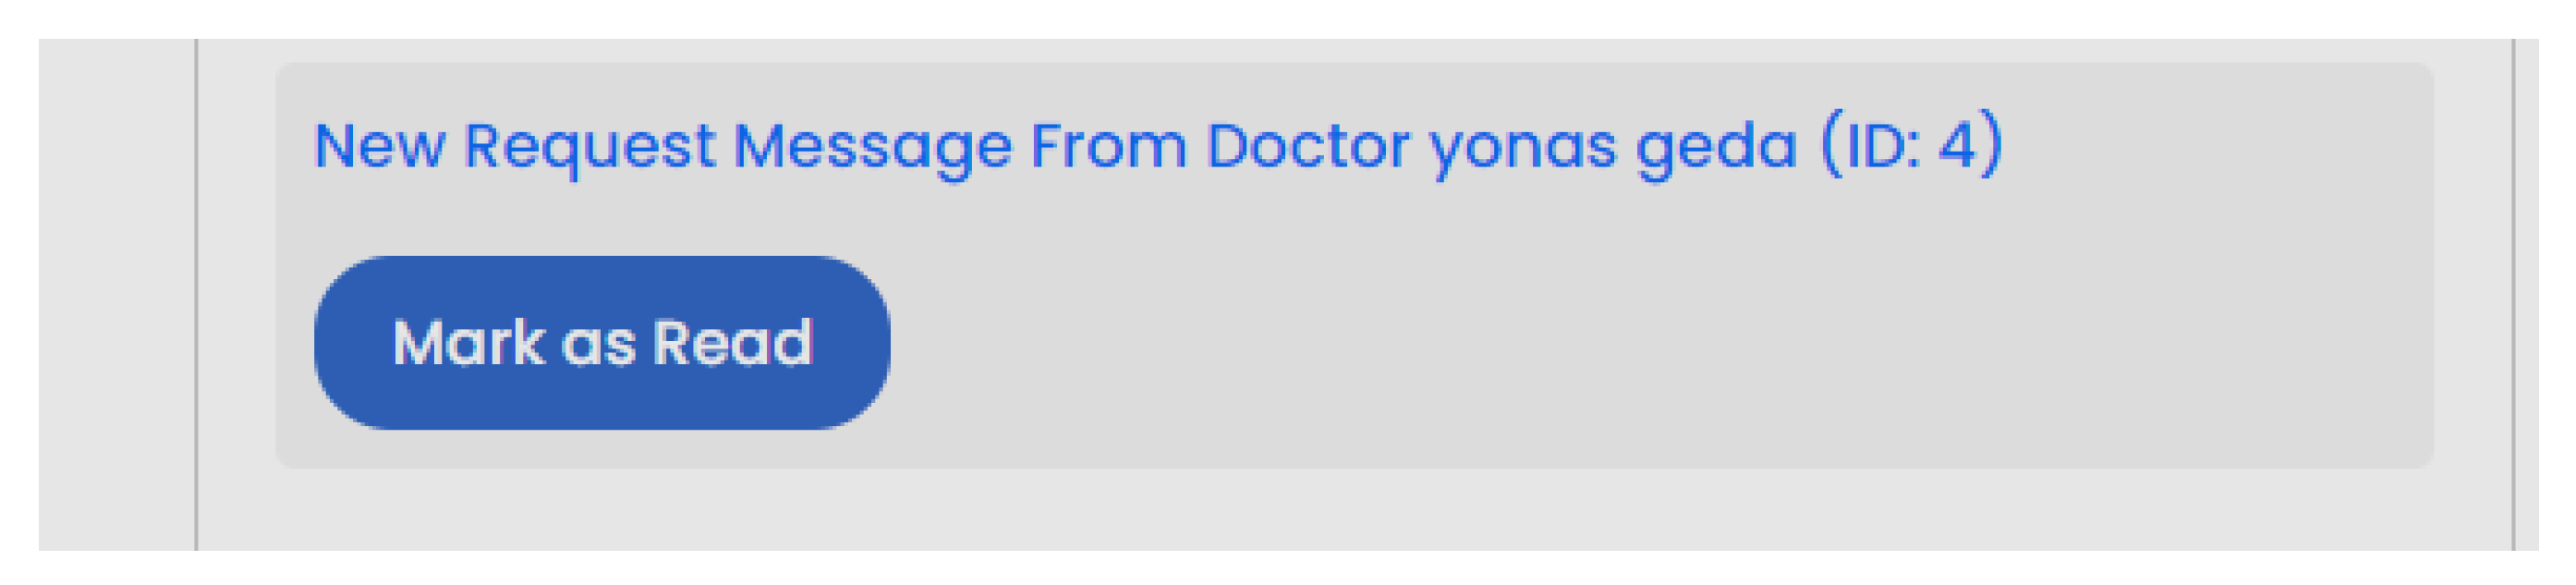
Figure 39.
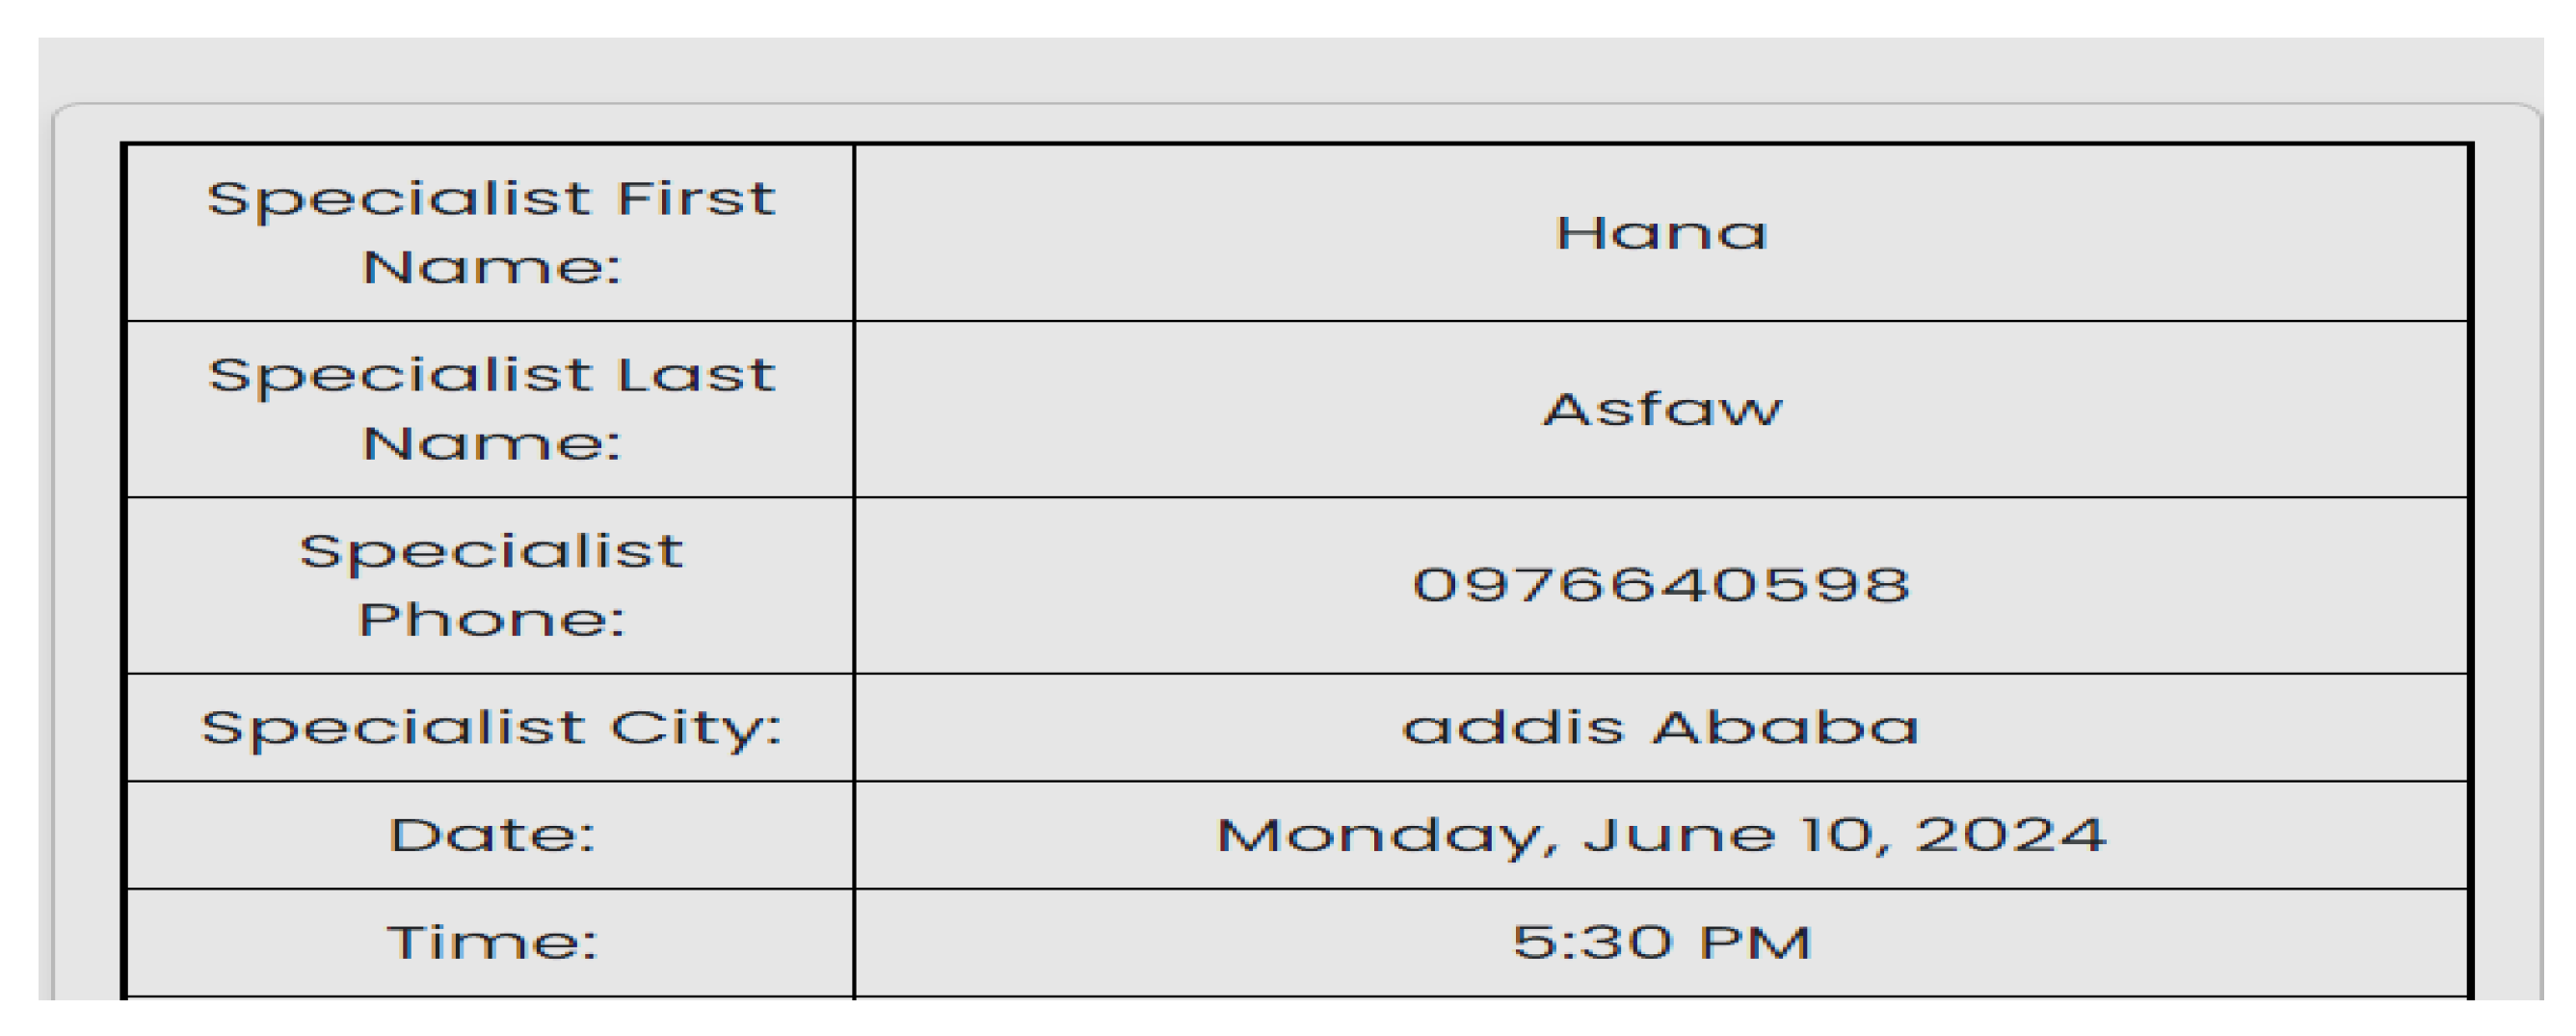
Specialist can view request detail.
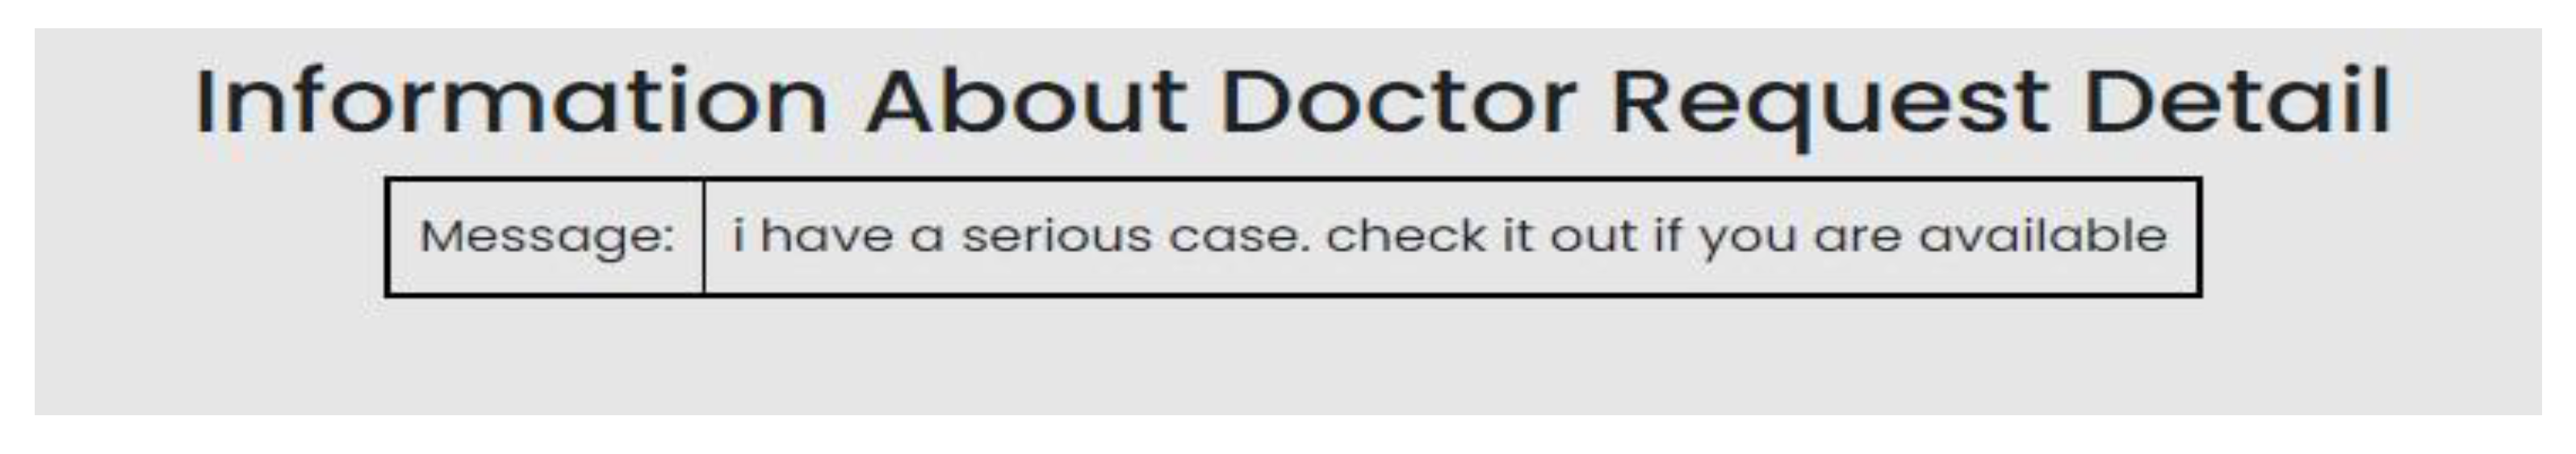
Figure 40.
Specialist sending response to the Doctor.
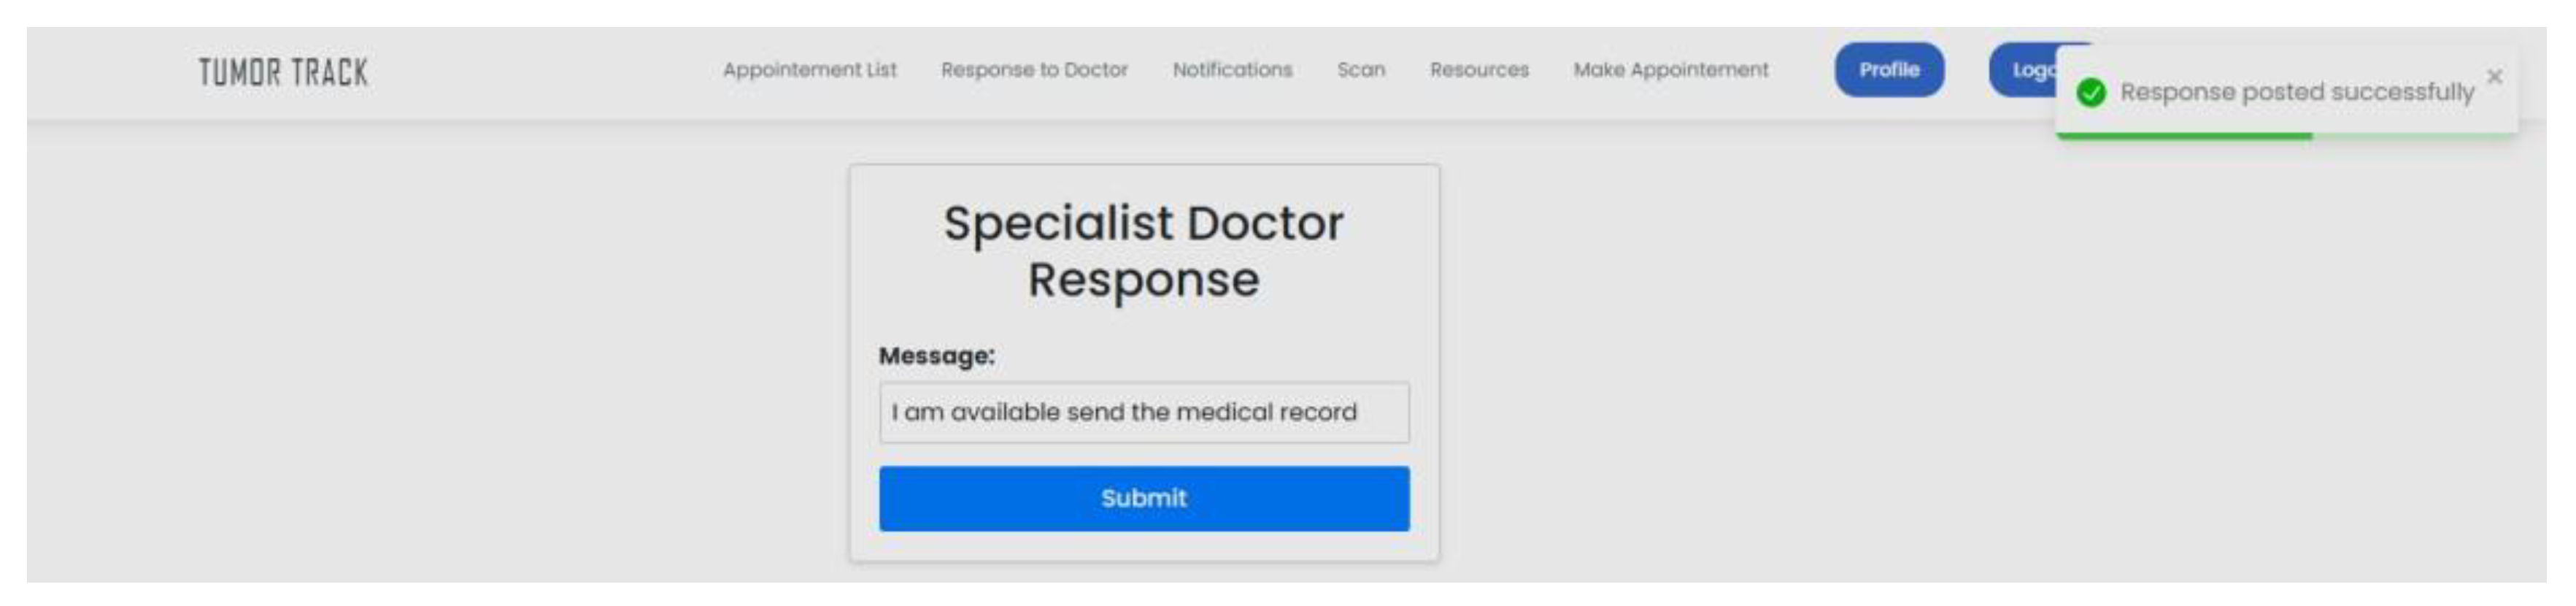
Figure 41.
Doctor receive response notification.
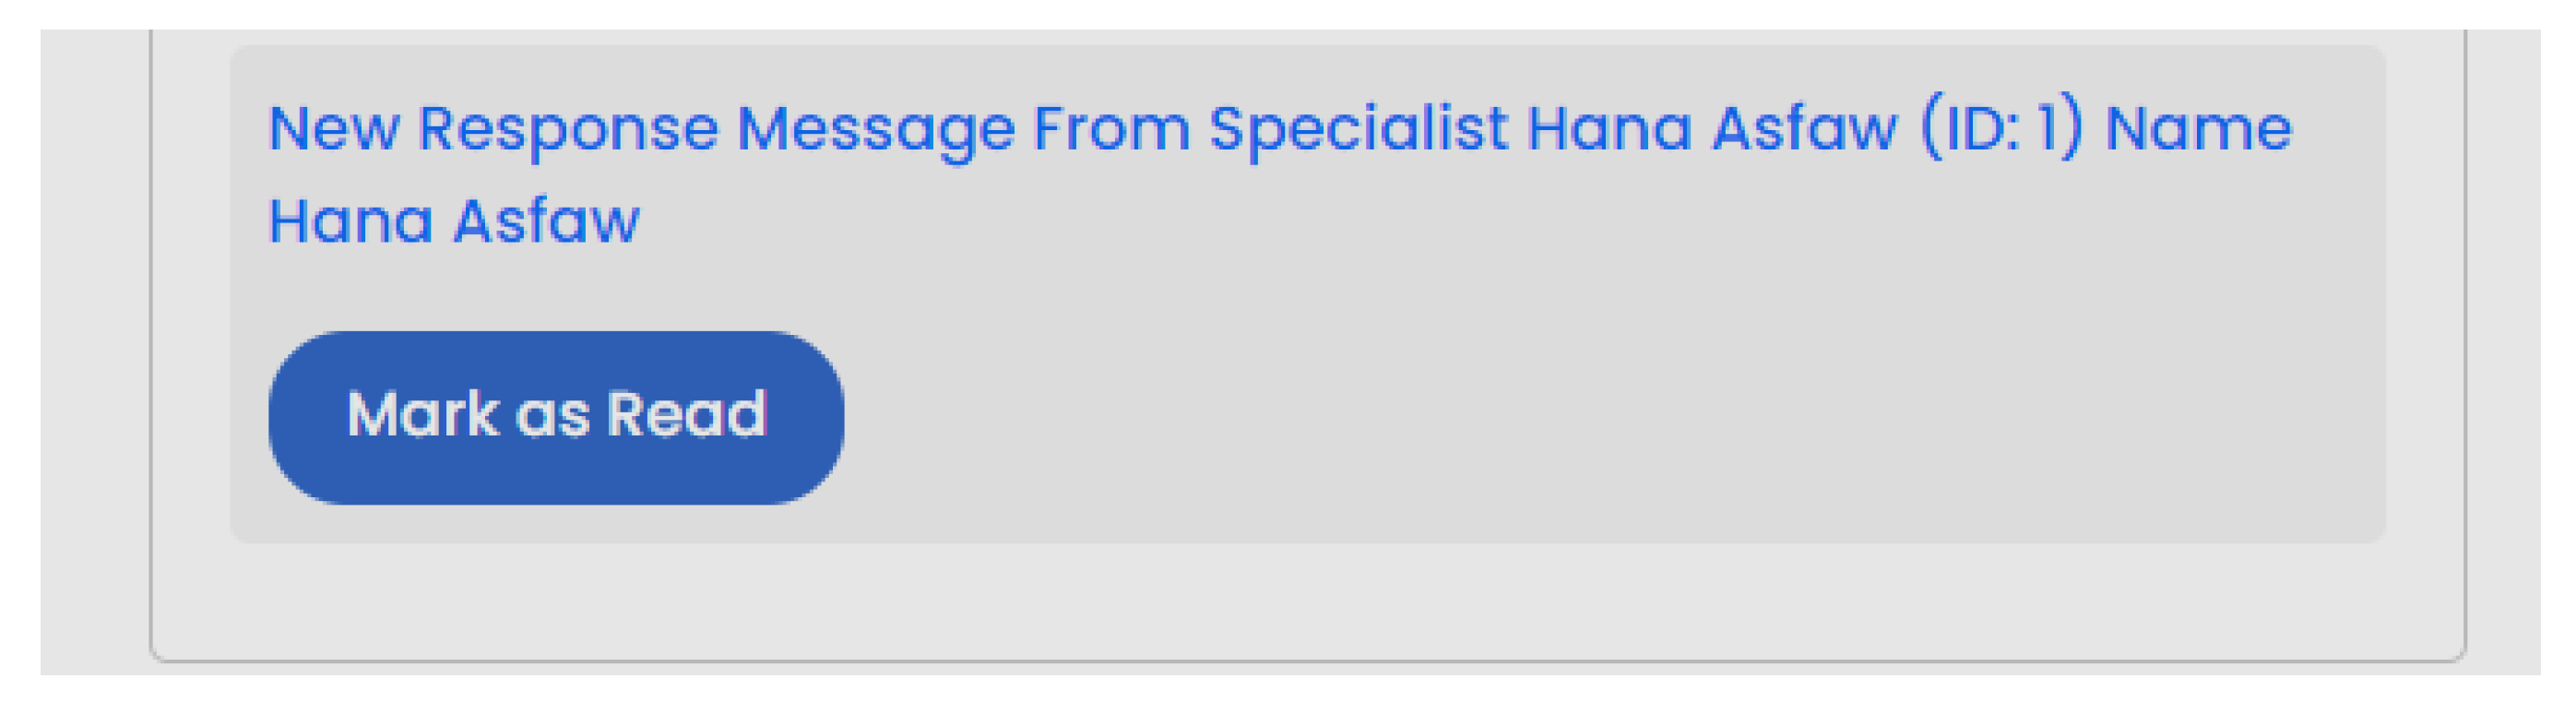
Figure 42.
Doctor can view response detail.
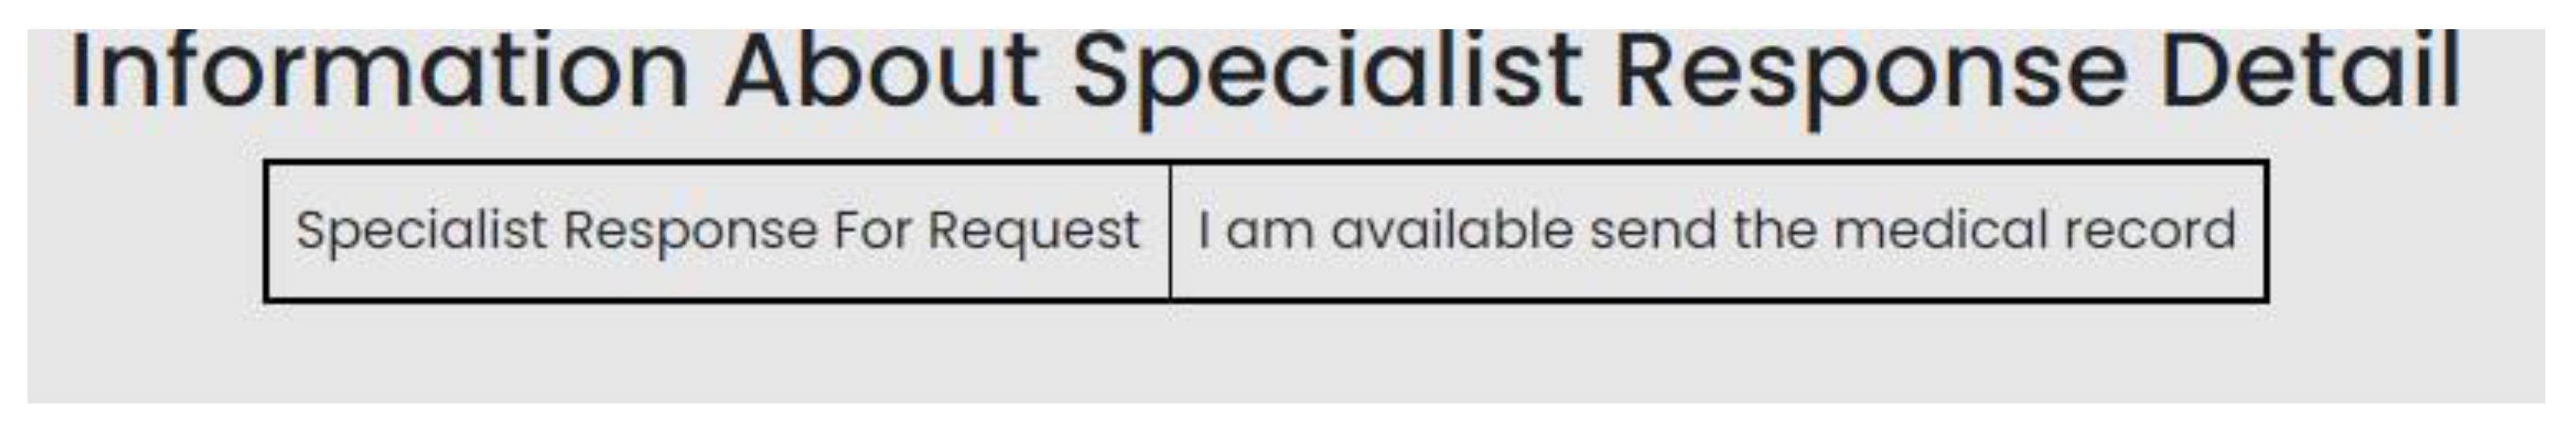
Figure 43.
Doctor sending patient record.
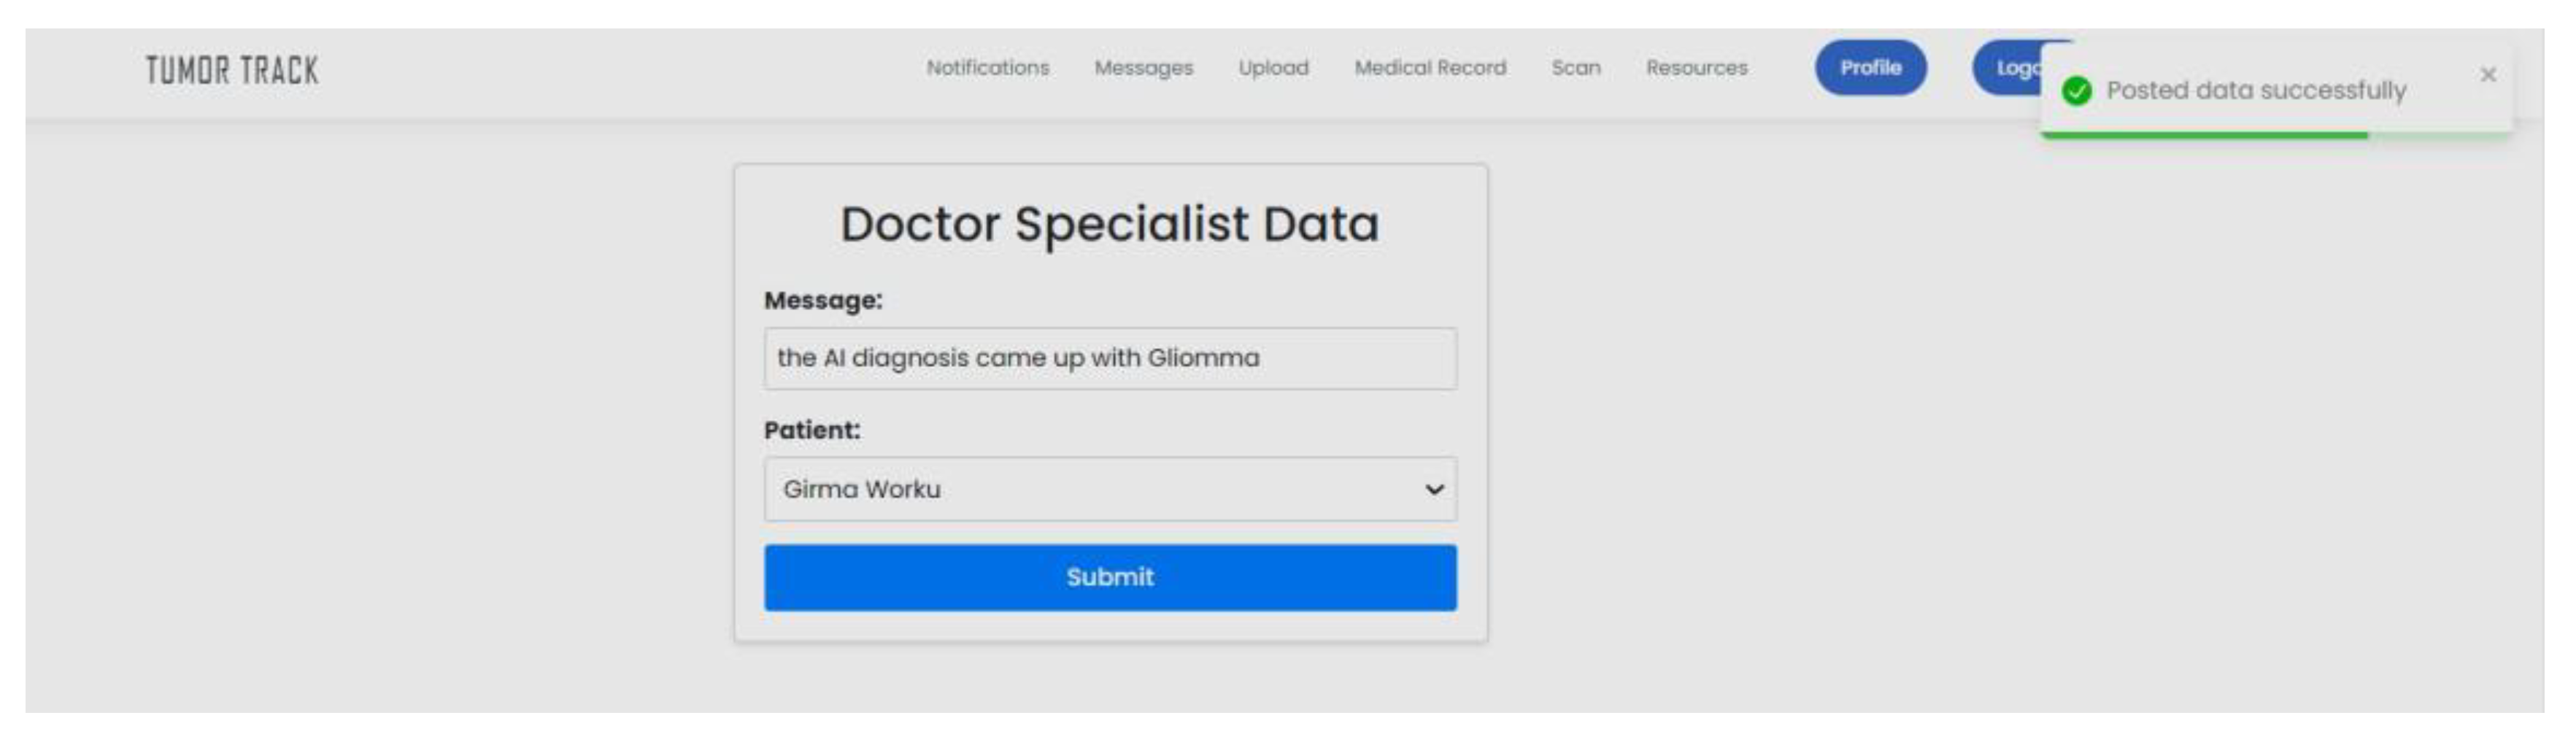
Figure 44.
Specialist receive notification.
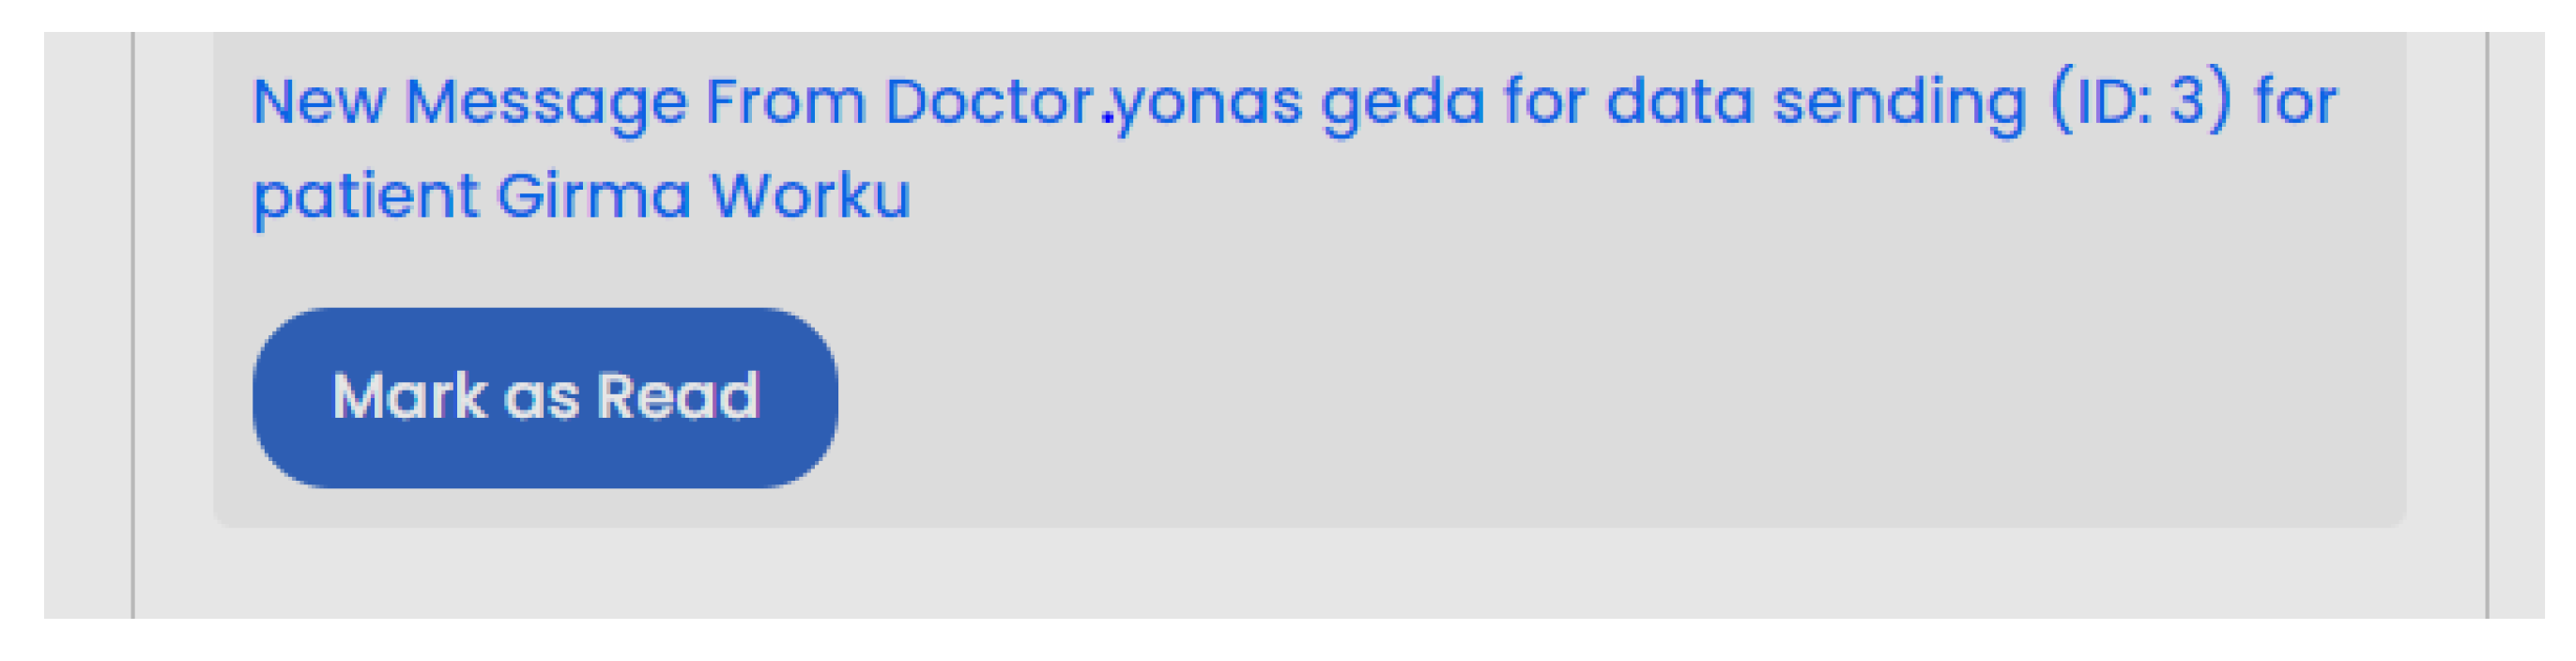
Figure 45.
Specialist can view Patient record.
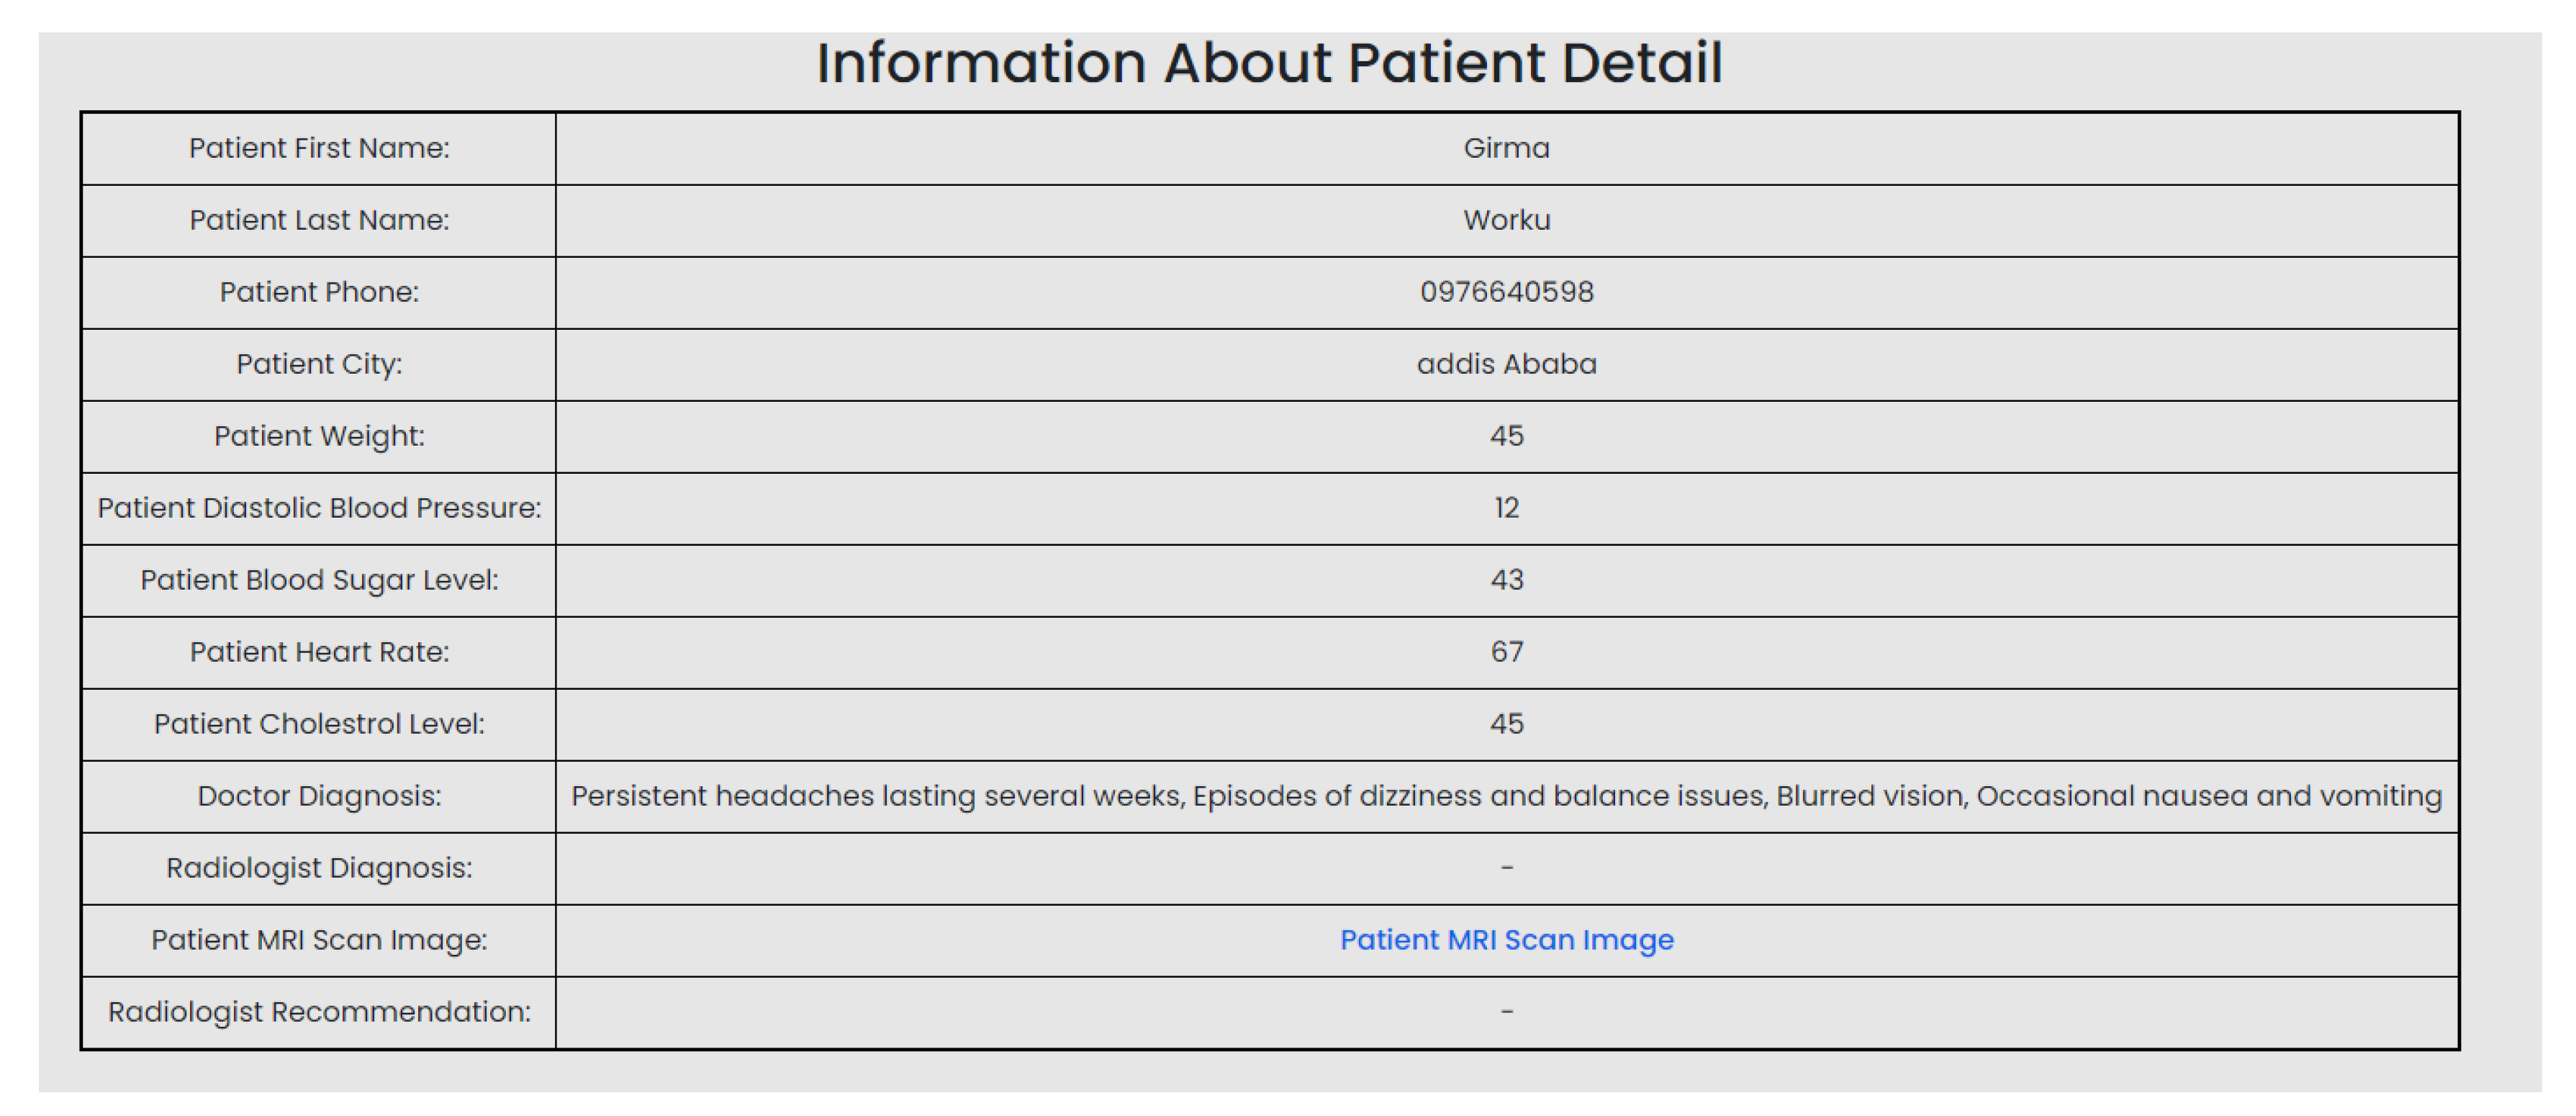
Figure 46.
Specialist can schedule appointment for patient if case is severe.

Figure 47.
Patient can view appointment.
The above diagrams show the successful integration of all the basic web application components as well as the AI models. During testing there was slight delay after uploading the MRI image to the AI model to get the result. This is due to the backend is processing the result of the two AI models simultaneously.
Table 21.
Test scenario 2.
| Scenario Id | 02 |
| Scenario Name | Registration |
| Participant Actor | Admin |
| Flow of events | The admin logs into his account. Chooses add user. Chooses role for this case she is a specialist. Fills in the required form and save it. |
Figure 48.
Admin registering a specialist.
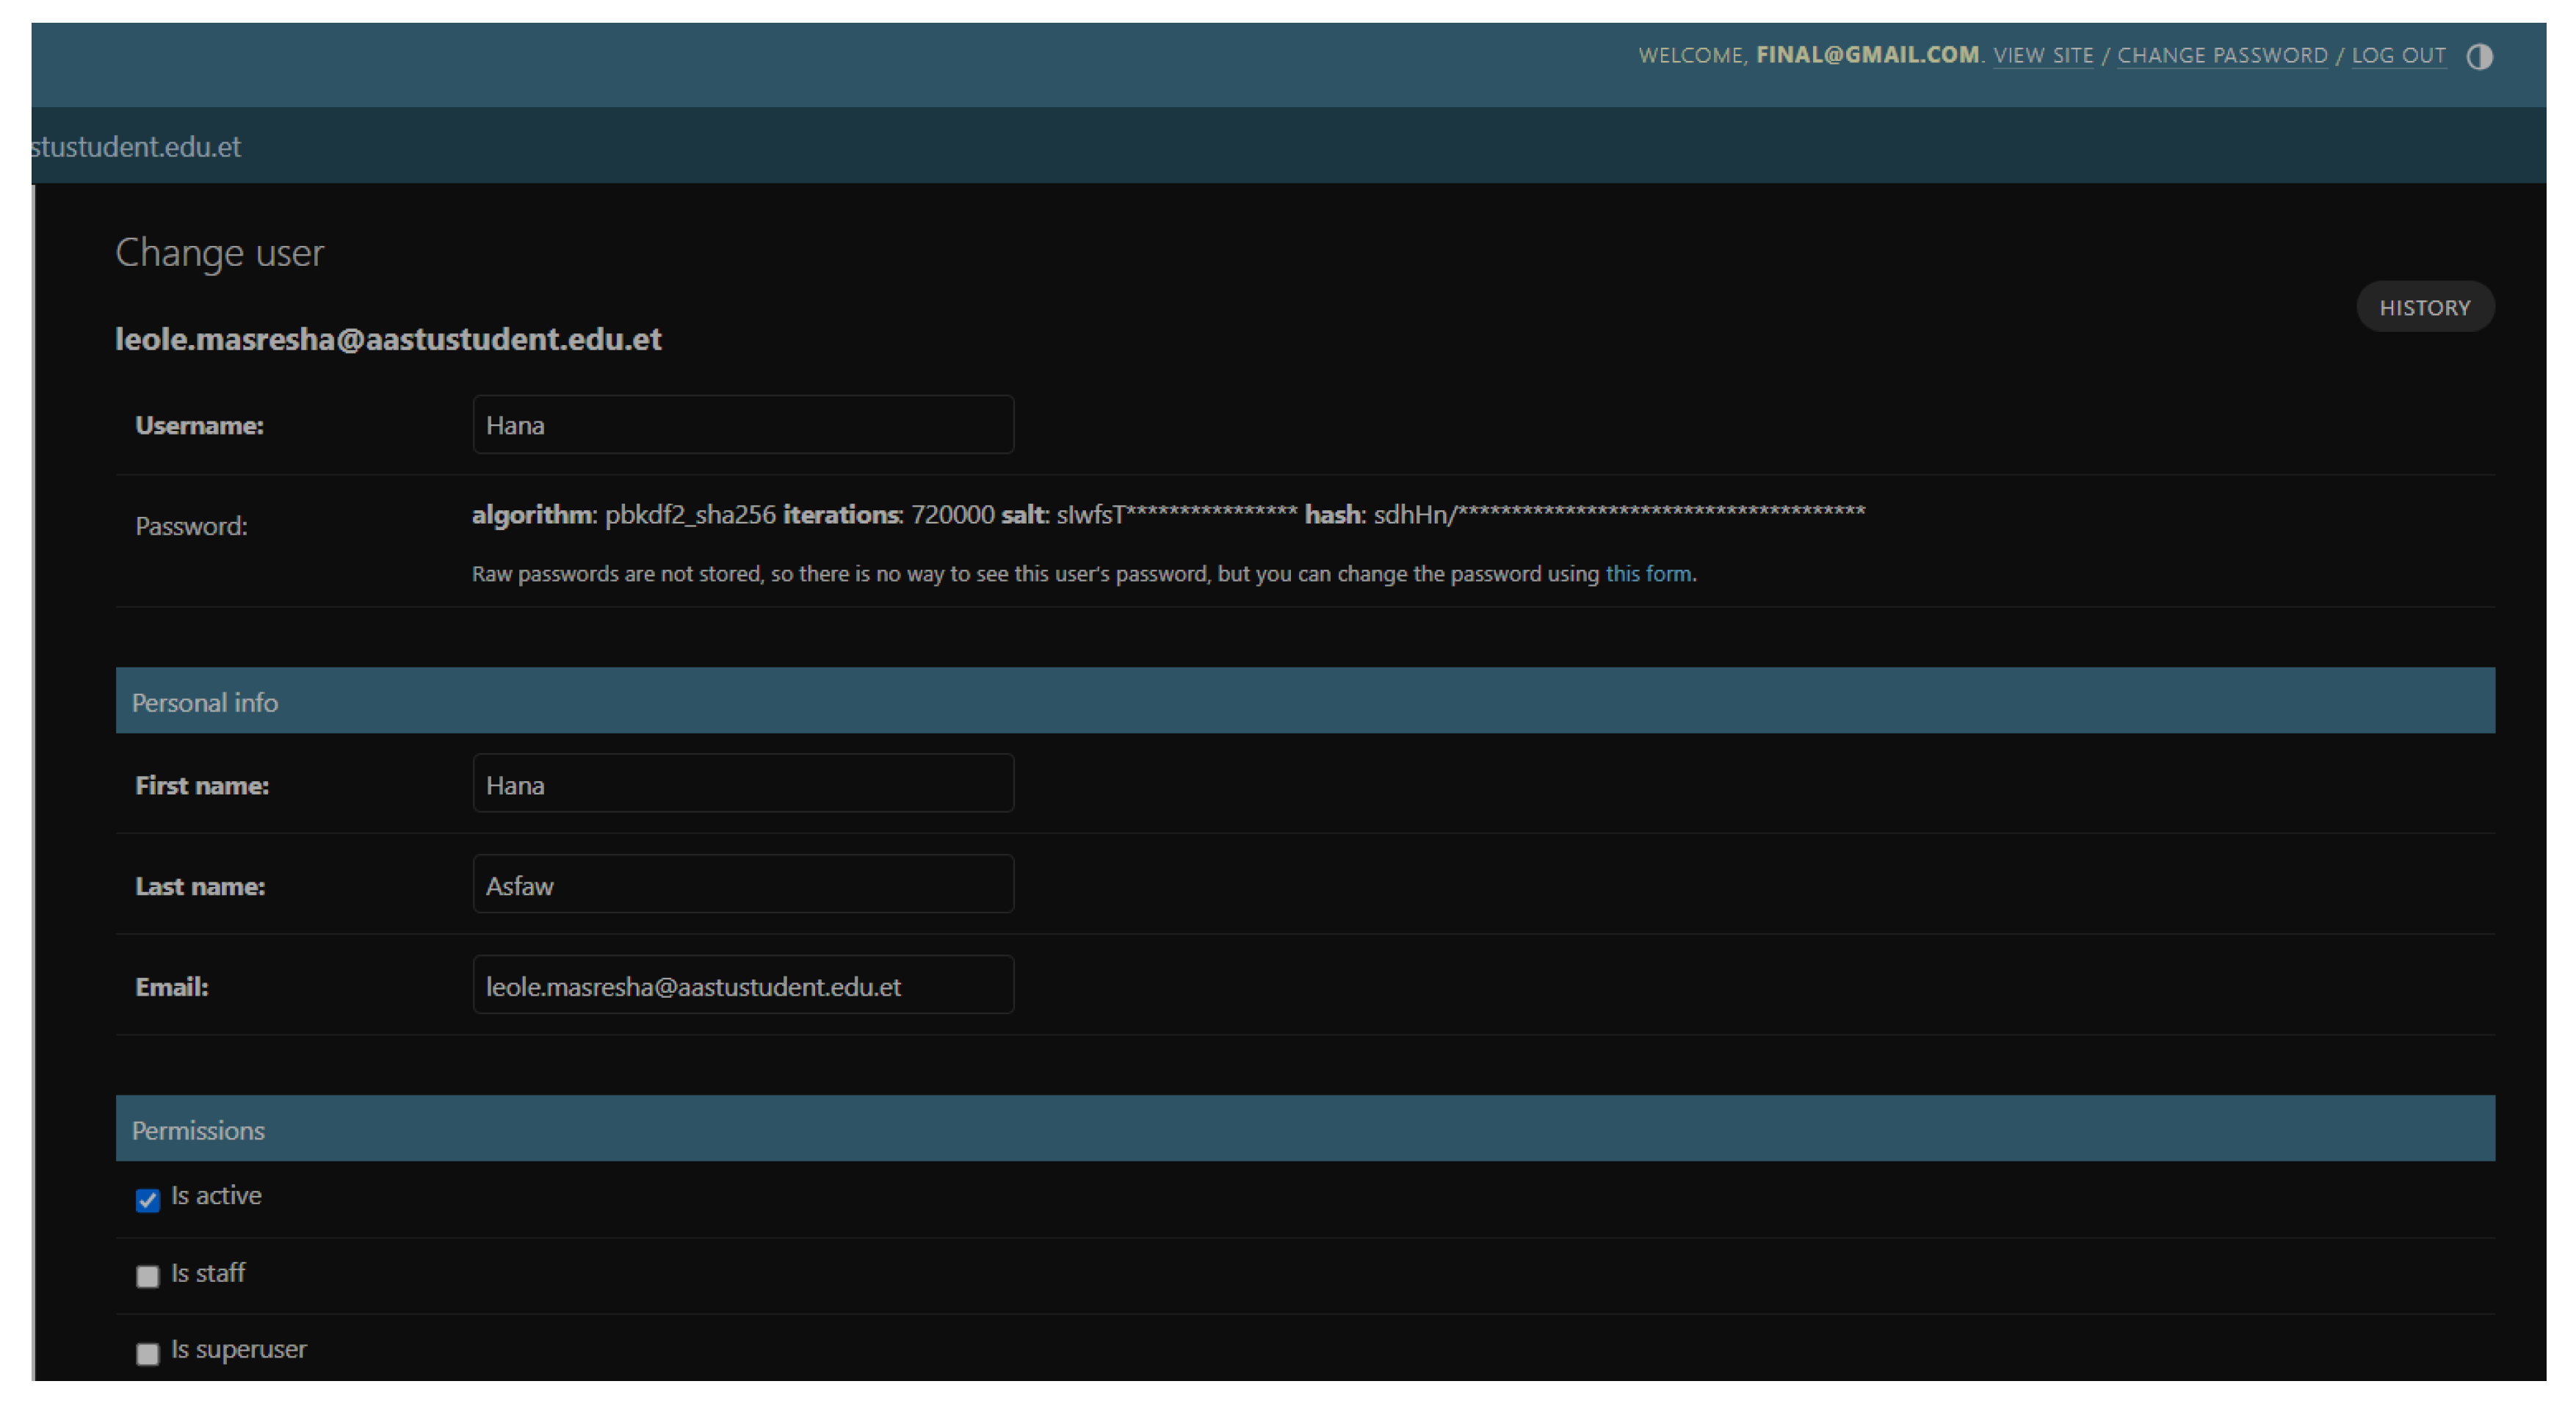
The above diagram shows how the admin can add new users (medical receptionists, doctors, radiologists and specialists). The test was completed successfully with out any issues.
Table 22.
Test scenario 3.
| Scenario Id | 03 |
| Scenario Name | Unable to login |
| Participant Actor | Patient (Feta M.) |
| Flow of events |
|
Figure 49.
Patient unable to login.
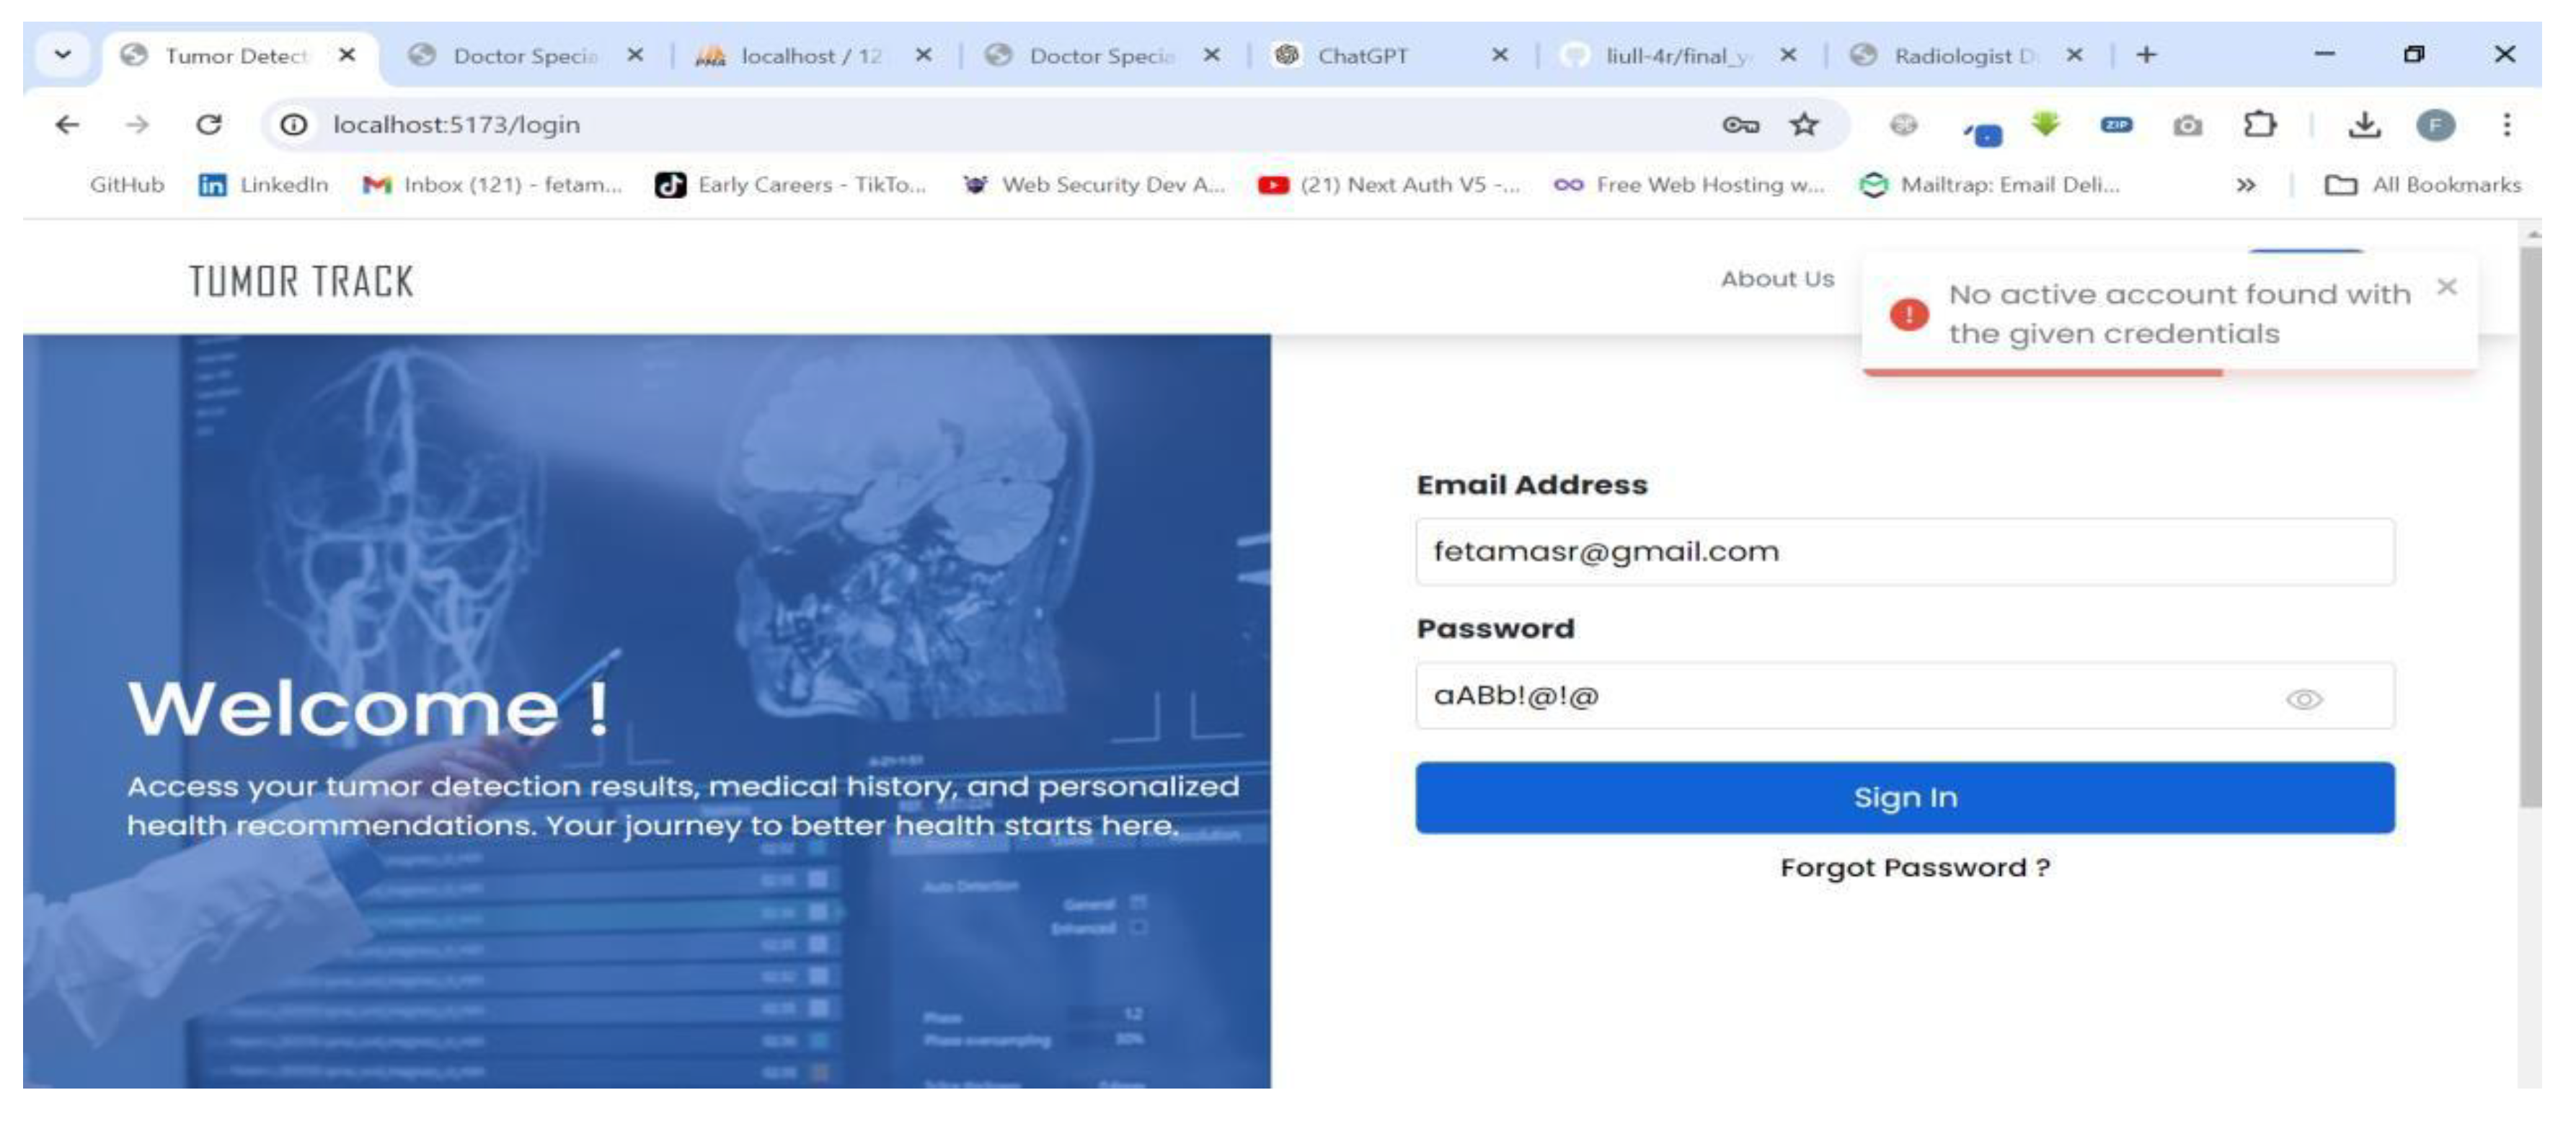
Figure 50.
Patient fill in form to reset password.
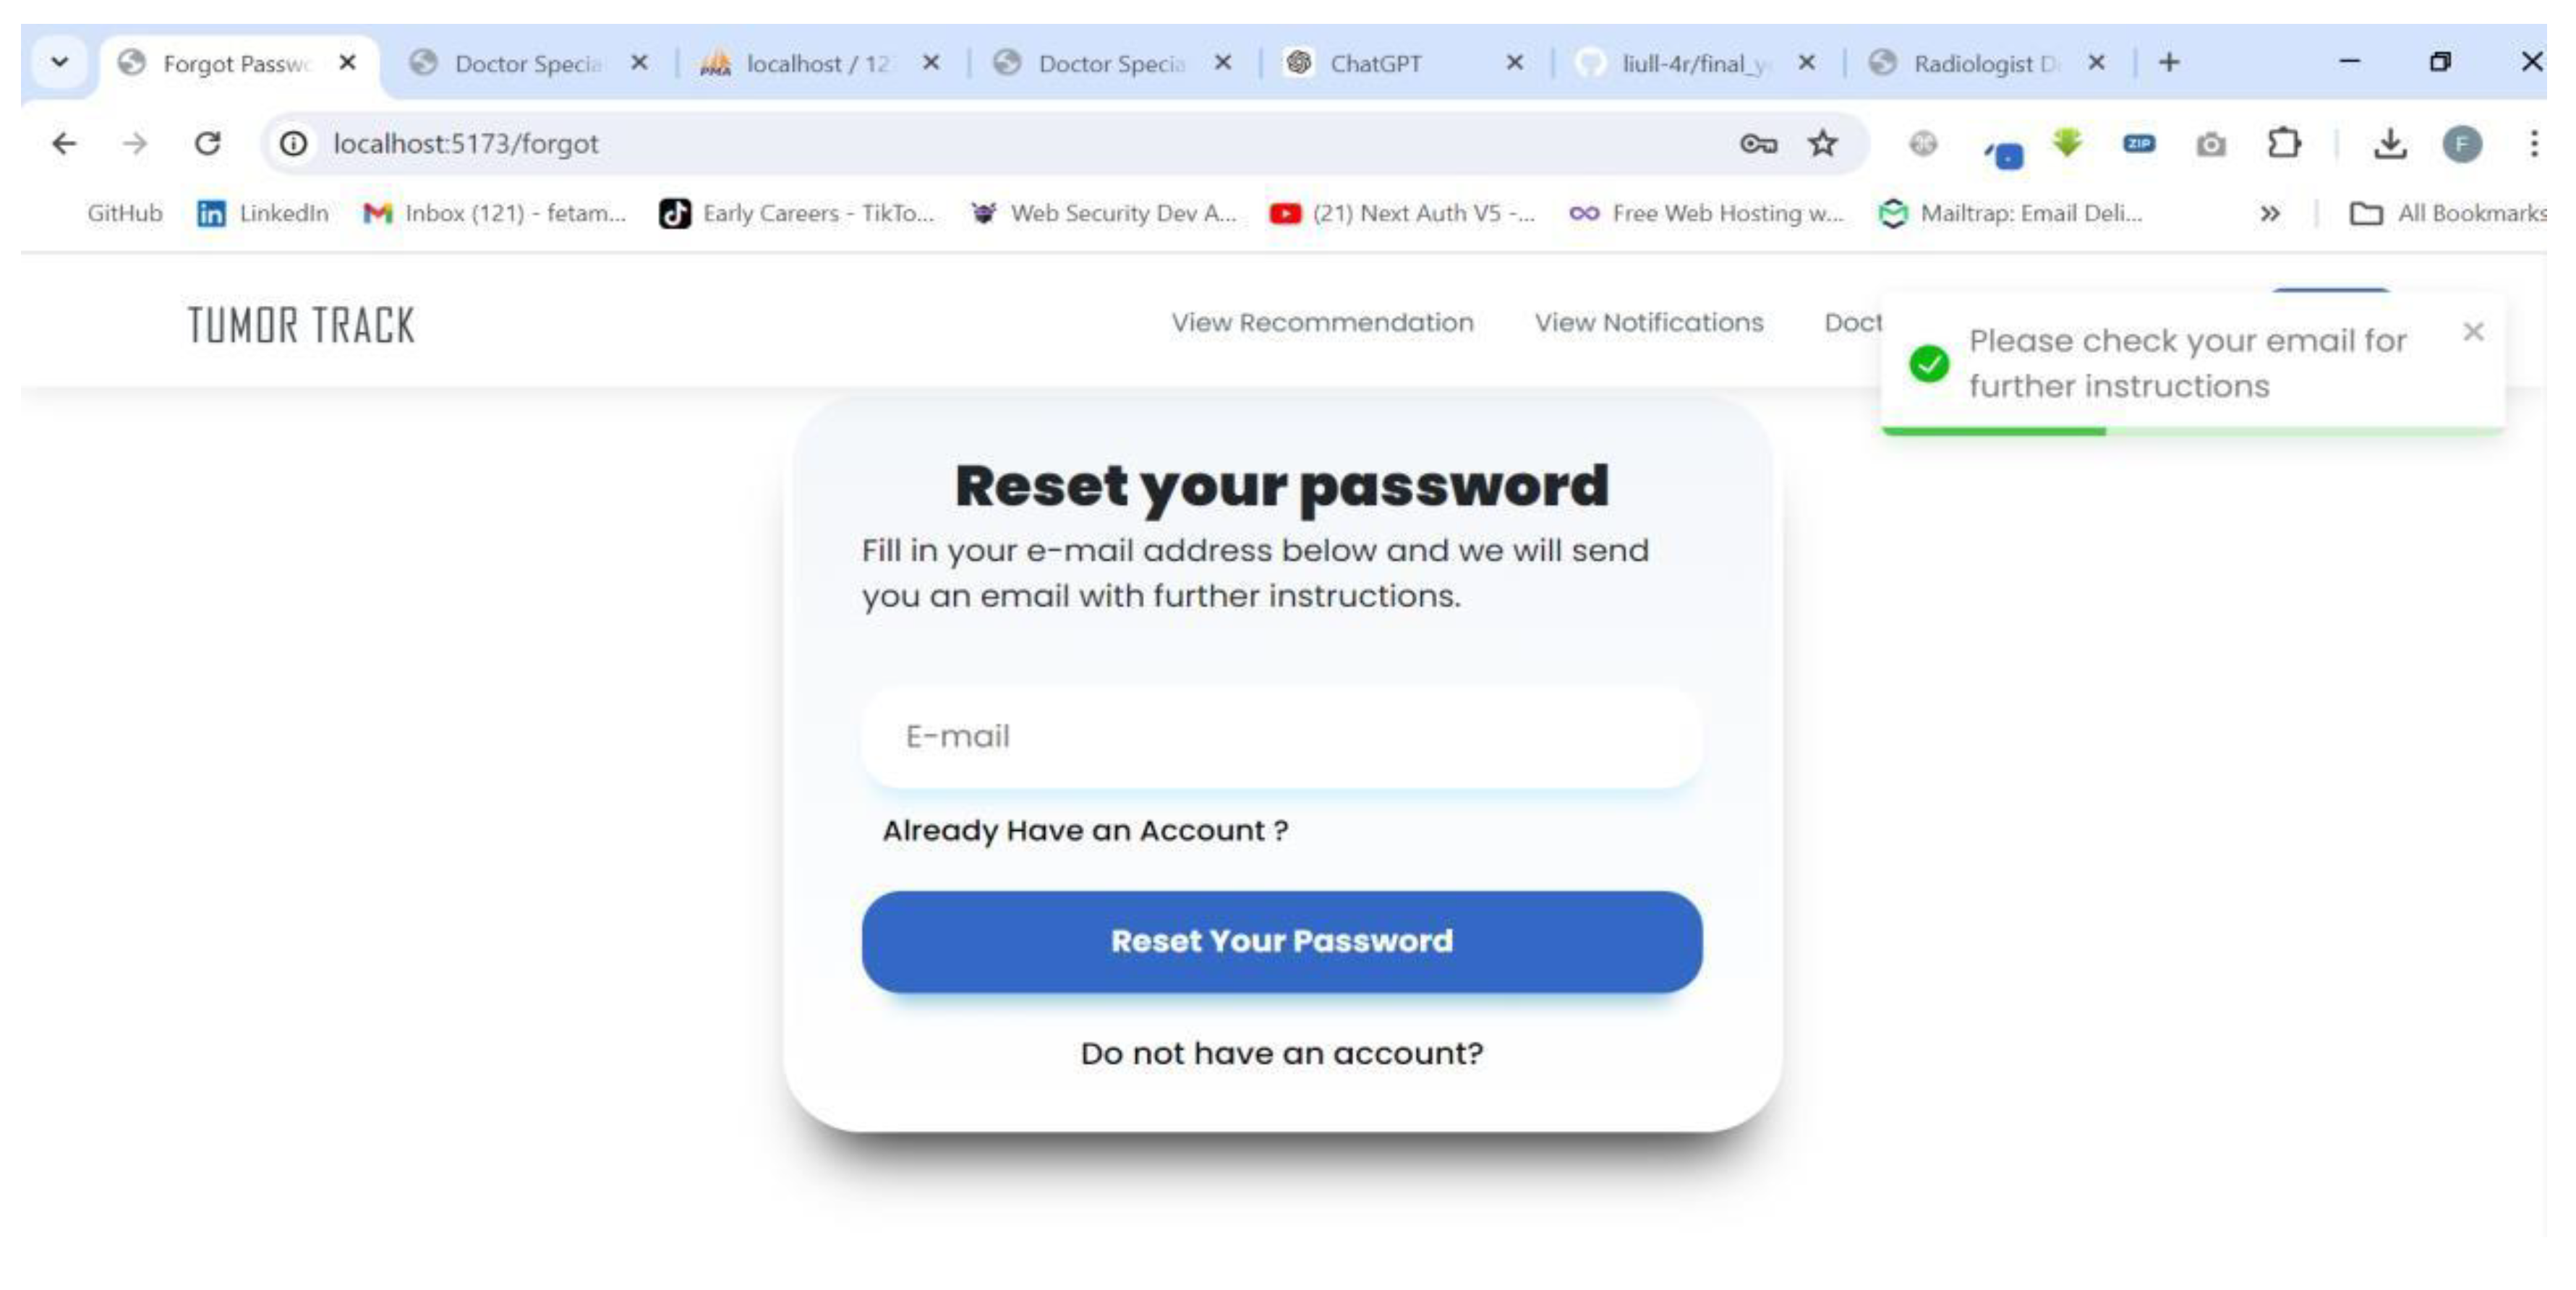
Figure 51.
Patient receive email to reset password.
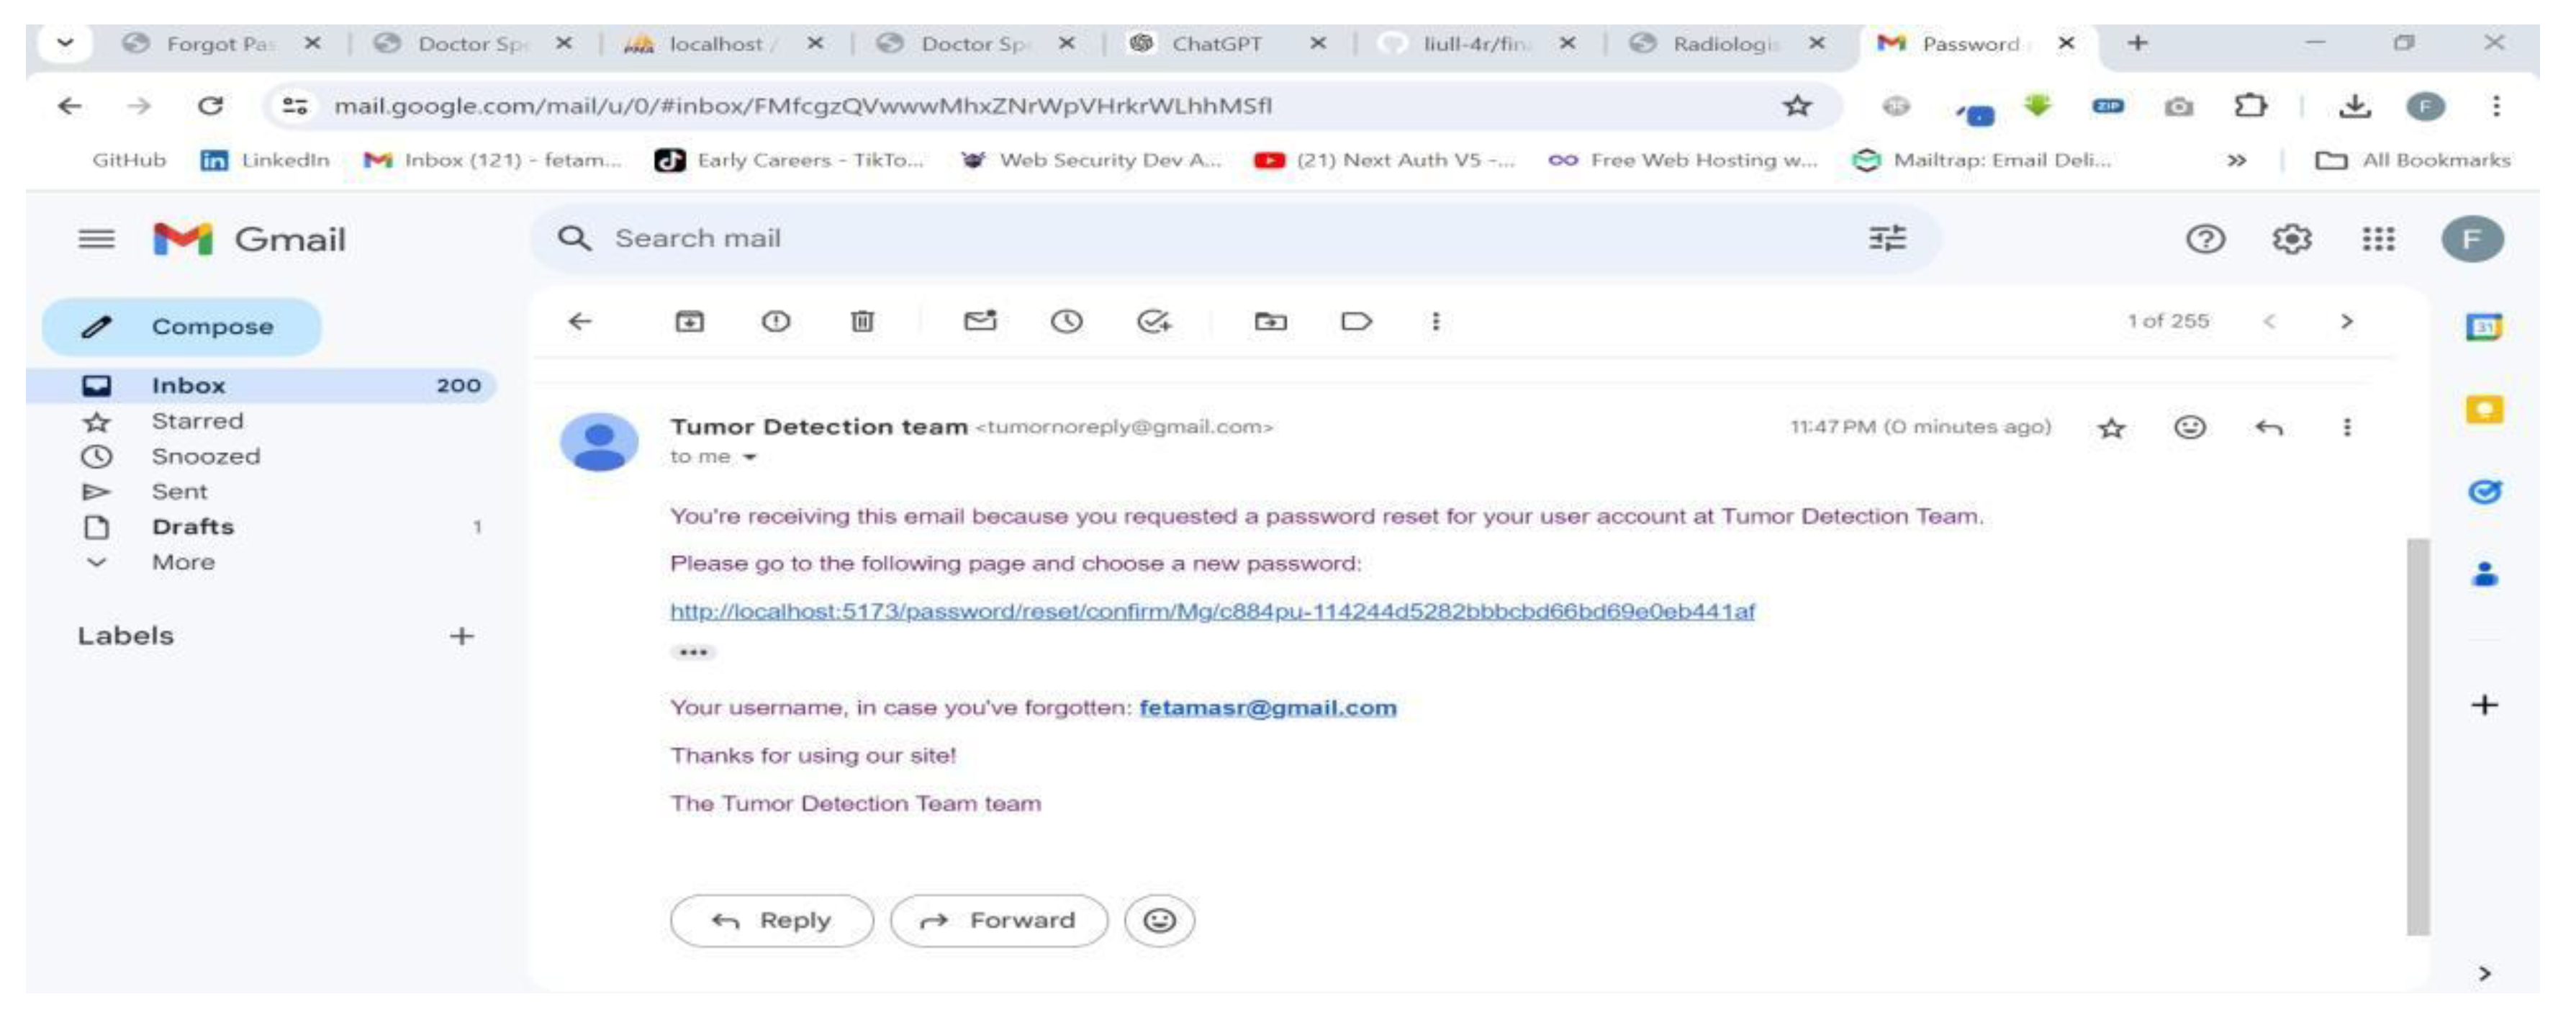
Figure 52.
Patient can now reset password.
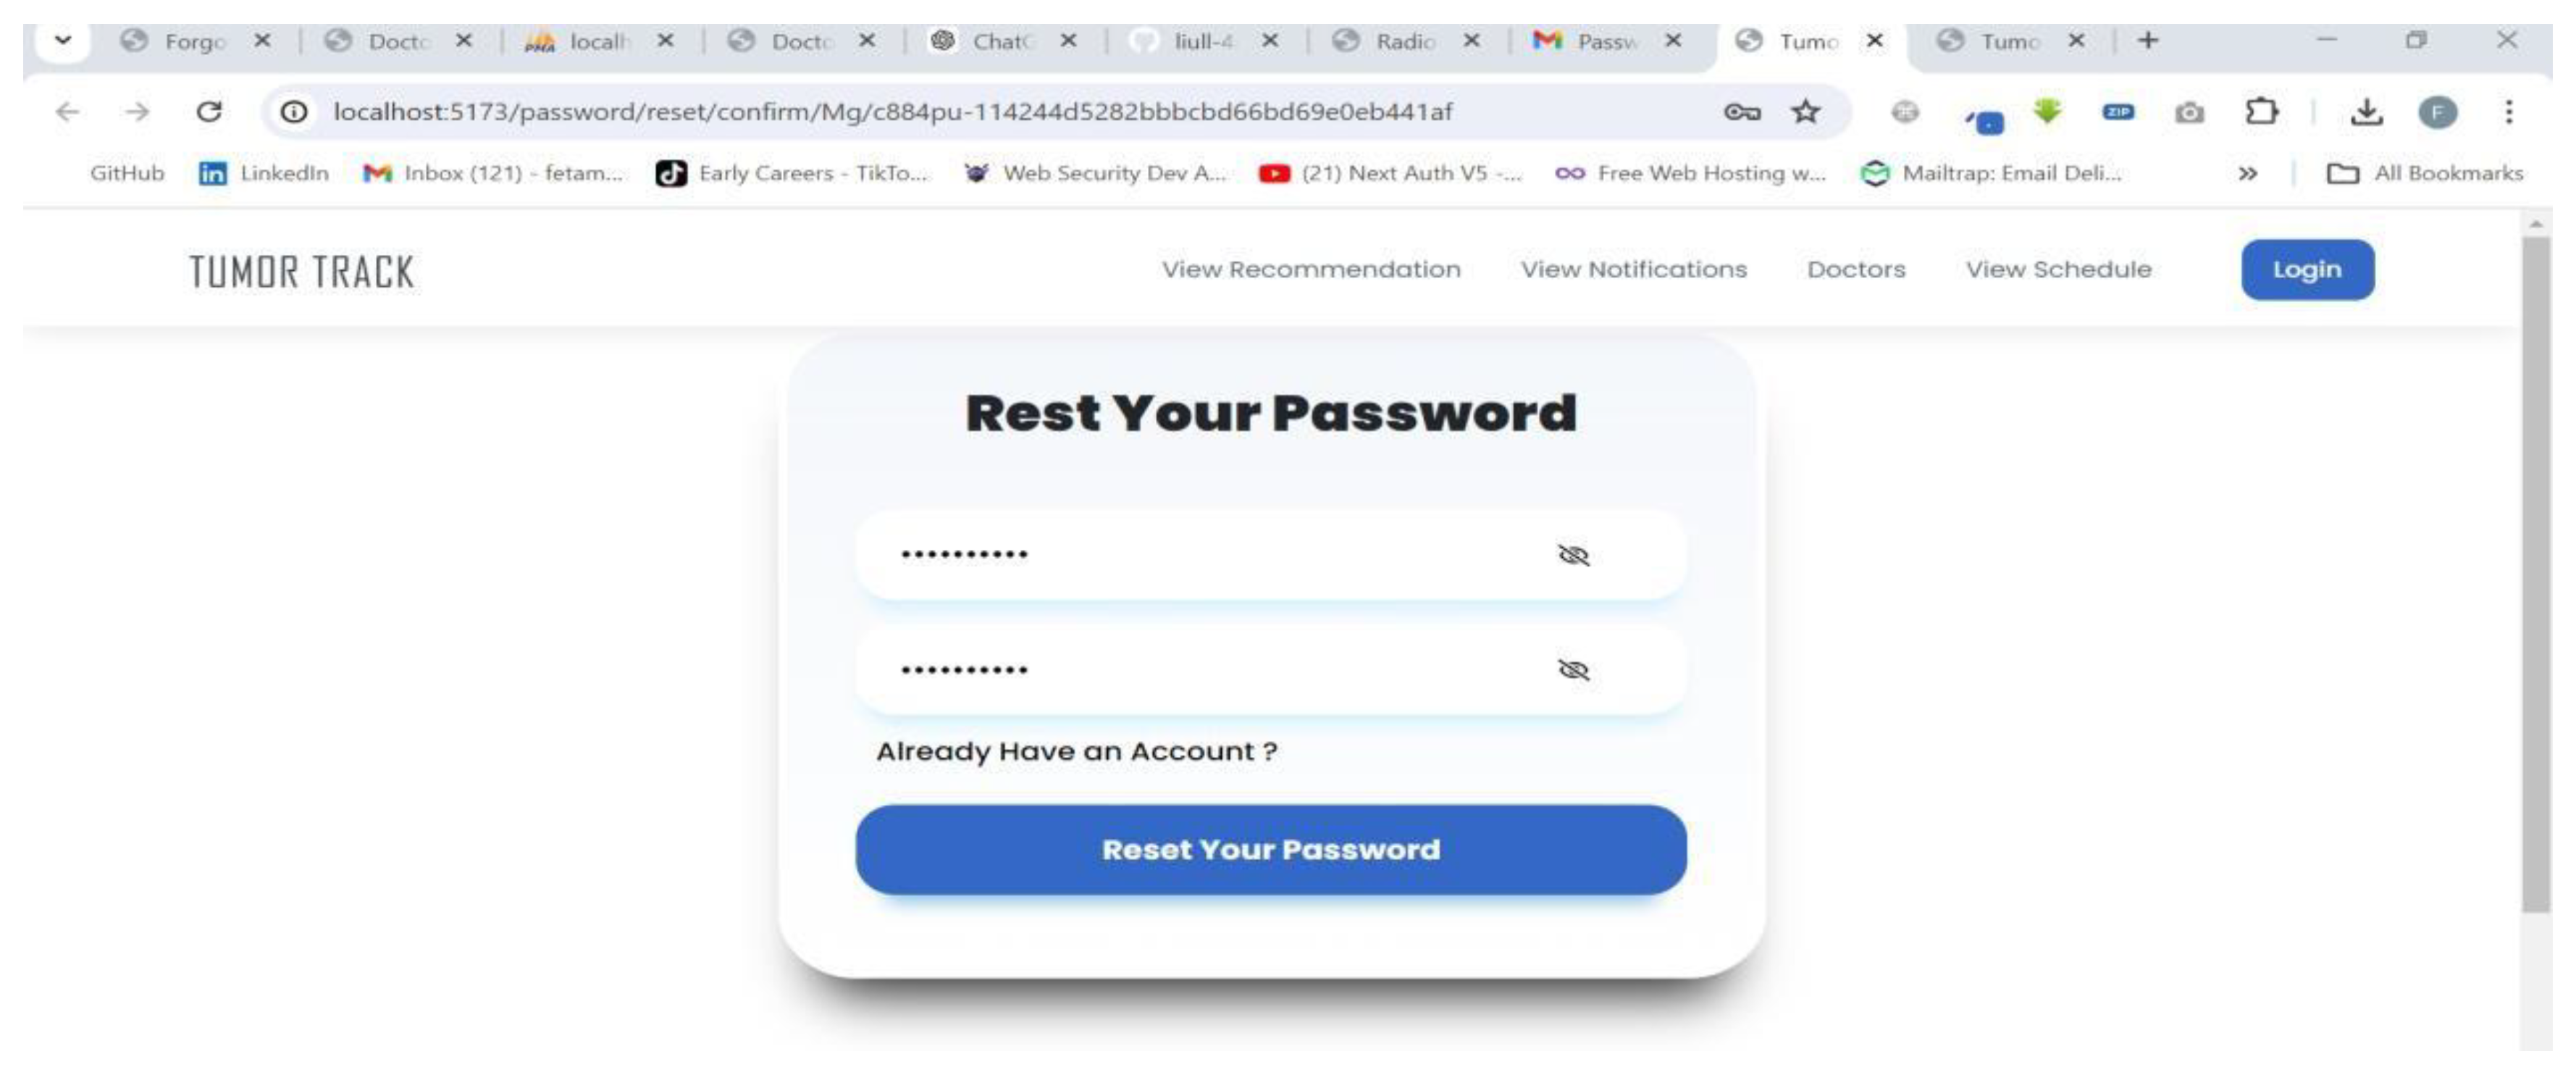
Figure 53.
Patient logged in successfully.
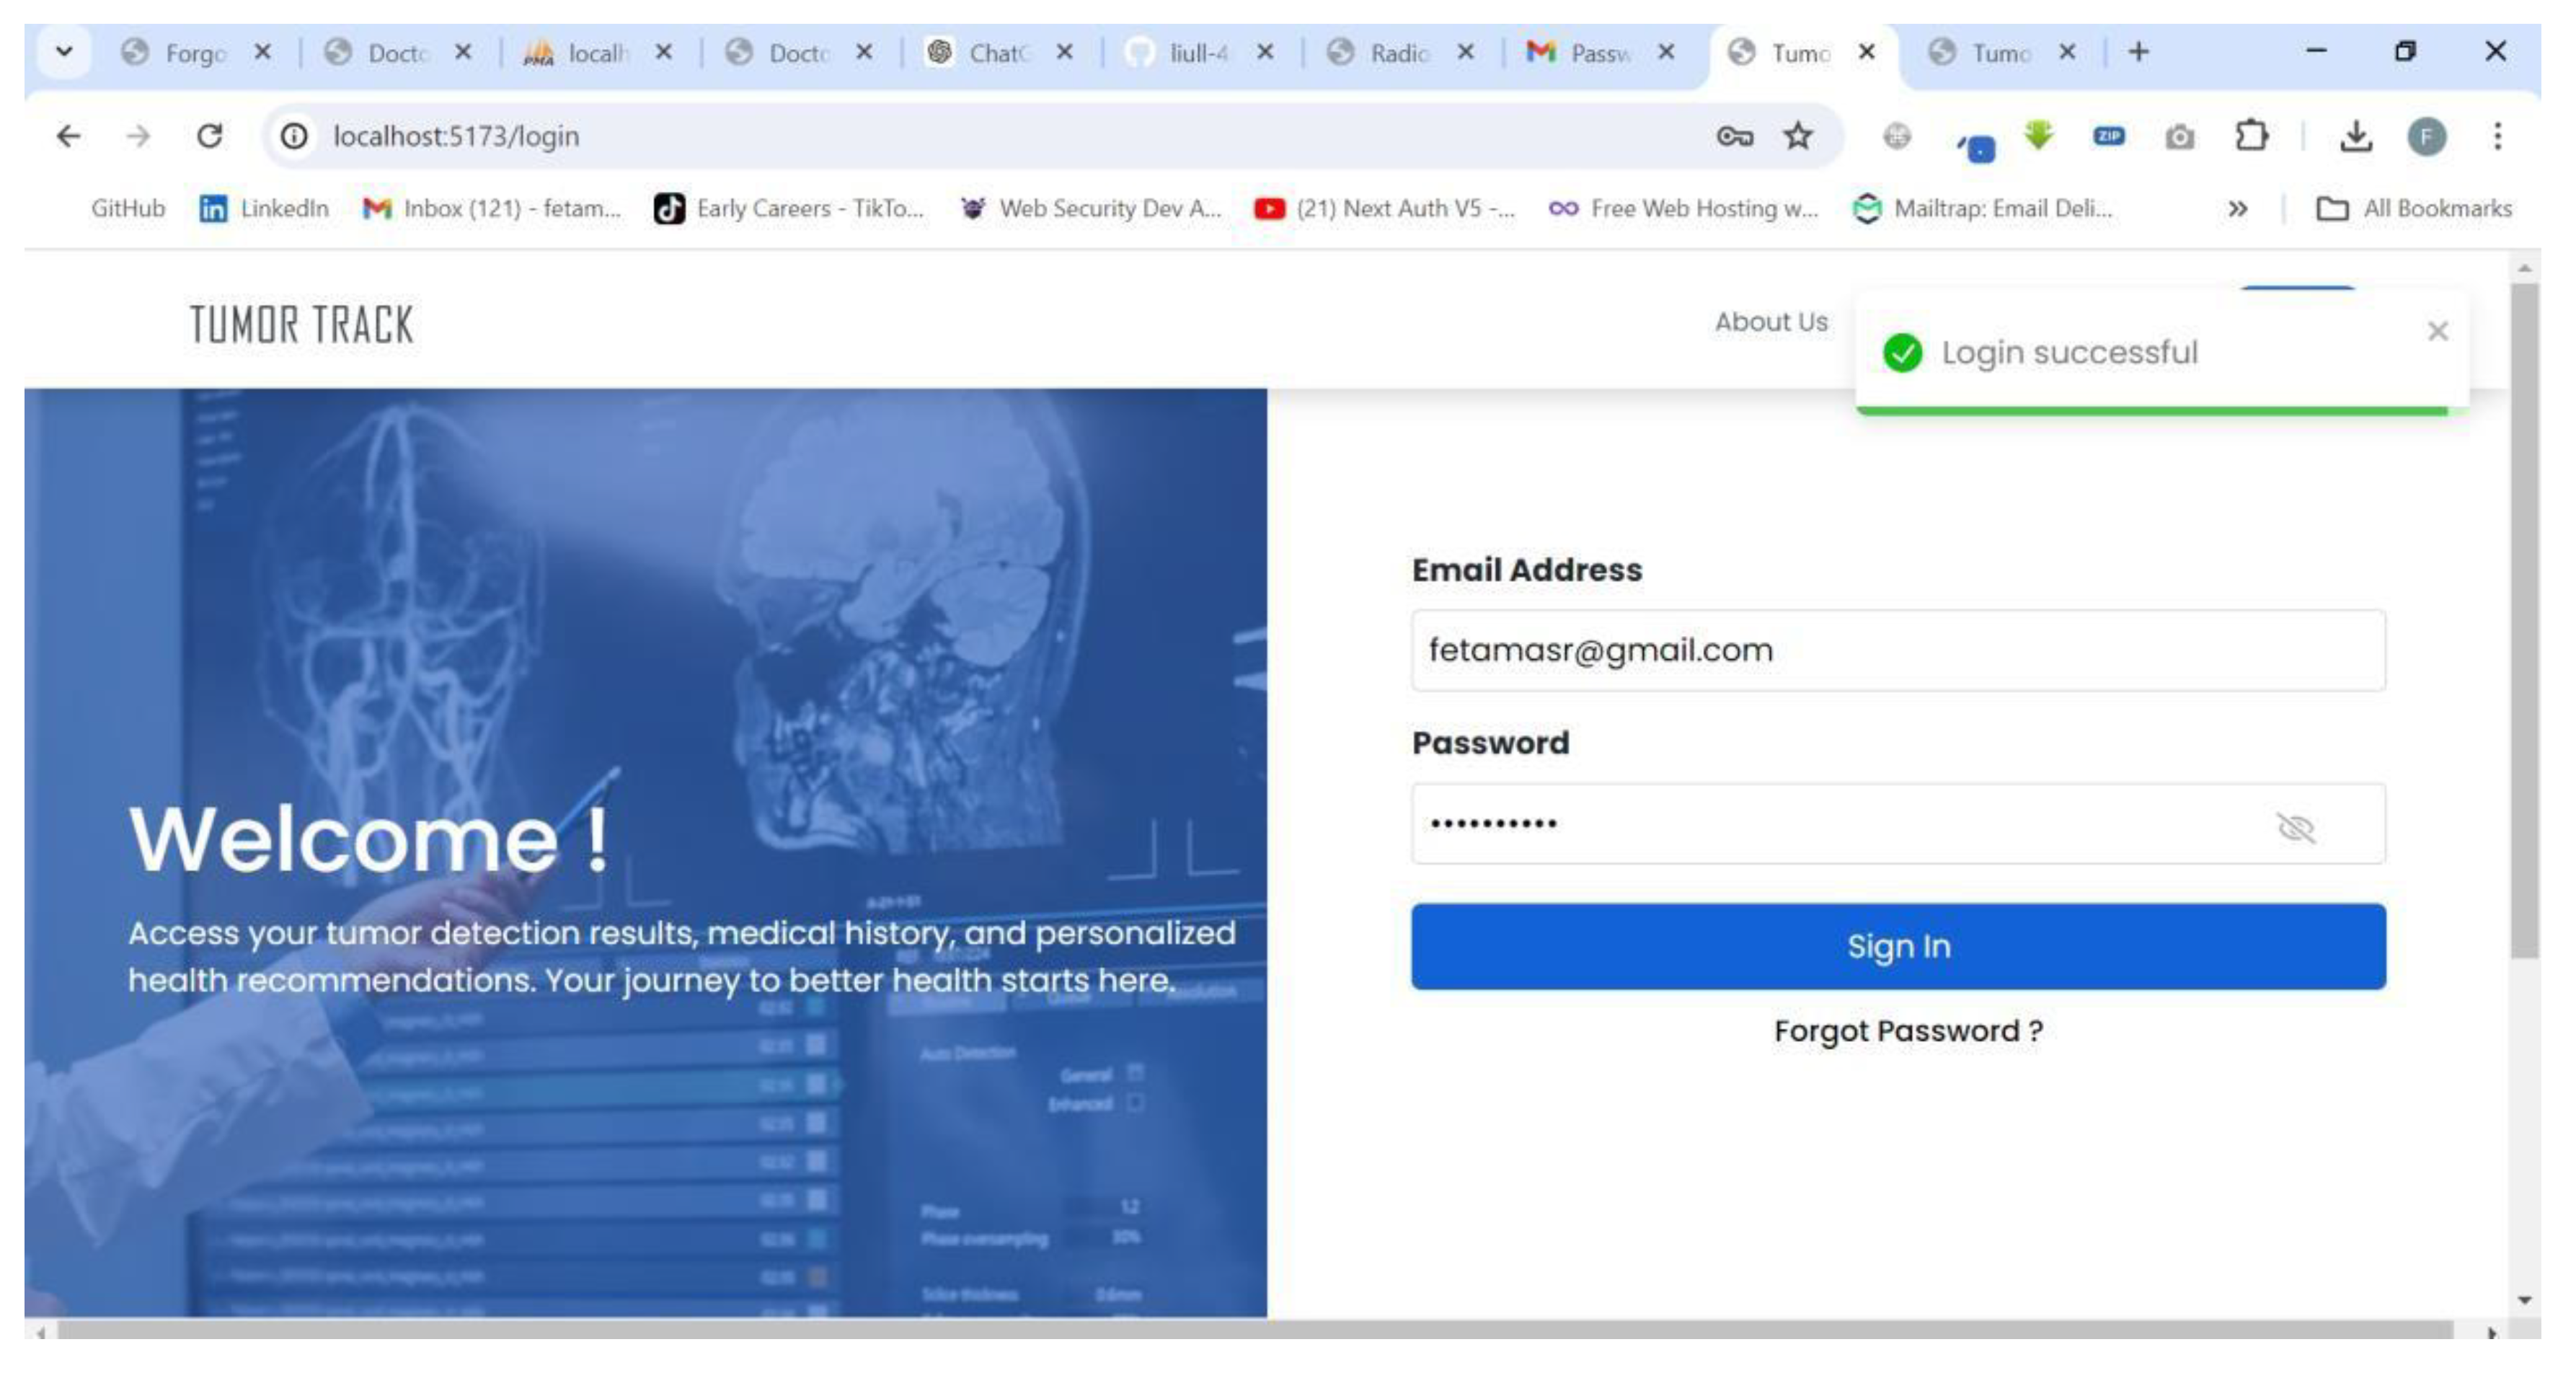
The above diagrams show how any user (patients, medical receptionists, doctors, radiologists and specialists) can recover forgotten password to login and access their accounts. This test also ended successfully without any issues.
So all the tests show that the web application is functioning properly and there are no significant problems or delays noticed when testing the system.
4.3.2. AI model Testing and Evaluation
4.3.2.1. Evaluation Metrics for Classification Model (ResNet 50)
The model was evaluated using accuracy, precision, F1 score AUC and Sensitivity metrics for the classification of brain tumors.
Table 23.
Performance metrics and results of ResNet 50 model.
| Performance Metrics | Results |
|---|---|
| Test Accuracy | 98.86% |
| Precision | 99.00% |
| Sensitivity (Glioma) | 97% |
| Sensitivity (Meningioma) | 99% |
| Sensitivity (Pituitary) | 100% |
| Sensitivity (Normal) | 100% |
| F1-score | 99.00% |
| AUC | 1.0 |
Figure 54.
Plot of Training and Validation Accuracy.
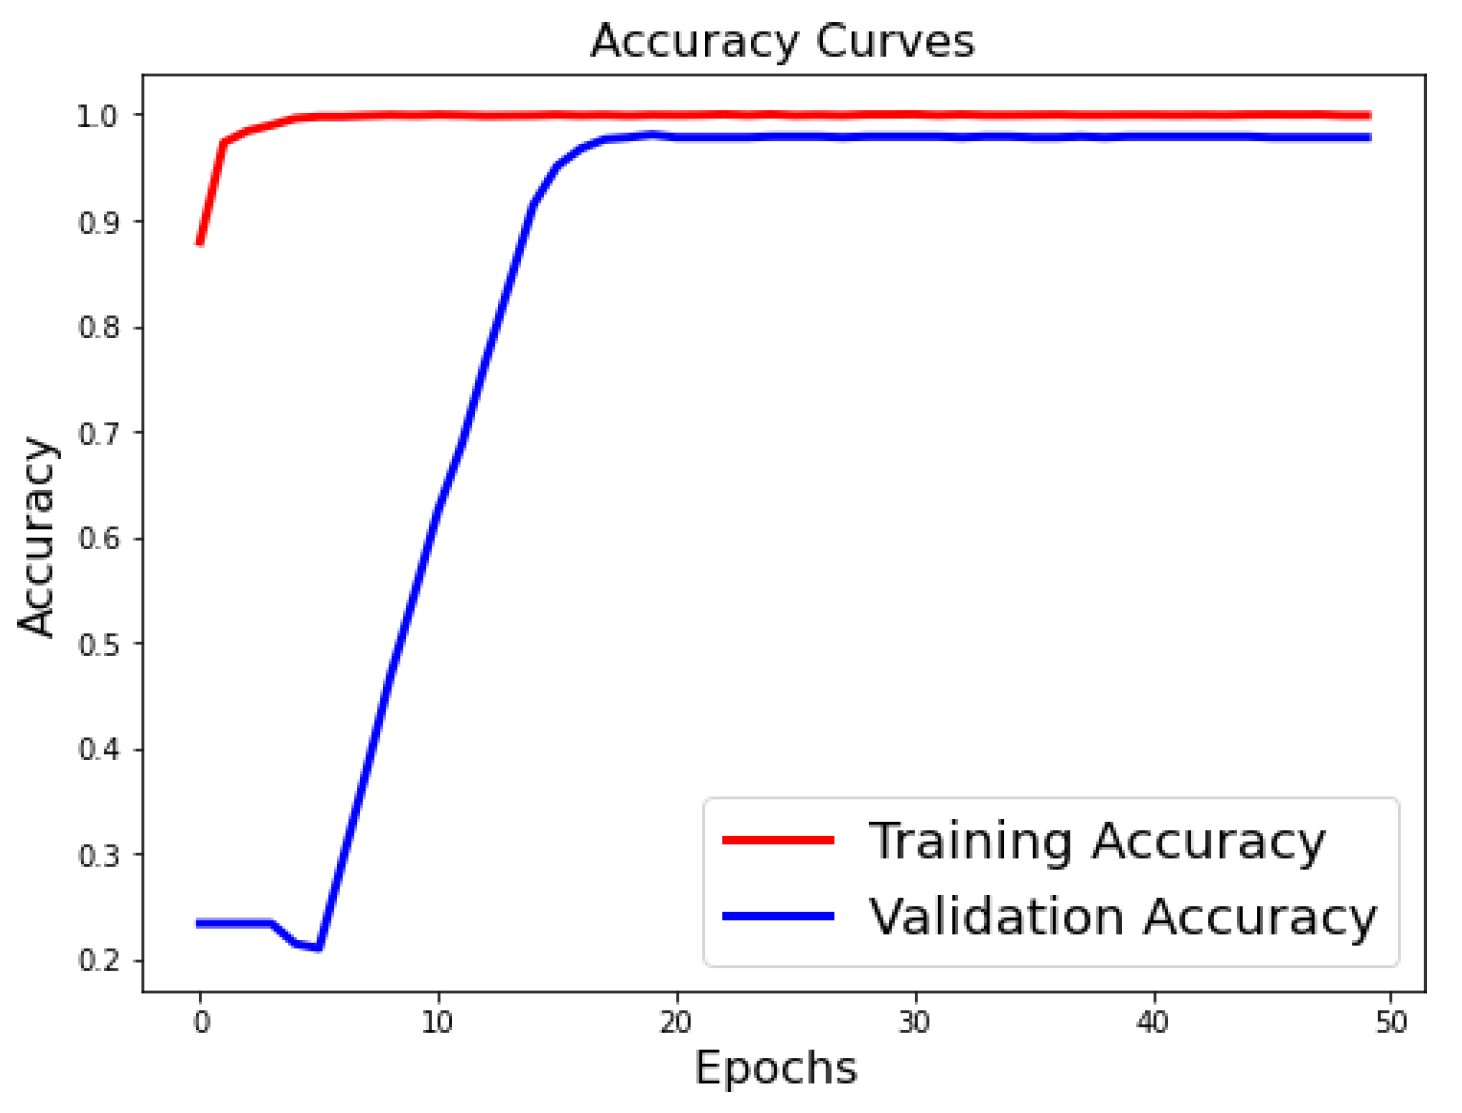
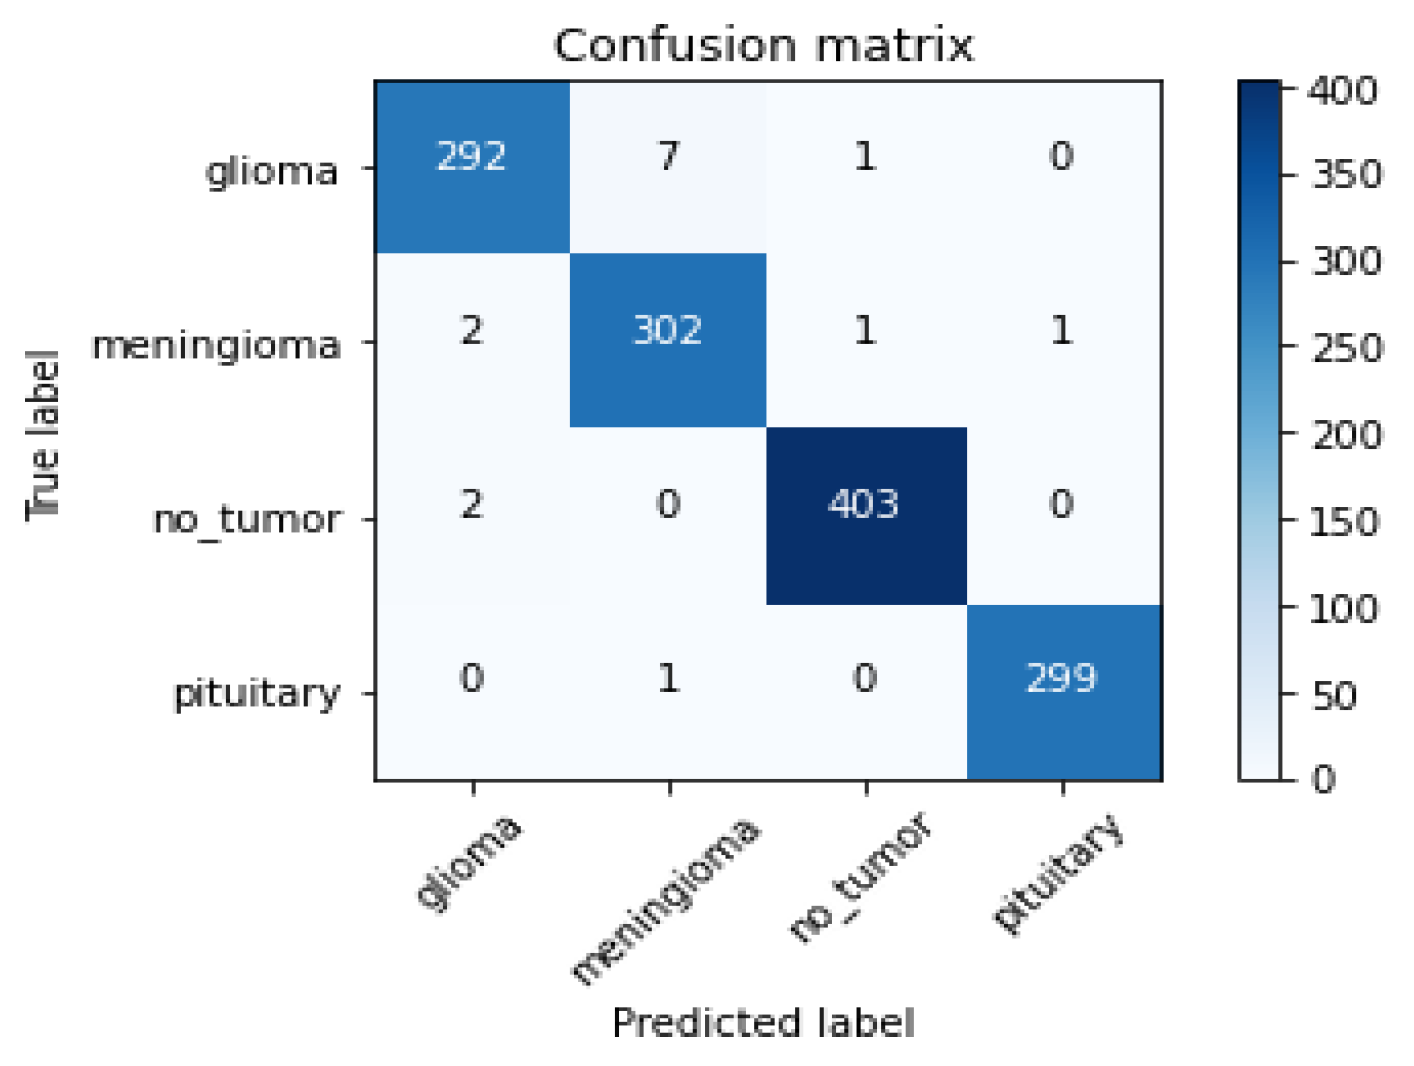
Figure 55.
Confusion Matrix.
Based on the performance metrics provided in the table, the results can be summarized as follows:
The overall test accuracy achieved was 98.86%, indicating a high level of accuracy in the classification of brain tumors and normal brain tissue. The precision of the model was also very high at 99.00%, demonstrating the model's ability to correctly identify positive cases.
The sensitivity, which measures the model's ability to correctly identify positive cases, was exceptional across the different classes. For glioma, the sensitivity was 97%, for meningioma it was 99%, and for pituitary tumors and normal brain tissue, the sensitivity was a perfect 100%.
The F1-score, which combines precision and sensitivity into a single metric, was also very high at 99.00%, further confirming the excellent performance of the model.
Finally, the area under the curve (AUC) was a perfect 1.0, indicating that the model was able to perfectly distinguish between the different classes of brain tumors and normal brain tissue.
Overall, these results demonstrate the exceptional performance of the model in accurately classifying brain tumors and normal brain tissue, with high accuracy, precision, sensitivity, and AUC. These findings suggest that the model could be a valuable tool for assisting clinicians in the diagnosis of brain tumors.
4.3.2.2. Evaluation Metrics for Segmentation Model (UNet)
The model was evaluated using metrics such as accuracy and Intersection over Union (IoU).
Table 24.
Training and Testing values of UNet.
| Metric | Training Value | Validation Value |
|---|---|---|
| Accuracy | 0.9975 | 0.9950 |
| Loss | 0.1 | 0.2 |
| IoU Metric | 0.8 | 0.6 |
Figure 56.
Accuracy, Loss and IOU metric curves of UNet model.
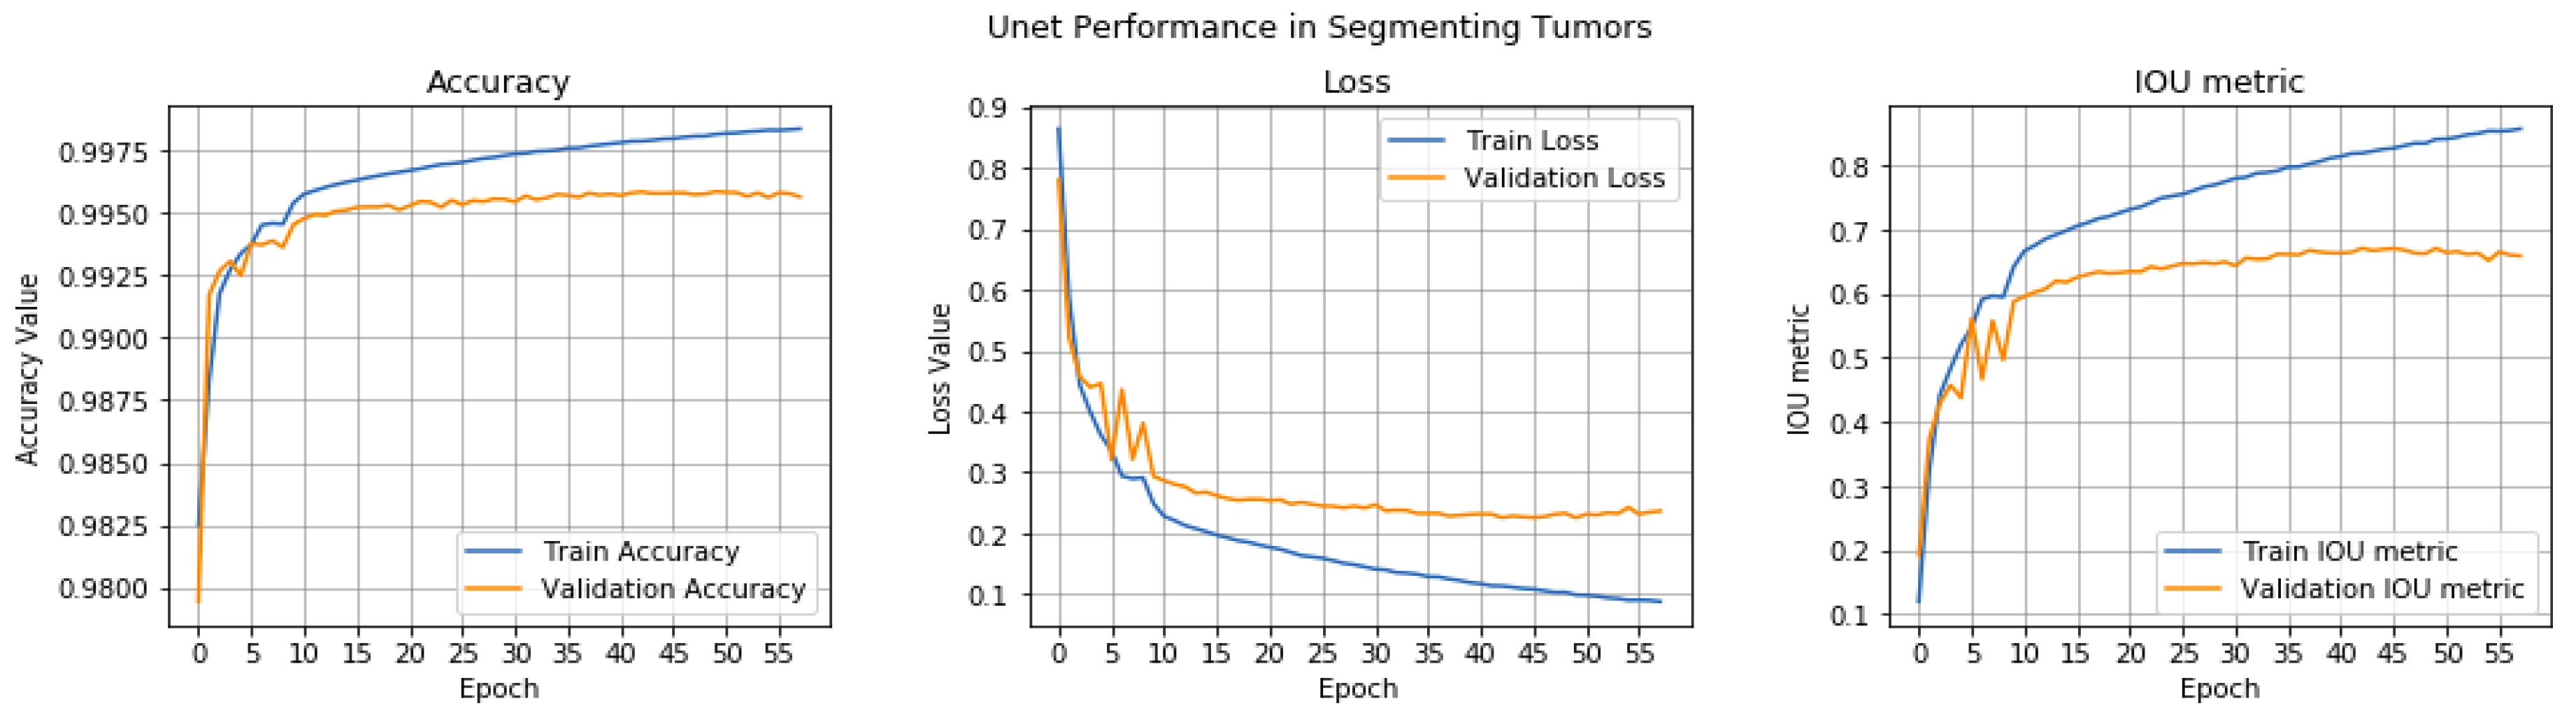
Figure 57.
Tested data with original and segmented image.
Based on the performance metrics provided in the table, the results can be summarized as follows:
The model achieved an impressive training accuracy of 0.9975, indicating that it was able to correctly classify the training samples with a very high degree of accuracy. The validation accuracy was also very high at 0.9950, demonstrating the model's ability to generalize well to unseen data.
The training loss was 0.1, which is a relatively low value, suggesting that the model was able to learn the underlying patterns in the data effectively during the training process. The validation loss was slightly higher at 0.2, but still within a reasonable range, indicating that the model was not overfitting to the training data.
The Intersection over Union (IoU) metric, which measures the overlap between the predicted and ground truth bounding boxes, was 0.8 for the training set and 0.6 for the validation set. While the training IoU was quite high, the slightly lower validation IoU suggests that there may be some room for improvement in the model's ability to accurately localize the objects of interest.
Overall, these results indicate that the model has achieved a high level of performance in terms of accuracy, loss, and IoU on both the training and validation sets. The high training and validation ac curacies, along with the relatively low training and validation losses, suggest that the model has learned the underlying patterns in the data effectively and is able to generalize well to new, unseen data.
The slightly lower validation IoU, however, suggests that there may be some room for improvement in the model's ability to accurately localize the objects of interest. This could be addressed through further optimization of the model architecture, hyper parameters, or training process.
Why is there a difference in metrics in the models?
Tumor Track is a medical web application designed to streamline patient management, diagnosis, and specialist consultations, integrating both manual inputs and an AI- based model for brain tumor classification and segmentation. The project involved the development of a web-based system that facilitates the efficient handling of patient data, MRI imaging, and medical consultations across different medical professionals.
The performance metrics commonly used for classification tasks include accuracy, precision, recall, F1-score, and AUC. These metrics focus on the model's ability to correctly identify the tumor type, which is a discrete, categorical output.
The brain tumor detection (segmentation) task involves identifying the location and boundaries of the tumor within the medical images. The performance metrics used for segmentation tasks are different, such as Intersection over Union (IoU), loss, and Accuracy. These metrics assess the spatial overlap between the predicted tumor region and the ground truth, as well as the model's ability to correctly identify the tumor pixels.
4.3.3. Integration
During the integration phase, we encountered several challenges related to version compatibility and model integration. The AI model and the web application were developed independently and integrated after both components were completed. This sequential development approach led to significant technical challenges, particularly in ensuring compatibility between the AI model and the web framework.
Version Compatibility
One of the primary challenges was version compatibility. The web framework utilized in the application was initially incompatible with the AI model. To resolve this issue, we had to downgrade the web framework to a version that was compatible with the AI model. This adjustment was necessary to ensure seamless integration and functionality of the overall system. Despite these challenges, the downgrading of the web framework allowed for successful integration, demonstrating the importance of compatibility considerations in the development and integration phases of software projects.
AI Model Integration
Another significant challenge was the integration of two AI models, ResNet 50 and UNet. Each model serves a distinct purpose, with ResNet 50 typically used for image classification and UNet for image segmentation. Combining these models into a cohesive system presented several technical difficulties:
Model Interoperability: Ensuring that the output of ResNet 50 could be effectively utilized as input for UNet required careful handling of data formats and preprocessing steps. Differences in the expected input and output shapes between the models necessitated additional preprocessing layers to facilitate smooth data flow.
Error Propagation: During the integration, slight errors were observed in the results. These errors were primarily due to the propagation of inaccuracies from the ResNet
50 model to the UNet model. Any misclassification or minor errors in feature extraction by ResNet 50 could potentially lead to amplified errors in the segmentation results produced by UNet.
Performance Optimization: The combined computational load of running both models sequentially introduced latency issues. Optimization strategies had to be implemented to ensure that the integrated models performed efficiently within the constraints of the application.
To address these challenges, several steps were taken:
Preprocessing Adjustments: Ensured compatibility in data formats and input/output shapes between the models.
Error Mitigation Techniques: Implemented error-checking mechanisms and iterative refinement processes to minimize the impact of inaccuracies from ResNet 50 on UNet.
Performance Tuning: Applied optimization techniques, such as model pruning and efficient batching, to reduce latency and improve overall performance.
These measures facilitated the successful integration of ResNet 50 and UNet, still with slight residual errors that are being continuously refined. The experience underscores the complexity of integrating multiple AI models and the importance of thorough testing and optimization in achieving accurate and efficient results.
4.4. Discussion
4.4.1. Challenges Faced
Integration of the AI Models with the web application:
Challenge: Integrating the AI-based brain tumor classification and segmentation model with the web application posed significant technical challenges, including ensuring compatibility between the AI model and the web framework.
Solution: Extensive testing and fine-tuning were performed to ensure seamless integration and accurate results. The AI model was wrapped in an API that the web application could call upon for processing MRI images.
Data Privacy and Security:
Challenge: Handling sensitive medical data required strict adherence to data privacy regulations and implementation of robust security measures.
Solution: Encryption protocols were employed for data storage and transmission. User authentication and role-based access control were implemented to ensure that only authorized personnel could access specific data.
User Interface Design:
Challenge: Designing an intuitive and user-friendly interface for a diverse user base (doctors, radiologists, specialists, medical receptionists, and patients) was challenging.
Solution: Multiple iterations of user interface (UI) designs were tested with feedback from our advisor and professionals. A clean, responsive design was adopted to ensure ease of use across various devices.
Scalability and Performance:
Challenge: Ensuring the system could handle a high volume of simultaneous users and large MRI image files without performance degradation.
Solution: The system architecture was optimized for scalability, using load balancing and efficient database queries. Performance testing was conducted to identify and address bottlenecks.
4.4.2. Expenses
In the course of this project, one of the key expenses incurred was the $10 spent on a Google Colab Pro subscription. This investment in the advanced computational resources provided by Google Colab Pro played a crucial role in the successful development and training of the deep learning model.
The Google Colab Pro subscription granted us access to enhanced GPU and TPU capabilities, allowing us to leverage the powerful hardware resources necessary for training complex deep learning models. This enabled us to expedite the training process, explore more sophisticated model architectures, and fine-tune the hyper parameters with greater efficiency. The increased computational power provided by the Pro subscription was instrumental in achieving the high levels of accuracy, precision, and sensitivity reported in the results.
Moreover, the Google Colab Pro environment offered a seamless and collaborative platform for our team to work on the project. The ability to easily share notebooks, access pre-trained models, and leverage a wide range of deep learning libraries and frameworks streamlined the development workflow, enhancing our productivity and enabling us to focus on the core research and innovation aspects of the project.
4.4.3. Contributions
Efficient Patient Management:
The system facilitates seamless creation and management of patient accounts, streamlining administrative processes and reducing paperwork.
Integrated Diagnostic Workflow:
The integration of diagnostic workflows within the system allows doctors to document patient history, make initial diagnoses, and refer patients for MRI scans and specialist consultations efficiently.
AI-Powered Diagnosis:
The incorporation of an AI model for brain tumor classification and segmentation aids medical professionals in making more accurate diagnoses, thereby potentially improving patient outcomes.
Secure and Accessible Data:
The system ensures that patient data is securely stored and accessible only to authorized personnel, maintaining patient confidentiality and data integrity.
4.4.4. Limitations
AI Model Reliability:
The accuracy of the AI model is dependent on the quality and diversity of the training data. In cases where the model encounters rare or atypical tumor presentations, its reliability may be compromised.
User Training Requirements:
Medical professionals may require training to effectively use the system and interpret AI-generated results, which could slow down the initial adoption rate.
Internet Dependency:
The system's reliance on internet connectivity could be a limitation in regions with unstable internet access, potentially hindering its usability in such areas.
The development of the Tumor Track web application has successfully created a comprehensive system for managing and diagnosing brain tumors, integrating AI to support medical professionals. Despite facing challenges such as AI integration and data security, the project will make significant contributions towards efficient patient management and accurate diagnostics. The next section will conclude what has been discussed so far and discuss what future directions might look like.
Chapter Five Conclusion and Recommendation
The findings of this project have significant implications for our understanding of Tumor Track web application. This section will delve deeper into the conclusion, exploring the theoretical and practical implications of the project's outcomes. Additionally, this section will provide recommendations for future research and practical applications, with the goal of advancing our knowledge and addressing the challenges associated with Tumor Track web application.
5.1. Conclusion
In this project, we have demonstrated the potential of deep learning-based methods for brain tumor detection and patient follow-up. Tumor Track web application uses the strengths of convolutional neural networks (CNNs) to accurately detect brain tumors and track patient outcomes. The results of our project show that we can achieve high accuracy in detecting brain tumors, with an average accuracy of 99.75.
This technological innovation not only reduces the time and subjectivity associated with manual image interpretation but also ensures more reliable and consistent diagnostic outcomes. Furthermore, the streamlined patient follow-up system embedded within this approach has facilitated improved communication between healthcare providers and patients, contributing to more timely and effective care. Overall, the high accuracy achieved in this project underscores the potential of deep learning technologies to revolutionize tumor diagnostics and patient management, paving the way for better healthcare outcomes.
In conclusion, Tumor Track is a powerful tool for brain tumor detection and patient follow-up. It has the potential to revolutionize the field of neuroimaging and improve patient outcomes. We believe that this web application will be a valuable tool for clinicians and researchers in the future.
5.2. Recommendation
We recommend that healthcare institutions adopt and integrate this advanced technology into their diagnostic and patient management routine because by leveraging deep learning algorithms, the system can significantly reduce the time and subjectivity associated with manual image interpretation, increasing the precision and
Chapter Five: Conclusion and Recommendation
accuracy in detecting tumors, including small and early-stage ones. Furthermore, the integration of a streamlined patient follow-up system can facilitate timely and effective communication between healthcare providers and patients, ensuring better adherence to treatment plans and improving overall healthcare outcomes. We also recommend that institutions invest in training for medical staff to effectively utilize these new technologies and ensure comprehensive data integration to maximize the benefits of this innovative approach.
5.3. Future Directions
Restructuring the web application:
Restructuring the Tumor Track web application to enable hierarchical registration, where clinics and hospitals register first, followed by doctors and medical receptionists under their respective institutions, and patients under their specific clinic or hospital.
Enhancing AI Capabilities:
Continuous improvement of the AI model by incorporating larger and more diverse datasets will enhance its accuracy and reliability. Collaboration with medical institutions for real-time data updates and model training is planned.
Mobile Application Development:
Developing a mobile application to complement the web-based system would provide greater accessibility for users, allowing them to manage tasks on-the-go.
Telemedicine Integration:
Integrating telemedicine functionalities to facilitate remote consultations and diagnoses, particularly beneficial in the context of the ongoing global health challenges.
Multi-Language Support:
Expanding the system to support multiple languages will make it accessible to a broader range of users globally, addressing language barriers in medical consultations.
Acknowledgment
I would like to express my deepest gratitude to my advisor, Dr. Ashenafi, for his invaluable guidance, unwavering support, and mentorship throughout my final year project. His expertise, encouragement, and dedication have been instrumental in shaping my academic and personal growth. I am truly grateful for his patience, wisdom, and commitment to excellence. I extend my heartfelt thanks for his continuous encouragement, insightful feedback, and belief in my abilities. I am honored to have had the opportunity to work under his supervision, and I am immensely grateful for his mentorship. Thank you, Dr. Ashenafi, for being an exceptional mentor and for inspiring me to strive for excellence in all aspects of my academic journey.
Appendix A
ResNet 50 model Data-set Source: https://figshare.com/articles/data-set/brain_tumor_data-set/1512427/5
UNet model Data-set Source: https://figshare.com/articles/data-set/brain_tumor_data-set/1512427/5
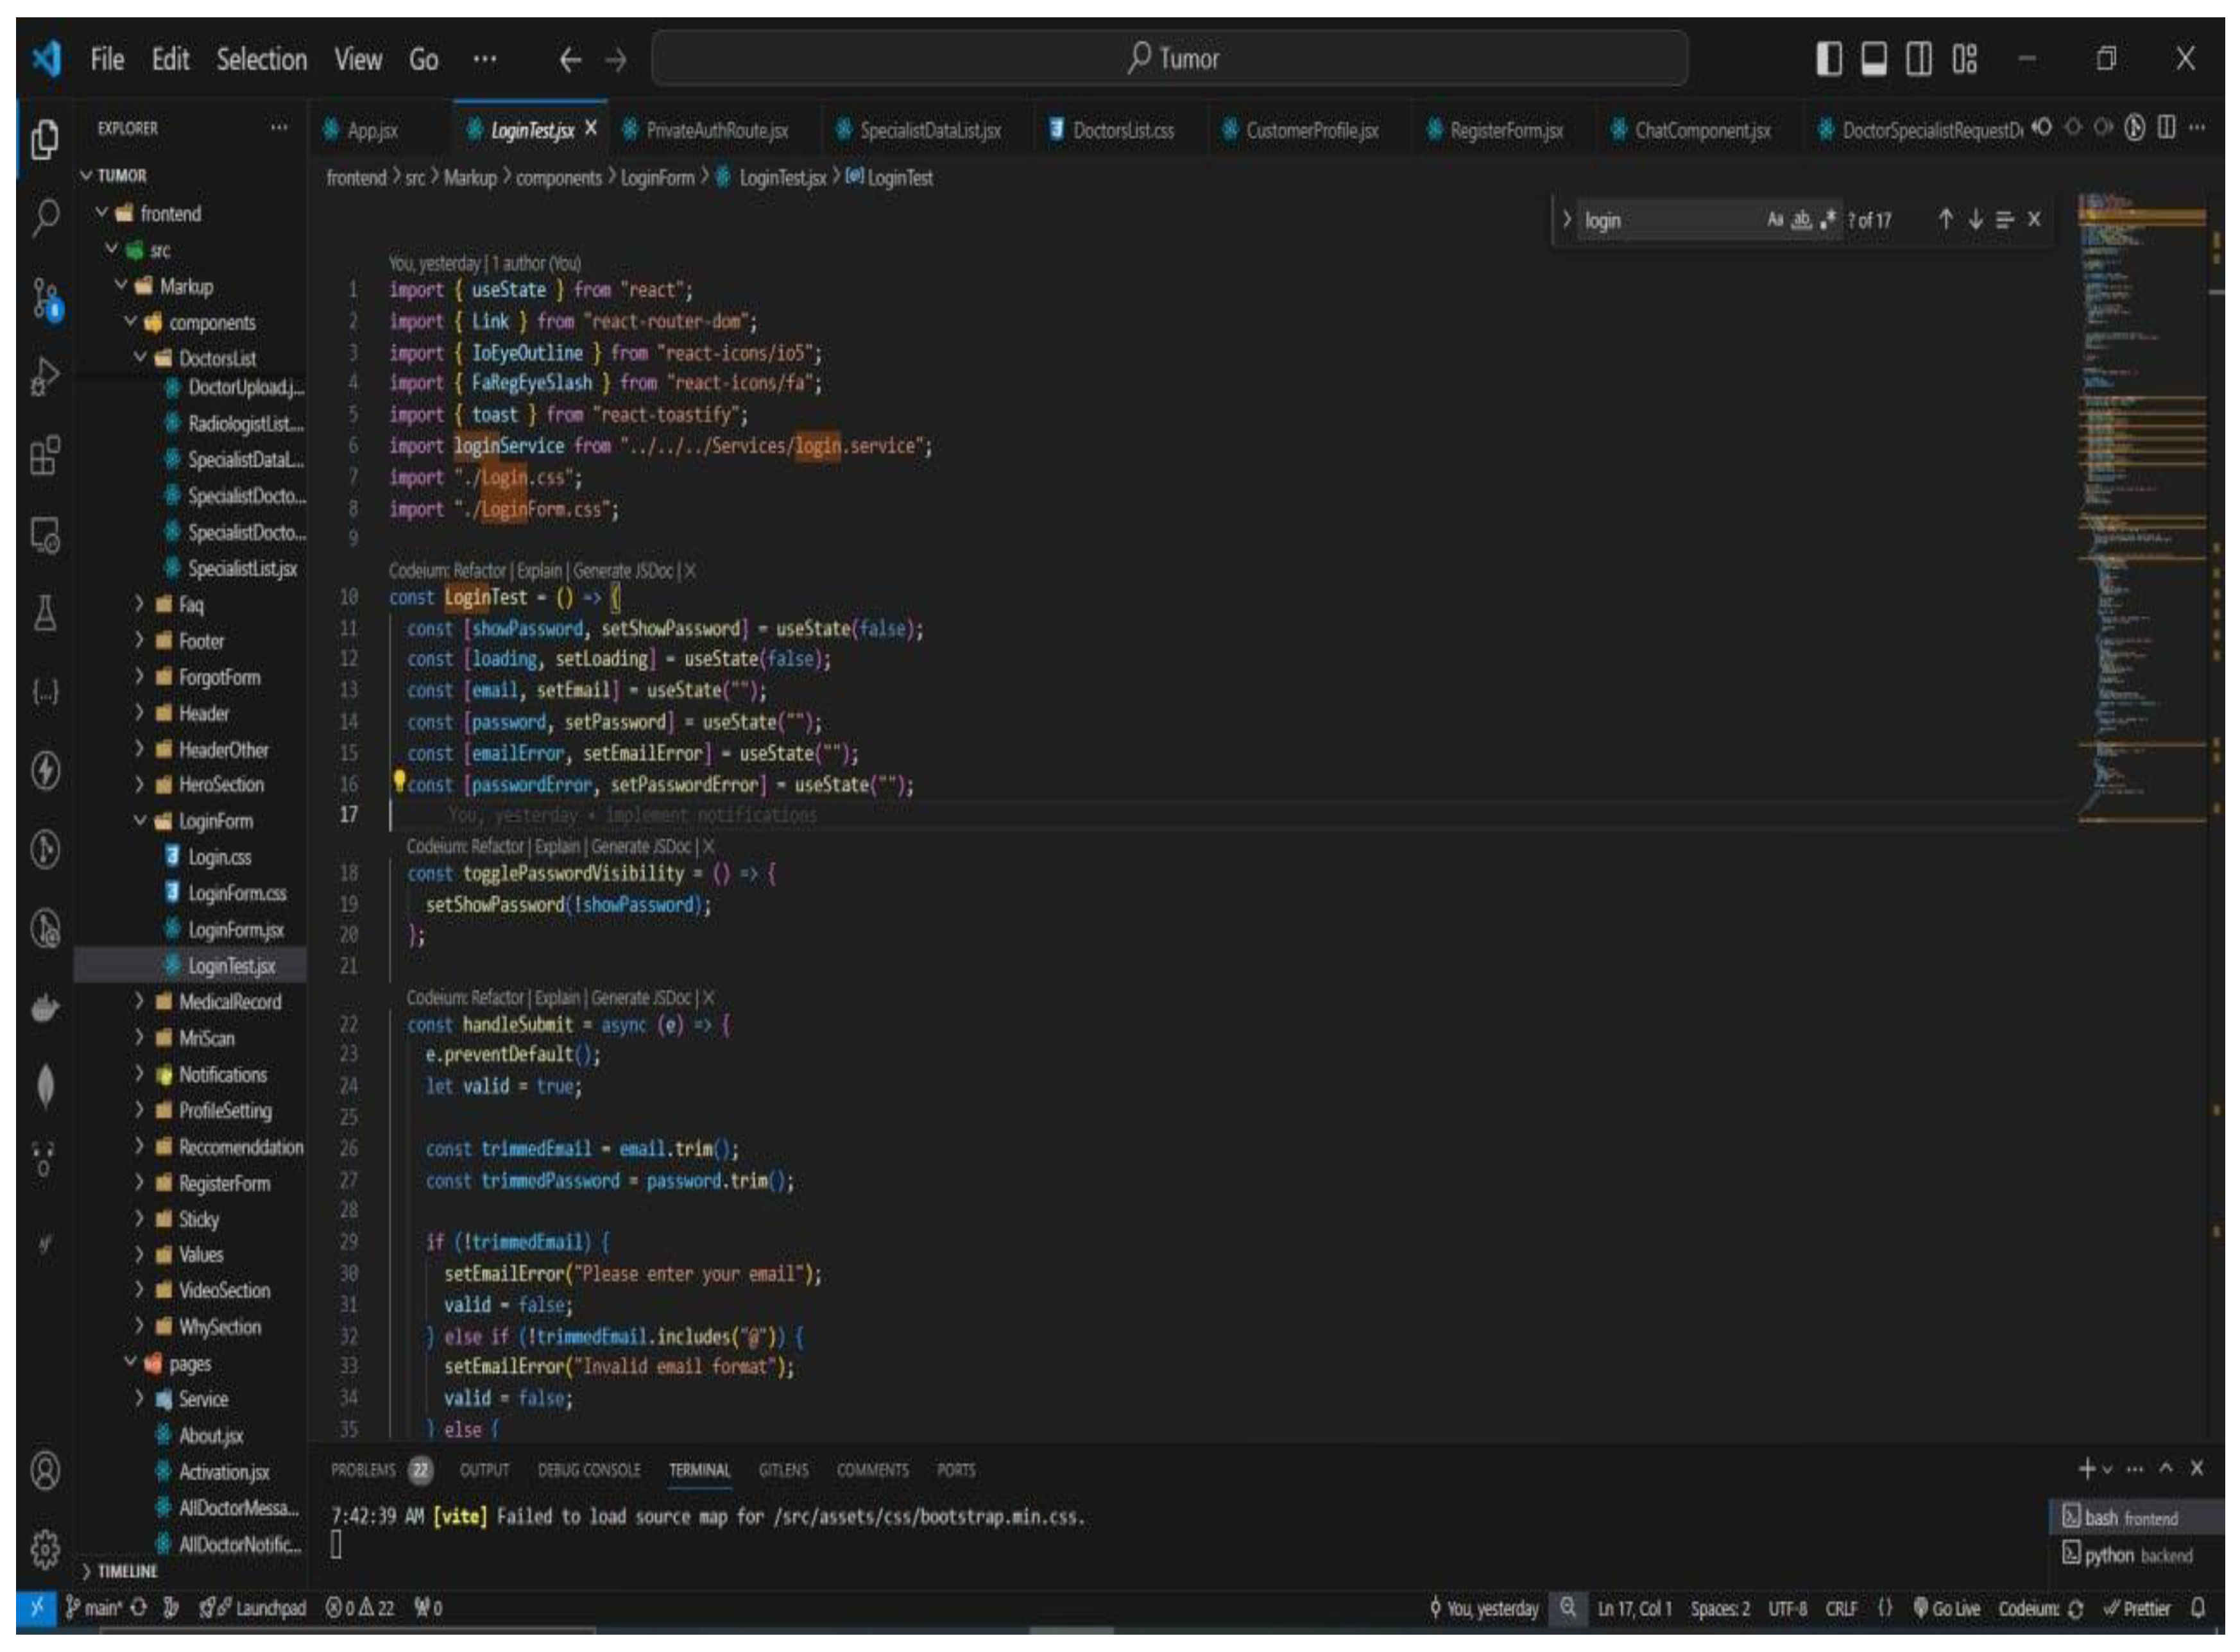
Frontend sample code:
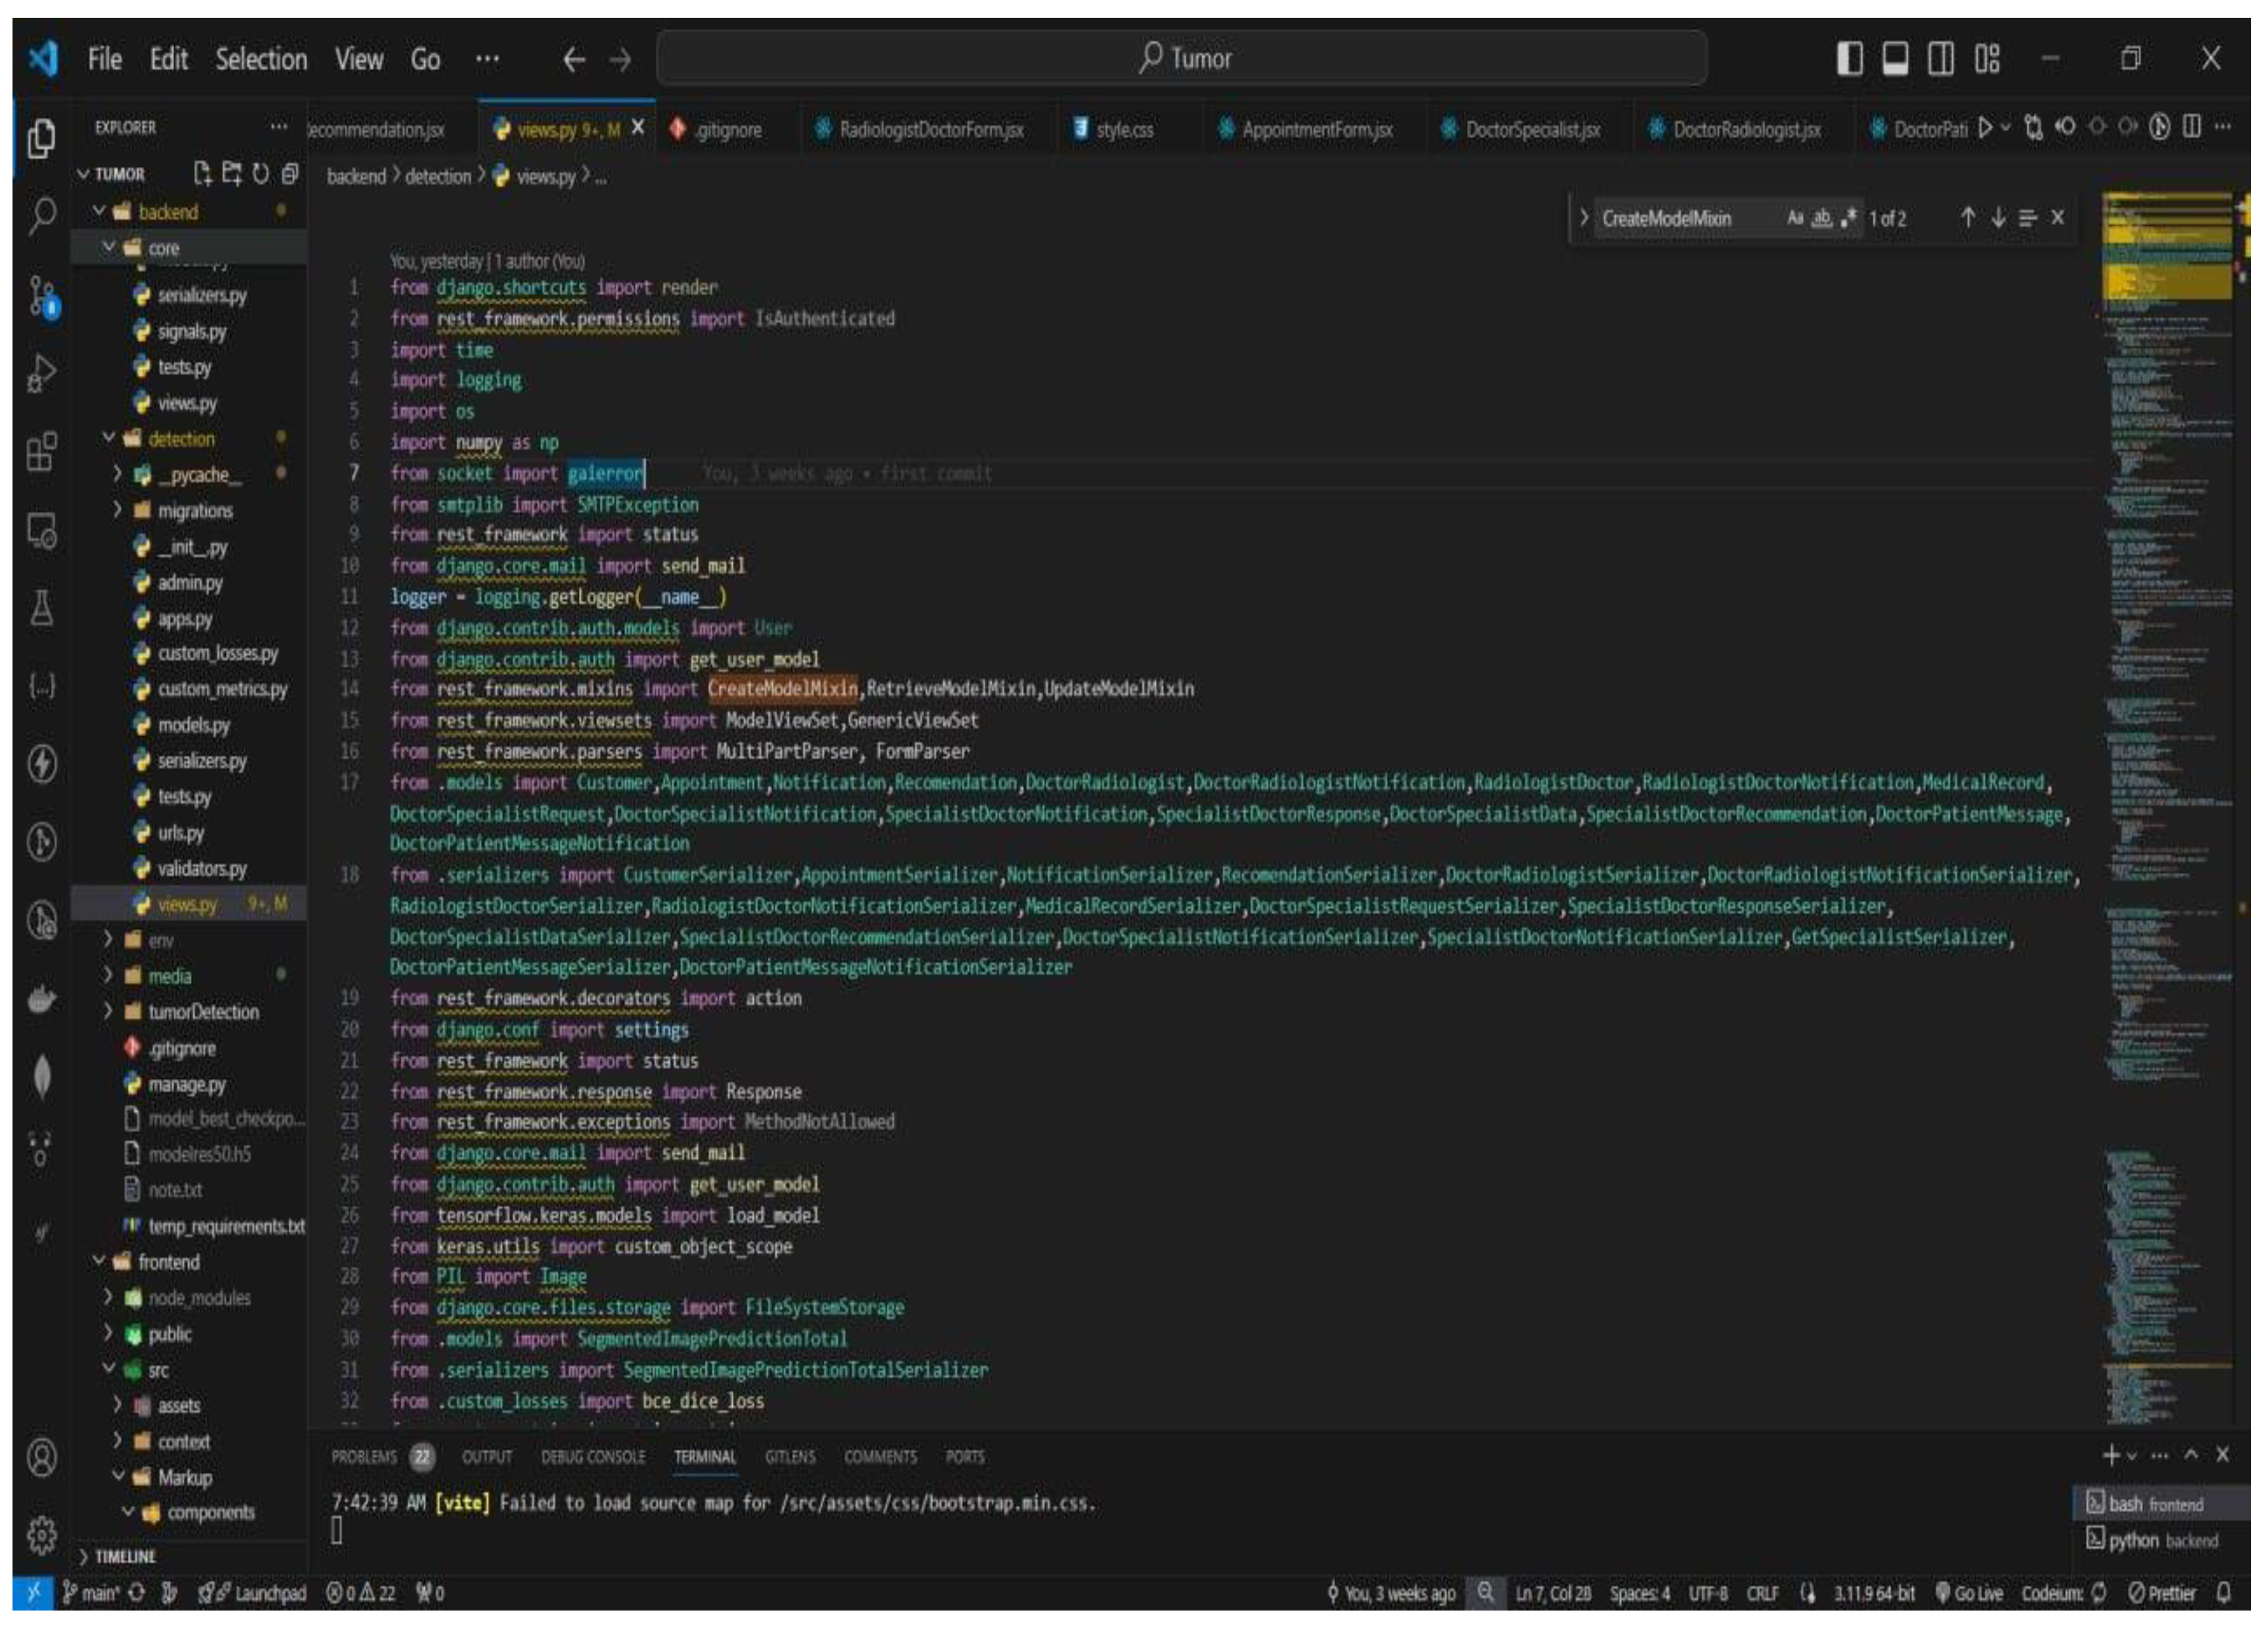
- Backend sample code:
ResNet 50 model sample code:
UNet model sample code:
Appendix B
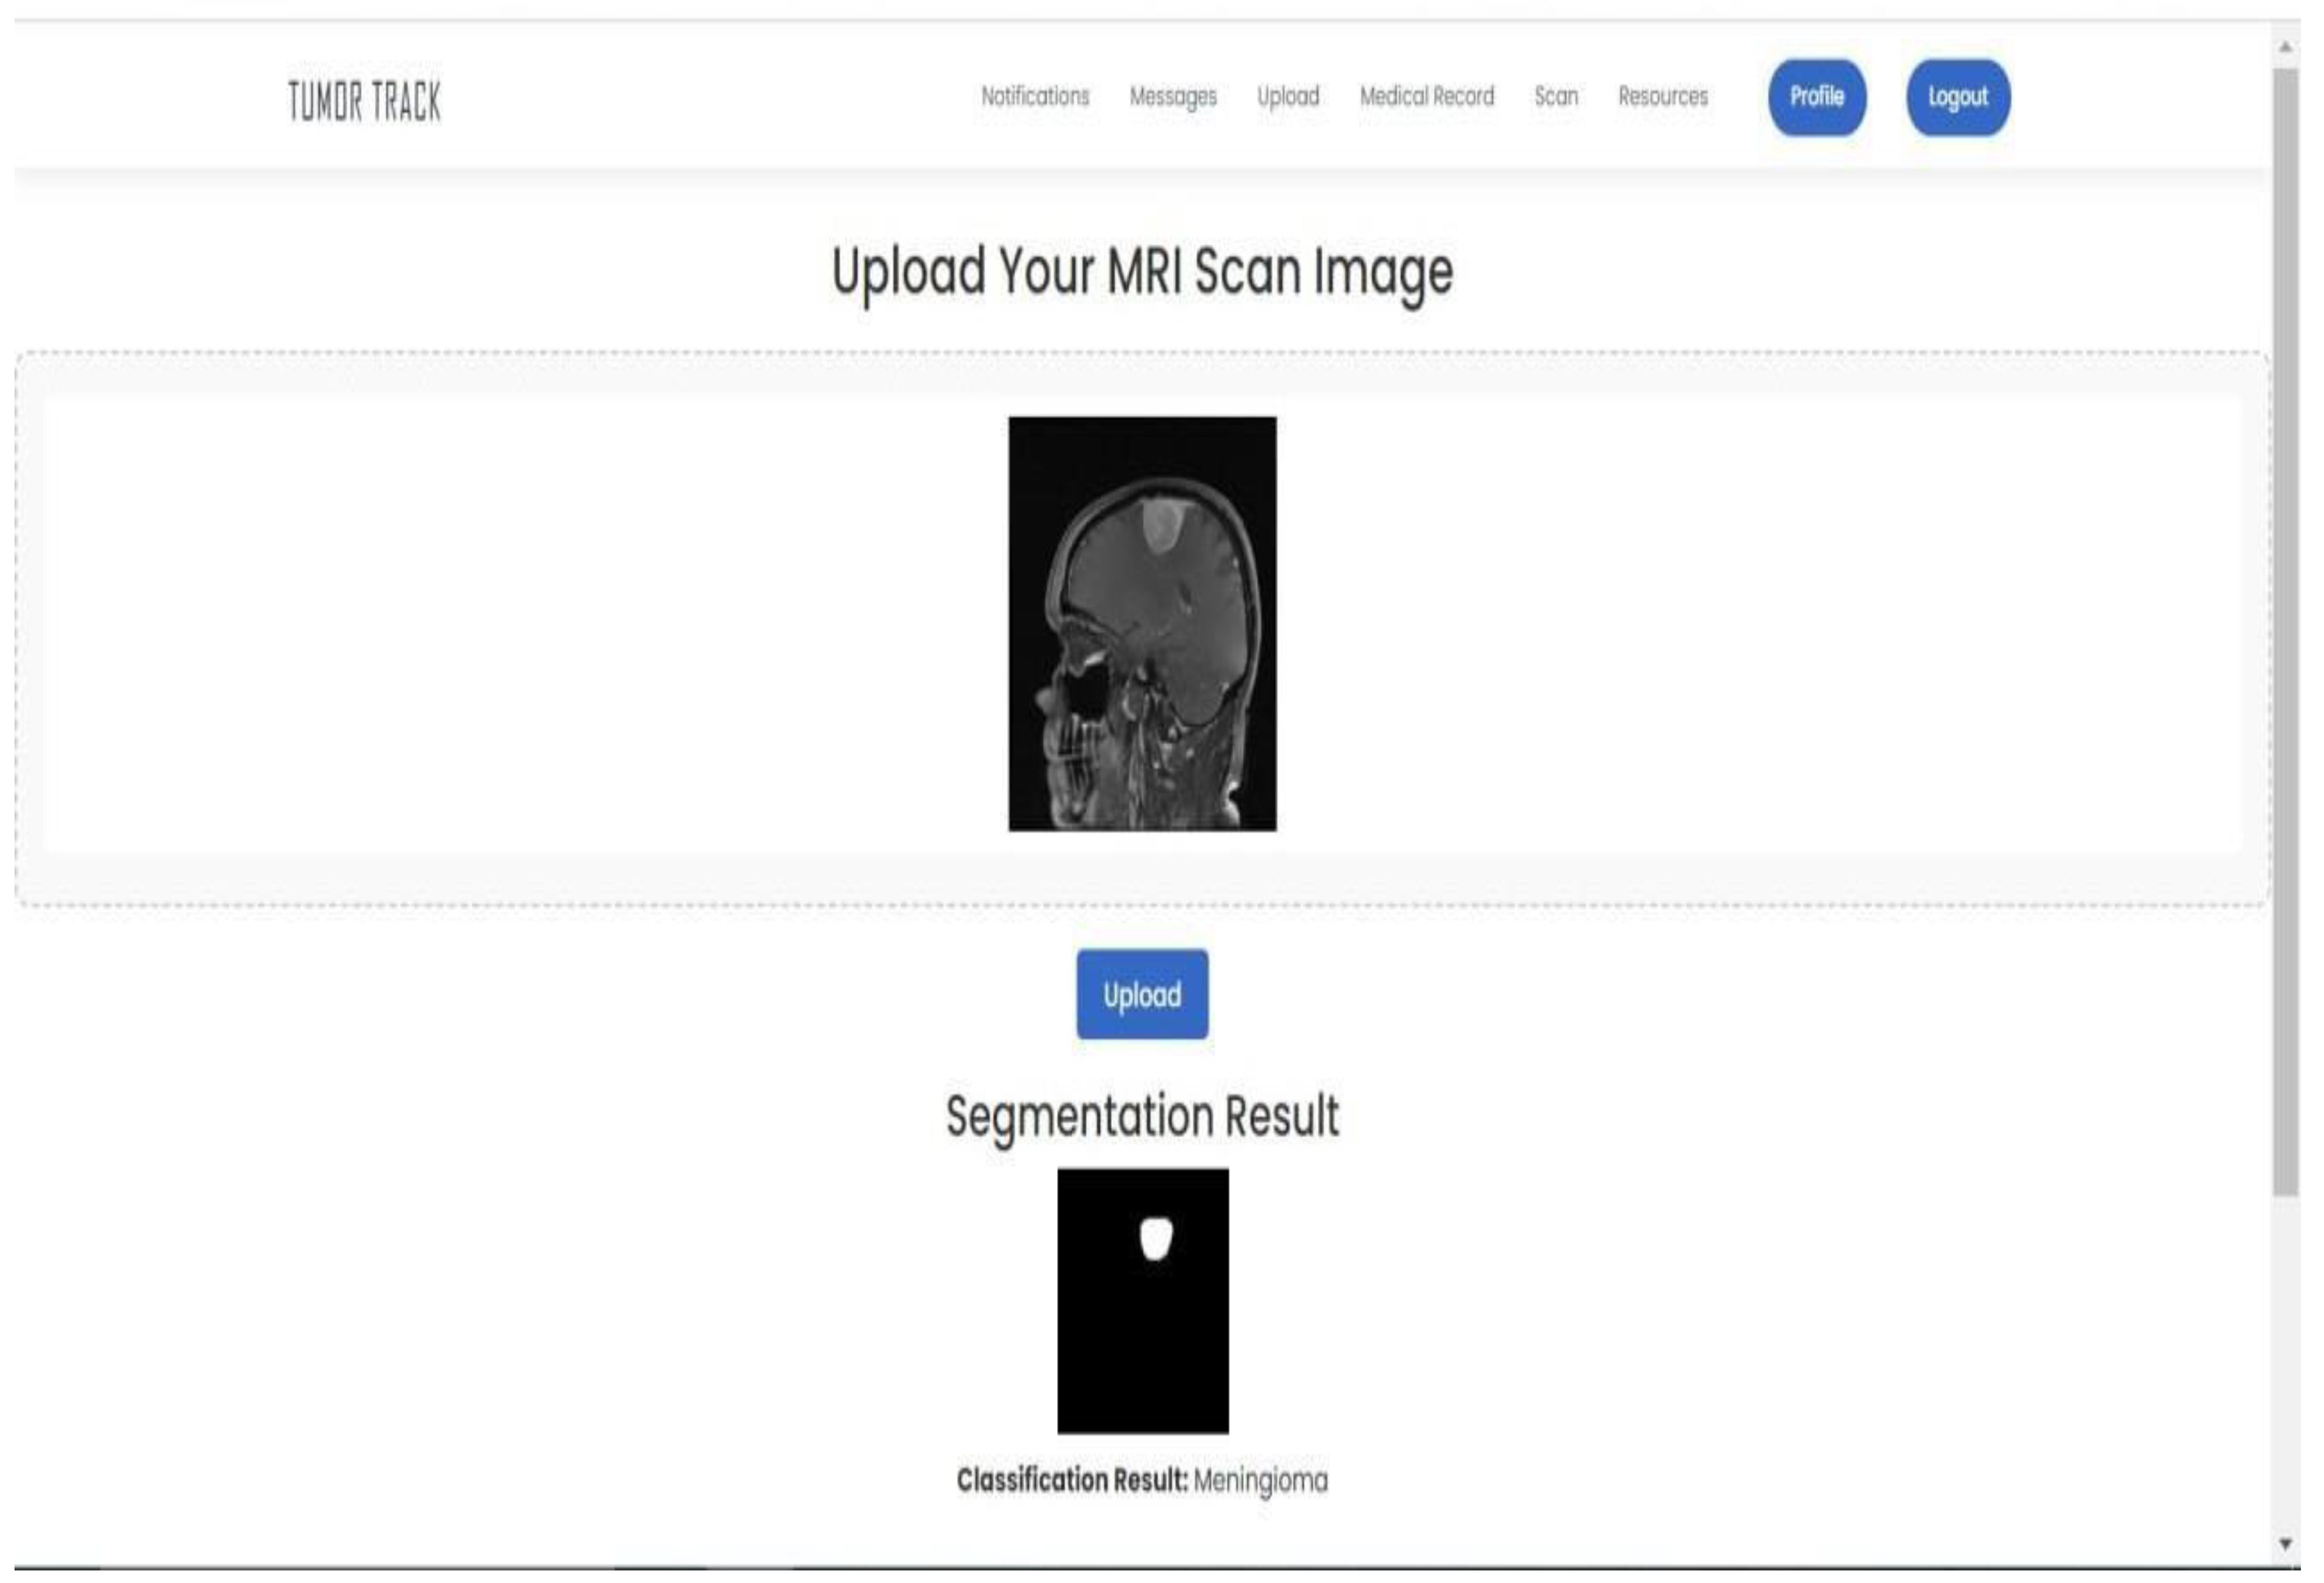
Sample output 1 (Meningioma):
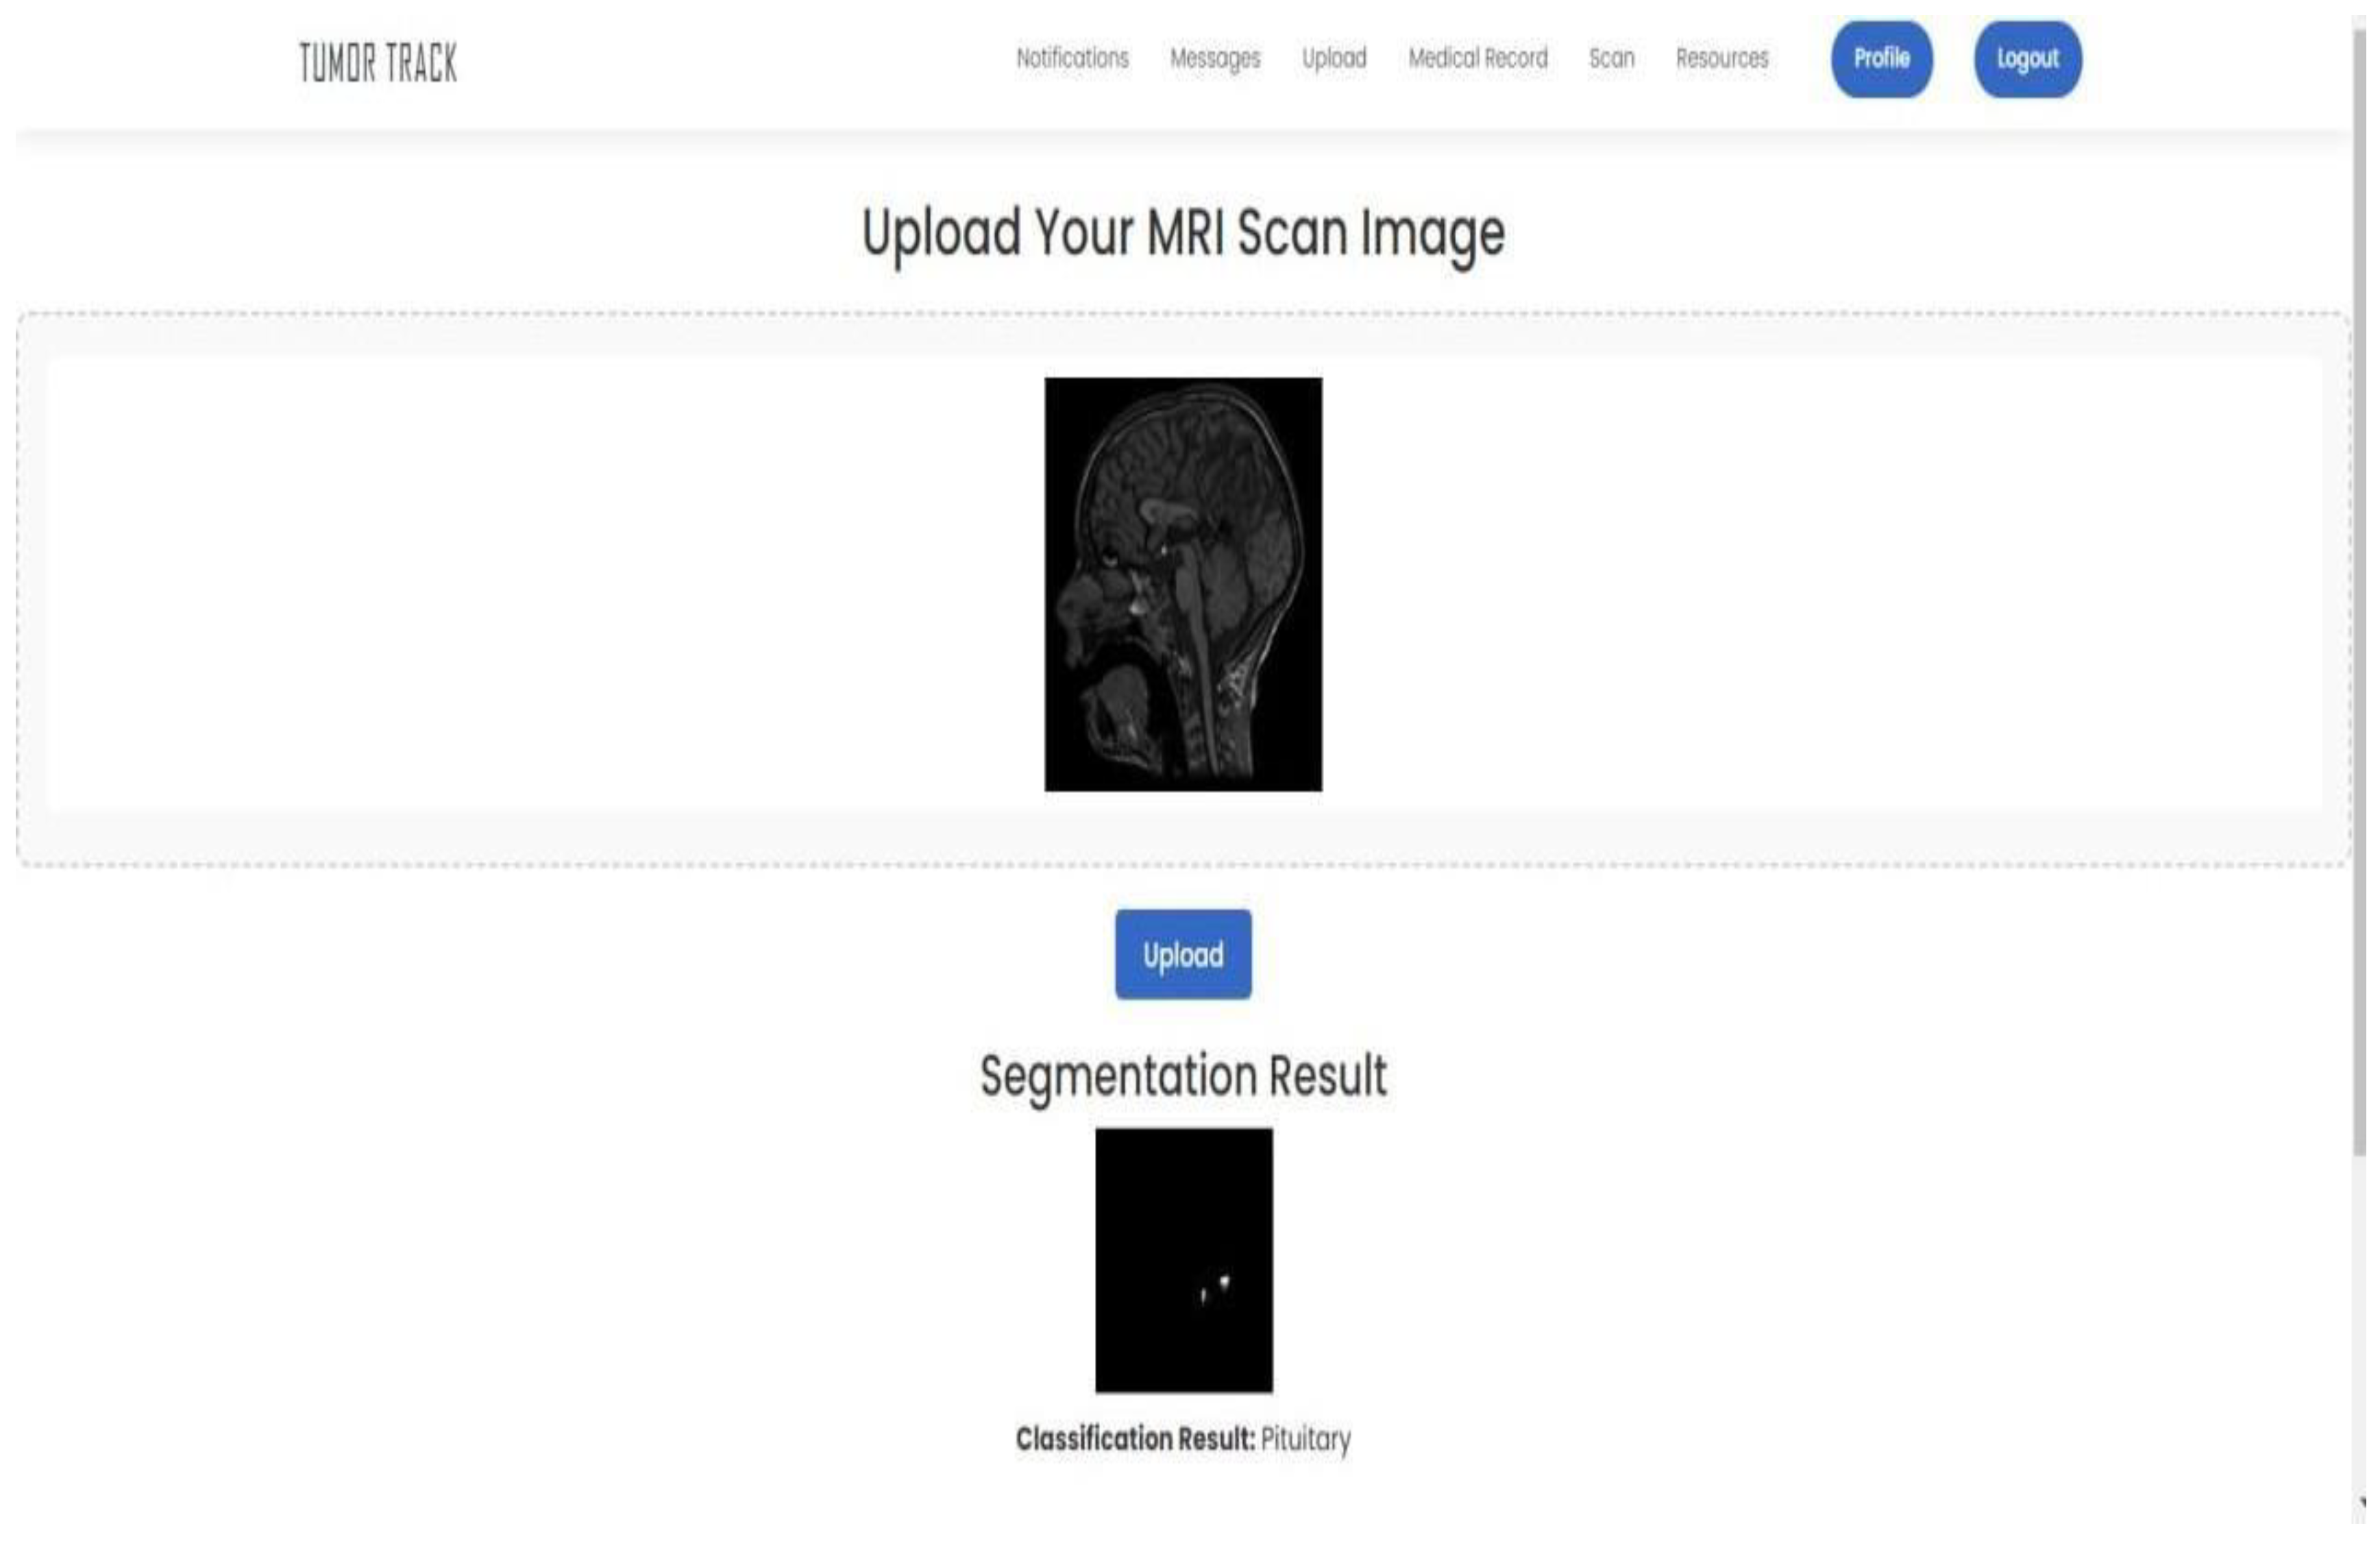
Sample output 2 (Pituitary):
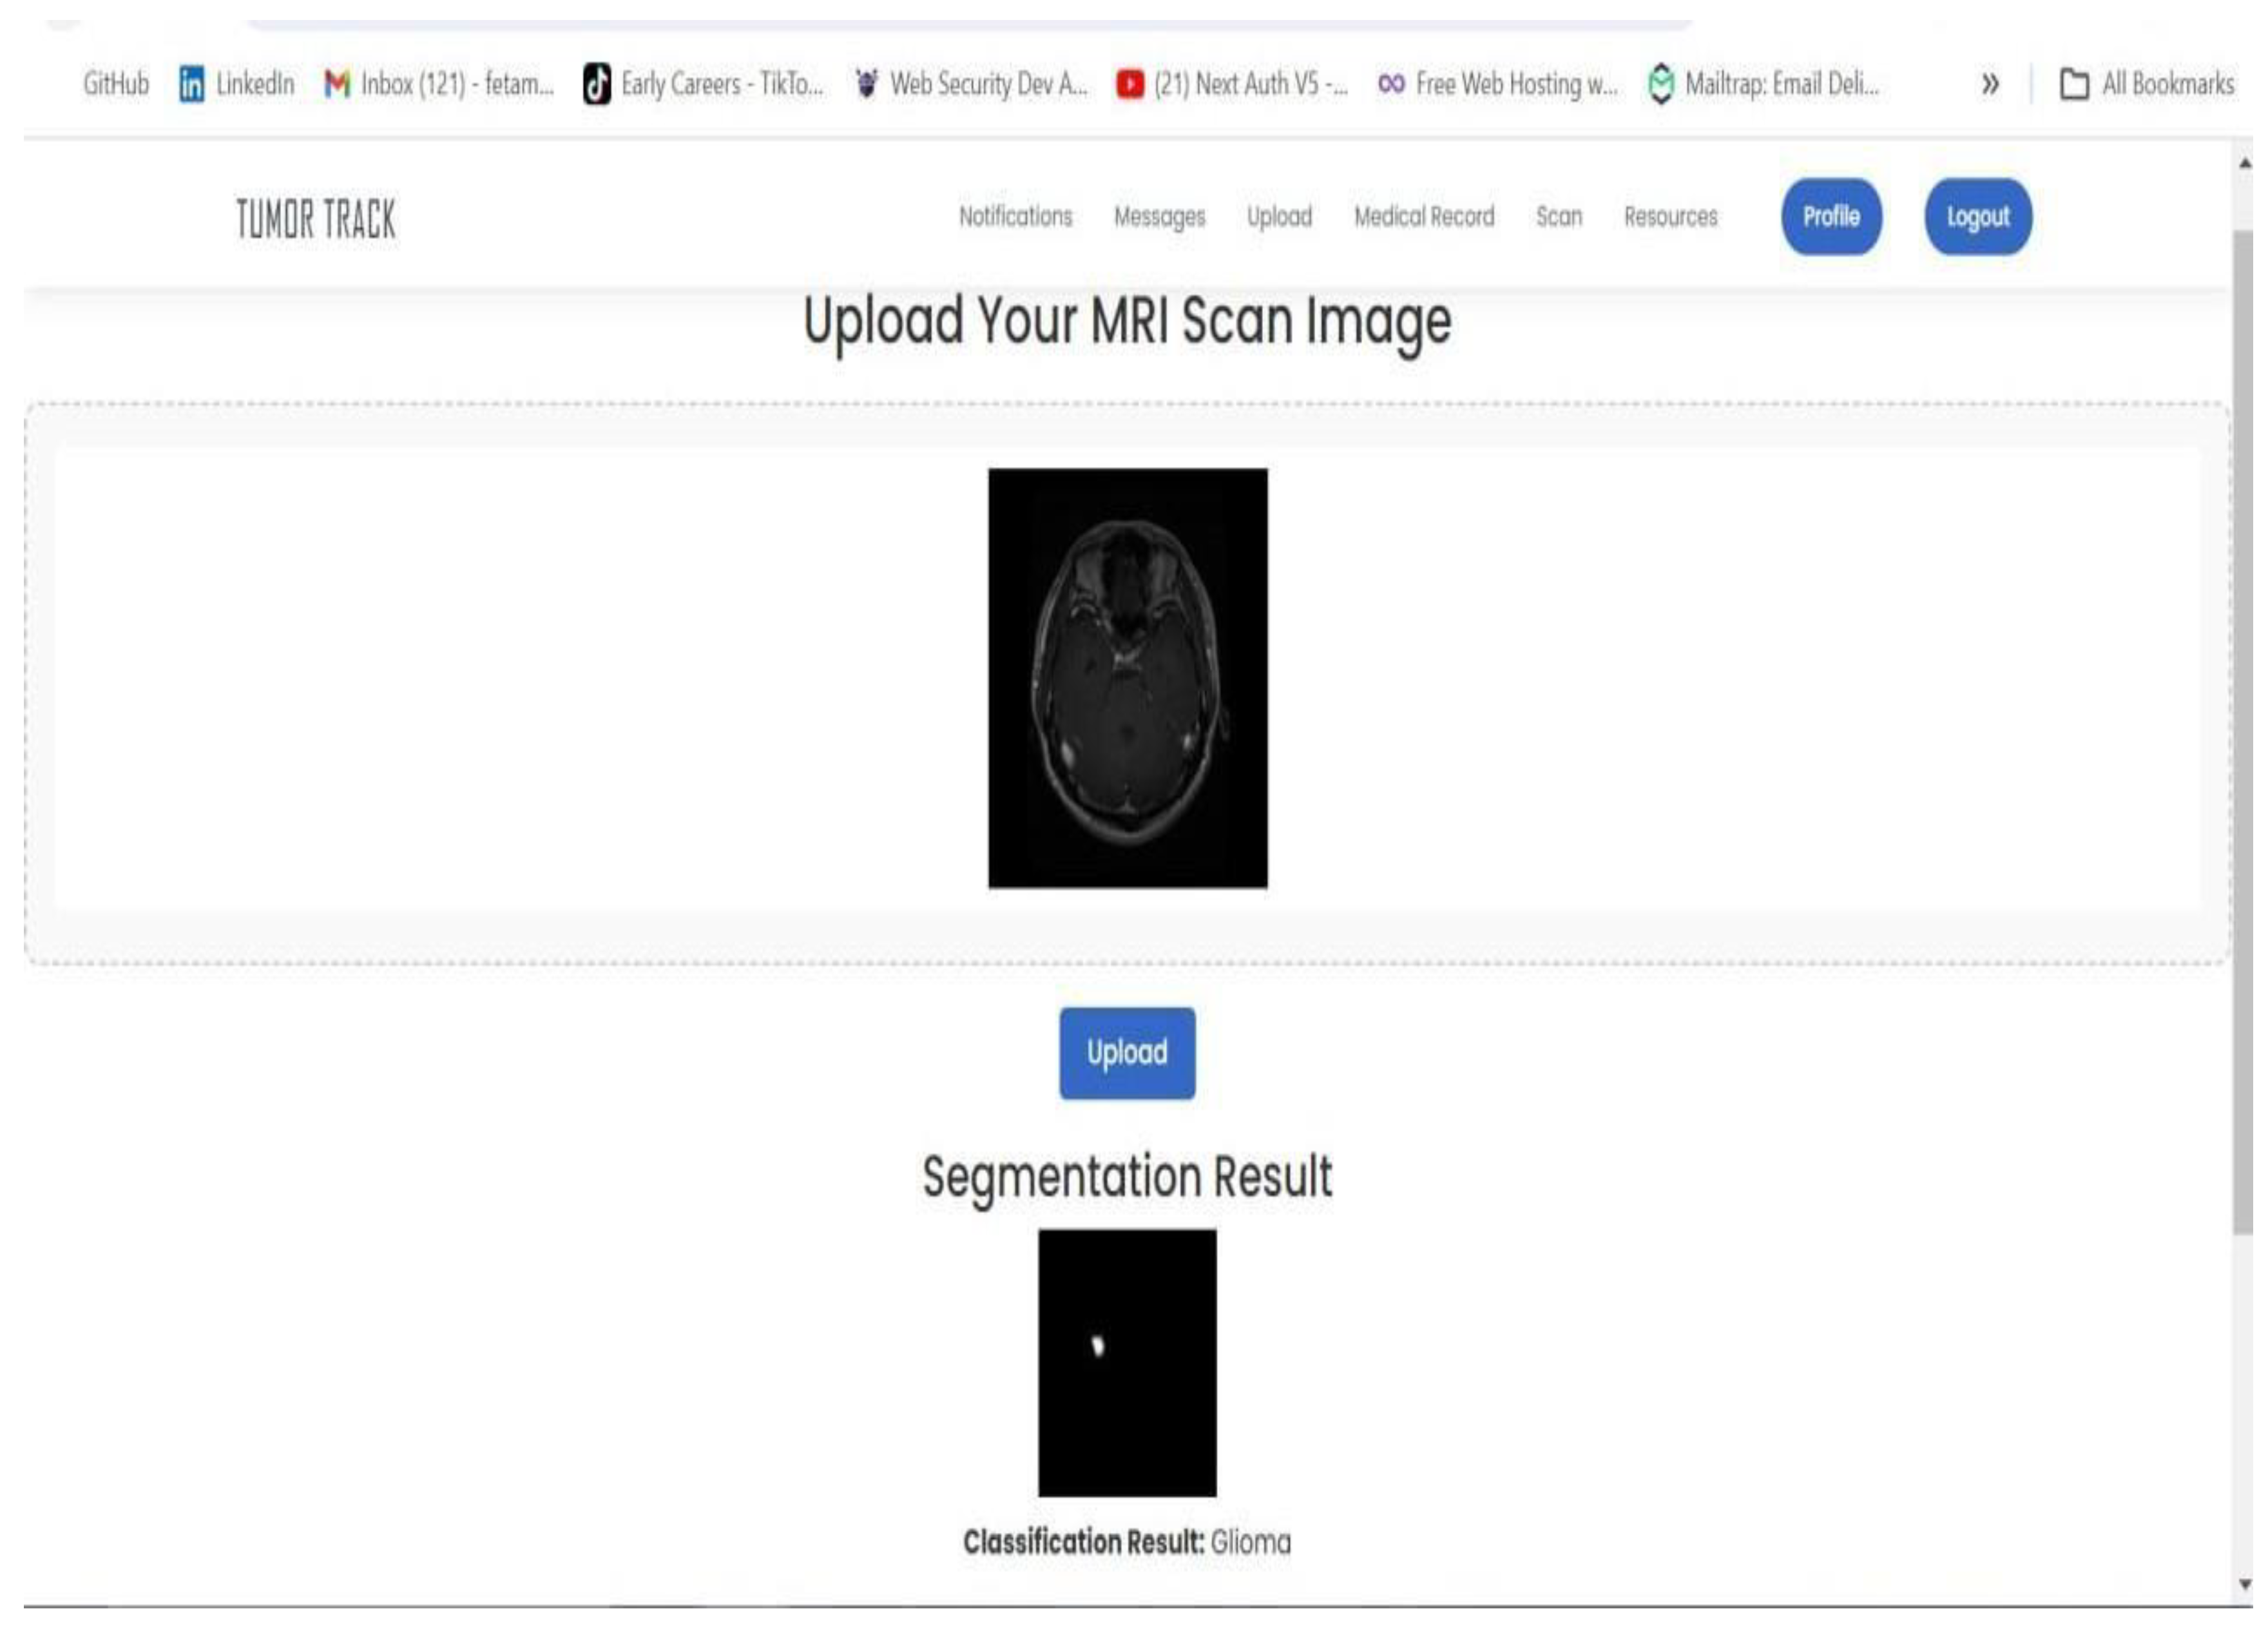
Sample output 3 (Glioma):
Sample output 4 (No tumor):
References
- Buser, A.A. The Training and Practice of Radiology in Ethiopia: Challenges and prospect. Ethiop J Health Sci. 2022, 32, 1–2. [Google Scholar] [CrossRef] [PubMed] [PubMed Central]
- Kaifi, R. A Review of Recent Advances in Brain Tumor Diagnosis Based on AI- Based Classification. Diagnostics (Basel). 2023, 13, 3007. [Google Scholar] [CrossRef] [PubMed]
- Sagaro, G.G.; Battineni, G.; Amenta, F. Barriers to Sustainable Telemedicine Implementation in Ethiopia: A Systematic Review. Telemed Rep. 2020, 1, 8–15. [Google Scholar] [CrossRef] [PubMed]
- Smith, J.; Johnson, K.; Lee, S.; Wang, X. Patient engagement and usability of a web-based patient follow-up application. Journal of Medical Informatics 2023, 123, 456–789. [Google Scholar]
- Johnson, M.; Lee, T.; Chen, Y. Impact of a patient follow-up web application on healthcare utilization and cost reduction. Journal of Healthcare Management 2022, 67, 123–135. [Google Scholar]
- Lee, J.; Wang, Z.; Chen, X. Application of deep learning in brain tumor detection from MRI images. Journal of Neuroradiology 2021, 48, 123–456. [Google Scholar]
- Wang, Y.; Chen, L. Image segmentation and classification algorithms for brain tumor detection. Journal of Imaging Science and Technology 2020, 64, 040402. [Google Scholar]
Disclaimer/Publisher’s Note: The statements, opinions and data contained in all publications are solely those of the individual author(s) and contributor(s) and not of MDPI and/or the editor(s). MDPI and/or the editor(s) disclaim responsibility for any injury to people or property resulting from any ideas, methods, instructions or products referred to in the content. |
© 2025 by the authors. Licensee MDPI, Basel, Switzerland. This article is an open access article distributed under the terms and conditions of the Creative Commons Attribution (CC BY) license (http://creativecommons.org/licenses/by/4.0/).
Copyright: This open access article is published under a Creative Commons CC BY 4.0 license, which permit the free download, distribution, and reuse, provided that the author and preprint are cited in any reuse.


