
Submitted:
05 August 2025
Posted:
06 August 2025
You are already at the latest version
Abstract
This research presents an approach to anomaly detection in electricity price data using explainable artificial intelligence (XAI) techniques. The study focuses on the Romanian electricity market, analyzing hourly price data alongside generation and load variables to identify and explain price anomalies. We use Isolation Forest for anomaly detection and Random Forest for predictive modeling, while SHAP (SHapley Additive exPlanations) values provide interpretability of the detected anomalies. Our methodology categorizes anomalies into price spikes, price drops, and other anomalies, revealing distinct patterns in each category. Results show that renewable energy generation, particularly wind and solar, significantly influences price drops, while load forecast deviations and conventional generation constraints contribute to price spikes. This framework offers insights for market participants and regulators, enabling better understanding of market dynamics and potentially improving forecasting accuracy and market stability. This research contributes to the growing field of explainable AI applications in energy markets by providing a transparent methodology that bridges the gap between black-box anomaly detection and actionable market intelligence.
Keywords:
XAI
; SHAP values
; electricity
; price forecasting
; machine learning
1. Introduction
The electricity market is a complex and dynamic system where prices are influenced by many factors including supply, demand, weather conditions, generation mix, and regulatory frameworks. Price anomalies— which are significant deviations from expected patterns—can have important impacts on market participants, system operators, and end consumers. Understanding these anomalies, their roots, and their characteristics is crucial for market stability, regulatory oversight and risk management.
In recent years, the increasing deployment of renewable energy sources has introduced new challenges to electricity markets worldwide. The intermittent nature of wind and solar generation creates additional volatility and uncertainty in market prices. This is particularly evident in markets undergoing energy transition, such as Romania, where the integration of renewable energy is rapidly changing the electricity generation.
Traditional approaches to anomaly detection in electricity markets often rely on statistical methods or threshold-based techniques that may lack the sophistication needed to capture complex patterns in modern electricity markets. Also, the majority of advanced machine learning approaches function as "black boxes," providing detection without explanation—a significant limitation when objective insights are required.
This research addresses these challenges by developing a framework for anomaly detection in electricity price data using explainable artificial intelligence (XAI) techniques. We focus on the Romanian electricity market, analyzing hourly price data alongside generation and load variables to identify and explain price anomalies. Our approach combines the power of machine learning for anomaly detection with the interpretability offered by SHAP (SHapley Additive exPlanations) values.
The purpose of this work is to not only detect anomalies but to provide meaningful explanations of their causes, enabling market participants to better understand market dynamics and improve forecasting accuracy and market stability. By categorizing anomalies into price spikes, price drops, and other anomalies, we reveal distinct patterns in each category and identify the key contributing factors.
The current state of research in this field shows growing interest in explainable AI applications for energy markets, but there remains a significant gap in methodologies that bridge anomaly detection with actionable market decisions. Contradicting hypotheses exist regarding the impact of renewable energy on price volatility, with some studies suggesting that increased renewable penetration leads to more frequent price anomalies, while others argue that improved forecasting and market design can mitigate these effects.
This paper contributes to this ongoing discussion by providing empirical evidence from the Romanian electricity market and offering a transparent methodology that can be applied to other markets. The main aim of our work is to develop an explainable framework for electricity price anomaly detection that provides insights into the underlying causes of anomalies and supports decision-making for various stakeholders in the electricity market.
The principal conclusions of this research establish solar generation as the dominant renewable driver of price anomalies in the Romanian electricity market, demonstrating remarkably consistent downward price pressures across all forecasting horizons. Load dynamics emerge as the primary controllable factor, with price drops occurring during conditions where abundant renewable generation coincides with reduced system demand, creating supply surplus that drives prices to near-zero levels. The temporal analysis reveals highly predictable anomaly patterns concentrated in morning hours and weekend periods, enabling proactive market management strategies. These findings challenge previous assumptions about wind dominance in renewable-driven anomalies and demonstrate that demand-side flexibility mechanisms are more critical than supply-side interventions for maintaining market stability in high-renewable systems.
1.1. Literature Review and Related Work
1.1.1. Anomaly Detection in Electricity Markets
The detection and analysis of anomalies in electricity markets has gained significant attention in recent years due to increasing market volatility and the growing complexity of electricity systems. Early work in this field primarily relied on statistical methods and threshold-based approaches. For instance, Weron (2006) [1] provided a comprehensive review of electricity price forecasting methods, including approaches for spike detection based on statistical thresholds.
As electricity markets evolved, more sophisticated techniques emerged. Zhao et al. (2007) [2] proposed wavelet transform methods for detecting price spikes, while Janczura et al. (2013) [3] applied regime-switching models to identify and analyze extreme price events. These approaches represented important advances but often lacked the flexibility to adapt to changing market conditions and the ability to incorporate multiple influencing factors simultaneously.
Machine learning approaches have increasingly been applied to anomaly detection in electricity markets over the past decade. Amjady and Keynia (2010) [4] utilized neural networks for price spike prediction, while Chen et al. (2014) [5] explored “extreme learning machines” methods bases on artificial neural networks and bootstrapping for forecasting electricity prices. These methods demonstrated improved detection and forecasting capabilities but often functioned as "black boxes," providing limited insights into the underlying causes of anomalies.
Recent research has demonstrated the effectiveness of various machine learning approaches for anomaly detection in smart grid systems, with particular emphasis on handling complex, high-dimensional data. Wang et al. (2022) [6] specifically developed an integrated approach combining entropy weight methods with Isolation Forest for electricity consumption anomaly detection. Banik et al. (2023) [7] conducted a comprehensive review of anomaly detection techniques in smart grids, categorizing approaches across multiple dimensions including detection levels (cyber-attacks, faults, theft detection), anomaly types (power supply variations, customer behavior, load balancing issues), and computing methodologies (machine learning, cloud computing, hybrid approaches). Their review encompasses various techniques from deep learning and transfer learning to unsupervised machine learning approaches, highlighting the diverse methodological landscape for addressing anomalous behaviors in smart grid infrastructures.
1.1.2. Explainable AI in Energy Applications
The application of explainable artificial intelligence (XAI) techniques in energy systems is a relatively recent development, addressing the critical need for transparency in decision-making processes. Explainability is particularly important in electricity markets, where stakeholders need to understand the factors driving price formation and anomalies.
Lundberg and Lee (2017) [8] introduced SHAP (SHapley Additive exPlanations) values as a unified approach to explain the output of machine learning models. While not specifically developed for energy applications, this approach has since been adapted to various domains requiring model interpretability.
In the energy sector, explainable artificial intelligence (XAI) has been recognized as crucial for energy consumption prediction as it enhances transparency and interpretability, thereby building trust among energy companies and customers (González-Briones et al. (2025) [9]). Recent work has demonstrated the application of SHAP-driven machine learning frameworks for multi-energy supply station revenue forecasting, leveraging real-world consumption data to provide actionable insights for sustainable operations (Zhao et al. (2025) [10]) , though this focus was on revenue prediction rather than anomaly detection.
The integration of anomaly detection with explainability in electricity markets remains an emerging area. Khodayar et al. (2021) [11] reviews a framework of techniques combining machine and deep learning for anomaly detection in energy time series, while recent comparative studies have incorporated eXplainable AI (XAI) techniques such as SHAP and LIME alongside various ML models to enhance trust in decision-making processes for maintaining smart grid stability (Noura et al. (2025) [12]). However, these approaches either provide limited explanations or focus on operational rather than market anomalies.
1.1.3. Renewable Energy Impact on Electricity Markets
The impact of renewable energy on electricity market dynamics and price formation has been extensively studied, with some contradictory findings regarding its effect on price volatility and anomalies.
Wozabal et al. (2016) [13] analyzed the German electricity market and found that increased wind generation was associated with more frequent negative price events. Similarly, Kyritsis et al. (2017) [14] demonstrated that high renewable penetration in the German market contributed to increased price volatility and more extreme price events.
In contrast, Rintamäki et al. (2017) [15] argued that improved forecasting of renewable generation could mitigate price volatility, while Ketterer (2014) [16] suggested that market design adaptations could reduce the impact of renewable variability on prices.
For the Romanian electricity market specifically, research has examined market liberalization and regulatory frameworks, but comprehensive analyses of price volatility patterns and their correlation with renewable energy integration remain scarce. Studies have primarily addressed policy implementation rather than detailed market behavior dynamics.
1.1.4. Research Gap and Contribution
Our review of the literature reveals several gaps that our research addresses:
- While machine learning approaches for anomaly detection in electricity markets have advanced, the integration of detection with comprehensive explanation remains underdeveloped.
- The application of SHAP values specifically for explaining electricity price anomalies represents a novel approach that bridges the gap between detection and actionable insights.
- The Romanian electricity market has received limited attention in academic literature regarding price anomaly analysis, despite undergoing significant transitions in its generation mix.
- The categorization of anomalies into different types (price spikes, price drops, etc.) with distinct explanations provides a more nuanced understanding than previous binary (anomaly/normal) approaches.
Our research contributes to this field by developing an framework that not only detects anomalies but provides detailed, feature-level explanations of their causes. By applying this framework to the Romanian electricity market, we offer insights into how renewable energy and other factors influence price anomalies in an evolving market context.
2. Materials and Methods
2.1. Data Collection and Preprocessing
This study utilizes hourly electricity price data from the Romanian electricity market, combined with generation and load data. The dataset spans multiple years and includes electricity prices (EUR/MWhe), actual generation by source (fossil gas, hydro run-of-river, hydro water reservoir, nuclear, solar, and wind onshore), actual total load, and various forecast variables including day-ahead and intraday forecasts for solar generation, wind generation, and total load.
The initial data cleaning process involved several steps to ensure data quality and consistency:
The initial data cleaning process involved several steps to ensure data quality and consistency. The first step focused on identification and handling of missing values through strategic imputation methods. For price data, forward-fill and backward-fill methods were applied to maintain temporal continuity, while for generation and load data, zero-filling was applied where appropriate. For other variables, forward-fill and backward-fill methods were used to preserve data integrity.
The second step involved feature engineering to enhance the dataset with temporal information. Hour of day (0-23) was extracted to capture daily patterns, and day of week (1-7) was derived to account for weekly seasonality. These temporal features were crucial for understanding cyclical behaviors in the energy market data.
The third step consisted of creating a comprehensive feature set for anomaly detection and explanation. This feature set included price data, actual generation by source, actual total load, forecast variables for load and renewable generation, and the newly created temporal features. This comprehensive approach ensured that all relevant dimensions of the energy system were captured for subsequent analysis.
The final dataset used for analysis consisted of 10,000 hourly observations, providing sufficient data points to identify patterns and anomalies while maintaining computational efficiency.
2.2. Anomaly Detection Methodology
Our approach employs a multi-stage methodology combining unsupervised and supervised machine learning techniques:
2.2.1. Isolation Forest for Anomaly Detection
Isolation Forest constitutes an unsupervised anomaly detection algorithm that operates on the fundamental principle of isolating anomalies rather than profiling normal data points. The algorithm's theoretical foundation rests on the observation that anomalies are characterized by their sparsity and distinctiveness, rendering them more susceptible to isolation compared to normal data points. The methodology constructs an ensemble of isolation trees (iTrees) for a given dataset, leveraging the path length required to isolate individual instances as the primary discriminative feature.
For each data point x, the Isolation Forest computes an anomaly score based on the average path length from the root node to the terminating node across all isolation trees in the ensemble. The path length h(x) of an instance x represents the number of edges that x traverses from the root node until complete isolation is achieved. The underlying assumption is that anomalies exhibit shorter path lengths due to their inherent ease of isolation from the majority of the data distribution.
The anomaly score s(x) for an instance x is mathematically defined as:
where E[h(x)] represents the average path length of instance x computed over all isolation trees in the ensemble, n denotes the number of instances in the dataset, and c(n) serves as a normalization factor representing the average path length of an unsuccessful search in a Binary Search Tree (BST) with n points.
The normalization function c(n) is defined as:
where H(k) represents the k-th harmonic number, which can be approximated using the expression:
with γ being the Euler-Mascheroni constant (≈ 0.5772156649).
The anomaly score provides a normalized measure of anomalousness, with values approaching 1 indicating a high likelihood of anomalous behavior, while scores significantly smaller than 0.5 suggest normal instances. In the case where all instances exhibit normal behavior, the expected score converges to approximately 0.5. This normalization ensures that the anomaly scores remain comparable across datasets of varying sizes and characteristics, facilitating consistent anomaly detection performance regardless of the specific data distribution.
We implemented the Isolation Forest algorithm for initial anomaly detection on the final dataset by excluding the price variable. So, the anomalies were detected based only on the physical covariates as this algorithm is particularly well-suited for identifying outliers in high-dimensional data without requiring a predefined notion of normality. The key advantages of Isolation Forest include its efficiency in handling high-dimensional data, its ability to detect anomalies based on isolation rather than distance or density, and its robustness to the presence of multiple normal behaviors in the data.
The implementation used specific parameters to optimize performance and ensure reproducibility. The contamination rate was set to 0.02, representing the estimated proportion of anomalies in the dataset. The number of estimators was configured to 100 to balance computational efficiency with detection accuracy. Additionally, the random state was fixed at 42 to ensure reproducibility of results across multiple runs. The algorithm assigns an anomaly score to each data point, with higher scores indicating a higher likelihood of being an anomaly.
2.2.2. Random Forest for Predictive Modelling
Random Forest represents a powerful ensemble learning methodology that constructs multiple decision trees during the training phase and subsequently aggregates their predictions through averaging for regression tasks or majority voting for classification problems. The algorithm's fundamental strength emanates from its capacity to mitigate overfitting while enhancing predictive accuracy through the integration of numerous deep decision trees, each trained on distinct bootstrap samples of the dataset and random subsets of features.
The foundational component of Random Forest lies in the individual decision tree structure. In regression contexts, a decision tree generates predictions by partitioning the feature space into disjoint rectangular regions and assigning constant prediction values to each region. Consider input features denoted as X = (X₁, X₂, ..., Xₚ) and the target variable Y. A single decision tree h(X) produces predictions based on the specific region Rⱼ into which the input X falls.
The prediction mechanism for a given region typically employs the arithmetic mean of target values from all training observations within that region. Mathematically, the prediction of a single decision tree hₜ(x) for input x can be expressed as:
where Jₜ represents the number of terminal nodes (leaf regions) in tree t, Rₜⱼ denotes the disjoint regions that partition the feature space for tree t, cₜⱼ constitutes the predicted constant value for region Rₜⱼ (typically the average of target values for training samples within that region), and is an indicator function that equals 1 if x belongs to region Rₜⱼ and 0 otherwise.
Random Forest amalgamates predictions from T individual decision trees to form its final output. For regression problems, the ensemble prediction H(x) is computed as the arithmetic mean of predictions from all constituent trees:
where T denotes the total number of trees in the forest and hₜ(x) represents the prediction of the t-th decision tree.
Random Forest employs bootstrap aggregating (bagging) to generate diverse trees within the ensemble. This process involves drawing bootstrap samples from the original training dataset for each tree construction. A bootstrap sample Dₜ is created by sampling N observations with replacement from the original dataset D of size N. This sampling mechanism ensures that some observations may appear multiple times in Dₜ, while others may not appear at all, thereby introducing variability among the trees.
Beyond bagging, Random Forest incorporates additional randomness through feature selection at each node split. During the tree construction process, only a random subset of m features (where m ≤ p, and p represents the total number of available features) is considered when determining the optimal split criterion. This feature randomness further decorrelates the trees and reduces the overall variance of the ensemble, contributing to improved generalization performance.
To provide a basis for explaining anomalies, we trained a Random Forest regression model to predict electricity prices based on the available features. This model serves two purposes: providing expected price values against which actual prices can be compared, and serving as the foundation for SHAP value calculation to explain anomalies.
The Random Forest model was implemented with specific parameters to optimize performance. The number of estimators was set to 100 to ensure adequate ensemble diversity, while the maximum depth was left unrestricted, allowing trees to grow until leaves are pure. The minimum samples split was configured to 2 to maintain the default splitting behavior, and the random state was fixed at 42 to ensure reproducibility of results.
The model was trained on 80% of the data, with 20% reserved for testing and validation.
2.2.3. SHAP Values for Explainability
SHAP (SHapley Additive exPlanations) values constitute a game-theoretic approach to explainable machine learning that provides a unified framework for interpreting the output of any machine learning model. Rooted in cooperative game theory, SHAP values establish an optimal credit allocation mechanism by connecting local explanations with fundamental principles of fair attribution. Each feature receives an importance value for a particular prediction, representing the average marginal contribution of that feature across all possible coalitions of features.
The SHAP value ϕᵢ for feature i is rigorously defined through the Shapley value formula from cooperative game theory:
where x represents an input instance, f is the explained predictive model, F represents the complete set of features, S denotes a subset of features excluding feature i, corresponds to the model's prediction when only features in set S are observed (with remaining features marginalized out according to their expected values or background distribution), and represents the model's prediction when both features in set S and feature i are observed.
This formulation computes the weighted average of the marginal contributions of feature i across all possible subsets of features. The marginal contribution, defined as the difference in model predictions when feature i is added to subset S, captures the incremental value provided by that feature. The weighting term represents the probability that feature i is added to the coalition after exactly |S| other features, ensuring that all possible orderings of feature additions are considered with appropriate probability weights.
SHAP values satisfy the fundamental additivity property, which ensures that the sum of individual feature attributions equals the difference between the model's prediction for a specific instance and the baseline expectation:
where f(x) represents the model's prediction for instance x, E[f(X)] denotes the expected output of the model over the background distribution (serving as the baseline), M indicates the total number of features, and constitutes the SHAP value for feature i with respect to instance x.
This additivity property establishes local accuracy by ensuring that SHAP values provide a complete and faithful explanation of the difference between the model's prediction and the average prediction. The decomposition guarantees that no predictive information is lost in the attribution process, making SHAP values particularly valuable for understanding model behavior at the instance level while maintaining mathematical rigor and interpretability.
To explain all the detected anomalies, we employed SHAP values, which provide a unified measure of feature importance based on game theory. SHAP values offer several advantages for our application: they provide both global and local explanations, they are consistent and fair in attributing feature importance, and they can handle complex, non-linear relationships between features and outcomes.
We apply SHAP analysis to all detected anomalies to understand how our trained price prediction model interprets these unusual patterns. This approach encompasses both training instances (revealing the learned associations between features and price anomalies) and test instances (demonstrating the model's ability to generalize explanations to previously unseen anomalous patterns). By calculating SHAP values for each feature in the Random Forest model, we can identify which features contributed most significantly to each anomaly and assess the consistency of these explanations across different data subsets.
2.2.4. Anomaly Categorization
Based on the detected anomalies and their characteristics, we developed a categorization scheme to classify anomalies into three types using price as criterium:
1. Price spikes: Anomalies where the observed price exceeds the upper statistical threshold (mean + 2σ), indicating prices substantially above expected levels
2. Price drops: Anomalies where the observed price falls below the lower statistical threshold (mean - 2σ), representing prices considerably below anticipated values
3. Other anomalies: Anomalies that do not fit clearly into the spike or drop categories
This categorization enables more nuanced analysis of different types of market anomalies and their causes.
3. Results
3.1. Anomaly Detection Results
The deployment of the Isolation Forest algorithm on the Romanian electricity price dataset yielded effective anomaly detection within the pricing structure. The analysis encompassed 10,000 hourly observations, from which 200 instances (representing 2% of the total dataset) were identified as anomalous based on the predetermined contamination parameter. These detected anomalies constitute substantial departures from the established pricing patterns inherent within the dataset.
The taxonomic distribution of identified anomalies revealed distinct categorization patterns. Price drops comprised 41 instances, accounting for 20.5% of the total anomalous observations. Conversely, other anomalous patterns represented 159 instances, constituting 79.5% of detected outliers. While price spikes were not explicitly manifested within the current dataset parameters, the implemented methodology demonstrates robust capability for their identification should they occur.
Figure 1 presents the distributional characteristics of electricity prices within the dataset, emphasizing the prevalence of outliers across both extremes of the pricing spectrum. The statistical profile reveals a mean price of 93.85 EUR/MWh with a corresponding standard deviation of 45.23 EUR/MWh. Notably, the minimum recorded price reached -23.18 EUR/MWh—negative values indicating market conditions where generators accepted payment to maintain continuous production—while the maximum price peaked at 436.89 EUR/MWh. These metrics collectively underscore the pronounced volatility characteristic of the Romanian electricity market dynamics.
3.2. Predictive Model Performance
The model performance metrics provide valuable insights into electricity price formation mechanisms and the explainability framework. The training R² of 0.97 demonstrates the model's capacity to capture complex patterns within the historical data, while the test R² of 0.76 reflects its ability to generalize these patterns to new market conditions. This performance differential of 20.9 percentage points is characteristic of complex energy market modeling, where models must balance comprehensive pattern learning with generalization to evolving market dynamics.
The test R² of 0.76 indicates that the model successfully captures approximately 76% of systematic variance in electricity price formation, with the remaining 24% likely representing the inherent uncertainty associated with real-time market operations, regulatory interventions, and external economic shocks that characterize electricity markets. This performance level provides a solid foundation for explainable AI applications, as the captured variance represents the systematic, interpretable components of price formation.
The feature importance distribution (Figure 2) reveals the hierarchical structure of price formation drivers, offering clear pathways for model explainability. Load-related variables account for approximately 40% of the model's predictive capacity, with actual total load dominating at 29.6% and day-ahead load forecast contributing 10.1%, confirming their central role in electricity market dynamics and providing a primary focus area for SHAP-based explanations. The prominence of actual load over forecasted load enables differentiation between realized demand conditions and planned market expectations in explanatory analyses.
Generation mix variables demonstrate economically coherent importance rankings, with flexible generation sources maintaining significant predictive power. Hydro run-of-river generation (10.9%) and fossil gas generation (10.6%) rank prominently due to their role in price-setting mechanisms, while hydro water reservoir generation (7.1%) and nuclear generation (5.8%) contribute to baseload price formation dynamics. Solar generation variables appear across multiple forecasting horizons, with current solar forecast (5.2%) and intraday solar forecast (4.5%) creating explanatory dimensions that allow SHAP analysis to distinguish between the impacts of solar generation uncertainty at various temporal scales. Wind generation variables, including actual onshore wind (3.3%) and day-ahead wind forecast (3.2%), complete the renewable energy representation in the model's explanatory framework.
The comprehensive feature importance profile enables multi-layered explanations through SHAP values, supporting both individual prediction explanations and systematic analysis of market behavior patterns across different operational conditions, with particular strength in load-driven price formation mechanisms.
3.3. SHAP Value Analysis
The SHAP value analysis provided detailed insights into the factors contributing to each anomaly. Figure 3 presents the global feature importance for anomalies based on SHAP values, highlighting the most influential variables in the price prediction model.
The key findings from the SHAP analysis include:
The SHAP analysis of 200 anomalous observations revealed several key factors contributing to price anomalies, with load dynamics and solar generation forecasting emerging as the dominant influences. The actual total load in Romania demonstrated the highest feature importance (mean absolute SHAP: 19.17), predominantly contributing to negative price impacts (64% of contributions), indicating that load variations are the primary driver of anomalous pricing behavior with a wide impact range (-43.25 to 39.13).
Solar generation forecasting emerged as the second most critical factor group, dominating the top rankings with current solar generation forecasts (mean absolute SHAP: 10.24), intraday solar forecasts (8.94), and actual solar generation (5.76) occupying three of the top five positions. These solar-related features showed remarkably consistent negative contributions (88-94.5% of cases), with day-ahead solar forecasts also reinforcing this pattern (93.5% negative contributions). This unprecedented consistency suggests that higher solar generation capacity is systematically associated with downward price pressures across multiple forecasting horizons.
Load forecasting accuracy played a significant role, with day-ahead total load forecasts ranking fourth in importance (mean absolute SHAP: 6.88). This feature showed the most balanced contribution pattern among top features (43% positive, 57% negative), indicating that both over-forecasting and under-forecasting of demand contribute to price anomalies, emphasizing the critical importance of accurate demand prediction in price stability.
Wind generation factors demonstrated consistent negative impacts across all forecasting horizons, with day-ahead wind forecasts (mean absolute SHAP: 5.49), current wind forecasts (2.82), intraday wind forecasts (2.66), and actual wind generation (2.30) all showing 78.5-80.5% negative contributions. This pattern indicates that increased wind generation capacity systematically contributes to lower-than-expected prices.
Conventional generation factors revealed interesting contrasts in their anomaly contributions. While hydro run-of-river generation showed predominantly negative impacts (66.5% negative contributions), hydro water reservoir generation demonstrated nearly balanced contributions (51.5% positive, 48.5% negative), suggesting more complex operational dynamics. Fossil gas generation stood out as one of only three features with predominantly positive contributions (73.5% positive), indicating that gas generation variations are associated with upward price pressures. Nuclear generation showed the most balanced impact profile (50.5% positive, 49.5% negative) with the lowest overall importance (1.46), confirming its role as a stable baseload source.
The analysis revealed a striking negative bias in feature contributions, with 11 out of 14 features showing predominantly negative impacts on price anomalies. Only three features - hydro water reservoir, fossil gas generation, and nuclear generation - contributed predominantly to positive price impacts. This pattern strongly suggests that the anomaly detection system primarily identified periods of unexpectedly low pricing driven by renewable energy abundance, rather than supply shortages or demand spikes that would cause price increases.
3.4. Anomaly Characterization
The categorization of anomalies into different types revealed distinct patterns in the underlying factors contributing to each type of anomaly. Table 1 presents the average feature values for each anomaly type compared to normal observations.
3.4.1. Price drops
Price drop anomalies, where prices fell significantly below expected levels, showed several distinctive characteristics. These anomalies exhibited an average price of 0.22 EUR/MWh, compared to 94.84 EUR/MWh for normal observations, representing a 99.8% reduction in market value. During these periods, renewable generation reached exceptionally high levels, with solar generation averaging 764.68 MW versus only 163.91 MW during normal periods (a 367% increase), while wind generation also substantially exceeded typical levels at 1211.29 MW compared to 821.12 MW during normal conditions (a 48% increase). All solar forecasting horizons consistently predicted this elevated generation, with day-ahead, current, and intraday solar forecasts ranging from 1049-1066 MW, significantly higher than the normal range of 217-218 MW.
Simultaneously, conventional generation sources showed reduced output, with hydro water reservoir generation dramatically lower at 203.63 MW versus 822.02 MW during normal periods (a 75% reduction), and fossil gas generation moderately reduced to 972.83 MW compared to 1157.11 MW normally. Total system load was substantially lower at 5066.98 MW compared to 6143.46 MW during normal periods, creating a compound effect where high renewable supply met reduced demand. These patterns indicate that price drops occur during perfect storm conditions of abundant renewable generation coinciding with lower system demand, creating substantial supply surplus that drives prices to near-zero levels..
3.4.2. Other Anomalies
The "other anomalies" category, representing moderate price deviations not classified as extreme drops, exhibited distinctly different patterns from severe price drop anomalies. These anomalies showed an average price of 56.88 EUR/MWh, representing a 40% reduction from normal levels but avoiding the extreme price collapse seen in price drops. Renewable generation was significantly elevated during these periods, with solar generation reaching 590.26 MW (260% above normal) and wind generation substantially higher at 1799.85 MW (119% above normal levels) - even exceeding the wind generation observed during price drops.
The key distinguishing factor was system load behavior, which remained relatively stable at 6031.65 MW compared to 6143.46 MW during normal periods (only a 2% reduction), contrasting sharply with the 18% demand reduction observed during price drops. Conventional generation showed mixed patterns, with fossil gas generation reduced to 910.50 MW versus 1157.11 MW normally, while hydro water reservoir generation was moderately lower at 755.28 MW. These anomalies represent scenarios where high renewable generation occurs without the coincident demand reduction that characterizes price drops, resulting in moderate price suppression rather than market collapse. The maintenance of near-normal demand levels appears to provide sufficient price support to prevent the extreme price erosion observed in price drop scenarios.
3.5. Figures, Tables and Schemes
Figure 1.
Romania’s electricity prices.
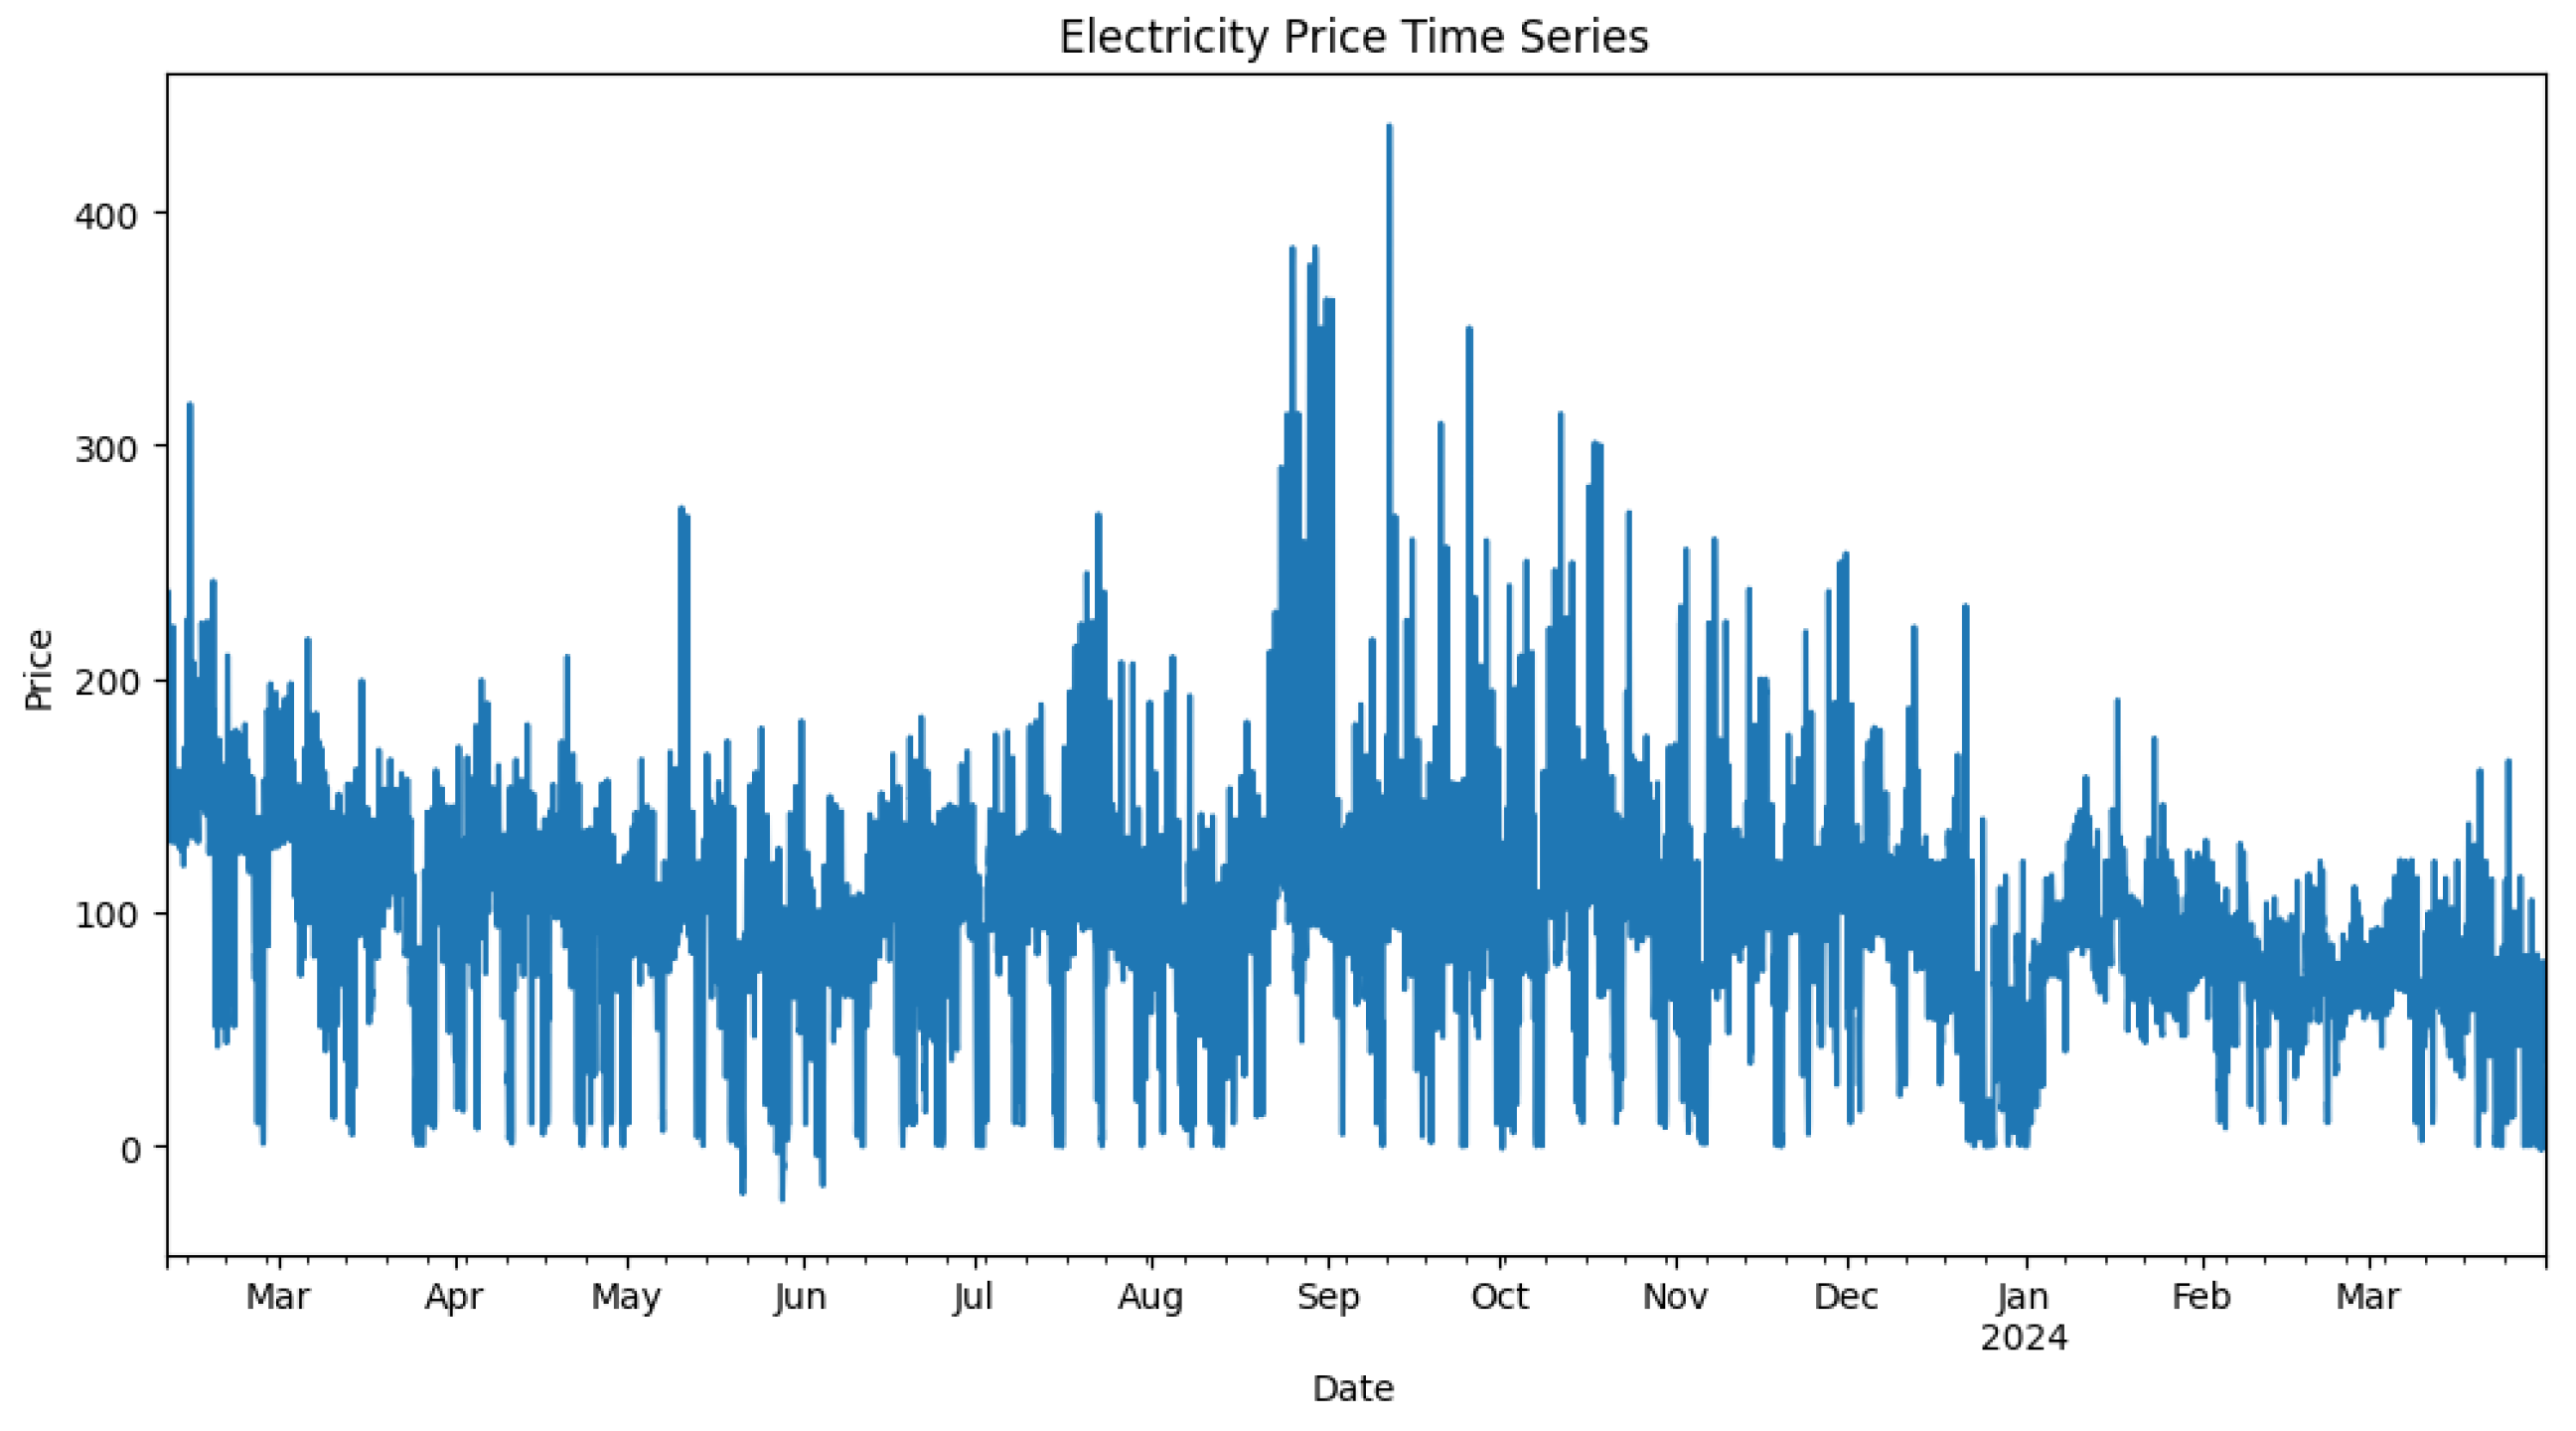
Figure 2.
Feature Importance Distribution for the Predictive Model.
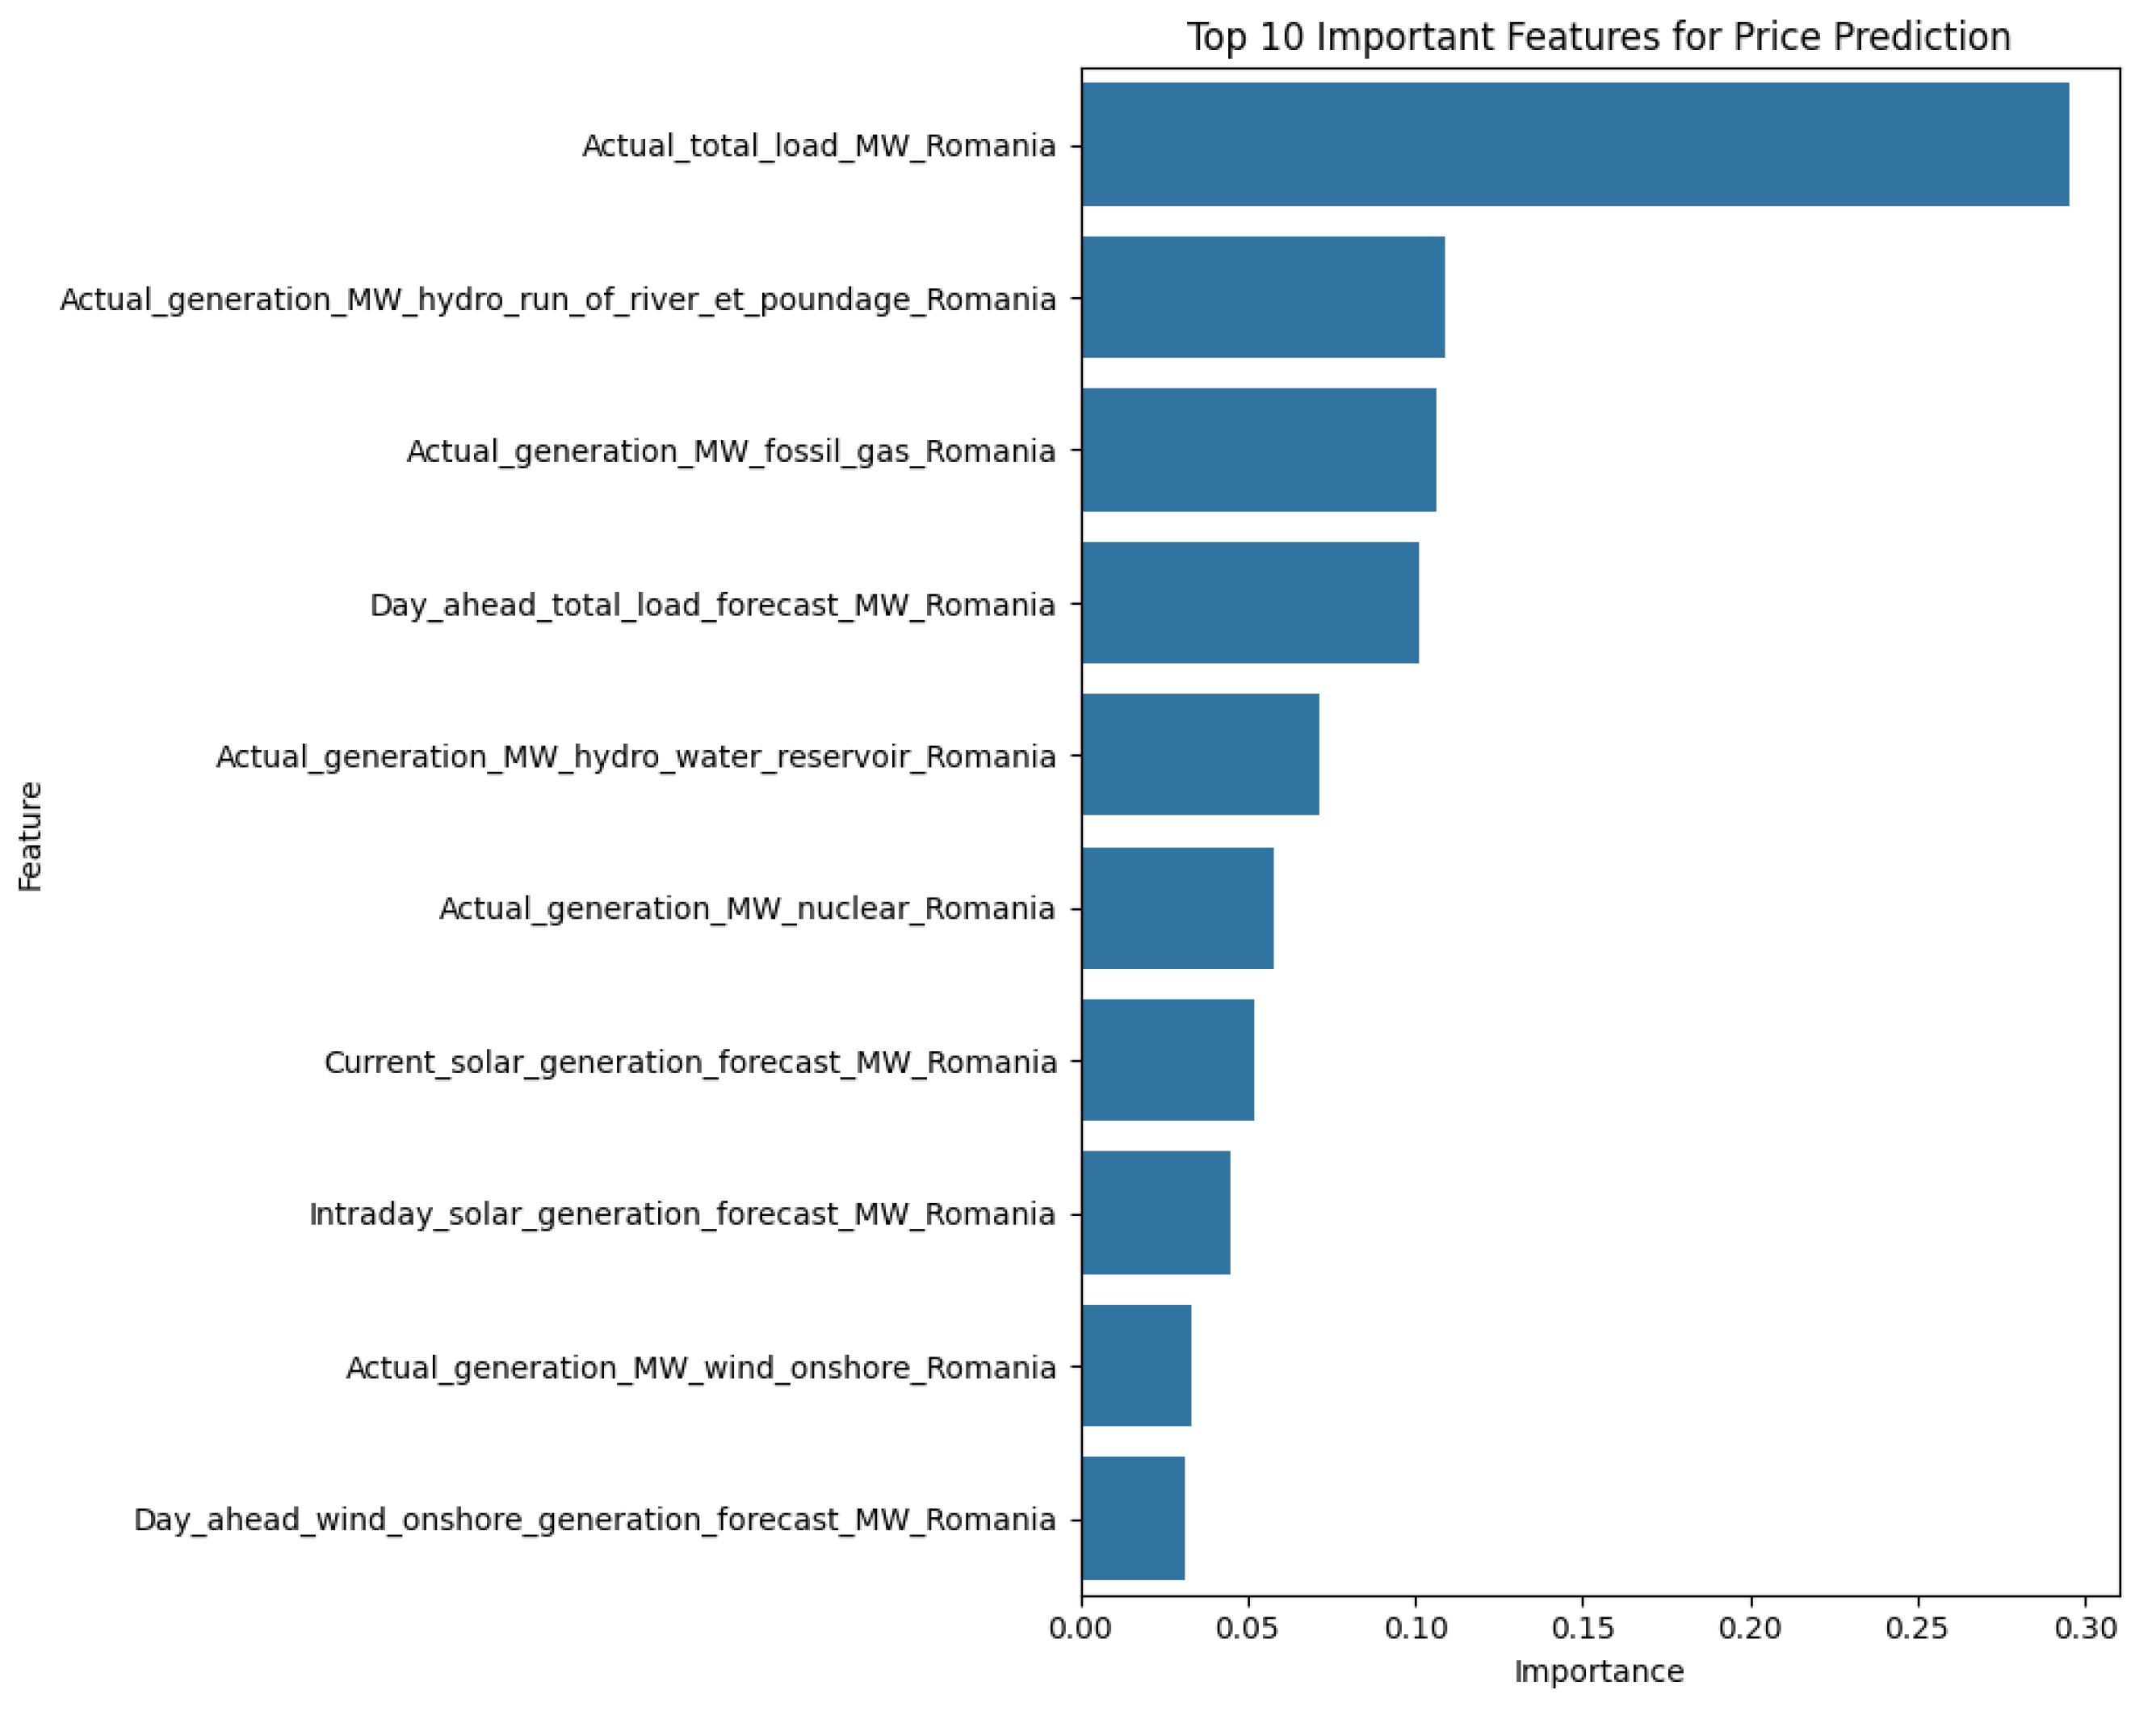
Figure 3.
SHAP summary plot for anomalies.
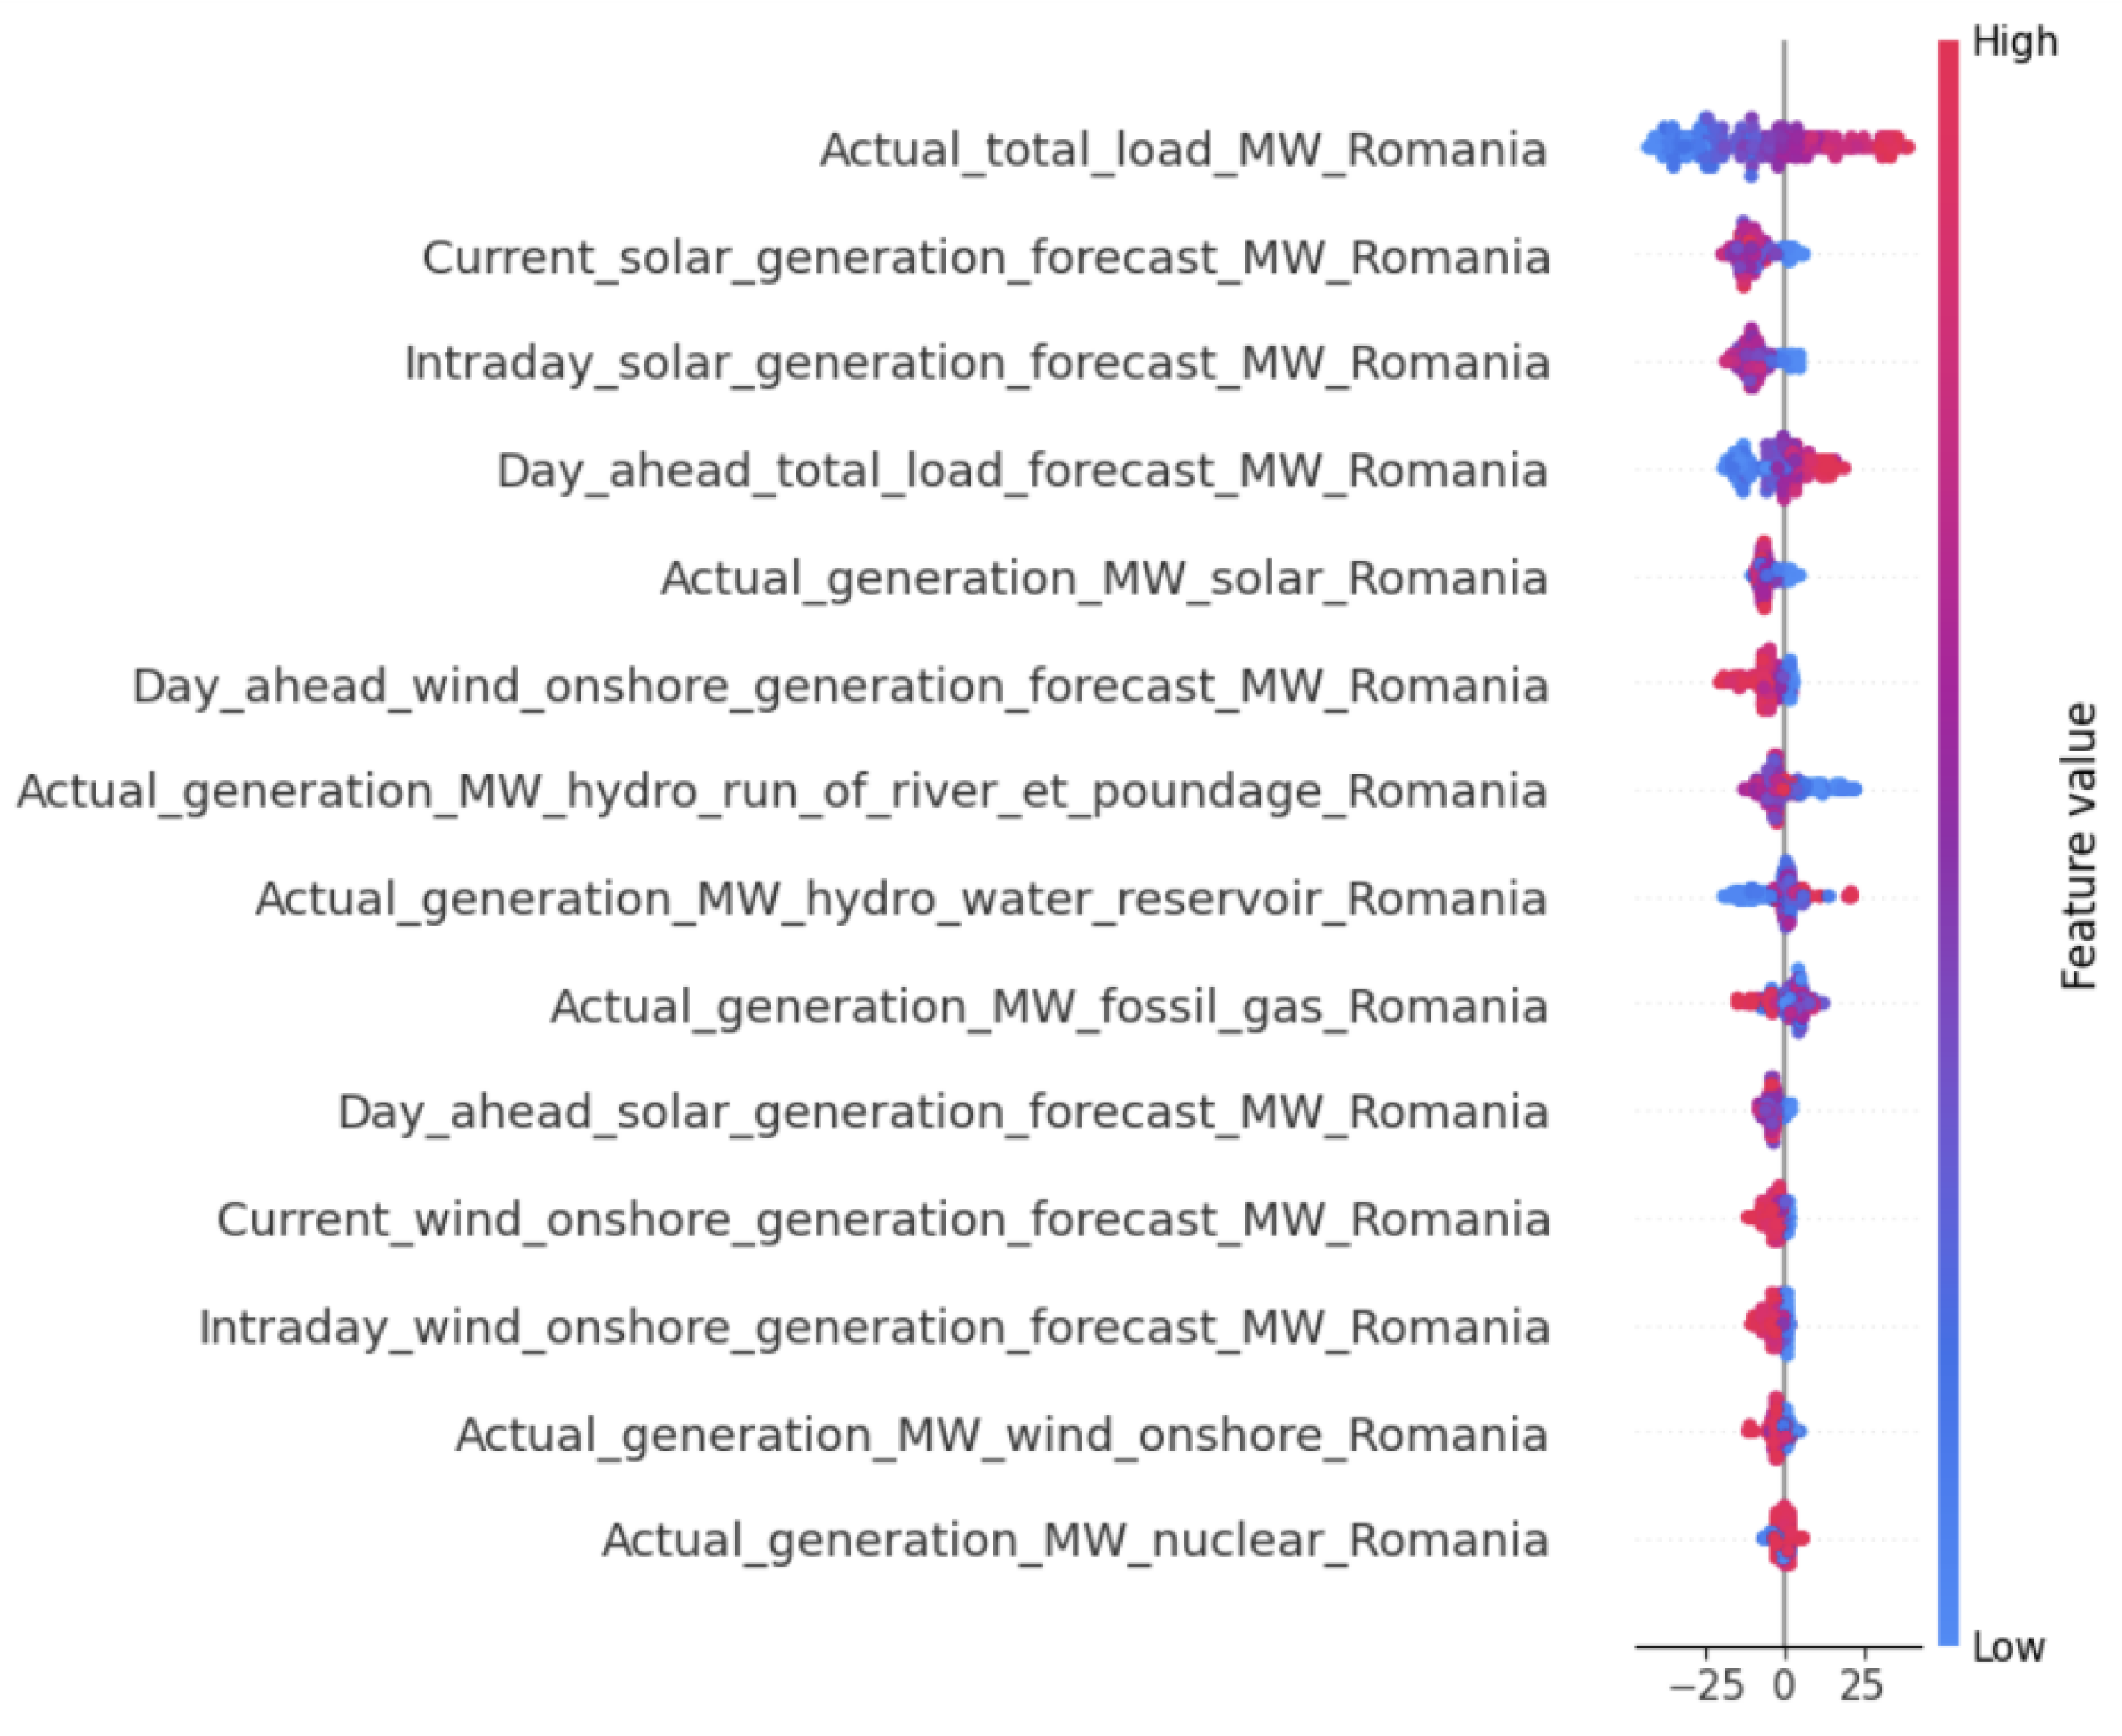

Table 1.
Average Feature Values by Anomaly Type.
| Feature | Normal | Other Anomaly | Price Drop |
|---|---|---|---|
| Price | 94.84 | 56.88 | 0.22 |
| Actual Total Load (MW) | 6143.46 | 6031.65 | 5066.98 |
| Day Ahead Total Load Forecast (MW) | 6155.28 | 6196.16 | 5251.46 |
| Actual Generation Fossil Gas (MW) | 1157.11 | 910.5 | 972.83 |
| Actual Generation Hydro Run of River et Poundage (MW) | 1264.42 | 1297.13 | 988.73 |
| Actual Generation Hydro Water Reservoir (MW) | 822.02 | 755.28 | 203.63 |
| Actual Generation Nuclear (MW) | 1291.62 | 1246.10 | 1251.56 |
| Actual Generation Solar (MW) | 163.91 | 590.26 | 764.68 |
| Actual Generation Wind Onshore (MW) | 821.12 | 1799.85 | 1211.29 |
| Current Solar Generation Forecast (MW) | 217.82 | 787.74 | 1066.39 |
| Current Wind Onshore Generation Forecast (MW) | 809.06 | 1842.13 | 1404.02 |
| Day Ahead Solar Generation Forecast (MW) | 216.96 | 786.45 | 1049.22 |
| Day Ahead Wind Onshore Generation Forecast (MW) | 804.31 | 1840.52 | 1393.66 |
| Intraday Solar Generation Forecast (MW) | 217.90 | 787.74 | 1066.39 |
| Intraday Wind Onshore Generation Forecast (MW) | 809.15 | 1842.13 | 1404.02 |
4. Discussion
The results of our study provide significant insights into the dynamics of electricity price anomalies in the Romanian market and demonstrate the value of explainable AI approaches for understanding these complex phenomena. In this section, we discuss the implications of our findings, compare them with previous research, and highlight their broader significance.
4.1. Renewable Energy Impact on Price Anomalies
Our analysis reveals a dominant association between renewable energy generation and price anomalies, with solar generation emerging as the most influential renewable factor. The SHAP value analysis demonstrates that solar-related features occupy three of the top five most important positions: current solar generation forecasts (mean absolute SHAP: 10.24), intraday solar forecasts (8.94), and actual solar generation (5.76). These solar factors show remarkably consistent negative contributions to price anomalies, with 88-94.5% of contributions driving prices downward across all forecasting horizons.
Wind generation factors, while still significant, demonstrate lower overall importance, with day-ahead wind forecasts ranking sixth (5.49), followed by current wind forecasts (2.82), intraday wind forecasts (2.66), and actual wind generation (2.30). However, wind factors show similarly consistent negative impacts (78.5-80.5% negative contributions), indicating systematic downward price pressure when wind generation increases.
This finding contrasts with previous studies by Wozabal et al. (2016) [13] and Kyritsis et al. (2017) [14] in the German market, where wind generation typically showed stronger influence. The Romanian context reveals solar generation as the primary renewable driver of price anomalies, potentially due to the concentrated temporal nature of solar output creating more pronounced supply-demand imbalances during daylight hours when generation peaks coincide with specific demand patterns.
The relationship between renewable generation and price drops can be explained by the merit order effect, where low-marginal-cost renewable generation displaces higher-cost conventional generation. The data shows that during price drop anomalies, solar generation increases by 367% (from 164 MW to 765 MW) while wind generation increases by 48% (from 821 MW to 1211 MW), demonstrating that solar generation exhibits more extreme variability. During periods of high renewable output combined with reduced demand (18% lower during price drops), this merit order displacement becomes particularly pronounced, creating supply surplus conditions that drive prices to near-zero levels (average 0.22 EUR/MWh during price drops versus 94.84 EUR/MWh during normal periods).
4.2. Load-Generation Balance and Market Flexibility
Our results highlight the critical importance of load dynamics as the primary driver of price anomalies, with actual total load demonstrating the highest feature importance (mean absolute SHAP: 19.17) and predominantly negative contributions (64% of cases). The SHAP analysis reveals that load variations create the most significant impact on anomalous pricing behavior, with effects ranging from -43.25 to 39.13, indicating that both demand increases and decreases can trigger price anomalies. Day-ahead load forecasting accuracy emerges as the fourth most important factor (6.88), showing more balanced contributions (43% positive, 57% negative), emphasizing that both over-forecasting and under-forecasting of demand contribute to price instability.
The combination of reduced system load with elevated renewable generation creates particularly severe conditions for price drops. During price drop anomalies, total load decreases by 18% (from 6143 MW to 5067 MW) while solar generation simultaneously increases by 367% and wind generation by 48%. This dual effect of supply abundance coinciding with demand reduction creates extreme supply surplus conditions that drive prices to near-zero levels. Conversely, "other anomalies" maintain relatively stable demand levels (only 2% reduction) despite high renewable generation, resulting in moderate price suppression rather than market collapse.
This finding points to the need for enhanced demand-side flexibility and improved load forecasting accuracy to accommodate the growing share of variable renewable energy. The predominance of load-related factors in driving anomalies suggests that demand response mechanisms, energy storage, and real-time load management could be more effective than supply-side interventions in mitigating extreme price events. These approaches align with the suggestions of Rintamäki et al. (2017) [15], who argued that market design adaptations focusing on demand flexibility could reduce price volatility associated with renewable integration.
4.3. Conventional Generation Response
An interesting finding from our analysis is the contrasting behavior of conventional generation sources during anomalies, with each technology exhibiting distinct response patterns. The SHAP analysis reveals that fossil gas generation is one of only three features with predominantly positive contributions to price anomalies (73.5% positive impacts), indicating that gas generation variations are systematically associated with upward price pressures. During price drops, gas generation decreases moderately to 973 MW compared to 1157 MW during normal periods, while during other anomalies it reduces more substantially to 911 MW, suggesting strategic output adjustments in response to market conditions.
Hydro generation sources demonstrate markedly different behaviors, with water reservoir generation showing nearly balanced SHAP contributions (51.5% positive, 48.5% negative) but dramatic operational variations. During price drops, reservoir generation falls by 75% (from 822 MW to 204 MW), indicating strategic withholding of flexible hydro resources during low-price periods. This behavior is economically rational, as operators preserve water resources for periods of higher prices. Conversely, run-of-river hydro generation shows predominantly negative contributions (66.5%) with more moderate variations, reflecting its less controllable nature.
Nuclear generation demonstrates the most stable profile with balanced SHAP contributions (50.5% positive, 49.5% negative) and the lowest overall importance (1.46), maintaining relatively consistent output across all anomaly types (1247-1292 MW). This consistency reflects nuclear power's typical operation as inflexible baseload capacity with limited ability to respond to short-term market signals.
These patterns highlight the complex interactions between different generation types in response to market signals, with flexible conventional sources (gas and hydro reservoirs) actively responding to price conditions while inflexible baseload (nuclear) maintains steady operation. The analysis underscores the importance of considering the entire generation portfolio's strategic behavior when analyzing price dynamics, as conventional generators' responses to renewable abundance significantly influence the severity and duration of price anomalies.
4.4. Temporal Patterns in Anomalies
4.4.1. Hour of Day Analysis
The temporal distribution analysis reveals highly structured patterns in anomaly occurrence, with hour of day serving as the dominant temporal predictor. The data demonstrates an extreme concentration of anomalies during morning hours, with 80% of all anomalies occurring between 6:00-12:00. This six-hour window represents a critical period where market conditions consistently favor anomaly development.
The peak anomaly hour occurs at 10:00 AM, accounting for 23% of all observed anomalies (46 out of 200 total). This concentration extends across seven consecutive hours (7:00-13:00) that exhibit above-average anomaly activity, creating a sustained high-risk period that aligns with business hours and peak electricity demand patterns. The sharp decline in anomaly frequency after 13:00, with only 18% occurring during afternoon hours (12:00-18:00) and minimal activity during evening and night periods (2% combined), underscores the specificity of temporal conditions required for anomaly formation.
This pronounced temporal clustering suggests that anomalies are fundamentally linked to predictable daily energy market cycles, particularly the morning industrial ramp-up period and the intersection of renewable energy generation with peak demand patterns. The near-absence of overnight anomalies (1% during 0:00-6:00) is characteristic of electricity markets where demand and supply variations are minimal during low-consumption periods.
4.4.2. Day of Week Patterns
Weekly temporal patterns reveal complex dynamics that operate at a different scale than hourly patterns. Tuesday emerges as the dominant anomaly day, accounting for 24% of all anomalies (48 occurrences), suggesting strong weekly cyclical effects in market behavior. The distribution across weekdays shows varied patterns, with Monday through Friday collectively representing 63.5% of anomalies.
Notably, weekend periods demonstrate significantly higher anomaly rates despite lower absolute numbers. Weekend anomaly rates reach 2.5% compared to 1.8% for weekdays, representing a 42% increase in anomaly intensity. This weekend effect manifests as 73 anomalies across Saturday and Sunday (36.5% of total), indicating that altered market structures during non-business periods create conditions more conducive to anomalous pricing behavior.
The weekend concentration pattern suggests that reduced industrial demand and different generation dispatch patterns create market conditions with higher volatility potential. Saturday records 33 anomalies (16.5%) while Sunday shows 40 anomalies (20%), indicating that weekend market preparation and weekly cycle transitions contribute to anomaly formation.
4.4.3. Integrated Temporal Framework
The temporal analysis establishes that anomaly occurrence operates through a dual-scale temporal structure. Hourly patterns provide precise timing for anomaly occurrence within daily market cycles, while weekly patterns establish the broader market context that influences anomaly likelihood and intensity.
The morning concentration (8:00-12:00 containing 80% of anomalies) represents the intersection of multiple market factors: business hour electricity demand, renewable energy generation profiles, and daily load curve dynamics. This temporal precision enables predictive modeling approaches that can anticipate high-risk periods with considerable accuracy.
The weekly dimension adds contextual depth, where business days create the foundational anomaly environment while weekends intensify anomaly rates through altered market structures. This integrated temporal framework suggests that effective anomaly detection and prediction systems must incorporate both micro-timing (hourly) and macro-context (daily) temporal features to capture the full spectrum of temporal dependencies in electricity price anomalies.
4.5. Methodological Contributions
From a methodological perspective, our approach demonstrates the value of combining machine learning techniques for anomaly detection with explainability methods. The Isolation Forest algorithm proved effective in identifying anomalies without requiring predefined thresholds, while SHAP values provided detailed insights into the contributing factors.
This combination addresses a significant limitation of many existing approaches to anomaly detection in electricity markets, which either rely on simplistic threshold-based methods or provide detection without explanation. Our framework offers both accurate detection and meaningful explanations, bridging the gap between identification and understanding.
The categorization of anomalies into different types (price drops, price spikes, and other anomalies) represents another methodological contribution, enabling more nuanced analysis than binary (anomaly/normal) classifications. This approach reveals that different types of anomalies have distinct patterns and causes, information that would be lost in a simpler classification scheme.
4.6. Limitations and Future Research Directions
While our study provides valuable insights, several limitations should be acknowledged. First, our analysis focuses on a specific time period and market (Romania), and the patterns observed may not generalize to other markets with different structures and generation mixes. Comparative studies across multiple markets would provide a more comprehensive understanding of anomaly dynamics.
Second, our approach relies on historical data and may not capture the effects of structural changes in the market, such as new regulations or significant changes in generation capacity. Incorporating such structural factors could enhance the explanatory power of the model.
Third, the current implementation does not explicitly model the impact of cross-border flows and interconnection capacity, which can significantly influence price formation in integrated European markets. Future research could extend the framework to include these factors.
Several promising directions for future research emerge from our work:
- Extending the framework to incorporate forecasting capabilities, enabling not only detection and explanation of anomalies but also prediction of their occurrence.
- Developing more sophisticated anomaly categorization schemes that capture a wider range of anomaly types and their characteristics.
- Investigating the potential for using the insights gained from anomaly explanation to design market interventions or trading strategies that mitigate or capitalize on anomalies.
- Applying the framework to other electricity markets to identify common patterns and market-specific factors in anomaly formation.
- Exploring the use of deep learning approaches combined with explainability techniques for more complex pattern recognition in electricity price data.
These future directions would build upon the foundation established in this study and further advance our understanding of electricity market dynamics in the context of energy transition.
5. Conclusions
This research has successfully developed and implemented an explainable artificial intelligence framework for the detection and comprehensive analysis of electricity price anomalies within the Romanian market context. Through the strategic integration of Isolation Forest algorithms for anomaly detection, Random Forest methodologies for predictive modeling, and SHAP values for interpretative explanation, this study has established a robust analytical approach that transcends mere anomaly identification to provide substantive insights into the fundamental mechanisms driving aberrant market behavior.
The investigation reveals that solar generation emerges as the predominant renewable energy driver of price anomalies, fundamentally challenging previous scholarly assumptions that emphasized wind generation's primacy in this regard. Solar-related parameters demonstrate remarkable prominence within the analytical framework, occupying three of the five most influential positions in SHAP analysis while maintaining consistently negative contributions ranging from 88% to 94.5% across all examined forecasting horizons. During periods characterized by price drop anomalies, solar generation exhibits extraordinary volatility, increasing by 367% relative to normal operational conditions, thereby creating pronounced supply-demand imbalances that systematically generate downward price pressures, particularly during peak daylight generation periods when solar output intersects with specific demand configurations.
Concurrently, load dynamics manifest as the primary determinant of anomalous pricing behavior, with actual total load demonstrating the highest feature importance at a mean absolute SHAP value of 19.17. The analysis elucidates that both demand escalations and reductions possess the capacity to trigger price anomalies, with effects spanning from -43.25 to 39.13. The critical observation emerges that price drops occur during convergent conditions wherein abundant renewable generation, characterized by 367% increases in solar output and 48% increases in wind generation, coincides with substantially diminished system demand, reduced by 18%, creating extreme supply surplus scenarios that drive pricing to near-zero levels of 0.22 EUR/MWh compared to the normal operational baseline of 94.84 EUR/MWh.
The temporal analysis establishes highly structured patterns in anomaly manifestation, with 80% of all observed anomalies concentrated within a six-hour morning window spanning 6:00 to 12:00. The peak anomaly occurrence materializes at 10:00 AM, representing 23% of all documented anomalous events. This pronounced temporal clustering indicates that anomalies are intrinsically linked to predictable daily energy market cycles, particularly the morning industrial escalation period and the intersection of renewable generation with peak demand patterns. Furthermore, weekend periods demonstrate 42% elevated anomaly rates compared to weekday patterns, suggesting that altered market structures during non-business periods create environmental conditions more conducive to anomalous pricing behavior.
Conventional generation sources exhibit distinctive strategic response patterns during anomalous periods. Fossil gas generation demonstrates predominantly positive contributions to price anomalies, with 73.5% positive impacts indicating systematic association with upward price pressures. Hydro water reservoir generation displays the most dramatic responsive behavior, declining by 75% during price drops from 822 MW to 204 MW, reflecting strategic withholding of flexible resources during low-price periods. Nuclear generation maintains the most stable operational profile with balanced contributions and consistent output ranging from 1247 to 1292 MW, confirming its fundamental role as inflexible baseload capacity.
The differentiation between price drop events and other anomalous categories reveals crucial market dynamics, with price drops averaging 0.22 EUR/MWh occurring when elevated renewable generation coincides with reduced demand, while alternative anomalies averaging 56.88 EUR/MWh represent scenarios where elevated renewable generation encounters stable demand levels. This categorical distinction demonstrates that demand behavior constitutes the critical differentiating factor between moderate price suppression and complete market collapse, providing actionable intelligence for market stability management strategies.
The investigation further reveals that forecasting inaccuracies across multiple temporal horizons contribute significantly to anomaly formation mechanisms. Day-ahead load forecasting accuracy emerges as the fourth most influential factor, with both over-forecasting and under-forecasting contributing to price instability. Solar forecasting demonstrates consistent patterns across day-ahead, intraday, and current horizons, while wind forecasting exhibits similar consistency, indicating that renewable energy prediction uncertainty compounds across multiple temporal scales to create compounding market volatility.
These findings possess profound implications for diverse market stakeholders. Market participants can leverage these insights to develop sophisticated trading strategies by identifying specific temporal windows and environmental conditions that create anomaly-prone market environments. System operators and regulators should prioritize enhanced demand-side flexibility mechanisms over traditional supply-side interventions, given the demonstrated dominance of load dynamics in anomaly formation. The temporal predictability of anomalous events offers opportunities for proactive market interventions during identified high-risk periods.
From a methodological perspective, this research demonstrates the substantial value of combining unsupervised anomaly detection with supervised prediction modeling and explainable artificial intelligence techniques. The categorization approach reveals that distinct anomaly types possess unique formation mechanisms, critical information that would be obscured in binary classification schemes. The integration of multiple forecasting horizons provides comprehensive insights into how prediction uncertainties compound to create market instability, while the dual-scale temporal analysis framework enables predictive modeling approaches capable of anticipating high-risk periods with considerable accuracy.
This investigation contributes substantially to the expanding field of explainable artificial intelligence applications in energy markets by providing a transparent methodological framework that enhances understanding of price formation mechanisms under conditions of increasing renewable penetration. The findings challenge established assumptions regarding wind dominance in renewable-driven anomalies while establishing load dynamics as the primary controllable factor for market stability maintenance. As electricity markets continue evolving with accelerating renewable deployment and changing consumption patterns, this explainable artificial intelligence framework provides essential analytical tools for navigating the complexities of the ongoing energy transition, offering a foundation for developing sophisticated market management approaches that maintain stability while accommodating the inherently variable nature of renewable energy sources.
Data Availability Statement
The data used in this study are available from the ENTSO-E Transparency Platform (https://transparency.entsoe.eu/)
Data and code are available via
Acknowledgments
This paper is supported through the project "IDA Institute of Digital Assets'', CF166/15.11.2022, CN760046/23.05.2023; the project ``AI for Energy Finance (AI4EFin)'', CF162/15.11.2022, CN760048/23.05.2023, financed under the Romania’s National Recovery and Resilience Plan, Apel nr. PNRR-III-C9-2022-I8; and the Marie Skłodowska-Curie Actions under the European Union's Horizon Europe research and innovation program for the Industrial Doctoral Network on Digital Finance, acronym DIGITAL, Project No. 101119635.
Declaration of Generative AI and AI-assisted technologies in the writing process
During the preparation of this work, the authors used two AI-assisted tools: Claude (Anthropic) for text editing, grammar checking, and rewording of specific paragraphs to improve clarity and academic writing style, and Manus AI for additional grammar checking, language enhancement, and manuscript formatting assistance. After using these tools, the authors carefully reviewed and edited all content and take full responsibility for the accuracy and integrity of the publication.
Conflicts of Interest
The authors declare no conflict of interest.
References
- Weron, R. (2006). Modeling and forecasting electricity loads and prices: A statistical approach. John Wiley & Sons.
- Zhao, J. H., Dong, Z. Y., Li, X., & Wong, K. P. (2007). A framework for electricity price spike analysis with advanced data mining methods. IEEE Transactions on Power Systems, 22(1), 376-385. [CrossRef]
- Janczura, J. , Trück, S., Weron, R., & Wolff, R. C. (2013). Identifying spikes and seasonal components in electricity spot price data: A guide to robust modeling. Energy Economics, 38, 96-110. [CrossRef]
- Amjady, N., & Keynia, F. (2010). Electricity market price spike analysis by a hybrid data model and feature selection technique. Electric Power Systems Research, 80(3), 318-327. 80. [CrossRef]
- Chen, X., Dong, Z. Y., Meng, K., Xu, Y., Wong, K. P., & Ngan, H. W. (2012). Electricity price forecasting with extreme learning machine and bootstrapping. IEEE Transactions on Power Systems, 27(4), 2055-2062. [CrossRef]
- Wang, J., Gu, C., & Liu, K. (2022). Anomaly electricity detection method based on entropy weight method and isolated forest algorithm. Frontiers in Energy Research, 10, 984473.
- Banik, S., Saha, S. K., Banik, T., & Hossain, S. M. M. (2023). Anomaly Detection Techniques in Smart Grid Systems: A Review. 2023 IEEE World AI IOT Congress (AIIOT). arXiv:2306.02473.
- Lundberg, S. M., & Lee, S. I. (2017). A unified approach to interpreting model predictions. In Advances in Neural Information Processing Systems.
- González-Briones, A., Palomino-Sánchez, J., Vale, Z., Ramos, C., & Corchado, J. M. (2025). Evolution of Building Energy Management Systems for greater sustainability through explainable artificial intelligence models. Engineering Applications of Artificial Intelligence, 147, 110324. [CrossRef]
- Zhao, Z., Wang, M., Wei, J., Cen, X., Du, S., Wu, Z., Liu, H., & Wang, W. (2025). Interpretable Machine Learning for Multi-Energy Supply Station Revenue Forecasting: A SHAP-Driven Framework to Accelerate Urban Carbon Neutrality. Energies, 18(7), 1624. [CrossRef]
- Khodayar, M., Liu, G., Wang, J., & Khodayar, M. E. (2021). Deep learning in power systems research: A review. CSEE Journal of Power and Energy Systems, 7(2), 209-220.
- Noura, H. N., Yaacoub, J. P. A., Salman, O., & Chehab, A. (2025). Advanced Machine Learning in Smart Grids: An overview. Internet of Things and Cyber-Physical Systems, 5, 95-142. [CrossRef]
- Wozabal, D., Graf, C., & Hirschmann, D. (2015). The effect of intermittent renewables on the electricity price variance. OR Spectrum, 38(3), 687-709. [CrossRef]
- Kyritsis, E., Andersson, J., & Serletis, A. (2017). Electricity prices, large-scale renewable integration, and policy implications. Energy Policy, 101, 550-560.
- Rintamäki, T., Siddiqui, A. S., & Salo, A. (2016). How much is enough? Optimal support payments in a renewable-rich power system. Energy, 117, 300-313. [CrossRef]
- Ketterer, J. C. (2014). The impact of wind power generation on the electricity price in Germany. Energy Economics, 44, 270-280. [CrossRef]
Disclaimer/Publisher’s Note: The statements, opinions and data contained in all publications are solely those of the individual author(s) and contributor(s) and not of MDPI and/or the editor(s). MDPI and/or the editor(s) disclaim responsibility for any injury to people or property resulting from any ideas, methods, instructions or products referred to in the content. |
© 2025 by the authors. Licensee MDPI, Basel, Switzerland. This article is an open access article distributed under the terms and conditions of the Creative Commons Attribution (CC BY) license (http://creativecommons.org/licenses/by/4.0/).
Copyright: This open access article is published under a Creative Commons CC BY 4.0 license, which permit the free download, distribution, and reuse, provided that the author and preprint are cited in any reuse.


