Submitted:
05 August 2025
Posted:
06 August 2025
You are already at the latest version
Abstract
We investigate the applicability of visual foundation models, a recent advancement in artificial intelligence, for archaeological remote sensing. In contrast to earlier approaches, we employ a strictly zero-shot methodology, testing the hypothesis that such models can perform archaeological feature detection without any fine-tuning or other adaptation for the remote sensing domain. Across five experiments using satellite imagery, aerial LiDAR, and drone video data, we assess the models’ ability to detect archaeological features. Our results demonstrate that such foundation models can achieve detection performance comparable to that of human experts and established automated methods. A key advantage lies in the substantial reduction of required human effort and the elimination of the need for training data. To support reproducibility and future experimentation, we provide open-source scripts and datasets and suggest a novel workflow for remote sensing projects. If current trends persist, foundation models may offer a scalable and accessible alternative to conventional archaeological prospection.
Keywords:
landscape archaeology
; automatic feature detection
; foundation models
1. Introduction: Foundation Models in Archaeological Remote Sensing
The term Foundation Model was popularized in 2021 by an article by Bommasani et al. [6] from the Stanford Institute for Human-Centered Artificial Intelligence (HAI). Foundation models are characterized by their training on massive, broad datasets, often consisting of billions of elements, and their ability to generalize across a wide range of downstream tasks. In other words, these models are not limited to the purposes for which they were originally trained, but can adapt to new, unseen applications.
A widely known example of such models is large language models (LLMs), such as ChatGPT developed by OpenAI [2]. These models accept text as input and generate meaningful textual output. More recently, the field has seen the development of so-called multimodal foundation models, which extend input and output modalities to include combinations of text, images, video, and audio. This paper focuses specifically on a subset of multimodal foundation models that process imagery or video as input, hence called visual large language models (vLLM).
This category has emerged only recently, made possible through advances in algorithms such as CLIP (Contrastive Language–Image Pretraining) by Radford et al. [37]. During training, CLIP connects images with written descriptions by analyzing hundreds of millions of captioned images. This allows the models to "understand" both pictures and text in a shared way. State-of-the-art systems such as GPT-4.1 or Google Gemini [12] exemplify this new generation of multimodal models. However, not all vision foundation models are text-conditioned. For instance, the Segment Anything Model (SAM) developed by Meta AI [16] operates on images and image coordinates instead.
1.1. Vision Foundation Models in Remote Sensing
Interest in foundation models within the remote sensing research community has increased significantly since around 2023, following the release of models such as Prithvi by IBM and NASA [26] and RemoteCLIP [27]. Since then, numerous foundation models for the remote sensing domain have been developed, although detailing them lies beyond the scope of this article. Readers are instead referred to recent survey articles such as by Mai et al. [30], Xiao et al. [42] and especially Lu et al. [29], Huo et al. [15], and Tao et al. [39], which provide the most up-to-date perspectives.
A key observation across the majority of projects discussed in these surveys is the reliance on large-scale remote sensing datasets sourced from the domain of interest. These datasets are typically used either to train a foundation model from scratch or to fine-tune an existing model for domain-specific applications. The rationale behind this approach stems from the fact that general-purpose foundation models, such as ChatGPT and Gemini, are primarily trained on image data taken from the internet that include only a very limited number of remote sensing images—particularly with respect to multispectral or hyperspectral imagery. Early empirical results supported the view that such models, without adaptation, are not well suited to remote sensing tasks.
1.2. Applications in Archaeological Remote Sensing
Huo et al. [15] articulate this prevailing sentiment in the remote sensing community by stating that “fine-tuning is essential for foundation models adapting to specific domains…” (p. 5). This, however, presents particular challenges for sub-domains such as archaeological remote sensing. First, archaeological datasets are typically small, often consisting of only a few dozen identified sites, which is insufficient for training foundation models at scale. Second, the process of training or fine-tuning AI models requires significant technical expertise and computational resources — both of which are often unavailable to archaeological research teams.
These limitations may explain the relatively small number of published studies applying foundation models to archaeological remote sensing. Nonetheless, several efforts have begun to explore this intersection. Within the GeoPACHA project, for instance, a domain-specific model named DeepAndes was developed based on DINOv2. This model was trained on over three million multispectral satellite images to support archaeological investigations in the Andean region [13,40,45]. Although the authors do not explicitly describe their model as a foundation model, the work by Canedo et al. [7] is also notable. Their study used a large dataset of LiDAR and orthophotos to train a vision transformer model capable of detecting ancient burial mounds.
However, some other researchers have challenged the assumption that training or fine-tuning is a prerequisite for effective application of foundation models in this field. Motivated perhaps by the lack of training data, they instead employ foundation models in a so-called "zero-shot" [36] setting, where no training at all is applied.
For example, Abate et al. [1] successfully utilized Sentinel satellite imagery in combination with ChatGPT, which was tasked with generating scripts for downstream analysis of archaeological features. Similarly, Ciccone [9] employed ChatGPT to develop a software assistant for detecting archaeological anomalies in multispectral orthophotos. Arnold and Tilton [4] examined the use of various multimodal foundation models, including ChatGPT and Google Gemini, to analyze image collections related to cultural heritage, with remote sensing data forming a subset of the imagery used in their study.
2. Foundation Models Used in This Study
We began by identifying a broad selection of visual foundation models based on selection criteria such as support for zero-shot inference, public availability, and recency. The initial shortlist included GPT-4.1 by OpenAI [2], Gemini 2.0-flash by Google [12], PaliGemma 2 [38], Qwen-VL 2.5 [5], DeepSeek-VL 2 [41], Microsoft Florence-2 [43], YOLO-World [8], and SAM 2.1 [16]. Preliminary experiments indicated that GPT-4.1, Gemini 2.0-flash, and SAM 2.1 consistently outperformed the other models in terms of detection quality. Consequently, to maintain clarity and focus, we restrict the presentation of results in this study to these three models.
3. Experiments
The first three experiments evaluate the efficacy of GPT-4.1 and Gemini 2.0-flash in detecting archaeological sites using satellite imagery and aerial LiDAR data. The final two experiments examine the applicability of SAM 2.1 to aerial LiDAR and drone-acquired video data, respectively.
Readers are encouraged to consult the accompanying supplementary materials (see Section 5) for a more comprehensive understanding of the results, particularly with respect to video output presented in Experiment 5.
3.1. Experiment 1: Detection of Castles in Bavaria, Germany in Satellite Imagery
3.1.1. Methodology
This experiment focused on detecting medieval castles and ruins in the German state of Bavaria. A dataset comprising 379 known castle coordinates was obtained from the Bavarian state heritage authority (Bayerische Schlösser- und Seenverwaltung). Satellite imagery was downloaded from Microsoft Bing, which offers image resolutions of up to 30 cm per pixel at little or no cost [32]. One of its limitations is that the actual resolution for any given location is not indicated due to Bing's use of unified global imagery from undisclosed sources [25]. Visual inspection of the data suggested an effective resolution of approximately 50 cm per pixel, which was deemed sufficient for this study.
Each of the 379 castle locations was downloaded as a GeoTIFF file with dimensions of 768 × 786 pixels, using the highest available resolution. This ensured that all castles were completely within the image with a suitable margin of 15 to 30 percent. To establish a control dataset for negative cases, 1,000 random coordinates across Bavaria were similarly sampled and processed. While this yields a 379:1000 ratio, it must be noted that castles similarly to the majority of archaeological feature types obviously occupy less than one percent of the entire landscape. Thus, the distribution only partly represents the actual spatial prevalence of archaeological sites. The size of the negative sample was rather determined based on the feasibility of manual inspection.
We then developed a set of scripts for Google Colab that pair each of these images with a standardized text prompt and submit it to the selected foundation model. Finding an optimal prompt requires extensive experimentation; however, we empirically determined that the following version yielded satisfactory results:
Figure 1.
Gemini 2.0-flash prompt for Bavarian castle detection, text highlights by authors
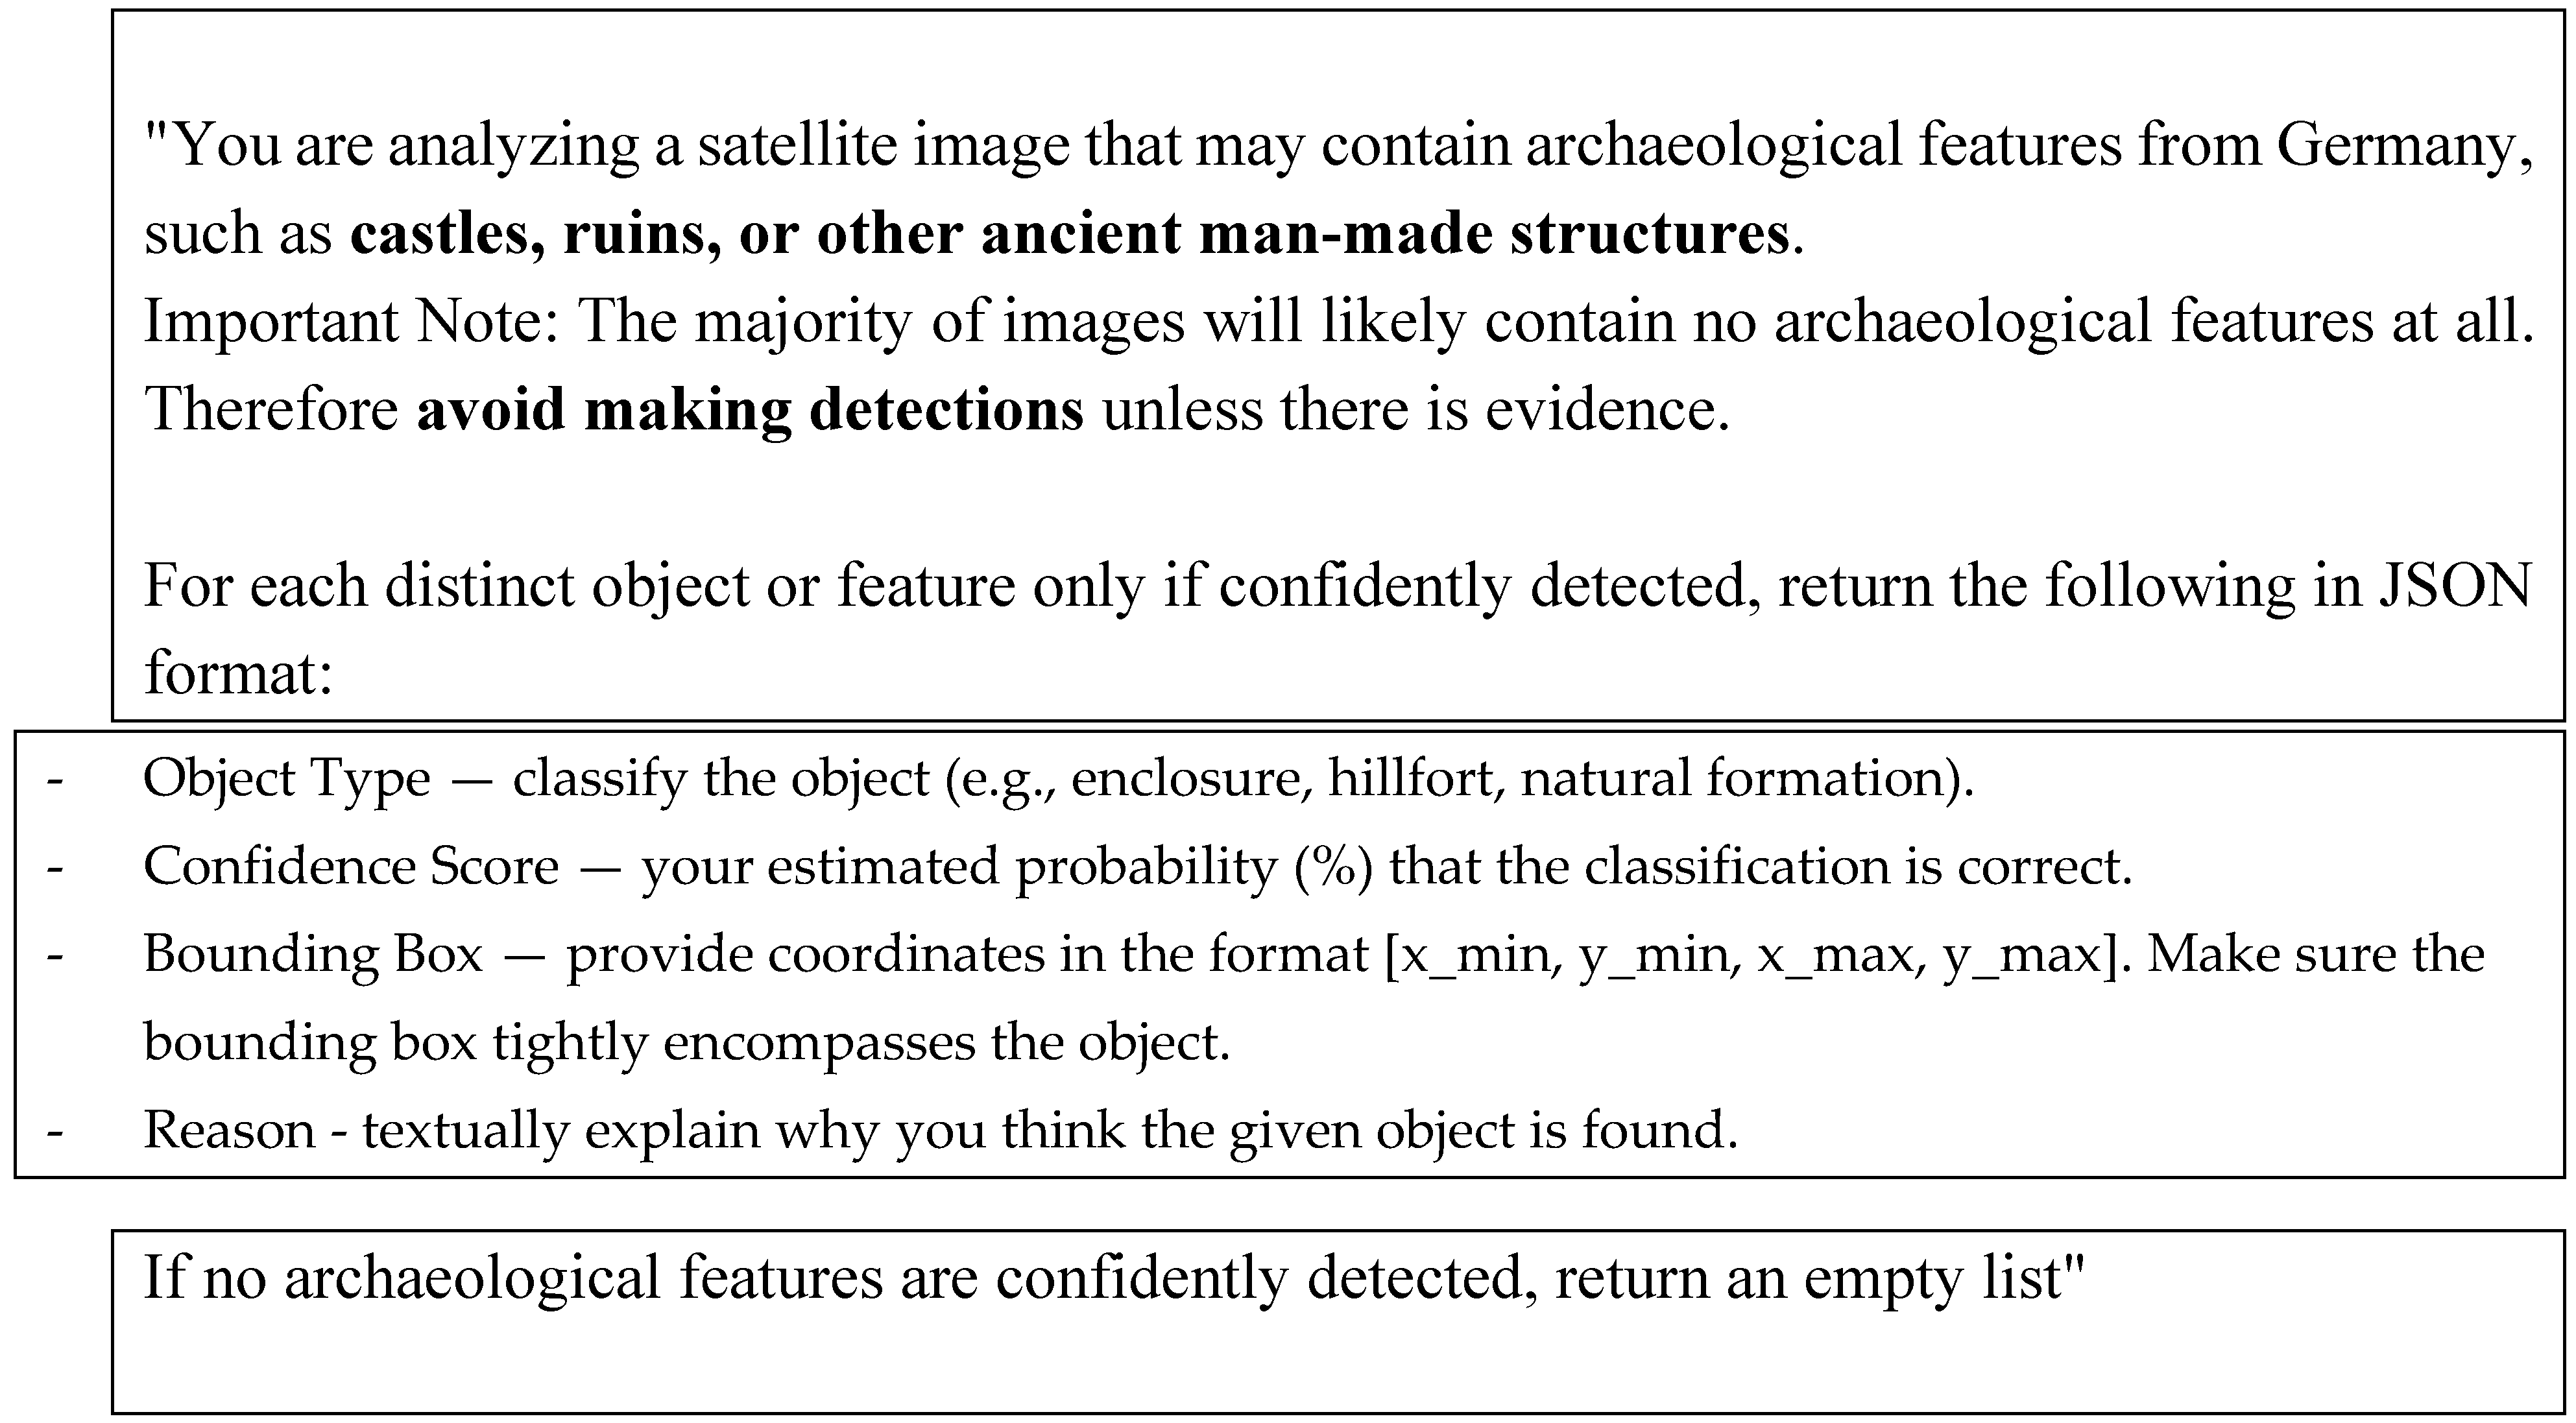
This prompt emphasizes the importance of avoiding false positives by explicitly instructing the model to withhold detections unless supported by evidence. Furthermore, it specifies the expected output fields—such as object type, bounding box coordinates, and classification confidence—in JSON, a popular data description language. This allows for scalable, automated post-processing across large datasets. Additionally, requiring a justification ("Reason") for each detection provides valuable insight into the model’s internal reasoning, which we found useful for iterative prompt refinement. Examples of such outputs are presented below.
The model outputs were automatically processed to visualize detections by overlaying bounding boxes and associated classification metadata on each image. To facilitate interpretation and evaluation, images were categorized as follows: those from the positive dataset containing at least one detection were labeled as true positives (TP), while those with no detections were labeled as false negatives (FN). Conversely, in the negative dataset, images with detections were marked as false positives (FP), and those without detections as true negatives (TN).
It is important to note that this classification scheme introduces a small degree of inaccuracy. For example, a detection may be recorded even if the predicted bounding box does not sufficiently overlap with the actual archaeological feature. As a result, the summary statistics presented in Table 2 may contain minor discrepancies. Based on visual inspection, we estimate that the classification error introduced by such cases is below 10%.
3.1.2. Quantitative Results
Table 2 reports the statistical evaluation for each of the foundation models tested. In addition to precision and recall, we report the F1 score, the harmonic mean of precision and recall, instead of accuracy. The F1 score is particularly appropriate in the context of archaeological remote sensing [10,34], as it balances two critical concerns: false positives (i.e., low precision), which waste time and resources during the necessary manual validation process; and false negatives (i.e., low recall), which risk the loss of potentially irreplaceable cultural heritage.

Table 2.
Statistics for Bavarian castles experiment.
| Model | TP | FN | TN | FP | Precision | Recall | F1 |
|---|---|---|---|---|---|---|---|
| GPT-4.1 | 244 | 135 | 899 | 101 | 71 % | 64 % | 67 % |
| Gemini 2.0-flash | 144 | 235 | 998 | 2 | 99 % | 38 % | 55 % |
Before interpreting the results, it is important to establish a performance baseline by considering the hypothetical outcomes of a human specialist. The Bing satellite imagery used in this study was obviously captured during the summer, when many castle sites are partially or entirely obscured by tree cover and dense vegetation. Furthermore, the dataset includes sites that are so heavily deteriorated that identifying them from a satellite perspective is extremely challenging (see example images below). Based on visual inspection, we estimate that even experienced human analysts would be able to detect only approximately two-thirds of the castles in the dataset. Detection rates would likely vary depending on the individual analyst's expertise in interpreting satellite imagery.
For the control dataset of random landscape, it is reasonable to assume that optimal human performance would result in fewer than 1% false positives. However, this rate may increase due to fatigue, particularly when analysts are required to process large, visually repetitive landscapes over extended periods.
The results for both models given in table 2 are therefore very promising and indicate that they are indeed capable of identifying a large percentage of castles or castle ruins in satellite imagery without any prior training or configuration. GPT leads with a recall rate of 64%, that is, very close to a hypothetical human analyst, while Gemini achieves a significantly lower result of only 38%.
The two models also differ significantly in their false positive rates. GPT shows a rate of around 10%, which is much higher than the expected 1% rate of human analysts. In contrast, Gemini's false positive rate is only 0.2%, which more closely aligns with the human baseline. However, it is important to interpret this result with caution: the absolute number of false positives produced by Gemini is low (only two cases) which limits the statistical robustness of this finding. Further experiments with larger datasets would be necessary to confirm the reliability of this trend.
3.1.3. Qualitative Results and Preliminary Assessment
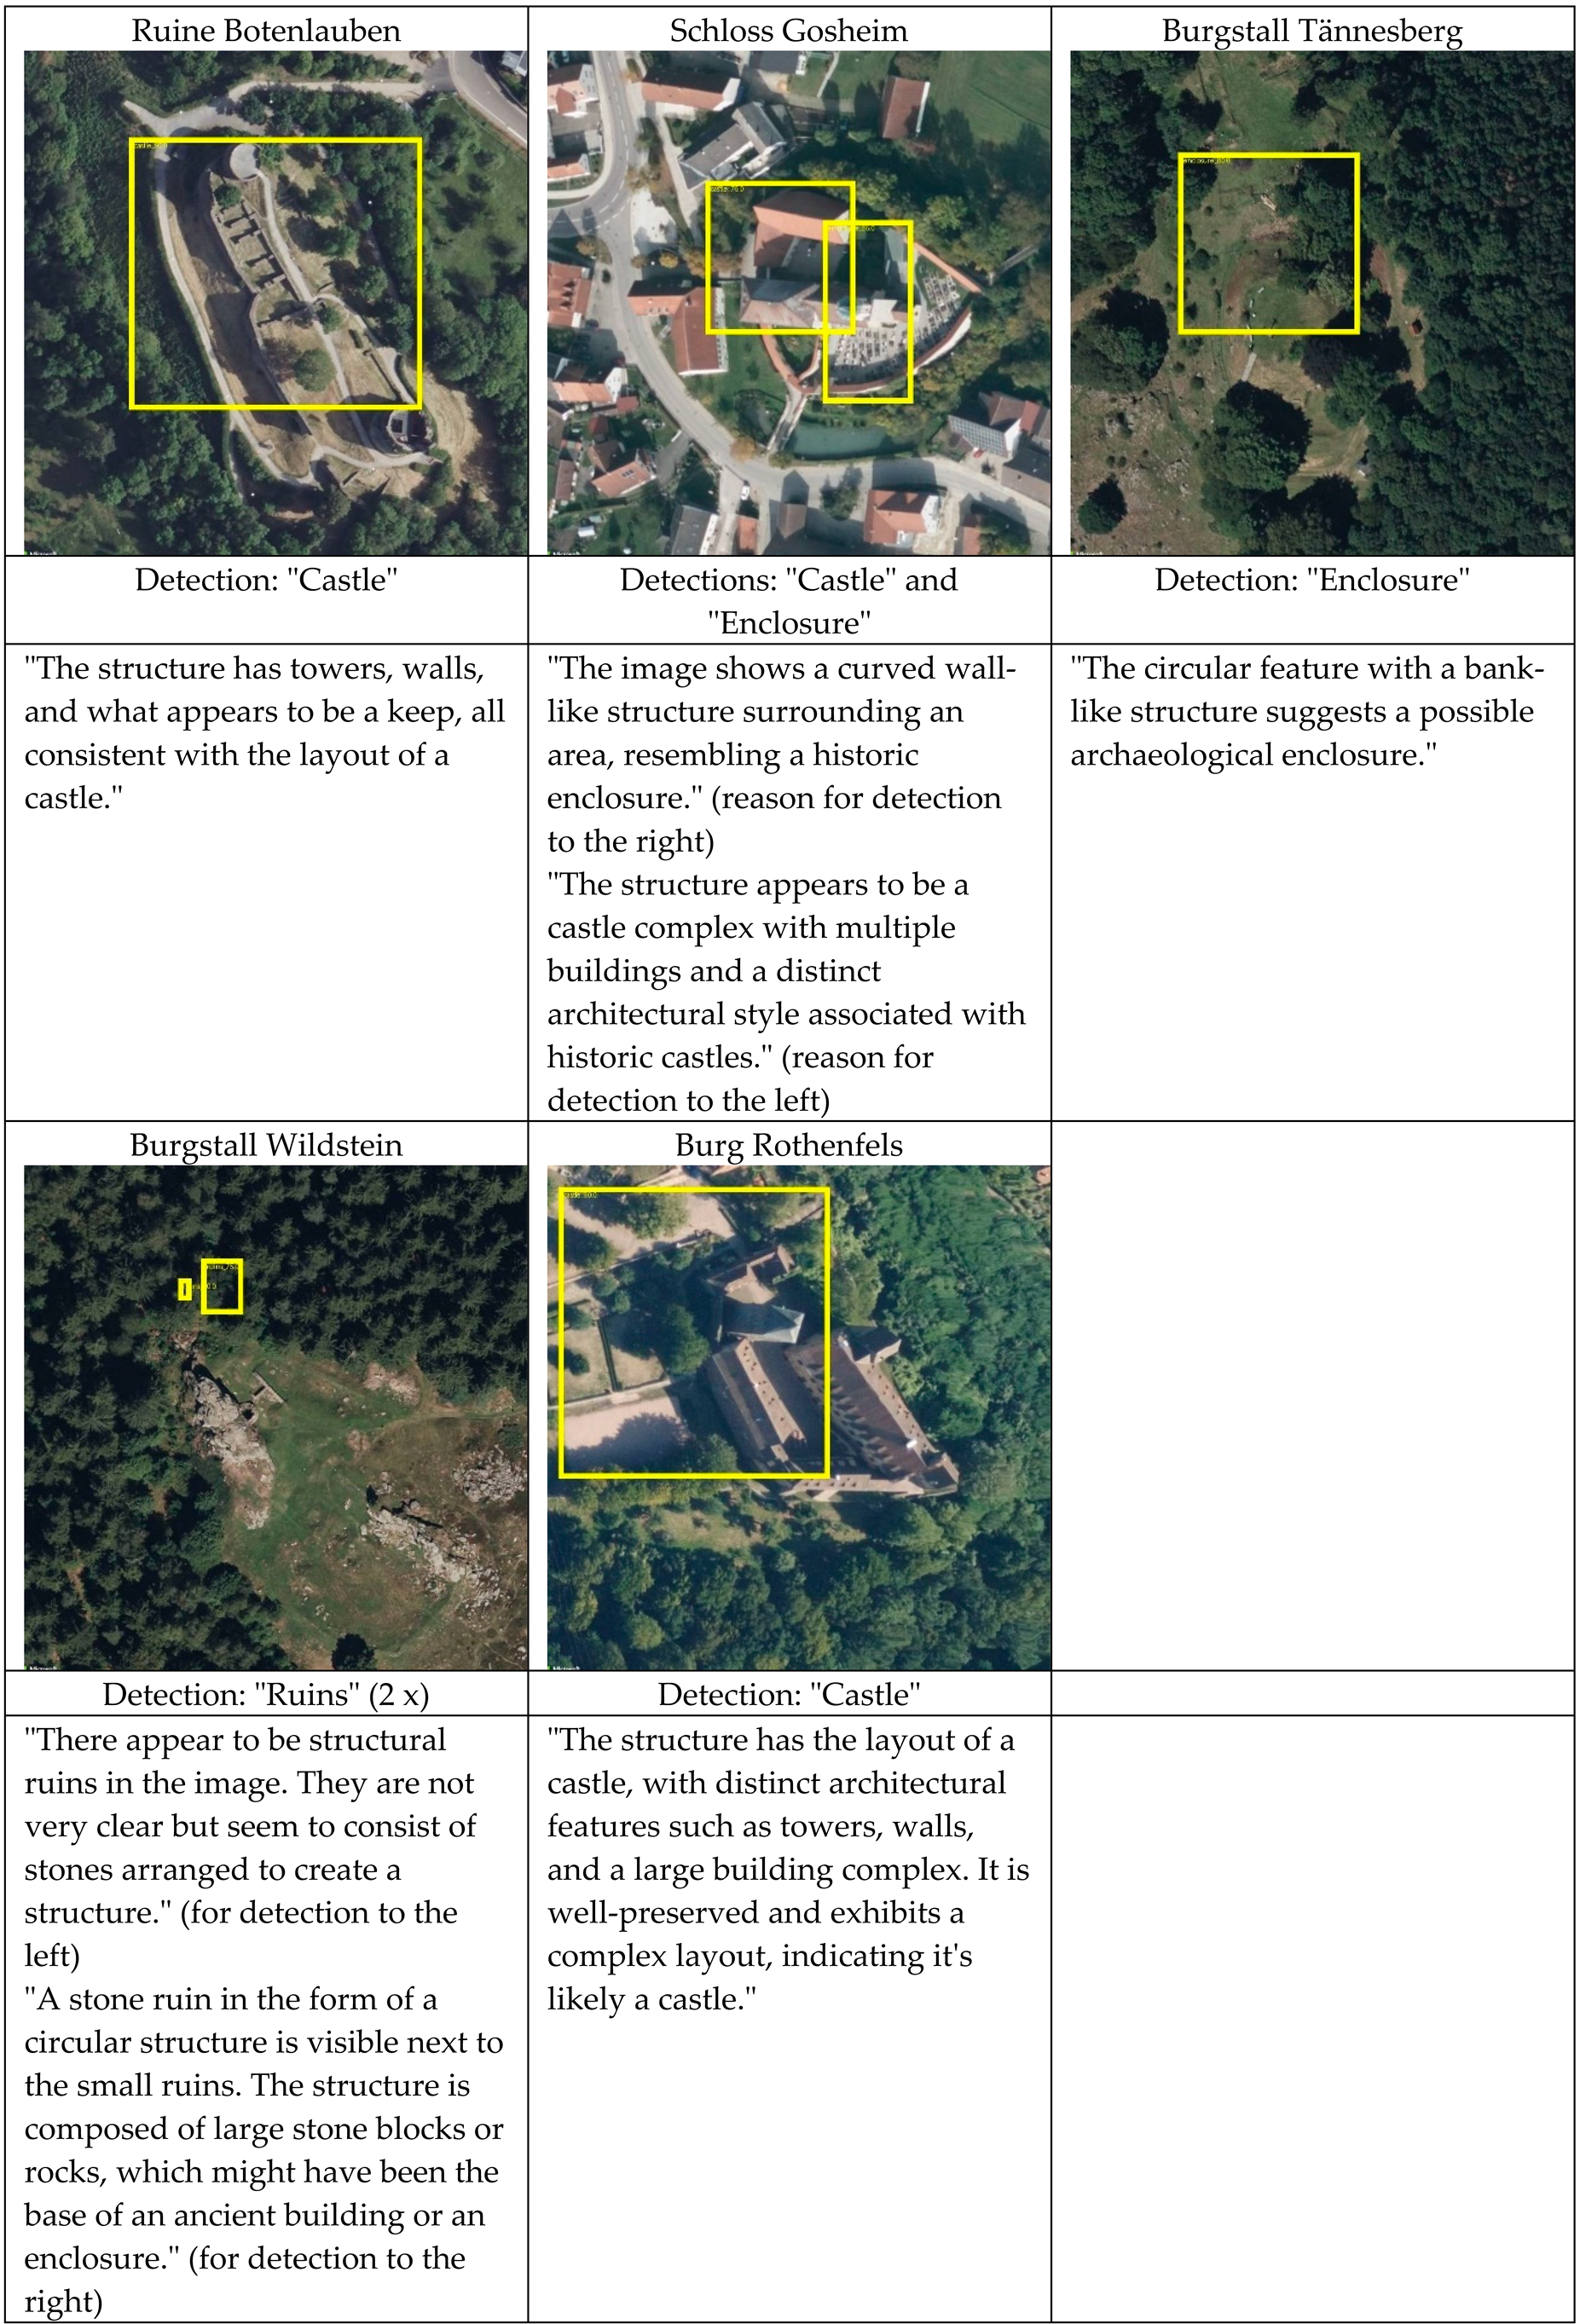
Table 3 and Table 4 present selected example outputs for GPT-4.1 and Gemini 2.0-flash, respectively. Both models exhibit certain shared characteristics. For instance, it appears that detections often do not encompass the entire structure of a castle but instead focus on distinctive architectural elements, such as a tower or keep (e.g., Burgruine Thanstein, Burgstall Wildstein, Burg Hartenstein). The precision of the generated bounding boxes varies considerably, ranging from relatively accurate delineations (e.g., Ruine Botenlauben) to significantly misaligned or imprecise boxes (e.g., Burg Rothenfels), and in some cases, the bounding boxes do not intersect with the actual castle remains at all (e.g., Burgruine Thanstein, Burgruine Natternberg).
Notably, the models occasionally succeed in detecting features partially obscured by vegetation (e.g., Burgstall Dietrichstein, Burgstall Tännesberg), suggesting a degree of robustness to challenging image conditions. Regarding the generated "Reason" texts, many appear to be drawn from stylistic patterns typical of archaeological descriptions and often capture the visual context with a reasonable degree of accuracy. However, further research with larger and more diverse datasets is necessary to identify consistent patterns and draw more definitive conclusions about model behavior and reliability in archaeological remote sensing tasks.
Table 2.
True positives detected by GPT4.1 (bounding boxes in yellow, detection type and reason text given underneath each image). All images in this section are ground size 150 m x 150 m and are north facing, © Microsoft Bing.
Table 2.
True positives detected by GPT4.1 (bounding boxes in yellow, detection type and reason text given underneath each image). All images in this section are ground size 150 m x 150 m and are north facing, © Microsoft Bing.
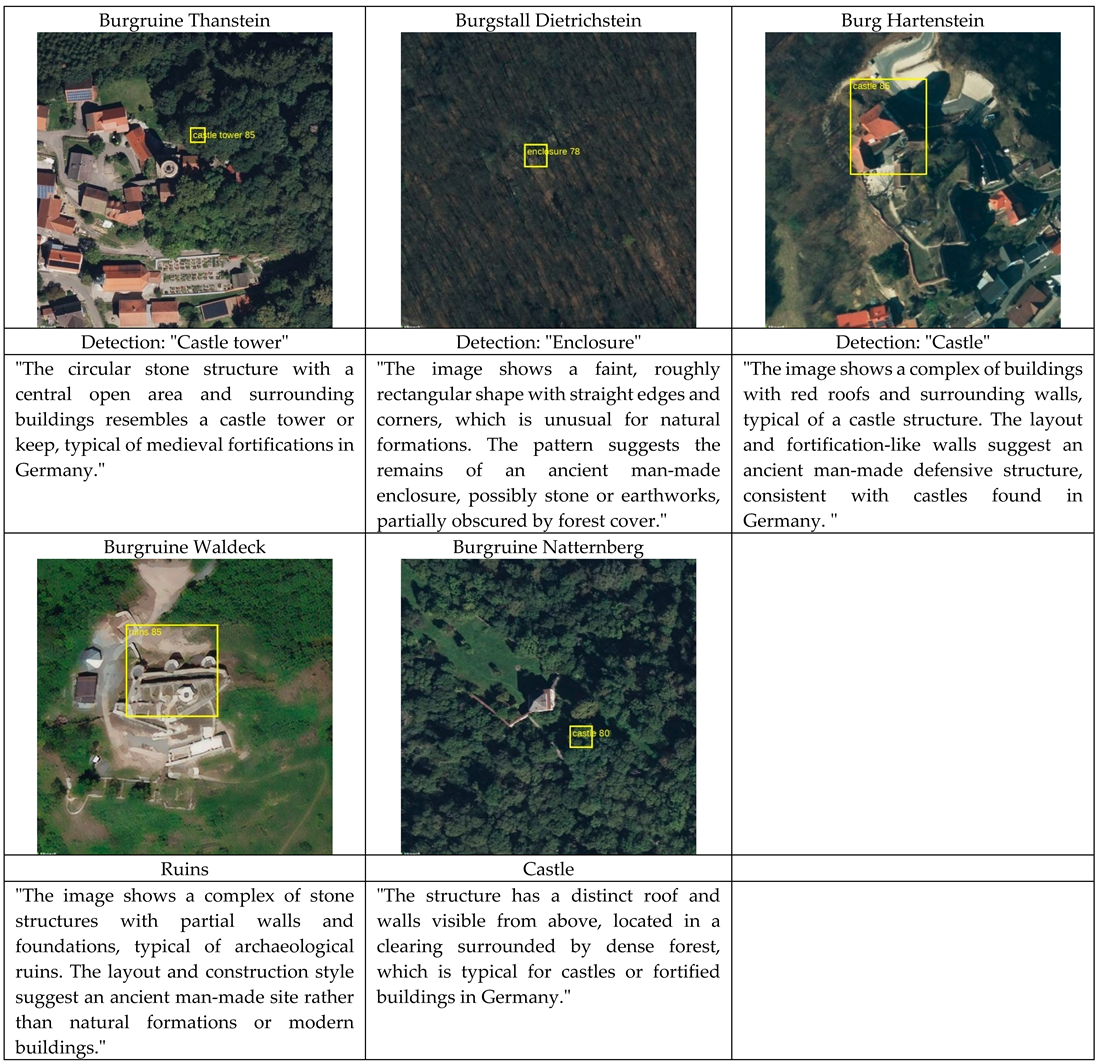
Table 3.
True positives detected by Gemini-2.0-flash (bounding boxes in yellow, detection type and reason text given underneath each image).
Table 3.
True positives detected by Gemini-2.0-flash (bounding boxes in yellow, detection type and reason text given underneath each image).
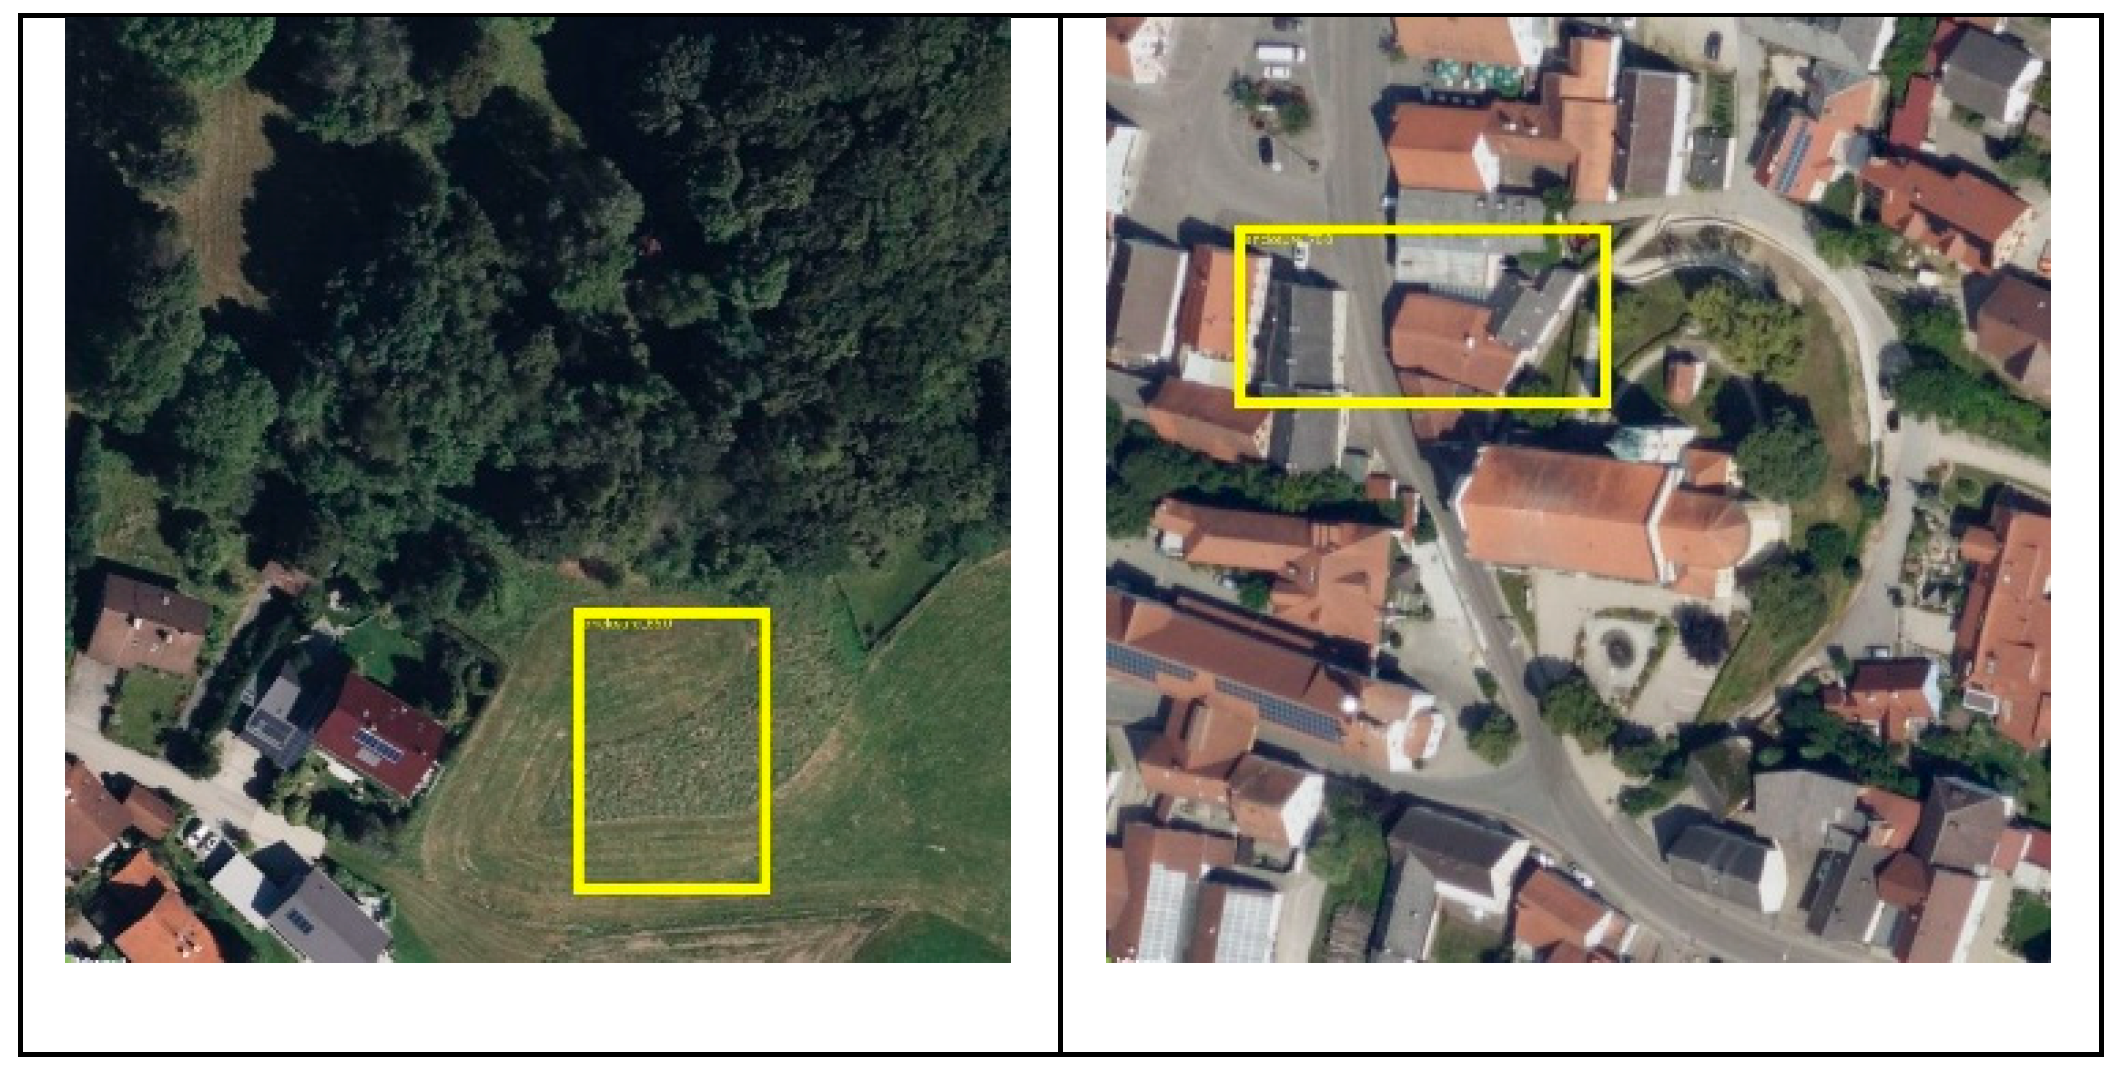
In the case of false positives, GPT-4.1 exhibited clear instances of so-called hallucinations (Figure 5). This phenomenon, common among foundation models (Huang et al., 2023), refers to evidently incorrect or implausible outputs such as detections in locations devoid of any archaeological features, whose underlying causes are not yet fully understood. For the two false positives produced by Gemini 2.0-flash (Figure 6), a more interpretable rationale can be proposed: it is plausible that the model was misled by modern housing structures in the imagery, which may share superficial spatial or geometric characteristics with archaeological remains.
Figure 4.
False positives from GPT4.1.
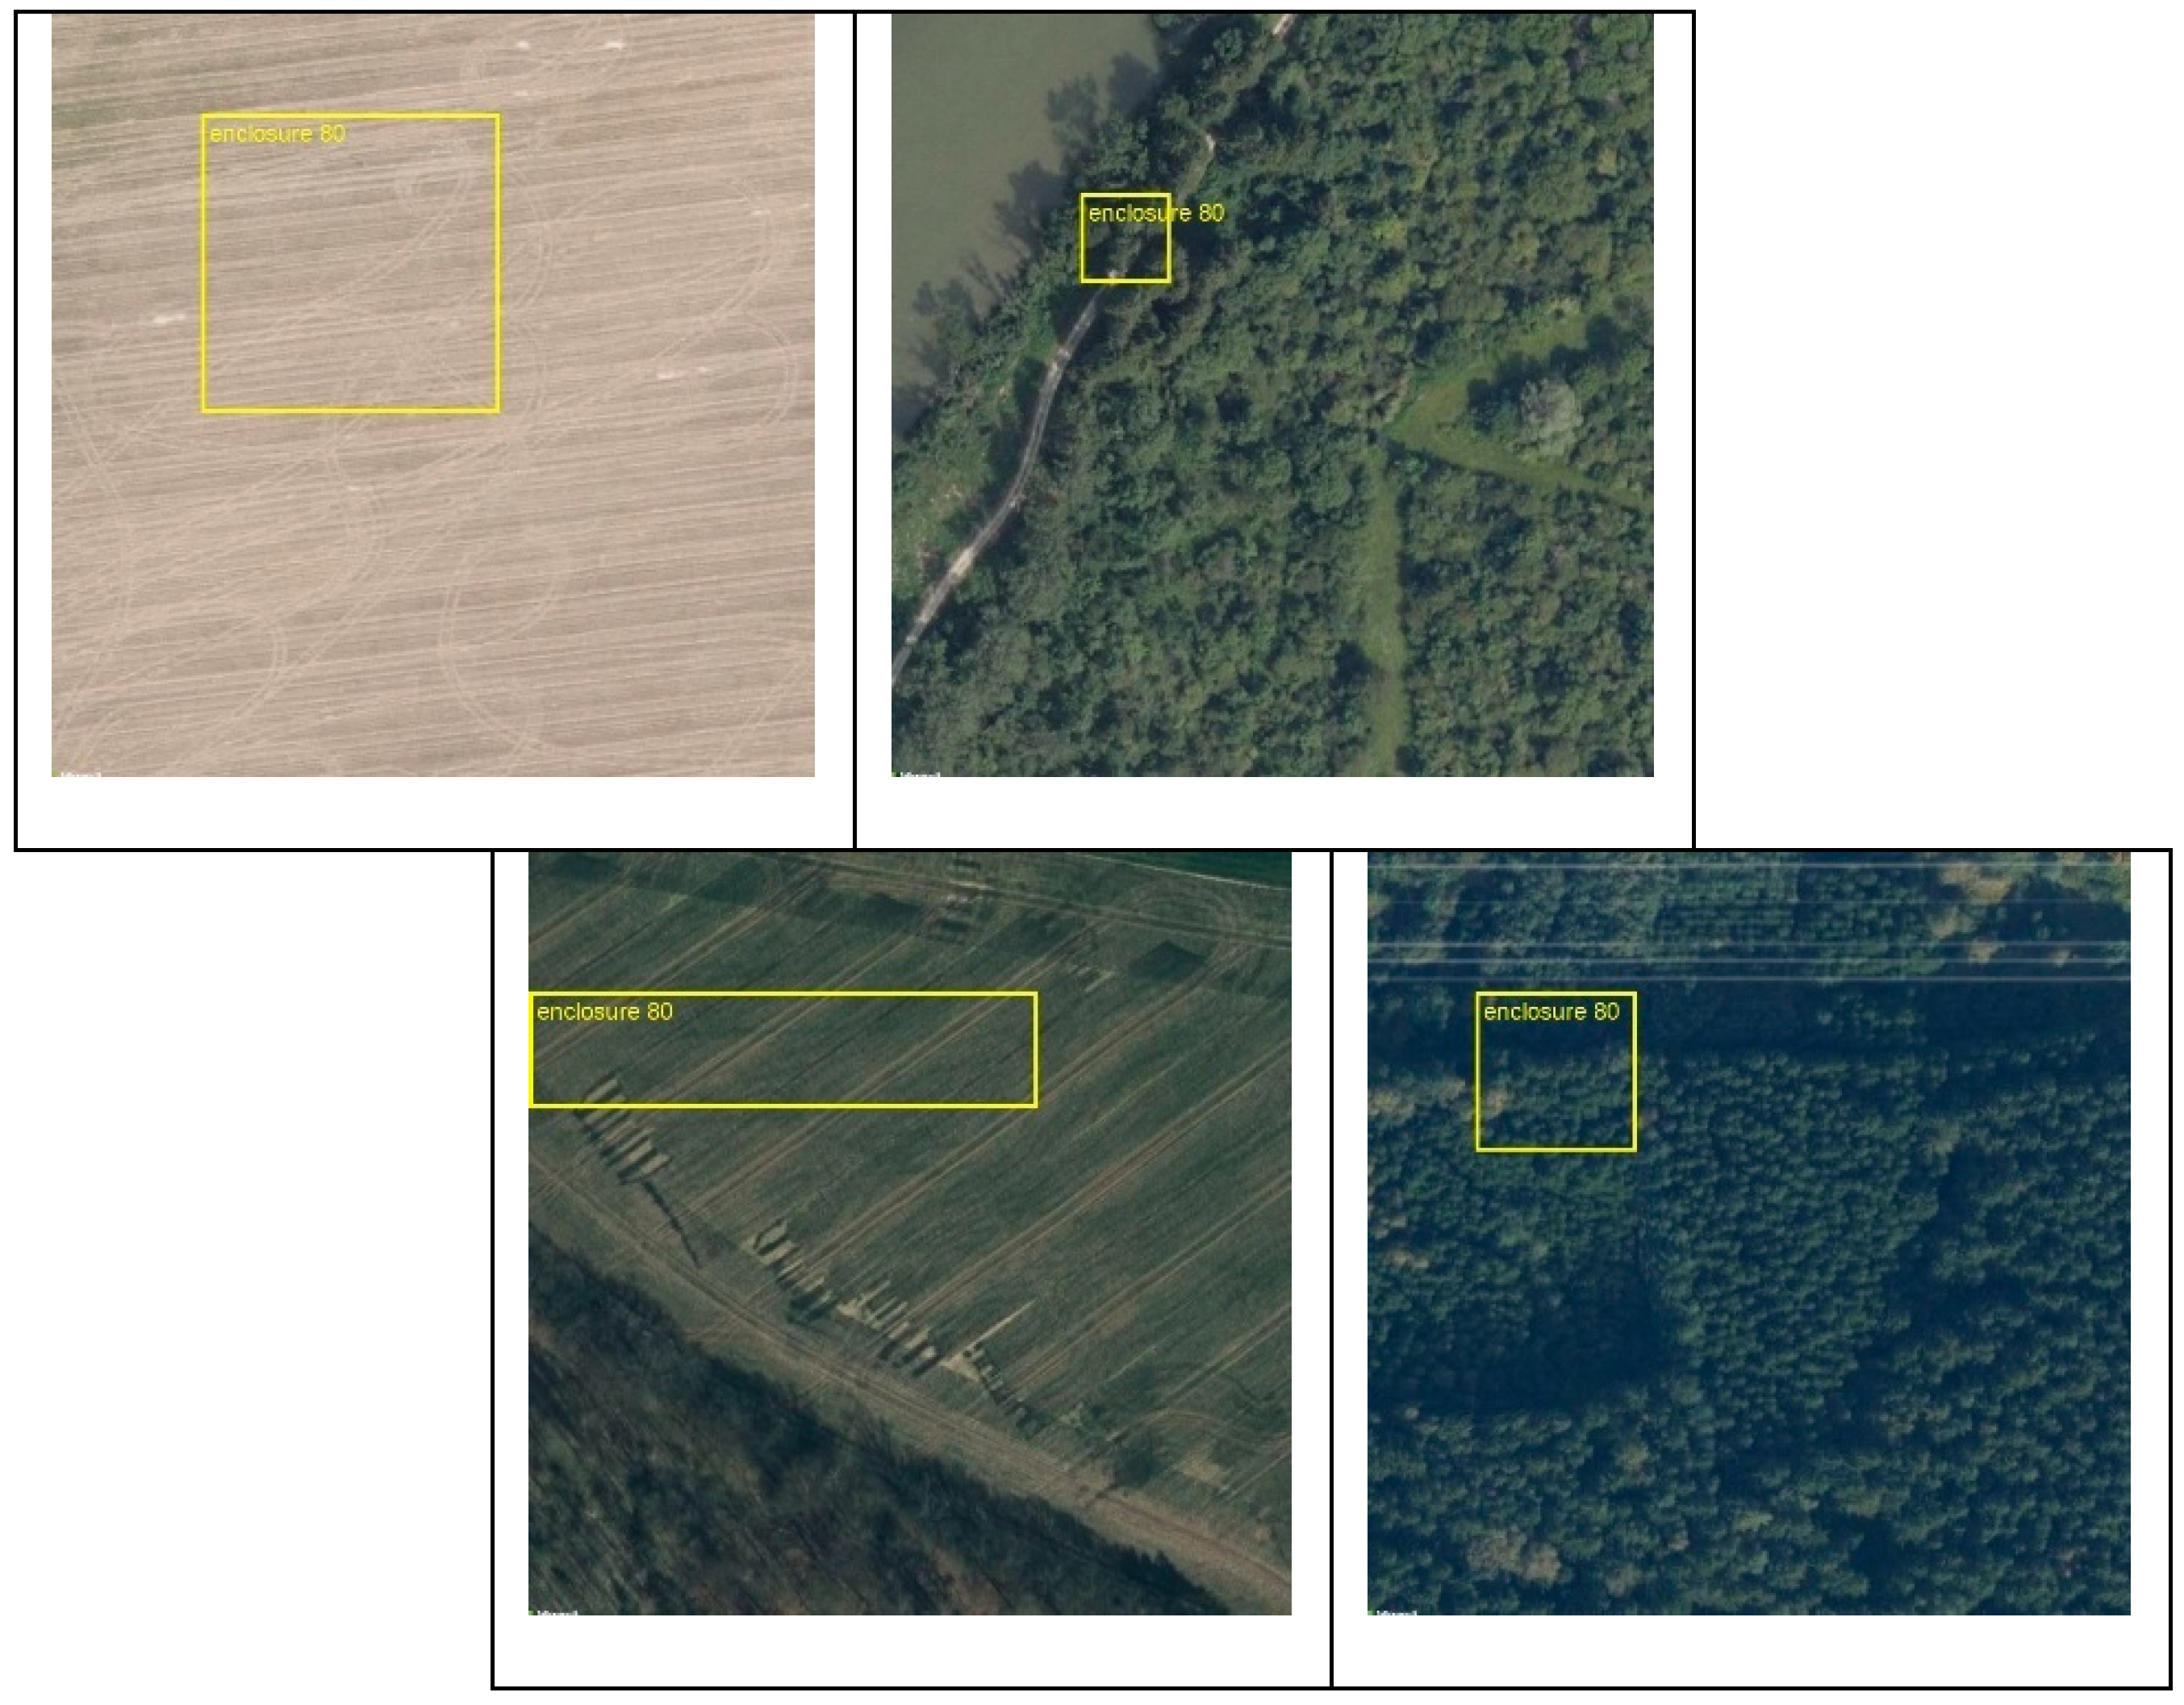
Figure 5.
False positives from Gemini 2-0 flash
3.2. Experiment 2: Detection of Angkorian Temples in Satellite Imagery
3.2.1. Methodology
To assess the generalizability of the models, we conducted a second benchmark using a thematically and geographically distinct dataset: Angkorian temple structures in Cambodia. This dataset includes 100 temple coordinates, sourced from previous archaeological studies [18]. Unlike the castles used in the previous experiment, the majority of these temples are not widely documented online or in academic literature in ways that would be accessible to Foundation models during training. We therefore hypothesize that most of them can be considered "previously unseen" by the models.
In addition, visual inspection revealed that fewer than 10% of them were listed on Google Maps, which may have served as a data source for Foundation model training.
As before, each location was processed into a 480 × 480-pixel image using the same Bing download method. Again, a negative control sample of 1,000 random coordinates from across Cambodia was also created and processed identically. The same scripts were used for model evaluation but the prompts were modified, as we found empirically that this yielded better results. The prompt used here reads:
Figure 6.
GPT-4.1 prompt for Angkorian temple detection, text highlights by authors.

Note that we made important changes to the prompt, especially when defining the objects we are trying to detect. In particular, we not only mention “temple” but also “reservoir” and “moat”. This is because we empirically found that the models often detected not the temple per se but rather structures regularly accompanying Angkorian temples, namely temple moats and reservoirs.
3.2.2. Quantitative Results
Table 8 shows that GPT-4.1 again emerged as the best-performing model, successfully detecting 57% of the temple sites. However, this rate was accompanied by a considerable number of false positives (9.8 %). In contrast, Gemini 2.0-flash identified only approximately one third of the temples (32%), but it achieved a substantially lower false positive rate of just 2.3 %. Overall, these results confirm a trend similar to that observed in the castle detection experiment discussed earlier.
In general, when scanning unknown areas for previously undocumented temples, archaeologists face a trade-off between higher detection rates and increased false positives. This dilemma is particularly evident here with GPT-4.1 with its false positive rate of 9.8%, raising concerns about its practical applicability in large-scale surveys where Gemini 2.0-flash seems to be better suited.
Additionally, the F1 scores in this experiment were generally lower than those in experiment 1. This reduction in performance is possibly due to the more degraded and fragmented condition of the Angkorian temples (in comparison with the well-preserved Bavarian castles). These structures, having endured the harsh tropical climate and recent military conflicts, present a more challenging context for automated detection.
Table 7.
Statistics for Angkorian temples experiment.
| Model | TP | FN | TN | FP | Precision | Recall | F1 |
|---|---|---|---|---|---|---|---|
| GPT-4.1 | 57 | 43 | 902 | 98 | 37 % | 57 % | 45 % |
| Gemini 2.0-flash | 32 | 68 | 977 | 23 | 58 % | 32 % | 41 % |
3.2.3. Qualitative Results and Preliminary Assessment
In addition to the statistical evaluation presented above, we report several observations based on a visual inspection of the AI-generated results (see tables 9 and 10 below). As in the previous section, the four tables below provide examples of true positives and false negatives for both models.
As above, it is evident that the predicted bounding boxes are frequently imprecise - often either too small or only partially overlapping with the detected object. However, GPT4.1 tended to produce more accurate bounding boxes overall. When comparing the correctly identified temples, we observed that the two models often detected different true positives. There was considerable variation in both directions; temples identified by one model were sometimes missed by the other. Similarly, the labeling of detected features differed between the models. Gemini classified 51 features as "reservoir" and 32 as "temple," whereas GPT labeled 24 as "temple," 21 as "moat," and 12 as "reservoir." These labels correspond to the texts given as reasons for the AI prediction by each model. As with the castle detections, the vocabulary used appears to originate from scholarly literature on Angkorian archaeology. Notably, while the term "moat" is present in the Gemini reason texts it did not label any detection as a moat.
A useful perspective is that archaeological datasets are inherently incomplete. Archaeologists can never assume that our survey or analytical results are exhaustive, given the fragmentary nature of the material record. From this standpoint, even if an AI model fails to detect a substantial portion of known features, for instance, missing 43% of temples, the identification of any previously unrecorded structures still constitutes a significant contribution. The value lies not necessarily in comprehensive detection, but in expanding the known corpus and demonstrating new methodological possibilities.
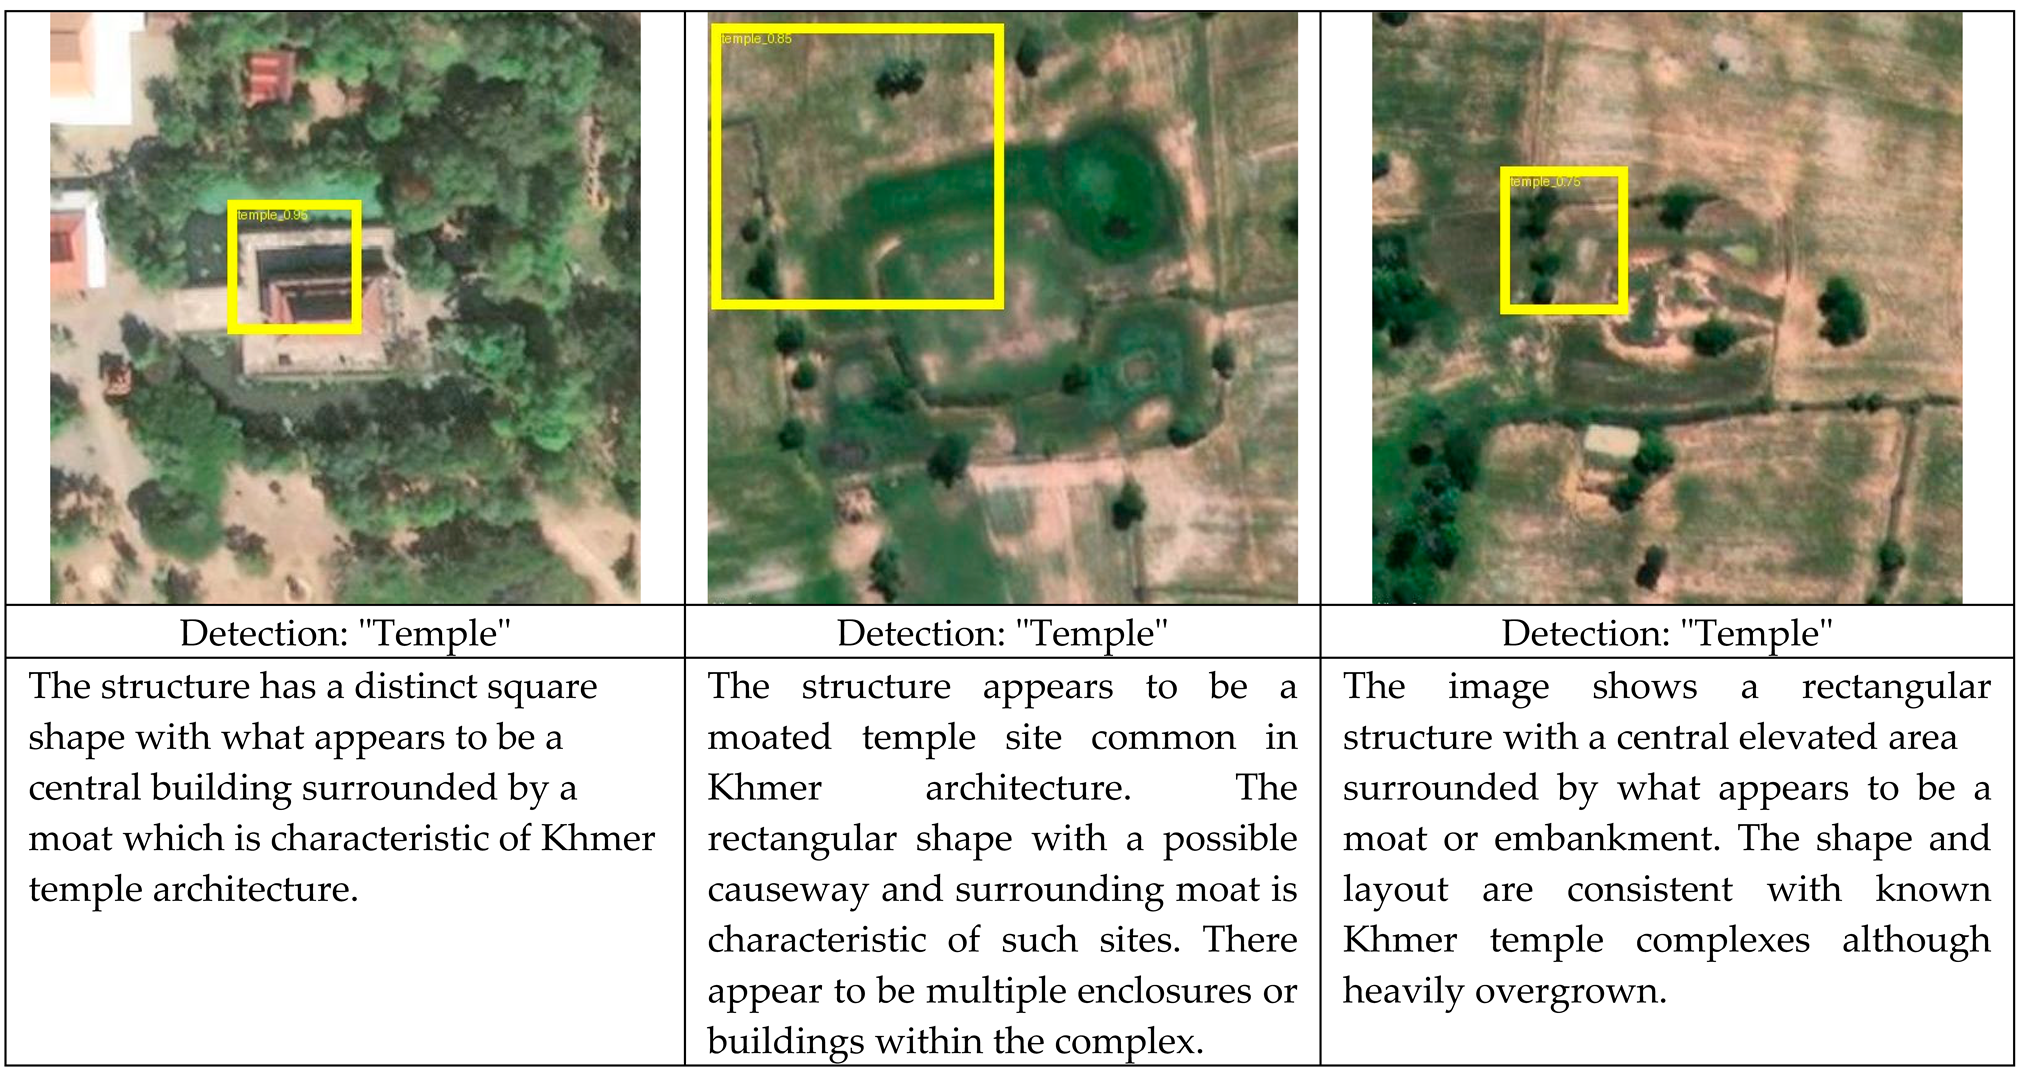
Table 8.
True positives detected by GPT4.1 (bounding boxes in yellow, detection type and reason text given underneath each image). All images in this section are ground size 100 m x 100 m and are north facing, © Microsoft Bing.
Table 8.
True positives detected by GPT4.1 (bounding boxes in yellow, detection type and reason text given underneath each image). All images in this section are ground size 100 m x 100 m and are north facing, © Microsoft Bing.

Table 9.
True positives detected by Gemini-2.0-flash (bounding boxes in yellow, detection type and reason text given underneath each image)
Table 9.
True positives detected by Gemini-2.0-flash (bounding boxes in yellow, detection type and reason text given underneath each image)
In addition to detection, the interpretive rationale provided by the AI models can offer valuable support to archaeological analysis. While these explanations are not always accurate, they help guide the researcher’s eye and prompt critical evaluation of identified features. In this sense, the model functions much like a human collaborator: even when its reasoning is flawed, it contributes to the interpretive process by surfacing new hypotheses and framing points of discussion. This mirrors the way archaeologists often debate the significance of features in the field or lab, and suggests that AI can play a productive role in that ongoing interpretive dialogue.
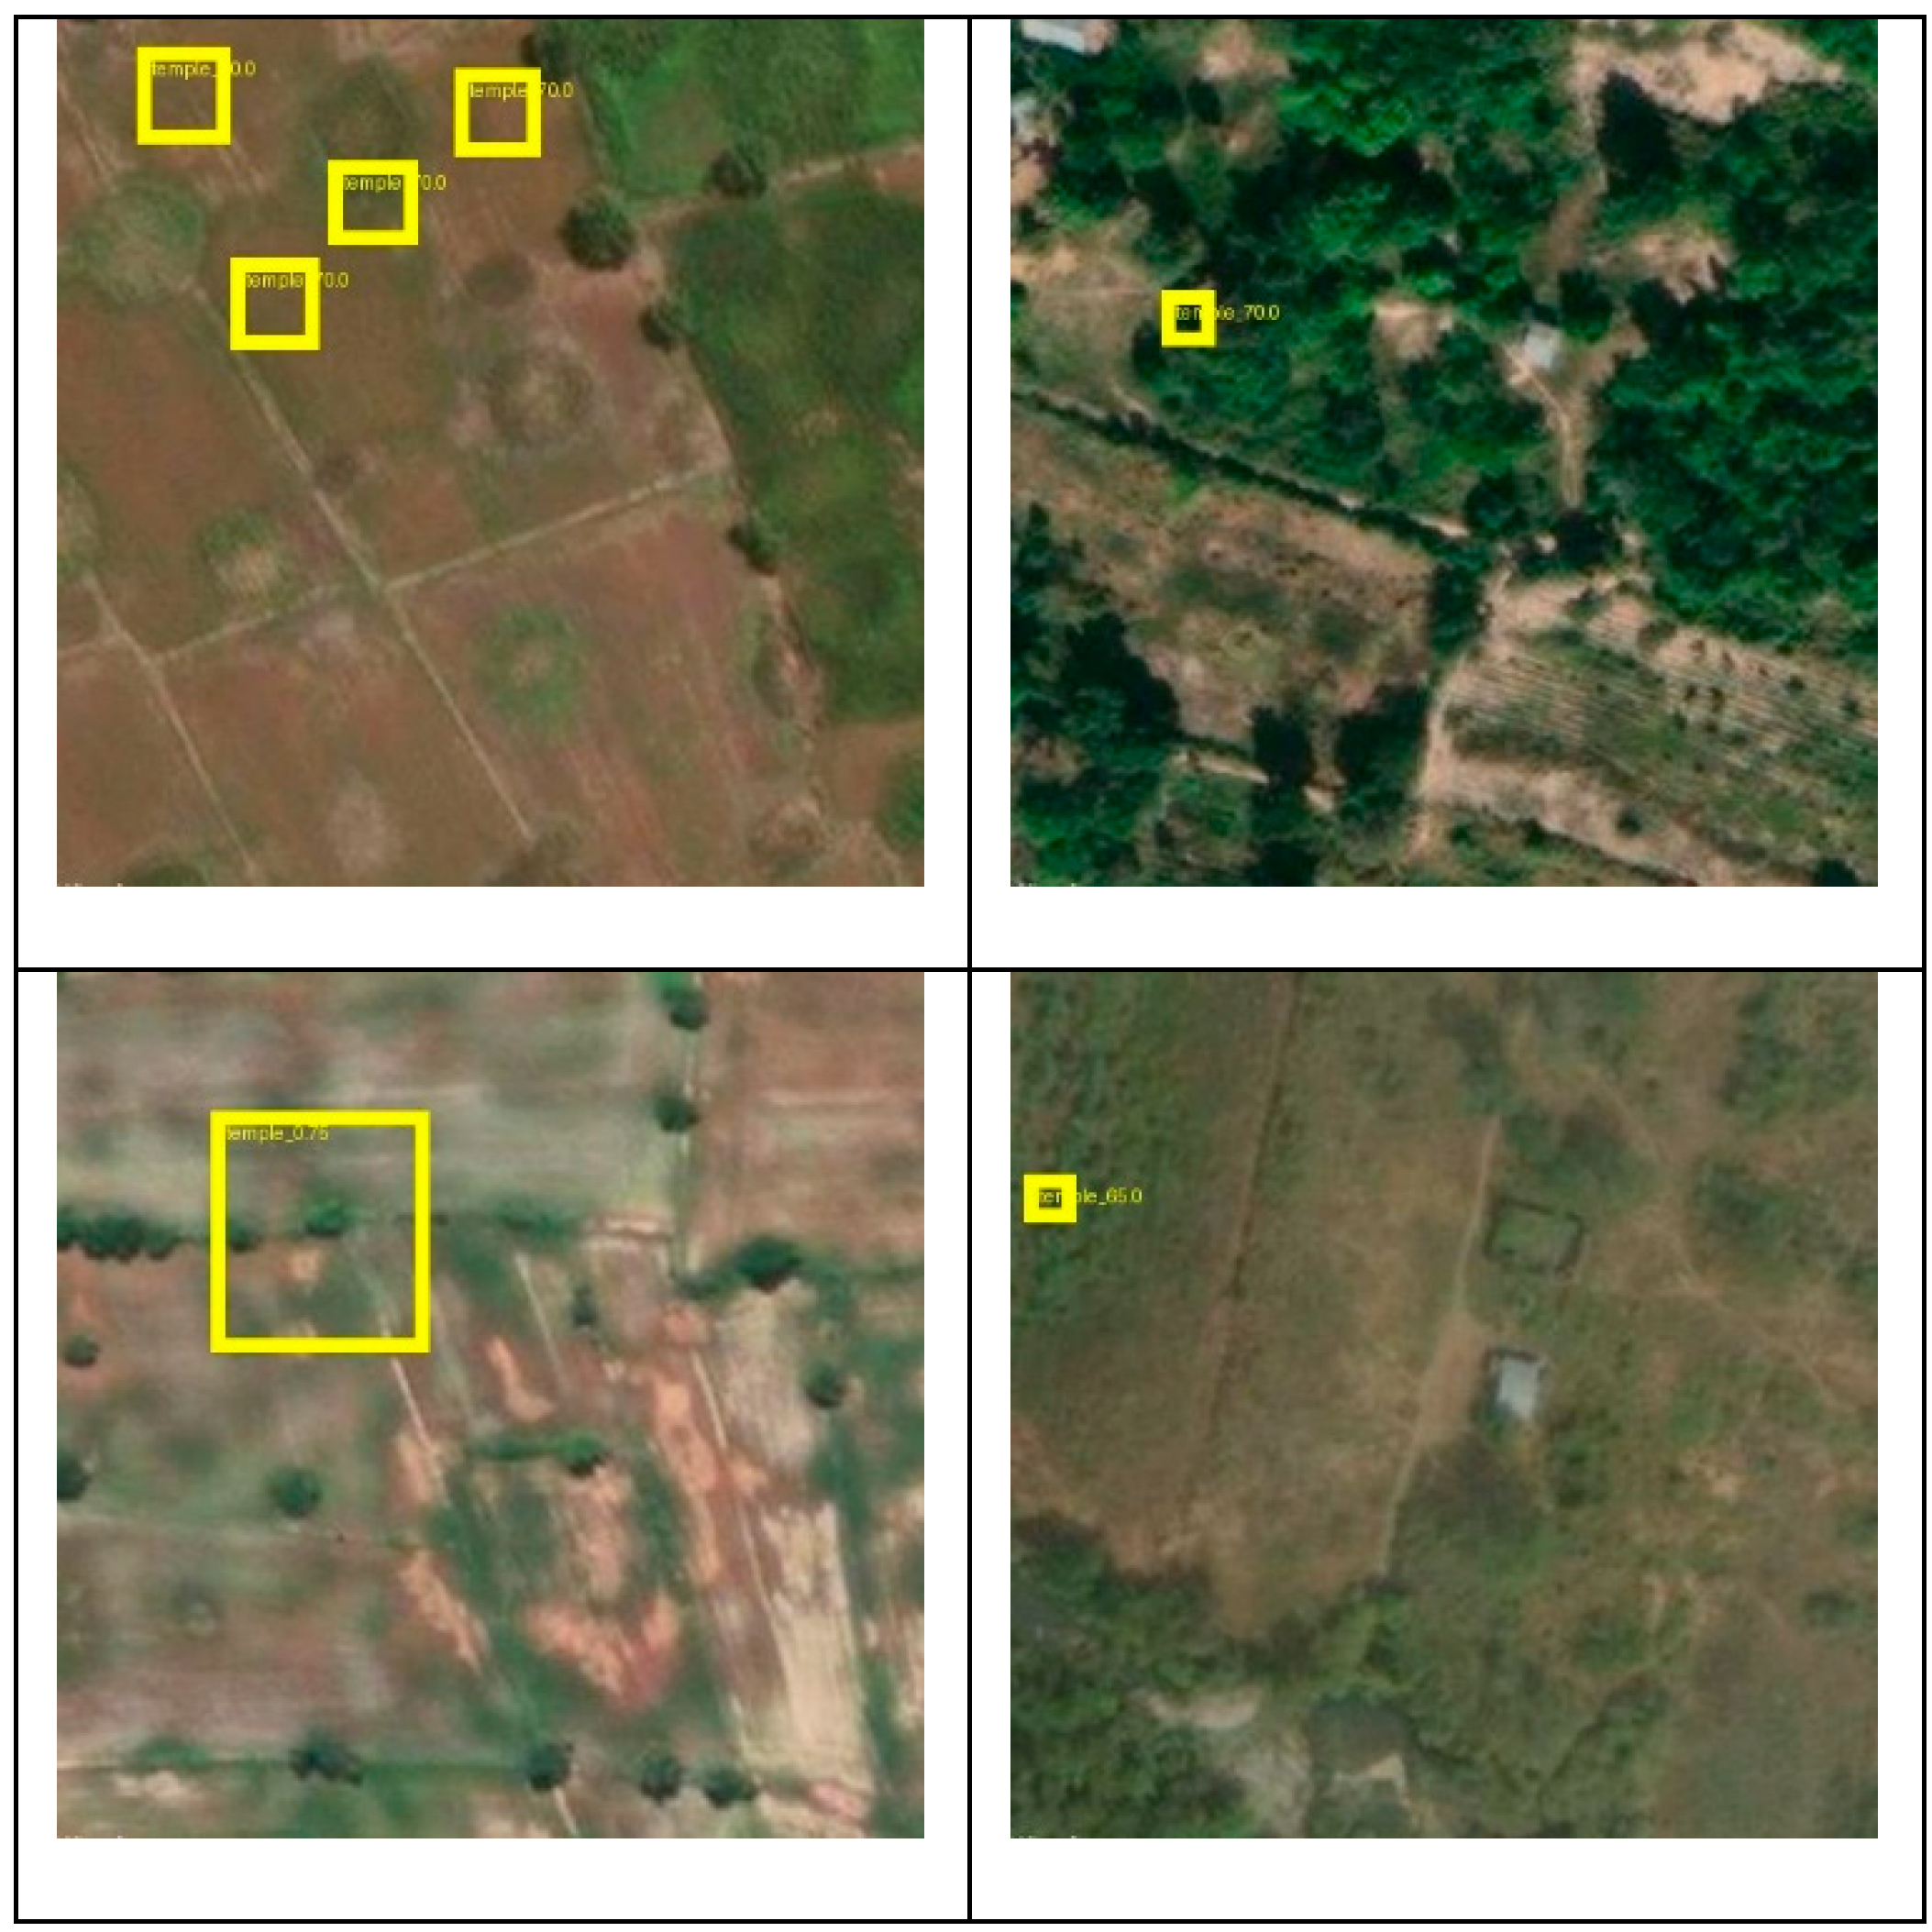
Regarding the false positives (or "hallucinations") produced by the two models (see Figure 11 and Figure 12 below), we were so far unable to identify consistent reasons or patterns that might explain the misclassifications. One exception involves a set of relatively small detections by Gemini 2.0-flash, with diameters of less than 10 to 15 meters on the ground. These are generally too small to represent Angkorian temples and could potentially be filtered out during post-processing, which would likely improve overall detection quality.
Figure 10.
False positives from GPT4.1.
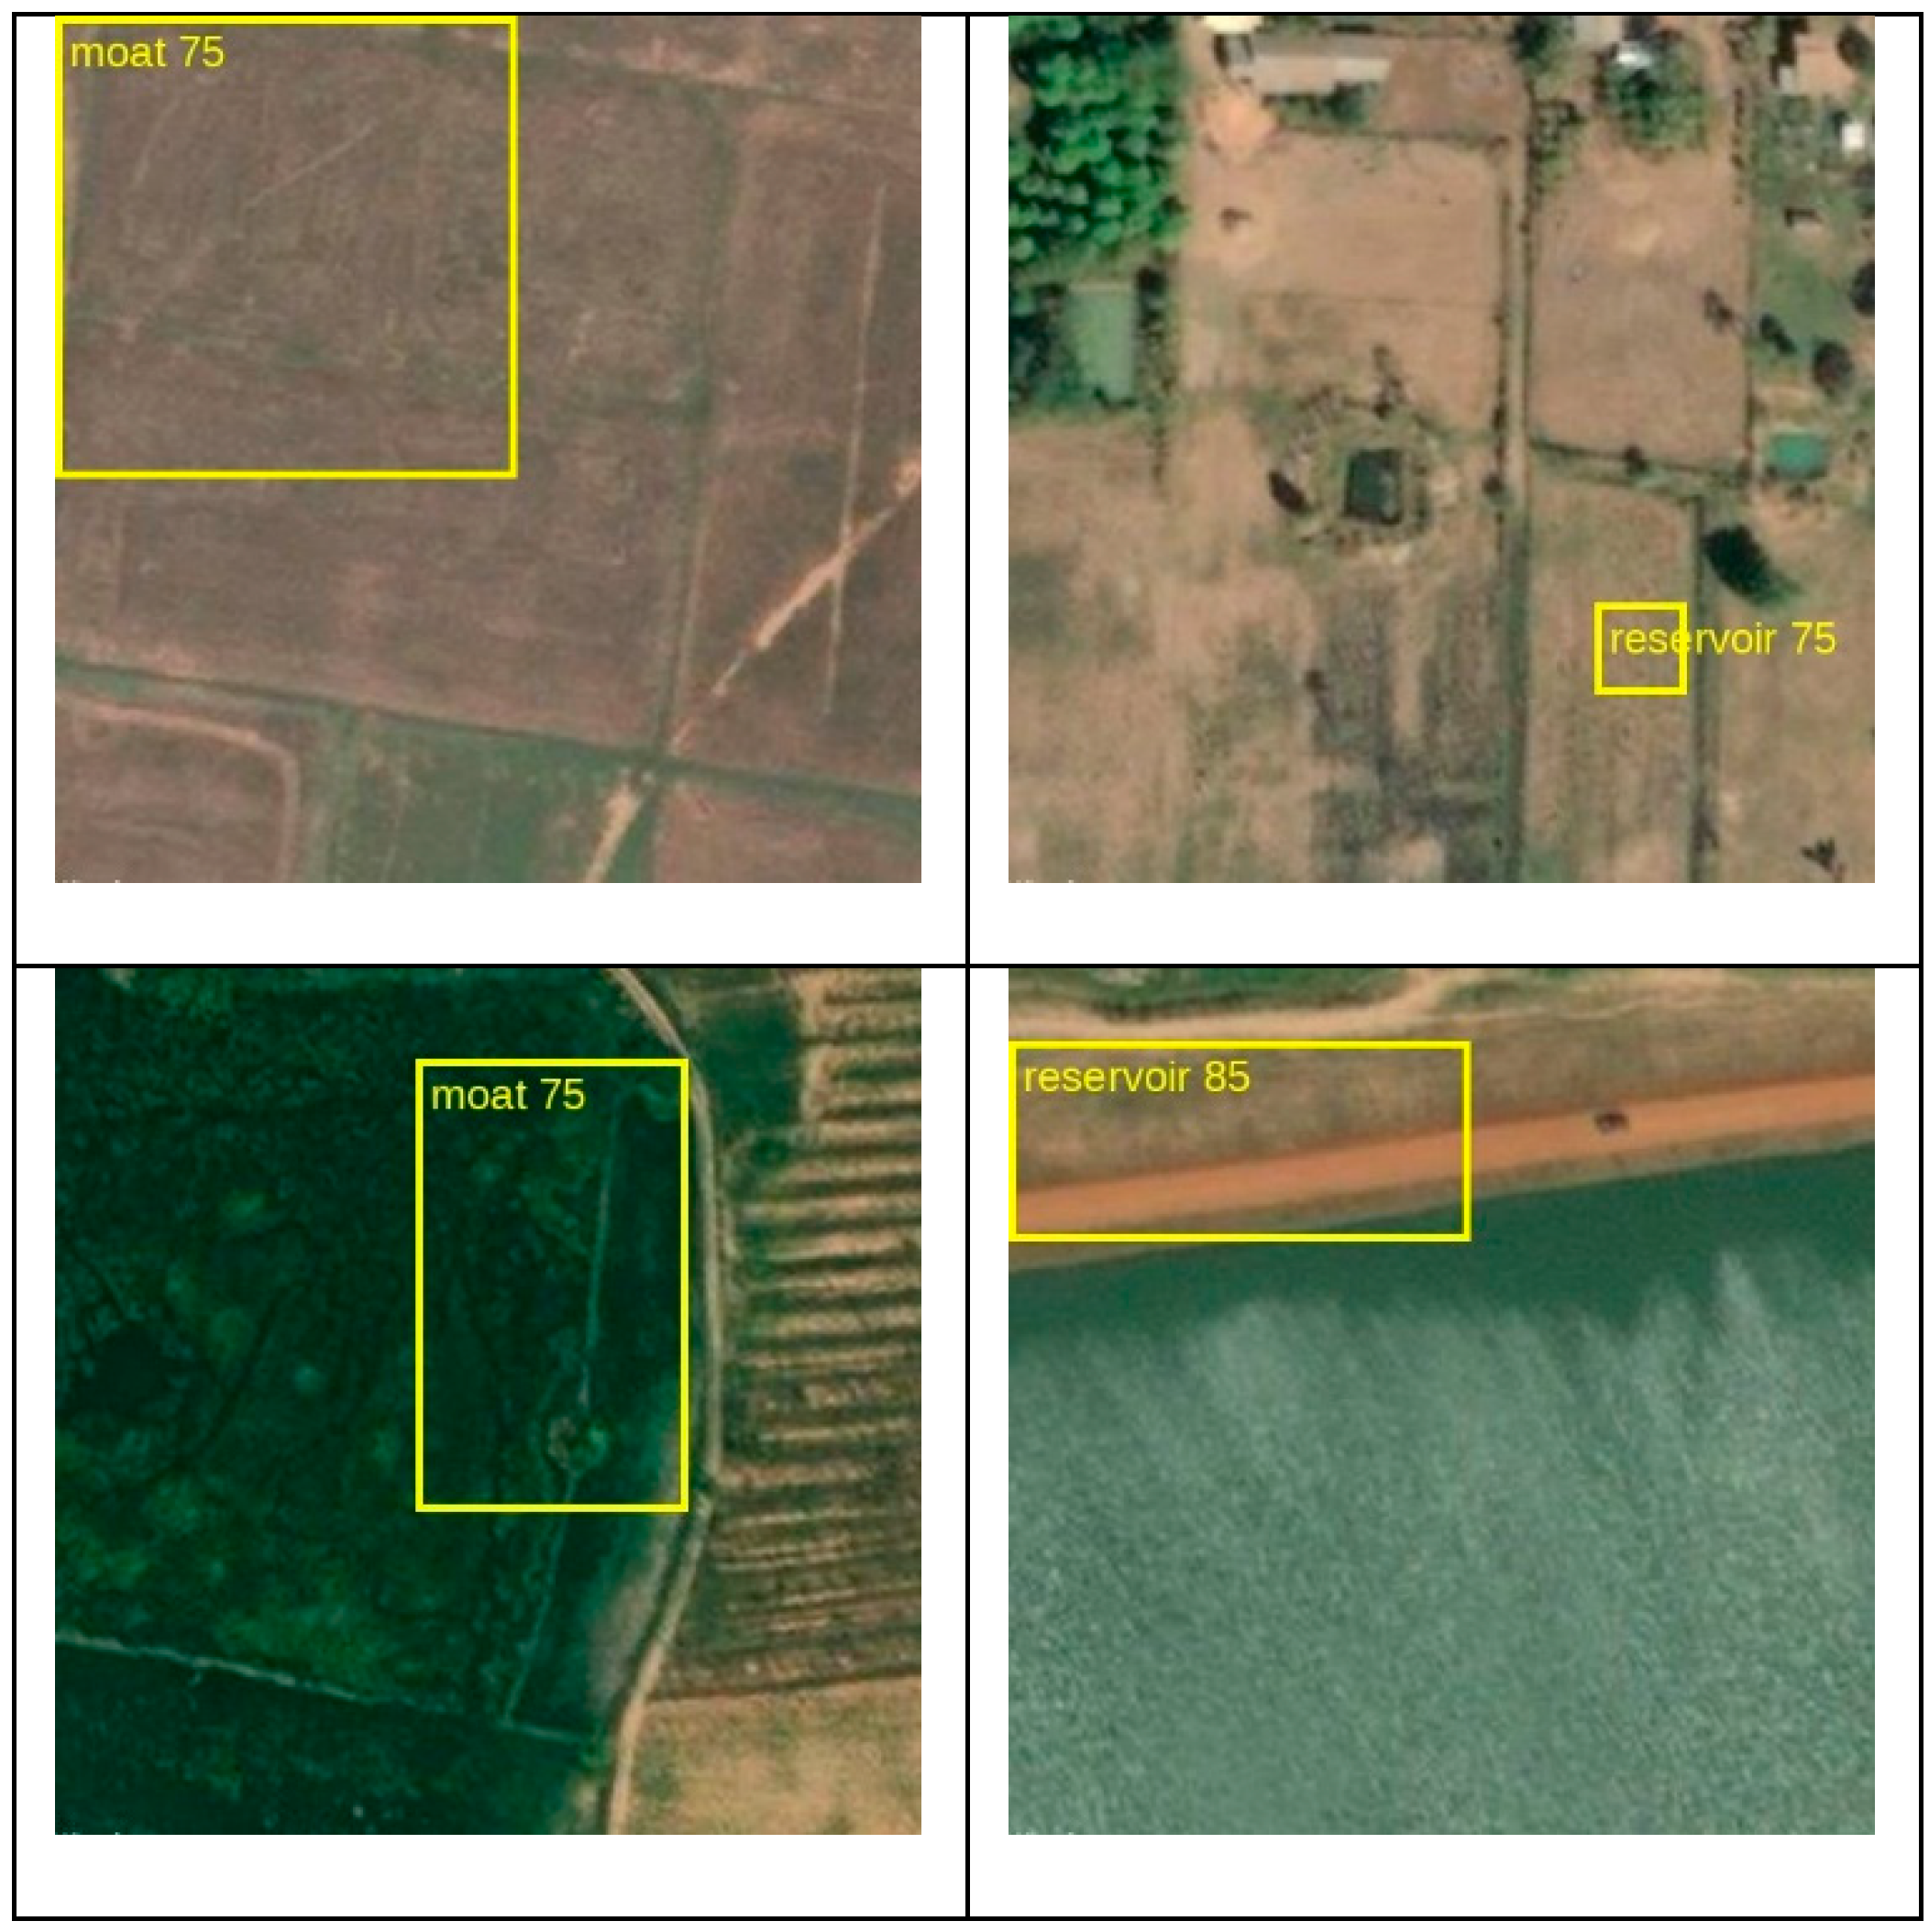
Figure 11.
False positives from Gemini 2.0-flash.
In conclusion, our findings demonstrate that foundation models are capable of detecting Angkorian archaeological structures in satellite imagery. The performance observed here is broadly consistent with our earlier research on identifying Angkorian temple reservoirs [23], where F1 scores ranged from 15% to 45%, depending on the region. A key distinction, however, lies in the level of human effort required: whereas the earlier study took several months to complete, the present experiment produced comparable results within a matter of days — representing a reduction in manual effort by several orders of magnitude.
3.3. Experiment 3: Finding English Hillforts in LiDAR Imagery
3.3.1. Methodology
Aerial LiDAR has become an increasingly important tool in archaeological research, particularly for identifying features in forested or otherwise visually obscured landscapes.
LiDAR data is typically provided either as raw point clouds or in raster formats such as Digital Elevation Models (DEMs). When working with visual foundation models which are typically trained on large collections of online images, it is advantageous for input imagery to resemble the visual domain these models were exposed to during training. In this context, hillshade visualizations appear to be the most prevalent form of LiDAR-derived imagery in both academic literature and online platforms.
Accordingly, we used the RVT library [20] to generate hillshade visualizations from the raw LiDAR data in our experiments. Future research may investigate whether alternative visualization techniques can yield improved detection results when employing foundation models.
The LiDAR dataset of English hillforts used in this experiment was derived from an earlier project [22], which in turn was based on the coordinates available in the Atlas of Hillforts compiled by Lock and Ralston [28]. From the 1,136 English hillforts with LiDAR coverage documented in the Atlas, a random subset of 300 sites was selected for further analysis.
In addition to the hillfort sites, 1,000 random land patches from England were also sampled to serve as negative examples. LiDAR data with 1 m resolution for both hillfort and non-hillfort locations was obtained from the UK Department for Environment, Food and Rural Affairs (DEFRA) website (see Section 5 below). For each location, hillshade visualizations were generated at a resolution of 768 × 768 pixels.
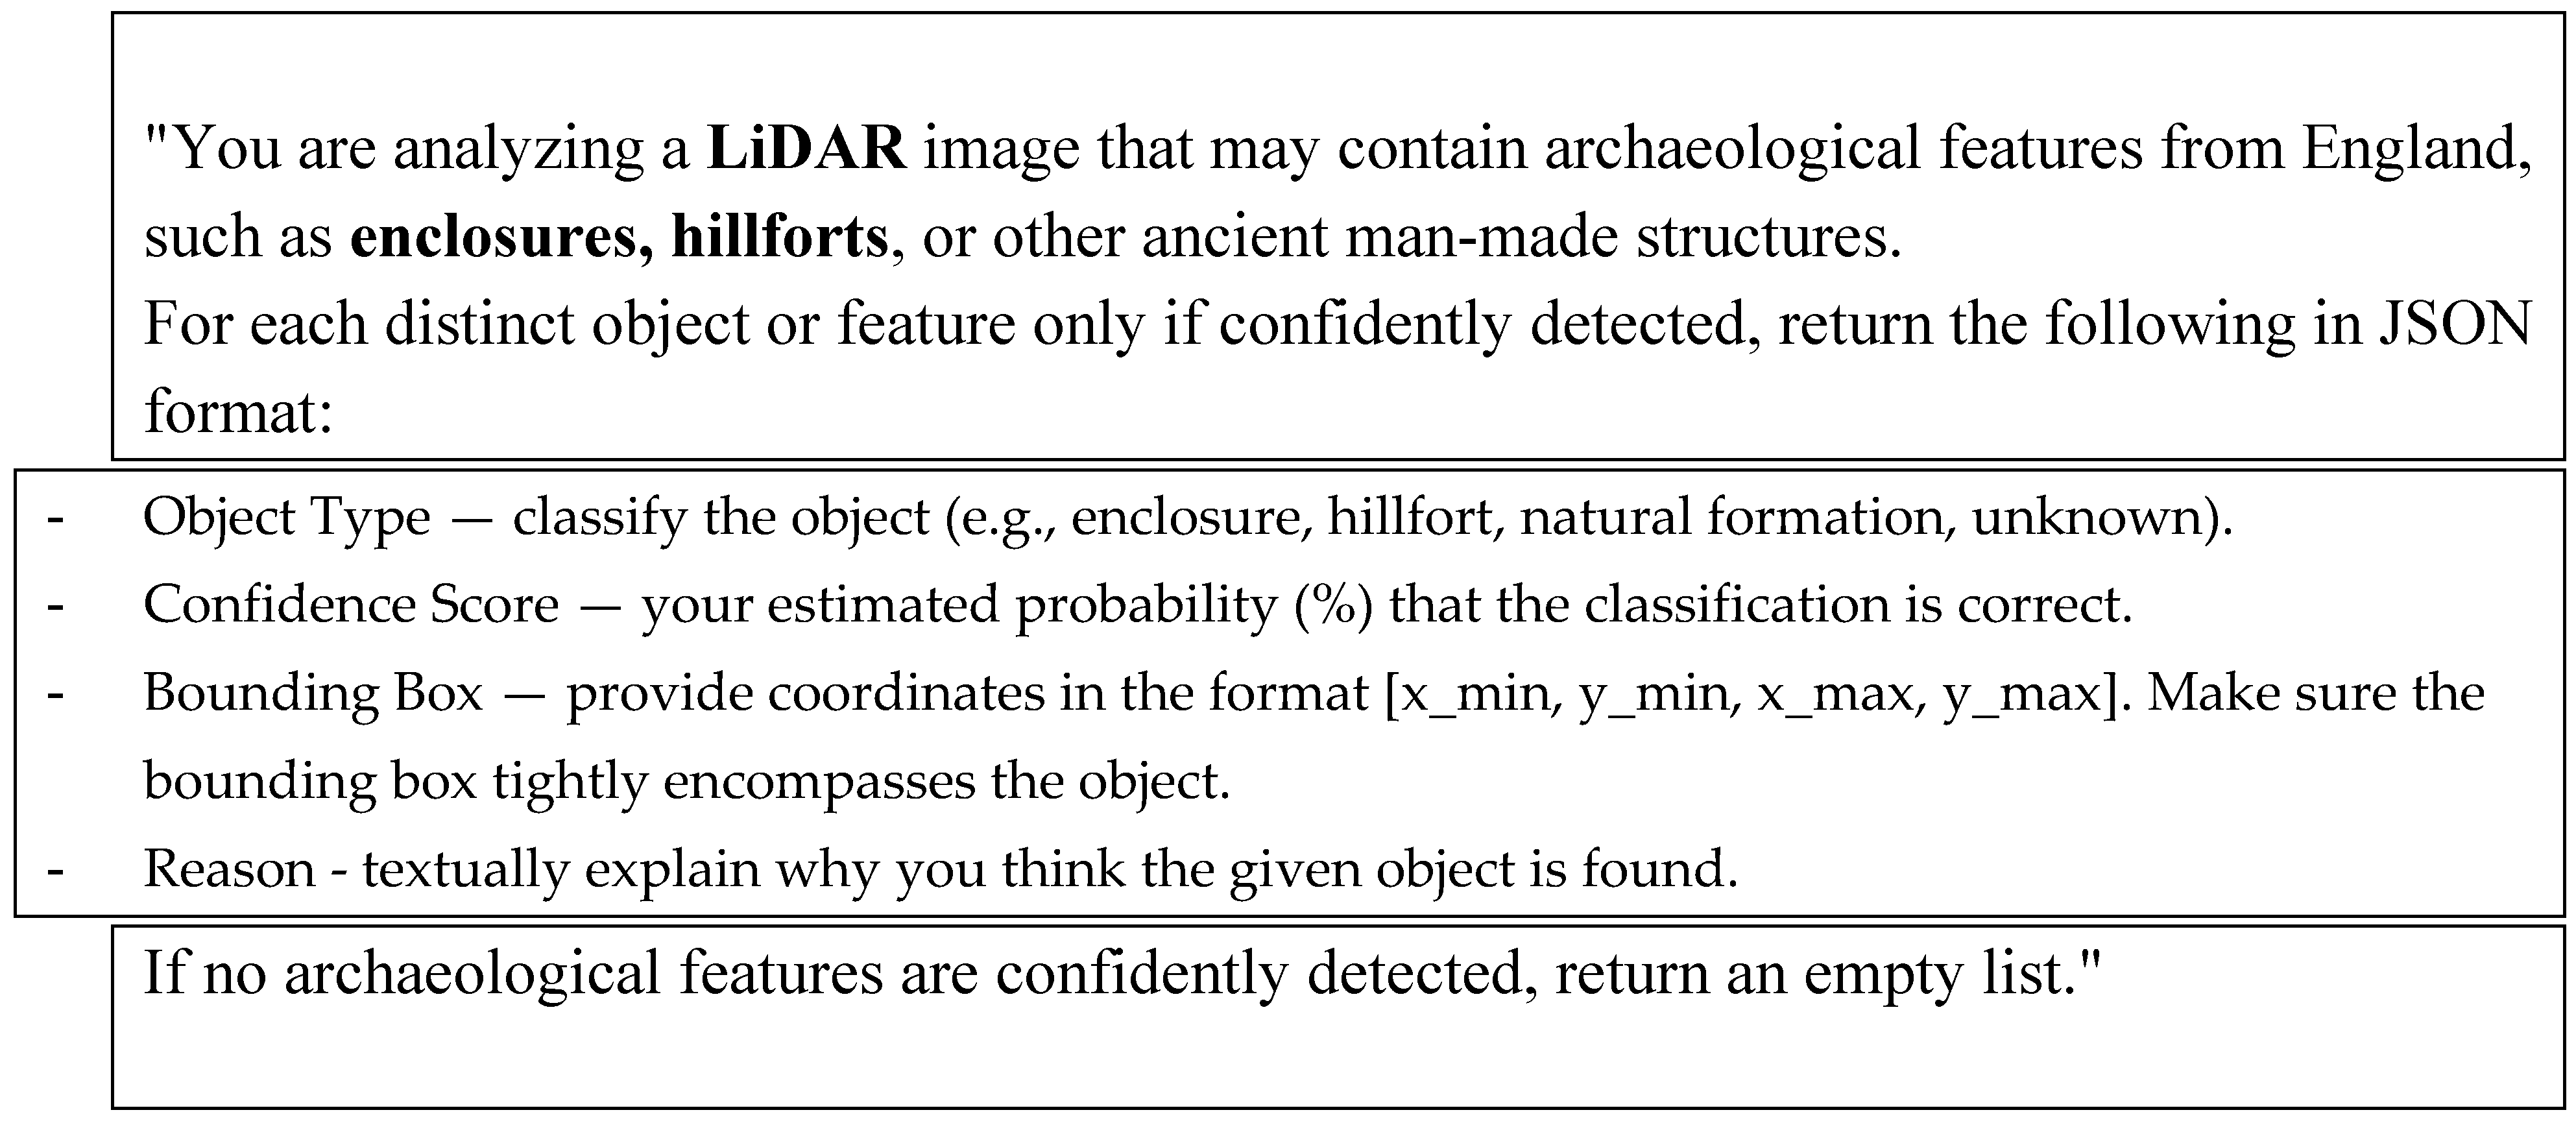
The same data processing scripts as mentioned above were employed in this study. The prompt text used for model inference was slightly modified and reads:
Figure 12.
GPT-4.1 and Gemini 2.0-flash prompt for hillfort detection in LiDAR, text highlights by authors
Figure 12.
GPT-4.1 and Gemini 2.0-flash prompt for hillfort detection in LiDAR, text highlights by authors
3.3.2. Quantitative Results
Table 14 shows that, in principle, both models demonstrated the ability to detect hillforts in LiDAR imagery. GPT-4.1 achieved a notably high detection rate, identifying 95% of the sampled hillforts. However, this high sensitivity came at the cost of a very large number of false positives — 813 out of 1,000 random land patches were incorrectly classified as hillforts. This result implies an implausibly high prevalence of hillforts across the English landscape, rendering GPT-4.1 currently unsuitable for practical applications in hillfort detection.
In contrast, Gemini correctly identified approximately 50% of the hillforts in the sample. While its detection rate was lower, it exhibited a significantly better false positive rate, misclassifying only 66 out of 1,000 random patches which again makes Gemini more appropriate for use in real-world archaeological workflows, particularly when validating features across broader landscape units such as districts or entire regions. We speculate that Gemini may have been exposed to a greater volume of LiDAR data during its training than GPT, which could account for its comparatively restrained and more accurate performance.
Table 13.
Statistics for hillforts in LiDAR experiment
| Model | TP | FN | TN | FP | Precision | Recall | F1 |
|---|---|---|---|---|---|---|---|
| GPT-4.1 | 286 | 14 | 187 | 813 | 26 % | 95 % | 42 % |
| Gemini 2.0-flash | 149 | 151 | 934 | 66 | 69 % | 50 % | 58 % |
3.3.3. Qualitative Results and Preliminary Assessment
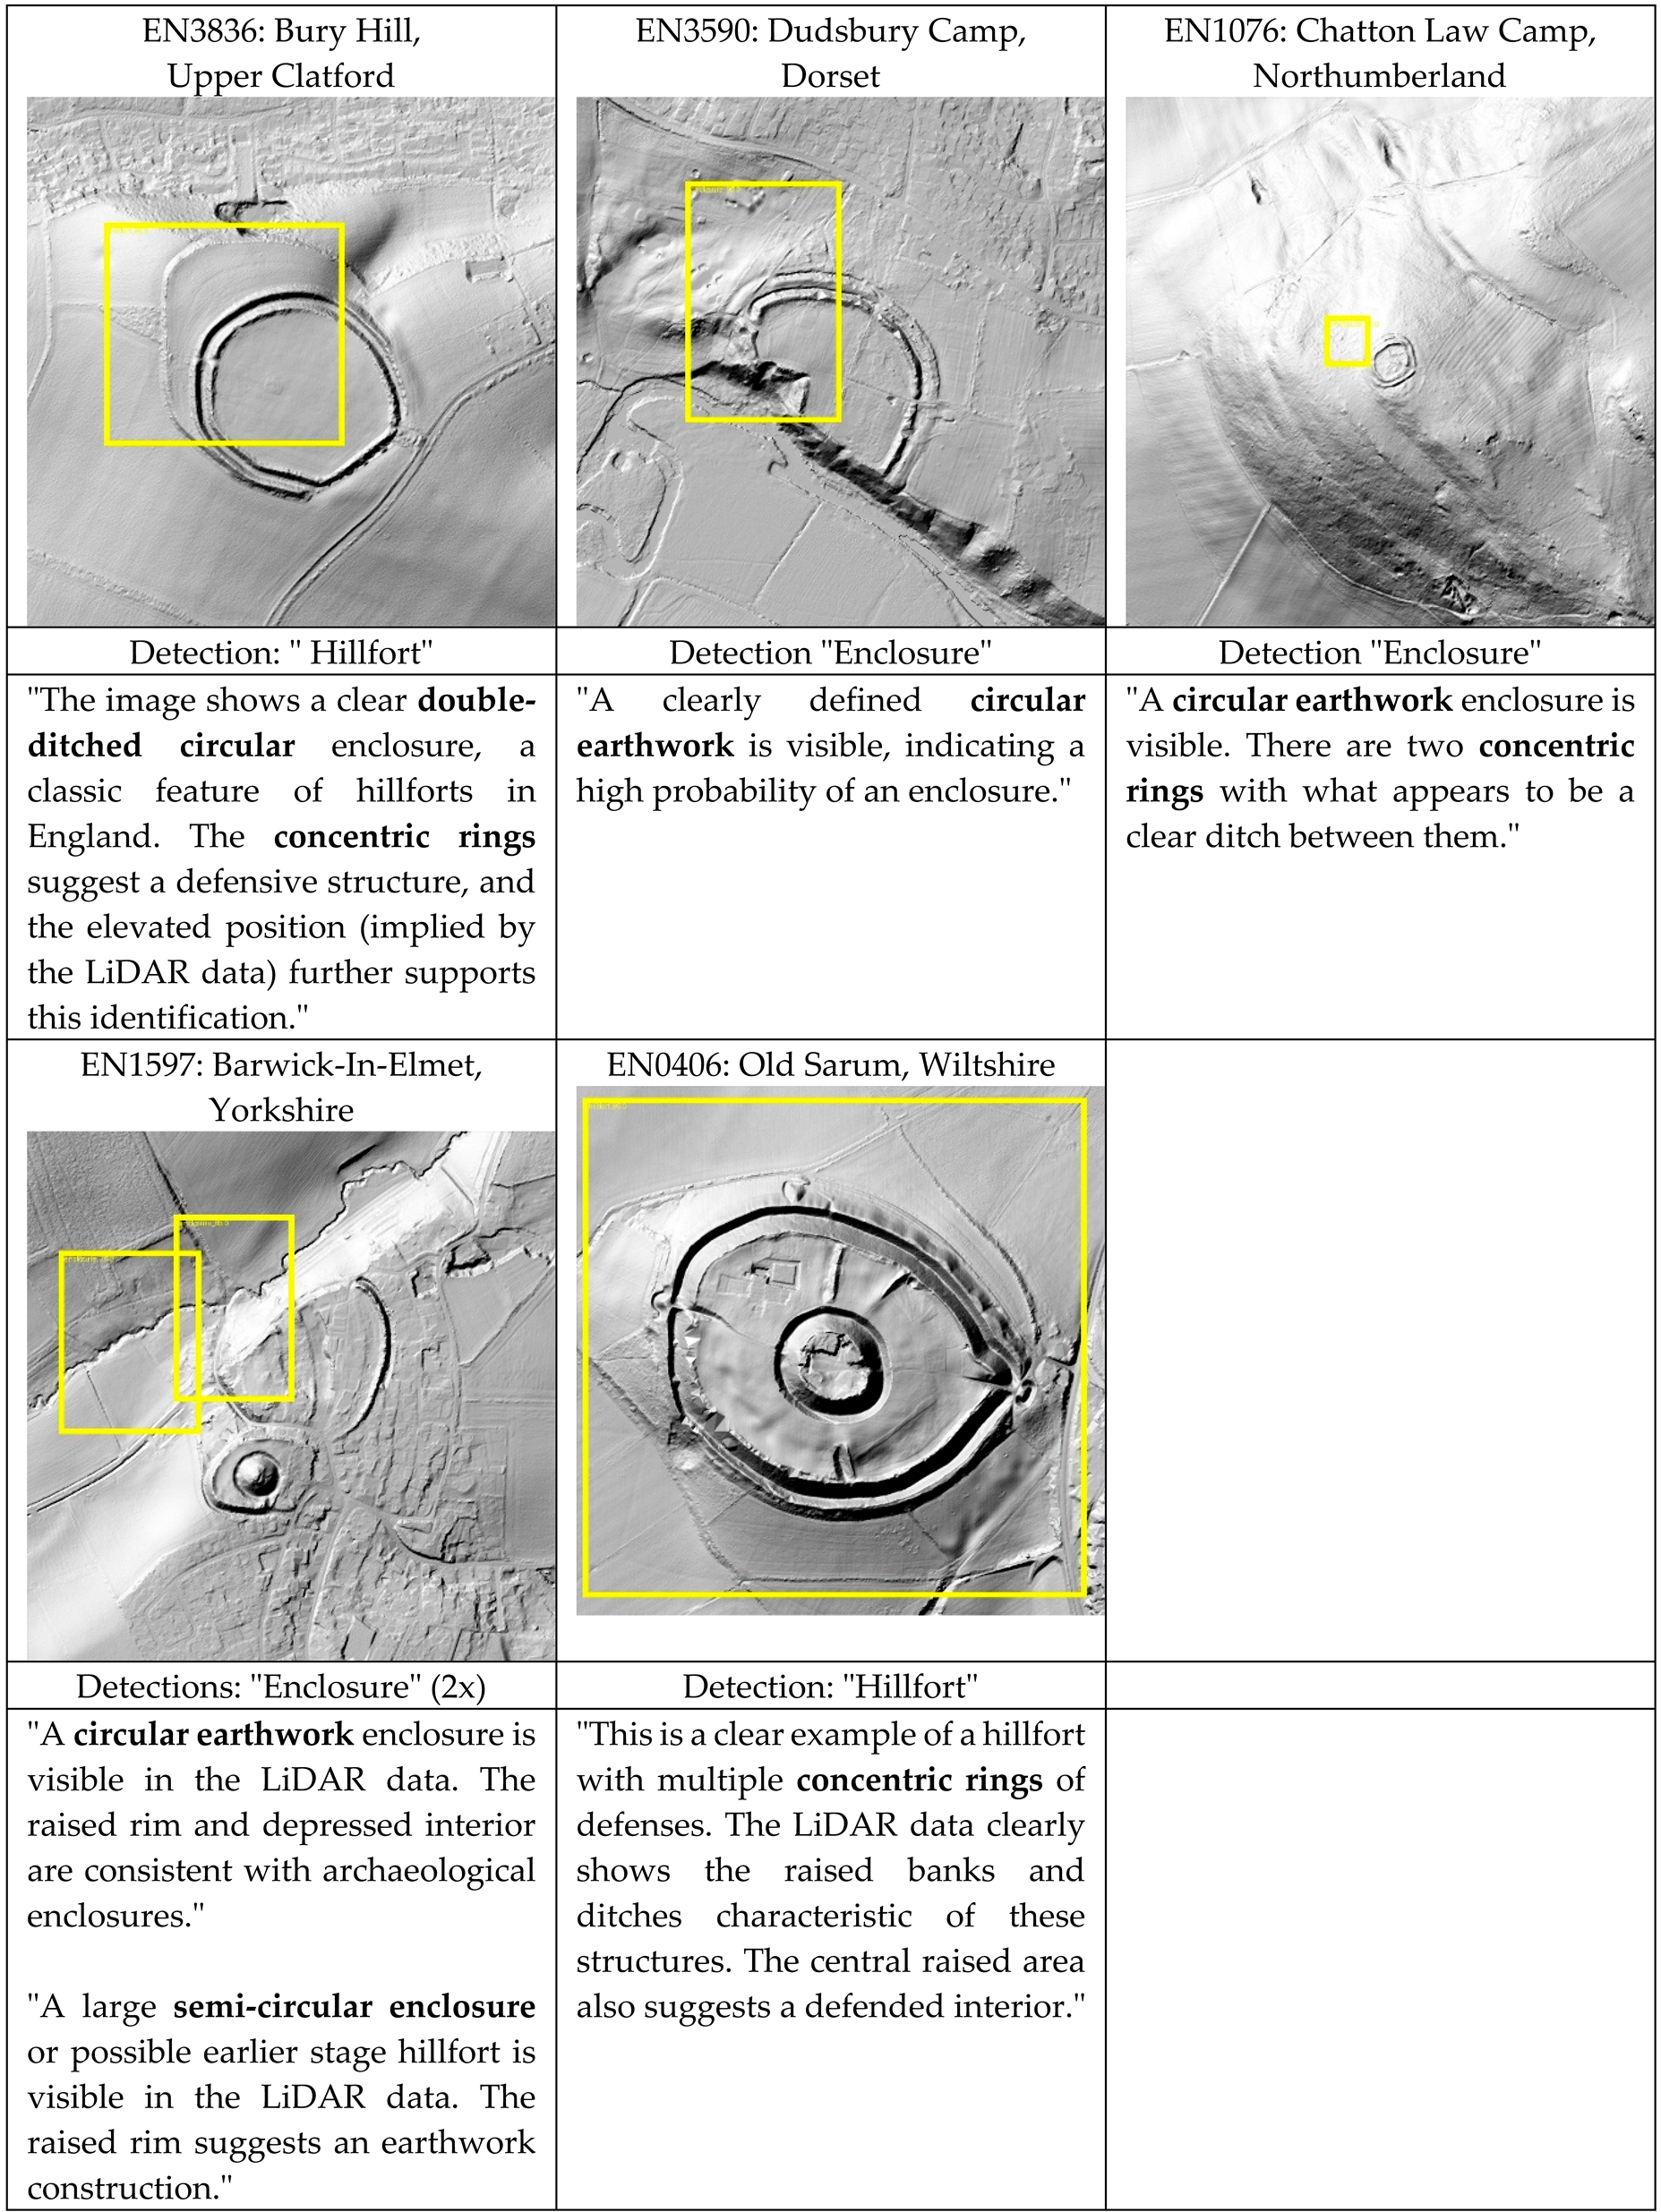
The examples presented in Table 15 and Table 16 below illustrate that bounding boxes are frequently imprecise, consistent with the results of the previous experiments. Both models classified their detections as either "hillfort" or "enclosure", two types of defensive sites that can be difficult to distinguish, even for experts in the field. GPT identified 121 enclosures and 165 hillforts, while Gemini detected 96 enclosures and 53 hillforts.
Although the reasoning texts provided by the models did not offer any clear justification for these classifications, they occasionally included surprisingly accurate image descriptions. Notably, both GPT-4.1 and Gemini 2.0-flash repeatedly referenced concentric wall structures. A particularly illustrative example is site EN1597, which corresponds to the Barwick-in-Elmet hillfort in Yorkshire. GPT-4.1 reported two detections at this location, and indeed, the Atlas of Hillforts confirms that this Iron Age site later became the location of a medieval motte-and-bailey castle — clearly visible in the southern portion of the LiDAR image. In contrast, the bounding box detections continue to appear misaligned and do not correspond well with the known locations of the two sites.
Table 14.
True positives detected by GPT4.1 (bounding boxes in yellow, detection type and reason text given underneath each image). All images in this section have ground size 768 m x768 m and are north facing, LiDAR © DEFRA, ID numbers starting with EN are taken from the Atlas of Hillforts.
Table 14.
True positives detected by GPT4.1 (bounding boxes in yellow, detection type and reason text given underneath each image). All images in this section have ground size 768 m x768 m and are north facing, LiDAR © DEFRA, ID numbers starting with EN are taken from the Atlas of Hillforts.
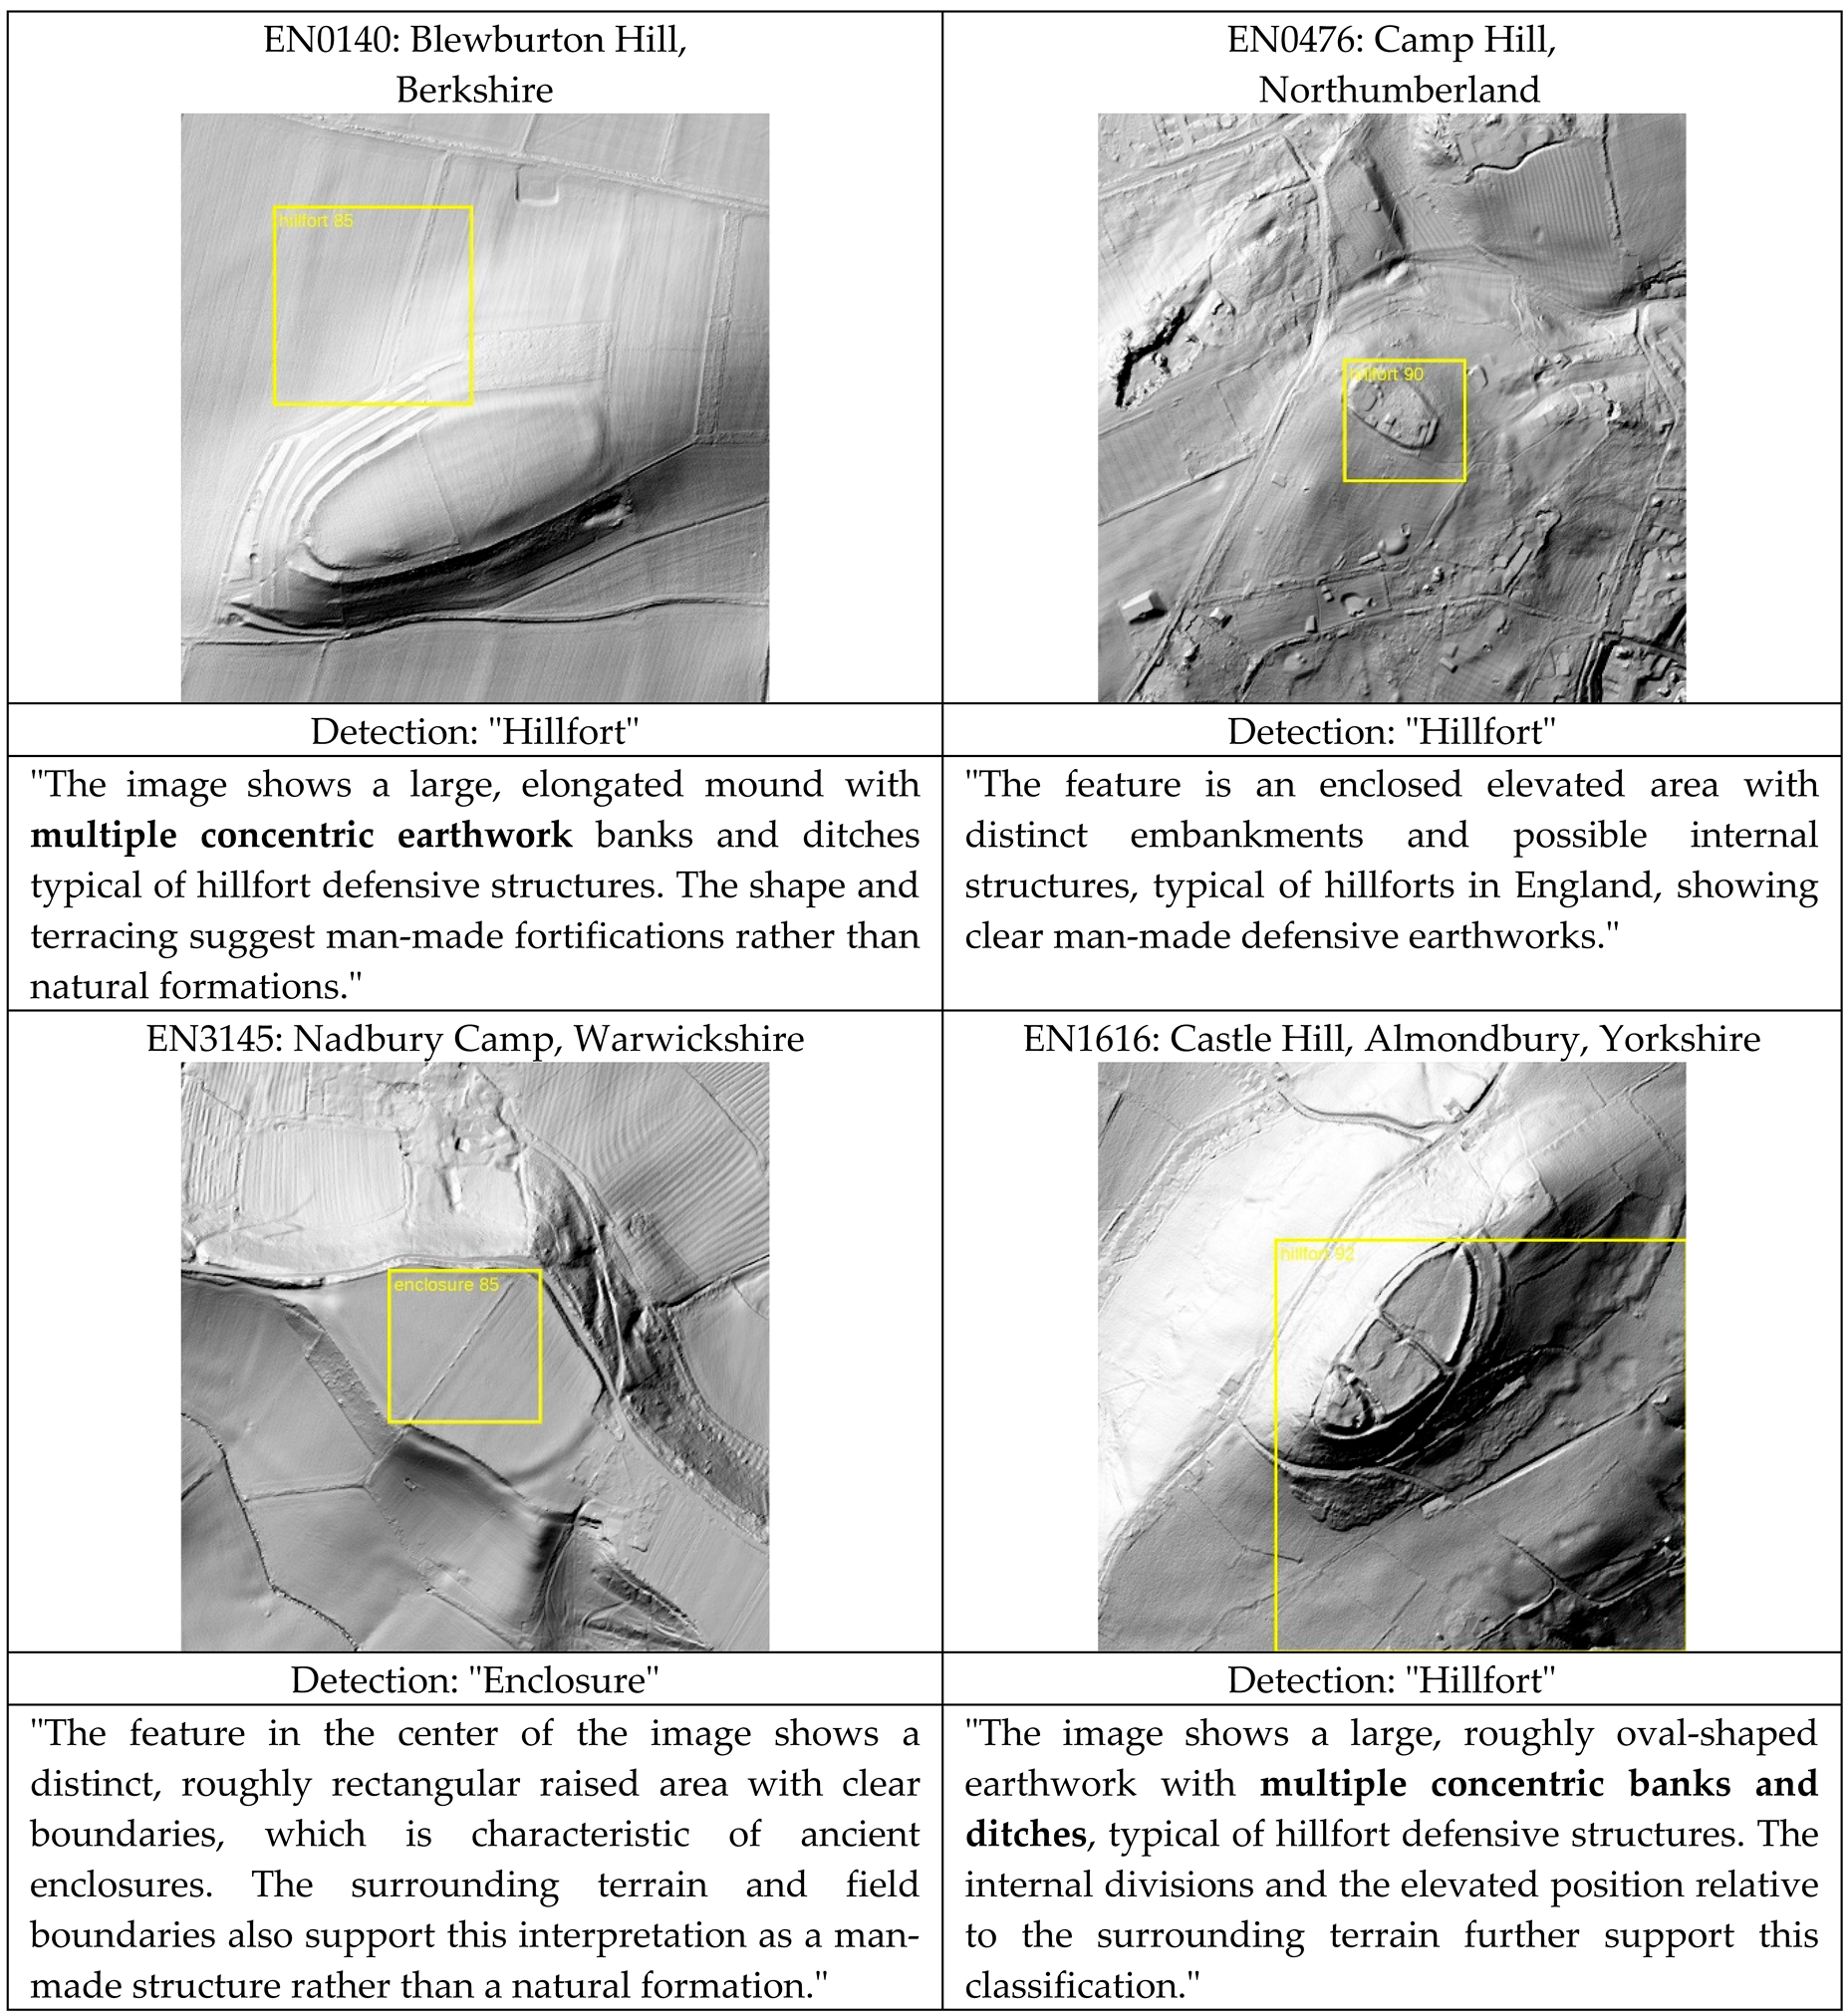
Table 15.
True positives detected by Gemini-2.0-flash (bounding boxes in yellow).
As with the previous experiments, the false positives (see examples in Figure 17 and Figure 18) do not exhibit any consistent or readily identifiable characteristics. Further investigation is necessary to better understand the underlying causes of these misclassifications and to determine whether they stem from systematic model behavior, data-related artifacts, or contextual ambiguities in the imagery.
Figure 16.
False positives from GPT4.1
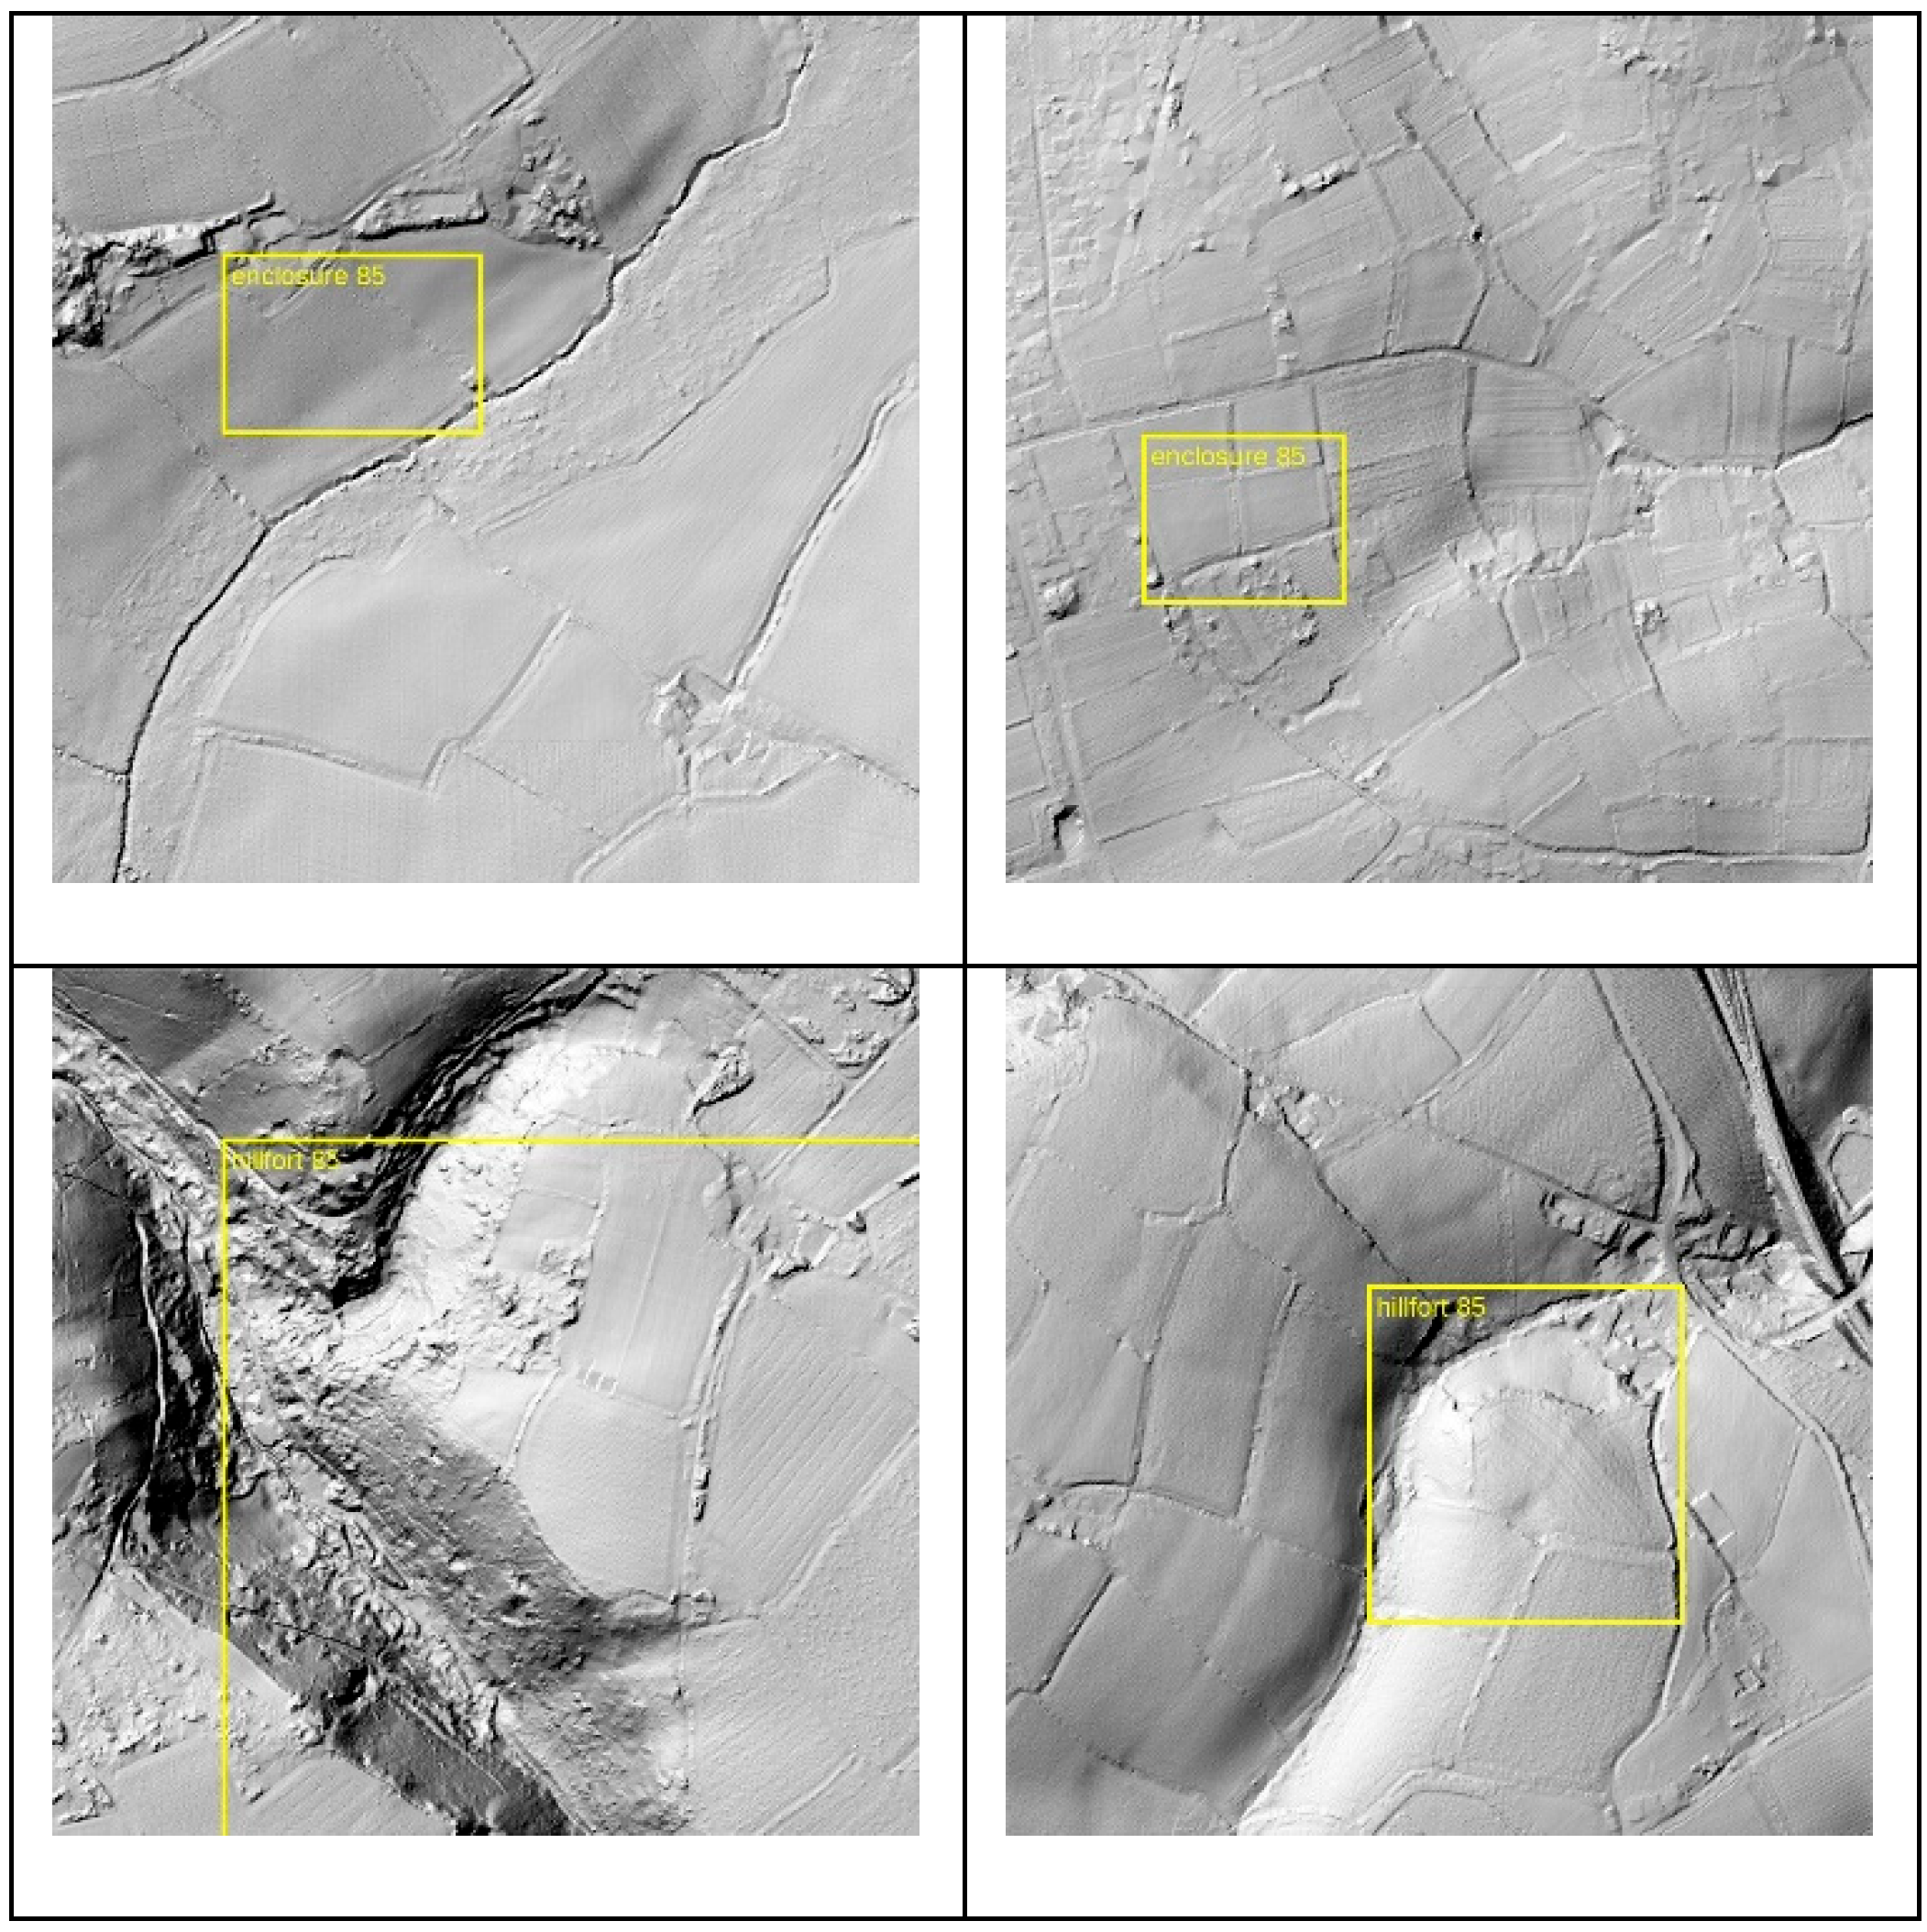
Figure 17.
False positives from Gemini 2.0-flash.

3.4. Experiment 4: Delineating the Dimensions of Archaeological Sites in LiDAR
3.4.1. Methodology
The remaining two experiments employ a different foundation model than the previous ones — specifically, the Segment Anything Model (SAM) in its version v2.1 [16]. Unlike the earlier experiments, which focused primarily on identifying rough bounding boxes for archaeological features, the aim here is to obtain precise outlines or boundaries of the features of interest. SAM is designed to segment or delineate all elements within an image without requiring prior training or semantic understanding of the image content.
For this experiment we used the entire 1,136 images of hillforts in England from our earlier project [22], again with a 768 × 786-pixel resolution. As in the previous experiment, we generated hillshade visualizations from the LiDAR data and presented these images to SAM.
SAM does not accept textual prompts; instead, it operates using so-called point prompts: one or more coordinates within an image that guide the model in performing segmentation. In this case, we used the central coordinate of each image, which approximately corresponds to the centroid of the hillfort as recorded in the Atlas of Hillforts.
3.4.2. Results and Preliminary Assessment
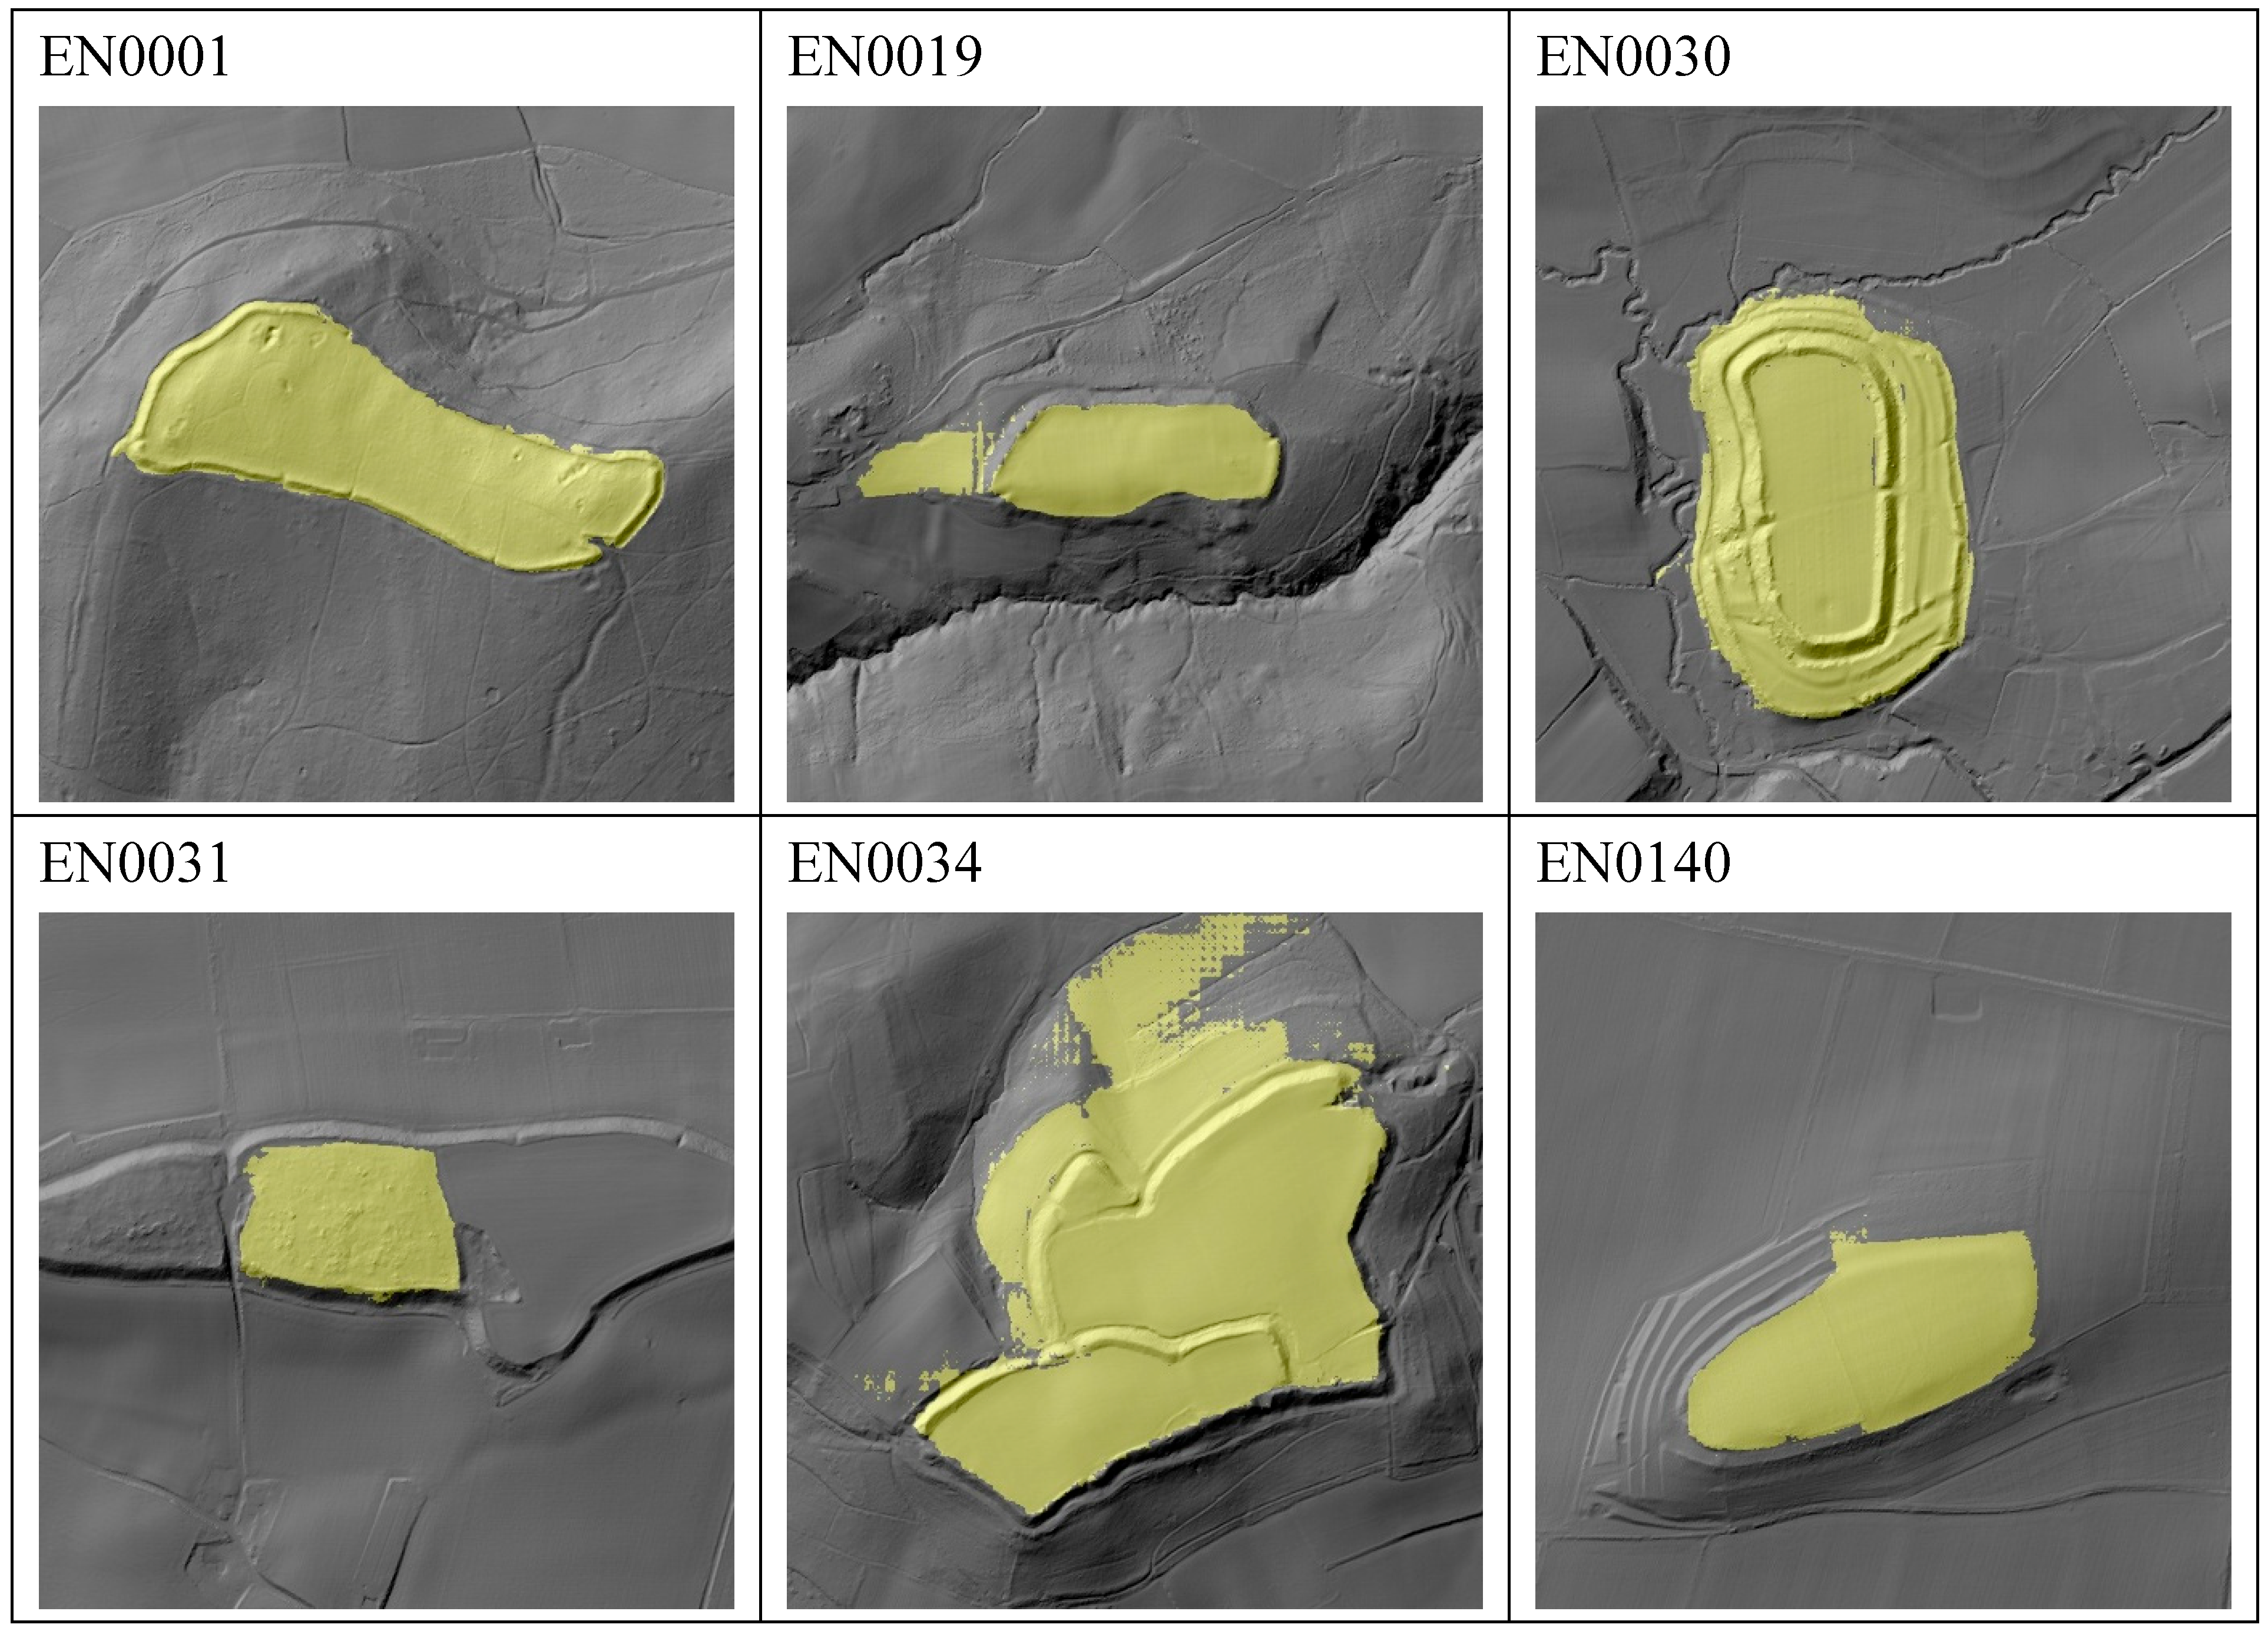
Figure 19 below shows that results in this experiment were very promising. We estimate that approximately 60% of the 1,136 hillforts were delineated correctly. This is a notable outcome, especially considering that even human experts often struggle to delineate hillforts accurately. Such difficulties arise due to the extent of erosion, destruction, or modern construction over the archaeological features.
Moreover, there exists a degree of ambiguity in archaeological interpretation, with the precise boundaries of many hillforts still a matter of scholarly debate. It should also be acknowledged that SAM occasionally produces errors. Further analysis, beyond the scope of this initial study, is required to understand the causes of these inaccuracies. Common issues include failure to detect outer ring walls (EN0140, for example) or the generation of irregularly shaped segmentations (examples are EN0019 and EN0034).
Figure 18.
Examples of English hillforts in LiDAR, yellow overlay produced by SAM 2.1. All images have ground size 768 m x 768 m and are north facing, LiDAR © DEFRA, ID numbers starting with EN are taken from the Atlas of Hillforts.
Figure 18.
Examples of English hillforts in LiDAR, yellow overlay produced by SAM 2.1. All images have ground size 768 m x 768 m and are north facing, LiDAR © DEFRA, ID numbers starting with EN are taken from the Atlas of Hillforts.

Despite these limitations, SAM demonstrates significant potential for archaeological applications. It may be employed for the semi-automatic documentation of archaeological sites, or as a valuable tool for generating training data for more conventional neural networks, thereby substantially reducing the effort needed for manual annotation in remote sensing projects. For a full list of results see the accompanying material (section 5 below).
3.5. Experiment 5: Finding Potsherds in Drone (UAV) Imagery
In this section we advance to the use of drone imagery, a technique increasingly employed in archaeological research due to its ability to reveal surface-level features across broad areas. Potsherds are commonly interpreted as indicators of past human activity, owing to their durability and ubiquity in archaeological contexts. Zones with high concentrations of sherds on the ground indicate higher human activity and can be prioritized for further archaeological prospection or excavation.
Automation of the detection process has long been a desirable goal, especially for large archaeological sites where manual fieldwalking is impractical due to the scale involved. Recent efforts in this area include those by Orengo and García-Molsosa [34], as well as Agapiou et al. [3], who have explored the application of convolutional neural networks (CNNs). However, such approaches face several notable limitations. Chief among these is the labor-intensive requirement to curate large annotated datasets (often comprising thousands of training examples of sherds), as well as the limited generalizability of CNN-based models across different sites due to variations in vegetation cover or illumination conditions.
Here the potential of the Segment Anything Model (SAM v2.1) as an alternative approach to overcome these limitations. SAM as a foundation model has been trained on a huge number of images and hence promises robustness to variations in image characteristics such as shadows, white balance, and illumination. Our aim is to evaluate to what extent this model can reliably detect potsherds in drone imagery.
3.5.1. Methodology
We acquired drone video footage in AVI format from an archaeological site in Greece (Fig. 20, site location not disclosed for site protection reasons). The footage was decomposed into individual frames, which were subsequently processed using SAM. The model generates segmentations of virtually all visible items in a given scene, not only potsherds (Fig. 21, left). Therefore, additional post-processing steps were required to isolate potsherds from other surface objects.
Figure 19.
Example drone image. Challenging scene with high number of potsherds and shadows. © for all images in this section: authors.
Figure 19.
Example drone image. Challenging scene with high number of potsherds and shadows. © for all images in this section: authors.
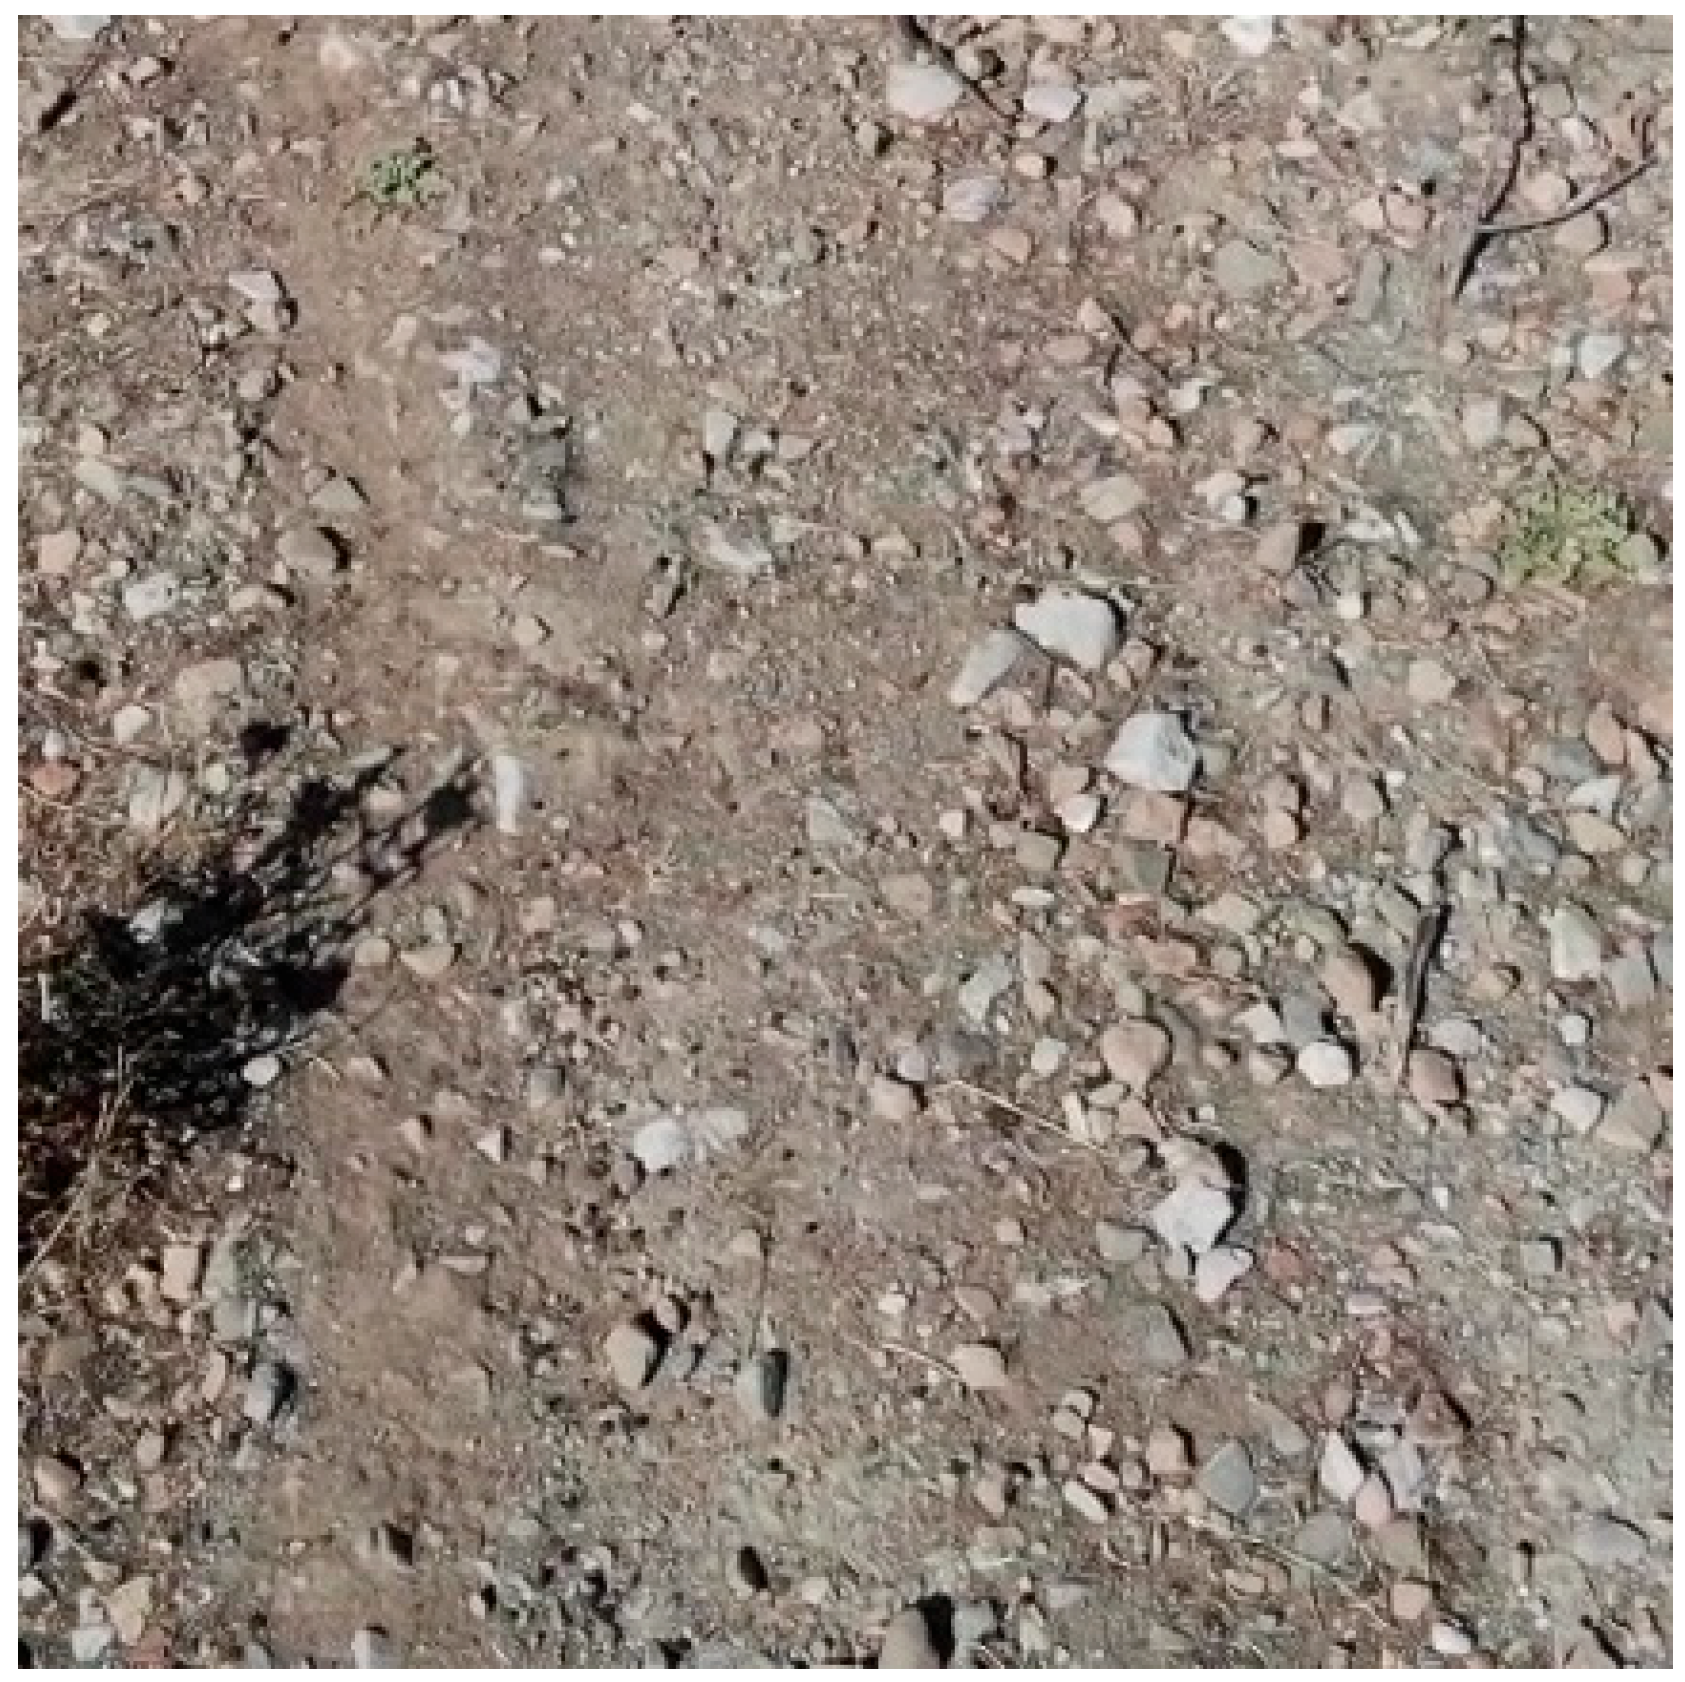
Figure 20.
Left: SAM2.1 output in blue, all items on the ground segmented. Right: Only potsherds remain after filtering.
Figure 20.
Left: SAM2.1 output in blue, all items on the ground segmented. Right: Only potsherds remain after filtering.
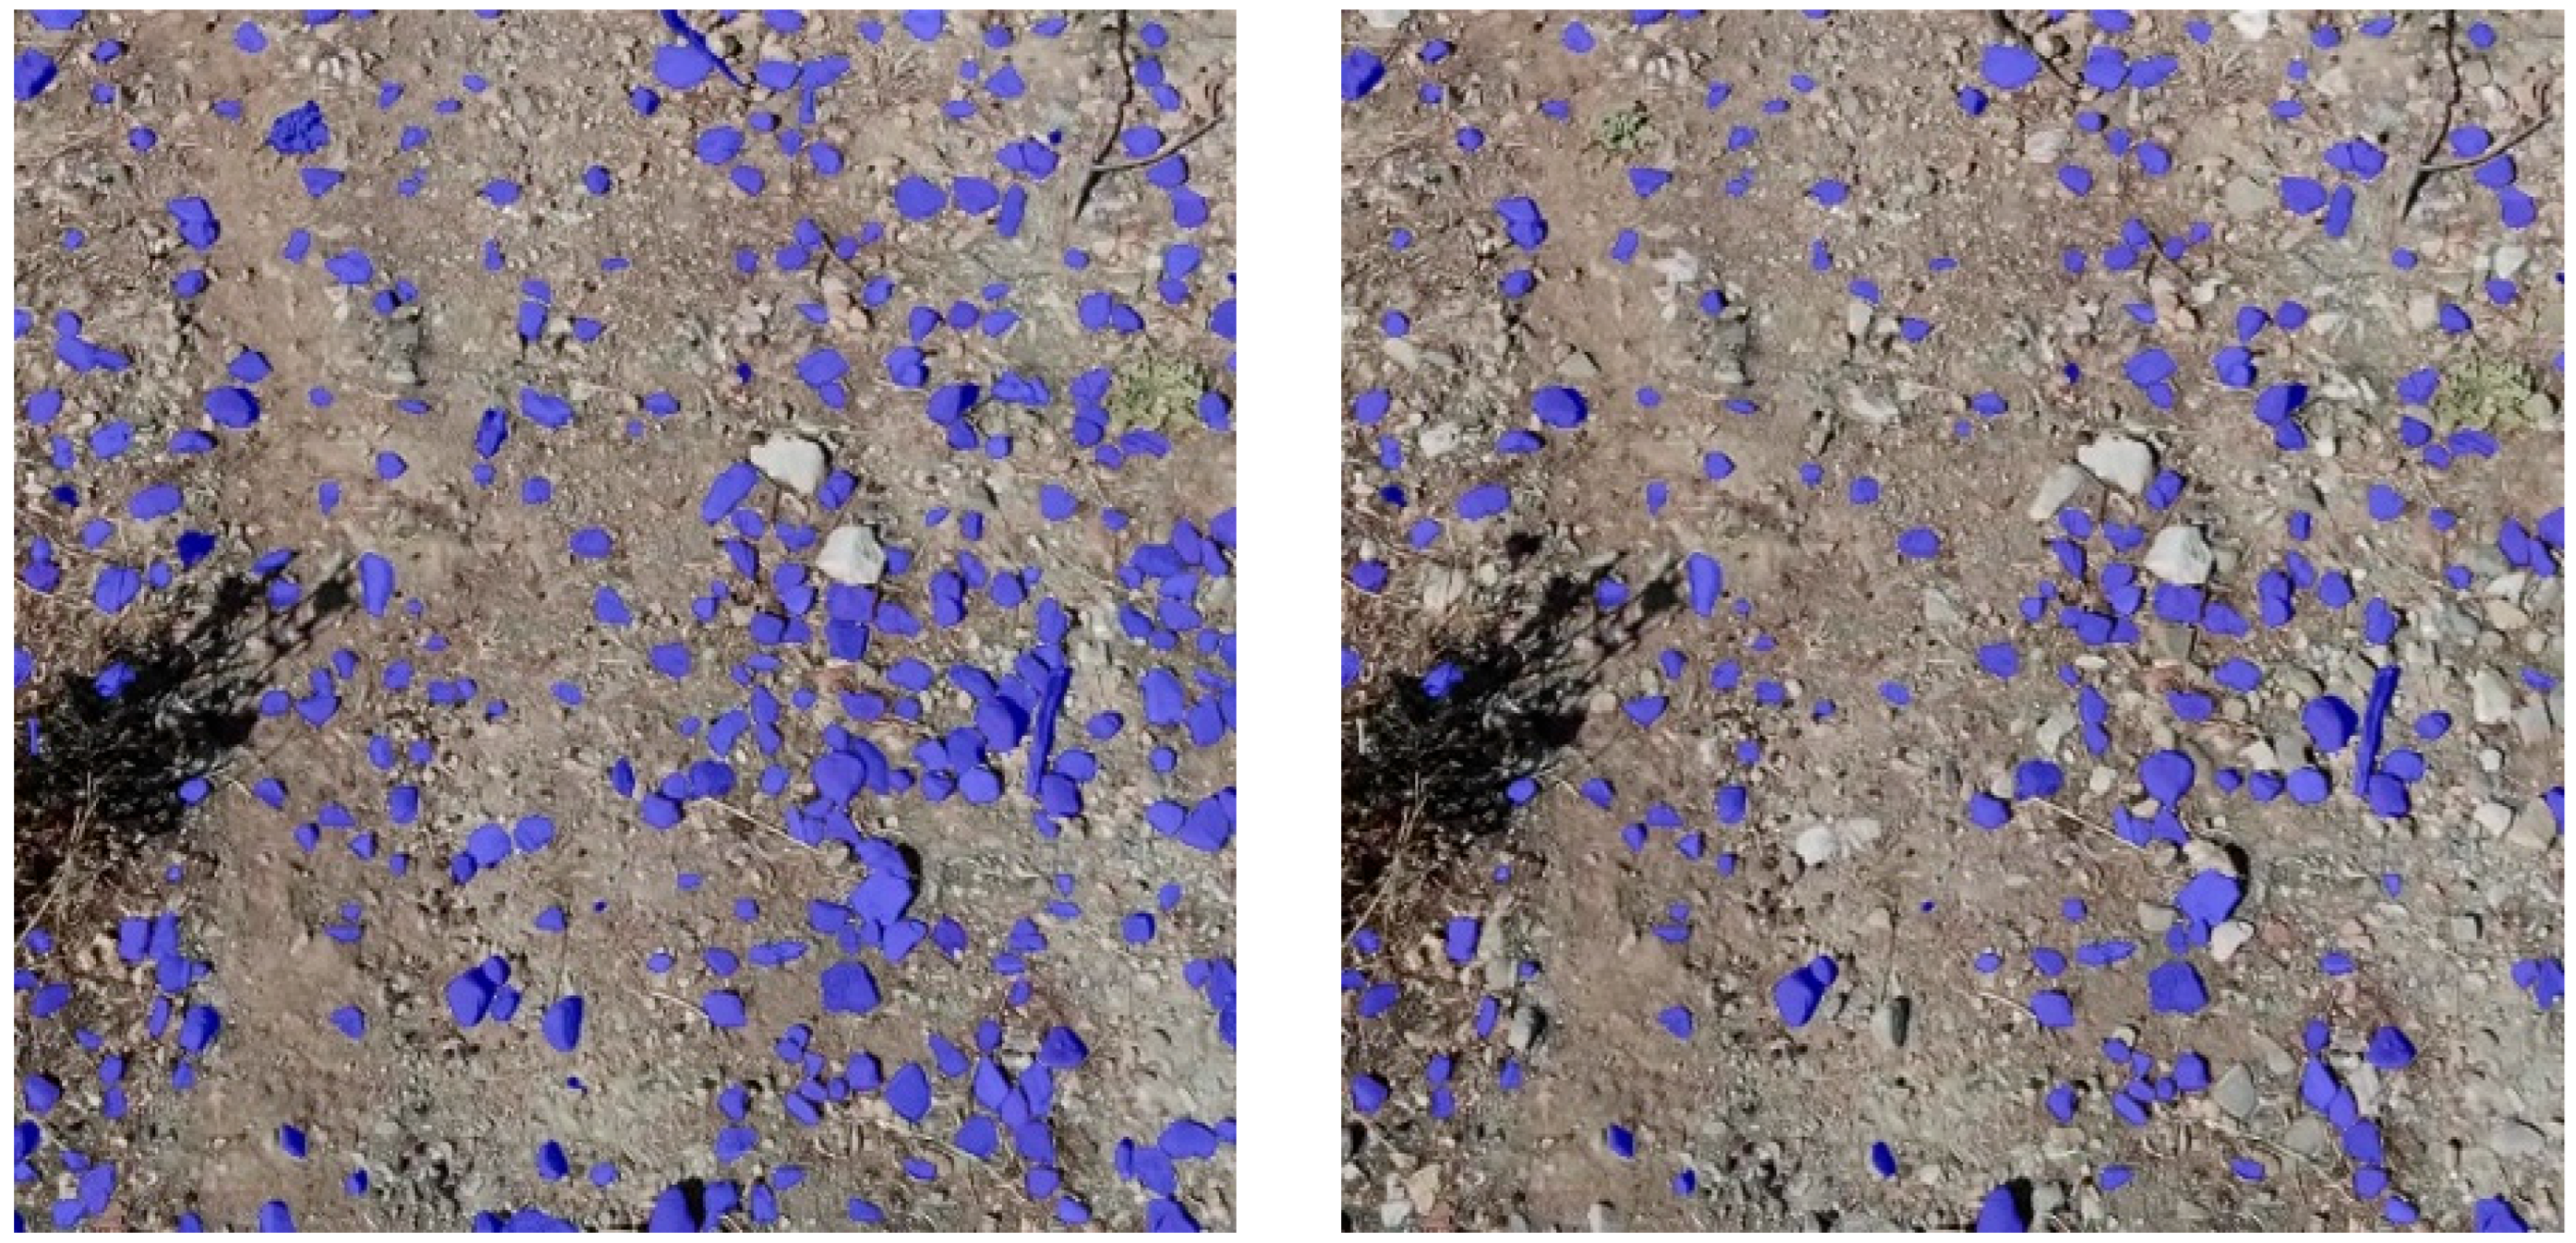
First, we applied a filtering step based on object area, with thresholds empirically determined for the specific site. Objects smaller than 1 cm² or larger than 500 cm² were excluded, effectively removing most non-relevant features.
Second, based on the color distribution of potsherds, we filtered objects with deviating color ranges. To achieve this, the images were first converted into the HSV (hue, saturation, value) color space, which has been shown to be more effective for color filtering than Red-Green-Blue images [11]. Objects with hue values falling outside an empirically defined range for potsherds were subsequently removed.
Third, we applied non-maximum suppression to remove overlapping segmentations, retaining only the segment with the maximum area within each overlapping group. The combined effect of these steps yielded high-precision delineation of potsherds, as illustrated in Figure 21 above (right) and Figure 22 below.
3.5.2. Results and Preliminary Assessment
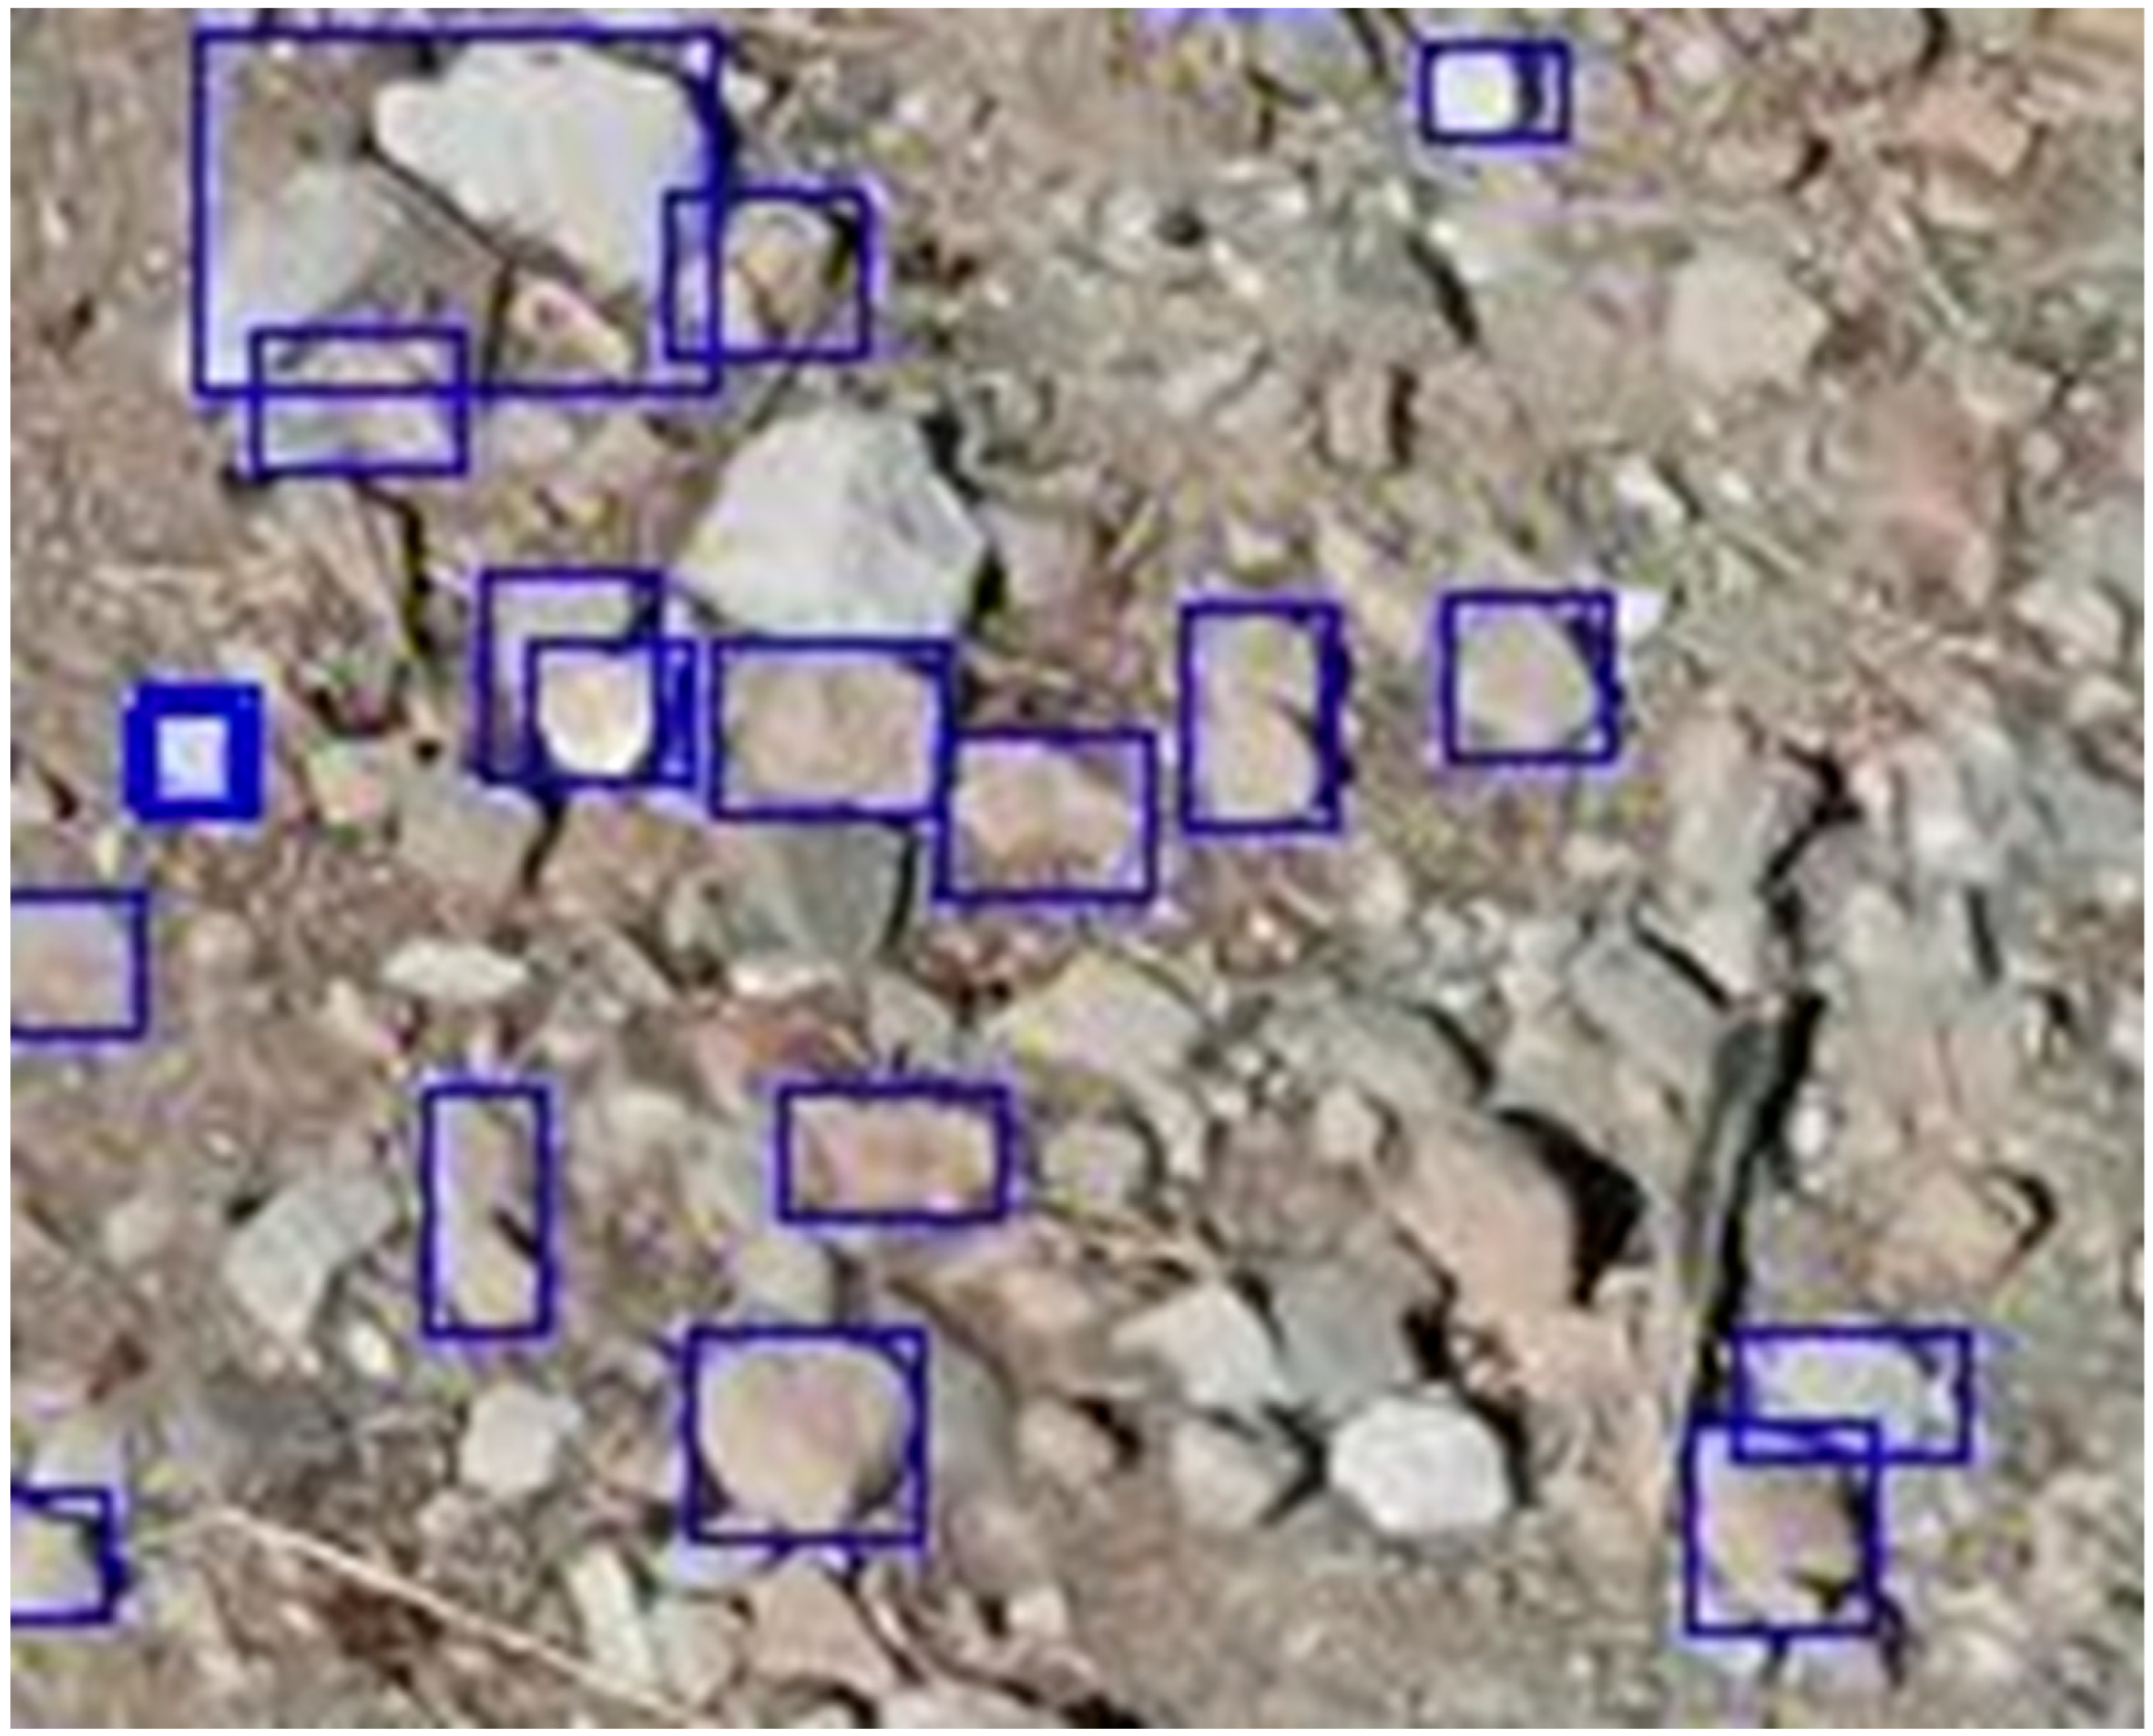
A quantitative evaluation of performance is challenging here due to the extraordinarily large number of potsherds at the test site. Nevertheless, based on visual inspection, we estimate that approximately 80% of the sherds were successfully detected, with very few false positives (Fig. 22). Annotated video material supporting this estimate is available in the accompanying material to this article (section 5) and we encourage readers to validate our findings or test the workflow on their own datasets, including drone footage or orthophotos.
Figure 21.
Potsherd detections shown with bounding boxes (blue). Occasional false positives, e.g. large stones on top edge of image. Some potsherds were missed in the bottom right corner, for example.
Figure 21.
Potsherd detections shown with bounding boxes (blue). Occasional false positives, e.g. large stones on top edge of image. Some potsherds were missed in the bottom right corner, for example.
In summary, SAM demonstrated effectiveness in delineating and quantifying potsherds from drone imagery, reducing the manual effort typically required from weeks to merely hours, as described in the projects cited above. To process footage from a given site, users need only define appropriate filter parameters — such as the hue range corresponding to the pottery types present at the site. In our case, this calibration process was completed in under two hours. Nevertheless, SAM remains computationally demanding; processing a 10-minute video may require up to five hours. A promising alternative is FastSAM [44], which seeks to substantially reduce processing time while maintaining comparable segmentation performance.
4. Discussion and Outlook
In this study, we examined the efficacy of visual foundation models for detecting archaeological features in remote sensing data using a zero-shot approach — that is, without any fine-tuning specific to the research domain. Our key finding is that, across five experiments involving different types of remote sensing data and archaeological site types, the models demonstrated detection performance comparable to that of human experts and previously established automated detection methods.
For archaeologists, a major advantage of this approach lies in the elimination of the need for training data, resulting in a substantially lower entry barrier. In addition, the required human effort is measured in hours rather than months, making the method highly accessible. While our results were consistent across three foundation models and three types of remote sensing data, it remains to be seen whether this trend generalizes to other modalities or archaeological contexts. We therefore encourage the research community to replicate and expand upon our work. To support such efforts, we provide a suite of scripts designed to simplify access to the tested foundation models and streamline the experimental workflow.
If future experiments confirm the observed trend, this approach has the potential to democratize archaeological remote sensing. Researchers without background in artificial intelligence or software development could effectively leverage foundation models by following the workflow we propose: First, a small sample can be tested using versions of ChatGPT or Gemini available on the internet along with prompt variations as demonstrated in this study. Second, if initial results appear promising, we recommend extending the expanding to a larger dataset that includes both positive and negative cases, to evaluate false positive rates. This can be facilitated using the scripts provided in this article. Third, for landscape-scale analyses, the remote sensing data can be partitioned into a spatial grid, with each grid cell processed automatically using the same scripts.
Only if this workflow fails to produce satisfactory results should researchers consider fine-tuning foundation models or resorting to other automated detection methods, both of which entail substantially greater effort and expertise.
The foundation models evaluated in this study are subject to frequent updates, often on a monthly or quarterly basis, which incorporate revised training data and model improvements. One key observation from our experiments is that the recency of a model’s release appears to be a critical determinant of performance. For example, earlier versions of Gemini were unable to produce usable results for LiDAR data, whereas version 2.0 (released in February 2025) demonstrated markedly improved outcomes. As the training data used for these models are typically undisclosed, we can only speculate that recent versions may have incorporated a greater volume of remote sensing data — particularly LiDAR — into their training corpora. This could also plausibly explain the significant performance differences observed between GPT-4.1 and Gemini 2.0-flash in experiment 3 above.
Despite the promising results presented in this study, several open issues remain that require further investigation. First, foundation models typically demand substantial memory and computational resources, which are generally only available via cloud-based environments rather than at the user's local site. This introduces external costs, although these are expected to decrease over time due to growing competition in the cloud services sector. In our project, the total cloud computing expenditure amounted to approximately USD 100. Furthermore, uploading data to the cloud raises privacy concerns, as many service providers reserve the right to reuse submitted data, which may not align with research ethics or data protection regulations.
Second, there are unresolved challenges intrinsic to the models themselves. As demonstrated, the quality of bounding box outputs is often inadequate — objects may be correctly identified, but precise spatial localization remains elusive. Additionally, the phenomenon of hallucinations, wherein the model produces spurious or implausible detections, underscores the necessity for manual verification, at least on a sampling basis, to ensure result reliability.
In addition to these limitations, a further critical direction for future research concerns the applicability of foundation models to non-visual remote sensing modalities such as multispectral, thermal, or seismic data. In our experiments, meaningful results were only achieved when the data was either natively within the visual color spectrum or could be translated into an equivalent visual representation such as greyscale hillshades derived from LiDAR. This represents a significant constraint on current applicability. Addressing this limitation will be essential to broaden the usefulness of foundation models across the full spectrum of remote sensing data types.
5. Data Availability
The source code developed for this project, along with download links for the datasets used, is publicly available on GitHub at https://github.com/juergenlandauer/FoundationModelsArchaeology. Detailed usage instructions are provided within the repository. The source code is released under the Creative Commons Attribution-ShareAlike 4.0 International License (CC BY-SA 4.0). The sources of the datasets used in this study are listed in Table 23 below.
Table 22.
Data sources used in this article.
| Experiment | Data source | License | Available from |
|---|---|---|---|
| 1: Bavarian castles | Coordinates: Bayerische Schlösser- und Seenverwaltung / Bayerische Vermessungsverwaltung | Creative Commons (CC BY-ND) | https://gdk.gdi-de.org/geonetwork/srv/api/records/b1c27b44-f60d-497f-a8cf-b555033db245 |
| Imagery: Microsoft Bing Satellite | Microsoft Bing Maps terms of use available at https://www.microsoft com/en-us/maps/product/print-rights | Microsoft Bing Maps API (see https://learn.microsoft.com/en-us/bingmaps/rest-services/). |
|
| 2: Cambodian temples | Not publicly available due to the ethics of archaeological site protection | ||
| 3+4: English hillforts | Coordinates: Atlas of Hillforts in Britain and Ireland [28] | Creative Commons (CC BY-SA 4.0) |
https://hillforts.arch.ox.ac.uk |
| Imagery: British Environment Agency National LIDAR Programme | Open Government License (see https://www.nationalarchives.gov.uk/doc/open-government-licence/version/3/) | https://environment.data.gov.uk/dataset/2e8d0733-4f43-48b4-9e51-631c25d1b0a9 | |
| 5: Potsherds in drone video | Video: Author J.L. | Creative Commons (CC BY-SA 4.0) | GitHub of article (see above) |
Author Contributions
Conceptualization: J.L and S.K.; Data curation: J.L and S.K.; Formal analysis: J.L and S.K.; Methodology: J.L and S.K.; Project administration: J.L.; Resources: J.L and S.K.; Software: J.L.N.A., F.V., M.S. and M.D.; Validation: J.L and S.K.; Visualization: J.L; Roles/Writing—original draft: J.L.; and Writing—review & editing: J.L and S.K. All authors have read and agreed to the published version of the manuscript.
Funding
This research received no external funding.
References
- Abate, N.; Visone, F.; Sileo, M.; Danese, M.; Amodio, A.M.; Lasaponara, R.; Masini, N. Potential Impact of Using ChatGPT-3.5 in the Theoretical and Practical Multi-Level Approach to Open-Source Remote Sensing Archaeology, Preliminary Considerations. Heritage 2023, 6, 7640–7659. [Google Scholar] [CrossRef]
- Achiam, J.; et al. GPT-4 Technical Report. 2023. [Google Scholar] [CrossRef]
- Agapiou, A.; Vionis, A.; Papantoniou, G. Detection of Archaeological Surface Ceramics Using Deep Learning Image-Based Methods and Very High-Resolution UAV Imageries. Land 2021, 10, 1365. [Google Scholar] [CrossRef]
- Arnold, T.B.; Tilton, L. Explainable Search and Discovery of Visual Cultural Heritage Collections with Multimodal Large Language Models. Workshop on Computational Humanities Research 2024. [Google Scholar] [CrossRef]
- Bai, S.; Chen, K.; Liu, X.; Wang, J.; Ge, W.; Song, S.; et al. Qwen2.5 VL Technical Report. ArXiv 2025. [Google Scholar] [CrossRef]
- Bommasani, R.; Hudson, D.A.; Adeli, E.; Altman, R.; Arora, S.; Arx, S.V.; Bernstein, M.S.; Bohg, J.; Bosselut, A.; Brunskill, E.; et al. On the Opportunities and Risks of Foundation Models. ArXiv 2021. [Google Scholar] [CrossRef]
- Canedo, D.; Hipólito, J.; Fonte, J.; Dias, R.; Pereiro, T.D.; Georgieva, P.; Gonçalves-Seco, L.; Vázquez, M.; Pires, N.; Fábrega-Álvarez, P.; et al. The Synergy between Artificial Intelligence, Remote Sensing, and Archaeological Fieldwork Validation. Remote. Sens. 2024, 16, 1933. [Google Scholar] [CrossRef]
- Cheng, T.; Song, L.; Ge, Y.; Liu, W.; Wang, X.; Shan, Y. YOLO-World: Real-Time Open-Vocabulary Object Detection. In 2024 IEEE/CVF Conference on Computer Vision and Pattern Recognition (CVPR); 2024; pp. 16901-16911. [CrossRef]
- Ciccone, G. ChatGPT as a Digital Assistant for Archaeology: Insights from the Smart Anomaly Detection Assistant Development. Heritage 2024, 7, 5428–5445. [Google Scholar] [CrossRef]
- Cowley, D.C. Remote sensing for archaeology and heritage management – site discovery, interpretation and registration. Remote sensing for archaeological heritage management, Archaeolingua, Ed. D. C. Cowley. 2011. [Google Scholar]
- Gonzalez, R.C.; Woods, R.E. Digital image processing, 2nd ed.; Prentice Hall, 2002. [Google Scholar]
- Google DeepMind. Gemini Technical Overview. 2025. Available online: https://deepmind.
- Guo, J.; Zimmer-Dauphinee, J.; Nieusma, J.M.; Lu, S.; Liu, Q.; Deng, R.; Cui, C.; Yue, J.; Lin, Y.; Yao, T.; et al. DeepAndes: A Self-Supervised Vision Foundation Model for Multi-Spectral Remote Sensing Imagery of the Andes. Arxiv 2025. [Google Scholar] [CrossRef]
- Huang, L.; Yu, W.; Ma, W.; Zhong, W.; Feng, Z.; Wang, H.; Chen, Q.; Peng, W.; Feng, X.; Qin, B.; et al. A Survey on Hallucination in Large Language Models: Principles, Taxonomy, Challenges, and Open Questions. ACM Trans. Inf. Syst. 2025, 43, 1–55. [Google Scholar] [CrossRef]
- Huo, C.; Chen, K.; Zhang, S.; Wang, Z.; Yan, H.; Shen, J.; Hong, Y.; Qi, G.; Fang, H.; Wang, Z. When Remote Sensing Meets Foundation Model: A Survey and Beyond. Remote. Sens. 2025, 17, 179. [Google Scholar] [CrossRef]
- Kirillov, A.; Mintun, E.; Ravi, N.; Mao, H.; Rolland, C.; Gustafson, L.; Xiao, T.; Whitehead, S.; Berg, A.C.; Lo, W.Y.; Dollár, P. Segment Anything. 2023 IEEE/CVF International Conference on Computer Vision (ICCV). 2023; pp. 3992-4003. [CrossRef]
- Klassen, S.; Carter, A.K.; Evans, D.H.; Ortman, S.; Stark, M.T.; Loyless, A.A.; Polkinghorne, M.; Heng, P.; Hill, M.; Wijker, P.; et al. Diachronic modeling of the population within the medieval Greater Angkor Region settlement complex. Sci. Adv. 2021, 7, eabf8441. [Google Scholar] [CrossRef] [PubMed]
- Klassen, S.; Weed, J.; Evans, D.; Petraglia, M.D. Semi-supervised machine learning approaches for predicting the chronology of archaeological sites: A case study of temples from medieval Angkor, Cambodia. PLOS ONE 2018, 13, e0205649. [Google Scholar] [CrossRef] [PubMed]
- Kokalj, Ž.; Hesse, R. Airborne laser scanning raster data visualization – a guide to good practice. Prostor, Kraj, Čas 14. Ljubljana: ZRC SAZU. 2017. Available online: https://iaps.zrc-sazu.si/en/publikacije/airborne-laser-scanning-raster-data-visualization-1#v (accessed on 9 May 2025).
- Kokalj, Ž.; Hesse, R.; Somrak, M. Visualisation of LiDAR-derived relief models for detection of archaeological features. Journal of Archaeological Science 2019, 106, 101–112. [Google Scholar] [CrossRef]
- Kokalj, Ž.; Somrak, M. Why Not a Single Image? Combining Visualizations to Facilitate Fieldwork and On-Screen Mapping. Remote. Sens. 2019, 11, 747. [Google Scholar] [CrossRef]
- Landauer, J.; Maddison, S.; Fontana, G.; Posluschny, A.G. Archaeological Site Detection: Latest Results from a Deep Learning Based Europe Wide Hillfort Search. J. Comput. Appl. Archaeol. 2025, 8, 42–58. [Google Scholar] [CrossRef]
- Landauer, J.; Klassen, S.; Wijker, A.P.; van der Kroon, J.; Jaszkowski, A.; der Vaart, W.B.V.-V.; Petraglia, M.D. Beyond the Greater Angkor Region: Automatic large-scale mapping of Angkorian-period reservoirs in satellite imagery using deep learning. PLOS ONE 2025, 20, e0320452. [Google Scholar] [CrossRef]
- Lasaponara, R.; Masini, N. Satellite remote sensing in archaeology: past, present and future perspectives. J. Archaeol. Sci. 2011, 38, 1995–2002. [Google Scholar] [CrossRef]
- Lesiv, M.; See, L.; Bayas, J.C.L.; Sturn, T.; Schepaschenko, D.; Karner, M.; Moorthy, I.; McCallum, I.; Fritz, S. Characterizing the Spatial and Temporal Availability of Very High Resolution Satellite Imagery in Google Earth and Microsoft Bing Maps as a Source of Reference Data. Land 2018, 7, 118. [Google Scholar] [CrossRef]
- Li, W.; Lee, H.; Wang, S.; Hsu, C.; Arundel, S.T. Assessment of a new GeoAI foundation model for flood inundation mapping. Proceedings of the 6th ACM SIGSPATIAL International Workshop on AI for Geographic Knowledge Discovery 2023. [Google Scholar] [CrossRef]
- Liu, F.; Chen, D.; Guan, Z.; Zhou, X.; Zhu, J.; Ye, Q.; Fu, L.; Zhou, J. RemoteCLIP: A Vision Language Foundation Model for Remote Sensing. IEEE Trans. Geosci. Remote. Sens. 2023, 62, 1–16. [Google Scholar] [CrossRef]
- Lock, G.; Ralston, I. Atlas of hillforts of Britain and Ireland. 2024. Available online: https://hillforts.arch.ox.ac.uk.
- Lu, S.; Guo, J.; Zimmer-Dauphinee, J.R.; Nieusma, J.M.; Wang, X.; Vanvalkenburgh, P.; Wernke, S.A.; Huo, Y. Vision Foundation Models in Remote Sensing: A survey. IEEE Geosci. Remote. Sens. Mag. 2025, 2–27. [Google Scholar] [CrossRef]
- Mai, G.; Huang, W.; Sun, J.; Song, S.; Mishra, D.; Liu, N.; Lao, N. On the Opportunities and Challenges of Foundation Models for Geospatial Artificial Intelligence. ArXiv 2023. [CrossRef]
- McCoy, M.D. Geospatial Big Data and archaeology: Prospects and problems too great to ignore. J. Archaeol. Sci. 2017, 84, 74–94. [Google Scholar] [CrossRef]
- Microsoft. Bing satellite imagery. Bing Maps. 2025. Available online: https://www.bing.com/maps.
- Mishra, M.; Zhang, K.; Mea, C.; Barazzetti, L.; Fassi, F.; Fiorillo, F.; Previtali, M. Deep Learning-Based AI-Assisted Visual Inspection Systems for Historic Buildings and their Comparative Performance with ChatGPT-4O. ISPRS - Int. Arch. Photogramm. Remote. Sens. Spat. Inf. Sci. XLVIII-2/W8-2024, 327–334. [CrossRef]
- Orengo, H.; Garcia-Molsosa, A. A brave new world for archaeological survey: Automated machine learning-based potsherd detection using high-resolution drone imagery. J. Archaeol. Sci. 2019, 112. [Google Scholar] [CrossRef]
- Osco, L.P.; de Lemos, E.L.; Gonçalves, W.N.; Ramos, A.P.M.; Junior, J.M. The Potential of Visual ChatGPT for Remote Sensing. Remote. Sens. 2023, 15, 3232. [Google Scholar] [CrossRef]
- Palatucci, M.; Pomerleau, D.; Hinton, G.; Mitchell, T. Zero-shot Learning with Semantic Output Codes. Advances in Neural Information Processing Systems 22 - Proceedings of the 2009 Conference, 2009; 22, 1410–1418. [Google Scholar]
- Radford, A.; Kim, J.W.; Hallacy, C.; Ramesh, A.; Goh, G.; Agarwal, S.; Sutskever, I. Learning Transferable Visual Models From Natural Language Supervision. Proceedings of the 38th International Conference on Machine Learning, PMLR 2021, 139, 2021. [Google Scholar] [CrossRef]
- Steiner, A.; Pinto, A.S.; Tschannen, M.; Keysers, D.; Wang, X.; Bitton, Y.; Gritsenko, A.; Minderer, M.; Sherbondy, A.; Long, S.; et al. PaliGemma 2: A family of versatile VLMs for transfer. ArXiv 2024. [CrossRef]
- Tao, L.; Zhang, H.; Jing, H.; Liu, Y.; Yan, D.; Wei, G.; Xue, X. Advancements in Vision–Language Models for Remote Sensing: Datasets, Capabilities, and Enhancement Techniques. Remote. Sens. 2025, 17, 162. [Google Scholar] [CrossRef]
- Wernke, S.A.; Van Valkenburgh, P.; Zimmer-Dauphinee, J.; Whitlock, B.; Morrow, G.S.; Smith, R.; Smit, D.; Ortega, G.R.; Jara, K.R.; Plekhov, D.; et al. Large-scale, collaborative imagery survey in archaeology: the Geospatial Platform for Andean Culture, History and Archaeology (GeoPACHA). Antiquity 2024, 98, 155–171. [Google Scholar] [CrossRef]
- Wu, Z.; Chen, X.; Pan, Z.; Liu, X.; Liu, W.; Dai, D.; Gao, H.; Ma, Y.; Wu, C.; Wang, B.; et al. DeepSeek VL2: Mixture of Experts vision language models for advanced multimodal understanding. ArXiv 2024. [CrossRef]
- Xiao, A.; Xuan, W.; Wang, J.; Huang, J.; Tao, D.; Lu, S.; Yokoya, N. Foundation models for remote sensing and earth observation: A survey. IEEE Geoscience and Remote Sensing Magazine. [CrossRef]
- Xiao, B.; Wu, H.; Xu, W.; Dai, X.; Hu, H.; Lu, Y.; Zeng, M.; Liu, C.; Yuan, L. Florence-2: Advancing a Unified Representation for a Variety of Vision Tasks. 2024 IEEE/CVF Conference on Computer Vision and Pattern Recognition (CVPR), 48182024; 4818–4829. Available online: https://doi.ieeecomputersociety.org/10.1109/CVPR52733.2024.00461.
- Zhao, X.; Ding, W.; An, Y.; Du, Y.; Yu, T.; Li, M.; Tang, M.; Wang, J. Fast Segment Anything. ArXiv 2023. [CrossRef]
- Zimmer-Dauphinee, J.; VanValkenburgh, P.; Wernke, S.A. Eyes of the machine: AI-assisted satellite archaeological survey in the Andes. Antiquity 2024, 98, 245–259. [Google Scholar] [CrossRef]
Disclaimer/Publisher’s Note: The statements, opinions and data contained in all publications are solely those of the individual author(s) and contributor(s) and not of MDPI and/or the editor(s). MDPI and/or the editor(s) disclaim responsibility for any injury to people or property resulting from any ideas, methods, instructions or products referred to in the content. |
© 2025 by the authors. Licensee MDPI, Basel, Switzerland. This article is an open access article distributed under the terms and conditions of the Creative Commons Attribution (CC BY) license (http://creativecommons.org/licenses/by/4.0/).
Copyright: This open access article is published under a Creative Commons CC BY 4.0 license, which permit the free download, distribution, and reuse, provided that the author and preprint are cited in any reuse.


