
Submitted:
04 August 2025
Posted:
05 August 2025
You are already at the latest version
Abstract
Background: Following vitamin D3 oral administration, attained serum concentrations of its metabolite 25-hydroxyvitamin D3 (25(OH)D3) are variable among children. Methods: We developed physiologically-based pharmacokinetic (PBPK) modelling using annually measured serum 25(OH)D3 concentrations in 77 Cape Town schoolchildren aged 6-11 years who received weekly oral doses of 10,000 IU vitamin D3 for 3 years during a clinical trial. Simulations were performed to test the model on 463 other participants in the same trial, and in a cohort of 1871 Mongolian schoolchildren aged 6-14 years who received weekly oral doses of 14,000 IU vitamin D3 for 3 years in another trial. Results: The best model attributed most of the variability in post-supplementation 25(OH)D3 concentrations to hepatic clearance and covariates including weight (ΔAIC=-21) and ZBMI (body mass index Z-score, ΔAIC=-34). For 463 other children from the same Cape Town trial (mean 25.8 nmol/L, 95% CI: [8.3-47.2] nmol/L), the mean estimation error was 5.3 nmol/L, and 76.7% of observations were within the 95% prediction intervals. Our simulation supported the previous proposal that serum 25(OH)D3 should exceed 50 nmol/L among 97.5% of European children at 24.4 μg/day vitamin D3 dosing. Despite a higher weekly dose (14,000 IU), the Mongolian children demonstrated a smaller average increase in serum 25(OH)D3 (23.3 [-24.5, 83.1] nmol/L), and were overestimated by the model. Conclusion: We developed the first PBPK model to successfully predict the long-term serum 25(OH)D3 increases in healthy schoolchildren in Cape Town who received orally administered vitamin D3 and exhibited higher increases than Mongolian children.
Keywords:
vitamin D
; healthy children
; PBPK modelling
; nonlinear mixed effects modelling
1. Introduction
Vitamin D plays crucial roles in bone health and development in children, as well as in maintaining calcium, phosphate, and magnesium homeostasis in the body [1,2]. Vitamin D deficiency is defined as serum 25-hydroxyvitamin D3 (25(OH)D3) concentrations less than 50 nmol/L by the Institute of Medicine (IOM) [3]. Following this definition, a worldwide study spanning 2000 to 2022 revealed 48.5% (90% CI: [42.5-54.5%]) of individuals <18 years of age are deficient [4]. In particular, regional studies found deficiency in 39.1% of under 18-year-olds in the United Arab Emirates [5], 64% of the 9-to 13-year-olds in Poland in March [6], and 65% children aged 6 to 12 years in Pakistan [7]. Deficiency is partly due to insufficient sun exposure during winter and spring [5,6,7,8]. By even the most conservative serum 25(OH)D3 threshold of 25 nmol/L, vitamin D deficiency is still frequent in both low- and high-income countries [8].
A meta-regression of 1429 subjects across 11 trials with vitamin D-fortified foods, conducted by Cashman and colleagues [9], revealed that the dietary requirement for 97.5% of children aged 2-17 years to maintain serum 25(OH)D3 over 50 nmol/L is 24.4 µg/day (95% CI: 16.8-38.2 µg/day) [9]. This model was adjusted for baseline levels, age, and BMI from the population living between latitudes 40° and 63°N [9].
Compared with regression modelling, pharmacokinetic (PK) modelling is often used to predict longitudinal changes in circulating concentrations of metabolites following administration of a drug or nutritional supplement, and has been adopted to inform dosing guidelines for paediatric clinical care [10,11]. Previously, a one-compartment model of 25(OH)D3 PK in children with chronic kidney disease suggested that a weight-based dosing strategy is needed [12]. Unfortunately, population predictions using this model systematically overestimated serum 25(OH)D3 concentrations, indicating that the model structure needed changing in order to make reliable predictions. Taken together, these factors motivated us to develop a PK model and use it to examine the 24.4 µg/day dose recommended by Cashman and colleagues [9].
For healthy adults, our previous physiologically-based pharmacokinetic (PBPK) modelling accurately predicted the mean serum 25(OH)D3 concentrations across a wide range of vitamin D3 doses in 155 trial arms, from 12.5 µg/day to 1250 µg/day for daily dosing, and up to 50,000 µg for bolus dosing [13]. This naïve average model highlighted the non-linear dose-exposure relationship for 25(OH)D3. We further developed the model into a nonlinear mixed effects model and identified weight as a predictive covariate for PK in healthy adults [14]. Here, we modified this adult model to fit data from a randomised controlled trial of vitamin D supplementation, which was conducted in Cape Town, South Africa to test the prevention of tuberculosis infection and disease [15], and compared model predictions using data from a sister trial in Mongolia [16].
2. Materials and Methods
2.1. Study Participants and Clinical Data Collection
Children in Grades 1-4 (aged 6 to 11 years) at participating schools in the Klipfontein district of Cape Town, South Africa, were recruited to the ViDiKids trial [15]. Over a 3-year period, each child randomised to the intervention arm received a weekly oral capsule containing 250µg (10,000 IU) vitamin D3. Capsule administration was recorded by the trial team during term-times and was supervised by parents/guardians during school holidays and COVID-19 lockdowns. Dosing records for each participant were used for model fitting and simulation. All received doses were assumed to be taken. Blood samples were collected at baseline and 36 months for all participants; and at 6, 12 and 24 months in a subset. Serum 25(OH)D2 and 25(OH)D3 concentrations were quantified with liquid chromatography tandem mass spectrometry [17]. The concentration of serum 25(OH)D2 was comparable to approximately 1% that of the serum 25(OH)D3, and serum 25(OH)D2 was not consistently detected. The fitting and testing of the model only used the 25(OH)D3 data. For simplicity, vitamin D3 and 25(OH)D3 are referred to as vitamin D and 25(OH)D onwards, respectively. In addition, the 6-month time point was confounded by seasonal changes and was excluded from modelling. The model was fitted to 77 children and was tested on data from 463 other children.
2.2. Physiological Parameters
We averaged the cardiac output for boys (4.8 L/min) and girls (4.3 L/min) aged 7 to 9 [18] and took the mean 4.55 L/min (273 L/h) for our model. The average blood flow for children in this model was estimated assuming the fraction of blood flow going into each compartment was the same as a 70 kg man [18]. For simplicity, we assumed the proportion of each compartment’s volume was the same for children and adults, with a 1 kg/L apparent density. All physiological parameters are presented in Table S3.
2.3. Model Structure
We developed a series of 11 nested models with different covariate structures to select the best PBPK model.
The base model (Model 1) was based on our published adult model [13], which considered the arterial blood (Vart), venous blood (Vven), the liver (Vl), and the rest-of-the-body compartment (Vrb) which lumped together all non-elimination organs. These four compartments were applied to models 1-8 and 11 (Figure S1). In models 9 and 10, non-elimination organs were divided into fat mass (Vfm) and lean mass (Vlm) (Figure S2). All model equations are listed in the supplementary materials.
Partition coefficients Kp were introduced to describe the ratio between specific compartments and the venous blood. Kp>1 indicates the concentration is higher in a compartment than in the venous blood. Kprb and Kp25rb are for vitamin D and 25(OH)D in the rest of the body compartment, respectively; Kpl and Kp25l are for vitamin D and 25(OH)D in the liver, respectively; Kpfm is for 25(OH)D in fat mass (models 9-10); and Kplm is for 25(OH)D in lean mass (models 9-10).
Fm refers to the fraction of vitamin D metabolised into 25(OH)D, which was assumed to be 0.33 [13]. CLH is the hepatic clearance rate (L/h).
The clearance of 25(OH)D was described by a sigmoidal function, to describe the nonlinear relationship between dose and 25(OH)D serum concentration:
To speed up simulation, we assumed vitamin D level in venous blood was kept in a steady state with arterial blood and the rest of the body. Thus, vitamin D concentrations of these two compartments were explicit functions of the venous blood concentration (equations 1 and 2). Simulated 25(OH)D was not affected by this assumption and the computing time using the “daspk” ordinary differential equations (ODE) solver, an implicit method for stiff ODEs and differential-algebraic equations (DAEs) implemented in R version 4.2.2, was reduced by ~90%. See supplementary section 1 for details.
Aart and Aven are the amount of vitamin D in the arterial and venous blood, respectively. Qco , Ql , and Qrb are the cardiac output, the liver blood flow and the blood flow to the rest of the body, respectively. Vart and Vven are the volume of distribution for the arterial and venous blood, respectively.
All models assumed combined additive and proportional residual errors. The fixed and random effects are tabulated (Tables 1 and S5).
The base model (Model 1) did not include any covariate to estimate parameters. All other models assumed that the volume of distribution of each compartment was directly proportional to weight (WT), and the maximum clearance rate for serum 25(OH)D (CLMAX) was proportional to WT0.75. Models 2-4 and 11 fixed the weight to its baseline value for each child. Models 5 and 6 assumed linear weight gain:
Models 7-10 interpolated weight from baseline to 3 years linearly for each child:
In Model 6, was related to the BMI-for-age Z-score (ZBMI) via :
In Models 9 and 10, the fraction of fat mass was reported to be related to ZBMI [19]:
2.4. Model Assessment and Selection
All nonlinear mixed-effects (NLME) models were fitted using the stochastic approximation expectation-maximization (SAEM) routine in nlmixr2 R package. To assess the fitting, we visualised the goodness-of-fit, distribution of conditional weighted residuals (CWRES), normalised prediction distribution errors (NPDEs) and performed a visual predictive check (VPC). We deemed η shrinkage <30% to be acceptable. Akaike information criterion (AIC) and Bayesian information criterion (BIC) were assessed for model selection. As conclusions based on the AIC and BIC were consistent, we did not prioritise one over the other.
For VPC, 1,000 samples of random effects ( and ) and residual errors were drawn to simulate the 5th, 50th and 95th percentiles of serum 25(OH)D, together with 90% prediction intervals (PI) around each percentile.
2.5. Simulations
To test the model independently, we simulated 9 children in the treatment arm of the safety sub-study (baseline, 1, and 2 years) and another 454 children in the treatment group (baseline and 3 years). For each child, we generated 30 virtual studies to estimate the 95% prediction intervals of the simulated 2.5th, 50th and 97.5th percentiles. In each study, a realisation of the fixed effect uncertainty ( and ) was made, and 2,500 samples of the IIV () and the additive residual error were generated to simulate the PK according to the dosing record of that child. The proportional residual error was not sampled to ensure simulations started with the observed baseline values.
To simulate the European children, a virtual population was generated for 1,250 boys and 1,250 girls for the 6-year-olds and 11-year-olds, respectively. Baseline serum 25(OH)D was sampled as per the reported 5th, 25th, 50th, 75th and 95th percentiles for European children [20]. For simplicity, points were sampled uniformly between each pair of neighbouring percentiles. To cover the whole range, we assumed the lower and upper bounds of 10 and 90 nmol/L, respectively. The WHO provides weight-for-age information from birth to 10 years. For the 6-year group, weight was sampled as per the 1st, 3rd, 5th, 15th, 25th, 50th, 75th, 85th, 95th, 97th and 99th percentiles reported by the WHO [21]. Similarly, uniform distribution was assumed between two percentiles. We used the weight-for-age Z-score as a proxy for the BMI Z-score. For the 11-year group, the WHO does not provide weight distribution, but instead reports BMI and height distribution. Hence, we initially sampled the body mass index-for-age [21] and height-for-age [22] percentiles (both at 1st, 3rd, 5th, 15th, 25th, 50th, 75th, 85th, 95th, 97th and 99th ) assuming independent distribution, and calculated the weight for each virtual child. As was done for the simulation of each child, 30 virtual studies were generated to sample the fixed effect uncertainty, random effects and the additive errors to estimate the 95% prediction intervals of the simulated 2.5th, 50th and 97.5th percentiles.
2.6. Comparing Trial Results
To compare the results from the Cape Town trial with its sister Mongolian trial, we compared the mean weight and serum 25(OH)D at baseline, weekly dose (250µg Cape Town v 350µg Mongolia), compliance (i.e. received doses / number of weeks ×100%), serum 25(OH)D increase. We graphed the 3-year changes in serum 25(OH)D versus with compliance. Baseline weight and age were fitted to a linear regression model to infer the mean weight increase each year (boy: 3.0 kg/year; girl: 3.4 kg/year). Similar to the European children described in section 2.5, we simulated the Mongolian children where each child started with their baseline weight and baseline serum 25(OH)D and was assumed to conform to the mean weight increase per year. Apart from this, simulation was also carried out at .
2.7. Computing Software and Environment
Baseline characteristics were analysed descriptively using IBM SPSS software, version 25 (IBM, NY, US). Categorical variables were summarised as frequencies and percentages, while continuous variables were presented as means with standard deviations. ZBMI for each child was computed in the WHO 2007 Z-Score calculator shiny app [23]. For NLME fitting, we used the nlmixr2 package version 2.0.9 in R (version 4.2.2) on a Linux high-performance cluster with 60 cores. Model fitting was performed using the SAEM routine implemented in nlmixr2. VPC was carried out using vpcSim function from the nlmixr2est R package version 2.1.5. Simulations were carried out with the rxode2 R package version 2.0.13 [24]. Graphical diagnostics were conducted using RStudio version 4.3.1.
3. Results
Out of the 1,682 participants in the ViDiKids trial, the first 200 participants enrolled on the study were also enrolled on a safety study. Among the 94 children in the treatment arm of this safety study, 77 children had their serum 25(OH)D consistently assessed at baseline, 1, 2 and 3 years, and were used to fit the model; 9 were assessed at baseline, 1 and 2 years, and were used to test the model; 8 had missing values and were excluded (Figure 1) [17]. Another 454 children were assessed at baseline and 3 years. They were also used to test the model (Figure 1). The baseline age and serum 25(OH)D of the 77 children for fitting were 8.9±1.3 years and 64.7±14.9 nmol/L, respectively. The baseline data were collected between March and September in 2017 (Table S1).
In the 94 children in the intervention arm of the safety study, mean serum 25(OH)D showed statistically significant increases (Figure S3). Baseline 25(OH)D was somewhat anti-correlated with ZBMI among the 77 children for model fitting (slope = -2.644 nmol/L; p-value = 0.10) (Figure S4).
3.1. The Final Model
The final model encompasses 5 compartments for vitamin D, including the GI tract, arterial blood, venous blood, the liver, and the rest of the body which lumps together all non-eliminating organs. For 25(OH)D, non-eliminating organs were divided into fat mass and lean mass (Figure 2). Predictive covariates include weight (to estimate the volume of distribution) and ZBMI (to estimate the fat mass and lean mass) [25]. Similar to our previous healthy adult PBPK model [13], a combined basal rate of vitamin D cutaneous synthesis and intake in each child was calculated so that the model was in balance with the baseline 25(OH)D prior to dosing (see supplementary materials Section 1 for details).
Model fitting made good parametric inference, with η shrinkage <30% (Table 2). Additive error (0.00249 nmol/L) was negligible, and proportional residual error was 0.109 which was small (Table 2). The random effect was independent from covariates (Figure S5), and the model was fitted at the optimal value of Kp25lm = 4 (Figure S6).
* IIV CV% is , where is the variance of random effects. Hence, .
The final model successfully repeated the observed serum 25(OH)D in 77 children for 3 years. Population predictions are in good agreement with observed serum 25(OH)D (Figure 3A). The concordance with data is higher for individual predictions (R2=0.70 in Figure 3B). The CWRES and NPDEs did not exhibit systemic errors, suggesting the model predictions were unbiased (Figure 2C-2F). Population and individual predictions for each child were plotted together with doses received during the 3-year span (Figure S7).
3.2. Visual Predictive Check
VPC verified model predictions. The observed 5th and 95th percentiles (red dashed lines in Figure 4) were within the 90% prediction intervals for the predicted 5th and 95th percentiles (shaded areas in Figure 4). The observed medians (black solid line in Figure 4) were also within 90% prediction intervals for the predicted medians. This confirms that model predictions were in good agreement with the fitting data.
3.3. Simulation of 9 Cape Town Children
To test the model, we first simulated 9 children from the same trial arm, who were not fitted. Here, we found observations for 5 out of 9 children were entirely within the 2.5th - 97.5th percentile range (Figure 5A, 5D, 5F, 5H, 5I). For the other 4 children, a 1-year observation (Figure 5C) and a 2-year observation (Figure 5E) were within the 2.5th - 97.5th predicted percentiles, and observations outside the 2.5th - 97.5th predicted percentiles were within ±20 nmol/L of the range (Figure 5B, 5C, 5E, 5G). This provided confidence in model predictions for up to 2 years of dosing.
In addition, we simulated further 454 children from the same trial, and found 76.9% of observed serum 25(OH)D were between the predicted 2.5th-97.5th percentiles (Figure S8). The mean difference between observation and the predicted 50th percentile is 5.4 nmol/L (90% CI: [-26.2, 39.5] nmol/L, Figure S9). The range of the predicted 2.5th to 97.5th percentiles changed over time. The range was smaller at the end of year 1, compared with the end of years 2 and 3 (Figure S10). Such range exhibited strong anti-correlation with baseline weight (R2=0.56) and was somewhat anti-correlated with baseline ZBMI (R2=0.18) (Figure S11).
3.4. Simulate Cashman’s 24.4µg Daily Dose
We simulated the proposed 24.4µg daily dose in European children of 6 and 11 years of age (Figure 6). Baseline 25(OH)D were sampled according to a reported European study [20]. Weight was based on WHO reports [21]. At 100% compliance, over 97.5% of the 6-year-old children were predicted to reach the 50 nmol/L threshold within 21 weeks (Figure 6A). For the 11-year-old children, 97.5% were predicted to reach the same threshold around 39 weeks (Figure 6B). This is intuitive, as older children are heavier. Their larger volume of distribution reduces the increase in serum 25(OH)D. In short, model simulation results were consistent with the expectation that 24.4µg daily vitamin D supplementation would be sufficient to reach the 50 nmol/L threshold among children aged 6-11 years.
3.5. Comparing Trials in Cape Town and Ulaanbaatar
Finally, we compared the Cape Town trial with the sister Mongolian trial (Figure S12). The mean baseline weight was similar for both studies (Figure S12C and Figure S12H), but baseline serum 25(OH)D was higher among the Cape Town children (mean = 64 nmol/L) than Mongolian children (mean = 38 nmol/L). Despite the lower compliance (Figures S12D and S12I) and the lower weekly dose (250µg Cape Town v 350µg Mongolia) for the Cape Town trial, serum 25(OH)D increase was higher among Cape Town children on average (mean = 32 nmol/L, Figure S12G) than Mongolian children (mean = 25 nmol/L, Figure S12B). In fact, many Mongolian children reported a 3-year serum 25(OH) that is lower than baseline (Figure S12B). In addition, the 3-year changes in serum 25(OH)D were not positively correlated with compliance (Figures S12E and S12J). Consistent with these findings, model simulations highlighted the difference between the two trials (Figure S13). The model overestimated the increase in the serum 25(OH)D at the final time point for Mongolian children (Figure S13A). To test whether this might be attributed to a higher clearance rate among the Mongolian children alone, we increased by 4 folds, but the simulation results were not in perfect agreement with the Mongolian data (Figure S13B). This suggests other factors warrant considerations.
4. Discussion
Currently, there is no vitamin D PK model for healthy children. Here, we reported a PBPK model for serum 25(OH)D based on 3-year observations among 77 Cape Town children. The model gave reasonable predictions for another 463 children among the same trial, for up to 3 years, with the 95% CI covering 77.3% of the observed values.
The model is concerned with the long-term changes in serum 25(OH)D. We identified both weight and ZMBI as covariates to predict the volume of distribution. In addition, the range of the 2.5th to 97.5th predicted percentiles at 3 years was strongly inversely correlated with weight (Figure S11A). The range was also somewhat anti-correlated with ZBMI (Figure S11B), probably due to the fact that weight and ZBMI were associated. This is intuitive: the narrower range for a heavy child might be due to the lipophilic nature of vitamin D, which tends to accumulate in adipose tissue, thereby reducing variability in serum levels.
Our simulation of the European children who received 24.4µg daily vitamin D was consistent with the finding by Cashman that this dose would be sufficient to bring the serum 25(OH)D above the 50 nmol/L threshold in the majority of European children. Here are some additional considerations for model parameter and potential limitations.
4.1. 25(OH)D Disposition in Children
Previously, population PK modelling of children with chronic kidney disease reported the volume of distribution (V/F) for 25(OH)D was inferred to be 292 L (95% CI: [199,572] L) for a 24 kg child [12]. They used a 1-compartment model to link vitamin D3 dose directly to serum 25(OH)D, assuming each molecule of vitamin D3 produces one molecule of 25(OH)D. Our model assumes that every 3 molecules of vitamin D produce 1 molecule of 25(OH)D, which is more accurate. Had Wan et al made the same assumption, their V/F would have been 97 L for a 24 kg child, or 122 L for a 30 kg child. These values would agree with our parameter values given the reasoning below.
In our PBPK model, volume of distribution Vd = Σ(Vorgan × Kp). For a 30kg child with ZBMI=0, 28.61% of weight is expected to be fat mass (i.e. 8.58 kg) [19]. Assuming 0.6 L arterial blood, 1.80 L venous blood and a 0.77 L liver (with Kp=1) (Table S3 and S4), the lean mass should be 30 x (100%–28.61%)–1.80–0.77–0.6 = 18.25 kg. Hence, Vd = Σ(Vorgan × Kp)= 1.8 + 0.6 + 0.77 × 1 + 8.58 × 4 + 18.25 × 4.71 = 123 L for 25(OH)D. This is consistent with what was reported for children with chronic kidney disease. We speculate the high Kp for 25(OH)D in lean mass (Kp25lm = 4) may indicate 25(OH)D efficiently binds with vitamin D receptors in children to meet the demand of rapid growth. This leads to the high Vd in children. In contrast, we previously reported the volume of distribution for vitamin D was between 10.0-16.6 L for a 70 kg man from a non-compartmental analysis [14]. In that model, the volume of distribution for the rest of the body (including all non-eliminating organs) Vrb = 62.2 L. Because Vd = Σ(Vorgan × Kp), we reasoned the partition coefficient for vitamin D Kprb must be lower than 1 [14]. Since 25(OH)D has similar physicochemical properties with vitamin D, Kp25rb<1 for adults was also expected.
4.2. Maximum Serum 25(OH)D Clearance Rate Constant
Here, we reported the maximum 25(OH)D clearance rate constant CLmax for a 30 kg child is 0.0119 h-1 (95% CI: [0.0102, 0.0139] h-1) (Table 1). For a 70 kg child, this extrapolates to 0.0225 h-1 (95% CI: [0.0193, 0.0262] h-1), and is smaller than a 70 kg adult we reported earlier (0.0463 h-1, 95% CI: [0.0359, 0.0597] h-1) [14]. This suggests there might be genuine differences in clearance between children and adults.
4.3. Limitation of the Data Used for Fitting and Testing
The data we fitted were sampled once a year for 3 years. The sampling was sparse, and we did not have observations for PK changes in shorter terms such as once every week. Hence, although the predictions made in years were reliable, the model does not necessarily capture short-term kinetics.
Secondly, the recorded dispensed doses were used to fit the model. Following long gaps in dosing (school holidays, COVID-19 lockdowns), serum 25(OH)D was predicted to diminish. Graphing the dosing information together with model predictions helped make sense of the fitting data (Figure S7). However, there were cases we could not explain, such as the lack of increase in the 1-year observations in children 41 and 92, and the 2-year observations in children 36 and 164 (Figure S7). These anomalous cases warrant further investigation.
Thirdly, the model does not consider seasonal variations. We fitted the serum 25(OH)D in the control group of the ViDiKids safety study (n=105) to a sinusoidal curve and inferred an amplitude of 11.5 nmol/L (Figure S14). Therefore, significant fluctuation is expected for Cape Town children within a year.
5. Conclusions
Here, we developed a population PBPK model to successfully fit the sparsely sampled 3-year time course of serum 25(OH)D concentrations in healthy Cape Town children started between 6-11 years. This model accurately predicted serum 25(OH)D for up to 3 years in 463 children from the same study who were not used to fit the model. Model simulation results agreed with Cashman’s finding that 24.4µg daily vitamin D is needed to achieve the 50 nmol/L sufficiency threshold in over 97.5% European children. The inferred volume of distribution was in agreement with another study on children with chronic kidney disease [12]. This model may be used to generate long-term forecasts in Cape Town children. However, Ulaanbaatar children exhibited significant differences in 25(OH)D dose-PK relationship which warrants further investigation.
Supplementary Materials
The following supporting information can be downloaded at the website of this paper posted on Preprints.org. Figure S1. Model diagram for models 1-8 and 11. Figure S2. Model diagram for models 9 and 10. Figure S3. Serum 25(OH)D concentrations after repeated weekly dosing of 250 µg vitamin D3. Figure S4. Baseline serum 25(OH)D levels vs. BMI-for-age Z-score for 77 children in the treatment group. Figure S5. The scatter plot for pharmacokinetic parameters for the final model and various reported covariates. Figure S6. Objective function value v Kp25lm. The objective function is fitted at different Kp25lm values: 1, 2, 3, 4, 6, 8. Figure S7. The fitted 77 children. Figure S8. Simulation of serum 25(OH)D concentrations in 454 Cape Town children in the treatment group. Figure S9. The distribution of residual error at 3 years: observation – population prediction at the 50th percentile. Figure S10. The distribution of the range (i.e. 97.5th – 2.5th percentiles) at 1, 2, and 3 years. Figure S11. The scatter plots between the 2.5th – 97.5th percentiles range and baseline bodyweight and ZBMI. Figure S12. Comparison of the treated Mongolian children with treated Cape Town children used to fit the model. Figure S13. Simulation of serum 25(OH)D concentrations in Mongolian children receiving a weekly dose of 350 µg vitamin D3. Figure S14. Serum 25(OH)D in the control group of the ViDiKids safety study (n=105) changes with time. Table S1. Baseline characteristics of the study population. Table S2. Physiological parameters used for paediatric compartmental lumping. Table S3. Physiological parameters of the PBPK model for paediatrics after compartments are lumped together. Table S4. Drug-specific parameters for model development. Table S5. Model development for 25(OH)D paediatric pharmacokinetics. Table S6. 25(OH)D model fitting results.
Author Contributions
Designed the research: A.R.M., T.Y. Collected data: K.M., D.G., A.R.M., N.W. Checked data and data visualisation: N.M., T.Y. Performed modelling: N.M., T.Y. Drafted the paper: N.M., T.Y., A.R.M. Finalised the paper: All authors.
Funding
N.M. was supported by the Royal Golden Jubilee Ph.D. Programme in Thailand (grant number PHD/0095/2561).
Institutional Review Board Statement
The ViDiKids Cape Town trial was sponsored by Queen Mary University of London, approved by the University of Cape Town Faculty of Health Sciences Human Research Ethics Committee (Ref: 796/2015) and the London School of Hygiene and Tropical Medicine Observational/Interventions Research Ethics Committee (Ref: 7450-2) and registered on the South African National Clinical Trials Register (DOH-27-0916-5527) and ClinicalTrials.gov (ref NCT02880982). For the ViDiKids Mongolian trial, the study was approved by Institutional Review Boards at the Mongolian Ministry of Health, the Mongolian National University and the Harvard T. H. Chan School of Public Health, USA (IRB reference number 14-0513), and registered with ClinicalTrials.gov (NCT02276755).
Informed Consent Statement
For the ViDiKids Cape Town trial, parents or legal guardians were invited to provide written informed consent for their child to participate in the trial during a home visit. For the ViDiKids Mongolian trial, parents have given informed consent for the eligible boys and girls who assent to participate in the study. .
Data Availability Statement
Anonymized data from the ViDiKids Cape Town Trial may be requested from Prof Adrian Martineau to be shared subject to terms of research ethics committee approval. Data requests for the ViDiKids Mongolian Trial should be sent to Dr Davaasambuu Ganmaa (gdavaasa@hsph.harvard.edu) and/or Prof Adrian Martineau (a.martineau@qmul.ac.uk) subject to terms of research ethics committee approval.
Acknowledgments
N.M. and T.Y. would like to thank N.Y.’s then PhD supervisor Prof Kesara Na-Bangchang at Thammasat University for the support. N.M. and T.Y. would like to thank Dr Andrew Collins and members of the Computational Biology Facilities at the University of Liverpool for providing the high-performance cluster, and Dr Henry Pertinez also at the University of Liverpool for the discussion on the modelling work.
Conflicts of Interest
The authors declare no conflicts of interest.
Abbreviations
The following abbreviations are used in this manuscript:
| η | Between individual variation |
| 25(OH)D | 25-hydroxyvitamin D |
| 25(OH)D2 | 25-hydroxyvitamin D2 |
| 25(OH)D3 | 25-hydroxyvitamin D3 |
| AIC | Akaike information criterion |
| BIC | Bayesian information criterion |
| BMI | Body mass index |
| CI | Confident interval |
| CL | Clearance |
| CWRES | Conditional weighted residuals |
| DAE | Differential-algebraic equations |
| IOM | Institute of Medicine |
| IU | International unit |
| Kp | Partition coefficients |
| NLME | Nonlinear mixed-effects |
| NPDE | Normalised prediction distribution errors |
| ODE | Ordinary differential equations |
| PBPK | Physiologically-based pharmacokinetic |
| PK | Pharmacokinetic |
| SAEM | Stochastic approximation expectation-maximization |
| V | Volume of distribution |
| VPC | Visual predictive check |
| WT | Weight |
| ZBMI | BMI-for-age Z-score |
References
- Bouillon, R.; Marcocci, C.; Carmeliet, G.; Bikle, D.; White, J.H.; Dawson-Hughes, B.; Lips, P.; Munns, C.F.; Lazaretti-Castro, M.; Giustina, A.; et al. Skeletal and Extraskeletal Actions of Vitamin D: Current Evidence and Outstanding Questions. Endocr Rev 2019, 40, 1109–1151. [Google Scholar] [CrossRef]
- Corsello, A.; Spolidoro, G.C.I.; Milani, G.P.; Agostoni, C. Vitamin D in pediatric age: Current evidence, recommendations, and misunderstandings. Front Med (Lausanne) 2023, 10, 1107855. [Google Scholar] [CrossRef]
- Forrest, K.Y.; Stuhldreher, W.L. Prevalence and correlates of vitamin D deficiency in US adults. Nutr Res 2011, 31, 48–54. [Google Scholar] [CrossRef]
- Cui, A.; Zhang, T.; Xiao, P.; Fan, Z.; Wang, H.; Zhuang, Y. Global and regional prevalence of vitamin D deficiency in population-based studies from 2000 to 2022: A pooled analysis of 7.9 million participants. Front Nutr 2023, 10, 1070808. [Google Scholar] [CrossRef]
- Alawadhi, F.; Yavuz, L. Signs and Symptoms of Vitamin D Deficiency in Children: A Cross-Sectional Study in a Tertiary Pediatric Hospital in the United Arab Emirates. Cureus 2021, 13, e18998. [Google Scholar] [CrossRef]
- Chlebna-Sokół, D.; Konstantynowicz, J.; Abramowicz, P.; Kulik-Rechberger, B.; Niedziela, M.; Obuchowicz, A.; Ziora, K.; Karalus-Gach, J.; Golec, J.; Michałus, I.; et al. Evidence of a significant vitamin D deficiency among 9-13-year-old Polish children: results of a multicentre study. Eur J Nutr 2019, 58, 2029–2036. [Google Scholar] [CrossRef]
- Arshad, S.; Zaidi, S.J.A. Vitamin D levels among children, adolescents, adults, and elders in Pakistani population: a cross-sectional study. BMC Public Health 2022, 22, 2040. [Google Scholar] [CrossRef]
- Cashman, K.D. Vitamin D Deficiency: Defining, Prevalence, Causes, and Strategies of Addressing. Calcif Tissue Int 2020, 106, 14–29. [Google Scholar] [CrossRef]
- Cashman, K.D.; Kiely, M.E.; Andersen, R.; Grønborg, I.M.; Madsen, K.H.; Nissen, J.; Tetens, I.; Tripkovic, L.; Lanham-New, S.A.; Toxqui, L.; et al. Individual participant data (IPD)-level meta-analysis of randomised controlled trials with vitamin D-fortified foods to estimate Dietary Reference Values for vitamin D. Eur J Nutr 2021, 60, 939–959. [Google Scholar] [CrossRef]
- Barker, C.I.S.; Standing, J.F.; Kelly, L.E.; Hanly Faught, L.; Needham, A.C.; Rieder, M.J.; de Wildt, S.N.; Offringa, M. Pharmacokinetic studies in children: recommendations for practice and research. Arch Dis Child 2018, 103, 695–702. [Google Scholar] [CrossRef]
- Freriksen, J.J.M.; van der Heijden, J.E.M.; de Hoop-Sommen, M.A.; Greupink, R.; de Wildt, S.N. Physiologically Based Pharmacokinetic (PBPK) Model-Informed Dosing Guidelines for Pediatric Clinical Care: A Pragmatic Approach for a Special Population. Paediatr Drugs 2023, 25, 5–11. [Google Scholar] [CrossRef]
- Wan, M.; Green, B.; Iyengar, A.A.; Kamath, N.; Reddy, H.V.; Sharma, J.; Singhal, J.; Uthup, S.; Ekambaram, S.; Selvam, S.; et al. Population pharmacokinetics and dose optimisation of colecalciferol in paediatric patients with chronic kidney disease. Br J Clin Pharmacol 2022, 88, 1223–1234. [Google Scholar] [CrossRef]
- Huang, Z.; You, T. Personalise vitamin D(3) using physiologically based pharmacokinetic modelling. CPT Pharmacometrics Syst Pharmacol 2021, 10, 723–734. [Google Scholar] [CrossRef]
- You, T.; Muhamad, N.; Jenner, J.; Huang, Z. The pharmacokinetic differences between 10- and 15-μg daily vitamin D doses. Br J Clin Pharmacol 2024, 90, 2611–2620. [Google Scholar] [CrossRef]
- Middelkoop, K.; Stewart, J.; Walker, N.; Delport, C.; Jolliffe, D.A.; Coussens, A.K.; Nuttall, J.; Tang, J.C.Y.; Fraser, W.D.; Griffiths, C.J.; et al. Vitamin D supplementation to prevent tuberculosis infection in South African schoolchildren: multicenter phase 3 double-blind randomized placebo-controlled trial (ViDiKids). Int J Infect Dis 2023, 134, 63–70. [Google Scholar] [CrossRef]
- Ganmaa, D.; Uyanga, B.; Zhou, X.; Gantsetseg, G.; Delgerekh, B.; Enkhmaa, D.; Khulan, D.; Ariunzaya, S.; Sumiya, E.; Bolortuya, B.; et al. Vitamin D Supplements for Prevention of Tuberculosis Infection and Disease. N Engl J Med 2020, 383, 359–368. [Google Scholar] [CrossRef]
- Middelkoop, K.; Walker, N.; Stewart, J.; Delport, C.; Jolliffe, D.A.; Nuttall, J.; Coussens, A.K.; Naude, C.E.; Tang, J.C.Y.; Fraser, W.D.; et al. Prevalence and Determinants of Vitamin D Deficiency in 1825 Cape Town Primary Schoolchildren: A Cross-Sectional Study. Nutrients 2022, 14. [Google Scholar] [CrossRef]
- Edginton, A.N.; Schmitt, W.; Willmann, S. Development and evaluation of a generic physiologically based pharmacokinetic model for children. Clin Pharmacokinet 2006, 45, 1013–1034. [Google Scholar] [CrossRef]
- Monasor-Ortolá, D.; Quesada-Rico, J.A.; Nso-Roca, A.P.; Rizo-Baeza, M.; Cortés-Castell, E.; Martínez-Segura, A.; Sánchez-Ferrer, F. Degree of Accuracy of the BMI Z-Score to Determine Excess Fat Mass Using DXA in Children and Adolescents. Int J Environ Res Public Health 2021, 18. [Google Scholar] [CrossRef]
- Wolters, M.; Intemann, T.; Russo, P.; Moreno, L.A.; Molnár, D.; Veidebaum, T.; Tornaritis, M.; De Henauw, S.; Eiben, G.; Ahrens, W.; et al. 25-Hydroxyvitamin D reference percentiles and the role of their determinants among European children and adolescents. Eur J Clin Nutr 2022, 76, 564–573. [Google Scholar] [CrossRef]
- World Health Organisation. Weight-for-age. Availabe online: https://www.who.int/tools/ child-growth-standards/standards/weight-for-age. (accessed on 27 May 2025).
- World Health Organisation. Length/height-for age. Availabe online: https://www.who.int/ tools/child-growth-standards/standards/length-height-for-age. (accessed on 27 May 2025).
- Canadian Pediatric Endocrine Group. Calculator: WHO 2007 Z-scores. Availabe online: https://cpeg-gcep.shinyapps.io/who2007_cpeg/. (accessed on 14 June 2023).
- Wang, W.; Hallow, K.; James, D. A Tutorial on RxODE: Simulating Differential Equation Pharmacometric Models in R. CPT Pharmacometrics Syst Pharmacol 2016, 5, 3–10. [Google Scholar] [CrossRef]
- Wilkes, M.; Thornton, J.; Horlick, M.; Sopher, A.; Wang, J.; Widen, E.; Pierson, R.; Gallagher, D. Relationship of BMI z score to fat percent and fat mass in multiethnic prepubertal children. Pediatr Obes 2018, 14. [Google Scholar] [CrossRef]
Figure 1.
Flowchart of subject selection for model fitting and testing.
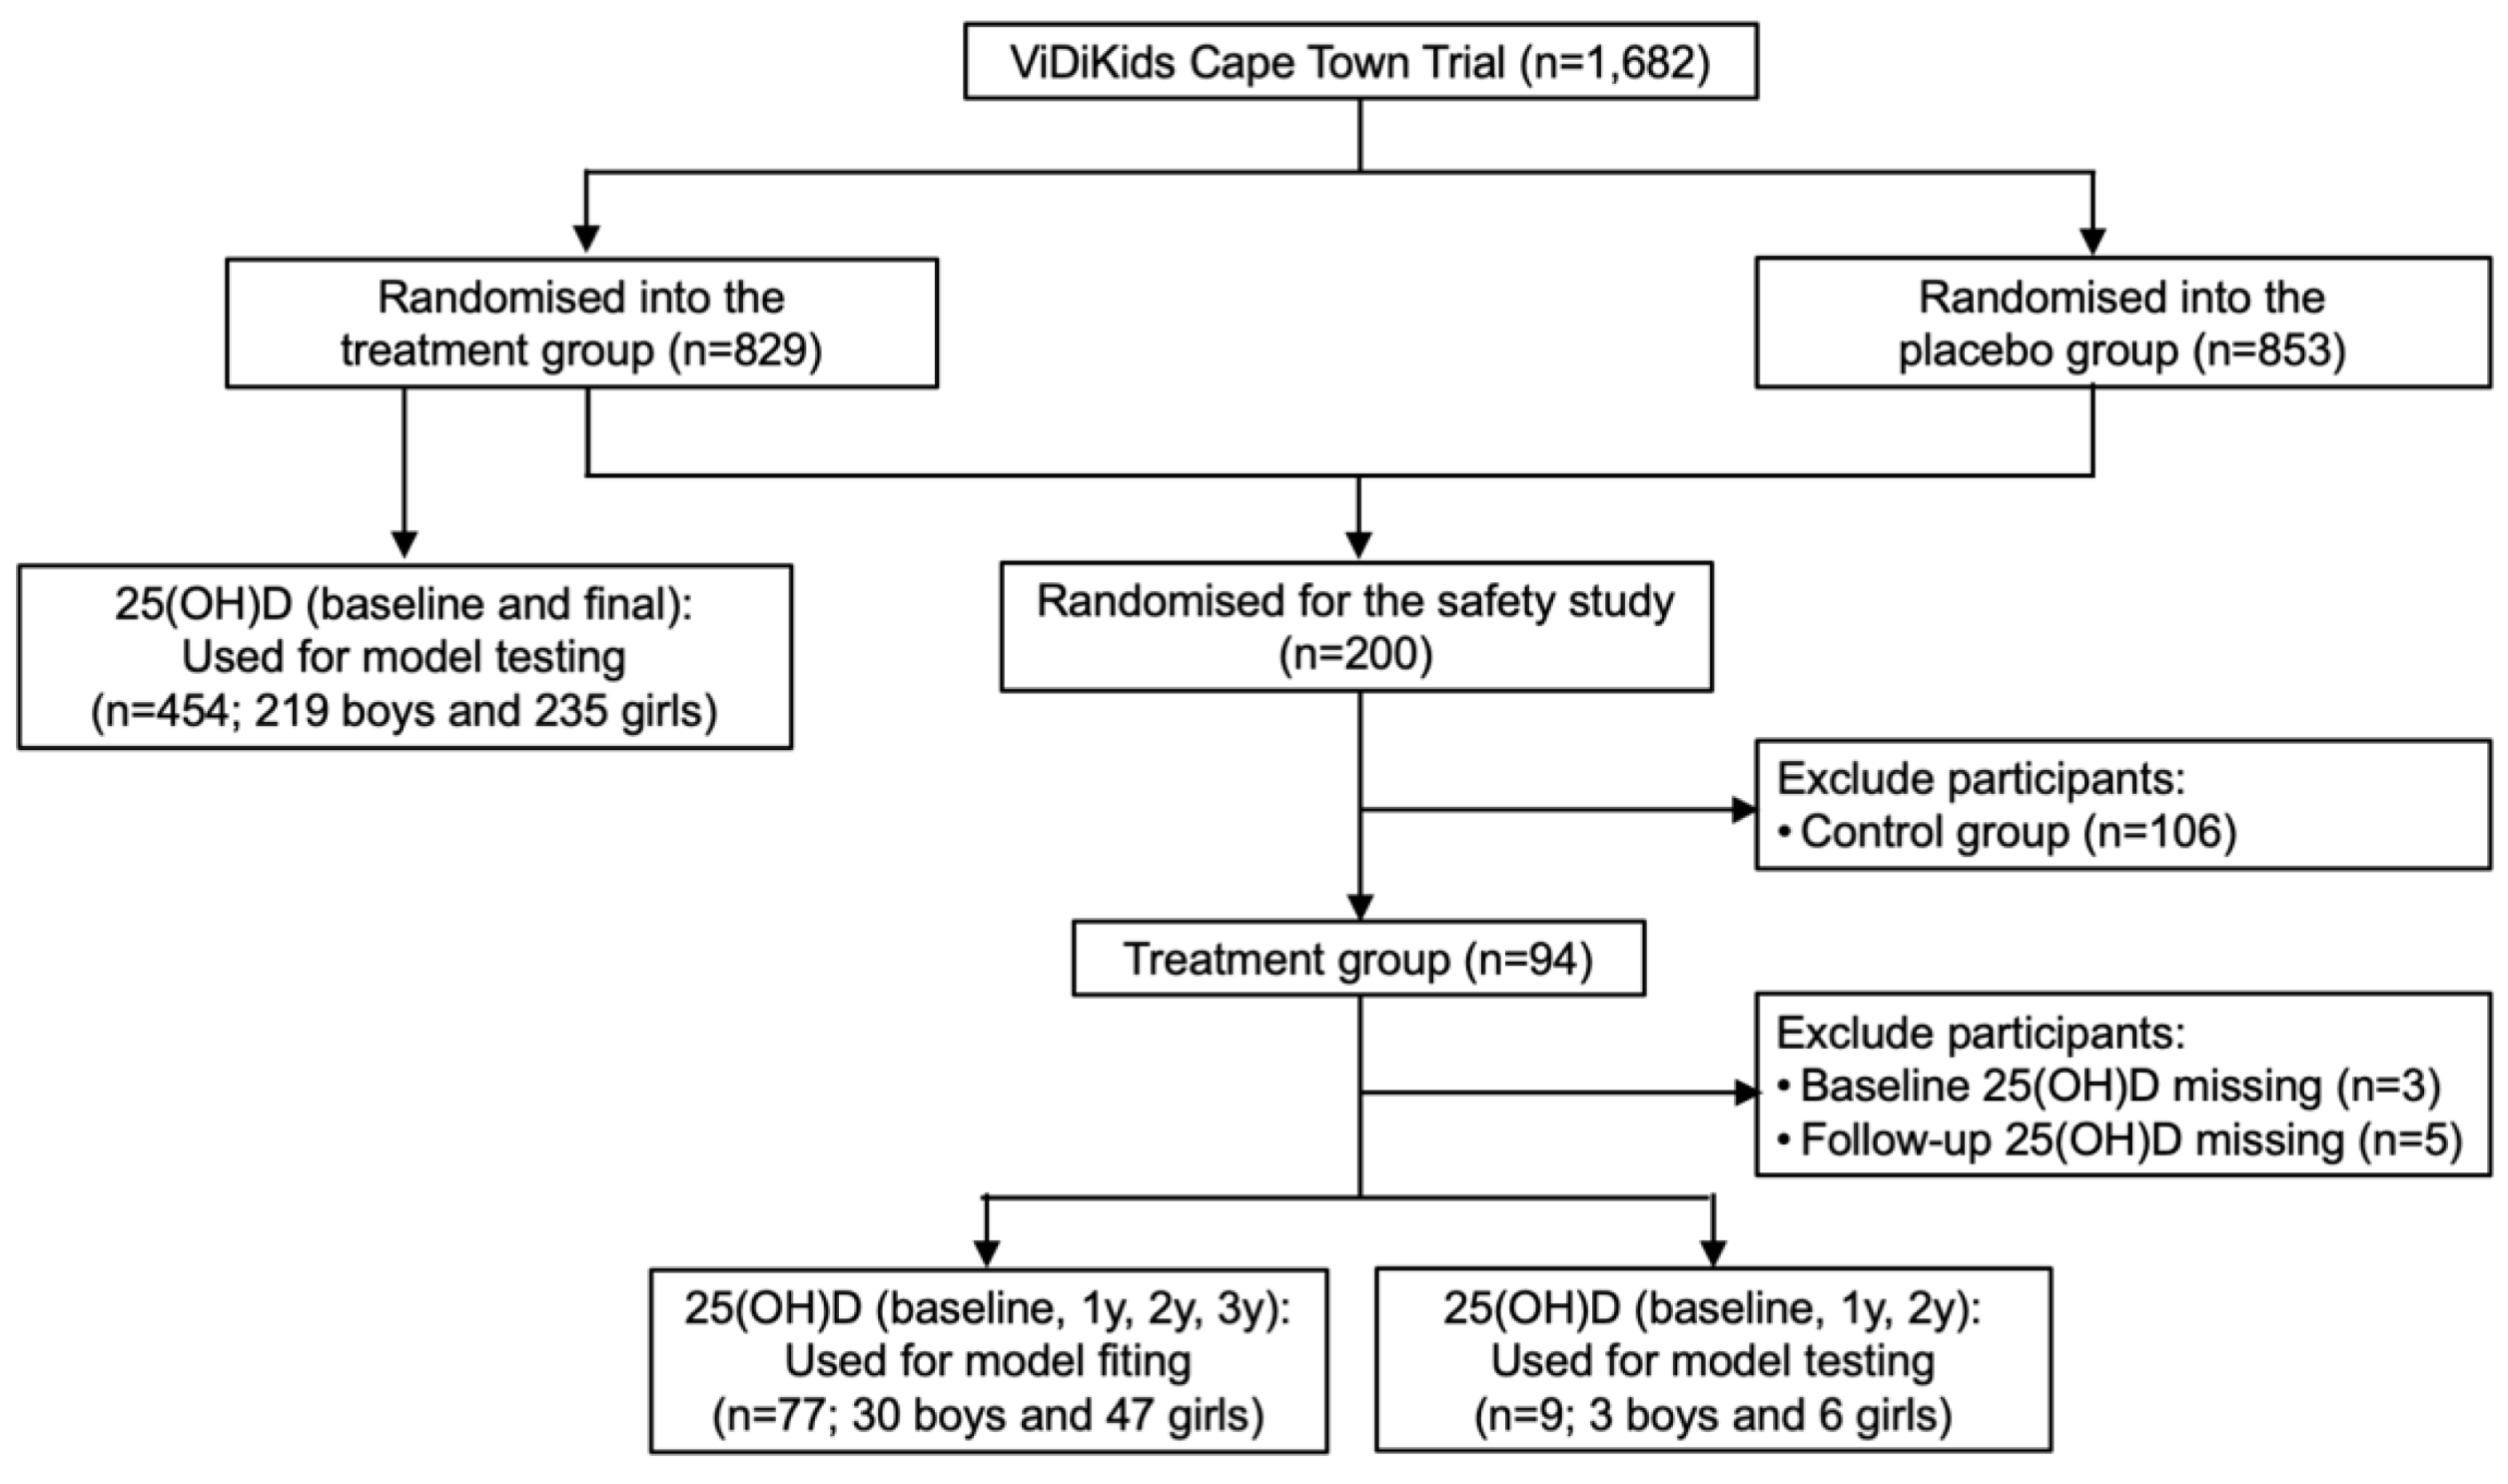
Figure 2.
Schematic diagram of the final model. Following the gastrointestinal (GI) tract, vitamin D is metabolised in the liver and circulates to the rest of the body through venous blood and arterial blood. Vitamin D from endogenous synthesis and food intake (ENDOG) was incorporated into the model to account for different baseline for each child. For 25(OH)D, non-eliminating organs were divided into lean mass and fat mass.
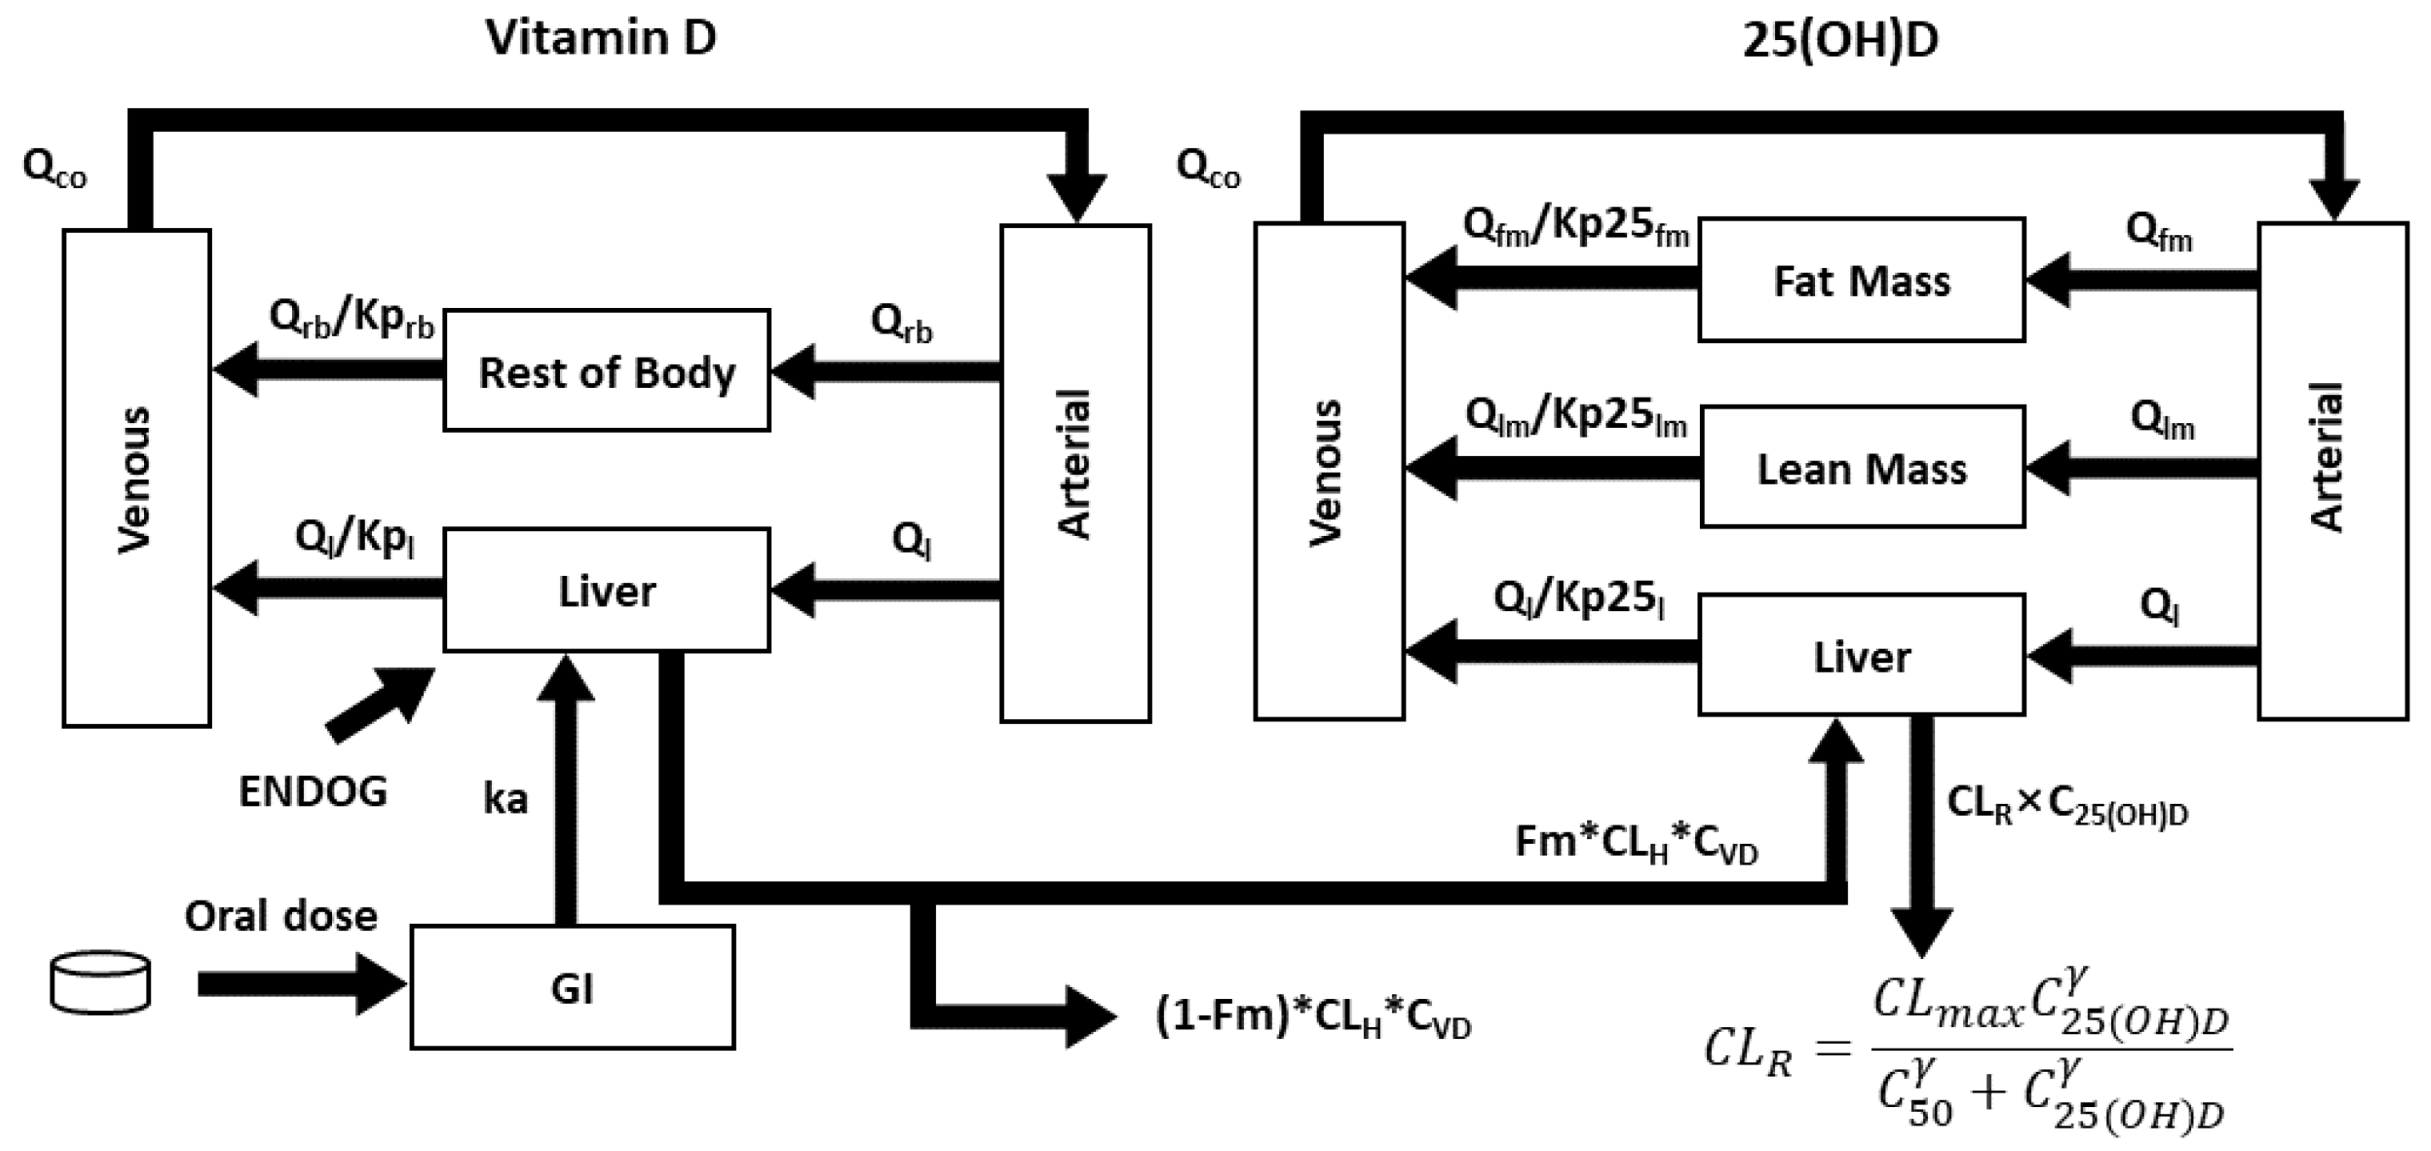
Figure 3.
Diagnostic plots for the final model. Goodness-of-fit for population (A) and individual predictions (B) against observed serum 25(OH)D concentrations. Conditional weighted residuals (CWRES) were plotted against population predictions (C) and time (D). Normalised prediction distribution errors (NPDE) were plotted against population predictions (E) and time (F).
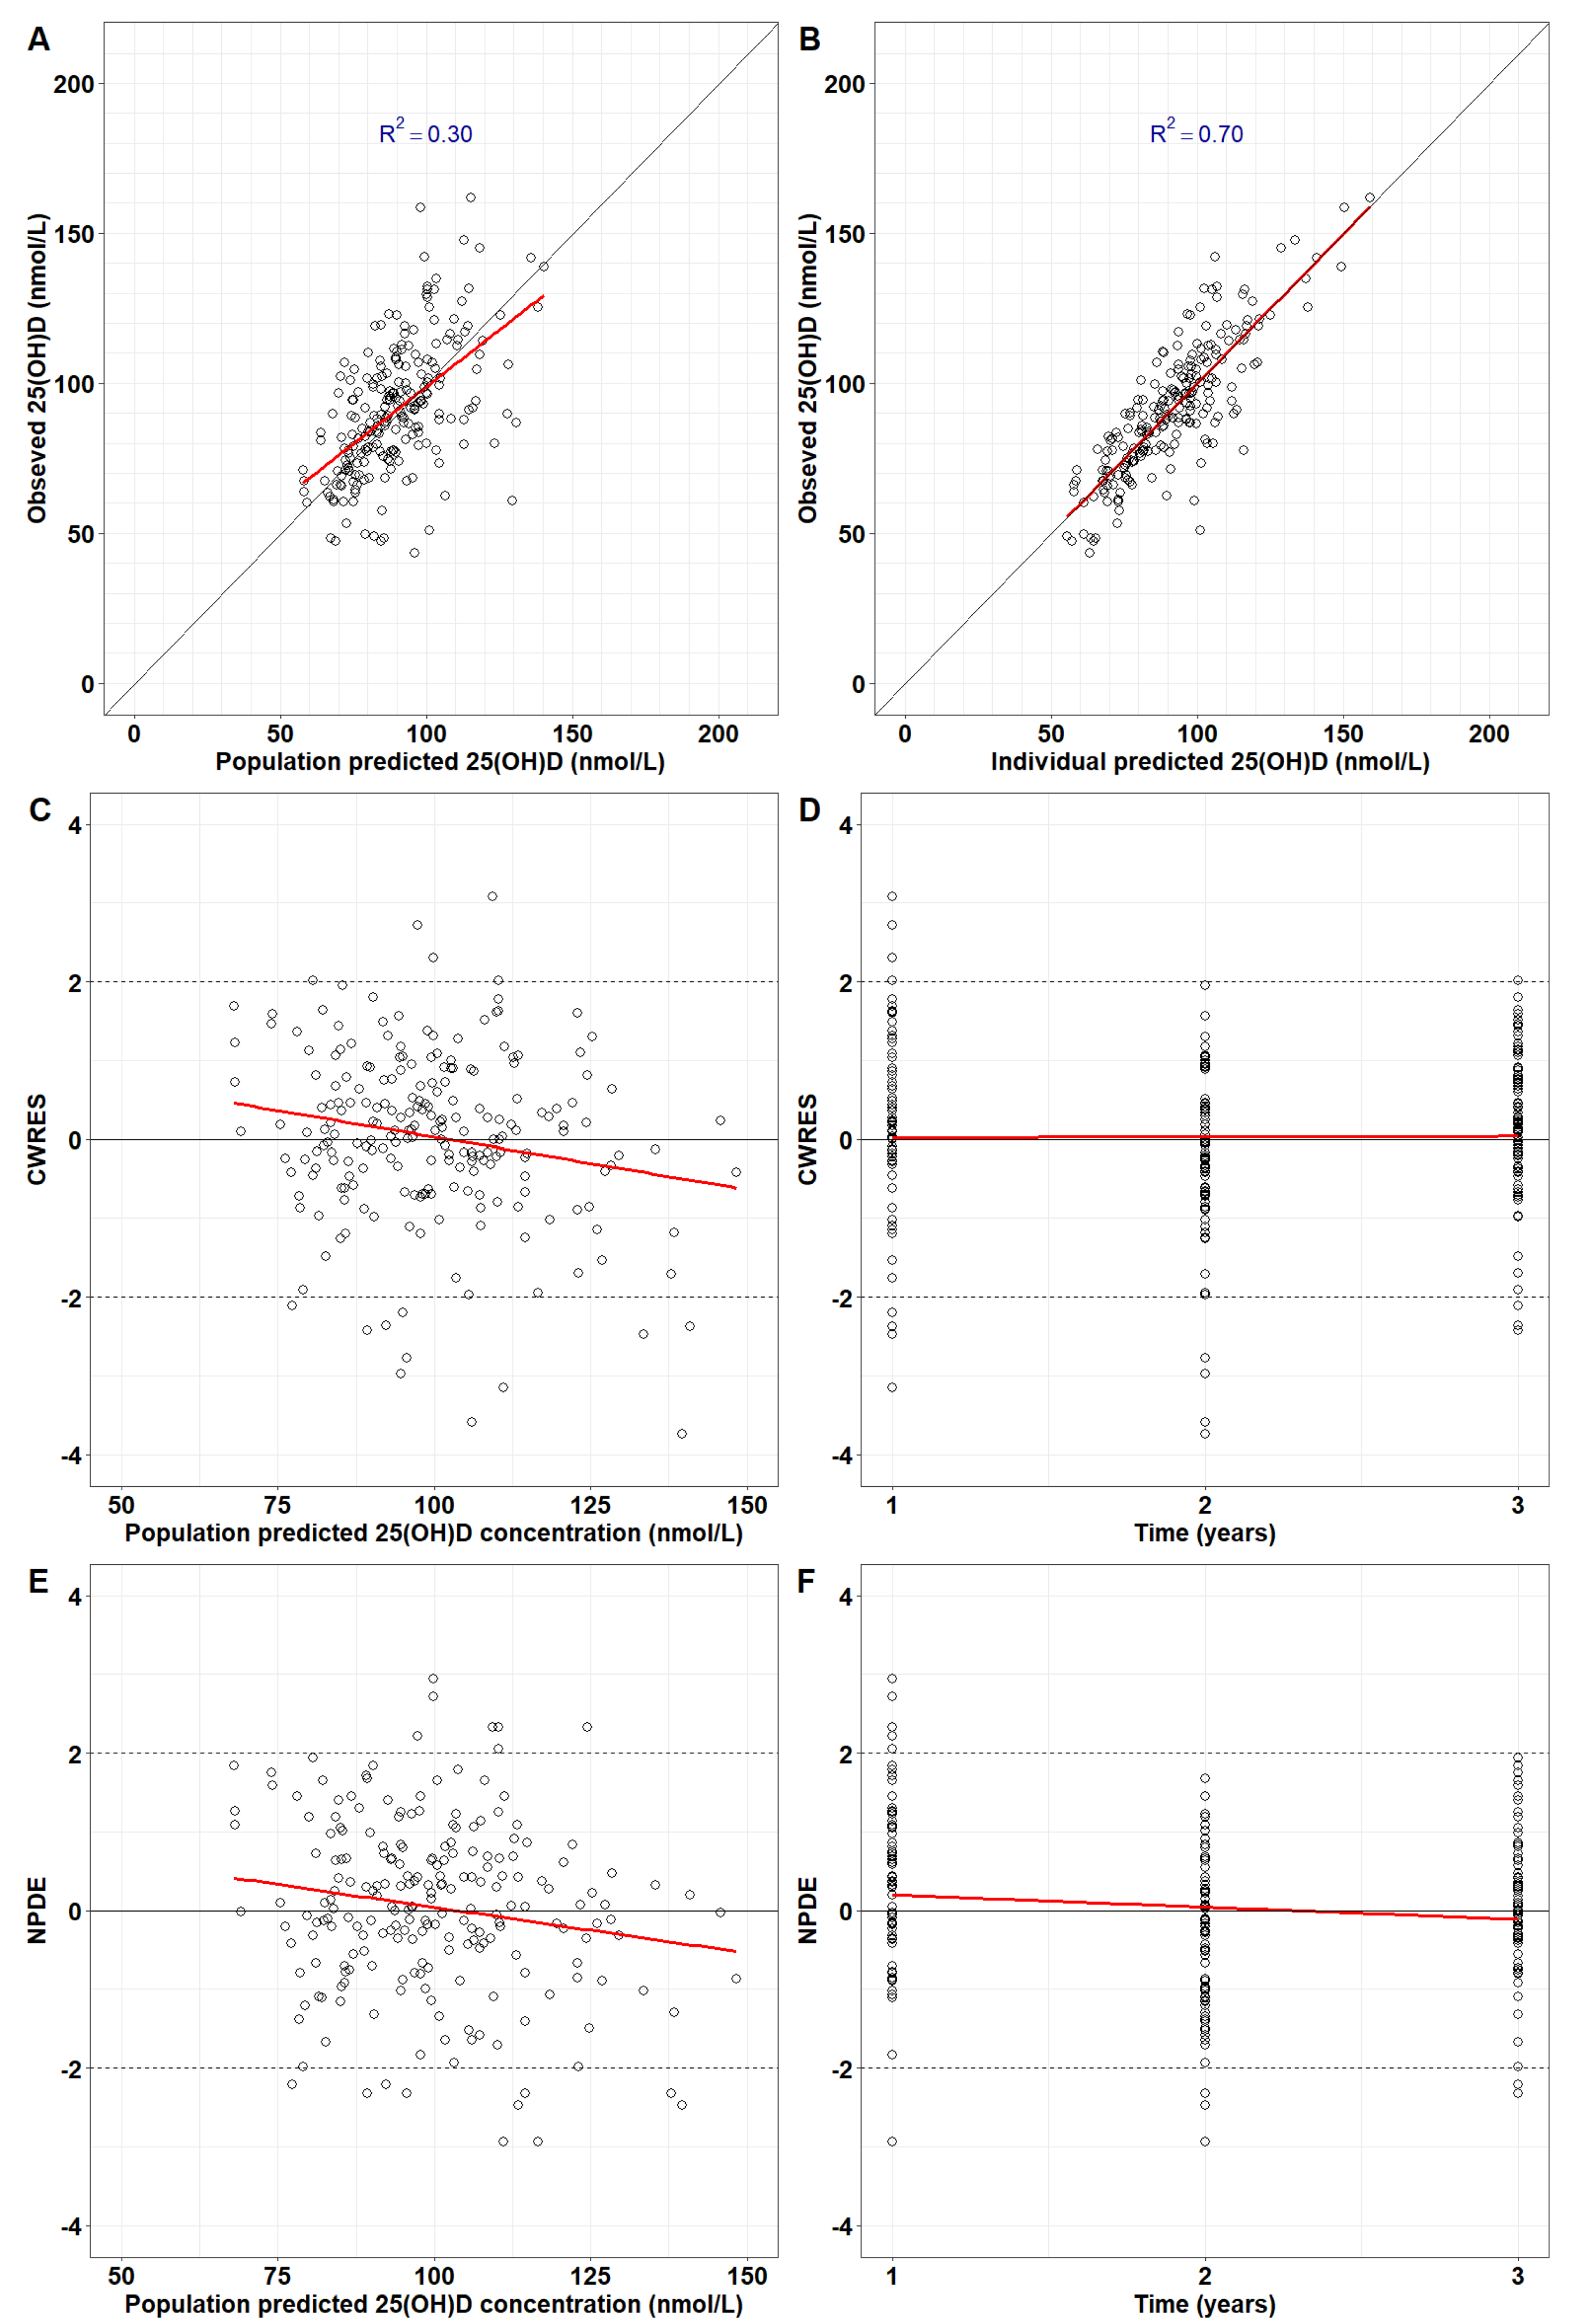
Figure 4.
VPC of the final model. Model is simulated 1,000 times. Blue dots: observations. Red dashed lines: observed 5th and 95th percentiles. Black dashed lines: simulated 5th and 95th percentiles. Grey shades around black dashed lines: 90% prediction intervals for the 5th and 95th simulated percentiles. Black solid line: median observations. Black dashed lines in bold: median predictions. Grey shades around median predictions: 90% prediction intervals for the median. Results are binned by each time point.
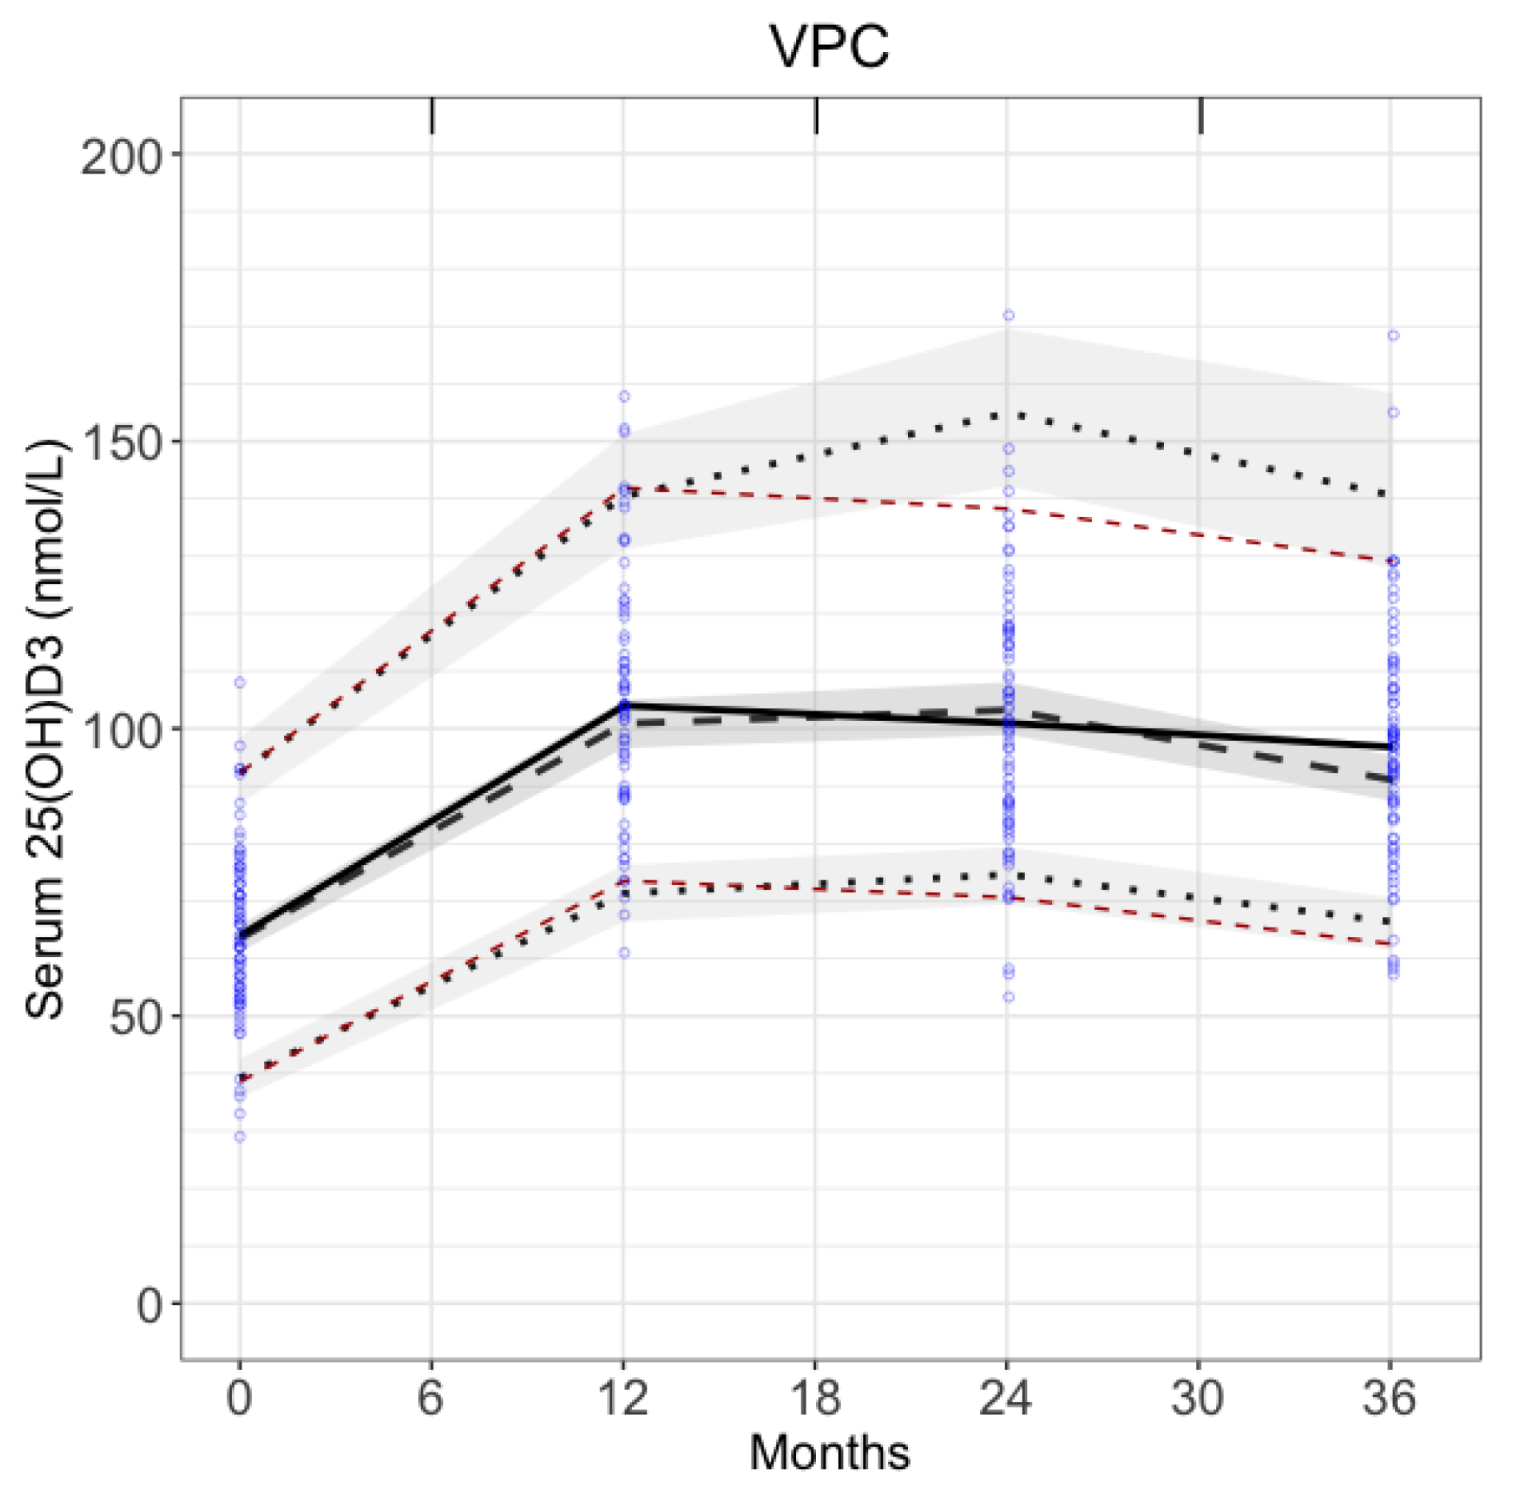
Figure 5.
Simulation of serum 25(OH)D concentrations in 9 Cape Town children not used for model fitting. Horizonal axis: time in weeks. Vertical axis: Serum 25(OH)D in nmol/L. Blue dots: observations. Solid lines: 10th, 50th and 90th percentiles. The 95% prediction intervals are too narrow to be seen. Vertical lines: dose in µg (salmon = 250; green = 500; cyan = 750; purple = 1000). Title: subject ID.
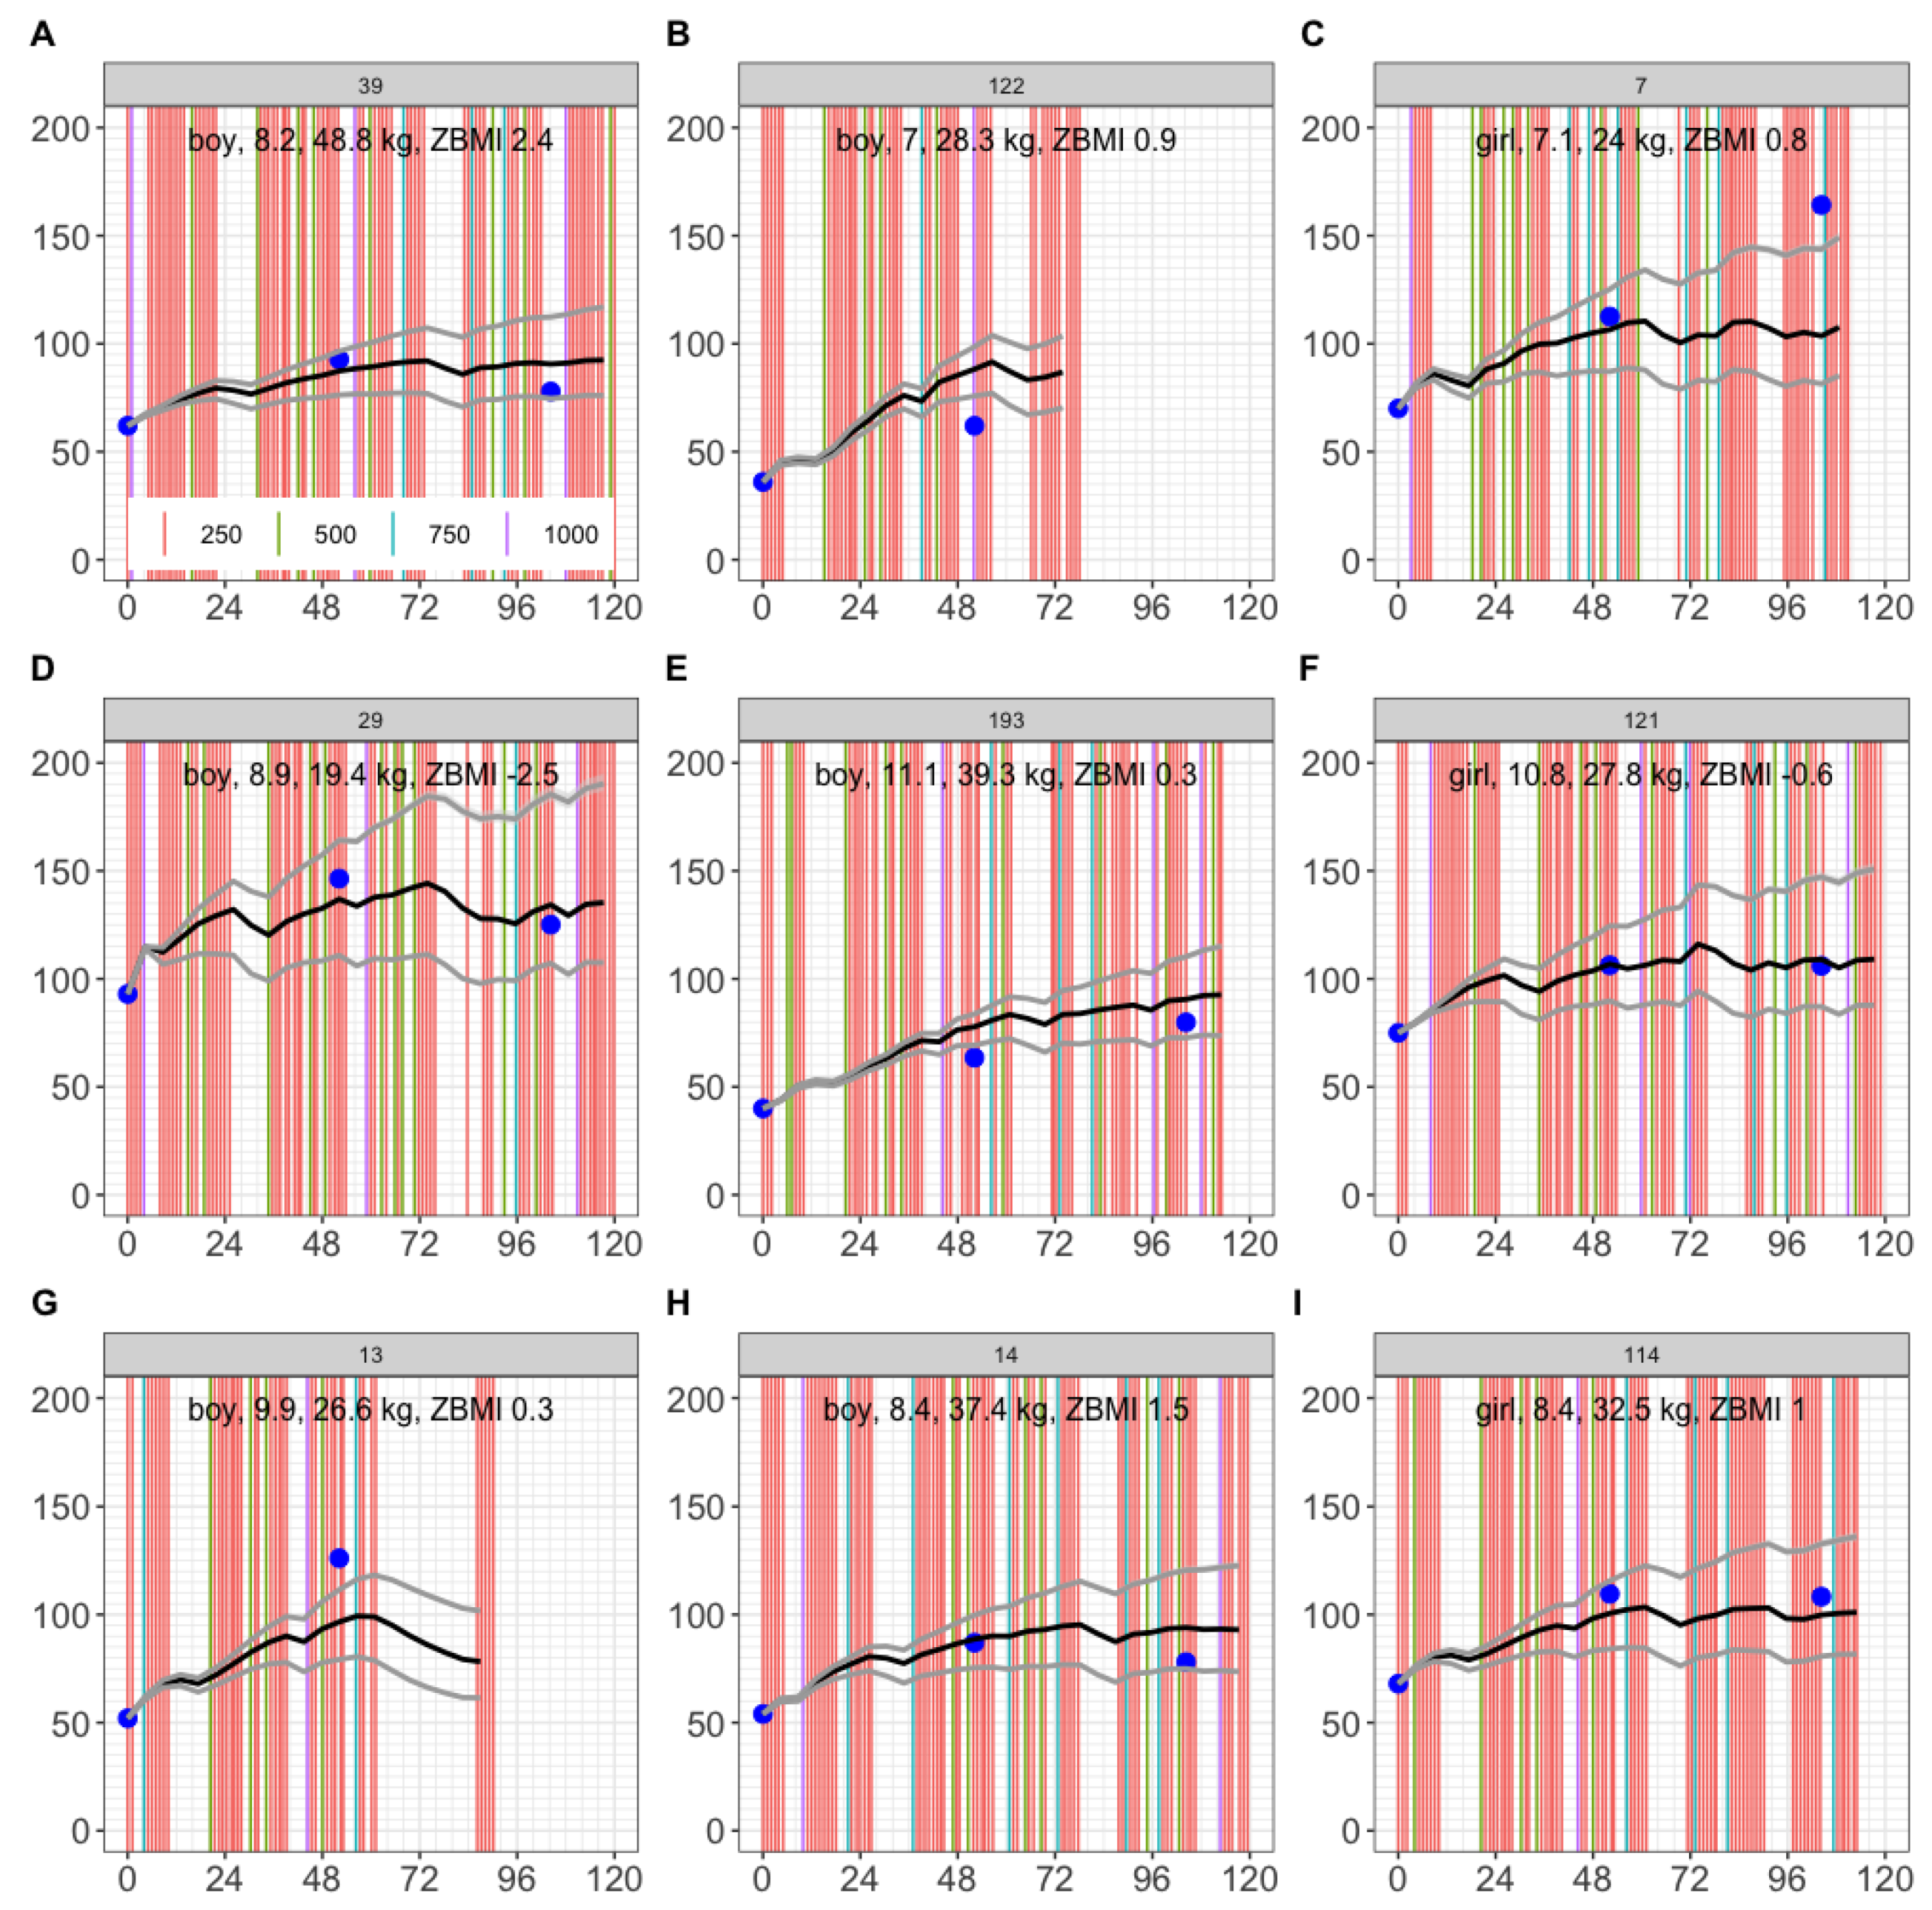
Figure 6.
Simulated serum 25(OH)D PK at 24.4µg vitamin D QD for one year. A) 6 years. B) 11 years. Lines: 2.5th, 50th and 97.5th percentiles. Shaded area: 95% prediction intervals. Severe deficiency: 25 nmol/L. Deficiency: 50 nmol/L. Potential toxicity: 125 nmol/L.
Figure 6.
Simulated serum 25(OH)D PK at 24.4µg vitamin D QD for one year. A) 6 years. B) 11 years. Lines: 2.5th, 50th and 97.5th percentiles. Shaded area: 95% prediction intervals. Severe deficiency: 25 nmol/L. Deficiency: 50 nmol/L. Potential toxicity: 125 nmol/L.
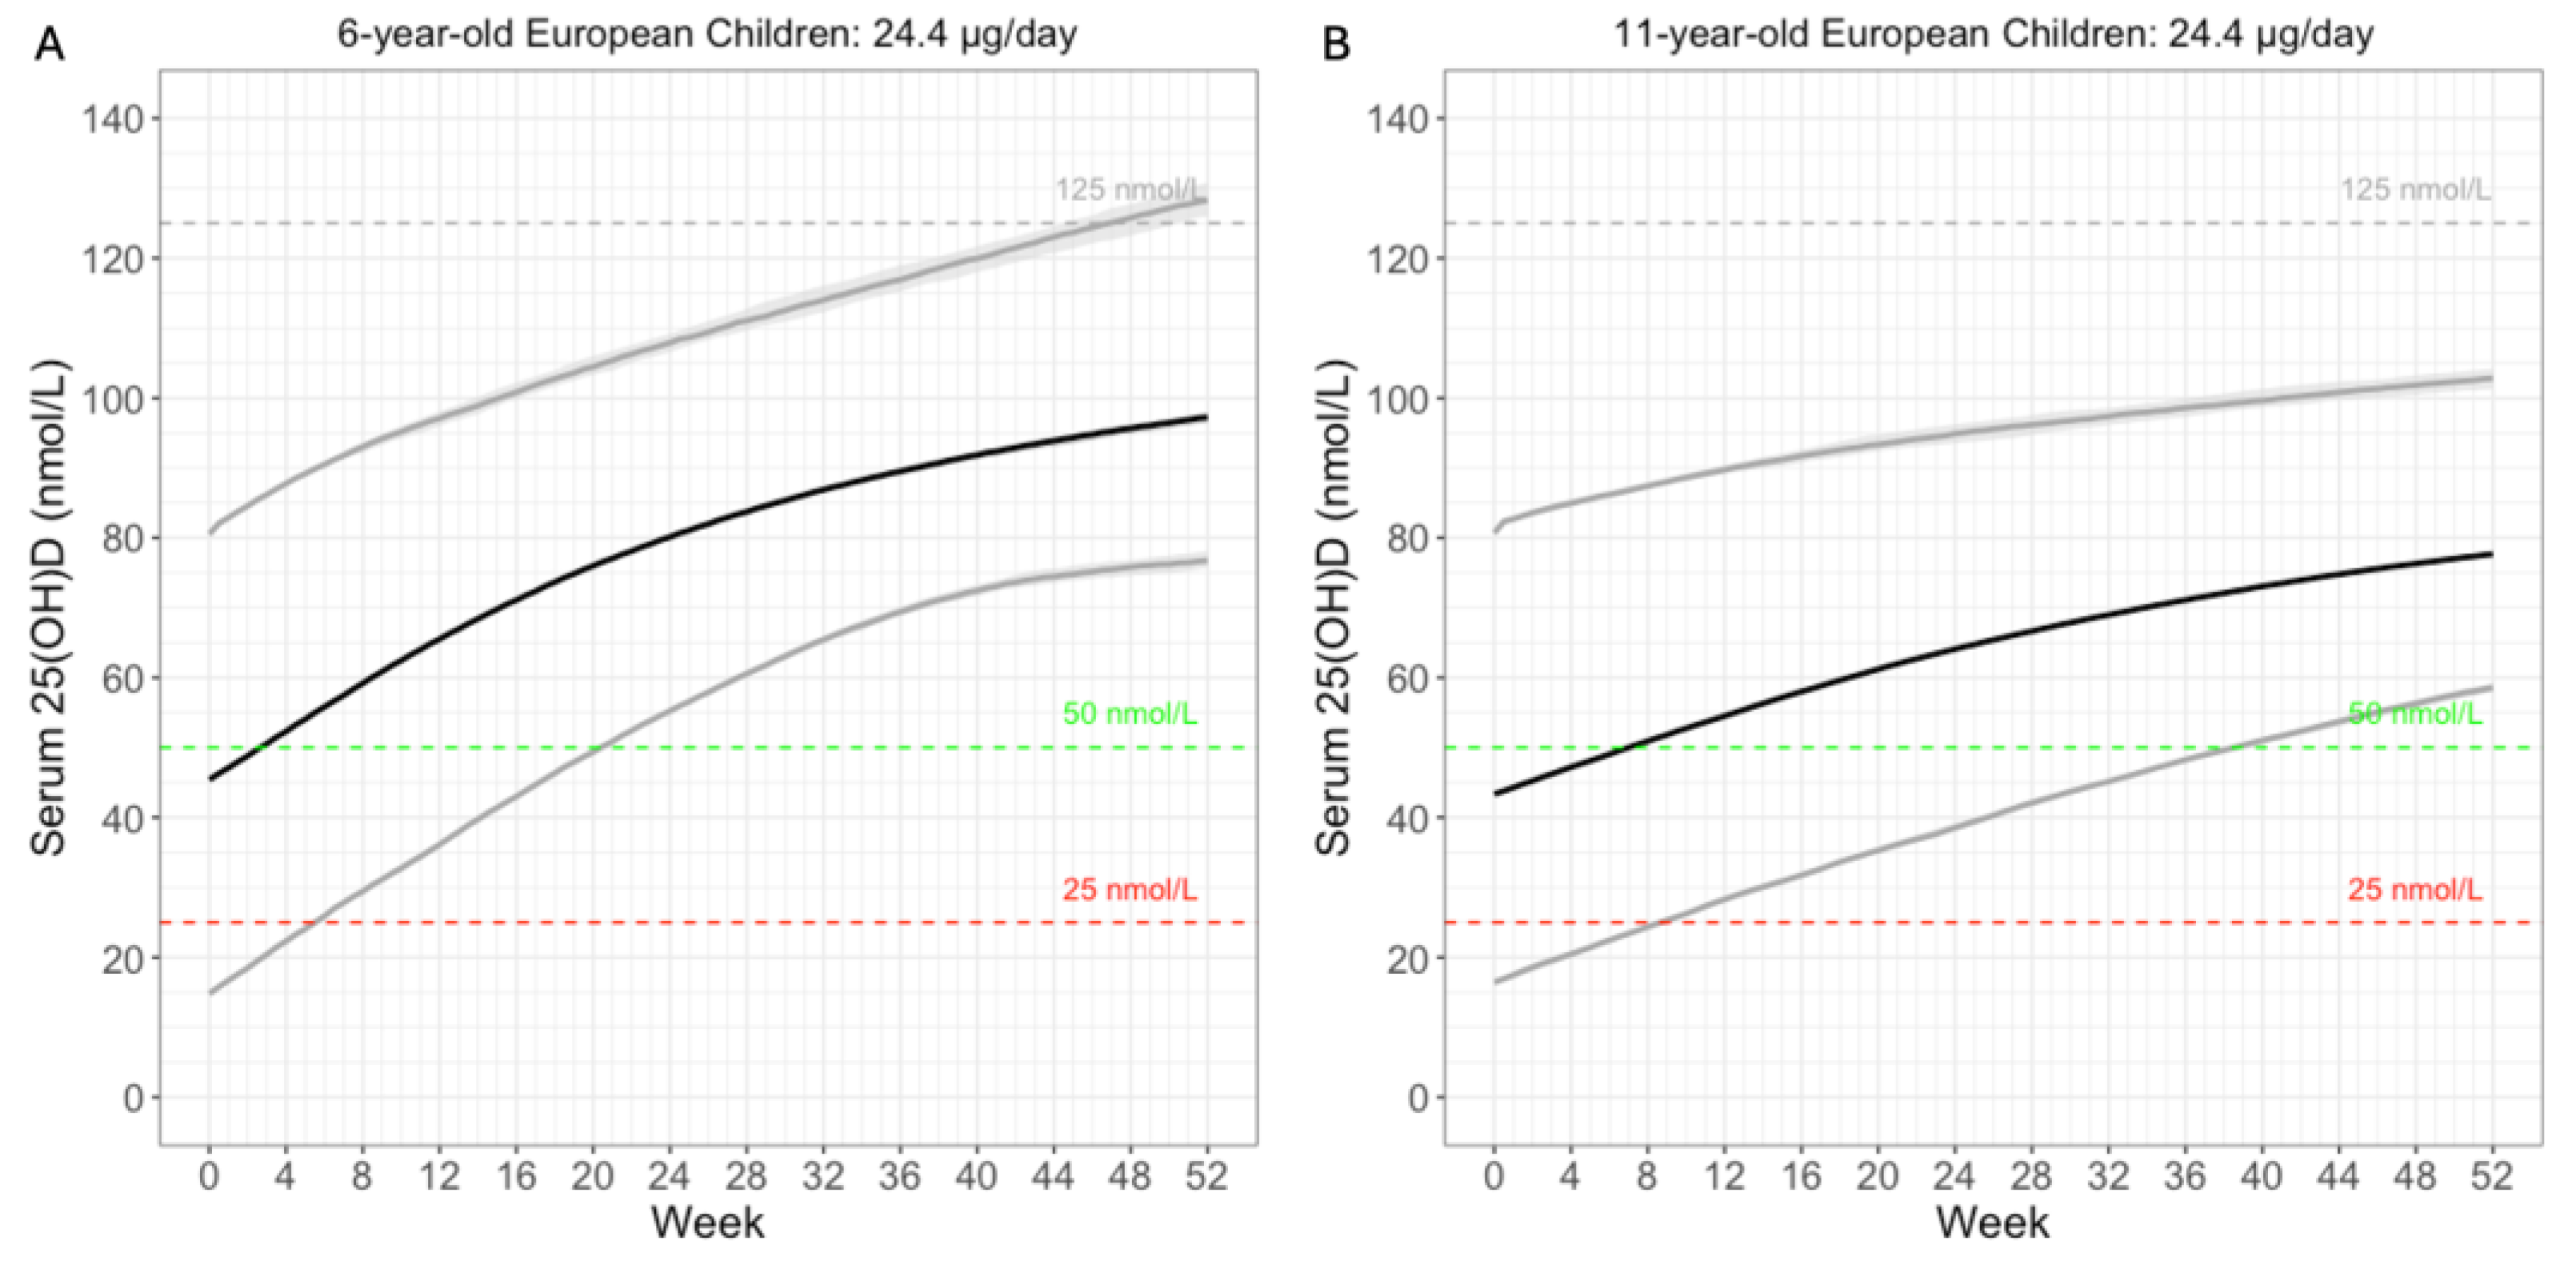

Table 1.
Fixed and random effects in all models.
| Model | Fixed Effects | Random Effects |
|---|---|---|
| 1-8 | , | , |
| 9 | , | |
| 10 | , , | |
| 11 | , |
Table 2.
Parameter estimates for the final model.
| Est. in Natural Log |
SE in Natural Log |
%RSE | Linear Scale (95% CI) | IIV %CV* | Shrink % | |
|---|---|---|---|---|---|---|
| CLmax (h-1) | -4.43 | 0.0787 | 1.78 | 0.0119 (0.0102, 0.0139) | 62.8 | 13.1% |
| Kp25fm | 1.54 | 0.136 | 8.8 | 4.66 (3.6, 6.11) | ||
| Additive error (nmol/L) | 0.00249 | 0.00249 | ||||
| Proportional error | 0.109 | 0.109 |
Disclaimer/Publisher’s Note: The statements, opinions and data contained in all publications are solely those of the individual author(s) and contributor(s) and not of MDPI and/or the editor(s). MDPI and/or the editor(s) disclaim responsibility for any injury to people or property resulting from any ideas, methods, instructions or products referred to in the content. |
© 2025 by the authors. Licensee MDPI, Basel, Switzerland. This article is an open access article distributed under the terms and conditions of the Creative Commons Attribution (CC BY) license (http://creativecommons.org/licenses/by/4.0/).
Copyright: This open access article is published under a Creative Commons CC BY 4.0 license, which permit the free download, distribution, and reuse, provided that the author and preprint are cited in any reuse.


