Submitted:
01 August 2025
Posted:
05 August 2025
You are already at the latest version
Abstract
While most efforts are aimed at preventing the surface roughening and colour change of wood due to weathering, some, mainly for decorative reasons, want wooden objects and elements to give the impression that they have been weathered for a long time. In this study, the simulated weathering of numerous softwoods as well as ring-porous and diffuse-porous woods by sandblasting and greying with iron sulphate was investigated. Calculations of the correlations between wood density, orientation, mass loss and thickness reduction by sandblasting, the difference between the hardness of late and early wood and the surface profile parameter Pt showed that the surface profiles correlates strongly with the mass loss, especially in the tangential orientation. Softwoods appeared to be the most promising for simulated profiling, especially spruce and larch with tangential surfaces. Among the ring-porous woods, oak and sweet chestnut also delivered good results.
Keywords:
softwood
; ring-porous wood
; diffuse-porous wood
; sandblasting
; artificial greying
; primary profile
; total height of the profile
1. Introduction
Wood in outdoor areas is exposed to the weather. Kropat et al. [1] defined weathering as a change in the appearance and surface properties of wood when it is exposed outdoors. The process of weathering and its consequences have been the subject of extensive research and numerous review and research articles dealing with the effects of weathering on wood. For example, the mechanisms of photodegradation were explained in the review paper by Chen and co-authors [2], changes in colour, surface profile and hardness are described in a review paper by Sahin et al. [3], which focused on the suitability of wood for landscape applications, and a review on improving the weathering resistance of wood can also be found in the literature [4], as well as studies on the weathering of tropical hardwood substrates [5]. Weathering of aged wood from historical wooden buildings has also been reported [6], wood weathering has been studied using a holistic approach [7], and last but not least, an analysis of chemical changes on the surface of a material similar to wood – moso bamboo - irradiated with UV light has also been carried out [8]. The main factors leading to weathering are: Solar radiation (ultraviolet and visible light), oxygen, water, heat, particulate matter, environmental pollutants, and microorganisms like bacteria and decay fungi [9]. The consequences of the weathering of wood were described in detail in the review by Kropat et al. [1], which cites numerous references on this subject. The most important changes concern the colour of the wood, the surface profile, the appearance of surface cracks and fissures, the change in mechanical properties and the increased wettability of the wood; some of these changes are the result of the effects of weathering on the chemical composition and structure of lignin, cellulose and hemicelluloses.
The most noticeable changes in wood surfaces due to weathering, especially sunlight, are those of the surface colours. According to numerous references cited in the review by Kropat et al. [1], the changes begin with an initial yellowing followed by a deeper brown colouration. A stable grey colour layer then develops, which can be 2 mm to 5 mm thick. This result is probably relatively independent of the original colour of the wood. After a longer period of time, a gradual darkening and blue discolouration occurs. The discolouration of the wood is the result of the degradation of lignin [2], which is particularly sensitive to radiation in the UVB range. Phenoxyl radicals and quinone compounds are formed, which are responsible for the colour change. Lignin depolymerises to form certain chromophoric groups such as o-quinone and p-quinones [6]. In the same review [2] it is also written that the degradation of certain extractives, especially polyphenolic compounds, under UV irradiation causes the formation of quinonoid and carbonyl groups, which leads to discolouration. However, the mostly uneven greying of weathered wood is not only due to the described formation of chromophore groups. The wood surfaces turn grey due to dust particles penetrating the porous structure of the wood and due to fungi and moulds [10,11]. Leached lignin fragments are also displaced to the top layer [8]. Photodegraded and leached wood surfaces consist mainly of cellulose [4,8,12], which is also the reason for the formation of the silver-grey colour.
Another phenomenon related to the weathering of wood is the increase in profiling of wood surfaces. The erosion rates of wood during natural weathering have been studied and reported some time ago [13]. Rain can leach the wood surface and wash out photo-degradation and hydrolysis products, leading to mass loss and erosion of the wood [7]. As erosion occurs faster in earlywood than in latewood, a wavy, corrugated surface pattern is created [9].
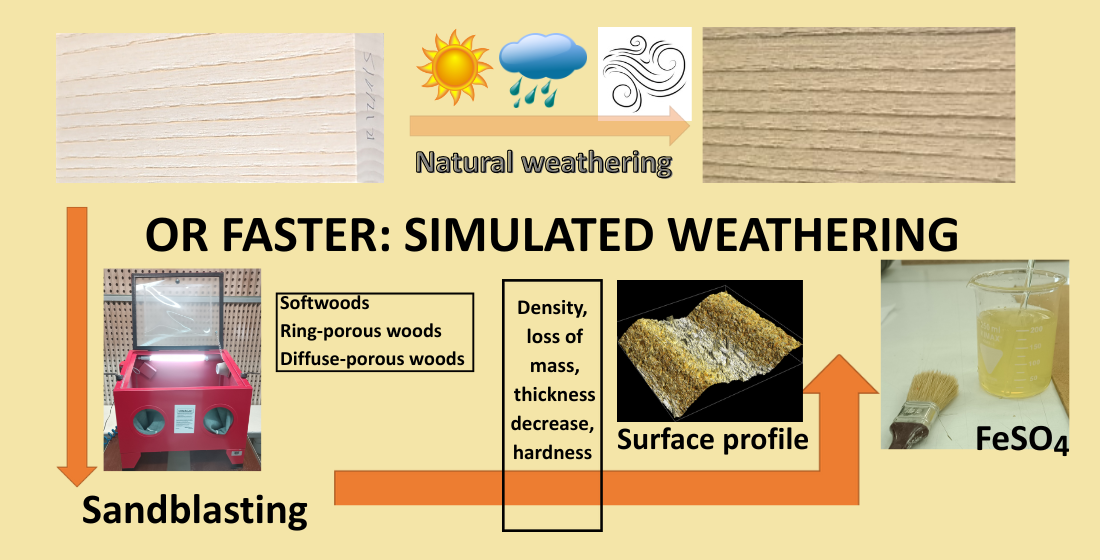
While most efforts are aimed at preventing the surface roughening and colour changes of wood due to weathering, e.g. by applying protective surface coatings, some, mainly for decorative reasons, want wooden objects and elements to give the impression that they have been weathered for a long time [1,9]. This can be achieved by simulated weathering, which aims to quickly transform the appearance of fresh wood into a weathered one [1]. According to Kropat et al. [1], simulated weathering can include the treatment of wood surfaces with ferrous compounds to achieve a grey surface colour, treatment with acids that cause discolouration, bleaching, treatment with selected stains, fuming with ammonia, alkali treatments, thermal treatments and various mechanical treatments, including sandblasting.
The focus of our investigation was on the preparation of profiled, corrugated look-like and grey wood. Sandblasting was expected to produce a pattern in which the more resistant parts of the wood, such as knots and dense areas such as latewood, protrude outwards in relation to the less resistant parts of the wood [1]. While sandblasting of uncoated wood is very rarely reported in the scientific literature [14], there is much more information on the greying of wood with iron compounds. Jankowska and Kwiatkowski [15], for example, carried out an artificial greying of European oak wood with an iron(II) sulphate solution. For the same purpose, surfaces of White oak were treated with iron(III) sulphate solutions [16]. The colouring effect of ferrous sulphate on nine different wood substrates was reported by Hundhausen et al. [17]. Rapid and uniform greying with an additional biocidal effect of solutions containing ferrous sulphate and an additional biocide has also been described [18]. The colour changes of artificially greyed wood were also investigated as a function of the weathering time [19].
The main objective of this research was to investigate sandblasting as part of the simulated weathering of wood and thus to elucidate this knowledge gap in the field of wood science and technology. With the aim of simulated profiling of wood surfaces, we sandblasted numerous softwoods as well as ring-porous and diffuse-porous hardwoods to assess the differences in efficiency of this mechanical treatment depending on the wood species. We were also interested in the erosion efficiency of sandblasting as a function of wood hardness. Finally, selected sandblasted wood samples were artificially greyed with an iron(II) sulphate solution to produce an aesthetically pleasing artificially aged wood.
2. Materials and Methods
2.1. Materials
The sandblasting experiments were carried out with numerous softwoods as well as with diffuse-porous and ring-porous wood species. The dry wood samples (at equilibrium moisture content (EMC) under laboratory conditions) had the following dimensions: 100 mm x 50 mm x 20 mm. In most cases, two orientations were prepared so that the largest area to be sandblasted was either the radial (labelled (R) in the list of wood species below) or the tangential (T). In most cases, both the radial and tangential surfaces were sandblasted, but in some cases only the radial or tangential surfaces were sandblasted. All wood samples were from Slovenia, and some are categorised as alien invasive species (A). Samples were taken from the following softwood species: Norway spruce Picea abies (L.) H. Karst. (R, T); Coast Douglas-fir Pseudotsuga menziesii (Mirb.) Franco (R); Scots pine Pinus sylvestris L. (R, T); European larch Larix decidua Mill. (R, T). Ring-porous hardwoods: European ash Fraxinus excelsior L. (R, T); Oak Quercus sp. (R, T), Sweet chestnut Castanea sativa Mill. (R, T); Elm Ulmus sp.(R, T); Honey locust Gleditsia triacanthos L. (R), A; Tree of heaven Ailanthus altissima (Mill.) Swingle (R), A; Black locust Robinia pseudoacacia L. (T), A. In addition to the aforementioned ring-porous wood species we have also prepared samples of the following diffuse-hardwood species we used in our research: Horse chestnut Aesculus hippocastanum L. (R); Maple Acer sp. (R, T); Linden Tilia sp. (R, T); Willow Salix sp. (R); Poplar Populus sp. (R); Boxelder maple Acer negundo L. (R, T), A.
We chose aluminium oxide - corundum as the abrasive for the sandblasting process. We used white aluminium oxide with a grain size of (425–500) μm mesh (product code: 201322172), supplied by “Tehnični sistemi d.o.o.” Bizeljsko, Slovenia. Iron(II) sulphate solutions (Carlo Erba, Dasit Group) were also used for the artificial greying of wood.
2.2. Sandblasting and Greying
The wood samples were processed individually in a sandblasting chamber. As the sandblasting was done by hand, particular attention was paid to maintaining uniform processing conditions. The nozzle was held at an approximate distance of 5 cm from the surface, with a travelling speed of about 2 cm/s and an angle of 45° to the sample surface. The working pressure was set to 6 bar. Each surface was treated with four passes (from all directions) to ensure uniform surface treatment over the entire area.
Iron(II) sulphate, also known as a green vitriol, is a water-soluble compound that is known to turn wood grey and give it an aged appearance. An approximately 5% solution was prepared by dissolving 10 g of green vitriol in 200 mL of distilled water. The samples were immersed in a beaker containing the solution, and in cases where the surface could not be properly wetted, a brush was also used. The objective of this part of our investigation was not to monitor or measure colour changes over time, but simply to obtain samples with a greyed or aged appearance.
2.3. Characterisation and Analyses
To determine the effectiveness of sandblasting, the samples were conditioned under laboratory conditions and characterised before and after sandblasting. For the same purpose, the thicknesses of the samples were measured before and after sandblasting using a digital calliper gauge. The thickness was measured three times on each sample: at both edges (10 mm from the edge) and in the centre. In this way, the average thickness was determined for each sample.
In order to determine a possible correlation between the hardness of early and late wood and the results of sandblasting, the indentation hardness HIT was measured on each sample and the indentation modulus was calculated separately for early and late wood. The measurements were carried out with the instrumented microindenter MCT3 (Anton Paar, Graz, Austria). In instrumented indentation measurements, the deflection of the indenter, the applied force and the resulting indentation depth are recorded simultaneously and in a controlled manner, which enables a precise evaluation of mechanical properties such as hardness and modulus. The hardness (HIT) is a measure of resistance to permanent deformation or damage and the indentation modulus (EIT) quantifies the elastic response of the material during indentation and represents the modulus of elasticity resulting from the initial slope of the load–displacement curve. On each sample with dimensions 10 mm x 10 mm x 20 mm (radial x tangential x longitudinal), 6 indentations were made on early wood and 6 indentations on late wood. The indentation tests were performed with a CR6 steel ball with a diameter of 6 mm. Some of the most important parameters of the microindentation measurements are: Acquisition rate 10 Hz; Linear load; Maximum load 5000.00 mN/min; Loading and unloading rates 5000.mN/min; Pause at maximum load before unloading 10.0 s.
The surfaces were analysed with an Olympus DSX1000 digital microscope. Each sample was placed under the objective of the OLYMPUS DSX10-SXLOB device (1x magnification) and the primary profile was measured perpendicular to the grain direction at two spots (approximately one third of the sample). Each measurement area consisted of four patches drawn in a straight line with 20% overlap. Exceptions were the samples of larch wood, sweet chestnut wood and honey locust wood, where the overlap was set at 30 %, and 50 % overlap for the robinia (black locust) samples, as the samples were narrower. The DSX software with the MIX (mixed light) light setting was used to observe and record the images.
The surfaces of some selected samples (Norway spruce wood, linden wood, and oak wood) were also analysed with the FEI QUANTA 250 scanning electron microscope (SEM) before and after sandblasting. For the SEM analysis, a thin layer of gold was sputtered onto the samples. The observations were made possible with the xTmicroscope control v6.2.11 software.
2.4. Statistical Analysis
These extensive investigations yielded numerous experimental data (Table 1 and Table 2), and we were interested in possible correlations between the success of profiling by sandblasting and some of the data obtained, such as mass loss or thickness reduction by sandblasting and surface profile parameter Pt, or difference between indentation hardness of late and early wood and Pt and the like. Therefore, we prepared the raw data for statistical analyses supported by artificial intelligence tools. Thus, some parts of the statistical analysis and interpretation were supported by Microsoft Copilot (GPT-4, July 2025 version), an AI-based assistant developed by OpenAI and integrated into Microsoft services [20]. This tool supported the preparation of the subsequent description of the statistical analysis and also produced a draft description of the results of the statistical analysis. This draft text was then corrected, supplemented and partially changed by the authors and can be found in Section 3.1.3, under Table 2. All statistical analyses were performed using Python 3.12 [21,22] and the libraries pandas [21,22,23], scipy, and sea-born. The primary goal was to identify relationships between selected wood properties using Pearson’s correlation coefficient (r), which measures the strength and direction of linear relationships between pairs of continuous variables. For each pair of variables, the Pearson correlation coefficient and the associated two-tailed p-value were calculated using the pearsonr() function from the scipy.stats module1. The threshold for statistical significance was set at α = 0.05. Degrees of freedom were calculated as N – 2, where N is the number of valid paired observations [24]. To assess the overall strength of interdependence between variables within each group (e.g. radial, tangential, conifers, ring-porous, diffuse-porous), the average absolute correlation (mean |r|) was computed by averaging the absolute values of all off-diagonal elements in the correlation matrix. All correlation matrices and p-values were also calculated separately for: radial and tangential surfaces, conifers, ring-porous and diffuse-porous hardwoods. Visualisations and summary tables were generated using matplotlib [25] and seaborn [23].
3. Results
3.1. Sandblasting Results
As described in the “Materials” section, our sandblasting experiments were carried out with numerous types of wood. We sandblasted the surfaces of 4 softwood species, 7 ring-porous hardwood species and 5 diffuse-porous species. Therefore, in this section we present only the most striking and meaningful results, either with a very good or excellent visual appearance of the sandblasted samples or, on the other hand, some selected results where sandblasting only led to a barely visible sandblasted surface profile.
3.1.1. Visual Appearance and Profiles of Sandblasted Surfaces
In the softwood samples, very nice visual results of sandblasting were obtained in the wood samples of Douglas fir and larch (Figure 1). The radial surfaces of the Douglas fir also all contained a coloured heartwood. The earlywood was sanded faster than the latewood in all samples, with the latter having a flat surface at the top of the profile. The wood samples were coarse and had an open, fibrous surface, especially in the early wood. The early wood was sanded so that the cross-section of the samples resembled a sawtooth pattern. Very similar results were achieved when sandblasting larch wood. Radial sandblasting reveals a very clear texture of the wood. When sandblasting tangentially orientated larch wood surfaces, a very pronounced texture of the wood was also achieved. Less rough, profiled surfaces were achieved when sandblasting Scots pine wood. Nevertheless, quite well profiled, corrugated surfaces were also achieved in this case. It should be noted that in all Scots pine wood samples, abrasive particles were embedded in the damaged wood, which were clearly visible to the naked eye. In fact, some abrasive grains were visible in almost all sandblasted samples, but only sometimes, as in the case of the Scots pine wood, the abrasive particles were more abundant.
In the group of ring-porous woods, the best sandblasting results were achieved with oak (Figure 2). The large pores of the early wood were eroded more intensively than the harder late wood. The obtained surface is rough and has deep channels in the sanded early wood. Numerous large sanding particles have settled in the area of the early wood. Smaller knots are visible in all samples that are less sanded (same height as the latewood). On the other hand, in this group, the elm wood samples were at the bottom of the list in terms of visually assessed sanding efficiency. All samples have a surface that resembles tissue distressing, but is the result of sandblasting the wood. The transitions between early and late wood are noticeable on tangential surfaces, so that the open pores are clearly visible and gradually merge into the less pronounced late wood. (Figure 3).
The results of sandblasting diffuse-porous hardwood were similar in efficiency to those of sandblasting ring-porous wood. However, our visual impression was that the profile achieved by sandblasting was even less pronounced than with sandblasted ring-porous hardwood samples. With sandblasted boxelder maple, for example, the discolouration really stands out. The patterns are quite similar. Fine lines can be seen on the surfaces, and this is the only result of sandblasting apart from the rough surface. When sandblasting tangentially aligned boxelder maple surfaces, the surface shows slightly accentuated transitions between early and late wood, which is the only result of sandblasting apart from a slightly rougher surface (Figure 4).
Analysing the surfaces with an Olympus DSX1000 digital microscope also revealed different values for surface primary profile parameters, which were the average values of 12 parallel measurements per wood species. To complement the visual impression of the effectiveness of sandblasting, we decided to compare the primary profiles of the sandblasted surfaces using the parameter Pt (Figure 5). Pt is defined as the total height of the profile, i.e. the vertical distance between the maximum profile peak height and the maximum profile depth along the assessment length [26].
As can be seen in Figure 5, the measured Pt parameters roughly correspond to our visual assessment of the waviness of surfaces as a result of sandblasting. High Pt values were observed in spruce, Douglas fir and larch, for example, and in ring-porous woods in oak and sweet chestnut. In contrast, the Pt of maple and boxelder maple was lower. We also calculated the average values of Pt for radial and tangential surfaces for three groups of wood samples: softwood, ring-porous wood and diffuse-porous wood. These values measured on radial surfaces were 623 µm, 586 µm and 503 µm, respectively, and on tangential surfaces: 711 µm, 525 µm and 434 µm, respectively. Finally, the average values of Pt for radial and tangential surfaces together were 667 µm for softwoods, 556 µm for ring-porous woods and 468 µm for diffuse-porous woods. Thus, based on the visual impression and surface profile values, it appears that the best wood species for sandblasting that promises good results is softwood, followed by ring-porous and diffuse-porous hardwood. Nevertheless, the values shown in Figure 5 should not be considered uncritically: Some surface defects such as cracks or knots can have an effect on the measured values. Figure 6, for example, shows the image of the tangential surface of a linden wood sample. The image was created using the DSX software of the Olympus DSX1000 digital microscope. The model does not show a clearly grooved surface, but a larger crack can be seen on the left side of the image. It is assumed that this crack was made more pronounced by the sandblasting process. It was included in the primary profile measurements and the average value of Pt in this case reached the unrealistically high value of 1733 µm. This would be the highest value of all Pt values determined, although the surface is obviously quite smooth (Figure 6). This is also the reason why we did not include the information about the tangential Pt parameter for linden wood in the graph in Figure 5.
3.1.2. SEM Images of Spruce and Oak Wood Samples
SEM micrographs of untreated and sandblasted spruce and oak wood are shown in Figure 7 and Figure 8. In SEM micrograph of untreated spruce wood (50-fold magnification, Figure 7, left), we can see two transitions between annual growth rings, with one annual ring in the centre. The early wood with larger pores is clearly distinguishable from the latewood. The surface of the wood is slightly damaged, especially in the earlywood area, where the cells have thinner walls and are consequently softer. The wood is otherwise free from growth anomalies. The surface of a sandblasted spruce wood sample (Figure 7, right) shows a distinctly damaged wood surface. There are large protrusions throughout the observed profile.
SEM images of untreated oak wood (50x and 500x magnification) are shown in Figure 8 (left and centre) and of sandblasted oak wood in the same figure (right). In one of the vessels, the tylose vessel elements of the early wood are clearly visible, while the others are not tylosed. Perforation plates are also visible, and two unilateral rays are present. The tissue is slightly torn, with some shorter fibres visible (Figure 8 right). At 500x magnification (Figure 8, centre), the surface created by planing can be seen even more clearly. The tissue is only slightly torn, mainly in the area of the early wood vessels. The image clearly shows where one vessel element ends and another begins. Finally, on the right-hand side of Figure 8 is an SEM image (500x magnification) of a sandblasted oak surface. A rough, torn surface can be recognised. A sanding particle can also be clearly recognised. It has characteristic straight and sharp edges that distinguish it from wood tissue. In addition, several grooves can be recognised, which were created by the impact of the blasting agent on the wood surface.
3.1.3. Indentation Hardness and Reduction of Mass and Thickness by Sandblasting
Figure 9 shows typical curves from the tests with the microindenter, which were used to calculate the indentation hardness and the indentation modulus. The load (Fn in N) versus indentation depth (Pd) curves consist of a load and unload range with a pause of 10 seconds.
Indentation hardness (HIT in MPa) is calculated as the ratio of the maximum applied load to the contact area at that load:
where Fmax is the maximum applied load in N and Ap(hc) (in µm2) is the projected contact area at the contact depth hc (µm) [27]
Indentation modulus (EIT) is derived from the slope of the unloading curve at the point of maximum load, considering the elastic response of the material and the geometry of the indenter (in our case, a 6 mm steel ball):
where S is the slope of the unloading curve, β is a correction factor (~ 1 for a spherical indenter) and the other symbols have the same meanings as described in Equation 1 [27]
The average values (calculated from 6 measurements on early wood and 6 measurements on late wood per surface orientation) for the indentation hardness and the indentation modulus are listed in Table 1.

Table 1.
Average indentation hardness (HIT (MPa)) and indentation modulus (EIT (GPa)) values1,2.
| Sample | Radial surface | Tangential surface | |||||||
|---|---|---|---|---|---|---|---|---|---|
| Early wood | Late wood | Early wood | Late wood | ||||||
| HIT | EIT | HIT | EIT | HIT | EIT | HIT | EIT | ||
| Spruce | 165(27) | 1.98(0.16) | 229(58) | 2.51(0.32) | 62.5(43) | 3.27(0.81) | 183(39) | 1.88(0.30) | |
| Douglas-fir | 94.9(6) | 1.72(0.08) | 424(147) | 4.91(1.01) | |||||
| Pine | 140(57) | 1.94(0.51) | 275(67) | 2.78(0.53) | 210(110) | 2.49(0.77) | 379(148) | 3.35(1.00) | |
| Larch | 283(81) | 3.47(0.54) | 547(170) | 5.82(0.95) | 329(132) | 6.30(2.19) | 689(42) | 9.29(1.67) | |
| Ash | 389(65) | 4.68(0.34) | 414(203) | 6.18(4.2) | 448(97) | 5.04(0.28) | 476(161) | 5.60(1.78) | |
| Oak | 272(112) | 3.42(1.06) | 488(116) | 4.04(0.69) | 776(125) | 8.11(1.18) | 949(151) | 10.8(1.20) | |
| Sweet chestnut | 205(84) | 3.02(1.46) | 374(48) | 3.31(0.81) | 208(38) | 3.59(0.55) | 458(84) | 5.41(0.45) | |
| Elm | 480(136) | 7.63(0.67) | 661(370) | 11.2(2.10) | 409(71) | 5.31(0.23) | 778(249) | 9.53(0.71) | |
| Honey locust | 504(142) | 6.11(0.92) | 748(69) | 9.30(0.71) | |||||
| Tree of heaven | 353(47) | 5.49(0.48) | 366(134) | 4.81(0.74) | |||||
| Black locust | 419(88) | 6.13(1.32) | 518(209) | 6.69(1.34) | |||||
| Horse chestnut | 225(30) | 3.07(0.31) | 263(75) | 3.22(0.32) | |||||
| Maple | 237(117) | 2.94(0.79) | 366(45) | 4.50(0.52) | 519(82) | 5.14(0.31) | 838(98) | 6.89(0.74) | |
| Linden | 98(40) | 2.79(2.04) | 142(48) | 1.78(0.25) | 113(53) | 1.73(0.37) | 184(15) | 2.10(0.33) | |
| Willow | 136(72) | 1.96(0.84) | 162(23) | 2.63(0.30) | |||||
| Poplar | 213(106) | 2.62(0.96) | 367(82) | 3.67(0.47) | |||||
| Boxelder maple | 289(45) | 4.88(0.40) | 415(134) | 6.10(1.06) | 860(65) | 10.3(0.67) | 876(152) | 9.65(1.70) | |
1 Empty cells mean that samples with this orientation were not available. 2 Standard deviations in parentheses.
As described in the literature [28], the indentation hardness values cannot be easily converted into other, more conventional hardness values such as Brinell hardness. For this reason, the hardness values from the literature were not included in Table 1. However, woods with high hardness values, expressed by HIT, are also described as hard in the literature (e.g. ash, elm or black locust) [29], and the same can be said for soft woods (e.g. willow, pine or poplar) [29]. If we look at the HIT and EIT data in Table 1, we can first see in some cases a very large scatter of the measured values expressed by the standard deviations, such as in the cases of HIT for oak, maple, willow or poplar wood (radial surface, early wood). As previously reported [30], this could be due to the high variability of wood properties, even within a single sample, but also to the low spatial resolution. It is quite difficult to place a steel ball exactly in the centre of earlywood or latewood tissues, especially if the annual rings of the samples are narrow. Nevertheless, the hardness values of early wood were determined to be lower than those of late wood, which was expected result [30,31,32,33], and the most important reason for this is the difference between densities of early and late wood [33,34].
In Table 2, experimental and literature data are presented that were used together with some data from Table 1 for the analysis of possible correlations between hardness, difference of hardness between early and late wood, decrease of thickness and mass loss because of sandblasting and profile, as expressed by the primary profile parameter Pt.
Table 2.
Densities, mass loss, thickness reduction, ΔHIT, and Pt for different wood species. .
| Wood | Orientation | Density (g/cm3)1 | Mass loss (%) | Decrease of thickness (%) | ΔHIT2 (MPa) | Pt (µm) |
|---|---|---|---|---|---|---|
| Spruce | radial | 430 [35] | 1.868 | 0.518 | 64 | 708 |
| tangential | 2.514 | 0.768 | 120 | 887 | ||
| Douglas-fir | radial | 530 [35] | 1.454 | 0.504 | 329 | 707 |
| Pine | data | 510 [35] | 1.727 | 0.541 | 135 | 472 |
| data | 1.411 | 0.508 | 360 | 554 | ||
| Larch | radial | 530 [35] | 1.786 | 0.539 | 264 | 604 |
| tangential | 1.548 | 0.182 | 360 | 692 | ||
| Ash | radial | 710 [35] | 1.098 | 0.646 | 25 | 481 |
| tangential | 1.091 | 0.387 | 28 | 546 | ||
| Oak | radial | 740 [35] | 1.316 | 0.393 | 216 | 761 |
| tangential | 1.036 | 0.185 | 173 | 638 | ||
| Sweet chestnut | radial | 560 [35] | 1.817 | 0.682 | 169 | 789 |
| tangential | 1.505 | 0.556 | 250 | 521 | ||
| Elm | radial | 570 [35] | 1.225 | 0.481 | 181 | 386 |
| tangential | 1.237 | 0.512 | 369 | 458 | ||
| Honey locust | radial | 670 [35] | 1.245 | 0.366 | 244 | 596 |
| Tree of heaven | radial | 540 [36] | 0.825 | 0.241 | 13 | 504 |
| Black locust | tangential | 710 [36] | 1.091 | 0.341 | 99 | 464 |
| Horse chestnut | radial | 500 [35] | 1.763 | 1.093 | 38 | 457 |
| Maple | radial | 620 [35] | 1.250 | 0.624 | 129 | 433 |
| tangential | 1.213 | 0.591 | 319 | 429 | ||
| Linden | radial | 560 [35] | 2.482 | 1.319 | 44 | 518 |
| tangential | 1.548 | 0.905 | 71 | 3 | ||
| Willow | radial | 500 [35] | 1.796 | 0.640 | 26 | 655 |
| Poplar | radial | 450 [35] | 1.131 | 0.363 | 154 | 524 |
| Boxelder maple | radial | 420 [36] | 0.825 | 0.241 | 126 | 428 |
| tangential | 1.091 | 0.341 | 16 | 441 |
*1 average values were taken for the density; if the tree species for the wood was not exactly known, average values were taken for similar species from the same genus 2 ΔHIT is the difference between HIT for late and early wood 3 the value was not measured.
To investigate potential dependencies between the measured wood properties, the artificial intelligence tool [20] performed a series of Pearson correlation analyses using sources cited in the Materials and Methods [21,22,23,24,25]. The analysis was also performed separately for radial and tangential surfaces and for specific anatomical wood groups: Softwoods, ring-porous hardwoods and diffuse-porous hardwoods. Variables included density, mass loss (Δm), thickness reduction (Δt), surface profile (Pt) and indentation hardness (HIT) as well as indentation modulus (EIT) for both early and late wood. Firstly, it was found that both the indentation hardness of the earlywood and the latewood were very strongly correlated with the respective indentation modulus values (r = .91 and r = .87, both p < .00000001), confirming the mechanical consistency of the indentation measurements. Δt – Δm: As expected, a strong positive correlation was found between thickness reduction and mass loss (r = .72, p < .001), suggesting that samples that were thinned more also lost more mass. This relationship was particularly strong for radial alignment (r = .79, p < .001). We were interested in surface primary profile as a result of the sandblasting process, and it was calculated that mass loss was strongly correlated with Pt (r = .61, p = .006), particularly in the tangential orientation (r = .82, p = .004), suggesting that more degraded samples had more profiled surfaces. This relationship is shown in Figure 10. On the other hand, a moderately negative correlation (r = –.34, p = .083) between density and thickness reduction suggests that denser wood samples are more likely to resist thickness reduction (Figure 10). Contrary to expectations, several pairs of properties showed very weak or no correlation: density – Pt (r = –.03, p = .874), Δt – Pt (r = +.00, p = .983), Pt – ΔHIT (r = +.14, p = .492). These results indicate that surface profile (Pt) is not related to wood density, nor to thickness reduction, and especially not to ΔHIT. We thought that a large difference between the hardness of the late and early wood would lead to a stronger waviness of the sandblasted wood (more intense blasting of the softer early wood). The lack of this correlation suggests that other factors, such as microstructural breakdown, may play a more important role.
To assess the overall strength of the relationships between wood properties, the programme calculated the average absolute Pearson correlation coefficient (|r|) for all pairwise combinations of Δt, Δm, Pt, ΔHIT and density for each group (sandblasting of radial or tangential surfaces, softwood, ring-porous and diffuse-porous hardwood). These values reflect the general tendency of properties to vary within each group. For example, softwoods and diffuse-porous hardwoods showed stronger dependencies between physical and mechanical properties, possibly due to a more uniform anatomical structure or degradation behaviour. In contrast, radial samples showed weaker correlations, suggesting that the property changes are less synchronised in this orientation.
3.2. Greying
We also carried out the greying of sandblasted samples by immersing them in iron(II) sulphate solution. The aim was not to analyse the greying process in detail, for example to examine the colour of the greyed samples in relation to their chemical composition or to measure colour differences as a result of greying. Rather, the aim was to prepare sandblasted samples that visually resemble wood that has been exposed to weathering for a long time. In this section, therefore, only a few examples of greyed samples are shown for illustrative purposes. This approach is consistent with architectural practices where iron(II) sulphate is used to accelerate and homogenise the greying of façades, especially in areas protected from direct weathering [17].
Figure 11 below shows an image of the surface of spruce samples in radial orientation. After exposure, the surfaces of the treated samples look old and worn. The newly formed colour is fairly homogeneous over the entire surface of the samples, with the exception of some areas of the late wood where the colour is slightly lighter and the greying is less pronounced. The embedded sanding particles are still present and are even more visible on the darker surface of the wood. Figure 11 shows also an image of the top surface of spruce samples in tangential orientation. The newly formed colour is fairly homogeneous over the entire surface of the samples, with the exception of the areas in the late wood, where the colour tone is slightly lighter and the greying is less pronounced. In the 4th sample counted from left in Figure 11, swelling occurred after thorough wetting and subsequent drying in sunlight. This led to a relaxation of the internal stresses, which caused a crack in the early wood of one of the knots, resulting in pronounced flaking of the treated surface.
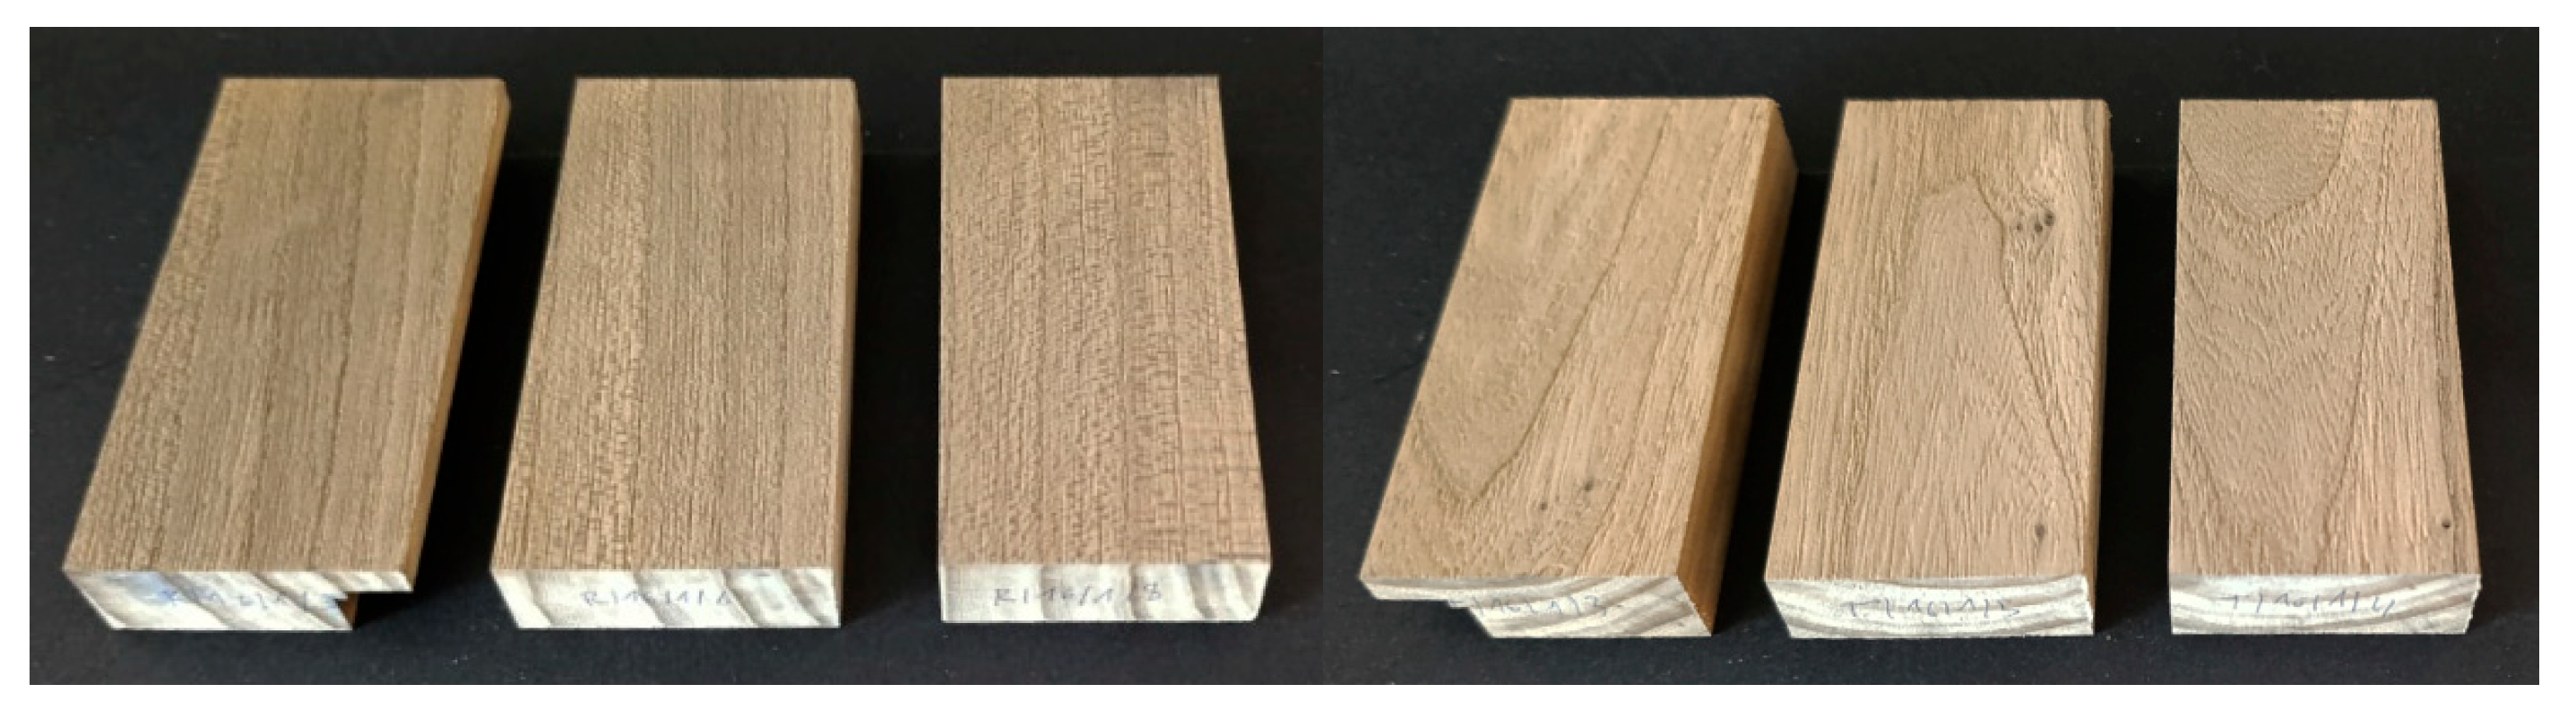
Figure 12 below shows an image of the surface of oak samples in radial orientation. After exposure, the surfaces of the treated samples look old and worn, similar to the softwood samples. The surfaces have darkened and are bluish (indigo) in colour, which is characteristic of the reaction between tannins and iron ions. This reaction leads to the formation of ferric pyrogallate complexes, resulting in immediate and intense darkening. Oak heartwood, rich in hydrolysable tannins, exhibits this effect prominently. The anatomical structure of oak, especially the wide rays composed of parenchyma cells, facilitates the accumulation and surface migration of extractives, enhancing the staining effect [17]. On our samples, also the abrasive inclusions are recognisable. They are visible in the early part of the wood as light-coloured grains. Areas of poor wetting are also visible, although a brush was used to aid immersion. On the right side of this Figure, an image of the surface of oak samples in tangential orientation is shown. The amount of embedded abrasives is lower in the tangential orientation than in the radially orientated examples. Areas of poor wetting with the iron sulphate solution are also visible.
The third illustrative example of greying is elm with radial and tangential sandblasted and greyed surfaces (Figure 13). After exposure, the surfaces of the treated samples look old, but not as worn as oak or chestnut, for example. The surfaces are greyed and despite their darker colour, the sandblasting effect is no more pronounced on these samples than on ash samples, for example. In samples with tangential sandblasted and greyed surfaces, the patterns appear more worn and aged than in the radial orientation. The surfaces are effectively greyed, which emphasises the transition between early and late wood.
4. Discussion
If we critically analyse the obtained measurement data and the correlations between them, it seems that softwoods are the most promising species if sandblasting is expected to be as efficient as possible, especially spruce and larch, especially for tangential surfaces that are to be sandblasted. Among the ring-porous woods, oak and sweet chestnut also achieved good results, even in radial orientation. In the group of diffuse-porous woods, willow was surprisingly profiled. In general, the tangential surfaces are more profiled than the radial ones after sandblasting. All in all, softwoods are the better choice for simulated weathering by sandblasting and greying.
Our results complement the information from the literature that the erosion and weathering behaviour of wood is closely related to its anatomical structure. Lemaster et al. [14] demonstrated that sandblasting with sodium bicarbonate or plastic media preferentially removes early wood, reinforcing the natural structure of the annual rings. This selective erosion mimics natural weathering and can be used to artificially age wood surfaces. Our results show that tangential surfaces, which have more earlywood, tend to have more profiled after sandblasting, which is consistent with the erosion patterns observed by Lemaster et al. [14]. Laskowska et al. [37] investigated the influence of sandblasting on the surface properties of spruce and larch wood as well as oak and Norway maple wood [37]. They concluded that their results emphasise the need to consider the wood species and anatomical variability when selecting surface preparation methods and finishing systems. Although the sandblasting process differs from conventional sanding, we believe that these conclusions confirm our findings. Sahin et al. [3] investigated surface profile changes as a result of natural weathering. They wrote that the characteristics of surface roughness in most wood species are very complicated and not well understood. To determine the causes of roughness, one must understand factors such as the wood’s cell wall structure, moisture conditions, annual ring orientation and density. They claim that the susceptibility to changes in surface appearance (including surface profile) is variable and highly dependent on the botanical origin of the wood species as well as the nature of the wood itself. This was also evident in our tests and should be taken into account when selecting wood for simulated weathering by sandblasting.
5. Conclusions
We have found that the sandblasting process can only be effectively profiled on certain types of wood under the parameters used. Sandblasting proved to be effective on all tested softwood species and some ring-porous hardwoods, but only to a limited extent on diffuse-porous hardwoods. A comparison of the treated samples of ring-porous and diffuse-porous hardwoods shows that sandblasting is quite effective in profiling the surfaces of certain ring-porous wood species. In contrast, the success and intensity of surface profiling was not as high for diffuse-porous hardwoods. It was calculated that the relative mass loss (in %) correlates with the primary profile, especially in the tangential direction. Therefore, the average values of primary profile parameters (e.g. Pt) were higher on tangential surfaces than on radial surfaces. Although sandblasting on radial surfaces seemed to be generally more successful in visual inspection, the measured values could not confirm this. Finally, we found that numerous abrasive particles of different sizes were embedded in the wood and could not be removed by blowing off with compressed air.
Author Contributions
Conceptualization, J.S. and M.Pe.; methodology, M.Pe., L.A., E.K., J.L., M.Pa. and J.S.; formal analysis, M.Pe., L.A., E.K., J.L., M.Pa. and J.S.; data curation, M.Pe.; validation M.Pe.; investigation, M.Pe., L.A., E.K., J.L., M.Pa. and J.S.; resources, M.Pe.; writing—original draft preparation, M.Pe.; writing—review and editing, L.A., E.K., J.L., M.Pa. and J.S.; supervision, M.Pe.; funding acquisition, M.Pe. All authors have read and agreed to the published version of the manuscript.
Funding
This research was funded by ARIS, Slovenian Research and Innovation Agency Ljubljana, Slovenia, grant number P4-0015 (Research Programme “Wood and lignocellulosic composites”).
Institutional Review Board Statement
Not applicable
Data Availability Statement
The master’s thesis by Mr Jernej S., which was the basis for the preparation of this paper, is available in the Repository of the University of Ljubljana at https://repozitorij.uni-lj.si/IzpisGradiva.php?id=170842&lang=eng . The original data presented in the study as well as various supporting measurement data not directly used in the text are openly available in the Repository of the University of Ljubljana at https://repozitorij.uni-lj.si/ , access numbers 171037 and 171040 (search in Advanced search mode: author Marko Petrič, work type Research data or Corpuses).
Acknowledgments
During the preparation of this manuscript, the authors used Microsoft Copilot (GPT-4, July 2025 version), an AI-based assistant developed by OpenAI and integrated into Microsoft services [Microsoft. (2025). Copilot (GPT-4, July 2025 version) [AI assistant]. https://copilot.microsoft.com] for the purposes of calculation of correlations between the experimental datasets and for support in preparation of two part of this article, explaining statistical methodology in the description of materials and methods and of the obtained correlations (the text between Table 2 and Section 3.3. The authors have reviewed and edited the output and take full responsibility for the content of this publication.”
Conflicts of Interest
The authors declare no conflicts of interest. The funders had no role in the design of the study; in the collection, analyses, or interpretation of data; in the writing of the manuscript; or in the decision to publish the results.
Abbreviations
The following abbreviations are used in this manuscript:
| R | Radial surface |
| T | Tangential surface |
| A | Alien invasive species |
| Pt | Surface profile parameter: the total height of the profile |
| |r| | the average absolute correlation (mean |r|) |
| HIT | Indentation hardness |
| EIT | Indentation modulus |
| ΔHIT | Difference of indentation hardnesses of late and early wood |
References
- Kropat, M.; Hubbe, M.A.; Laleicke, F. Natural, Accelerated, and Simulated Weathering of Wood: A Review. BioRes 2020, 15, 9998–10062. [Google Scholar] [CrossRef]
- Chen, Y.; Gao, Y.; Duan, H.; Xu, X. Progress in the Experimental Design and Performance Characterization of Artificial Accelerated Photodegradation of Wood. Coatings 2024, 14, 1600. [Google Scholar] [CrossRef]
- Kus Sahin, C.; Topay, M.; Ali Var, A. A Study on Suitability of Some Wood Species for Landscape Applications: Surface Color, Hardness and Roughness Changes at Outdoor Conditions. Wood Res. 2020, 65, 395–404. [Google Scholar] [CrossRef]
- Jirouš-Rajković, V.; Miklečić, J. Enhancing Weathering Resistance of Wood—A Review. Polymers 2021, 13, 1980. [Google Scholar] [CrossRef]
- De Windt, I.; Van Den Bulcke, J.; Wuijtens, I.; Coppens, H.; Van Acker, J. Outdoor Weathering Performance Parameters of Exterior Wood Coating Systems on Tropical Hardwood Substrates. Eur. J. Wood Prod. 2014, 72, 261–272. [Google Scholar] [CrossRef]
- Mi, X.; Li, Y.; Qin, X.; Li, J. Effects of Natural Weathering on Aged Wood from Historic Wooden Building: Diagnosis of the Oxidative Degradation. Herit Sci 2023, 11, 109. [Google Scholar] [CrossRef]
- Cogulet, A.; Blanchet, P.; Landry, V. The Multifactorial Aspect of Wood Weathering: A Review Based on a Holistic Approach of Wood Degradation Protected by Clear Coating. BioResources 2017, 13, 2116–2138. [Google Scholar] [CrossRef]
- Yu, H.; Pan, X.; Xu, M.; Yang, W.; Wang, J.; Zhuang, X. Surface Chemical Changes Analysis of UV-Light Irradiated Moso Bamboo (Phyllostachys Pubescens Mazel). R.Soc.Open Sci 2018, 5. [Google Scholar] [CrossRef]
- Evans, P.D. Weathering of Wood.; Canadian Wood Preservation Association, 36th Annual Meeting: Ottawa, Ontario, October 27 2015. [Google Scholar]
- Kubovský, I.; Oberhofnerová, E.; Kačík, F.; Pánek, M. Surface Changes of Selected Hardwoods Due to Weather Conditions. Forests 2018, 9, 557. [Google Scholar] [CrossRef]
- Hill, C.; Kymäläinen, M.; Rautkari, L. Review of the Use of Solid Wood as an External Cladding Material in the Built Environment. J Mater Sci 2022, 57, 9031–9076. [Google Scholar] [CrossRef]
- Ding, T.; Qin, Z.; Luan, R. Discoloration of Heat-Treated and Untreated Red Alder Wood in Outdoor, Transitional and Indoor Space. Wood Material Science & Engineering 2024, 19, 589–600. [Google Scholar] [CrossRef]
- Williams, R.S.; Knaebe, M.T.; Feist, W.C. EROSION RATES OF WOOD DURING NATURAL WEATHERING. PART 11. EARLYWOOD AND LATEWOOD EROSION RATES. Wood Fiber Sci. 33, 43–49.
- Lemaster, R.L.; Shih, A.J.; Yu, Z. Blasting and Erosion Wear of Wood Using Sodium Bicarbonate and Plastic Media. Forest Prod J 2005, 55, 59–64. [Google Scholar]
- Jankowska, A.; Kwiatkowski, A. Effectiveness of European Oak Wood Staining with Iron (II) Sulphate during Natural Weathering. Maderas, Cienc. Tecnol. 2022, 24. [Google Scholar] [CrossRef]
- Dagher, R.; Stevanovic, T.; Landry, V. Wood Color Modification with Iron Salts Aqueous Solutions: Effect on Wood Grain Contrast and Surface Roughness. Holzforschung 2023, 77, 356–367. [Google Scholar] [CrossRef]
- Hundhausen, U.; Mai, C.; Slabohm, M.; Gschweidl, F.; Schwarzenbrunner, R. The Staining Effect of Iron (II) Sulfate on Nine Different Wooden Substrates. Forests 2020, 11, 658. [Google Scholar] [CrossRef]
- Lesar, B.; Humar, M. Performance of Iron(II)-Sulphate-Treated Norway Spruce and Siberian Larch in Laboratory and Outdoor Tests. Forests 2022, 13, 1497. [Google Scholar] [CrossRef]
- Humar, M.; Osvald, F.; Lesar, B. Colour Changes of Weathered Wood Surfaces Before and After Treatment with Iron (II) Sulphate. Drv. ind. (Online) 2024, 75, 5–17. [Google Scholar] [CrossRef]
- Copilot (GPT-4, July 2025 Version). Available online: https://copilot.microsoft.com (accessed on 28 July 2025).
- Virtanen, P.; Gommers, R.; Oliphant, T.E.; Haberland, M.; Reddy, T.; Cournapeau, D.; Burovski, E.; Peterson, P.; Weckesser, W.; Bright, J.; et al. SciPy 1.0: Fundamental Algorithms for Scientific Computing in Python. Nat Methods 2020, 17, 261–272. [Google Scholar] [CrossRef]
- McKinney, W. Data Structures for Statistical Computing in Python. In Proceedings of the Proceedings of the 9th Python in Science Conference (SciPy 2010).
- Waskom, M. Seaborn: Statistical Data Visualization. JOSS 2021, 6, 3021. [Google Scholar] [CrossRef]
- Bobbit, Z. How to Report Pearson’s r in APA Format (With Examples) Available online:. Available online: https://www.statology.org/how-to-report-pearson-correlation/ (accessed on 28 July 2025).
- Hunter, J.D. Matplotlib: A 2D Graphics Environment. Comput. Sci. Eng. 2007, 9, 90–95. [Google Scholar] [CrossRef]
- Surface Roughness Parameters Available online:. Available online: https://www.keyence.eu/ss/products/microscope/roughness/line/parameters.jsp (accessed on 28 July 2025).
- Anton Paar GmbH Software Reference Guide: Indentation; From Indentation Software Version 10 for 64 Bits Windows® 10.
- Broitman, E. Indentation Hardness Measurements at Macro-, Micro-, and Nanoscale: A Critical Overview. Tribol Lett 2017, 65, 23. [Google Scholar] [CrossRef]
- Forest Products Laboratory. Wood Handbook—Wood as an Engineering Material. U.S. Department of Agriculture, Forest Service, Forest Products Laboratory: Madison, Wisconsin, 2021.
- Petric, M.; Levanic, J.; Paul, D. Investigations of Surface-Treated Wood by a Micro-Indentation Approach: A Short Review and a Case Study. Bulletin of the Transilvania University of Brașov, Series II: Forestry, Wood Industry, Agricultural Food Engineering 2023, 177–190. [Google Scholar] [CrossRef]
- Tyurin, A.I.; Korenkov, V.V.; Gusev, A.A.; Vasyukova, I.A.; Yunak, M.A. Comparison of the Viscoelastic Properties and Plasticity of Early and Late Wood of Pine and Spruce by Continuous Stiffness Measurement during Nanoindentation. Nanotechnol Russia 2024, 19, 116–124. [Google Scholar] [CrossRef]
- Golovin, Yu.I.; Tyurin, A.I.; Gusev, A.A.; Matveev, S.M.; Golovin, D.Yu.; Samodurov, A.A.; Vasyukova, I.A.; Yunak, M.A.; Kolesnikov, E.A.; Zakharova, O.V. Scanning Nanoindentation as an Instrument of Studying Local Mechanical Properties Distribution in Wood and a New Technique for Dendrochronology. Tech. Phys. 2023, 68, S156–S168. [Google Scholar] [CrossRef]
- Hirata, S.; Ohta, M.; Honma, Y. Hardness Distribution on Wood Surface. J Wood Sci 2001, 47, 1–7. [Google Scholar] [CrossRef]
- Peng, H.; Jiang, J.; Zhan, T.; Lu, J. Influence of Density and Equilibrium Moisture Content on the Hardness Anisotropy of Wood. Forest Products Journal 2016, 66, 443–452. [Google Scholar] [CrossRef]
- The Engineering ToolBox. Available online: https://www.engineeringtoolbox.com/wood-density-d_40.html (accessed on 28 July 2025).
- Nowak, D.J. Understanding I-Tree: Summary of Programs and Methods – Appendix 11: Wood Density Values; U.S. Department of Agriculture, Forest Service, Northern Research Station: Madison, Wisconsin, 2021. [Google Scholar]
- Laskowska, A.; Piwek, A.; Lipska, K.; Kłosińska, T.; Rybak, K.; Boruszewski, P. Evaluation of the Selected Surface Properties of European Oak and Norway Maple Wood Sanded with Aluminum Oxide Sandpapers of Different Grits. Coatings 2025, 15, 813. [Google Scholar] [CrossRef]
Figure 1.
Sandblasted radial surfaces of Douglas-fir samples (top) and of radial surfaces of larch wood (bottom left) and tangential surfaces of larch wood (bottom right).
Figure 1.
Sandblasted radial surfaces of Douglas-fir samples (top) and of radial surfaces of larch wood (bottom left) and tangential surfaces of larch wood (bottom right).
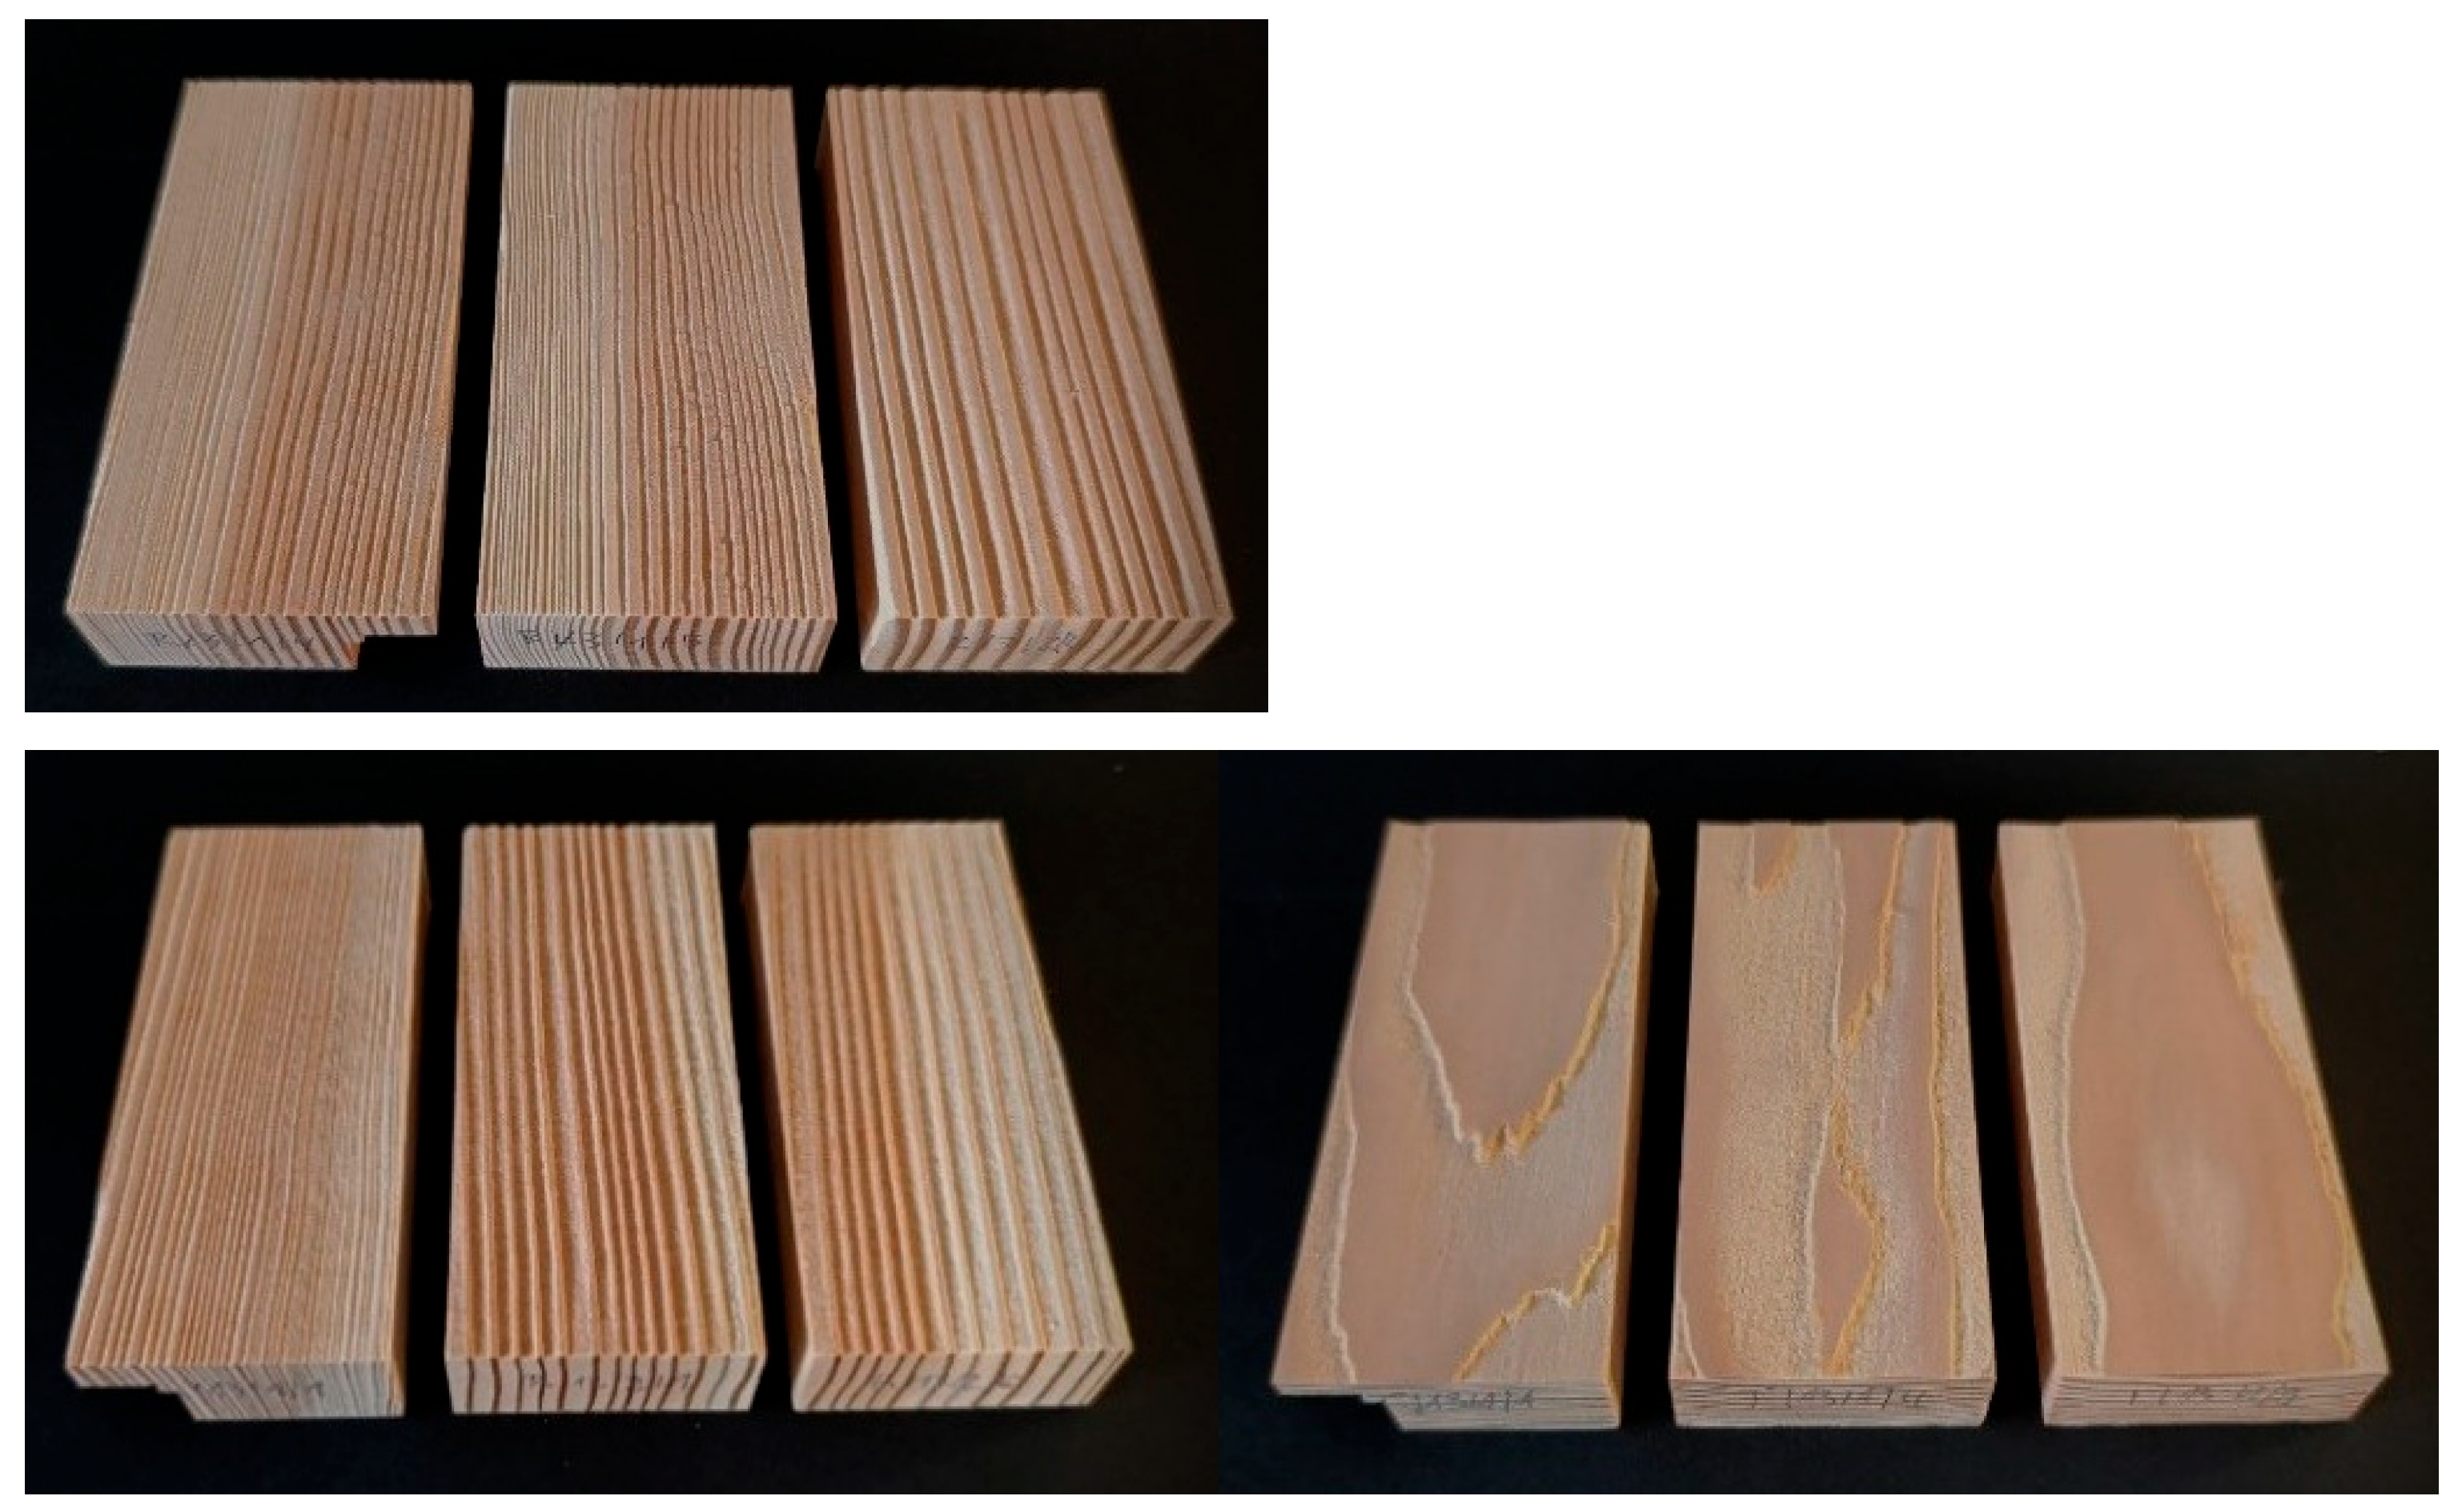
Figure 2.
Sandblasted oak wood samples in radial (left) and tangential (right) orientation.
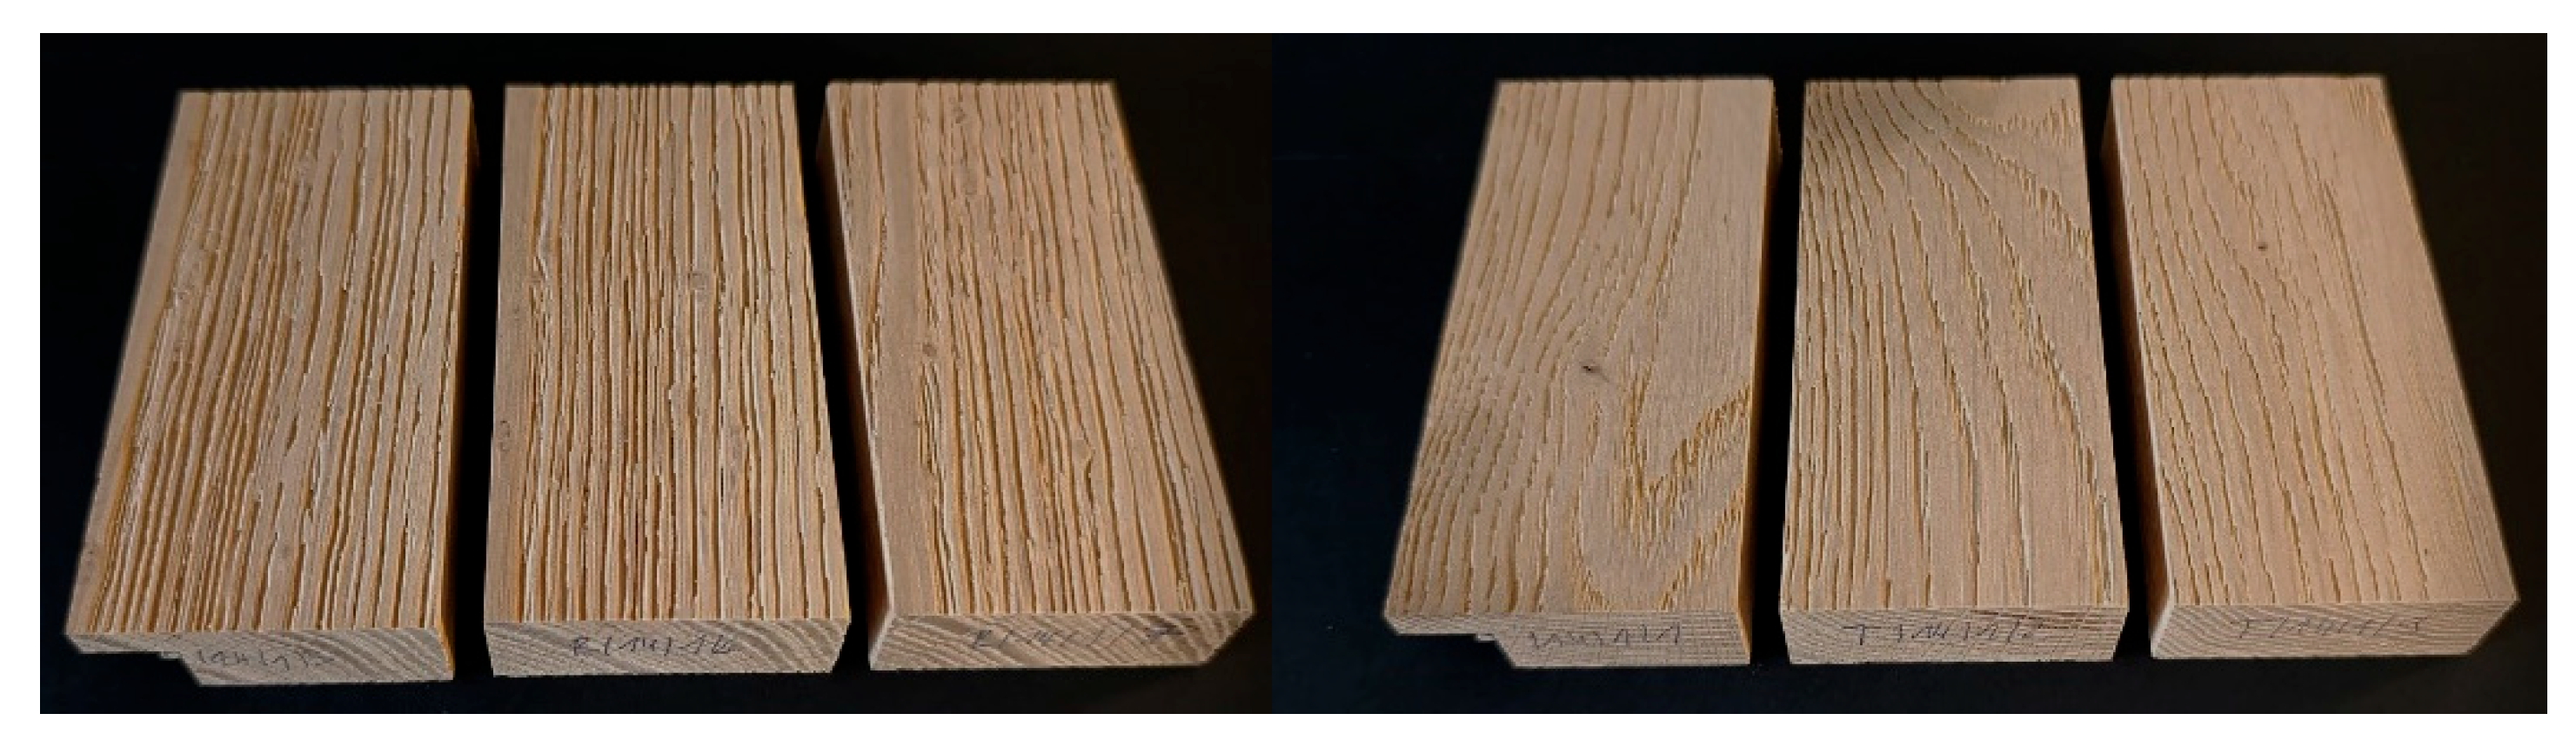
Figure 3.
Tangential surfaces of sandblasted elm wood.
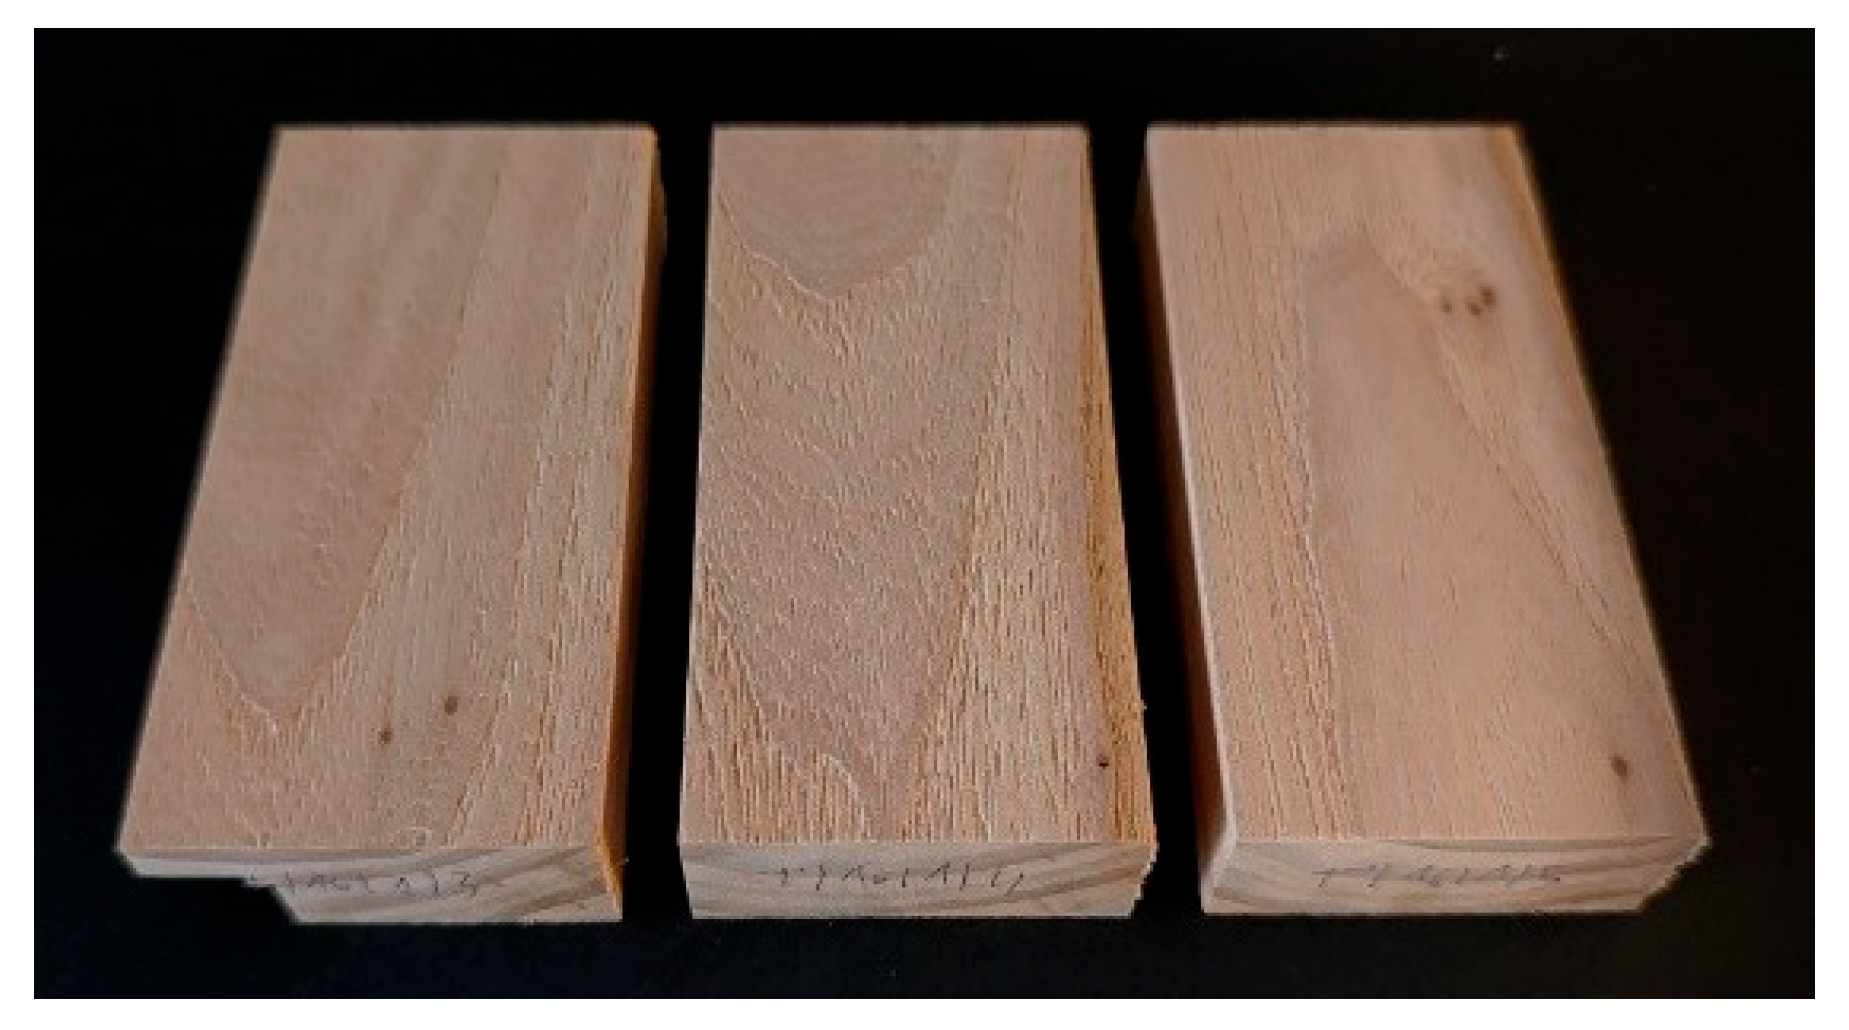
Figure 4.
Sandblasted radial (right) and tangential (left) surfaces of sandblasted boxelder maple wood.
Figure 4.
Sandblasted radial (right) and tangential (left) surfaces of sandblasted boxelder maple wood.
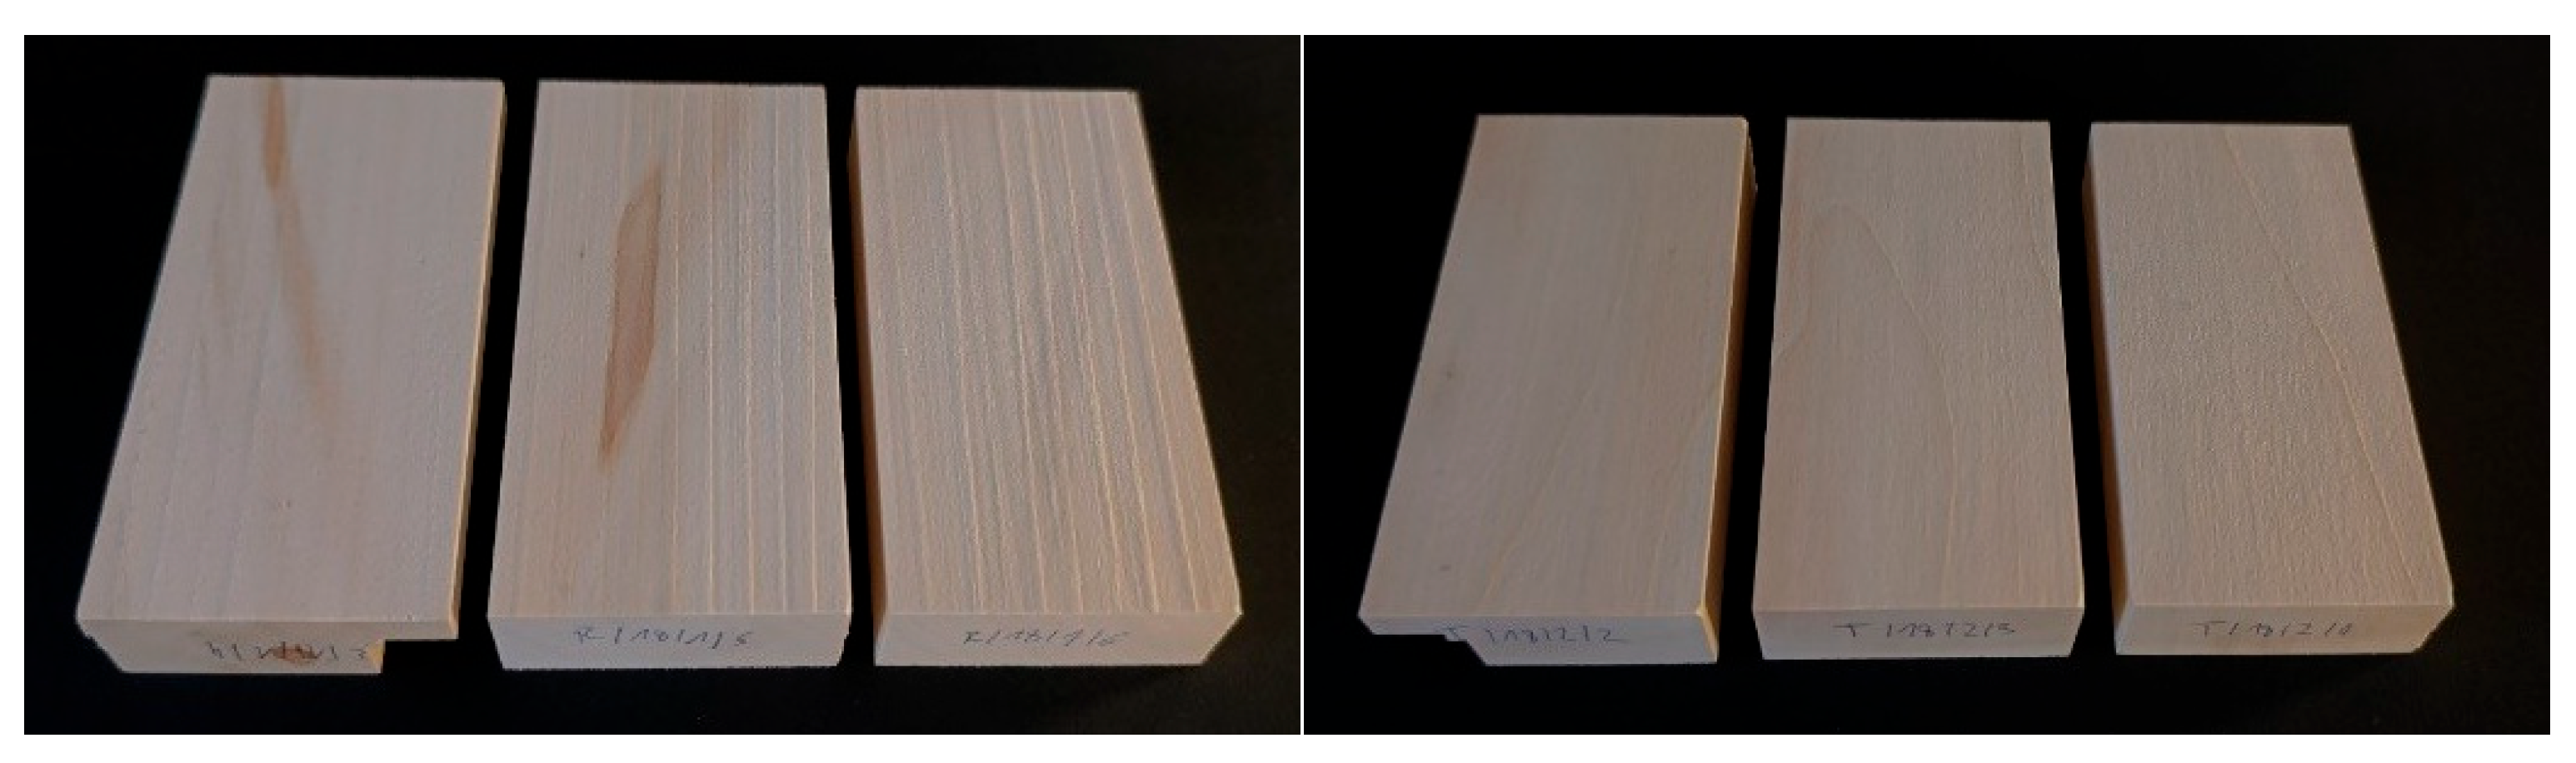
Figure 5.
Pt values of radial and tangential surfaces of various wood samples. Some data are missing – the relevant samples were either not available, or because of surface defects unrealistic values were obtained (linden wood, tangential surface). .
Figure 5.
Pt values of radial and tangential surfaces of various wood samples. Some data are missing – the relevant samples were either not available, or because of surface defects unrealistic values were obtained (linden wood, tangential surface). .
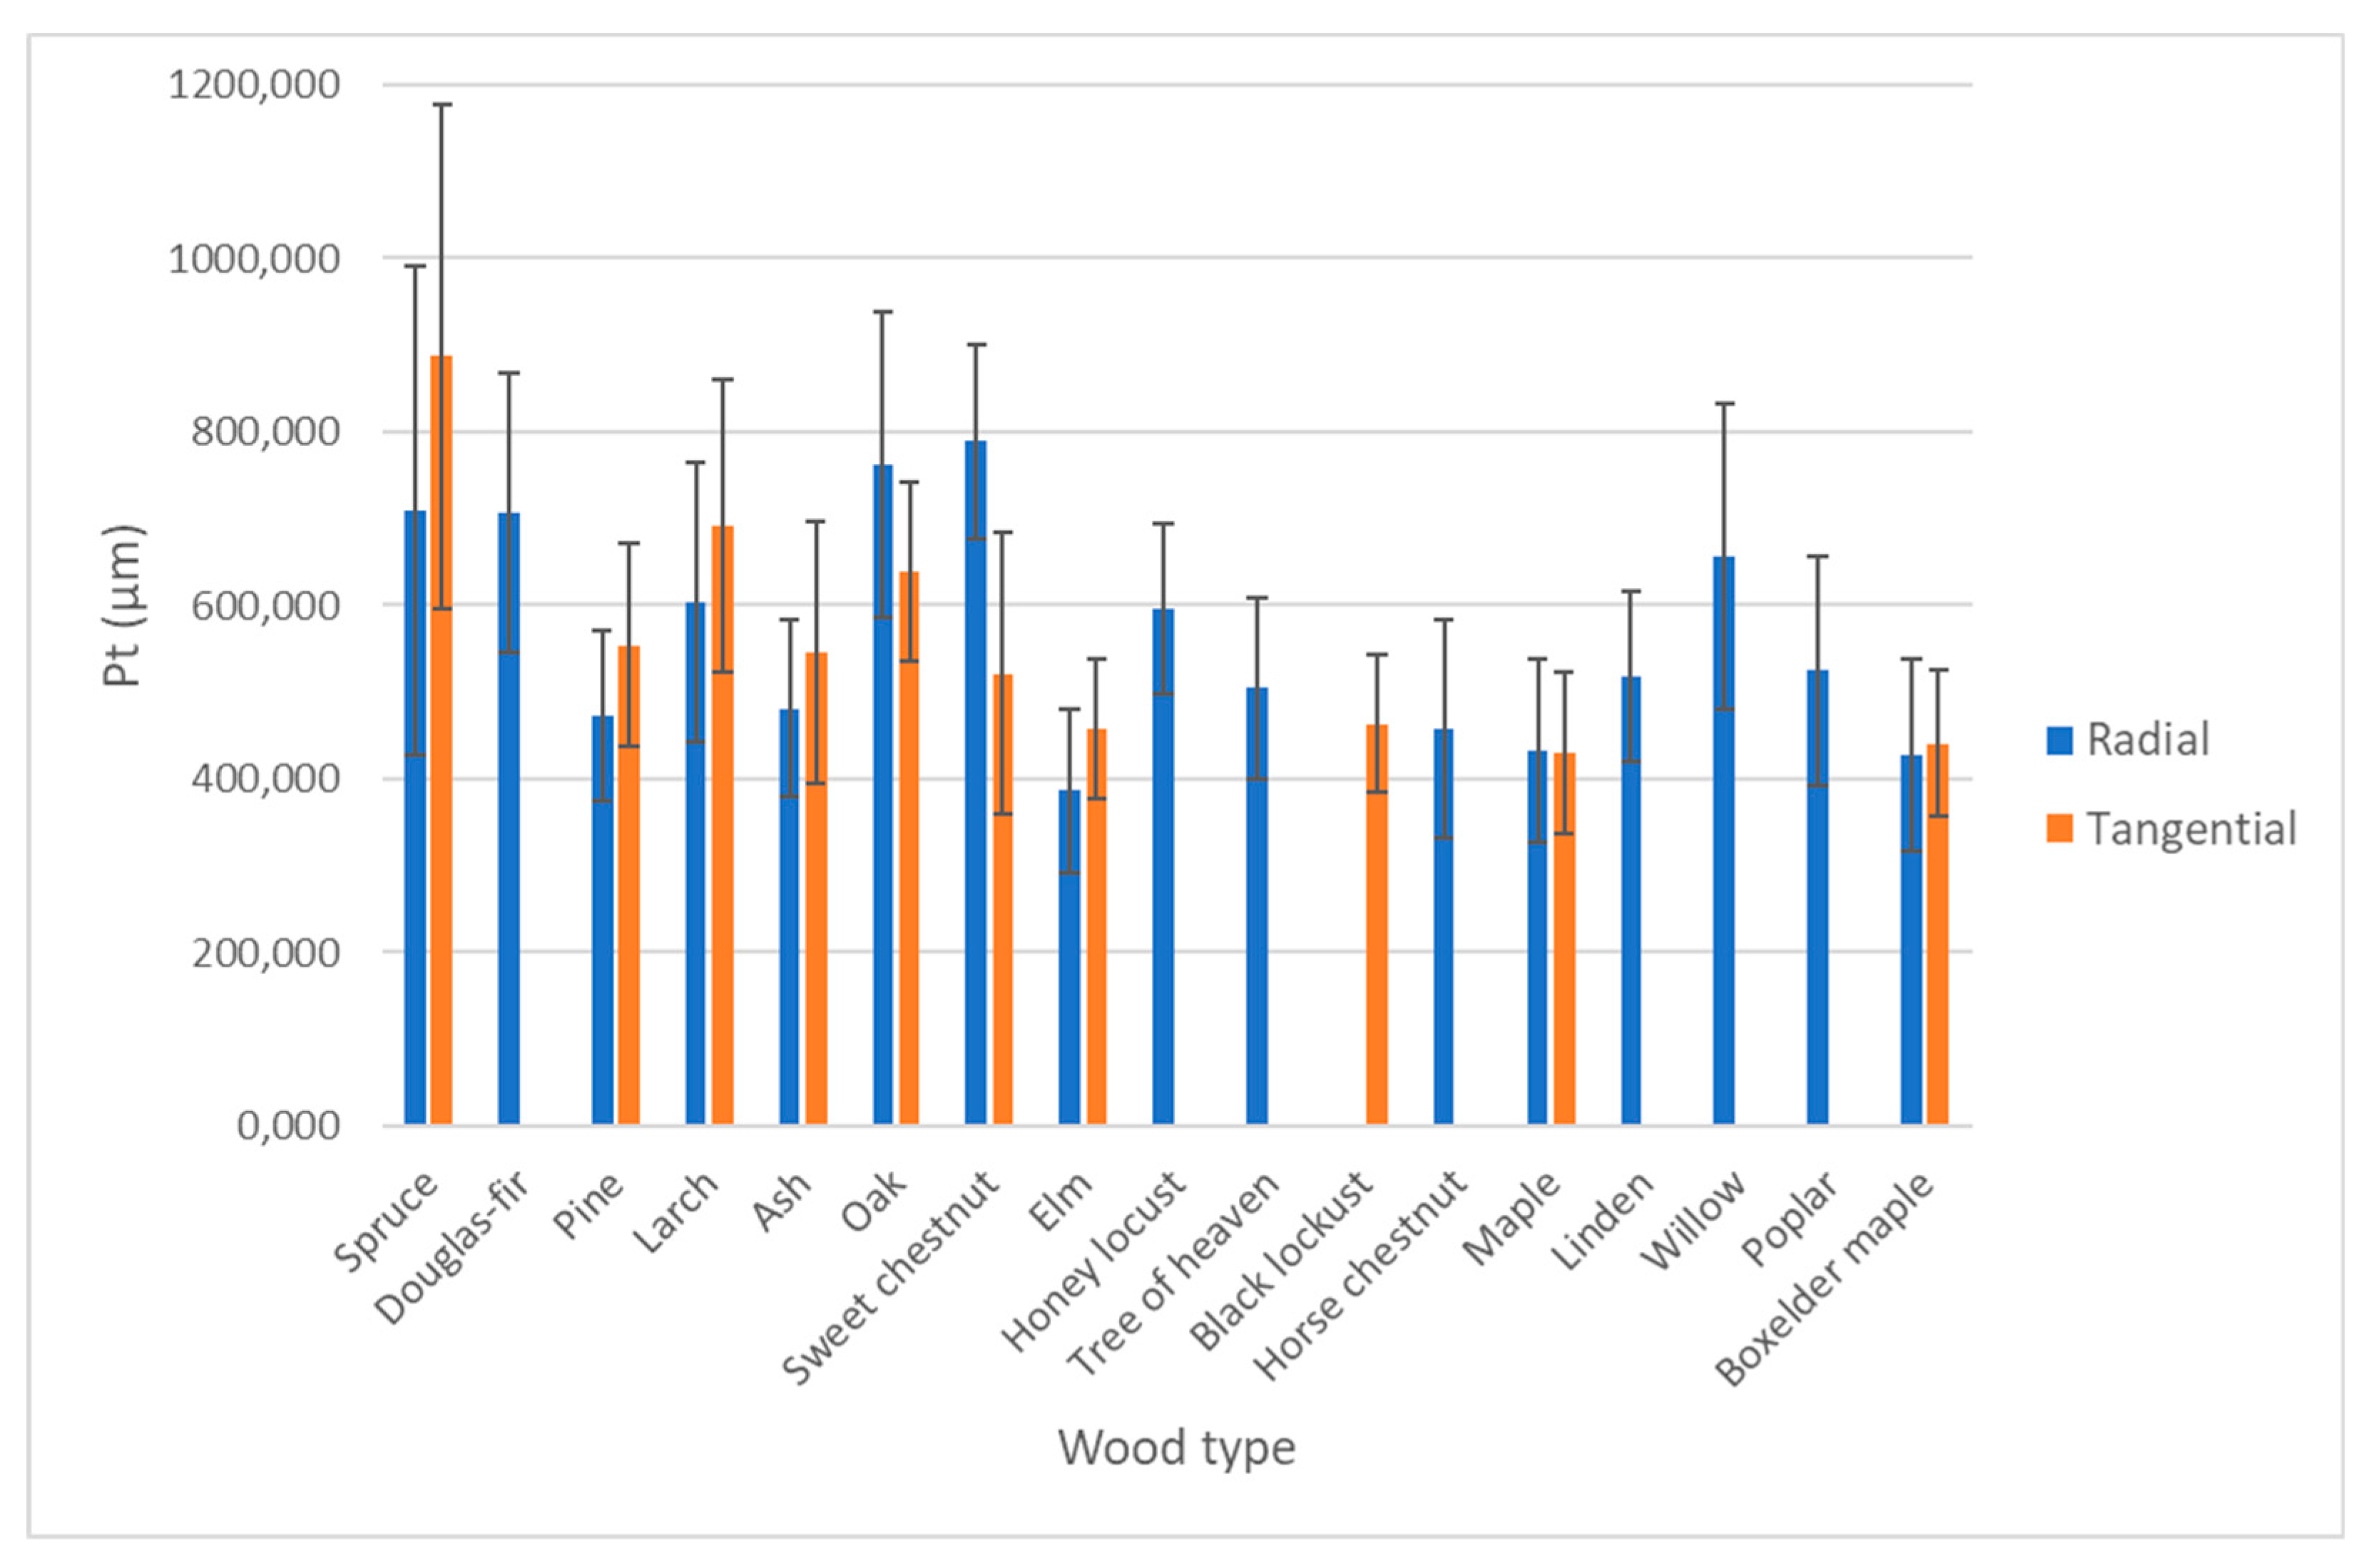
Figure 6.
Software-generated model showing the profile of one sample of linden wood.
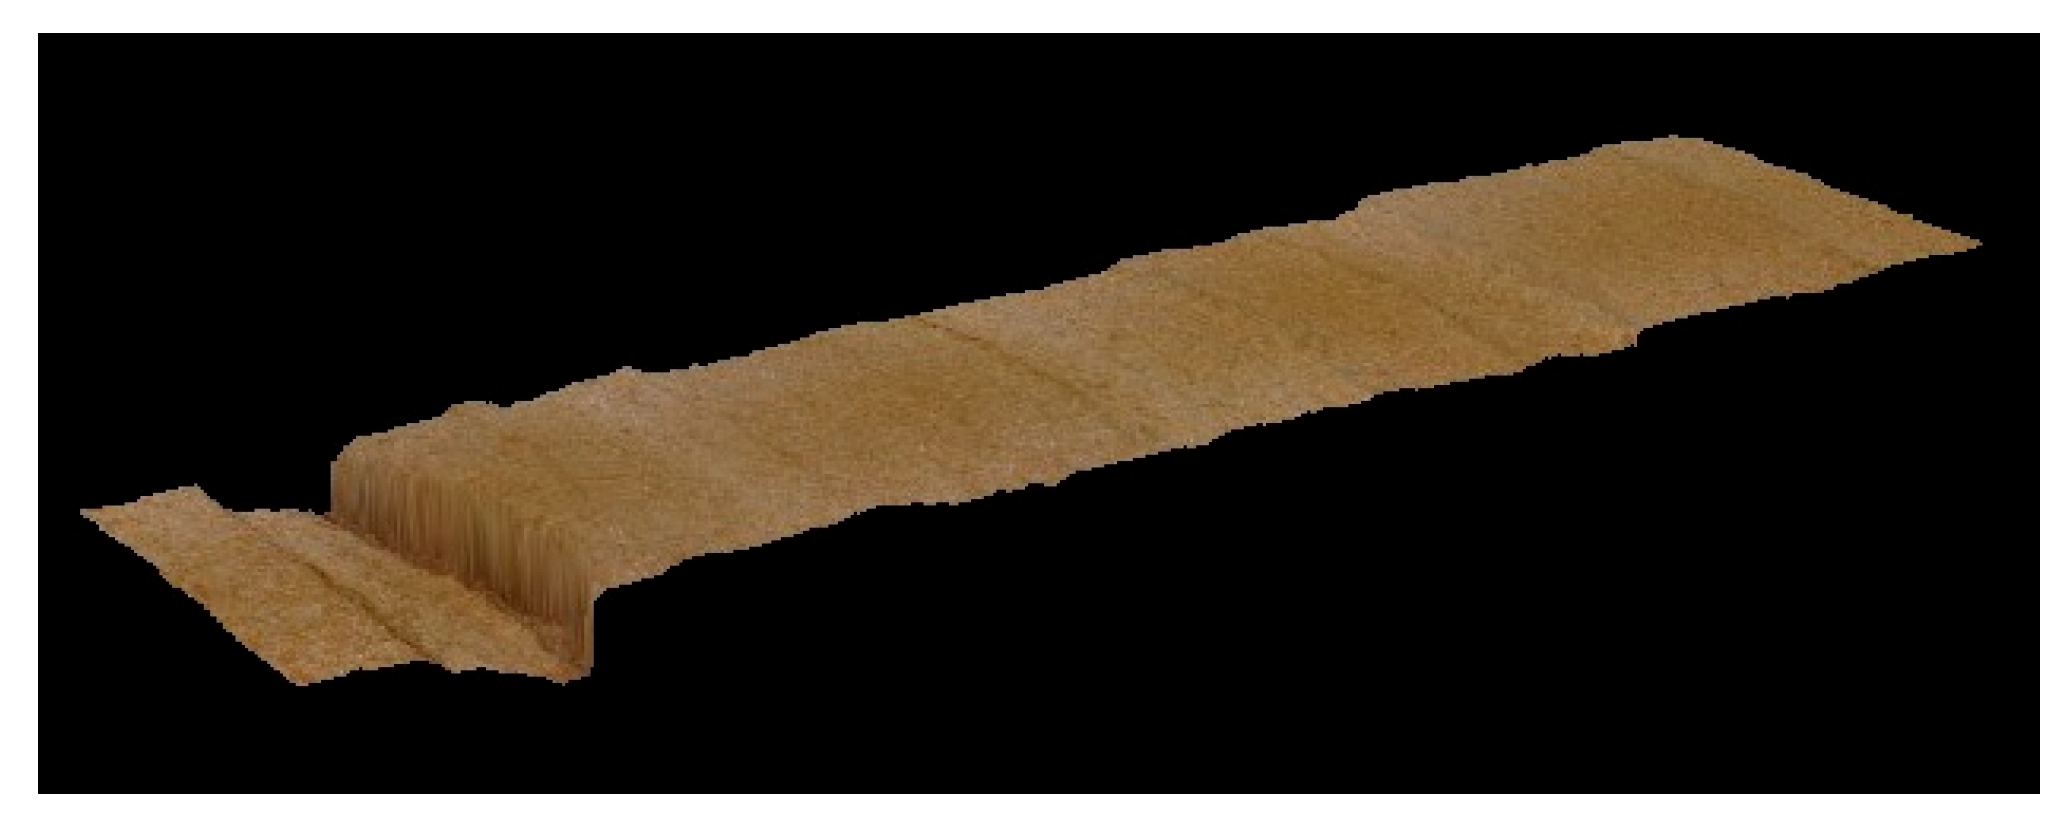
Figure 7.
SEM micrograph of untreated spruce wood (left) and of sandblasted spruce wood (right).
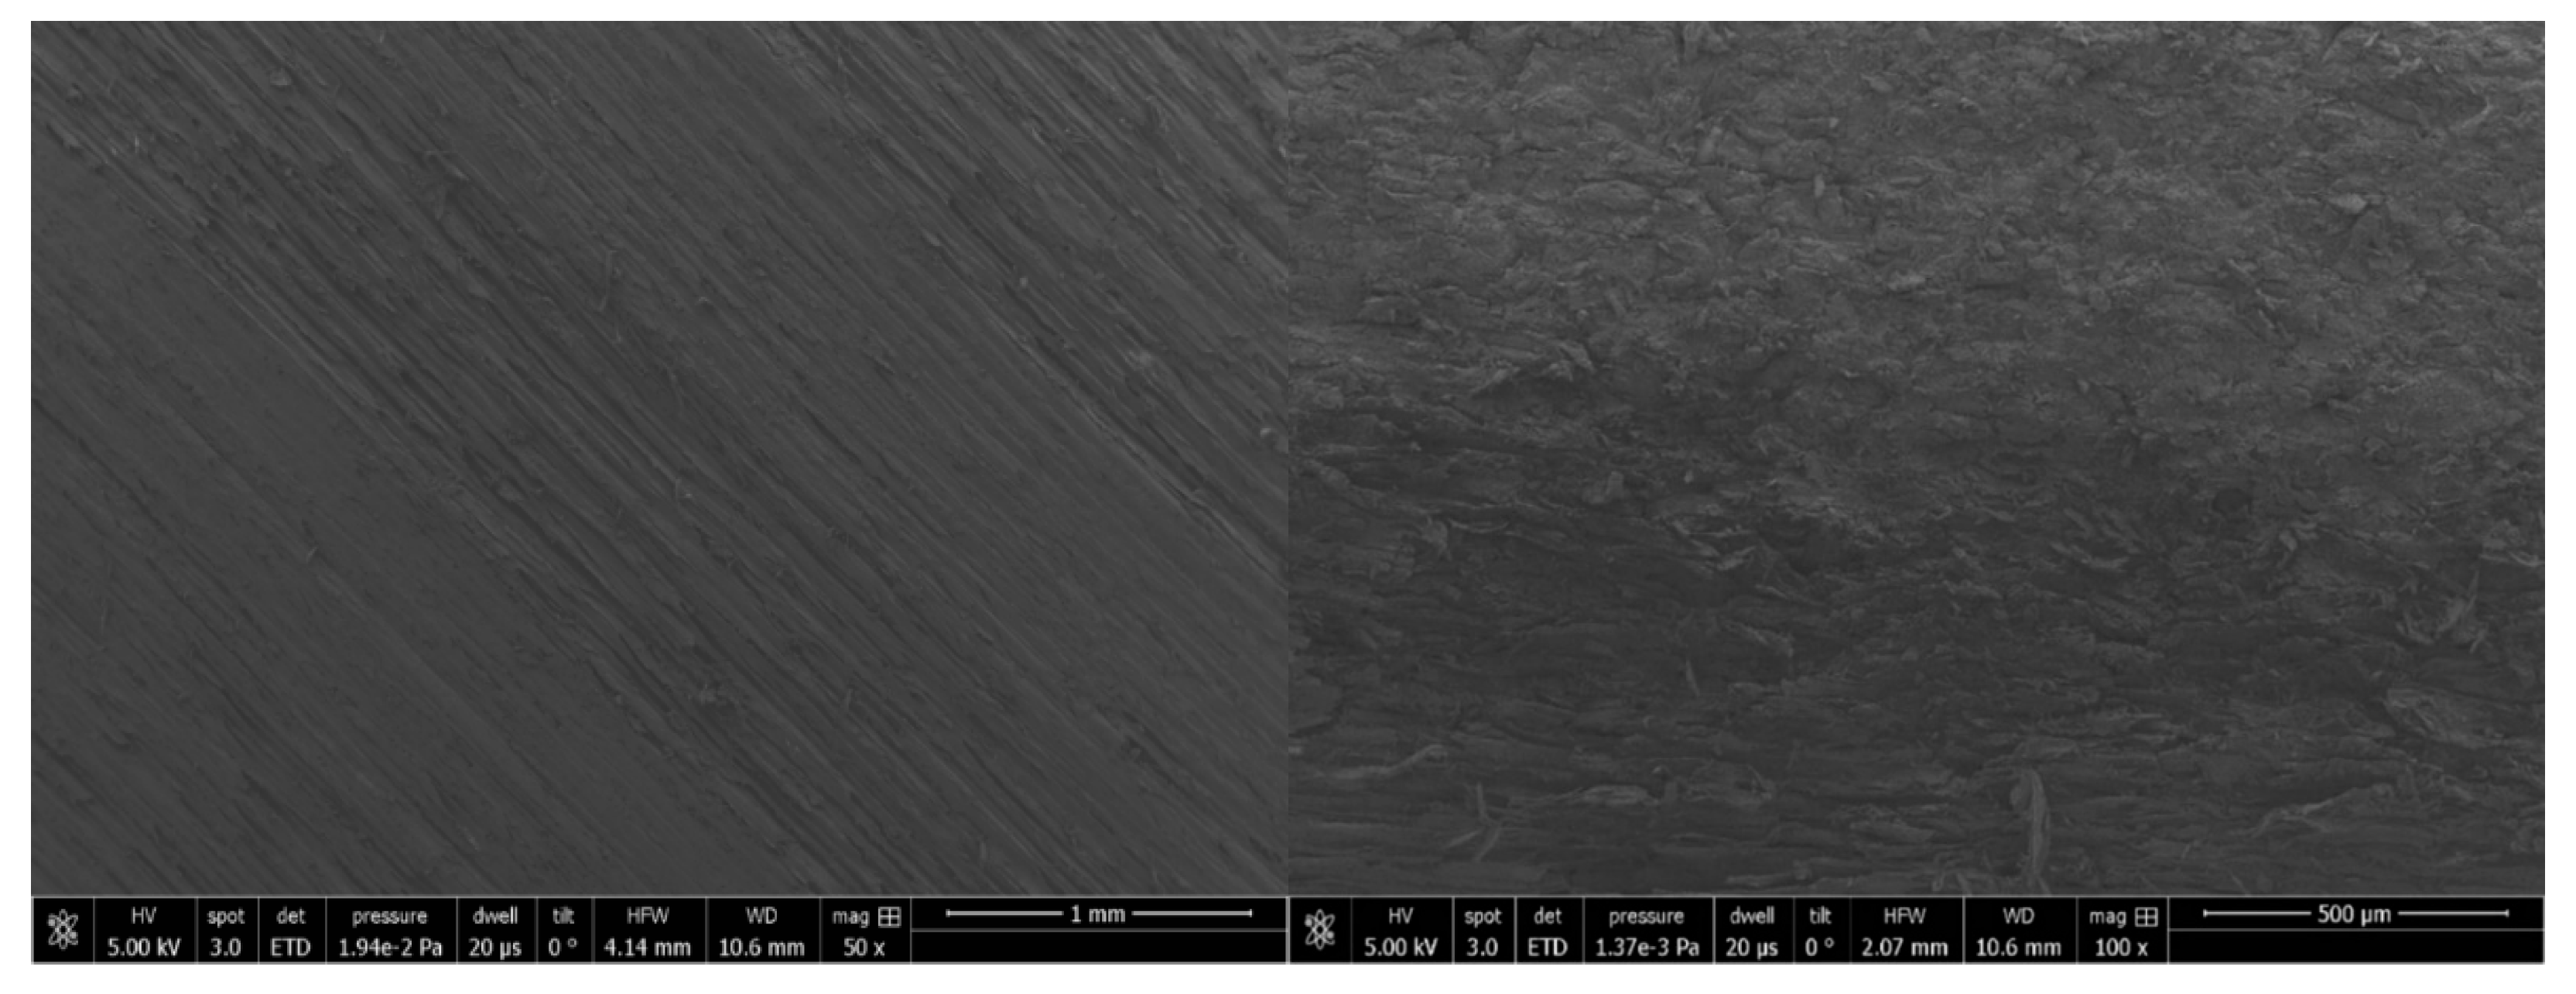
Figure 8.
SEM micrograph of untreated oak wood (50x, left, 500x centre) and of sandblasted oak wood (500x right).
Figure 8.
SEM micrograph of untreated oak wood (50x, left, 500x centre) and of sandblasted oak wood (500x right).
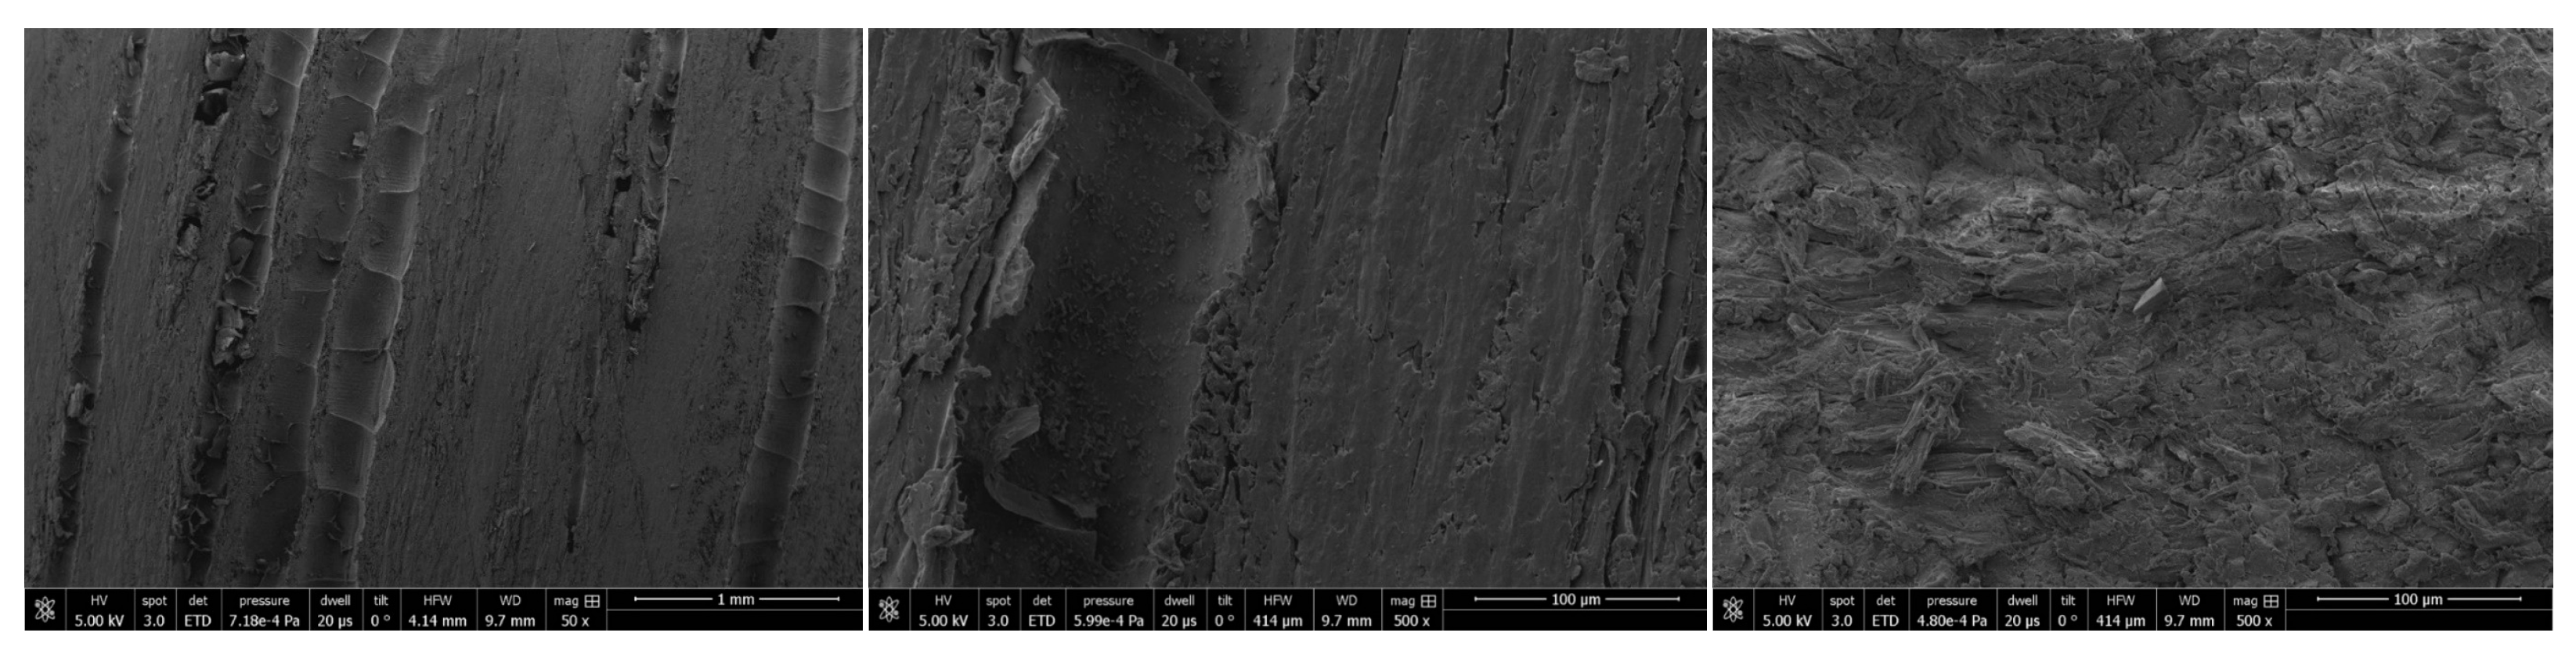
Figure 9.
Penetration depth Pd of the indenter as a function of the load Fn for spruce wood, measured on the radial surface.
Figure 9.
Penetration depth Pd of the indenter as a function of the load Fn for spruce wood, measured on the radial surface.
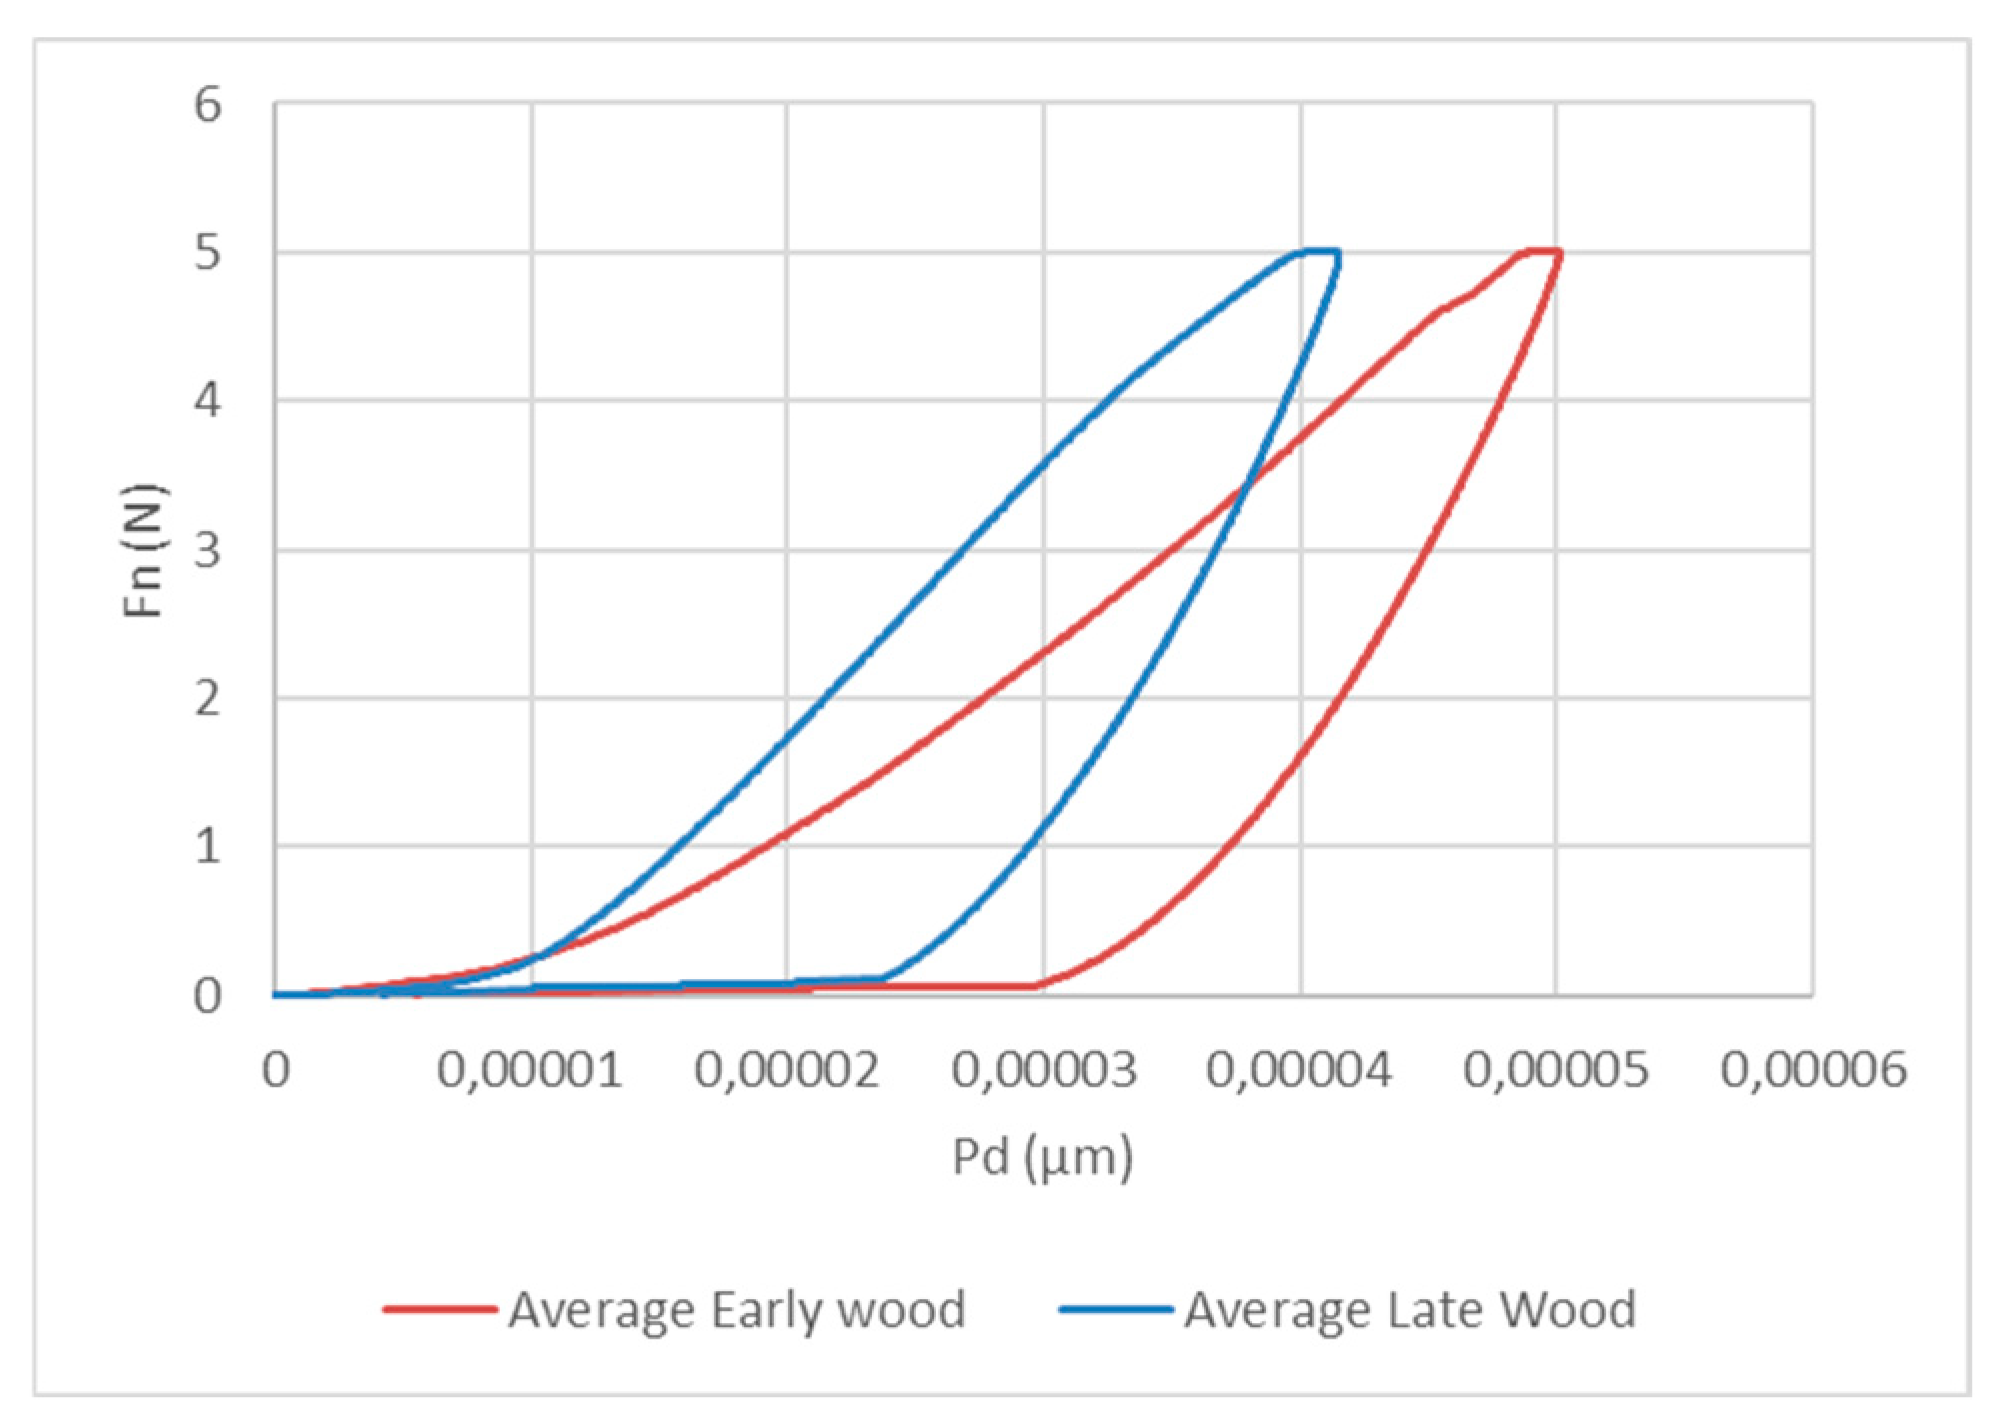
Figure 10.
Correlation plots for the cases with a strong positive correlation (top) and noticeable negative correlation (bottom). .
Figure 10.
Correlation plots for the cases with a strong positive correlation (top) and noticeable negative correlation (bottom). .

Figure 11.
Radial sandblasted greyed 3 spruce wood samples (left) and of tangential sandblasted greyed 3 spruce wood surfaces(right).
Figure 11.
Radial sandblasted greyed 3 spruce wood samples (left) and of tangential sandblasted greyed 3 spruce wood surfaces(right).
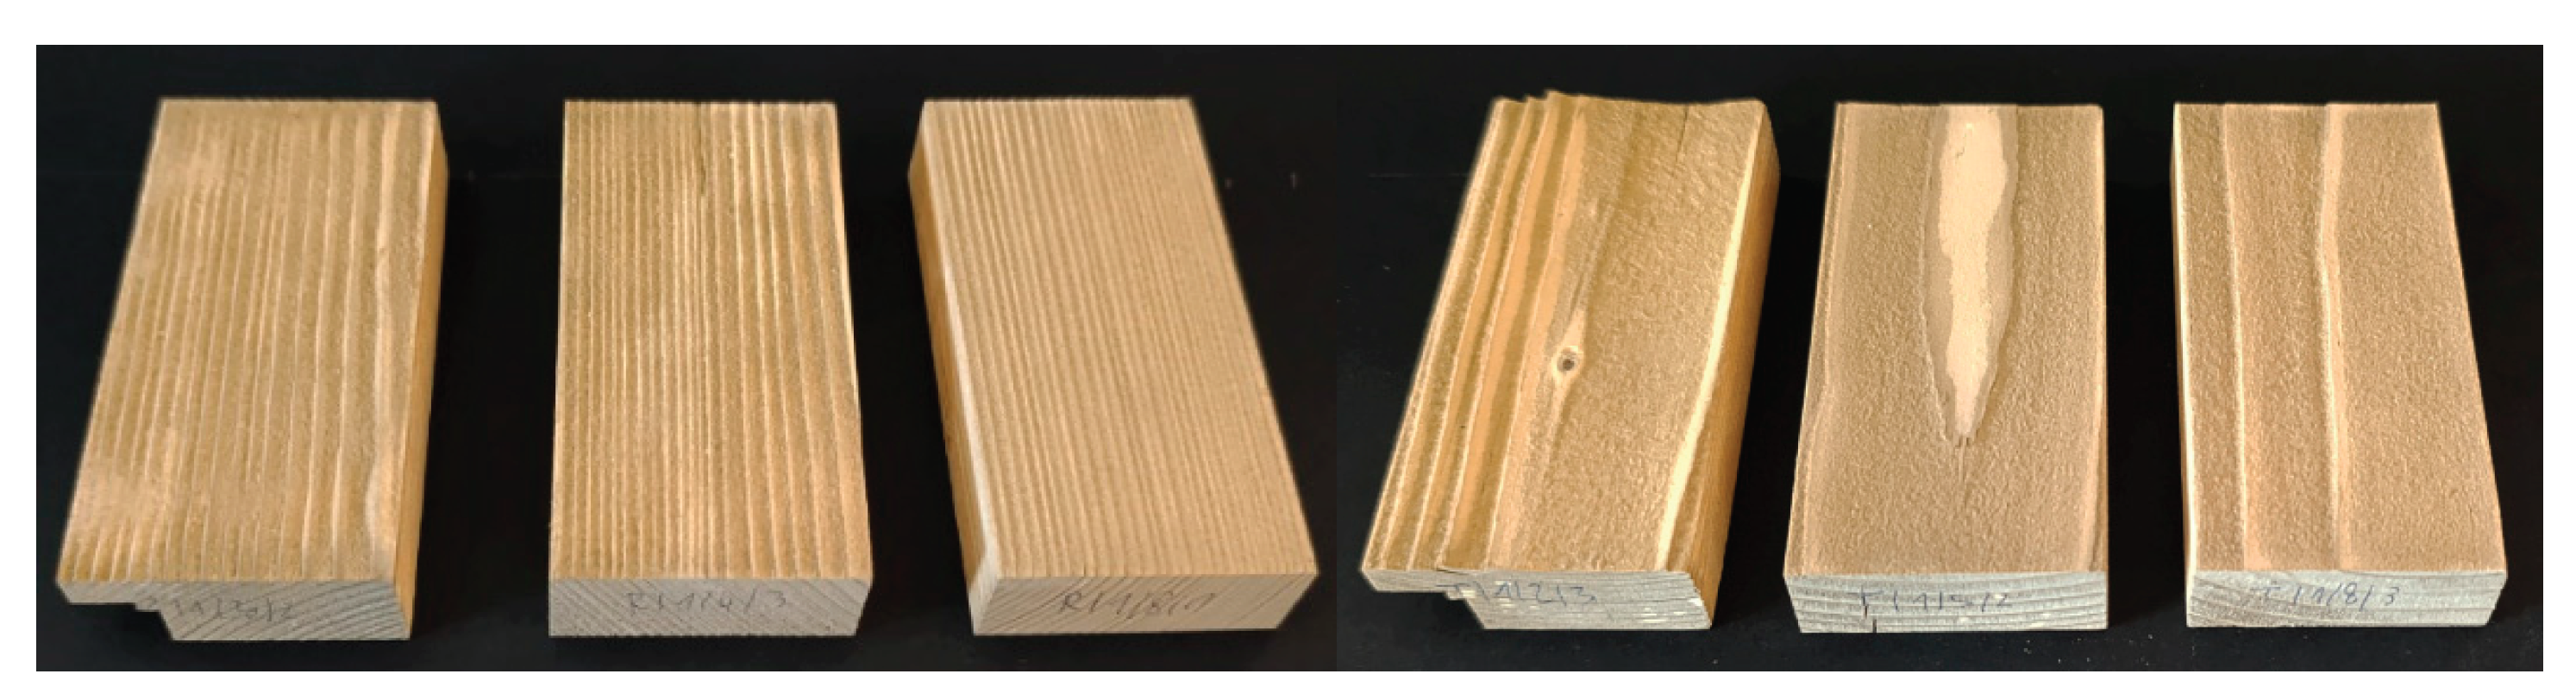
Figure 12.
Radial sandblasted greyed oak wood samples (left) and of tangential sandblasted greyed oak wood surfaces(right).
Figure 12.
Radial sandblasted greyed oak wood samples (left) and of tangential sandblasted greyed oak wood surfaces(right).
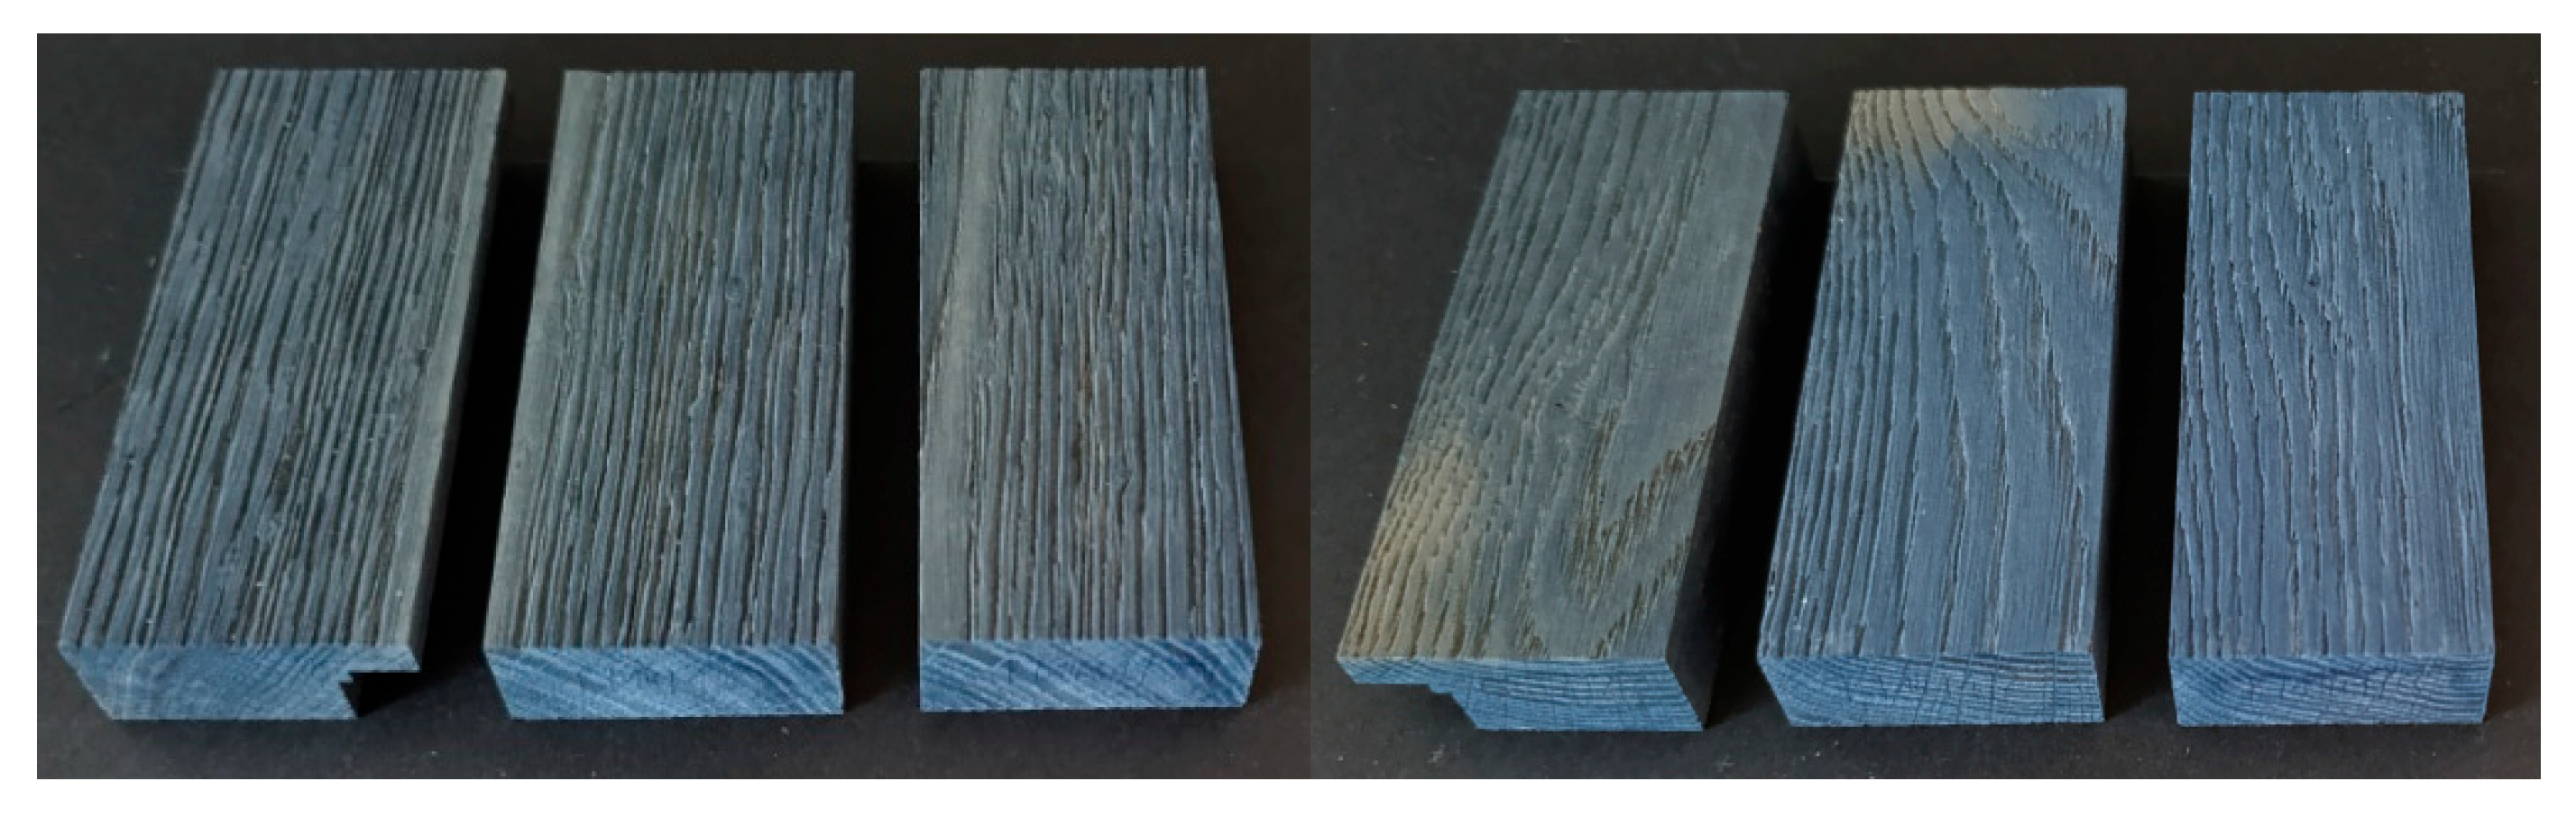
Figure 13.
Radial sandblasted greyed elm wood samples (left) and of tangential sandblasted greyed elm wood surfaces (right).
Figure 13.
Radial sandblasted greyed elm wood samples (left) and of tangential sandblasted greyed elm wood surfaces (right).
Disclaimer/Publisher’s Note: The statements, opinions and data contained in all publications are solely those of the individual author(s) and contributor(s) and not of MDPI and/or the editor(s). MDPI and/or the editor(s) disclaim responsibility for any injury to people or property resulting from any ideas, methods, instructions or products referred to in the content. |
© 2025 by the authors. Licensee MDPI, Basel, Switzerland. This article is an open access article distributed under the terms and conditions of the Creative Commons Attribution (CC BY) license (http://creativecommons.org/licenses/by/4.0/).
Copyright: This open access article is published under a Creative Commons CC BY 4.0 license, which permit the free download, distribution, and reuse, provided that the author and preprint are cited in any reuse.


