Submitted:
30 July 2025
Posted:
06 August 2025
You are already at the latest version
Abstract
Aiming at the problem of interior space design of small recreational vehicle, this paper proposes a functional facility grouping method based on user’s behavior data analysis. Firstly, drawing on the properties of correlation coefficient in statistics, the correlation degree between different functional facilities is defined according to the usage time interval, to establish the correlation degree matrix; and then the correlation degree matrix is proved to be a real symmetric positive-definite matrix; finally, based on the correlation degree matrix, the factor analysis method is adopted for grouping all the functional facilities to maximize the correlation degrees between functional facilities in the same group, and minimize the ones between different groups, so as to better satisfy the users' needs for the convenience and improve the comfort of the drivers and passengers. Theoretical analysis and practice show that the method proposed in this paper is based on rigorous mathematical analysis which can be used as a general theoretical model for grouping functional facilities in small recreational vehicle.
Keywords:
small recreational vehicle
; correlation degree
; factor analysis
; grouping
1. Introduction
With the continuous improvement of people’s pursuit of life quality, leisure traveling has become a fashionable and popular way of life. As a kind of travel carrier with promising development, small recreational vehicle has attracted much attention for its characteristics of free, convenient and economic. Statistical data shows that the comfort and convenience of the recreational vehicle’s interior space are the primary factors that drivers and passengers pay attention to [1,2]; meanwhile, in the whole industry chain of recreational vehicle manufacturing, the design cost of the interior space accounts for about 50~60% of the total price [3,4]. Therefore, research on the design method of recreational vehicle’s interior space plays an important guiding role for manufacturing enterprises to reduce costs and improve users’ satisfaction.
At present, researches on the interior space design of recreational vehicle mainly consist of three fields, including the design method based on spatial scale study, modularization idea and performance constraint theory.
1.1. Design Method Based on Spatial Scale Study
Spatial scale research is based on the theories of ergonomics and design psychology, to establish the recreational vehicle’s interior design solutions by studying the furniture scale, human body scale, physiological scale and psychological scale. Its main design methods include: (1) Ergonomics-based design approaches [5,6,7,8,9]. Drawing on the interior design theories, these methods integrate the interior space of the recreational vehicle by analyzing the human-machine dimensions of the recreational vehicle’s functional facilities, to maximize the utilization of the space. (2) Design methods based on design psychology [10,11,12,13,14]. These approaches establish the evaluation methods of the design scheme from physiological scale and psychological scale of the drivers and passengers, to test the comfort of the initial design scheme with the help of computer simulation, to propose improvement measures. The above approaches explored the design techniques of recreational vehicle’s interior space from different perspectives; however, the correlations between different functional facilities are usually neglected. Therefore, starting from the analysis of the correlations between functional facilities and studying the influence effects on the design results is a new direction for the recreational vehicle’s interior space design.
1.2. Design Method Based on Modularization Idea
Modular design is a green design method that combines the product design elements into subsystems with specific functions, i.e., modules, and then to design product by reasonable modules combinations. The applications of these approaches to the recreational vehicle’s interior space design mainly include: (1) Modular design approaches based on functional requirements analysis [15,16,17,18,19]. The basic principle of these methods is to categorize the users’ requirements of recreational vehicle and based on the classification results, establish the standard module library, to establish the design scheme of recreational vehicle’s interior space by combining the modules. (2) Modular design approaches based on manufacturing processes [20,21,22,23,24]. The basic principle of these methods is to establish the design scheme by analyzing the manufacturing process of the recreational vehicle and merging similar processes of different production lines, to simplify the manufacturing process. It can be seen that the comfort needs of drivers and passengers are usually ignored to a certain extent in the modularized design methods. Therefore, taking the users’ experience as the starting point and exploring the influencing effects on the design scheme of recreational vehicle’s interior space design, can further improve the practicality of the modular design methods.
1.3. Design Method Based on Performance Constraint Theory
Performance constraint theory is mainly used for the design of specific functional facilities. Firstly, it puts forward constraints on the usage performance of the specified functional facilities, and then analyzes the parameters, morphology, and structure of the functional facilities from various perspectives, such as the reasonableness of the spatial dimensions, the convenience of the human- machine interaction, the safety and comfort in the usage process, so as to establish an optimized design scheme [25,26,27,28]. Since the precise quantitative descriptions of the constraints are usually required in the mathematical planning algorithms involved in these methods and the solution process is also complex, it is mainly applicable to the design of simple functional facilities.
1.4. Sketch of the Algorithm
Based on the above researches, this paper proposes a method of grouping all functional facilities based on their correlations for designing the interior space of small recreational vehicle. Firstly, drawing on the quantitative representation of the correlation between random variables in statistics, i.e., the nature of the correlation coefficient, the correlation degree between two functional facilities is defined based on the usage time interval, so as to quantitatively represent the correlation between them; secondly, the correlation degrees of all the functional facilities are formed into the correlation degree matrix, and the matrix can be proved to be a real symmetric positive definite one; next, based on the properties of the correlation matrix, the factor analysis method is adopted to group all the functional facilities, so that the correlations of functional facilities within the same group are as large as possible, and the ones between different groups are as small as possible, so as to better satisfy the users’ needs for the convenience of the functional facilities and improve the users’ comfort in traveling; finally, a case analysis is given to prove the effectiveness of the proposed method.
2. Correlation Degree Between Functional Facilities
In travelling, all the needs of the drivers and passengers are realized by operating or using a series of functional facilities inside the recreational vehicle. Considering the convenience of realizing the user’s different needs, the functional facilities for realizing specific needs should be arranged relatively centralized, i.e., the layout scheme of the recreational vehicle’s interior should be designed with reference to the correlations of functional facilities. Therefore, drawing on the quantitative description of correlation between random variables in statistics, this paper begins by defining the correlation degree between two different functional facilities.
In statistics, the correlation between two random variables X and Y can be described by their correlation coefficient ρXY, which has the following basic properties: [29,30]
(1) Normality.
For the random variables X and Y, the correlation coefficient ρXY satisfies -1 ≤ ρXY ≤ 1, where its absolute value |ρXY | reflects the correlation degree between X and Y.
(2) Symmetry.
The correlation coefficient between random variables X and Y is equal to the one between Y and X, i.e., ρXY = ρYX.
It follows that the quantitative definition to characterize the correlation between different functional facilities inside recreational vehicle should satisfy the two properties of the correlation coefficient in statistics.
From the perspective of users’ behavior, drivers and passengers generally need to use multiple functional facilities sequentially in order to satisfy their specific needs during a trip. For different functional facilities, the usage time intervals can indicate the correlations between them. Therefore, the usage time interval could be adopted to quantitatively describe the correlation between two functional facilities.
Let xi and xj be two different functional facilities, and the usage time for xi and xj are ti and tj, then the usage time interval between xi and xj is defined as:
It is evident that ΔTij meets the properties of symmetry, but not normality. Thus, ΔTij could be normalized by considering the total duration of the trip. That is, assuming the total duration of the trip is T, then the standardized time interval can be defined as follows:
It can be seen that the standardized usage interval satisfies both symmetry and normality. At the same time, decreases as the correlation between xi and xj increases. In order to be consistent with the statistical connotation of correlation coefficient, can be further amended as the following definition.
Correlation degree of two functional facilities:Let xi and xj be two functional facilities inside recreational vehicle. During the trip, the usage time of xi and xj are ti and tj, and the duration of the trip is T, then the correlation degree σij between xi and xj is defined as:
3. Positive Characterization of the Correlation Matrix
The correlation degree σij defined by Equation (3) provides a quantitative description of the relevance between two different functional facilities. Combining all the functional facilities two by two and calculating the corresponding correlation degrees, the correlation degree matrix Σ can be constructed as follow:
For the correlation degree matrix Σ, the following theorem holds:
Symmetry and positive definiteness of the correlation degree matrix: The correlation degree matrix Σ is a real symmetric positive definite matrix.
First prove the symmetry of Σ.
Denote all the functional facilities inside recreational vehicle as the vector X = (x1, x2, …, xn) T. From Equations (3) and (4), the correlation degree matrix Σ can be written as:
By the definition of the time interval ΔTij in equation (1), we know that Σ is a symmetric matrix.
The following proves the positive definiteness of Σ.
Let a n-dimensional vector c = (c1, c2, …, cn) T ≠ 0.
Substituting Equation (5) into Equation (6), after simplifying and combining, we get:
Let the random variable, bringing it into Equation (7), we get
The definition of the time interval ΔTij shows that , and hence z ≠ 0, i.e.,
The above equation shows that Σ is a positive definite matrix. In summary, the correlation degree matrix Σ is a real symmetric positive definite matrix.
4. Functional Facilities Grouping Model
Based on the definition of correlation degree, all functional facilities can be grouped so that the correlation degrees within the same group are as large as possible, and the ones between different groups are as small as possible, so that the design solution can fully satisfy the users’ needs for convenience.
4.1. Factor Analysis
Factor analysis is a method of grouping components based on the correlations between them with reference to the covariance matrix of a random vector. The basic model of factor analysis method is as follows [31,32].
- (1).
- X = (x1, x2, …, xn)T is an observable random vector with covariance matrix Σ.
- (2).
- The common factor vector F = (F1, F2, …, Fm) (m<n) is an unobservable random vector with mean vector E(F) = 0 and covariance matrix D(F) = I, i.e., the components in the common factor vector F are independent of each other.
- (3).
- The error vector ε = (ε1, ε2, …, εn) Tis independent of the common factor vector F with mean vector E(ε) = 0, and its covariance matrix Σε is diagonal, i.e.:
Under the above conditions, the system of Equation (9) is called the factor analysis model.
Express the system of Equation (9) in matrix:
where the element aij in A=(aij)n×m is called the factor loading, and its absolute value indicates the dependence degree between the component xi and the common factor Fj. The matrix A formed by all the factor loadings is called the factor loading matrix.
Calculating the covariance matrix for each end of equation (10) gives:
On the other hand, the proved theorem in section 3 shows that Σ is a real symmetric positive definite matrix, for which the Cholesky decomposition [33,34] is performed:
where , λi (i=1, 2, …, n) are the eigenvalues of the covariance matrix Σ, and λ1>λ2>… >λp, ei is the eigenvector corresponding to λi.
Comparing Equations (11) and (12) shows that the error vector ε = 0 in Equation (10) when A = G, and the resulting factor analysis model is accurate. However, an exact factor analysis model implies that in the random vector X = (x1, x2, …, xn) T, the components will be divided into n groups, i.e., an exact factor analysis model can be obtained only when the correlations between all the components in X are completely ignored. In general, it is necessary to retain most of the correlations between the components, in which case the first m (m<n) columns in G can be used as an approximation of the factor loading matrix A, i.e.,:
When building the factor analysis model based on the factor loading matrix derived from Equation (13), the error vector ε ≠ 0, which means that there must be a certain amount of information loss when grouping the components in X based on Equation (10).
4.2. Error Analysis
In statistics, the total amount of information contained in a random variable is generally measured by its variance [35,36]. In Equation (10), let A = G, which gives the sum of the variances of the components in X under the exact decomposition condition:
Equation (14) shows that under the condition of exact decomposition, the sum of the information contained in X is equal to the cumulative sum of all the eigenvalues of X’s covariance matrix Σ.
The factor analysis model is then built from the approximation of matrix A shown in Equation (13), which is obtained from Equation (10):
Comparing Equations (14) and (15) shows that under imprecise conditions and ignoring the correlations of the components between different groups, the sum of the information loss caused by grouping the components in X with Equation (10) is . Thus, for a specified error β, the number of groupings m can be determined by the following inequality:
where η is called the cumulative variance contribution of the first m eigenvalues. In the empirical case, the number of groupings m can be determined from inequality (16) when η > 80%~ 85%. The value of η can be reasonably adjusted in combination with specific applications, but the basic principle of adjustment is that it should be conducive to the reasonable interpretation of the factor analysis model.
4.3. Grouping Model Based on Factor Analysis
To summarize, all the functional facilities inside recreational vehicle are denoted as the vector X = (x1, x2, …, xn) T, which can be grouped based on its correlation degree matrix in the following steps.
- (1)
- Record the usage time ti (i = 1, 2, …, n) spent by users on functional facility xi.
- (2)
- Calculate the correlation degrees between different functional facilities based on equation (3), and then construct the correlation degree matrix Σ.
- (3)
- Calculate the eigenvalues of Σ and arrange all the eigenvalues in descending order as λ1>λ2>…>λn.
- (4)
- Calculate the eigenvector ei corresponding to the eigenvalue λi (i = 1, 2, …, n).
- (5)
- For the given error β, calculate the number of eigenvectors m for constructing the factor loading matrix according to Equation (16), and then construct the factor loading matrix A from the first m eigenvectors according to Equation (13).
- (6)
- Grouping of all the functional facilities according to Equation (10).
5. Case Analysis
CCHW-Weiman recreational vehicle is a self-propelled recreational vehicle designed by Lanzhou Lanshi Group on the basis of the special chassis of SAIC Datsun V80, which can be used for 6 people to live and travel. The recreational vehicle contains 14 functional facilities: beds, stoves, sofas, ventilation windows, hanging cabinets, sinks, showers, refrigerator, cupboards, toilet, dressing mirror, storage cabinet, standing cabinets and parlor table, which are denoted as X = (x1, x2, …, x14) T.
Based on a 300-minute travel, the usage time of the functional facilities inside the recreational vehicle by 20 groups of drivers and passengers are recorded to calculate the usage time interval. The average usage time intervals between different functional facilities are shown in Table 1.
Based on the data in Table 1, the correlation degree matrix Σ for all the functional facilities is calculated according to Equation (3), and then the eigenvalues and eigenvectors of Σ are calculated. All the eigenvalues are sorted in descending order, and the cumulative variance contribution of the first m (m<14) eigenvalues are calculated. The first four eigenvalues, eigenvectors and cumulative variance contributions are listed in Table 2.
From Table 2, it can be seen that the cumulative variance contribution of the first three eigenvalues is 97.99%, so let m=3 and the factor loading matrix is constructed according to equation (13), which in turn creates a system of transformation equations according to equations system (9).
As can be seen from the transformation equations, x1,x4,x5,x7,x10,x11,x13 have a greater dependence on the common factor F1, so they are categorized into a group. Functional facilities in this group are mainly used for user’s living and washing, and constitutes the living and washing area; x3,x14 are more dependent on the common factor F2, which are divided into another group to form the recreation area; finally, the remaining facilities x2,x6,x8,x9,x12 are divided into another group. This group of functional facilities is primarily used for cooking and dining while traveling and constitutes the dining and kitchen area. The final grouping results are shown in Table 3.
In the grouping results shown in Table 3, the first group has the more functional facilities. Considering that the passengers will usually need washing after sleeping, the functional facilities of the first group are further divided into the living area and the washing area, in which the functional facilities of the living area are beds, hanging cabinets, dressing mirror and standing cabinets, while the washing area consists of ventilator windows, showers, and toilet. The final results of functional facilities grouping are shown in Table 4.
Since the functional facilities in living area and washing area are highly correlated, they are set up as adjacent areas in the space layout. On the other hand, in order to further improve the passenger capacity and space utilization of the small recreational vehicle, the upper part of the driving area is designed as an additional resting area, which can provide a resting space for 1~2 people. The final interior space design scheme is shown in Figure 1.
Light gray is used as the main color and dark gray as the accent color of the interior space, to establish the rendering graph of the interior space of CCHW-Weiman, as shown in Figure 2.
6. Conclusions and Discussion
For the problem of interior space design of small recreational vehicles, this paper proposes a grouping method of functional facilities in recreational vehicles based on the user’s behavior dada analysis. Compared with the present design methods, the method proposed in this paper has the following advantages:
(1) Fully satisfy the user’s need for convenience in terms of functional facilities.
The method proposed in this paper is based on the behavioral data analysis of drivers and passengers, and aims to improve the convenience of the use of functional facilities during travelling, while the design method based on spatial scale study focus on maximize the space utilization, and the design method based on modularization idea mainly to reduce the manufacturing costs. Therefore, the method proposed in this paper can fully satisfy the driver’s need for convenience of functional facilities.
(2) Better generality.
Compared with the design method based on the performance constraint theory, the solution process of the proposed method is simple and avoids the limitation that the design method based on the performance constraint theory is only applicable to the design of simple functional facilities due to the complex calculation. Therefore, the proposed method can be used as a general theoretical model for the interior space design of small recreational vehicles.
The definition of the correlation degree of functional facilities in this paper is based on the usage time interval between different facilities, and therefore the proposed design method aims to improve the convenience of functional facilities. Considering that different functional facilities are also related in terms of material, structure and manufacturing process, if these factors are included in the definition of the correlation degree of the functional facilities, the convenience of using the functional facilities can be improved while optimizing the manufacturing process and manufacturing cost. We will study this issue in depth in our later work.
Author Contributions
Conceptualization, Q.N.; Methodology, Q.N. and S.C.; Resources, Z.Q.; Writing—original draft, Q.N.; Supervision, Z.Q.; Project administration, Q.N. and S. C.; funding acquisition, Q.N and S.C. All authors have read and agreed to the published version of the manuscript.
Funding
This research was funded by the humanities and social sciences enhancement special fund of Lanzhou Jiaotong university with grant number RW24A005.
Data Availability Statement
Data are contained within the article.
Acknowledgments
Lanzhou Lanshi Group Automobile Design Center provided detailed recreational vehicle design drawings for this research, we hereby thank them for the technical aids.
Conflicts of Interest
The authors declare no conflict of interest.
References
- Florin, B. ; Nicolae, V, B.; Lucian, F, T.; et al. Improving electric vehicle arrange and thermal comfort through an innovative seat heating system. Sustainability, 2023: 15, 5534. [Google Scholar]
- Berg, J.; Henriksson, M. ; Ihlstrom.; et al. Comfort first! Vehicle-sharing systems in urban residential areas: The importance for everyday mobility and reduction of car use among pilot users. Sustainability. 2019, 11: 2521. [Google Scholar]
- Nagl.; Kurt. Auto suppliers cut costs as vehicle output slows: Companies reduce manufacturing capacity, headcount amid uncertainty. Crain’s Detroit Business 2024, 45: 1.
- Tawan, C.; Peerawat, S.; Nuwong, C.; et al. Total cost of ownership (TCO) analysis of electric vehicle in ASEAN. Energy. Sustain. Dev. 2025, 85: 101650. [Google Scholar]
- Nade, L.; Ashima, K. ; Brandon, J, P.; et al. Understanding older adults’ needs for and perceptions of shared autonomous vehicle interior features: A focus group and user enactment study. Appl. Ergon. 2025, 123: 104408. [Google Scholar]
- Ksander, N, W.; Tugru, l I.; Riender, H. et al. Standards for passenger comfort in automated vehicles: Acceleration and jerk. Appl. Ergon. 2023, 106: 103881.
- Brischetto, A.; Lotti, G.; Tosi, F. Ergonomics in design: The human-centred design approach for developing innovative motor recreational vehicle systems. Advances in Intelligent Systems and Computing, 2019: 824, 1066. [Google Scholar]
- Liu, Z, M.; Chen, X, H.; Liang, X, A. Growable design of passenger vehicle interior space based on FAHP and FQFD. 2024, PloS one. 19: e0303233.
- Salami, B, S.; Siti, A, B.; Azizan, A.; et al. An ergonomics study and rapid upper limb assessments (RULA) for a car interior to support limb disabled drivers. Journal of Management Science & Engineering Research 2022, 2:17-30.
- Yang, Q, X.; Ai, M, C.; Tong, X, Y.; et al. Demands exploration of future interior layout in shared mobility using design fiction. Lecture Notes in Networks and Systems. 2021, 276:259-267.
- Koo, S. An observation on alterations of usability in automobile interior design with autonomous driving technology escalation. Transactions of the Korean Society of Automotive Engineers, 2019, 27: 693-700.
- Stefan, J, B.; Stella, C. A theoretical framework of haptic processing in automotive user interfaces and its implications on design and engineering. Front Psychol, 2019: 10, 1470.
- Sun, X. Research on architectural interior space design based on design psychology. Psychol. Rep. 2024, 127: 253-254.
- Zhang, X, N.; Wang, X, Y.; Xu, W, A. Research on user demands and functional design of an AR-based interior design and display platform for recreational vehicles. Appl. Sci, 2024: 14, 1056.
- Zhang, Z, N.; Zhuge, X.; Li, X.; et al. An object-oriented approach to the modular design of mechatronic systems. IEEE. Trans. Eng. Manag. 2024, 71: 2623-2639.
- Li, Z, C.; Bao, C, J.; Li, R, H.; et al. Design research of scenic camp construction vehicle based on function analysis method. Journal of Machine Design, 2022, 39:129-137.
- Fu, M. ; Hao, Y, L.; Gao, Z, F., Ed.; et al. User-driven: A product innovation design method for a digital twin combined with flow function analysis. Processes. 2022, 10: 2353. [Google Scholar]
- Liu, F. ; Jing, Y, C.; Shao, P.; et al. Research on design method of product functional hybridization for integrated innovation. Appl. Sci, 1: 12, 1030. [Google Scholar]
- Yu, F. ; Jia, X, C.; Zhao, X, W.; et al. A method for inspiring radical innovative design based on cross-domain knowledge mining. 2024, Systems. 2022, 12: 102.
- Mollajan, A. ; Thomson, V, J; Iranmanesh, S, H. Engineering management and modular design: A path to robust manufacturing processes. 2025, Processes. 13: 160.
- Darwish, A. ; Elgenedy, M, A.; Williams, B, W. A review of modular electrical sub-systems of electric vehicles. 2024, Energies. 17: 3474-3503.
- Xu, W, B.; Ma, X, J.; Jin, Y. A modular mathematical modeling method for smart deign and manufacturing of automobile driving axles. J. Circuit. Syst. Comp, . 2024, 33: 1-17.
- Davood, O. ; Seyed, M, S.; Ali, B, A., Ed.; et al. A sustainability approach to vehicle modular platform design: A mathematical model. Proc. Inst. Mech. Eng. E. J. Process. Mech. Eng. 2022, 236: 2296-2310. [Google Scholar]
- Santiago, M, Z.; Nathalie, K.; Cristovao, S.; et al. Multi-agent system for perturbations in the kitting process of an automotive assembly line. Eng. Appl. Artif. Intell, 2024: 135, 1086.
- Ganesh, S. ; Phi, R, T.; Aybike, O. Development of a parametric packaging and sizing tool for autonomous electric bus system. Proc. Inst. Mech. Eng. D. J. Automob. Eng, 2021: 235, 1713. [Google Scholar]
- Lv, T, T.; Wang, D, F.; Du, X, J. Dual-scale parametric modeling and optimal design method of CFRP automotive roof beam. Compos Struct, 2023: 308, 1166.
- Yuki, S. Efficiency optimization design that considers control of interior permanent magnet synchronous motors based on machine learning for automotive application. IEEE. Access. 2023, 11: 41-49.
- Song, W, F.; Xie, X, Z.; Huang, W, Y.; et al. The design of automotive interior for Chinese young consumers based on Kansei engineering and eye-tracking technology. Appl. Sci-Basel. 2023, 13, 1067.
- Zhou, X, Y.; Lin, M, W.; Wang, W, W. Statistical correlation coefficients for single-valued neutrosophic sets and their applications in medical diagnosis. AIMS. Math. 2023, 8: 16340-16359.
- Zhang, J.; Yu, X. ; Deng, S, M.; et al. Estimation of correlation coefficient with monotone transformation and multiplicative distortions. Commun. Stat – Theor. M. 2025, 54: 1-33.
- Sardarabadi, A, M. Complex factor analysis and extensions. IEEE. T. Signal. Proces. 2018, 66: 954-967.
- Forni, M.; Hallin, M.; Lippi, M.; et al. Dynamic factor models with infinite-dimensional factor space: Asymptotic analysis. J. Econom. 2017, 199: 74-92.
- Elías, D, N.; Dylan, S, C, A.; Giuliano, R, F, Q.; et al. Statistical package for computing precision covariance matrices via modified Cholesky decomposition. SoftwareX. 2025, 30: 10, 2125.
- Deliang, D.; Chengcheng, H.; Shaobo, J.; ea, al. Regularized estimation of Kronecker structured covariance matrix using modified Cholesky decomposition. J. Stat. Comput. Simul. 2025, 95: 905-930.
- Yang, J, S.; Wan, Z, Q.; Hector, J. An efficient strategy for information reuse in probability density evolution method considering large shift of distributions with multiple random variables. Probabilist. Eng. Mech, 2025: 79, 103728.
- Yannick, R.; Carolin, S. Identifying informative predictor variables with random forests. J. Educ. Behav. Stat. 2024, 49: 595-629.
Figure 1.
Interior space layout of CCHW-Weiman recreational vehicle.
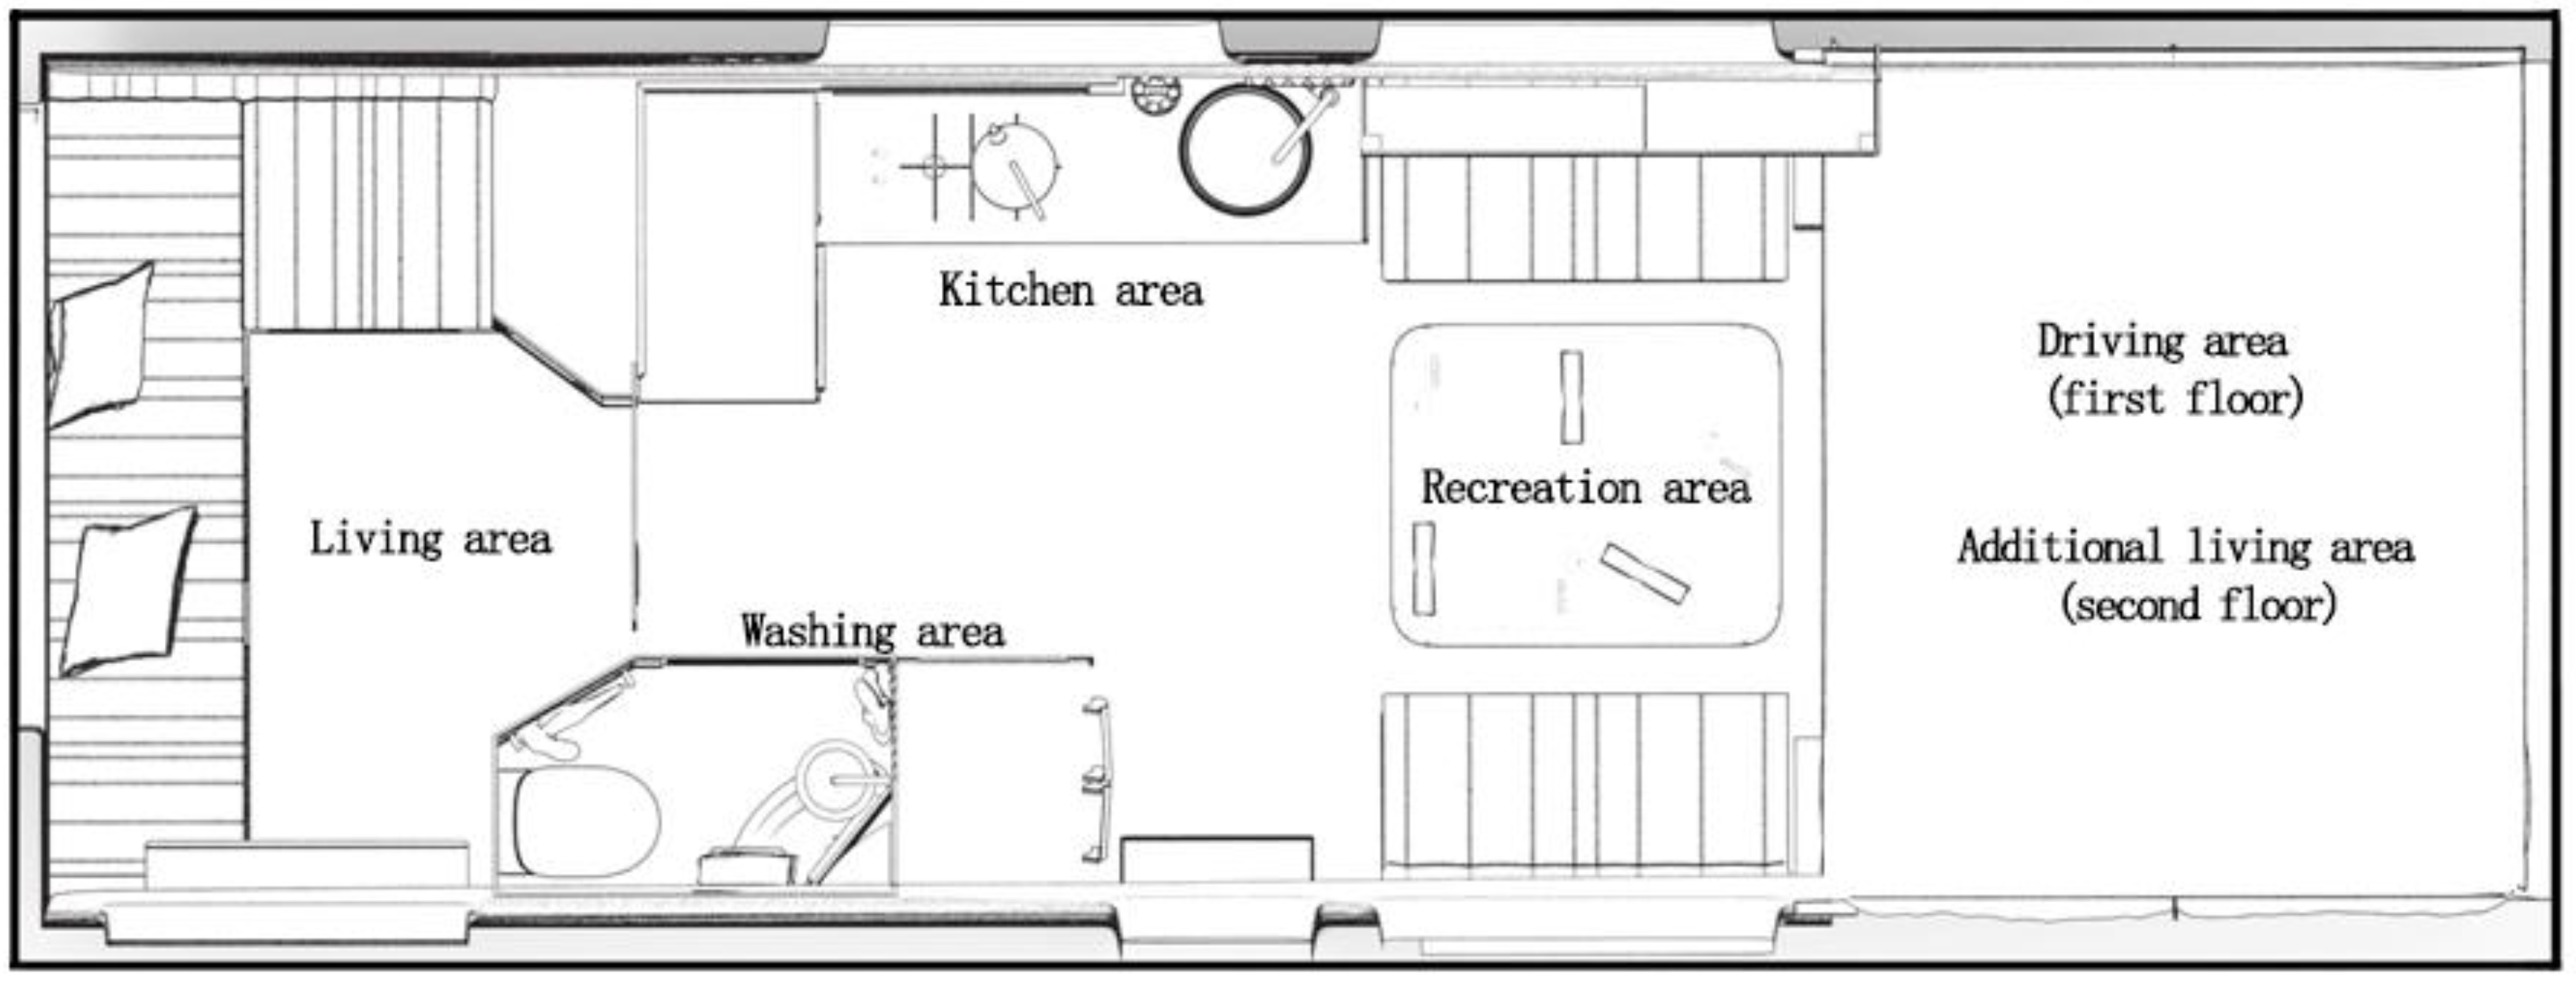
Figure 2.
Rendering graph of interior space of CCHW-Weiman recreational vehicle.
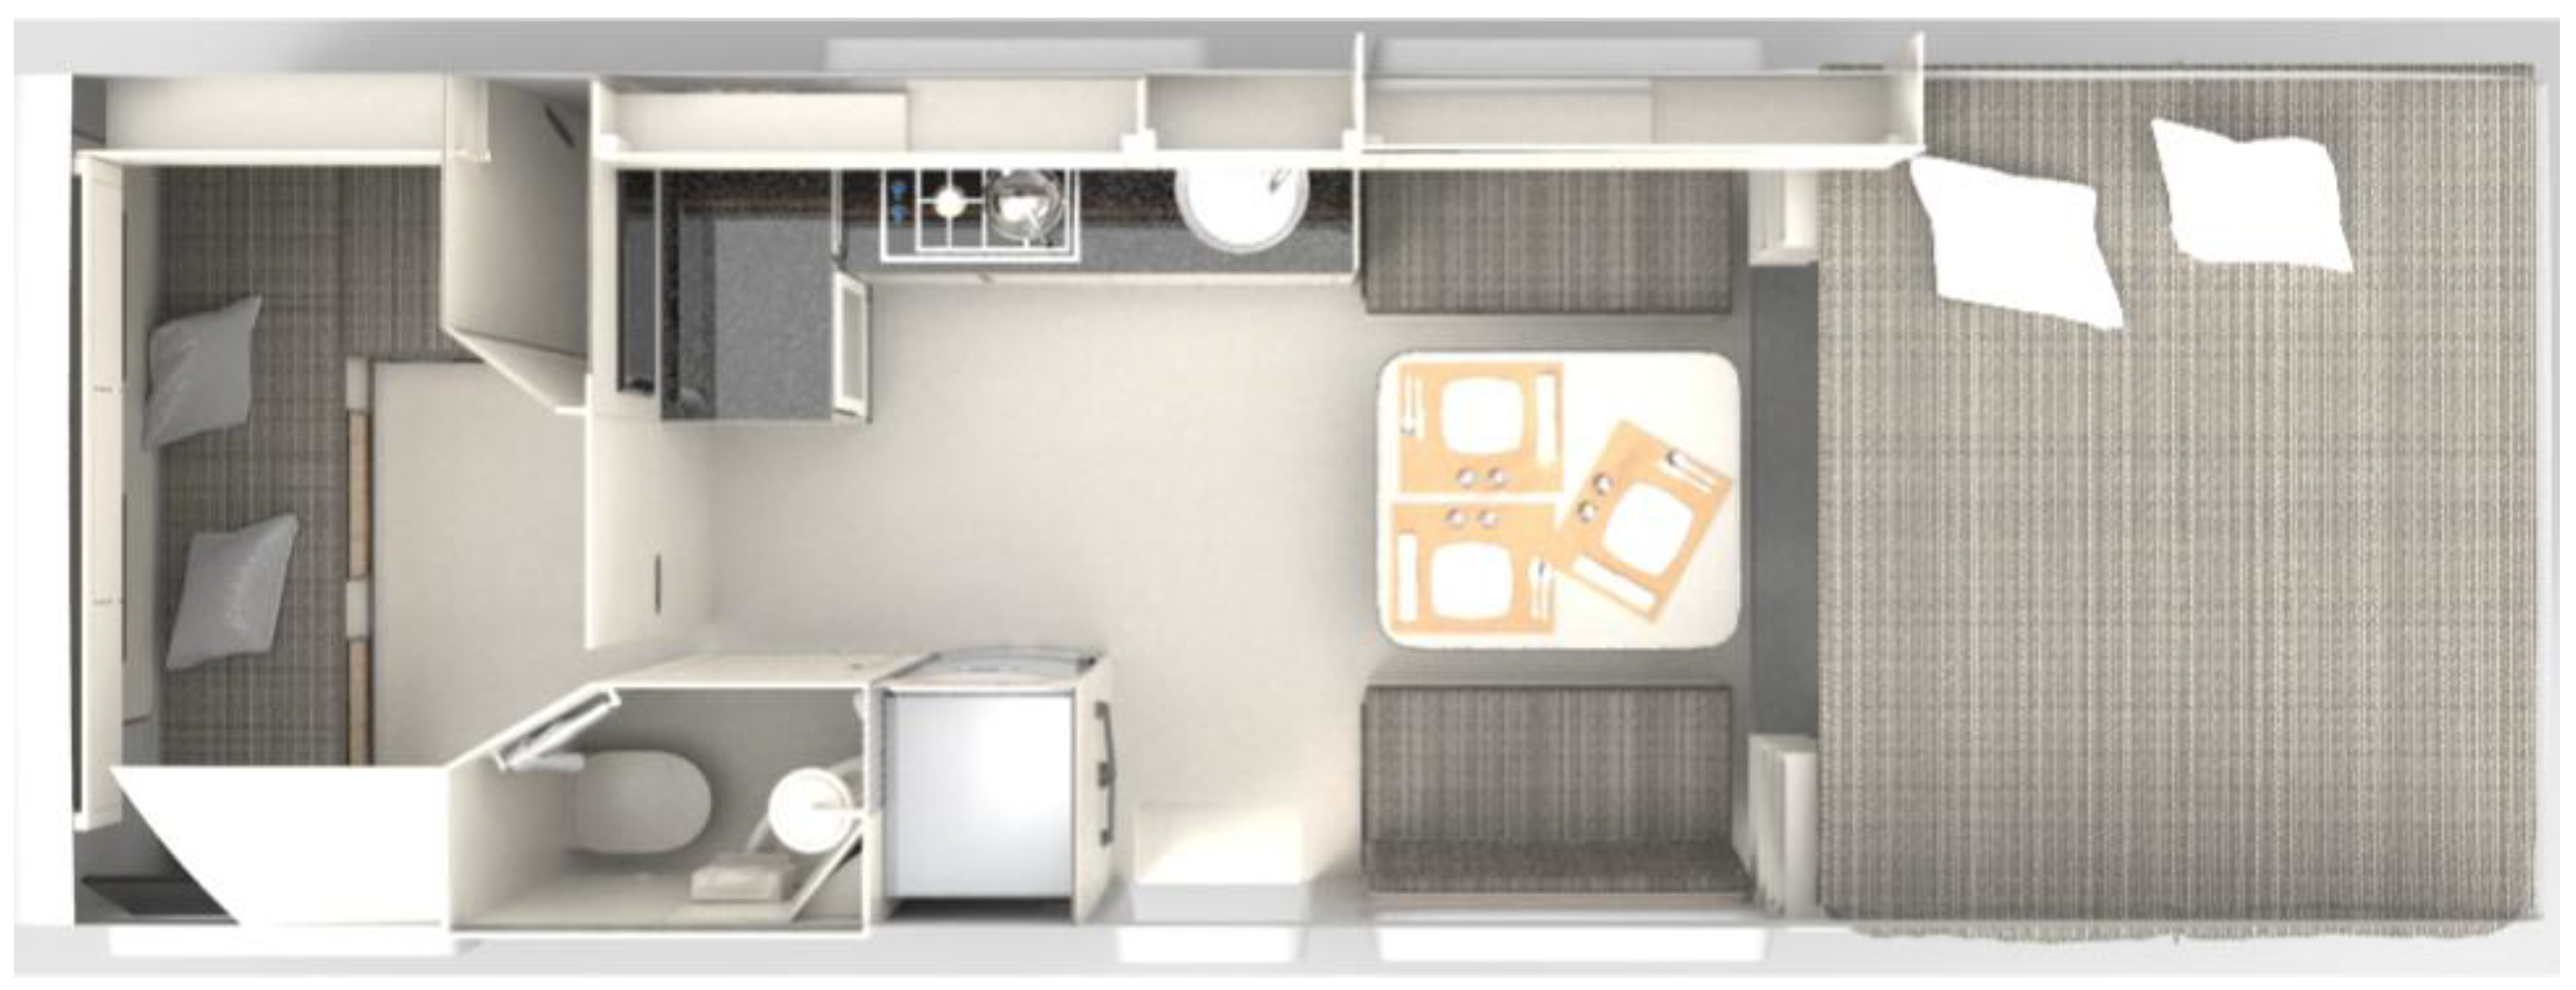

Table 1.
The average usage time intervals between different functional facilities (unit: min).
| x1 | x2 | x3 | x4 | x5 | x6 | x7 | x8 | x9 | x10 | x11 | x12 | x13 | x14 | |
|---|---|---|---|---|---|---|---|---|---|---|---|---|---|---|
| x1 | 0 | 225 | 280 | 2 | 5 | 210 | 15 | 205 | 208 | 10 | 25 | 215 | 8 | 282 |
| x2 | 225 | 0 | 55 | 223 | 220 | 15 | 210 | 20 | 17 | 215 | 200 | 10 | 217 | 57 |
| x3 | 280 | 55 | 0 | 278 | 275 | 70 | 265 | 75 | 72 | 270 | 255 | 65 | 272 | 2 |
| x4 | 2 | 223 | 278 | 0 | 3 | 208 | 13 | 203 | 206 | 8 | 23 | 213 | 6 | 280 |
| x5 | 5 | 220 | 275 | 3 | 0 | 205 | 10 | 200 | 203 | 5 | 20 | 210 | 3 | 277 |
| x6 | 210 | 15 | 70 | 208 | 205 | 0 | 195 | 5 | 2 | 200 | 185 | 5 | 202 | 72 |
| x7 | 15 | 210 | 265 | 13 | 10 | 195 | 0 | 190 | 193 | 5 | 10 | 200 | 7 | 267 |
| x8 | 205 | 20 | 75 | 203 | 200 | 5 | 190 | 0 | 3 | 195 | 180 | 10 | 197 | 77 |
| x9 | 208 | 17 | 72 | 206 | 203 | 2 | 193 | 3 | 0 | 198 | 183 | 7 | 200 | 74 |
| x10 | 10 | 215 | 270 | 8 | 5 | 200 | 5 | 195 | 198 | 0 | 15 | 205 | 2 | 272 |
| x11 | 25 | 200 | 255 | 23 | 20 | 185 | 10 | 180 | 183 | 15 | 0 | 190 | 17 | 257 |
| x12 | 215 | 10 | 65 | 213 | 210 | 5 | 200 | 10 | 7 | 205 | 190 | 0 | 207 | 67 |
| x13 | 8 | 217 | 272 | 6 | 3 | 202 | 7 | 197 | 200 | 2 | 17 | 207 | 0 | 274 |
| x14 | 282 | 57 | 2 | 280 | 277 | 72 | 267 | 77 | 74 | 272 | 257 | 67 | 274 | 0 |
Table 2.
The first four eigenvalues, eigenvectors and cumulative variance contributions.
| No. | Eigenvalue | Eigenvector | Cumulative variance contribution |
| 1 | 8.42 | (0.28,0.25,0.19,0.28,0.29,0.27,0.29,0.27,0.27,0.29,0.29,0.26,0.28,0.18)T | 60.11% |
| 2 | 4.73 | (-0.25,0.28,0.33,-0.25,-0.25,0.27,-0.23,0.26,0.27,-0.24,-0.21,0.27,-0.25,0.32)T | 93.93% |
| 3 | 0.54 | (0.04,-0.11,0.59,0.04,0.05,-0.27,0.04,-0.28,-0.28,0.05,0.03,-0.22,0.05,0.60)T | 97.99% |
| 4 | 0.12 | (-0.41,-0.05,-0.01,-0.36,-0.23,-0.01,0.34,0.01,-0.01,0.06,0.72,-0.03,-0.06,-0.01)T | 98.59% |
Table 3.
Results of functional facilities grouping.
| Grouping results | Functional area | Functional facilities |
|---|---|---|
| Group 1 | Living and washing area | beds, ventilation windows, hanging cabinets, showers, toilet, dressing mirror, standing cabinet |
| Group 2 | Recreation area | sofas, parlor table |
| Group 3 | Dining and kitchen area | stoves, sinks, refrigerator, cupboards, storage cabinet |
Table 4.
The final results of functional facilities grouping.
| Grouping results | Functional area | Functional facilities |
|---|---|---|
| Group 1 | Living area | beds, hanging cabinets, dressing mirror, standing cabinets |
| Group 2 | Washing area | ventilator windows, showers, toilet |
| Group 3 | Recreation area | sofas, parlor table |
| Group 4 | Dining and kitchen area | stoves, sinks, refrigerator, cupboards, storage cabinet |
Disclaimer/Publisher’s Note: The statements, opinions and data contained in all publications are solely those of the individual author(s) and contributor(s) and not of MDPI and/or the editor(s). MDPI and/or the editor(s) disclaim responsibility for any injury to people or property resulting from any ideas, methods, instructions or products referred to in the content. |
© 2025 by the authors. Licensee MDPI, Basel, Switzerland. This article is an open access article distributed under the terms and conditions of the Creative Commons Attribution (CC BY) license (http://creativecommons.org/licenses/by/4.0/).
Copyright: This open access article is published under a Creative Commons CC BY 4.0 license, which permit the free download, distribution, and reuse, provided that the author and preprint are cited in any reuse.


