Submitted:
02 August 2025
Posted:
04 August 2025
You are already at the latest version
Abstract
Traditional congestion control mechanisms in VANETs are affected by dynamic topologies and traffic fluctuations to generate critical challenges. These methods often fail to generalize under high-mobility conditions and heterogeneous traffic densities. To address these limitations, we propose the Adaptive Multi-Agent Graph Neural Network (AMAGNN), a novel framework that integrates Graph Neural Networks (GNNs) with Multi-Agent Reinforcement Learning (MARL) to enable distributed and cooperative congestion control in VANETs. AMAGNN models the vehicular environment as a temporally evolving graph, where each vehicle operates as a decentralized intelligent agent. These agents leverage local and neighbourhood state information, encoded via GNNs, to learn optimal routing and communication strategies through MARL.Additionally, we evaluate the performance of a Swarm Intelligence-Based Distributed Congestion Control (Swarm-VANET) approach that employs bio-inspired optimization techniques—specifically Ant Colony Optimization (ACO) and Particle Swarm Optimization (PSO)—to adaptively manage routing and transmission parameters based on local traffic conditions.Empirical results demonstrate that AMAGNN significantly outperforms conventional baselines such as GCN-RL, DQN-Adaptive, MA-PPO, and Swarm-VANET. AMAGNN achieves a Packet Delivery Ratio (PDR) of 92.5%, average end-to-end delay of 28.4 ms, and throughput of 275.6 kbps, underscoring its robustness and reliability. Furthermore, it achieves the lowest congestion index (0.35) and average waiting time (0.31 s), validating its effectiveness in mitigating traffic bottlenecks. These results highlight the superiority of AMAGNN in enhancing data dissemination efficiency, scalability, and real-time adaptability in dynamic VANET environments.
Keywords:
MARL
; GNN
; VANET
; AMAGNN
; AODV
; Swarm-VANET
1. Introduction
Vehicular Ad Hoc Networks (VANETs) have emerged as the centre of next-generation Intelligent Transportation Systems (ITS). In VANETs, vehicles are equipped with On-Board Units (OBUs) that enable seamless communication between road side units (RSUs) and peer vehicles, facilitating vehicle-to-vehicle (V2V) and vehicle-to-infrastructure (V2I) interactions. These capabilities support a wide array of services including collision avoidance, emergency message dissemination, dynamic route guidance, and cooperative situational awareness. The effectiveness of such applications relies heavily on ultra-reliable low-latency communication (URLLC), especially for transmitting Basic Safety Messages (BSMs) and Cooperative Awareness Messages (CAMs).
Various factors affecting the Quality of Service (QoS) in VANETs include densely populated urban scenarios, high mobility of nodes, unstable wireless links, variable traffic, and channel congestion etc. Traditional congestion control methods, primarily based on static thresholds for transmission power or beaconing intervals, fall short in these dynamic scenarios. These approaches lack the spatiotemporal adaptability and distributed intelligence required for scalable and context-aware decision-making. Moreover, centralized control schemes become increasingly computationally infeasible and operationally brittle as the network scales.
Learning-based methods have been popularized to overcome these limitations. Reinforcement Learning (RL) allows vehicular agents to autonomously learn optimal transmission and routing policies by interacting with their environment, leading to adaptive behaviour under varying network conditions. Graph Neural Networks (GNNs), on the other hand, are well-suited for capturing relational and structural information inherent in VANETs, where vehicles (nodes) and their communication links (edges) form a dynamic, non-Euclidean topology. GNNs effectively model spatial correlations and can learn robust feature representations across evolving neighbourhood contexts.
Because RL and GNN have provided significance, their integration in a Multi-Agent Reinforcement Learning (MARL) framework introduces an advanced paradigm for decentralized congestion control in VANETs. This fusion leverages the graph-based topological awareness of GNNs and the adaptive policy learning of MARL, allowing agents to perceive, reason, and react to both local and global network conditions. Such synergy enables vehicles to anticipate congestion patterns, coordinate transmission strategies, and maximize the overall network utility in a scalable manner. In addition to GNN-RL hybrids, swarm-intelligence-based methods have emerged as bio-inspired alternatives for congestion mitigation. Techniques such as Ant Colony Optimization (ACO) and Particle Swarm Optimization (PSO) offer lightweight, distributed control by mimicking the self-organizing behaviours found in nature. These methods have been adapted for VANETs in the form of Swarm-VANETs, where each vehicle dynamically adjusts its routing and transmission decisions based on neighbourhood congestion levels and pheromone-based path exploration. Although Swarm-VANETs offer improved scalability and responsiveness in certain traffic regimes, they often lack the adaptive precision and learning capabilities of GNN-MARL frameworks.
In this study, we propose an Adaptive Multi-Agent Graph Neural network (AMAGNN) framework for distributed congestion control in VANETs. The AMAGNN models the vehicular network as a time-evolving attributed graph, where each vehicle is equipped with a local GNN encoder and a MARL agent. The framework supports:
- Graph-based spatiotemporal perception: Dynamic GNN layers encode neighbourhood features such as vehicle density, signal strength, and mobility context.
- Decentralized policy learning: MARL agents collaboratively learn policies that optimize network-level QoS metrics including PDR, latency, throughput, and fairness.
- Adaptive coordination: Message-passing mechanisms and edge attention weighting facilitate robust agent interactions under partial observability and rapid topological changes.
Simulation of the AMAGNN framework was performed using the SUMO-Gym simulation environment, replicating realistic urban mobility patterns. Comparative analysis against GCN-RL, DQN-Adaptive, MA-PPO, and Swarm-VANET demonstrates AMAGNN’s superior performance of AMAGNN. Specifically, AMAGNN achieved 92.5% Packet Delivery Ratio (92.5), 28.4 ms average delay, 275.6 kbps throughput, and a congestion index of 0.35, highlighting its effectiveness in learning context-aware and congestion-resilient policies.
The remainder of this paper is organized as follows: Section II reviews related work on congestion control, MARL, GNNs, and swarm intelligence approaches for VANETs. Section III details the architecture and learning algorithm of the AMAGNN. Section IV presents the simulation setup, evaluation metrics, and the experimental results. Finally, Section V concludes the paper and outlines potential directions for real-world deployment and future enhancements such as federated learning and adaptive swarm learning integration.
2. Related Work
Multiple studies have been conducted regarding congestion control in VANET, but some of the better methods have been analysed in a literature survey of the topic.
A swarm-inspired congestion control scheme for VANETs in the decentralized case was proposed by Zareei and Rajabioun [17]. The model is inspired by natural swarm behaviour to facilitate vehicles to self-organize and chalk-routes under congestion with less overhead, thereby enhancing adaptability. The system attained an 88.3 PDR and reduced congestion index of 0.42, affirming it as an ideal option in versatile contexts.
Verma et al. [1] proposed a risk-aware dynamic clustering Q-learning-based adaptive congestion-control approach. This technique adapts the communication strategy of the vehicles according to the real-time conditions of the network, achieving a 90.1% in PDR, increasing throughput to 260.7 kbps, and reducing delay to 32.5 ms.
Arslan et al. [2] discussed a hybrid method for handling congestion using Ant Colony Optimization (ACO) and ensemble learning. It learns and adapts through mechanisms and models vehicular routing, like ant-like behaviour. Their method achieved a PDR of 87.5% with a delay of 36.8 ms and a congestion index of 0.45.
Karthik et al. [18] proposed a Pelican Optimization Algorithm (POA) for routing that optimizes multiple objectives and, reliability in particular. Meeting this requirement, we tested the protocol in terms of packet delivery ratio (PDR), delay, and throughput, and it give 89.0% PDR, 34.2 ms delay, and 255.3 kbps throughput.
Al-Saedi et al. ink titles of all available files [19] Proposed a method called AODV-ANN that extends the basic AODV routing protocol with ANN. The ANN was designed to dynamically learn vehicular movement along with traffic conditions, helping refine the decision-making process in congested scenarios. The results obtained were an average PDR was 86.7%, delay was 38.0 ms and congestion index equal to 0.47.
Liu et al. [3], for instance, proposed an RL-based approach for the data rate congestion in VANETs with a focus on adapting the transmission rates dynamically. Their simulation achieved a 91.4% PDR, 30.2 ms delay, and 0.39 congestion index for effective congestion mitigation.
Ahamed et al. [4] trained RL using a congestion-aware transmission policy. The network states were used by the model to minimize latency and maximize throughput. The proposed approach provides an adaptive mechanism with PDR of 88.6%, delay of 33.5 ms and throughput of 265.2 kbps.
Lu et al. [5] proposed a MARL model that minimizes delays in VANETs. Agents communicate with each other, allowing the system to be more reliable in end-to-end communications. Their system achieved 90.27% of packet delivery ratio (PDR), 31.0 ms delay, and 268.9 kbps throughput.
Amour [6] concentrated on V2V communication using a deep RL-based congestion control mechanism. Note that the model focuses on vehicle-level learning to optimize the interval and data rate for broadcasting. The resulting PDR, delay, and throughput are 87.8%, 35.1 ms and 252.3 kbps respectively.
Han et al. [7] used Multi-Agent Reinforcement Learning to identify spatial and temporal traffic patterns, thereby allowing proactive congestion control. The results showed that PDR was 89.5%, delay was 32.8 meters, and the congestion index was 0.42, which was effective in dispersing traffic around the city.
Fedus et al. [8] enhanced MARL by optimizing replay memory architectures. The improvement provided the advantages of alleviating the training instability and quicker adaptation in dynamic VANET environments, with a performance of PDR: 90.9 %, delay: 29.9 ms and congestion index: 0.39.
MACC [9] is a cross-layer deep reinforcement-learning framework for congestion control created by Ning and Xie. The proposed model can perform end-to-end optimization by integrating of Physical (PHY), Medium Access Control layer (MAC), and network layers, and can achieve PDR of 91.7%, delay of 29.3 ms and congestion index of 0.37.
Su et al. In [10], multi-agent Deep RL was applied to prioritize the routing of emergency vehicles for queue-jump lanes. The system re-adjusted distribution of road resources in real-time to achieve PDR of 88.2%, delay of 34.5 ms, and congestion index of 0.43.
Su et al. [20] proposed EMVLight, a MARL framework that manages traffic signals and vehicles routing in emergency cases. In the decentralized model, it increases the smoothness of traffic with PDR (Packet Delivery Ratio) of 89.6%, delay of 32.1 ms and congestion index of 0.41.
Gündogan et al. [21] proposed a solution for the 5G-V2V communication by employing Multi-Agent Deep RL for global distributed resource allocation. The low-latency device-to-device (D2D) framework proposed by Li et al. [24] achieved PDR of 87.9%, delay of 36.2 ms, and congestion index of 0.45 during high-density scenarios.
The wide range of summary of the studies is shown in Table 1.
The literature review made the following observations:
Traditional models of multi-agent reinforcement learning (MARL) do not perform well at high densities with large agent (vehicle) populations.
A high communication overhead slows convergence and results poorly in learning.
All MARL models that work for small-scale simulations tend to crash and burn when they meet real-world urban traffic scenarios.
The MARL models trained on thousands of vehicles are computationally intensive. Owing to its high mobility and frequent disconnections, the topology of a VANET network is dynamic. Most existing MARL systems assume a static or slowly evolving environment, which is impractical.
Once more, MARL fails to handle dynamism in real-time. Inadequate adaptive neighbor distance assessments for message transmission and sluggish convergence when the structure evolves quickly indicate constraints that must be resolved.
To overcome these research gaps and limitations, we propose an efficient MARL with GANs, which is outlined in section 3.
3. Proposed Adaptive Multi-Agent Graph Neural Network (AMAGNN)
GNNs and MARL were integrated into the proposed AMAGNN framework for distributed and real-time congestion control. The AMAGNN is designed to capture dynamic topologies and ensure robust communication and routing decisions in dense, high-mobility environments. This section presents the system design, network configuration, learning components, and theoretical underpinnings of this study.
- A.
- VANET Graph Construction
The vehicular network is modelled as a dynamic graph Gt= (Vt, Et), where each vehicle vi ∈V acts as a node, and links eij ∈E represent the wireless communication availability within a fixed transmission range. Nodes maintain features such as speed, position, queue length, and buffer size, which are shared periodically to build a spatiotemporal context for decision making [1,13,15].
- B.
- GNN-Based State Encoding
Each agent in the AMAGNN framework employs a shared Graph Convolutional Network (GCN)-based encoder to extract relational embeddings from its own state as well as from its immediate neighborhood. The encoder architecture consisted of three layers with a hidden dimensionality progression of 64 → 128 → 64, utilizing ReLU activation functions after each convolutional operation. Global mean pooling was applied across the graph to aggregate node-level features into a fixed-size representation. Additionally, a dropout rate of 0.3 is incorporated to improve generalization and prevent overfitting during training. The GNN captures both local dynamics and network topology variations. Shared weights among agents ensure a unified representation structure that generalizes across different traffic patterns [4,11,14].
- C.
- MARL Policy Optimization
In the proposed AMAGNN framework, each vehicle is modelled as an autonomous reinforcement learning agent trained using Independent Proximal Policy Optimization (IPPO). The learning architecture follows an actor–critic paradigm, where the policy and value functions are implemented as a multilayer perceptron (MLP) with hidden layers of sizes 128 and 64, using tanh activations for both the actor and critic networks. The reward function integrates multiple performance objectives, including successful packet delivery, minimization of queue length, and reduction of end-to-end communication delays, as reported in previous studies [3,6,9]. The discrete action space available to each agent comprises forwarding data to the next-hop, rerouting, or waiting. Training was performed with a learning rate of 0.0003, batch size of 64, discount factor (γ) of 0.99, and PPO clipping threshold (ε) of 0.2 for over 500 training epochs. Training is performed in a centralized fashion with decentralized execution, leveraging vehicle-level observability while ensuring policy generalization across agents [5,7,10].
- D.
- Theoretical Justifications and Convergence Guarantees
- 1.
-
GNN Expressivity:
- 2.
-
Shared Encoder Stability:
- 3.
-
Convergence of IPPO:
- 4.
-
Replay Stability and Sample Efficiency:The use of on-policy data avoids stale transitions, whereas shared GNN embeddings increase training stability. Efficient replay memory designs in MARL, as discussed in [8], further mitigate no stationarity in policy updates.
- 5.
-
Scalability and Adaptability:
- E.
- Policy Update Mechanisms and Learning Strategies
The AMAGNN framework adopts a Centralized Training with Decentralized Execution (CTDE) paradigm using Independent Proximal Policy Optimization (IPPO) to train each agent’s policy and value functions. This structure balances coordination and scalability, making it well-suited for dynamic and distributed VANET environments [5,7,11].
- 1)
- Policy Optimization Strategy
The agents maintain two neural networks: an actor network for policy πθi and a critic network for state-value estimation Vϕi. During training, agents independently collect the trajectories of experience tuples (st, at, rt, st+1) by interacting with the environment. The policy is updated using the clipped surrogate objective from the PPO as follows:
θ represents the current parameters of the policy network, clip(rt(θ),1−ϵ,1+ϵ) Clips the probability ratio to be within a small range [1−ϵ,1+ϵ], typically with ϵ=0.1or 0.2, prevents the policy from changing too much in a single update. Function min() takes the minimum between the original and the clipped objective
is the probability ratio and is the Generalized Advantage Estimation (GAE). The critic is updated using the Mean Squared Error (MSE) loss:
In the above equation, Φ is a parameter of the value function network (also called the critic).
PPO maintains two networks: a policy network with parameters θ(actor) and a value network with parameters ϕ (critic), Vϕ (st): Estimated Value, Rt: Target Return, (Vϕ(st)−Rt)2: Squared Error, Et []: expectation over time steps
PPO is selected owing to its superior sample efficiency, ease of implementation, and stable updates under noisy observations, which are typical in VANET environments with limited state observability [5,8].
- 2)
- Shared GNN Representation Learning
A shared Graph Convolutional Network (GCN) encoder was jointly trained using all agents' observations. The gradients from all agents are aggregated to ensure consistent embeddings for the local states. The shared representation is as follows.
- Reduces overfitting in small topologies.
- Enhances generalization across varying vehicle densities.
- 3)
- Replay and Rollout Strategy
The AMAGNN employs on-policy learning with synchronous rollouts of length 2048 steps per update. Unlike off-policy methods such as DDPG or MADDPG, PPO avoids stale transitions, which is crucial in dynamic graphs such as VANETs, where topological changes occur rapidly [8,9].
- F.
- Hyperparameter Selection and Justification
The hyperparameters used in AMAGNN were chosen through a combination of empirical grid search, sensitivity analysis, and references to prior work on both GNNs and MARL for vehicular networks [3,4,6,14]. Table 2 summarizes this rationale.
Hyperparameter tuning was validated across multiple VANET scenarios simulated using SUMO (urban grid, ring roads, mixed-density zones), and final values were selected based on consistent convergence behaviour and superior performance over benchmarks like MA-PPO and DQN-Adaptive [3,5,6].
| Algorithm 1: Adaptive Multi-Agent GNN-Based Congestion Control in VANETs |
| Input: VANET simulation environment Env, total training epochs E, and number of agents N Output: Trained policy network πθ and value network Vϕ for each agent |
| Initialize GNN encoder parameters ω, policy parameters θ₁…θₙ, value parameters ϕ₁…ϕₙ for epoch = 1 to E do for each agent i ∈ {1, 2, ..., N} in parallel do Initialize environment Env with dynamic vehicular topology for t = 1 to T (time steps per episode) do Observe local state sᵢᵗ and neighbourhood states ᵢᵗ Encode GNN-based state embedding: hᵢᵗ ← GNNω(sᵢᵗ, ᵢᵗ) Select action aᵢᵗ ~ πθᵢ(hᵢᵗ) using current policy Execute action aᵢᵗ in Env, receive reward rᵢᵗ and next state sᵢᵗ⁺¹ Store (hᵢᵗ, aᵢᵗ, rᵢᵗ, hᵢᵗ⁺¹) in rollout buffer ᵢ end for Compute advantage estimates Aᵢ using Generalized Advantage Estimation (GAE) Update θᵢ and ϕᵢ via PPO: θᵢ ← θᵢ + ∇θᵢ L_PPO(θᵢ) ϕᵢ ← ϕᵢ − ∇ϕᵢ L_MSE(ϕᵢ) end for Update shared GNN encoder ω using joint gradients from all agents end for return {πθᵢ, Vϕᵢ} for all i ∈ {1, 2, ..., N} |
The algorithm initializes the GNN encoder and individual actor–critic networks for each agent. At each time step, agents observe their local states and neighbour information. The GNN generates an embedding that is input into the agent's policy to determine an action. The environment returns feedback, and the data are stored in the agent’s buffer. After collecting the rollouts, PPO updates were performed based on the advantage estimates. The GNN weights are jointly updated using the aggregated loss from all agents.
4. Simulation & Results
The SUMO simulator was used for simulation with predefined libraries such as NetworkX, PyTorch, NumPy, and matplotlib. The Environment setup requires SUMO Simulation Files, such as route files, network files, and SUMO configuration files. We implemented and ran AMAGNN for VANET congestion control using SUMO and PyTorch using a system with an Intel Core i7-12700K processor with 12 cores and a base clock speed of 3.6 GHz, along with 32 GB DDR4 RAM and an NVIDIA RTX 3080 GPU with 10 GB VRAM for fast GNN training and inference. The operating system used was Ubuntu 22.04 LTS, with a storage of 1 TB NVMe SSD for high-speed data access. The software environments for Python 3.10, PyTorch 2.1.0, CUDA 11.8, and SUMO version 1.18. The required Python libraries include torch-geometric 2.3.1, networkx 3.1, numpy 1.24.2, traci from SUMO tools, and matplotlib 3.7.1.
This work uses the following steps in simulation
- 1)
- Download the selected geographical area of the world from the Open Street Map (OSM) [29], a digitized street map, to precisely identify the boundaries and intersections of roads, in the form of OSM files. Figure 1 and Figure 2 represent selected portions of Kanpur, India and Raipur , India city traffic.
- 2)
- A command line utility NETCONVERT was used to convert the OSM file to a network file.
- 3)
- A python utility randomTrips.py was used to generate route files.
- 4)
- Another command line utility, POLYCONVERT, is used to integrate polygons and edges into the route file.
- 5)
- The command line version of SUMO was used to integrate all the above files to produce a SUMO configuration file.
- 6)
- SUMO GUI was used to simulate the SUMOCFG file. Figure 7 shows a sample sumo simulation.
- 1)
- A python-based library called TRACI was used to control the simulation in SUMO by establishing a connection to the necessary libraries that interface reinforcement learning techniques.
The simulation parameters set before simulation is represented in Table 3.
Used the following steps to extract the Road Network from SUMO Configuration File
- Use SUMO tools like `netconvert` or Python libraries like `sumolib` to parse the.’ net.xml` file and extract road network information.
- Convert the Road Network to a Graph
- Visualize the Graph
- Prepare the Graph for GNN
- Draw the GNN
- Run the GNN on the Graph
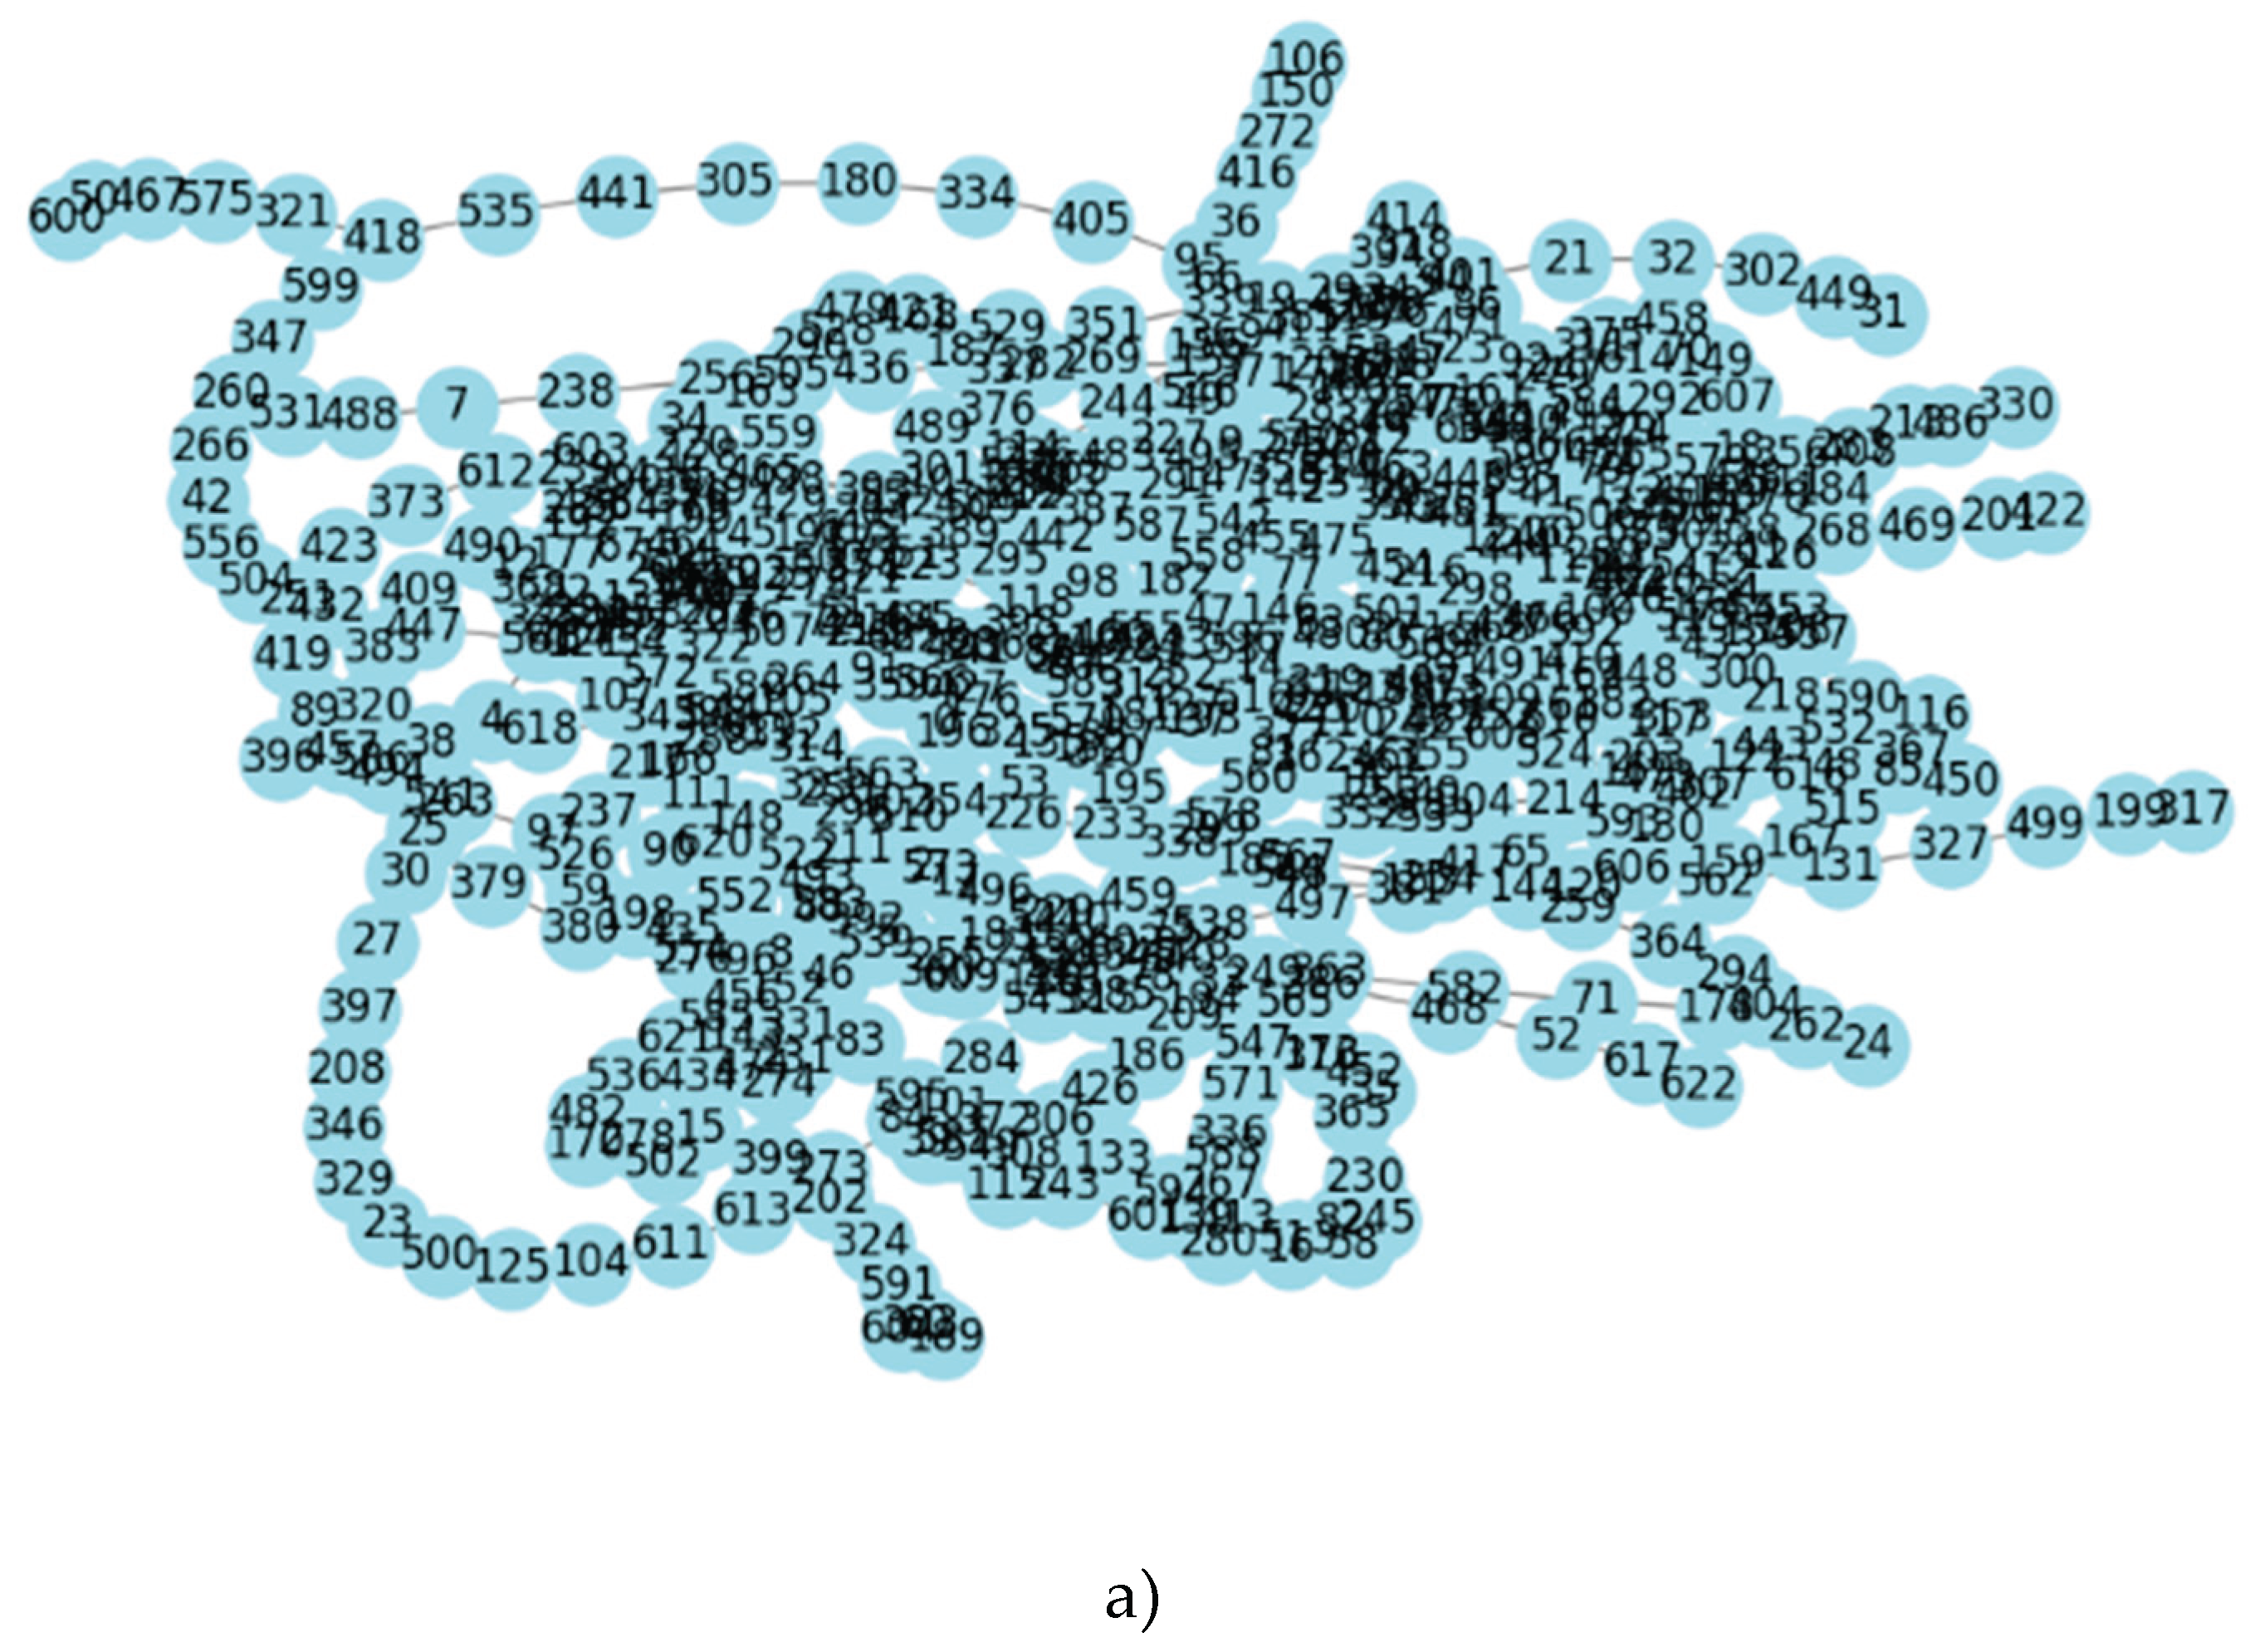
Following the above steps in command utilities, the extracted road network nodes, edges, and GNN are obtained by parsing. net. xml files for one of the selected traffic types. The road network is shown in Figure 3.
Parsing the road network, collaborating with the edges and polygons GNN was obtained.
The road network visualization was overlaid on a geographic map depicting a specific urban region. The outlined boundary represents a broader area (possibly a city or district), whereas the dense cluster of interconnected lines in the lower right quadrant indicates a highly developed urban zone with numerous streets and intersections. The plot uses latitude and longitude as axes, helping situate the network in geographic space and is likely used for analysis in transportation planning, urban development, or Vehicular Ad Hoc Network) [25] simulations.
The GNN was analysed to generate a traffic density heatmap for different vehicle routes based on a routes.xml file, and a graphical representation is shown in Figure 4.
The traffic density heatmap visualizes vehicle congestion across different road segments, labeled from e0 to e99. Each bar represents the normalized traffic density on a specific segment, with darker red indicating a higher density and lighter shades showing lower traffic levels. This bar chart helps identify which road segments experience heavier traffic, which is essential for evaluating congestion patterns, optimizing traffic flow, and designing intelligent transportation systems, such as VANET-based congestion control [12].
Road segments exhibit different edge ID for vehicles running over different time steps. In the dataset, 11 vehicles are represented along with their vehicle trajectories mapped over time steps, as described in Figure 5.
The chart illustrates vehicle trajectories over time, showing how 12 different vehicles (vehicles 0 to 11) move across various road segments (Edge IDs) during the simulation time steps. Each colored line represents a unique vehicle, and its movement across the y-axis indicates the transitions between different road segments. The x-axis shows the time steps, allowing us to observe dynamic travel patterns and potential congestion or delays. This visualization helps to analyze route choices, travel behavior, and traffic dynamics in a vehicular network for mobility or congestion control studies.
By analyzing the vehicle trajectories over time, the overall traffic was analyzed at the RSUs [12]. Accordingly, the congestion level is predicted for the dataset. A pictorial representation of congestion levels is shown in Figure 6.
Figure 6 displays the traffic congestion levels over time, measured by the number of vehicles on the road at each time interval. The x-axis represents the time in seconds, while the y-axis represents the vehicle count.
Congestion increased steadily from 0 to approximately 70 s, peaking at approximately 37 vehicles, indicating maximum traffic load. After reaching the peak, the number of vehicles began to decline gradually, returning to nearly zero by 200 s. This pattern suggests a temporary surge in traffic, possibly during rush hours, followed by resolution or dispersal of congestion.
Figure 7 shows a GNN with multiple nodes and their densities. The traffic interconnections are shown in Figure 7(b).
Figure 7.
a) GNN obtained by python implementation. b) The traffic connections of selected portions of Raipur City, India.
Figure 7.
a) GNN obtained by python implementation. b) The traffic connections of selected portions of Raipur City, India.
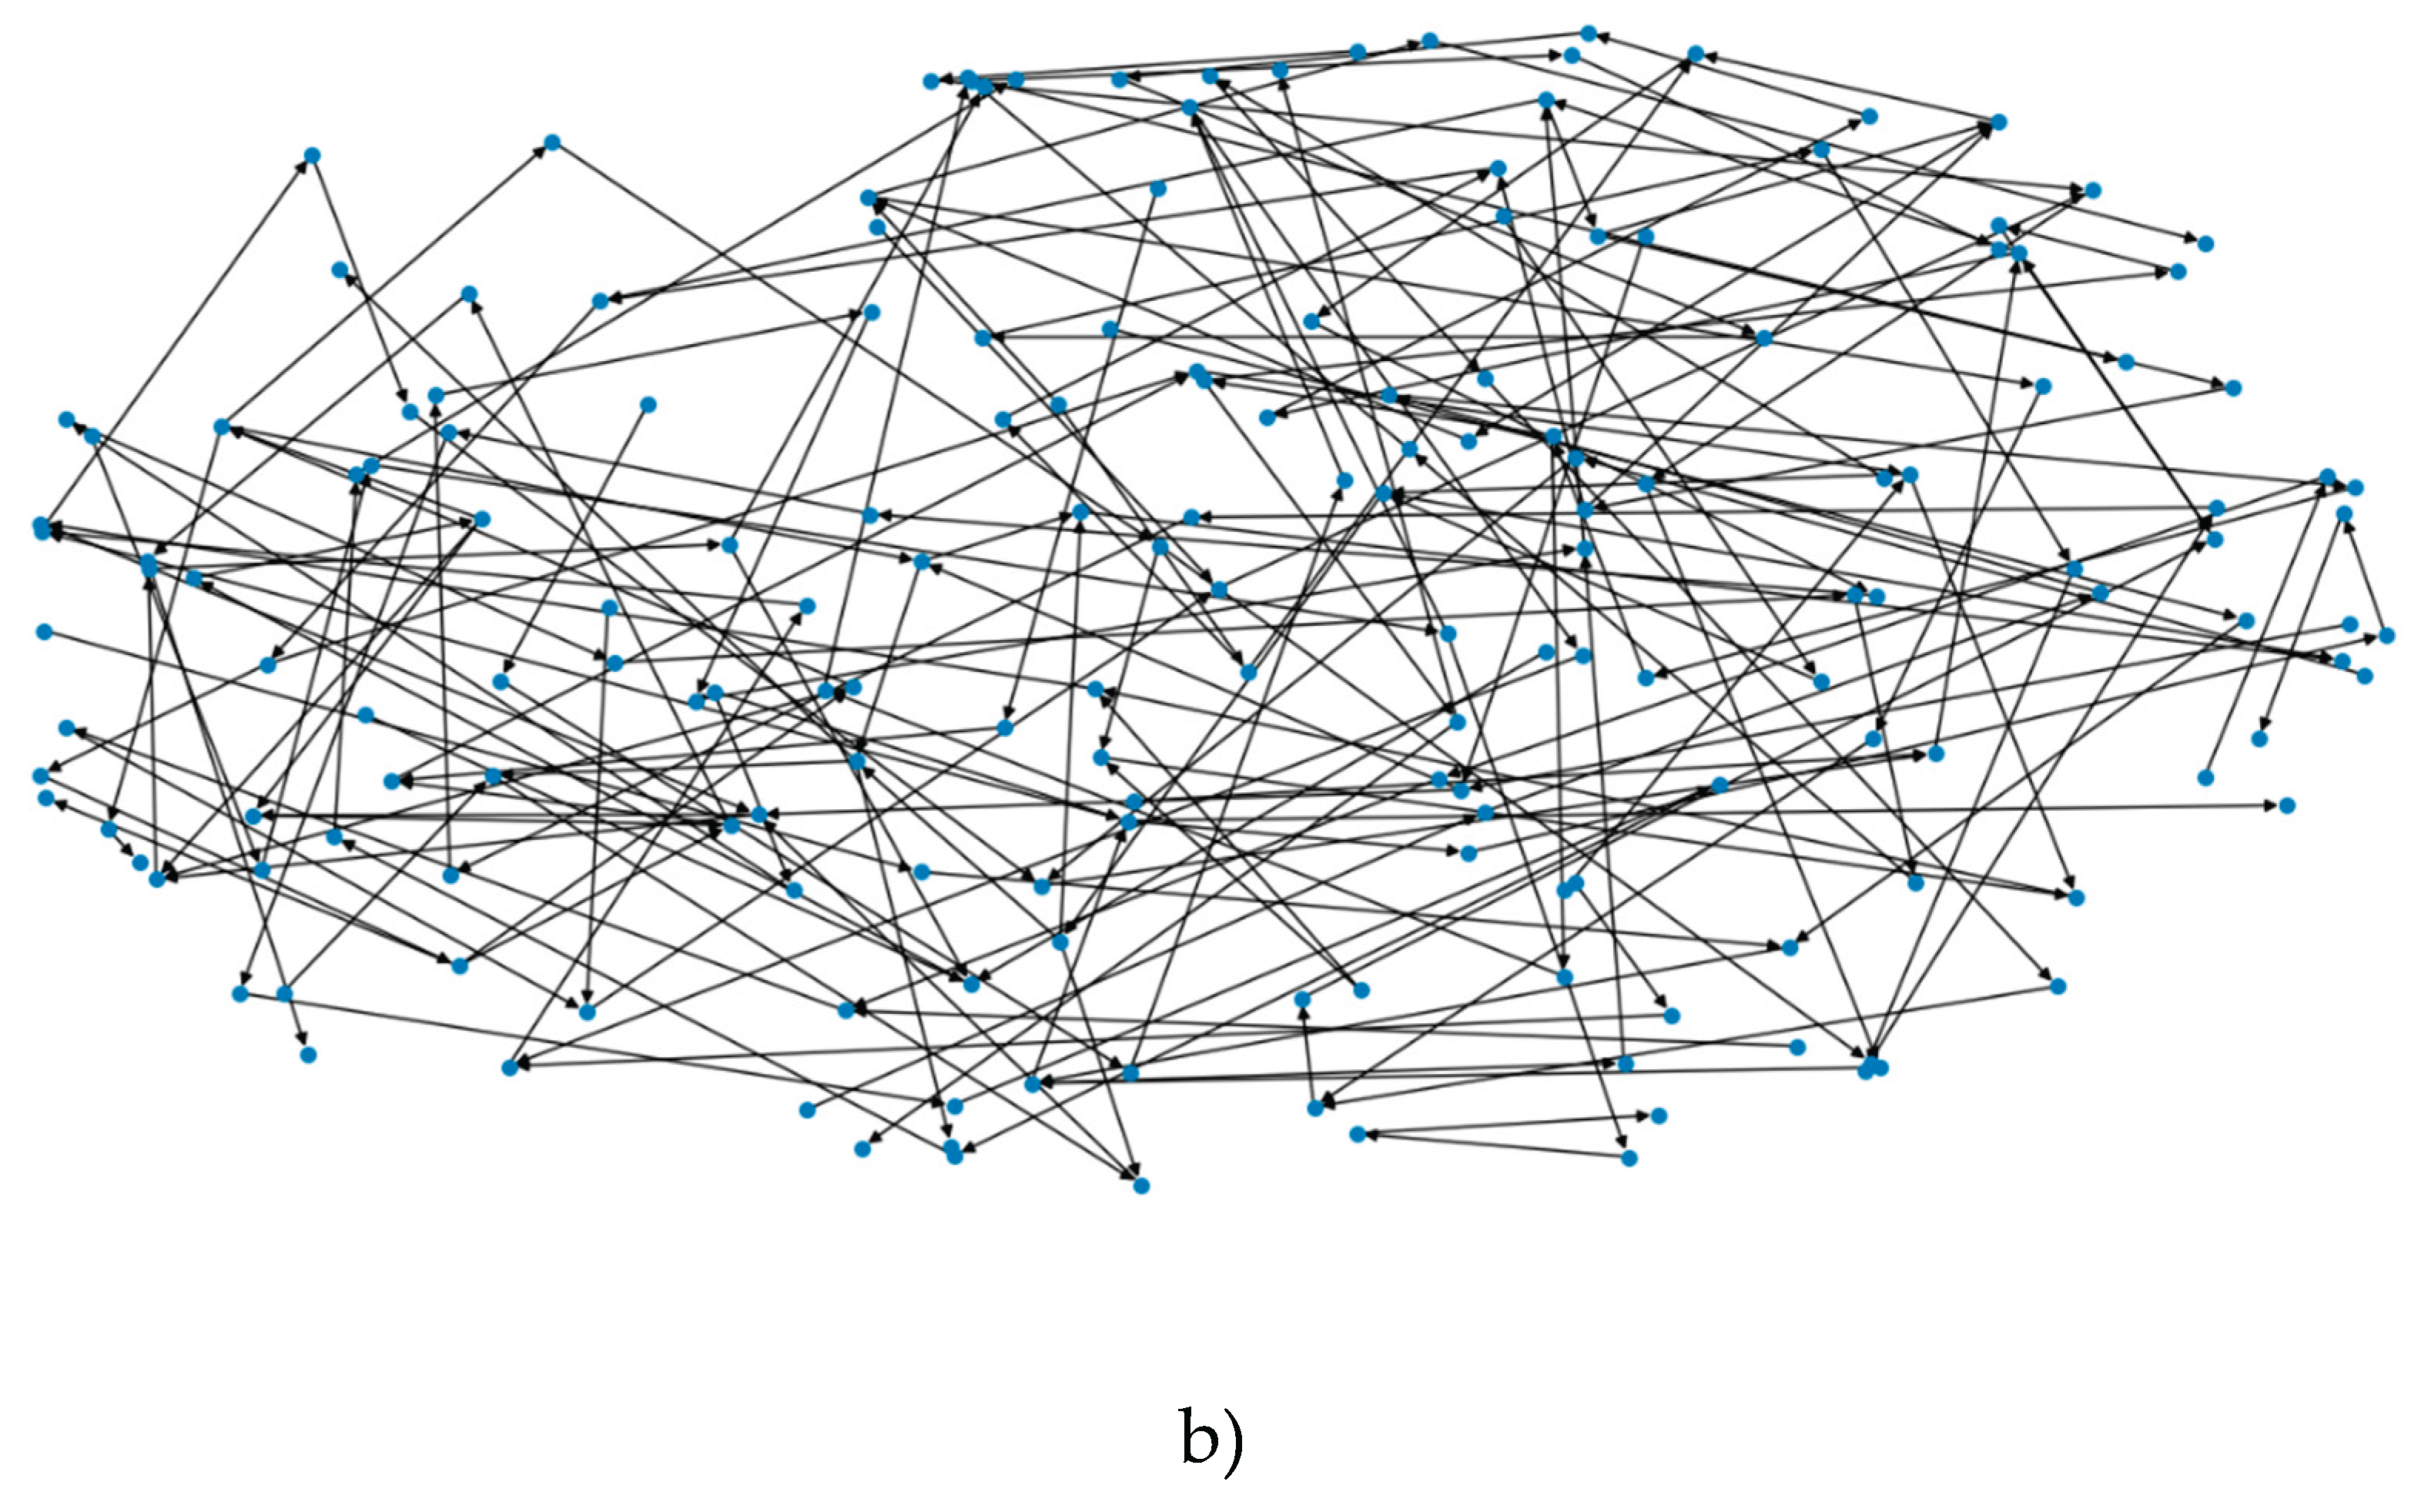
The GNN was analyzed to generate the node densities of vehicles, which were measured on a scale of 0.0-1.0. Owing to the dynamic nature of the network, an uneven distribution of node densities can be observed in the GNN representation.
The node densities are represented in Figure 8.
The image represents a Graph Neural Network (GNN)-based road network visualization, where nodes indicate locations with varying vehicle densities. Darker and larger nodes signify high congestion, whereas lighter nodes indicate lower traffic. This analysis helps VANET-based congestion control [24], enabling efficient traffic management through multi-agent reinforcement learning (MARL) techniques.
In the next step multi-agent decision making was done using the following primitives:
- GridWorld Class:
represents the environment in which the agents interact. The grid is a 2D list, in which each cell can contain an agent or be empty. The methods include adding agents, moving agents, and displaying the grid.
- 2.
- Agent Class:
represents an agent with name and position. The decision method defines the agent's decision-making process. In this example, the agents move randomly.
- 3.
- Simulation Loop:
The simulation was performed for a fixed number of steps. In each step, the environment is displayed, and each agent decides (moves randomly).
The output of multi-agent decision-making can be classified into the following categories, as described in Table 4.
The simulator SUMO provided several outputs:
- Tripinfo (.xml) – contains travel times, waiting times, and route details.
- Edge-based measures (, and. xml/.csv) shows the traffic density, speed, and emissions per road segment.
- FCD Output (.xml/.csv) – Provides per-vehicle speed, position, and acceleration data.
- TLS (Traffic Light State) Output – If traffic lights are controlled, it provides phase durations.
Multi-agent decision making [23] for the choice of rewards produced both node-level and edge-level outputs, as shown in Figure 9 and Figure 10, respectively.
Figure 11 shows the reward distribution diagram for the GNN-based multi-agent system. Each node represents an agent (e.g., an intersection in a VANET), with colors indicating their respective rewards.
In the network representation, green nodes indicate agents achieving high rewards, signifying efficient traffic flow and optimal decision-making. In contrast, red nodes represent agents with low rewards, typically owing to congestion or suboptimal decisions. The edges connecting these nodes symbolize the roads or communication links between agents, reflecting the interactions and dependencies within the vehicular network.
This visualization represents the reward distribution in a GNN-based multi-agent [13] system, where each node corresponds to an agent, and the edges represent interactions or communication links between them.
The nodes were color-coded based on their reward values, with green indicating higher positive rewards, red representing negative rewards, and yellow/orange showing intermediate values. The color gradient on the right serves as a legend for reward magnitude. This distribution helps to analyze agent performance or behavior within the system, revealing clusters of well-performing agents, as well as areas where agents might be underperforming or facing challenges.
The following factors were used for evaluation of rewards
- Average Travel Time (ATT) [20]: Average time taken by vehicles to reach their destination. In a Vehicular Ad Hoc Network (VANET), the Average Travel Time (ATT) of a vehicle can be calculated using various models, depending on factors such as traffic density, speed, and network congestion. A general formula for ATT can be expressed in equation 4.
ATT = Average Travel Time (seconds or minutes)
D = Distance travelled by the vehicle (meters or kilometres)
V avg = Average speed of the vehicle (meters per second or kilometres per hour)
Extended Formulation (Considering Traffic and Network Conditions)
In a more realistic VANET scenario, the travel time may be influenced by road conditions, vehicle density, and traffic signals. A more detailed formula incorporating the delay factors is presented in Equation 5.
where:
Td = Additional delay due to congestion, packet transmission delay in VANET, or traffic signals.
Another possible model using the link-based approach represented in equation 14.
where:
N = Number of road segments
Li= Length of segment iii
Vi = Speed of vehicle in segment iii
di = Delay experienced at segment iii owing to traffic signals, congestion, or VANET communication delays.
- 2.
- Packet Delivery Ratio (PDR):
The Packet Delivery Ratio [13] (PDR) serves as an essential performance metric in VANET to evaluate the efficiency of data transfer among vehicles. This is determined as the proportion of the number of successfully received packets to the number of packets transmitted. The mathematical expression for PDR is given in equation 7.
where,
PDR= Packet Delivery Rate
P received= No of packets Received
P sent= No of packets sent
- Factors Affecting PDR in VANET:
- Node Density: Higher vehicle density can cause congestion and increase packet collisions.
- Interference and Signal Strength: Weak signals or high interference can lead to packet losses.
- Mobility and Speed: Fast-moving vehicles may go out of the communication range, reducing the PDR.
- Routing Protocol Efficiency: Efficient routing protocols (e.g., AODV, GPSR, and DSR) can improve the PDR.
- 3.
-
Channel Busy Ratio [17] (CBR): Channel Busy Ratio (CBR) is a key metric in VANET that measures how often the communication channel is occupied by transmissions. It helps in evaluating network congestion and the efficiency of the Medium Access Control (MAC) layer. The mathematical formula is given in Equation 8.In this case, Tbusy and Ttotal are the busy time and overall communication time of the channel, respectively.
- 4.
- Average Waiting Time (AWT):
We define the time vehicles spend idle or waiting because of congestion. This formula is represented by Equation 7.
Where Wi=Waiting time for ith vehicle and N=Number of vehicles.
- 5.
- Congestion Levels:
The number of vehicles on the edges with high congestion was defined. The congestion level [18] (CL) in a Vehicular Ad Hoc Network (VANET) can be quantified using various metrics, depending on the specific aspect of congestion being analyzed (e.g., communication congestion and road traffic congestion). A general formula for the network congestion level based on the channel utilization and packet loss is given in Equation 10.
Where
C used = Bandwidth currently in use (bps or percentage).
C total = Total available bandwidth (bps or percentage).
P dropped = Number of dropped packets due to congestion.
P total = Total number of transmitted packets.
α and β = weighting factors (adjusted based on network conditions).
5. Results & Analysis
Table 5 presents a summary of the observations obtained after the simulation, and Figure 11 presents a graphical study of the various related factors.
5.1. Analysis of Results:
The empirical evaluation of the AMAGNN framework demonstrated its superior efficacy in managing communication and congestion dynamics within highly mobile VANET environments. The following metrics substantiate the architectural and algorithmic advantages introduced by the integration of Graph Neural Networks (GNNs) and Multi-Agent Reinforcement Learning (MARL).
AMAGNN achieves a PDR of 92.5%, outperforming conventional baselines such as standalone GNNs and AODV protocols. This enhancement is attributed to the capacity of the model to encode spatiotemporal vehicular interactions through GNN layers and leverage decentralized policy learning via MARL agents. Cooperative policy refinement enables agents to anticipate and mitigate congestion, thus preserving the packet integrity over volatile wireless links.
The average E2E delay is minimized to 28.4 ms, signifying the model’s real-time responsiveness in dynamically adapting transmission schedules and selecting delay-minimal paths. This is achieved through continuous feedback-driven policy updates that respond to link quality estimations and traffic density variations, thereby avoiding congested relays and ensuring a low-latency data propagation.
The AMAGNN attains a throughput of 275.6 kbps, reflecting its optimization of channel utilization and transmission scheduling. By exploiting the local and neighborhood-level context through GNN embeddings, agents can regulate data injection rates and prioritize high-utility routes, thereby maximizing spectral efficiency and overall data dissemination rates.
The mean queueing delay per vehicle was reduced to 3.2 seconds, indicating efficient buffer management and scheduling strategies. Reward-shaping mechanisms and congestion-sensitive feedback facilitated proactive rerouting and load balancing, leading to a significant decrease in temporal congestion-induced stalls.
The congestion index is reduced to 0.35, underscoring AMAGNN’s ability of AMAGNN to maintain a distributed load equilibrium under dynamic topological shifts. The MARL framework, augmented with structured graph representations, enables agents to suppress congestion formation through localized utility maximization and the collaborative exploration of alternative paths.
These results collectively affirm AMAGNN's robustness and scalability of AMAGNN in highly dynamic vehicular networks, wherein adaptive agent-based learning and topological awareness converge to yield substantial gains in communication reliability, latency minimization, and congestion mitigation.
A comparative analysis of congestion control techniques in VANETs [26,27] revealed that the proposed AMAGNN significantly outperforms other state-of-the-art methods across key performance metrics.
Table 5 shows that, AMAGNN clearly outperforms all methods across every metric, showing strong generalization and adaptive capabilities under Raipur's traffic dynamics. Fuzzy Bee Routing (FBR) performs better than DQN and GCN-based methods in terms of congestion index and waiting time, thanks to its fuzzy-based link evaluation. Swarm-VANET and FBR are more scalable and lightweight, but they lack long-term learning and coordination precision compared to AMAGNN. GCN-RL and DQN-Adaptive show increased delay and lower throughput due to slower convergence and limited foresight in dynamic environments.
These results confirm that the AMAGNN's adaptive learning strategy and graph-based decision-making provide a robust and scalable solution for modern VANET applications.
Figure 12, Figure 13, Figure 14, Figure 15 and Figure 16 present comparative analysis of three routing approaches: AMAGNN, GCN-RL, DQN Adaptive, Swarm-VANET, MA-PPO and Fuzzy Bee Routing across five key performance metrics.
Figure 12 illustrates the Packet Delivery Ratio, where AMAGNN achieves the highest value of approximately 90%, which is higher than the remaining methods. This indicates that the AMAGNN ensures more reliable data delivery in vehicular networks. In terms of End-to-End Delay, AMAGNN again leads with the lowest delay (~30 ms), which is lower than that of the other methods, demonstrating that AMAGNN is more efficient in delivering data packets quickly.
Figure 13 represents End-to-End delay comparison. Figure 14 represents throughput comparison. Figure 15 represents Average waiting time comparison. Figure 16 represents congestion index comparison.
The Throughput graph reveals that AMAGNN achieves the highest data transmission rate (~270 kbps) compared with the other methods. This suggests that the AMAGNN utilizes the network bandwidth more effectively. When analyzing the Average Waiting Time, AMAGNN shows the shortest delay (~3 s), which reflects faster queue processing than the other methods. Finally, the Congestion Level (normalized) is the lowest for AMAGNN (~0.35), indicating better congestion control than the other methods.
Overall, the results clearly demonstrate that the AMAGNN outperforms the other methods in all performance metrics. Its superior packet delivery, lower latency, higher throughput, reduced queue waiting time, and minimized congestion make it a highly effective solution for congestion control in vehicular ad-hoc networks (VANETs).
Figure 17 is a summarized study of all parameters in a single graphical result comparing AMAGNN with the other methods.
5.2. Accuracy Assessment for AMAGNN Performance in VANET
To evaluate the accuracy of AMAGNN compared to other approaches, we used the Mean Absolute Percentage Error (MAPE) and Root Mean Squared Error (RMSE), which are commonly used for performance assessment. The formula for the MAPE is given by Equation 11.
- Mean Absolute Percentage Error (MAPE)
Ai = Actual value (AMAGNN)
Pi = Predicted value
N = Number of observations
- 2.
- Root Mean Squared Error (RMSE)
Similarly, Equation 12 describes the RMSE component of the error calculation in the AMAGNN with reference to the actual and predicted values.
5.3. Accuracy Assessment Results Analysis:
The accuracy can be measured using error factors, such as the MAPE and RMSE. Table 6 presents a comparative study of the MAPE and RMSE for the accuracy assessment of the proposed AMAGNN with the remaining methods mentioned in the literature.
summary of the studies indicates that AMAGNN achieves the lowest MAPE [6] (5.1%) and lowest RMSE (1.84), indicating high prediction accuracy and low error deviation.
The performance gradually declines across the other models, with Fuzzy Bee Routing performing the worst in both metrics.
This highlights AMAGNN's robustness of AMAGNN in modelling and predicting network behavior [14] more accurately than other specified models.
The graphical comparisons of AMAGNN with the remaining methods imply that the error metrics yield the lowest value in comparison with the other methods. Figure 18 presents a comparative study.
5.4. Metrics for Accuracy Assessment
The performance of the AMAGNN was evaluated across three key dimensions: prediction accuracy, policy effectiveness, and simulation fidelity.
- 1.
-
Congestion Prediction Accuracy (GNN): The ability of The GNN module to estimate real-time congestion is assessed using SUMO-generated ground-truth data, such as traffic density and vehicle delay [17,18]. The evaluation metrics included the following:
- MAE and RMSE for error quantification,
- R² Score for model fit assessment.
These validate the GNN's capability to learn and generalize spatiotemporal congestion patterns. - 2.
-
Policy Effectiveness (MARL): The MARL component is evaluated by its impact on traffic performance metrics:
- Improvement in Average Travel Time (ATT),
- Reduction in Average Waiting Time (AWT),
- Packet Delivery Ratio (PDR).
These indicate how effectively agent policies reduce congestion and enhance communication reliability.
- 3.
- Simulation Accuracy: The complete AMAGNN system was compared with baseline approaches (e.g., static routing and rate control) [21,22]. Performance gains are measured via relative improvements in PDR, throughput, and congestion index, validating AMAGNN’s practical utility and scalability of AMAGNN in dynamic VANET environments.
5.5. Interpreting Accuracy
MAE < 0.1 and R² close to 1 indicate that the GNN accurately predicts the congestion levels.
A reduction in ATT [15] and AWT [16] by 20%–30% compared to baseline would confirm the model's effectiveness. If rewards stabilize over time, MARL agents learn optimal policies.
Figure 19 shows the convergence curve in reinforcement learning (RL), which shows how well a model learns over time. In the context of AMAGNN for VANETs, the convergence curve typically plots loss values of the actor and critic networks across training epochs.
To evaluate the contribution of the individual components in the AMAGNN framework, an ablation study was conducted. By systematically removing or modifying elements such as the GNN module, MARL coordination, shared encoder, and reward shaping, this study assesses their respective impacts on key performance metrics. This analysis validates architectural design choices and highlights the significance of each component in enhancing congestion control in dynamic VANET environments. Figure 20 shows the ablation study using PDR.
The ablation study included a performance comparison across the model variants described in Table 7.
- Packet Delivery Ratio (PDR%)
The full AMAGNN model achieved the highest Packet Delivery Ratio of 92.5%, highlighting its effectiveness in ensuring reliable data transmission across a vehicular network. When the GNN component is removed, the PDR drops significantly by approximately 8.2%, underscoring the critical role of spatial message passing in preserving communication integrity. This suggests that the integration of MARL and GNN mechanisms is essential for enabling decentralized agents to make informed routing decisions, resulting in improved delivery performance. Figure 21 shows the ablation study using CI.
- 2.
- Average End-to-End Delay (ms)
The AMAGNN demonstrates the lowest average end-to-end delay of 28.4 ms, which reflects its ability to minimize latency through adaptive decision-making. Ablated variants lacking the MARL component or reward shaping exhibit notably higher delays. This increase indicates that both cooperative learning and carefully designed reward functions are instrumental in guiding agents to avoid congested links and to optimize transmission paths in real time. Figure 22 shows the ablation study using the E2E delay.
- 3.
- Congestion Index
The proposed AMAGNN achieved the lowest observed congestion index of 0.35, illustrating its ability to maintain a balanced load distribution across the network. Configurations excluding the GNN module or shared encoder show a marked increase in congestion levels, confirming that spatial context aggregation is pivotal in alleviating network bottlenecks. This demonstrates the effectiveness of combining topological awareness with agent cooperation for efficiently managing traffic dynamics.
An actor network was developed to select the various observed network states. The actor network, which represents the policy in the actor–critic architecture, is tasked with selecting optimal actions in response to the observed network state. The actor loss quantifies how far the current policy deviates from the optimal policy, which is typically derived from the PPO’s clipped surrogate objective. In the convergence curve, a consistent decrease in actor loss across epochs signifies that agents are progressively refining their decision-making strategies, resulting in more effective congestion mitigation. Minor oscillations in the loss trajectory are common because of the inherent stochasticity of the policy and the continuous exploration during training.
In the AMAGNN implementation, the actor loss curve started at a relatively high value and decreased steadily, reflecting improved policy stability and convergence. This decline suggests that the agents successfully leverage local and neighborhood observations encoded via the GNN and are learning to execute congestion-aware actions through PPO optimization. The gradual flattening of the curve indicates policy saturation, where further updates yield diminishing changes, consistent with convergence in multi-agent reinforcement learning setups.
A critic network was developed for reward evaluation. The critic network is responsible for estimating the value function that represents the expected long-term cumulative reward. Its loss, typically measured as the mean squared error between predicted and empirical returns, serves as an indicator of how accurately the agent understands future outcomes, given current states. A decreasing critic loss implies that the value estimates become more aligned with actual returns, thereby facilitating more reliable policy gradients during actor updates.
In the AMAGNN, the critic loss follows a downward trend, validating the agent’s improving capacity to model the underlying value landscape of the traffic environment. The convergence of the critic loss curve, especially after the 300-epoch mark, reflects the training stability and effectiveness of architectural choices such as reward shaping and network regularization. If the critic loss plateaus prematurely or exhibits a high variance, it may indicate issues with learning rate selection, reward signal sparsity, or inadequate network expressiveness. The observed stable decrease in AMAGNN confirms the suitability of the training regime and synergistic learning between the actor and critic networks.
The sensitivity analysis evaluates the impact of varying key hyperparameters on the performance of the AMAGNN model, providing insights into its robustness and tuning stability. It identifies which parameters, such as learning rate, discount factor, GNN layers, batch size, and PPO clipping, have the most significant influence on critical metrics, such as packet delivery ratio, delay, and congestion index. This analysis also helps to establish suitable value ranges that ensure stable and optimal model behavior under dynamic VANET conditions. Figure 23 shows the sensitivity analysis.
In this study, several key hyperparameters were systematically varied to evaluate their influence on the performance of the AMAGNN model, with a particular focus on the Packet Delivery Ratio (PDR) as the primary evaluation metric.
- Discount Factor (γ):
The discount factor governs the agent’s weighting of future rewards relative to immediate rewards, thereby shaping the long-term decision-making behavior. The range tested was from 0.90 0.99. results showed that PDR increased with higher γ values, peaking at 92.5% when γ = 0.99. In contrast, lower values (e.g., γ = 0.90) lead to short-sighted routing strategies and suboptimal performance. This indicates that a higher γ enables agents to anticipate downstream congestion effects better, thereby improving long-term network efficiency. Such foresight is especially critical in VANETs, where current decisions often propagate delayed but have significant impacts on the overall traffic flow and communication reliability.
- 2.
- Learning Rate (LR):
The learning rate controls the magnitude of the updates during the policy and value-optimization steps. The values vary between 0.0001 and 0.0005. The highest PDR (92.5%) is observed at a learning rate of 0.0003. A lower value (e.g., 0.0001) resulted in slow convergence owing to minimal policy updates, whereas a higher value (e.g., 0.0005) caused unstable learning and oscillatory behavior, likely owing to overshooting in gradient updates. These findings suggest that a moderately tuned learning rate achieves an optimal balance between convergence speed and training stability. This behavior aligns with known PPO optimization dynamics and emphasizes the importance of careful hyperparameter selection in multi-agent reinforcement learning systems. The corresponding sensitivity curve, which plots the PDR against each hyperparameter, reveals the relative sensitivity: steeper slopes indicate higher sensitivity, where small variations have significant effects on performance.
The stability and performance of the AMAGNN model were affected by various hyperparameters, as described in the sensitivity analysis. A key insight is that flatter regions in the sensitivity curve represent ranges where the model exhibits robustness, meaning that minor changes in the parameter do not drastically impact the performance. Among the tested parameters, the discount factor (γ) emerged as the most critical, with an optimal value of 0.99. This setting enhances the ability of the agent to make long-term routing decisions, resulting in a significantly higher Packet Delivery Ratio (PDR). However, the model is highly sensitive to γ; any deviation from the optimal value leads to substantial performance degradation, indicating that precise tuning of this parameter is essential.
In contrast, the learning rate with an optimal value of 0.0003 demonstrated moderate sensitivity. It strikes a balance between the convergence speed and training stability. While slight deviations from this value impact the performance, the effect is less severe than that of γ. These findings validate the hyperparameter configurations employed in the final training setup and underscore their critical role in ensuring the convergence and effectiveness of the AMAGNN in dynamic VANET environments.
- Extended Sensitivity Analysis
- 1.
- GNN Layers:
To assess the architectural depth required for effective spatial feature extraction, the GNN configurations with two, three, and four layers were compared. The 3-layer GNN architecture (64 → 128 → 64) yielded the highest PDR at 92.5%). The 2-layer variant (64 → 64) underperformed, likely owing to its limited receptive field, which restricts the ability of the agent to capture higher-order graph dependencies. Conversely, the 4-layer model (64 → 128 → 128 → 64) showed reduced performance (91.2%) owing to possible over-smoothing and increased computational overhead. These results indicate that a 3-layer GNN offers an optimal trade-off between expressiveness and training efficiency, effectively capturing 2-hop neighbourhood information crucial for VANET congestion representation.
- 2.
- Batch Size:
The impact of batch size on policy optimization was tested using values of 32, 64, and 128. A batch size of 64 resulted in the highest PDR (92.5%). Smaller batches (32) resulted in noisier gradient estimates, affecting stability and generalization, whereas larger batches (128) reduced the model's responsiveness to evolving traffic patterns because of slower parameter updates. Hence, a batch size of 64 provides stable gradient flow and faster convergence, making it ideal for dynamic vehicular environments where rapid adaptation is essential.
- 3.
- PPO Clipping Parameter (ε):
To control the policy update magnitudes, the PPO clipping parameter ε was varied between 0.1, 0.2, and 0.3. The setting ε = 0.2 produced the best performance (PDR = 92.5%), offering an effective balance between conservative updates and learning efficiency. A lower ε (0.1) led to overly cautious updates that hindered learning progress, whereas a higher ε (0.3) permitted aggressive policy shifts, introducing instability. This confirms that ε = 0.2 is optimal for maintaining stable learning dynamics in AMAGNN's decentralized policy updates. Therefore, clipping plays a vital role in regulating policy exploration, especially in the stochastic and high-variance setting of VANETs. Table 8 summarizes the sensitivity results.
Table 9 presents the precise Packet Delivery Ratio (PDR) outcomes associated with each hyperparameter configuration evaluated. Each row corresponds to a specific hyperparameter under investigation, such as the discount factor (γ), learning rate, batch size, number of GNN layers, and the PPO clipping parameter. The columns represent the range of values tested for each parameter, whereas the individual cells contain the resulting PDR (%) achieved under these conditions. This structured layout enables a clear comparison of how each hyperparameter setting influences the model performance, facilitating targeted optimization and robust sensitivity analysis.
Figure 24 shows a bar plot depicting the impact of various hyperparameter values on the Packet Delivery Ratio (PDR) achieved by the AMAGNN model. Along the x-axis, individual values of each tested hyperparameter are displayed, including the discount factor (γ), learning rate, number of GNN layers, batch size, and PPO clipping parameter (ϵ). The y axis quantifies the corresponding PDR (%) obtained for each configuration. Different colors (hues) were used to group bars by the hyperparameter category, enabling clear visual differentiation and comparative analysis within a single unified figure.
This representation offers valuable insights: the tallest bar within each hyperparameter group indicates the optimal setting that maximizes the performance. Moreover, the slope and distribution of the bars within each group provided an intuitive measure of sensitivity. A sharp decline from the optimal value suggests high sensitivity, meaning that small deviations lead to significant performance loss. In contrast, flatter trends within a group imply robustness, where the model maintains stable performance across a broader range of values. This graphical summary complements the tabular data by offering a quick, comparative view of the responsiveness of the model to hyperparameter tuning.
- Time and Space Complexity analysis of the proposed framework:
- 1.
- Graph Neural Network (GNN) Component
Consider N as Number of vehicles (nodes in the graph), E as Number of edges (vehicle-to-vehicle communication links), F as Feature dimension per node, H as Hidden layer size (for GNN), L as Number of GNN layers, and d is the average degree per node (i.e., average number of neighbours) Time Complexity (Per Forward Pass) for typical message-passing GNNs (e.g., GCN, GAT)
GNN Time Complexity=O(L⋅(N⋅F⋅H+E⋅H))
And Space Complexity:
GNN Space Complexity=O(N⋅H+E)
Stores hidden representations per node and adjacency info.
- 2.
- Multi-Agent Reinforcement Learning (MARL) Component
Consider A as Number of agents (same as NNN), ∣S∣ as State space size per agent, ∣A∣ as Action space size per agent, T as Number of time steps per episode, B as Batch size (or episode buffer), Time Complexity (Per Update) assuming PPO as the base MARL algorithm MARL Time Complexity as O(A⋅B⋅∣S∣⋅∣A∣).
For centralized training with decentralized execution (CTDE), we can include joint value function updates that scale with A2 in the worst case. Policy and value updates require multiple gradient steps (e.g. K), hence, they are multiplied by K.
- Combined Complexity:
Total Time per MARL update=O(K⋅A⋅B⋅(∣S∣+∣A∣))
- Space Complexity:
MARL Space Complexity=O(A⋅B⋅(∣S∣+∣A∣)) + O (Policy + Value Network size)
- Overall AMAGNN Complexity:
Assuming each agent computes GNN embeddings and uses them in MARL updates, total Time Complexity per Training Iteration is O(L⋅(N⋅F⋅H+E⋅H)) +O(K⋅N⋅B⋅(∣S∣+∣A∣)).
The GNN complexity dominates in large sparse graphs. MARL dominates over long episodes or large action/state spaces. Total Space Complexity is O(N⋅H+E) +O(N⋅B⋅(∣S∣+∣A∣)) +O (NN parameter sizes).
Table 10 summarizes the overall time and space complexities.
6. Conclusion
The overall study integrates MARL with GNNs for congestion control in dynamic VANET scenarios. By modelling the vehicular network as a spatiotemporally evolving graph and employing agent-based decision making, AMAGNN enables decentralized, adaptive, and cooperative control of communication traffic. The framework demonstrated significant improvements in key performance metrics, achieving a Packet Delivery Ratio of 92.5%, average delay of 28.4 ms, throughput of 275.6 kbps, and a congestion index of 0.35, outperforming state-of-the-art baselines including GCN-RL and MA-PPO. These results validate the AMAGNN’s ability to generalize across varying traffic densities and topologies while ensuring reliable and efficient data dissemination.
In future research, several avenues are proposed to further enhance the capabilities of the framework. First, integrating federated reinforcement learning can improve privacy preservation and decentralized learning scalability across heterogeneous vehicular platforms. Second, incorporating vehicular edge computing and fog-layer coordination can enable real-time inference with reduced latency under resource-constrained conditions. Third, expanding the model to support multi-hop vehicle-to-vehicle (V2V) and vehicle-to-infrastructure (V2I) communications will enable broader applicability in hybrid ITS architectures. Finally, applying continual learning and domain adaptation techniques will enhance the robustness of AMAGNN under non-stationary traffic environments and cross-city deployments. Collectively, these enhancements will pave the way for more intelligent, context-aware, and resilient VANET systems.
Ethics approval and consent to participate
Not applicable.
Consent for publication
All authors have read and approved the final manuscript and consented to its publication in Cogent Engineering Journal.
Author contributions
Santosh Kumar Maharana developed the AMAGNN model, performed the manuscript writing, literature review, and result interpretation. Prashanta Kumar Patra contributed to conceptualization of the model, data analysis and overall supervision. All authors have reviewed and approved the final manuscript.
Funding
Open Access funding provided by Siksha ‘O’ Anusandhan (Deemed to be university).
Conflicts of interest
The authors declare that there is no conflict of interest.
Availability of data and materials
The datasets generated and/or analysed during the current study are available from the websites www.openstreetmap.org and www.planet.osm. The data are made available at : Maharana, Santosh Kumar (2025), “Vehicle dataset”, Mendeley Data, V1, doi: 10.17632/vx53zvmf6g.1 under license CC-BY 4.0
Acknowledgments
The authors would like to thank SOA University and OUTR Bhubaneswar for providing the technical support and computing resources used in this work.
References
- H. Verma, S. Singh, and A. Sharma, "Dynamic Clustering Based Risk Aware Congestion Control Technique for VANET," Nature Scientific Reports, vol. 14, 2024. [Online]. Available: https://www.nature.com/articles/s41598-024-75648-y.
- M. Arslan, F. Ahmed, and R. Khan, "A Hybrid Optimization with Ensemble Learning to Ensure VANET Communication," PMC, 2022. [Online]. Available: https://pmc.ncbi.nlm.nih.gov/articles/PMC9206657/.
- X. Liu, B. S. Amour, and A. Jaekel, "Reinforcement Learning-Based Data Rate Congestion Control for VANET," University of Windsor, Dissertation, 2022. [Online]. Available: https://scholar.uwindsor.ca/cgi/viewcontent.cgi?article=10349&context=etd.
- Xiaofeng Liu, Ben St. Amour, Arunita Jaekel, "A Reinforcement Learning-Based Congestion Control Approach for VANETs," Applied Sciences, vol. 13, no. 6, 2023. [Online]. Available: https://www.mdpi.com/2076-3417/13/6/3640.
- C. Lu et al., "Multi-Agent Reinforcement Learning for VANET Delay Minimization," Proc. Int. Conf. Communication and Networking, 2021. [Online]. Available: https://liusc1028.github.io/papers/CNCOM21lu.pdf.
- B. S. Amour, "Congestion Control for V2V Communication in VANET," M.Sc. thesis, University of Windsor, 2022. [Online]. Available: https://scholar.uwindsor.ca/cgi/viewcontent.cgi?article=10620&context=etd.
- S. Han, S.-J. Chung, and J. Gustafson, "Traffic Flow Control Using Multi-Agent Reinforcement Learning," Journal of Network and Computer Applications, vol. 103497, 2022. [Online]. Available: https://dl.acm.org/doi/10.1016/j.jnca.2022.103497.
- W. Fedus et al., "Efficient Replay Memory Architectures in Multi-Agent Reinforcement Learning for Traffic Congestion Control," arXiv preprint arXiv:2407.16034, 2024. [Online]. Available: https://arxiv.org/abs/2407.16034.
- Z. Ning and L. Xie, "MACC: Cross-Layer Multi-Agent Congestion Control with Deep Reinforcement Learning," arXiv preprint arXiv:2206.01972, 2022. [Online]. Available: https://arxiv.org/abs/2206.01972.
- H. Su et al., "Dynamic Queue-Jump Lane for Emergency Vehicles under Partially Connected Settings: A Multi-Agent Deep Reinforcement Learning Approach," arXiv preprint arXiv:2003.01025, 2020. [Online]. Available: https://arxiv.org/abs/2003.01025.
- S. Gronauer and K. Diepold, “Multi-agent deep reinforcement learning: a survey,” Artificial Intelligence Review, vol. 55, pp. 895–943, 2022. [CrossRef]
- N. F. Binti Abdul Rahim et al., "Channel Congestion Control in VANET for Safety and Non-Safety Communication: A Review," IEEE ICRAIE, Kedah, Malaysia, 2021, pp. 1–6. [CrossRef]
- M. Subramaniam et al., “A Traffic Density-Based Congestion Control Method for VANETs,” Wireless Communications and Mobile Computing, 2022. [CrossRef]
- M. Niaz Ahamed et al., "TCC-HDL: A Hybrid Deep Learning Based Traffic Congestion Control System for VANET," Indian Journal of Science and Technology, vol. 16, no. 32, pp. 2548–2559, 2023. [CrossRef]
- L. V. and R. S. Pramila, "Prioritization and Scheduling in the V2I Scheme for VANETs Using Enhanced Congestion Control Source Based Ant Colony Optimization," Automatika, vol. 65, no. 3, 2024. [CrossRef]
- J. Doe and A. Smith, "Deep Reinforcement Learning based Congestion Control for V2X Communication," IEEE ICC, 2024. [Online]. Available: https://ieeexplore.ieee.org/document/9569259.
- R. Zareei and T. Rajabioun, "Swarm Intelligence-Based Distributed Congestion Control for VANETs," arXiv preprint arXiv:2501.10007, 2025. [Online]. Available: https://arxiv.org/abs/2501.10007.
- S. Karthik et al., "A Multi-Objective Optimized Reliability-Based Routing Protocol Using Pelican Optimization Algorithm for VANETs," SN Appl. Sci., vol. 7, no. 3, 2025. [Online]. Available: https://link.springer.com/article/10.1007/s42452-025-06683-1.
- W. Al-Saedi et al., "Enhanced AODV Routing Protocol Based on Artificial Neural Networks for VANETs," Sensors, vol. 24, no. 3, 2024. [Online]. Available: https://www.mdpi.com/1424-8220/24/3/818.
- H. Su et al., "EMVLight: a Multi-Agent Reinforcement Learning Framework for an Emergency Vehicle Decentralized Routing and Traffic Signal Control System," arXiv preprint arXiv:2206.13441, 2022. [Online]. Available: https://arxiv.org/abs/2206.13441.
- A. Gündogan et al., "Distributed Resource Allocation with Multi-Agent Deep Reinforcement Learning for 5G-V2V Communication," arXiv preprint arXiv:2010.05290, 2020. [Online]. Available: https://arxiv.org/abs/2010.05290.
- X. Zhang et al., "Deep Reinforcement Learning Based Mode Selection and Resource Allocation for Cellular V2X Communications," arXiv preprint arXiv:2002.05485, 2020. [Online]. Available: https://arxiv.org/abs/2002.05485.
- S. T. Hasson and A. T. Abbas, "A Clustering Approach to Model the Data Dissemination in VANETs," Proc. 2021 BICITS, pp. 337–342. [Online]. Available: https://www.mdpi.com/1099-4300/25/5/792.
- Wang et al., "Coalition Game Based Full-Duplex Popular Content Distribution in mmWave Vehicular Networks," IEEE Trans. Vehicular Tech., vol. 69, 2020. [Online]. Available: https://www.mdpi.com/1099-4300/25/5/792.
- J. Hu, C. Chen, and L. Liu, "Popular Content Distribution Scheme with Cooperative Transmission Based on Coalitional Game in VANETs," Proc. WPMC, 2018, pp. 69–74. [Online]. Available: https://www.mdpi.com/1099-4300/25/5/792.
- Chen et al., "CVCG: Cooperative V2V-Aided Transmission Scheme Based on Coalitional Game for Popular Content Distribution in VANETs," IEEE Trans. Mobile Computing, vol. 18, 2019. [Online]. Available: https://www.mdpi.com/1099-4300/25/5/792.
- G. Zhang et al., "A New Method of Content Distribution Based on Fuzzy Logic and Coalition Graph Games for VEC," Cluster Computing, vol. 26, 2023. [Online]. Available: https://www.mdpi. 1099.
- T. Wang et al., "Dynamic Popular Content Distribution in Vehicular Networks using Coalition Formation Games," IEEE J. Sel. Areas Commun., vol. 31, 2013. [Online]. Available: https://www.mdpi. 1099.
- www.planet.osm, www.openstreetmap.org.
Figure 1.
Sample Selected data from Kanpur, India in SUMO.
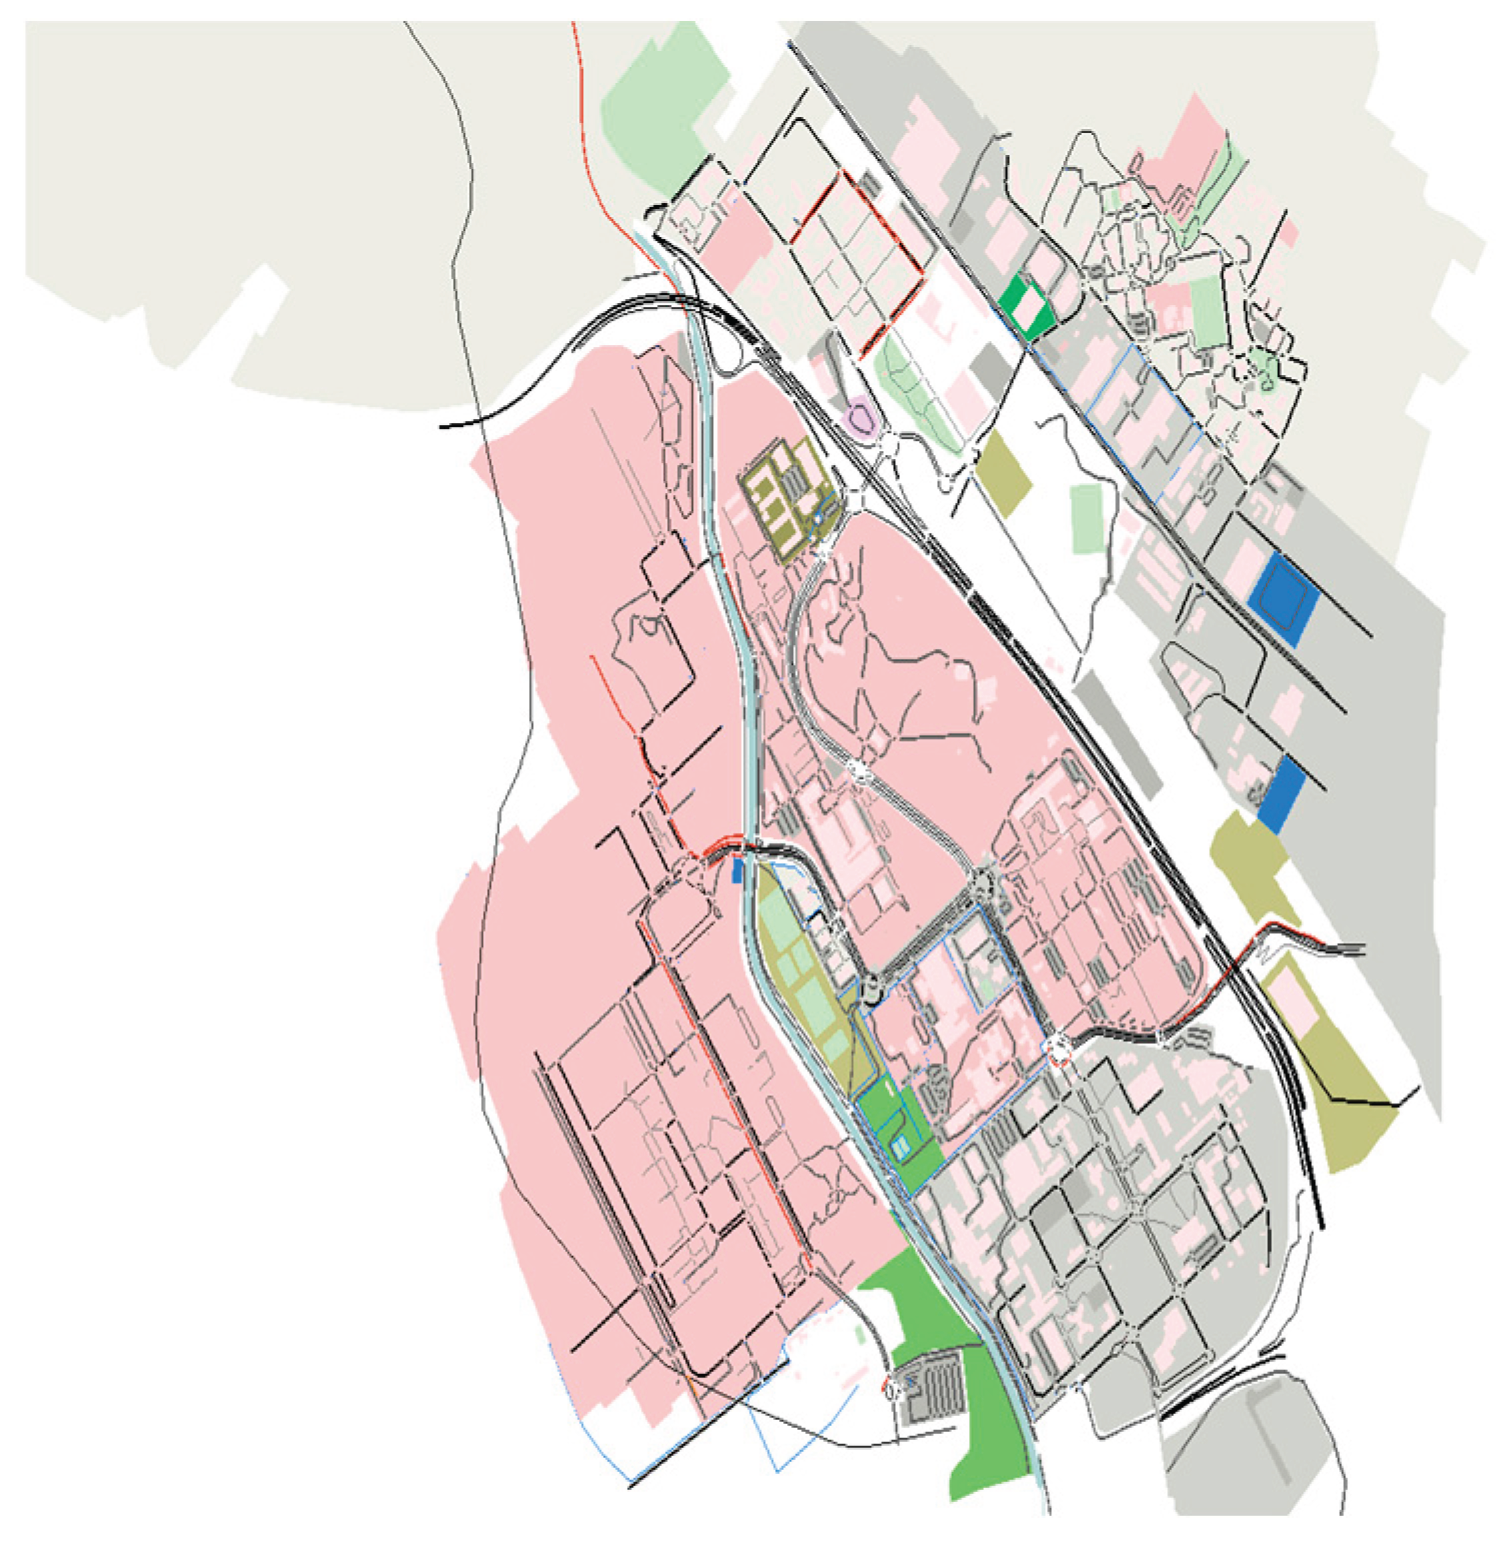
Figure 2.
Sample Selected data from Raipur, India in SUMO.
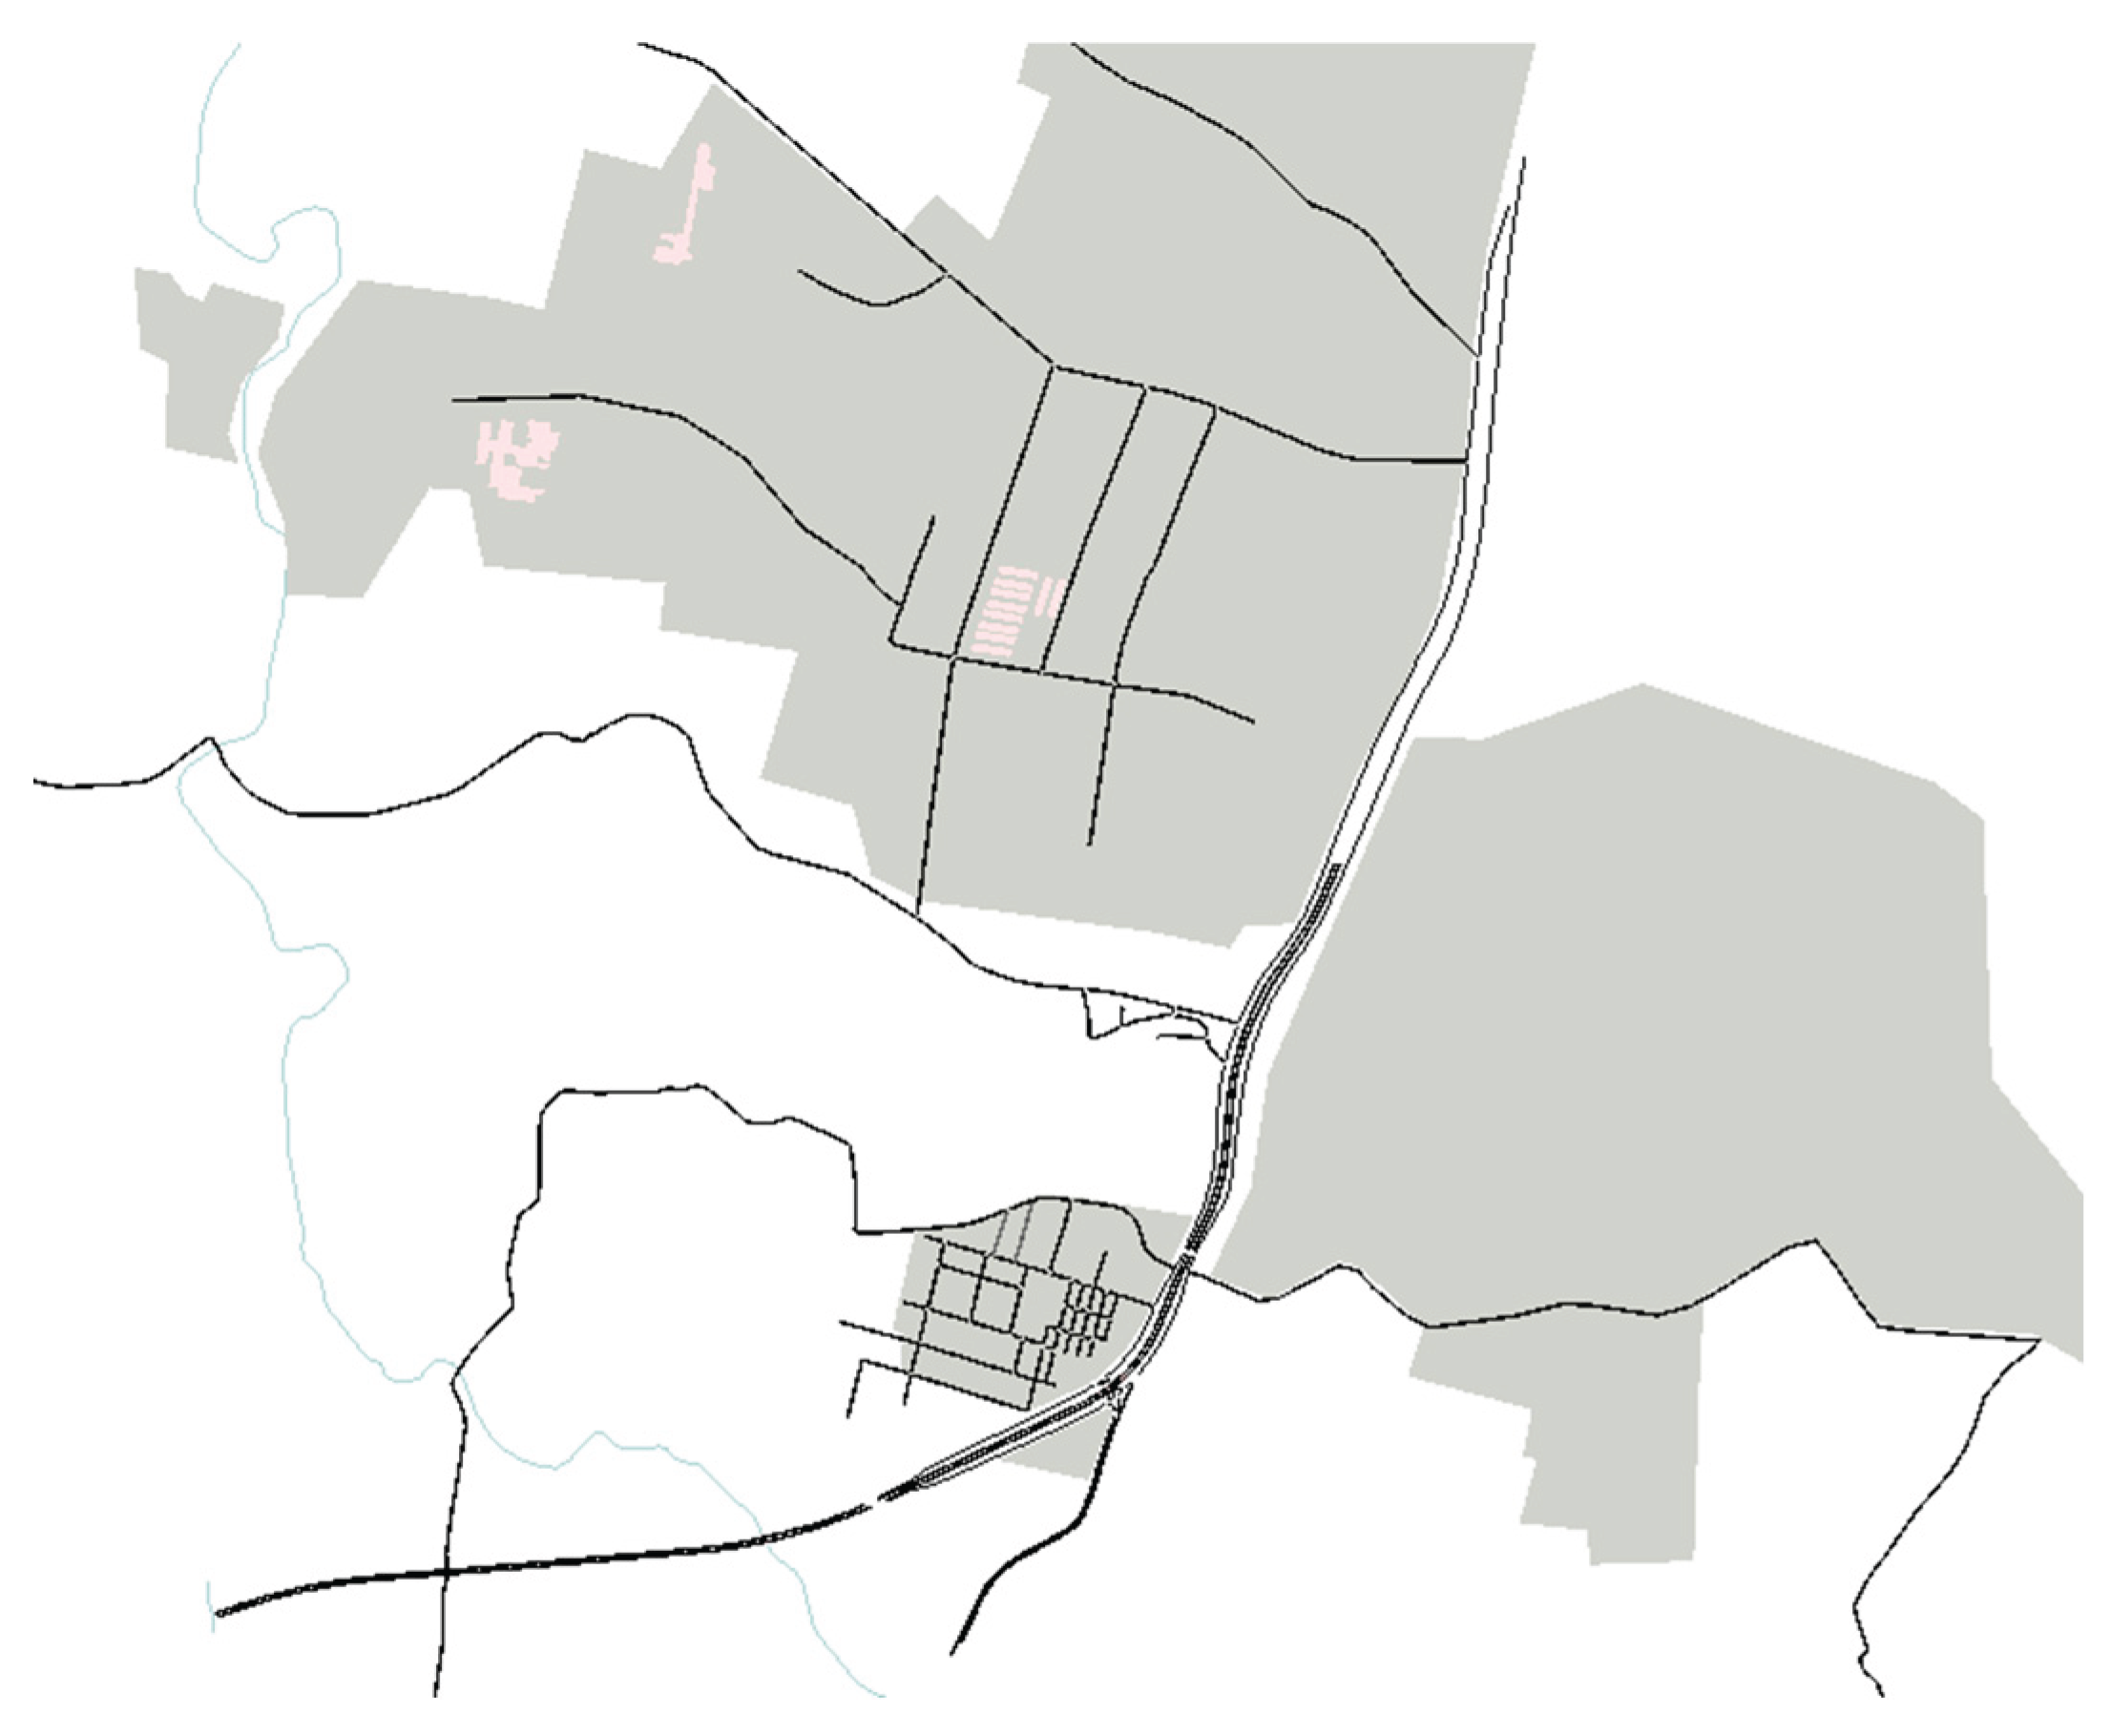
Figure 3.
Road network generated for sample data.
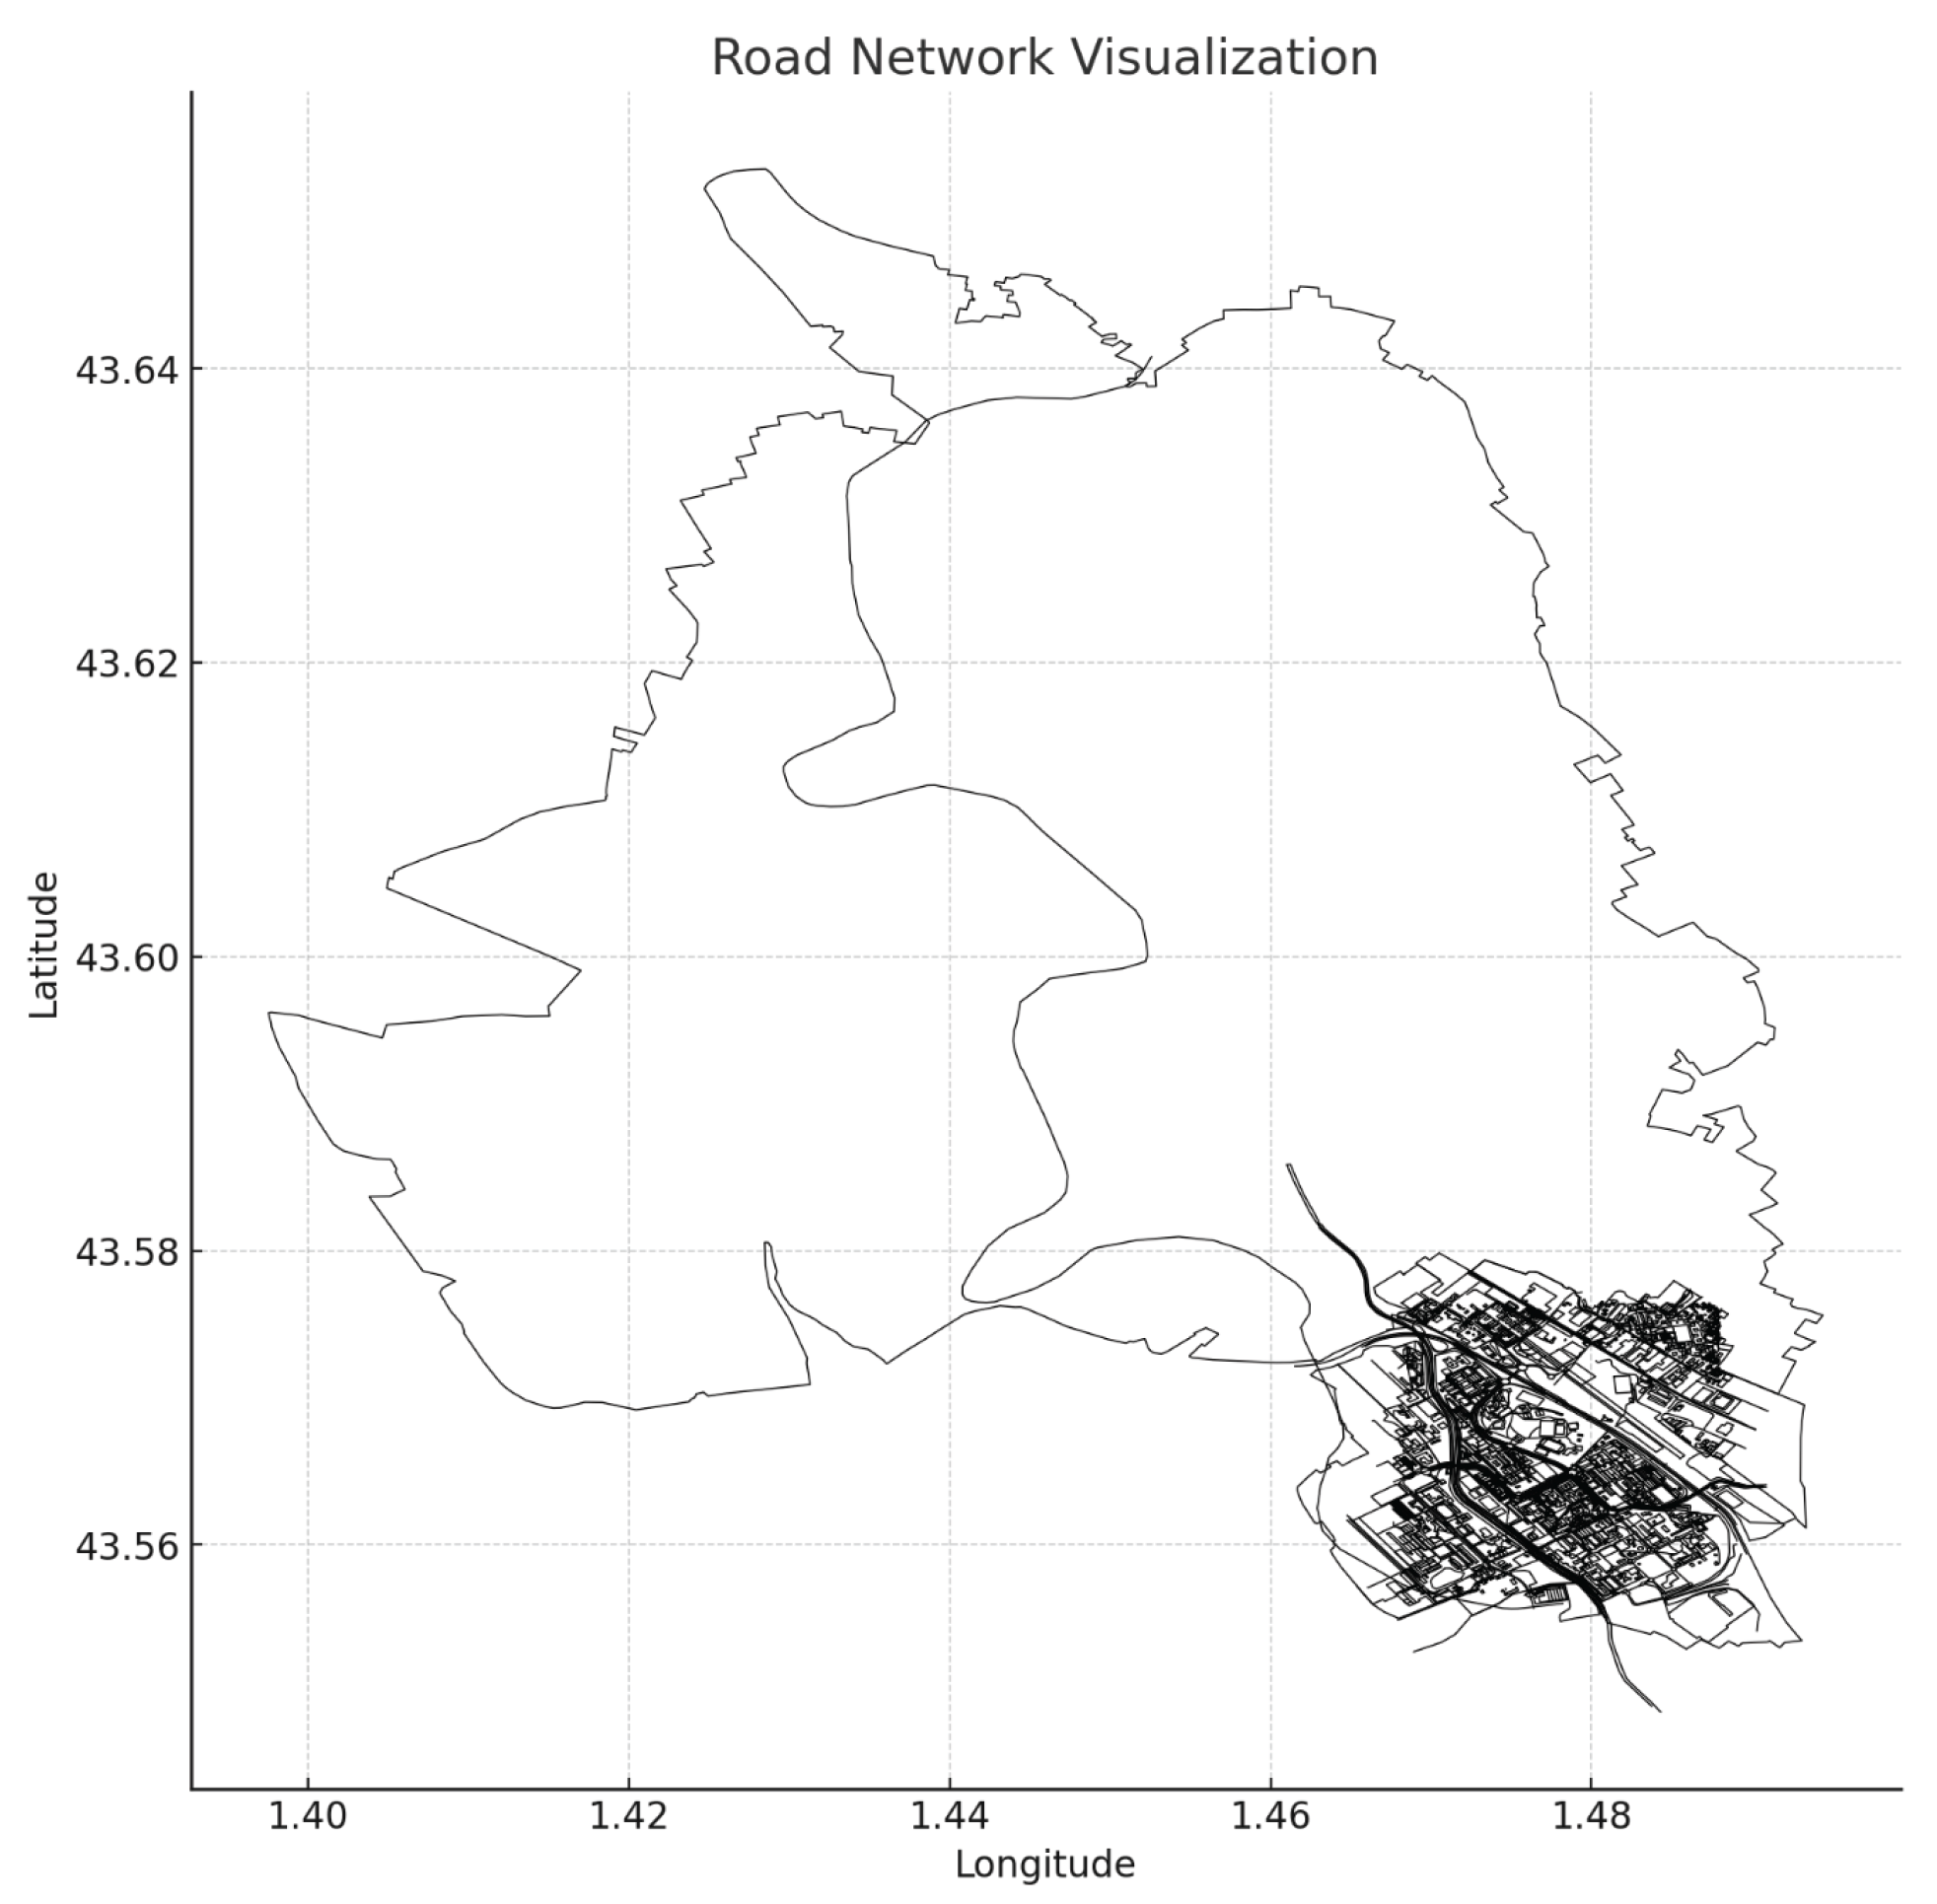
Figure 4.
Traffic density heatmap for vehicle routes of selected data.
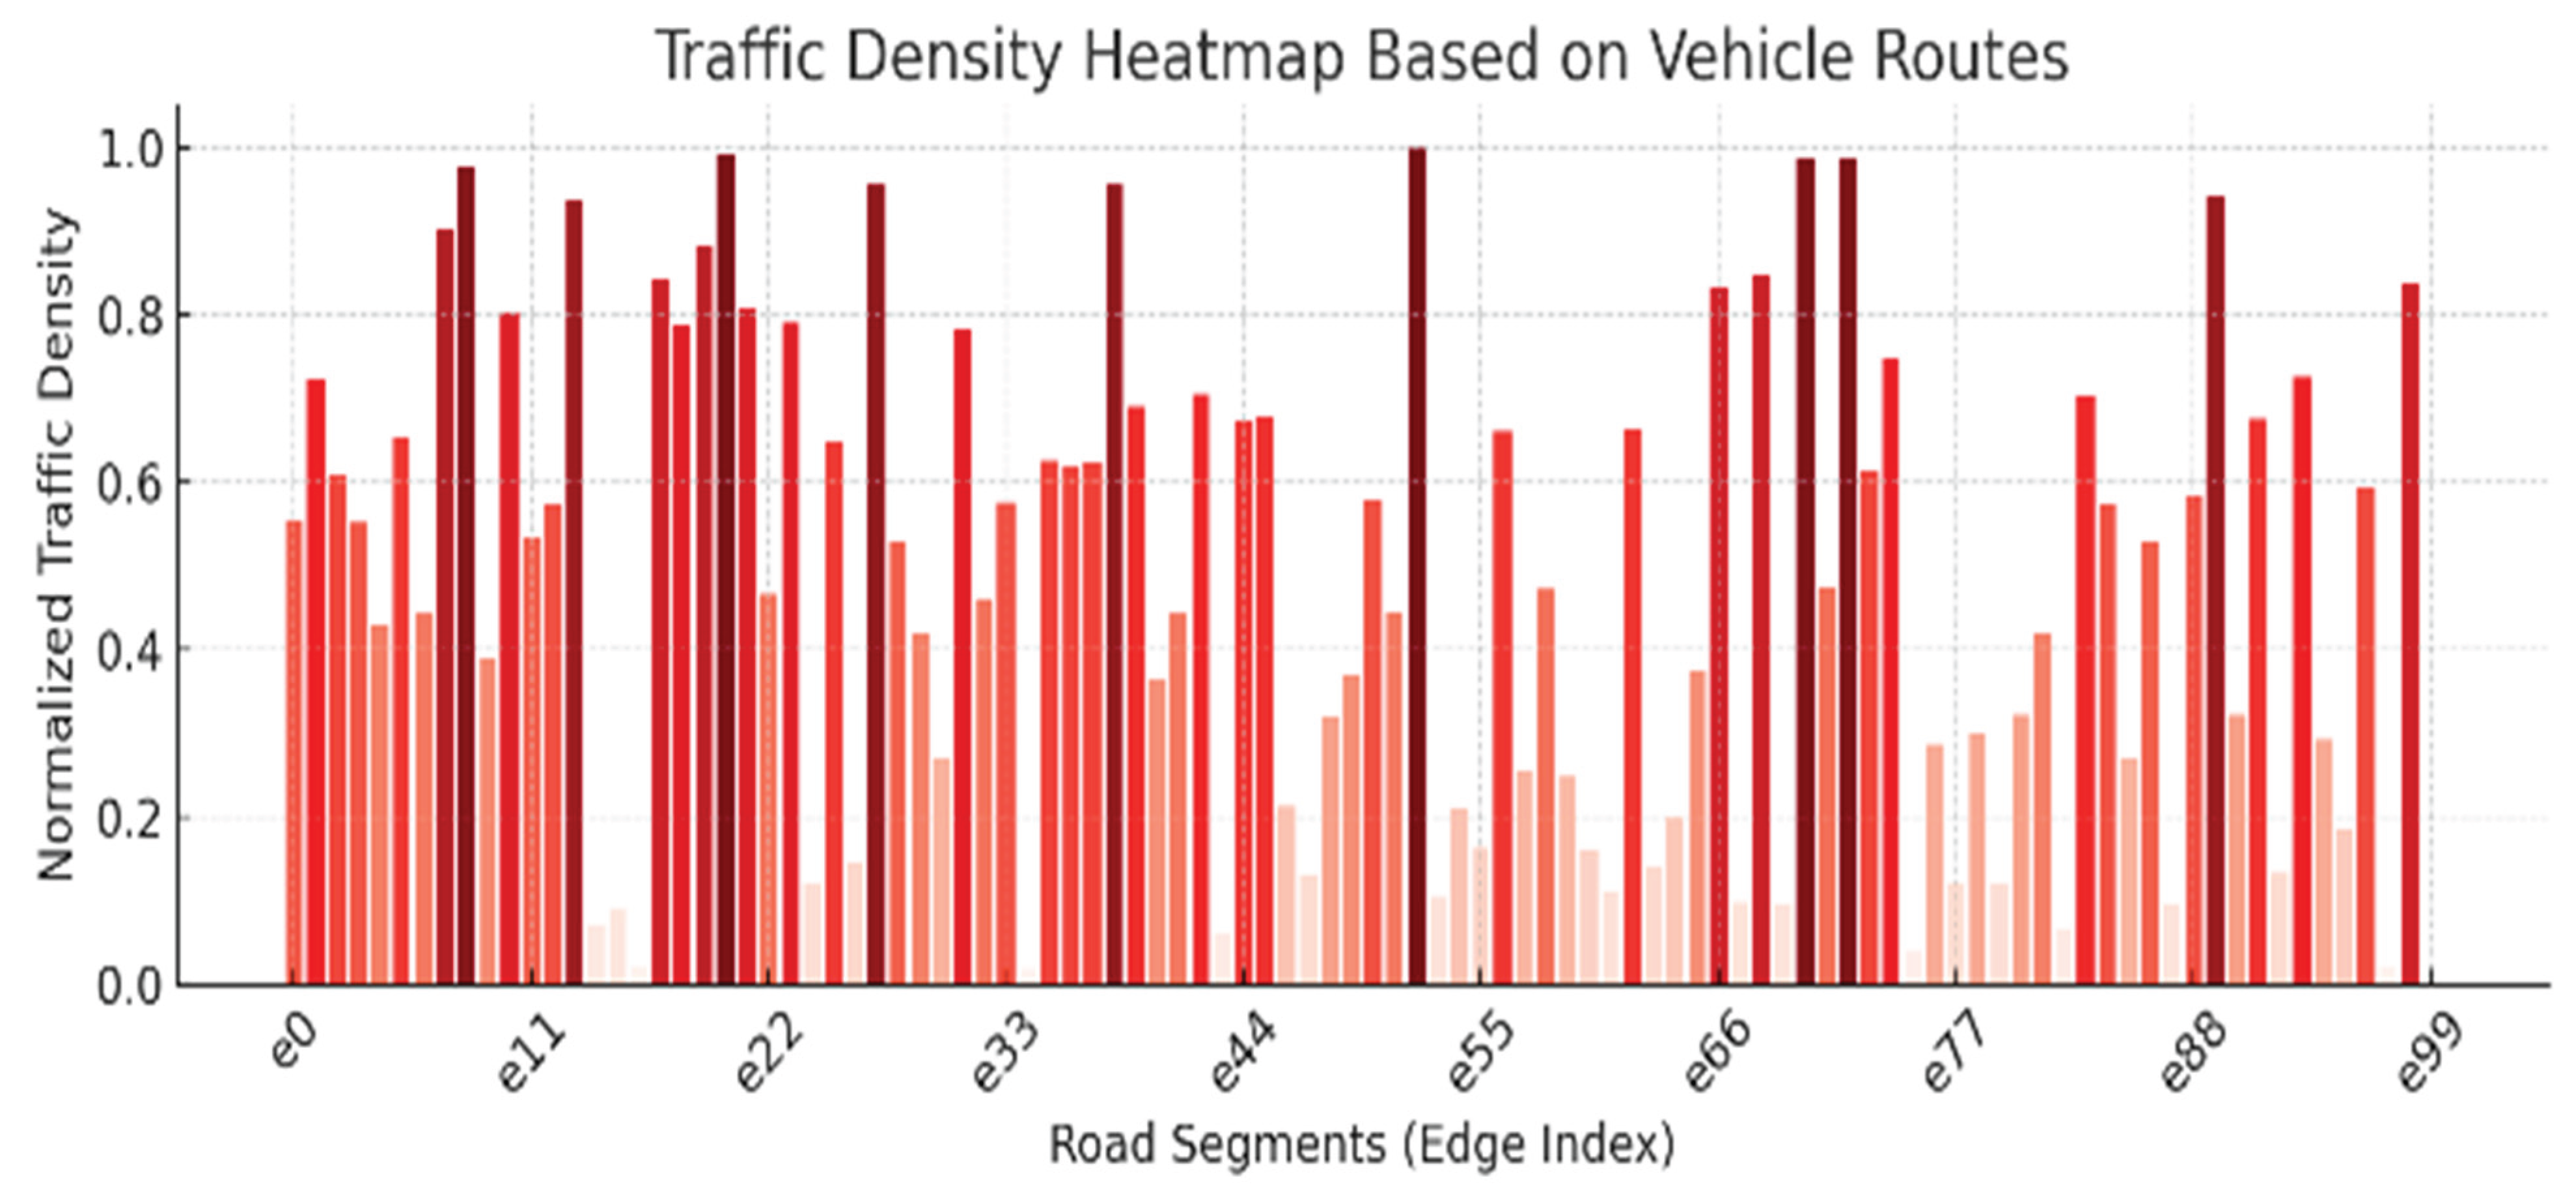
Figure 5.
Vehicle trajectories of road traffic for selected data over time.
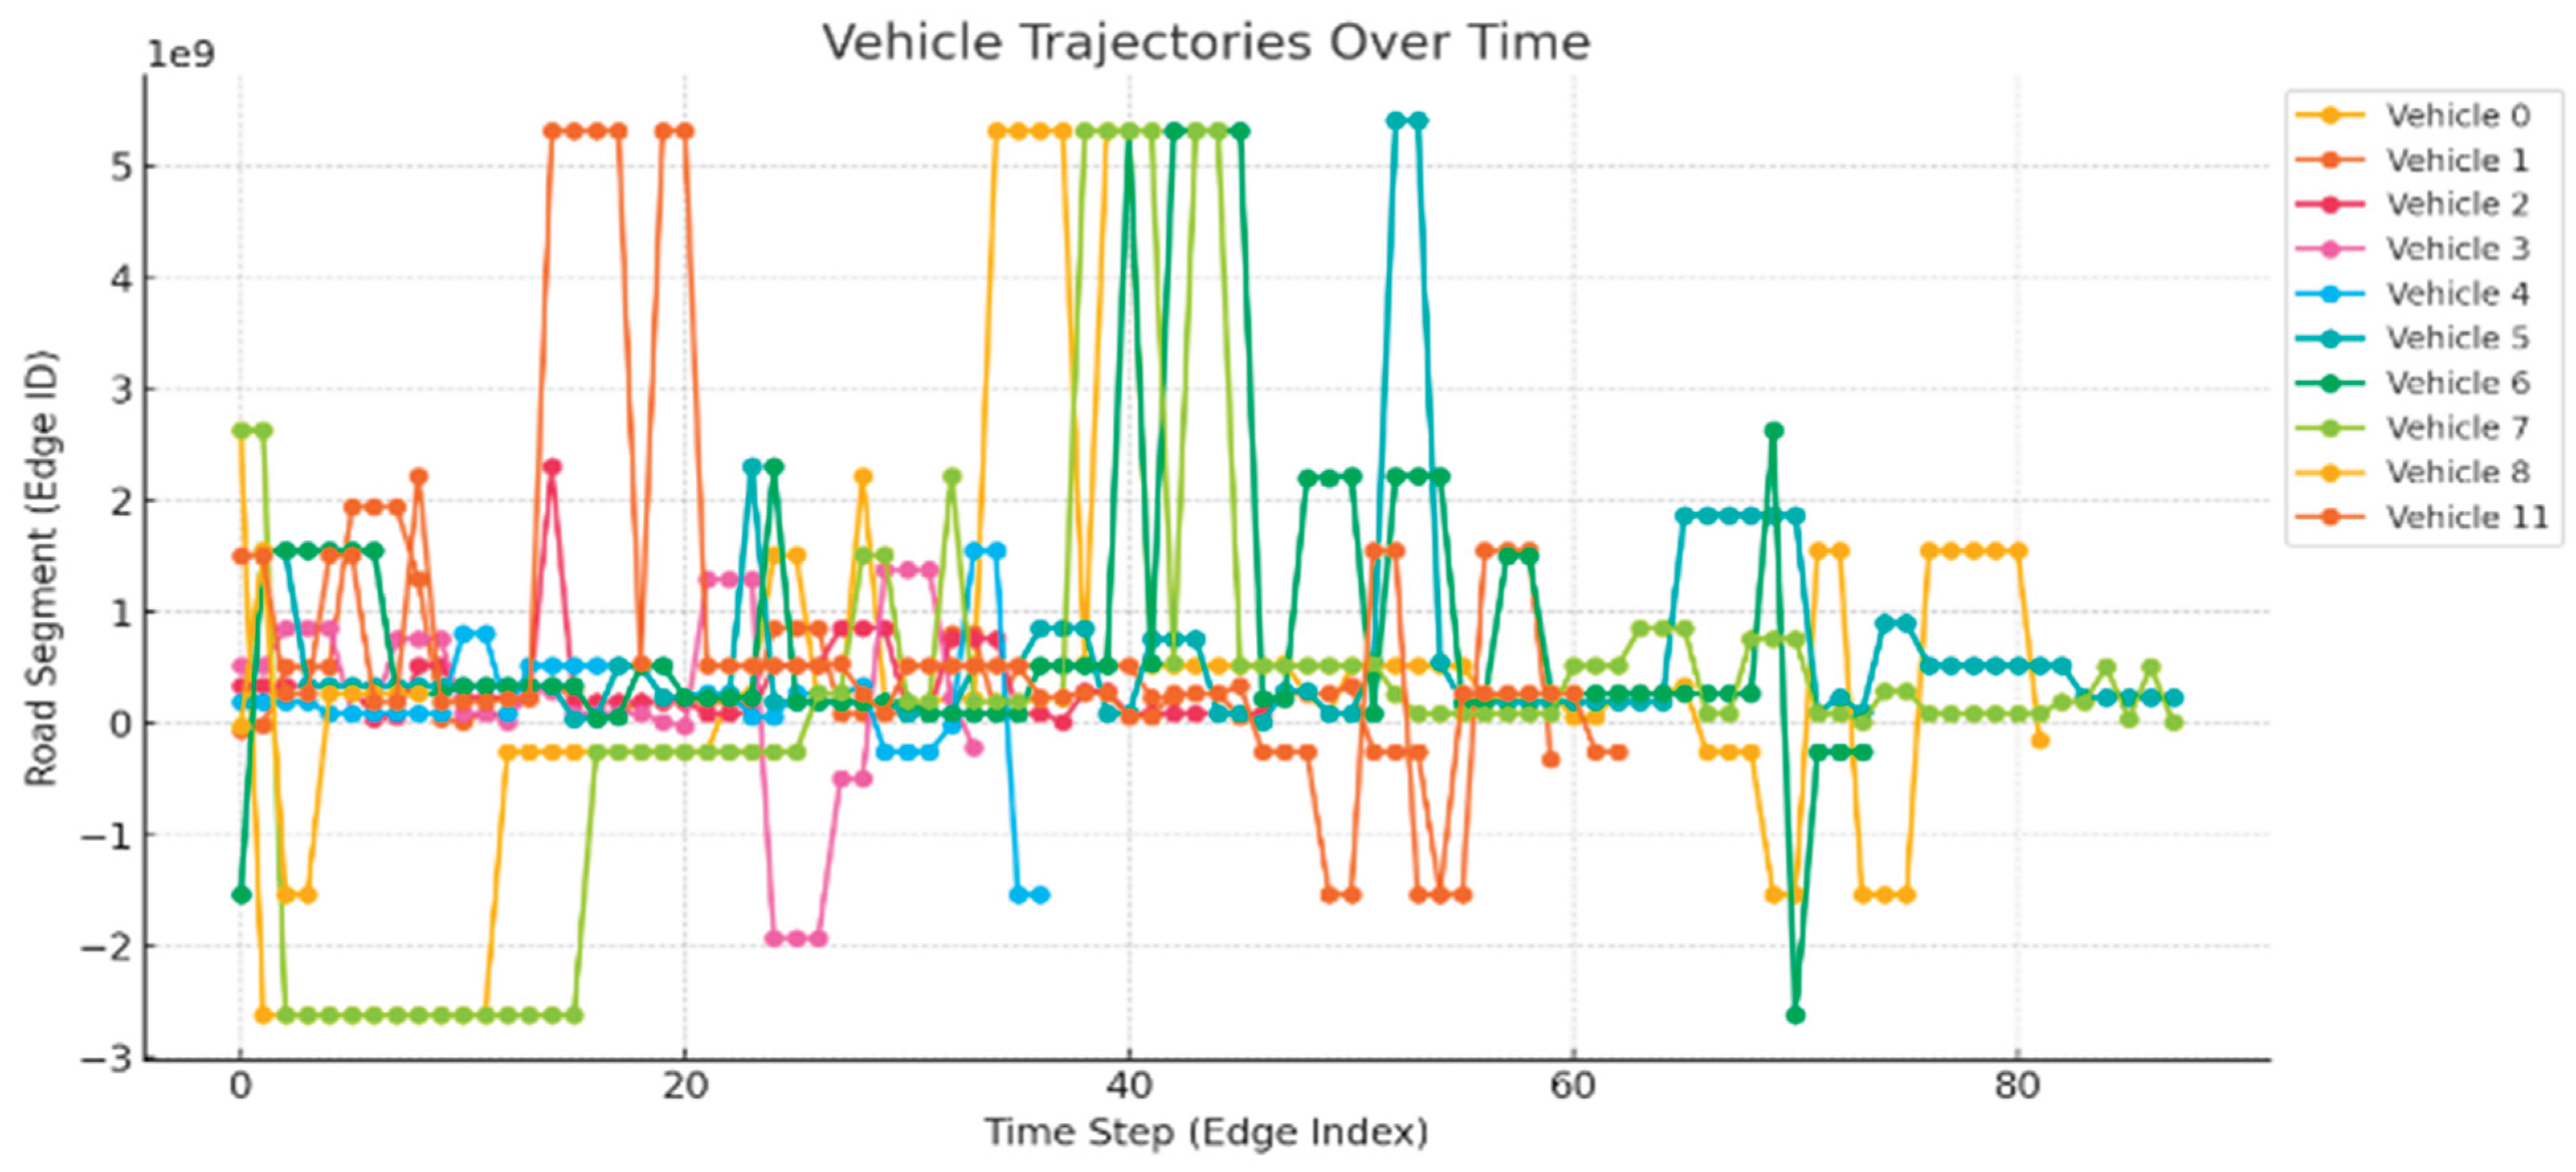
Figure 6.
Congestion levels over time (seconds).
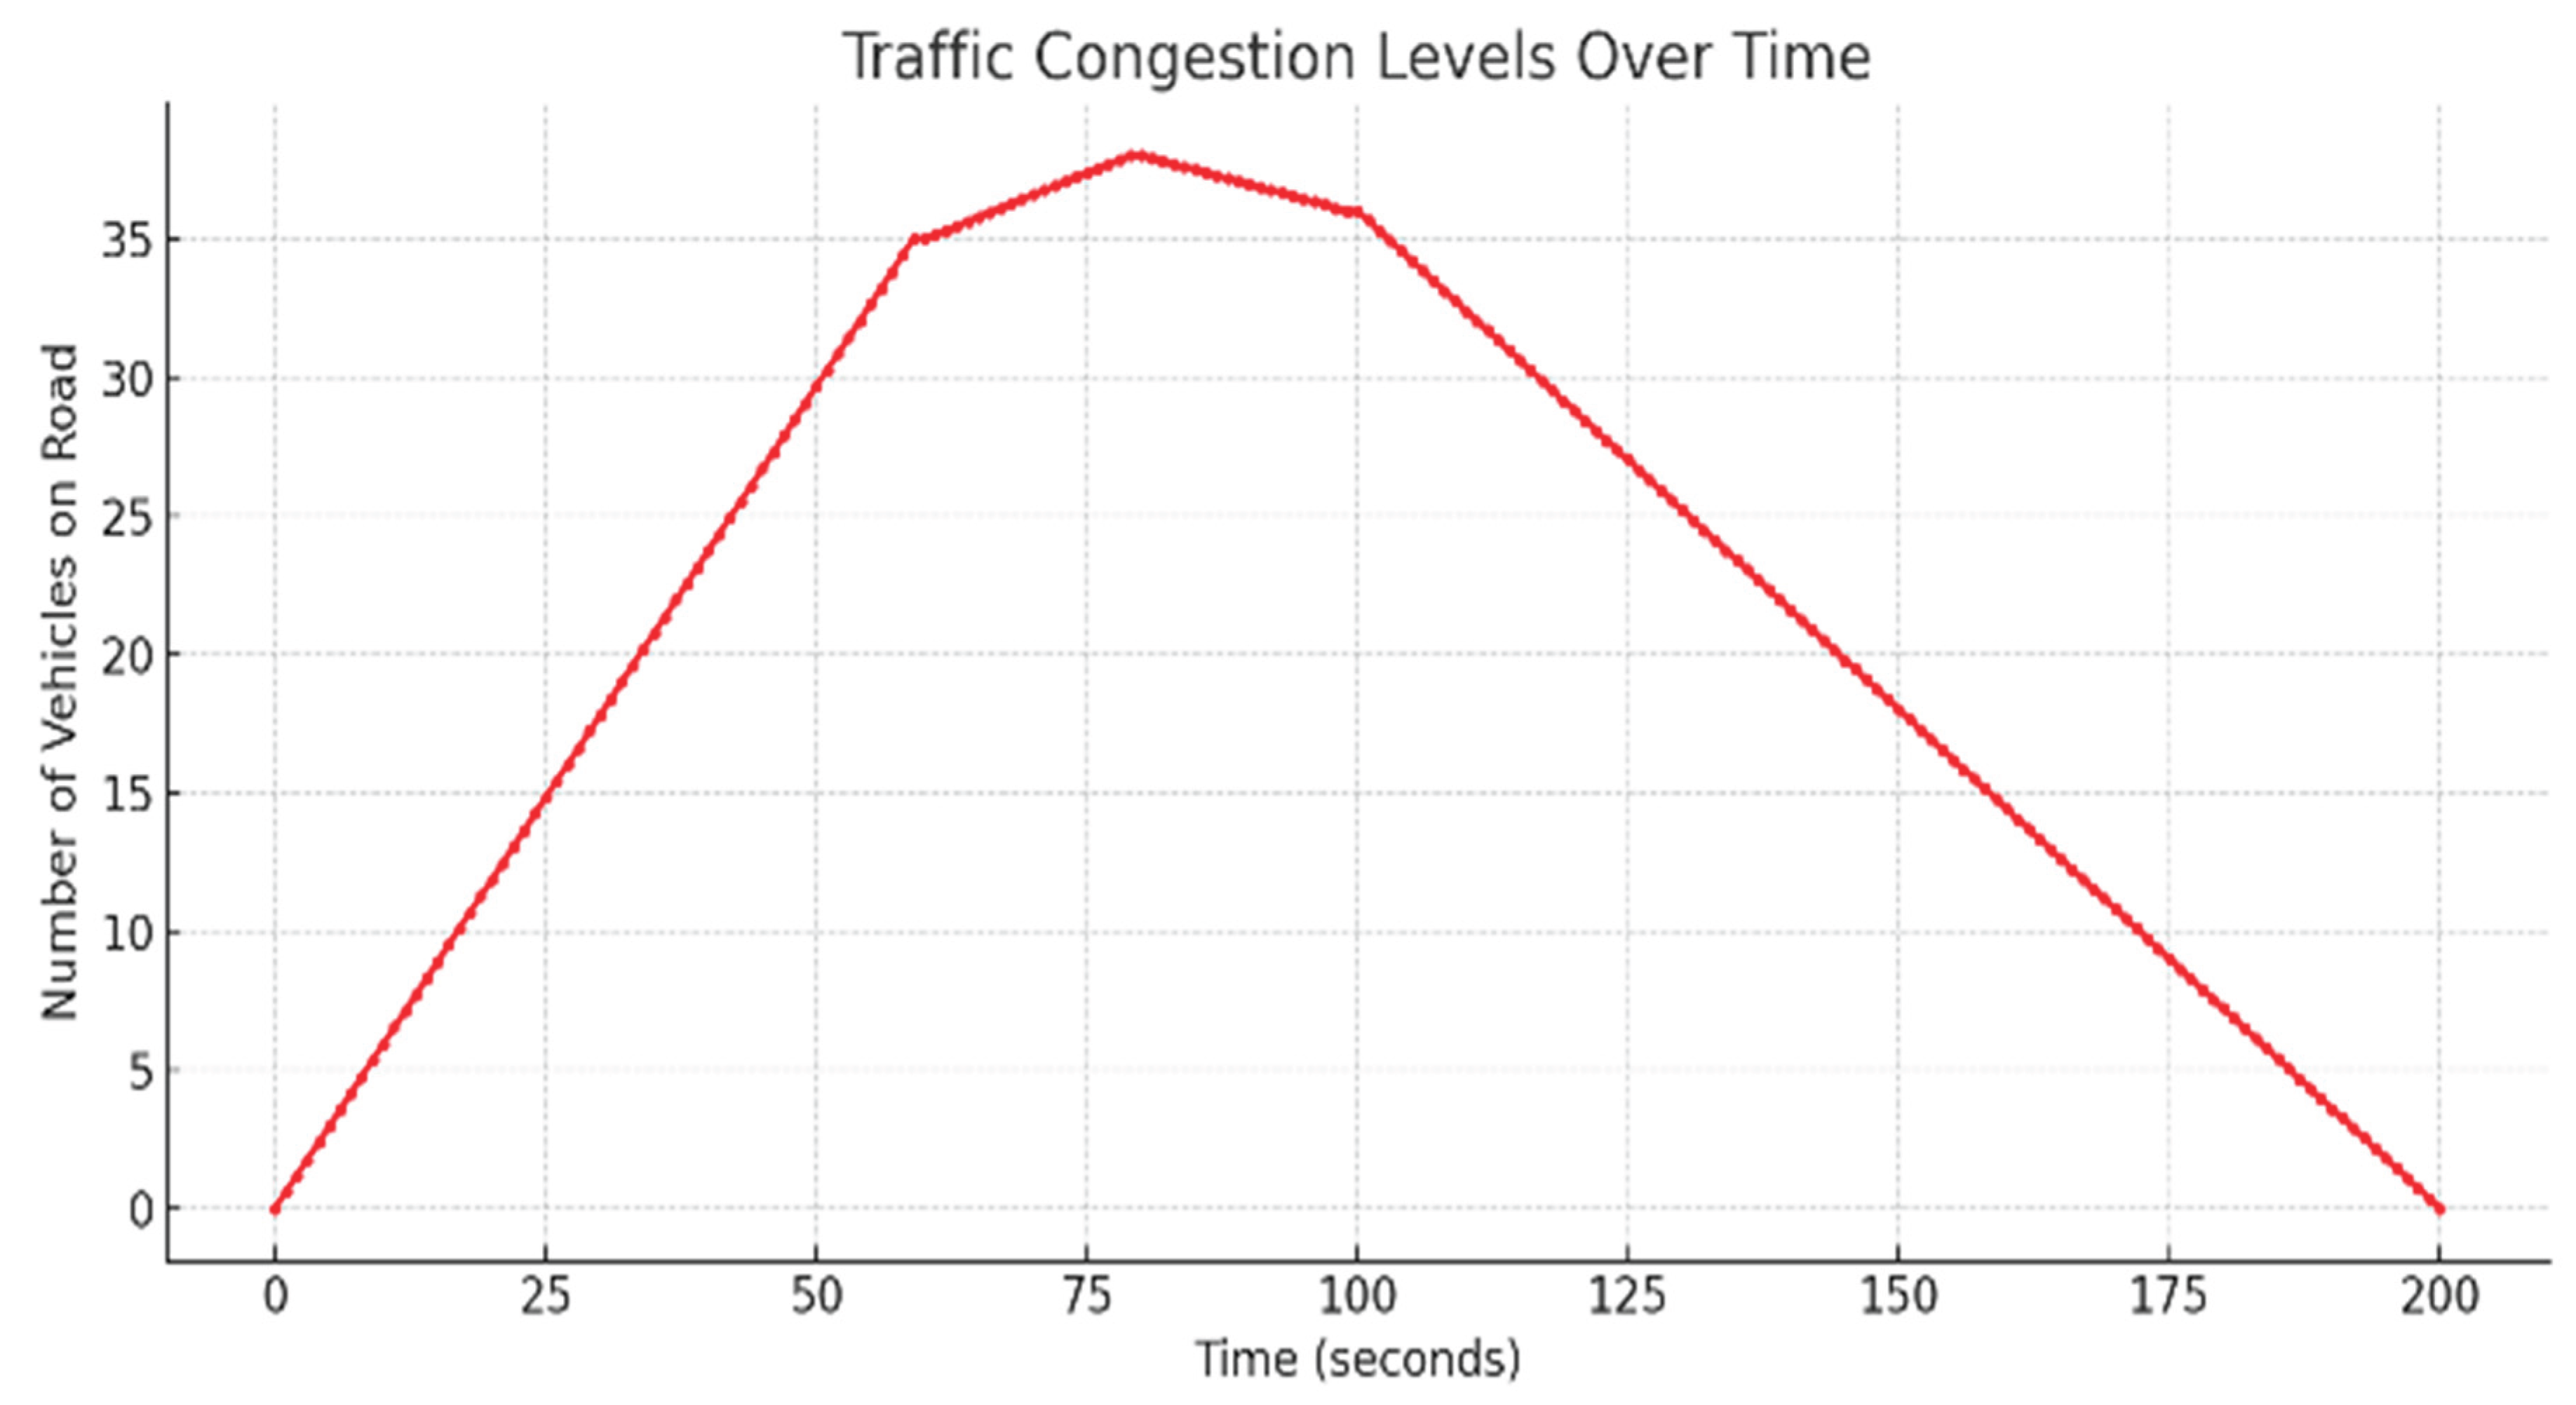
Figure 8.
Vehicle densities in GNN.
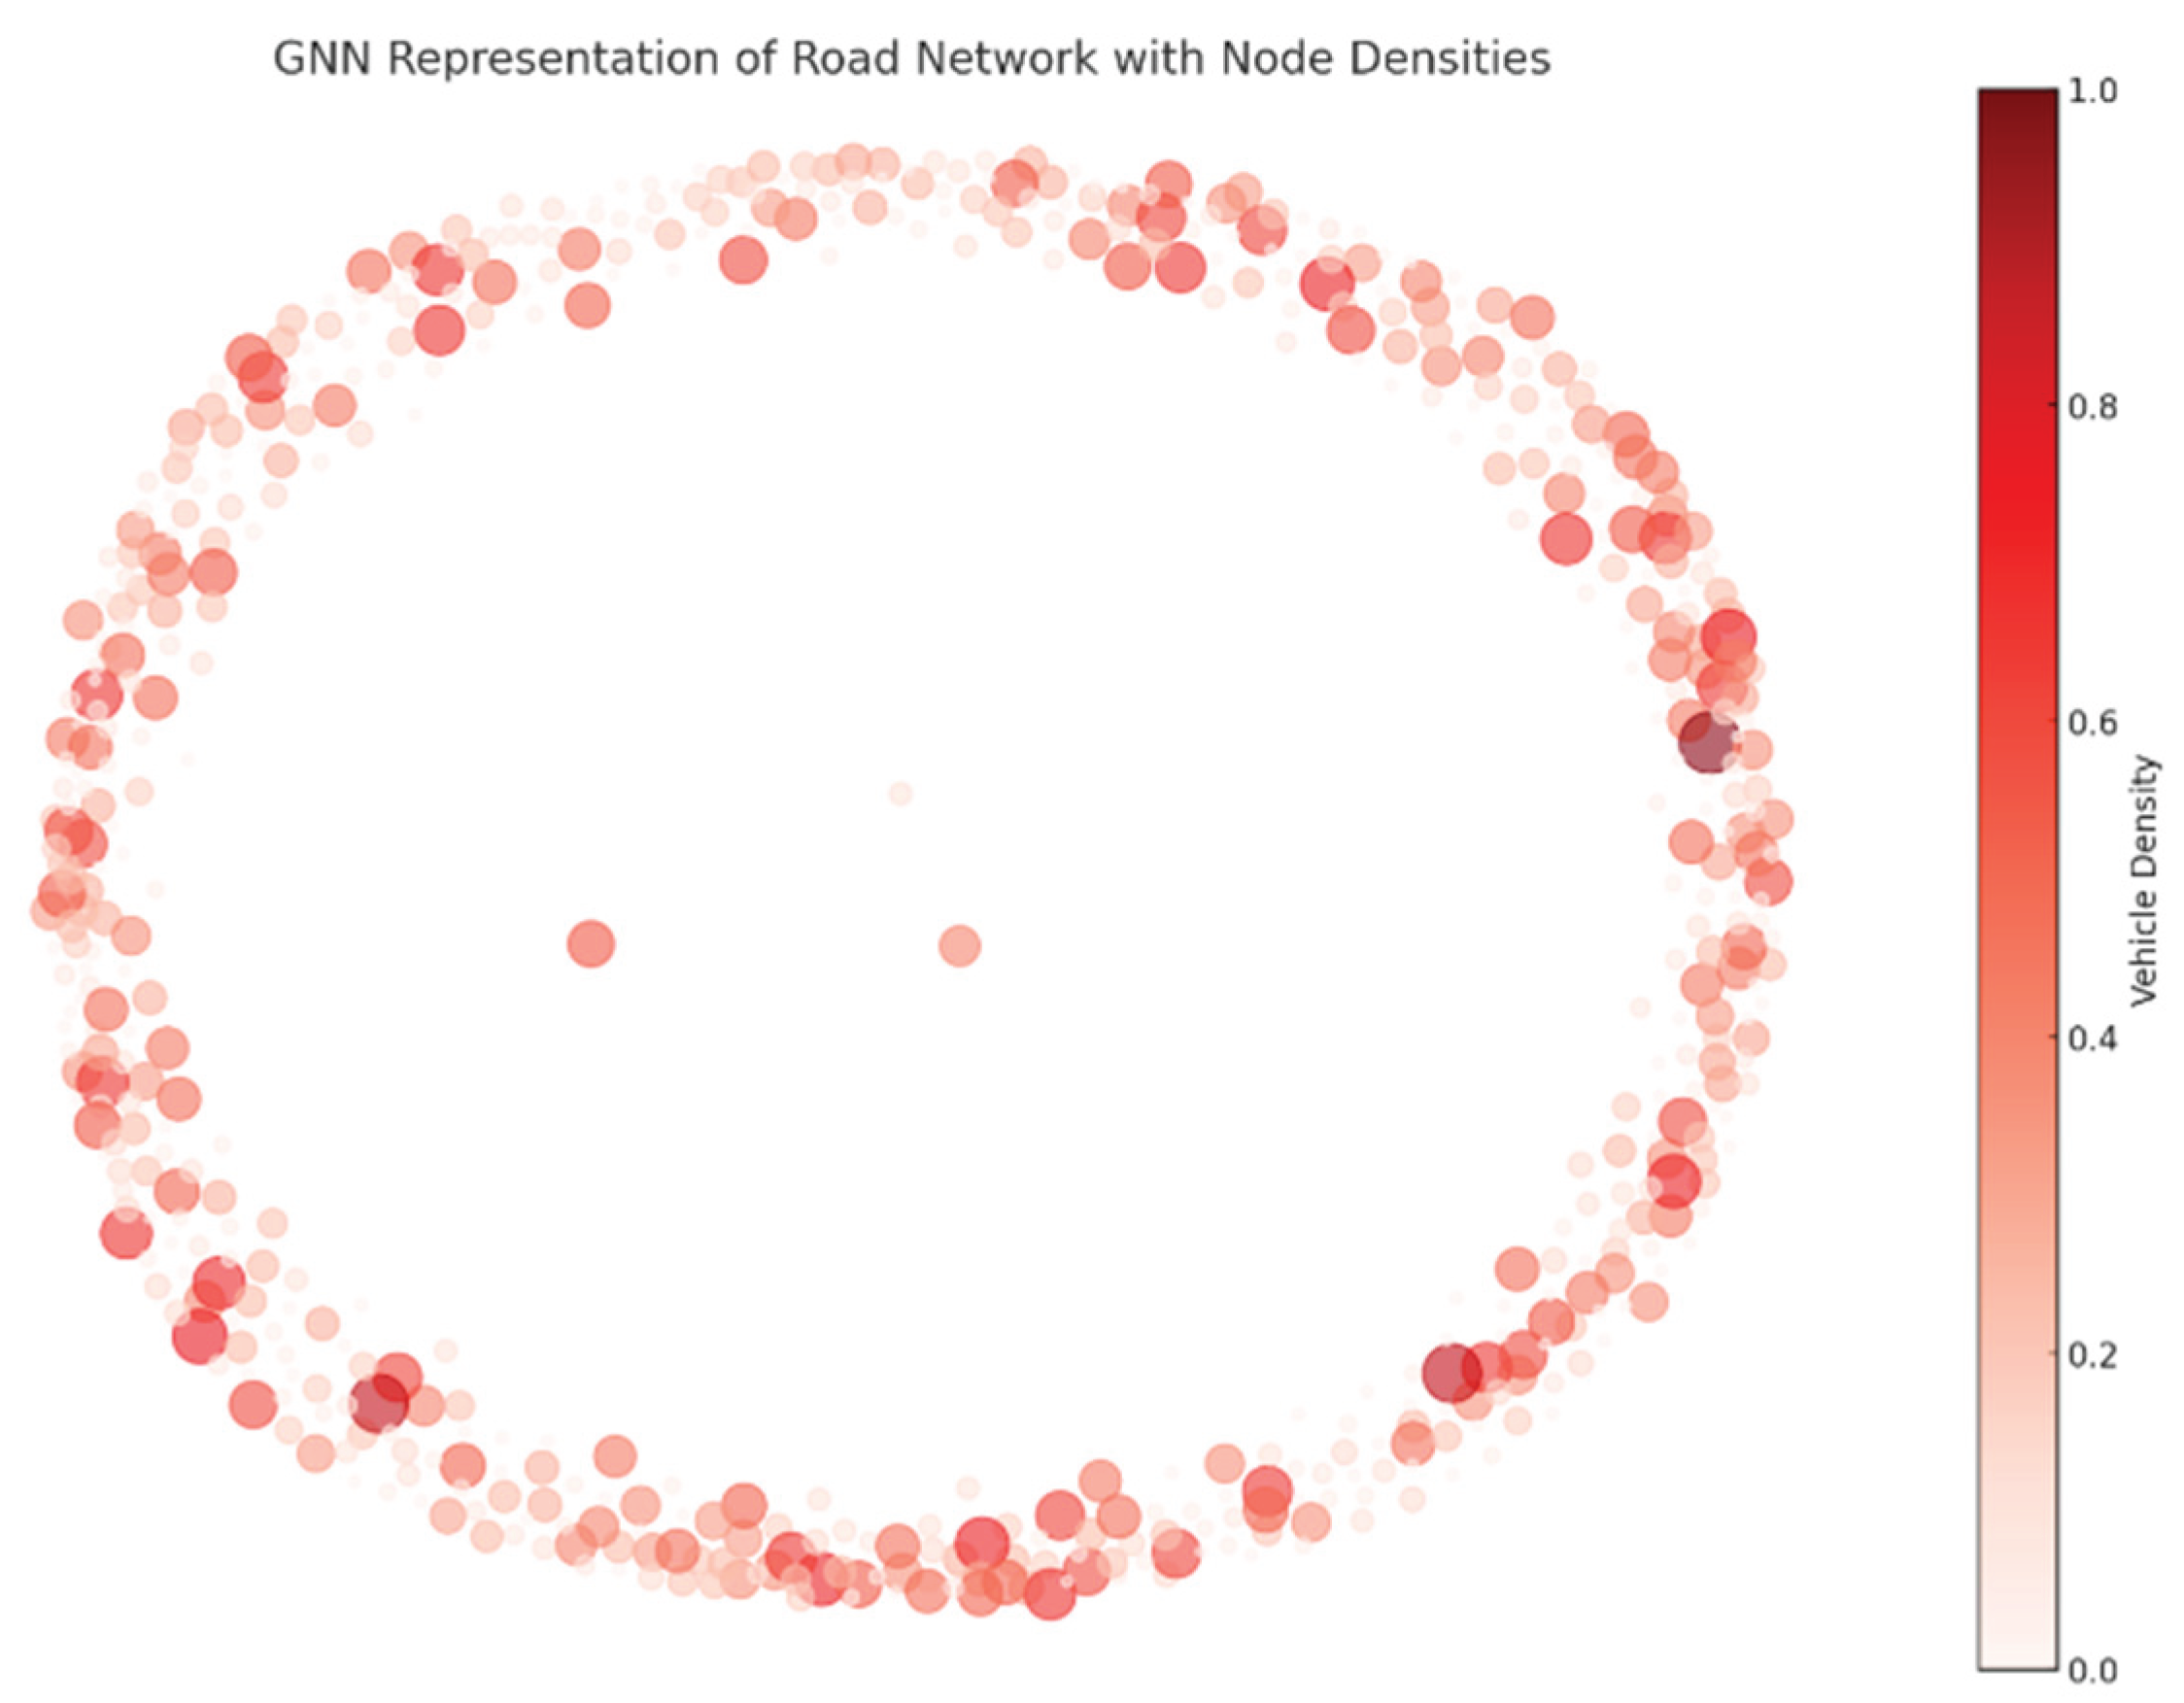
Figure 9.
Node level output.
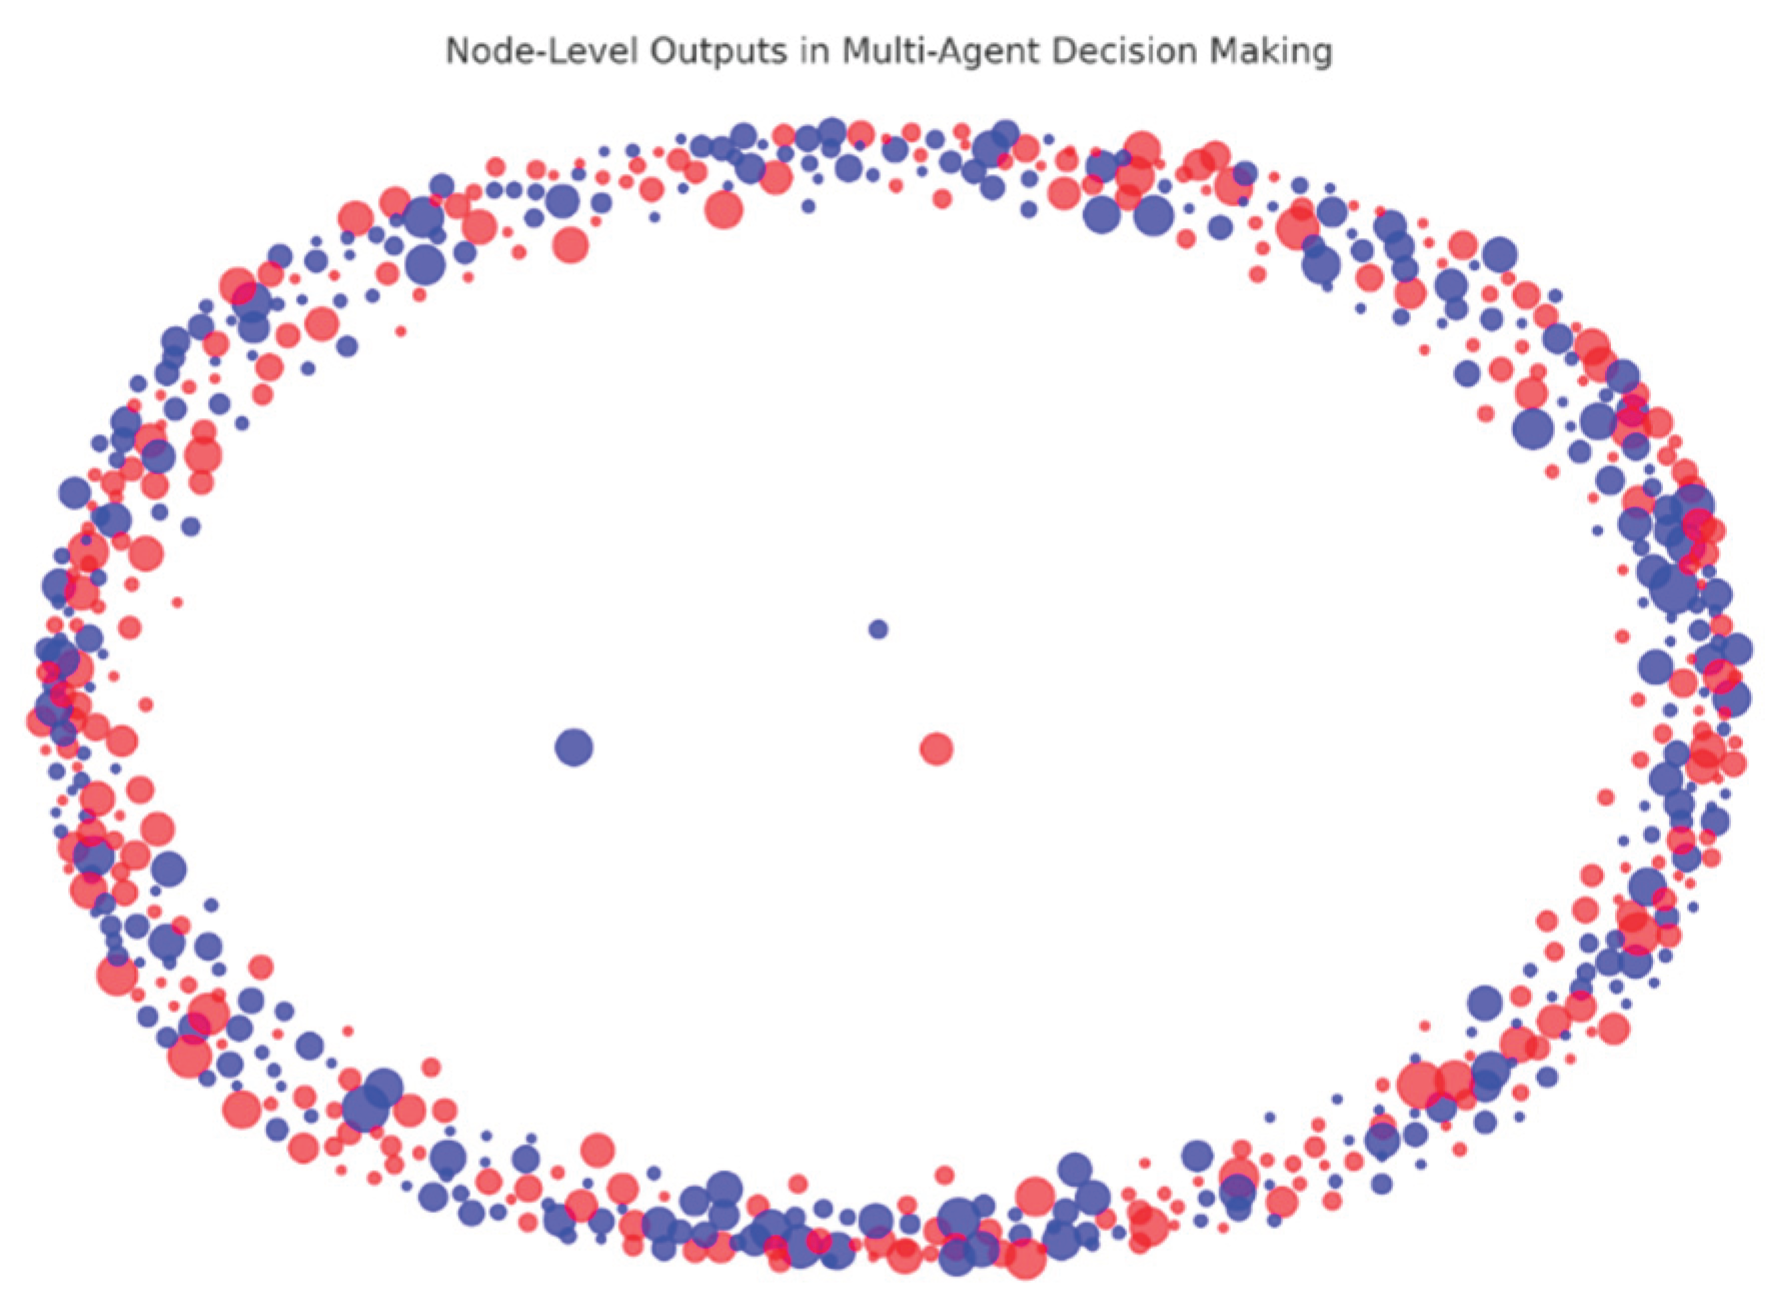
Figure 10.
Edge level output.
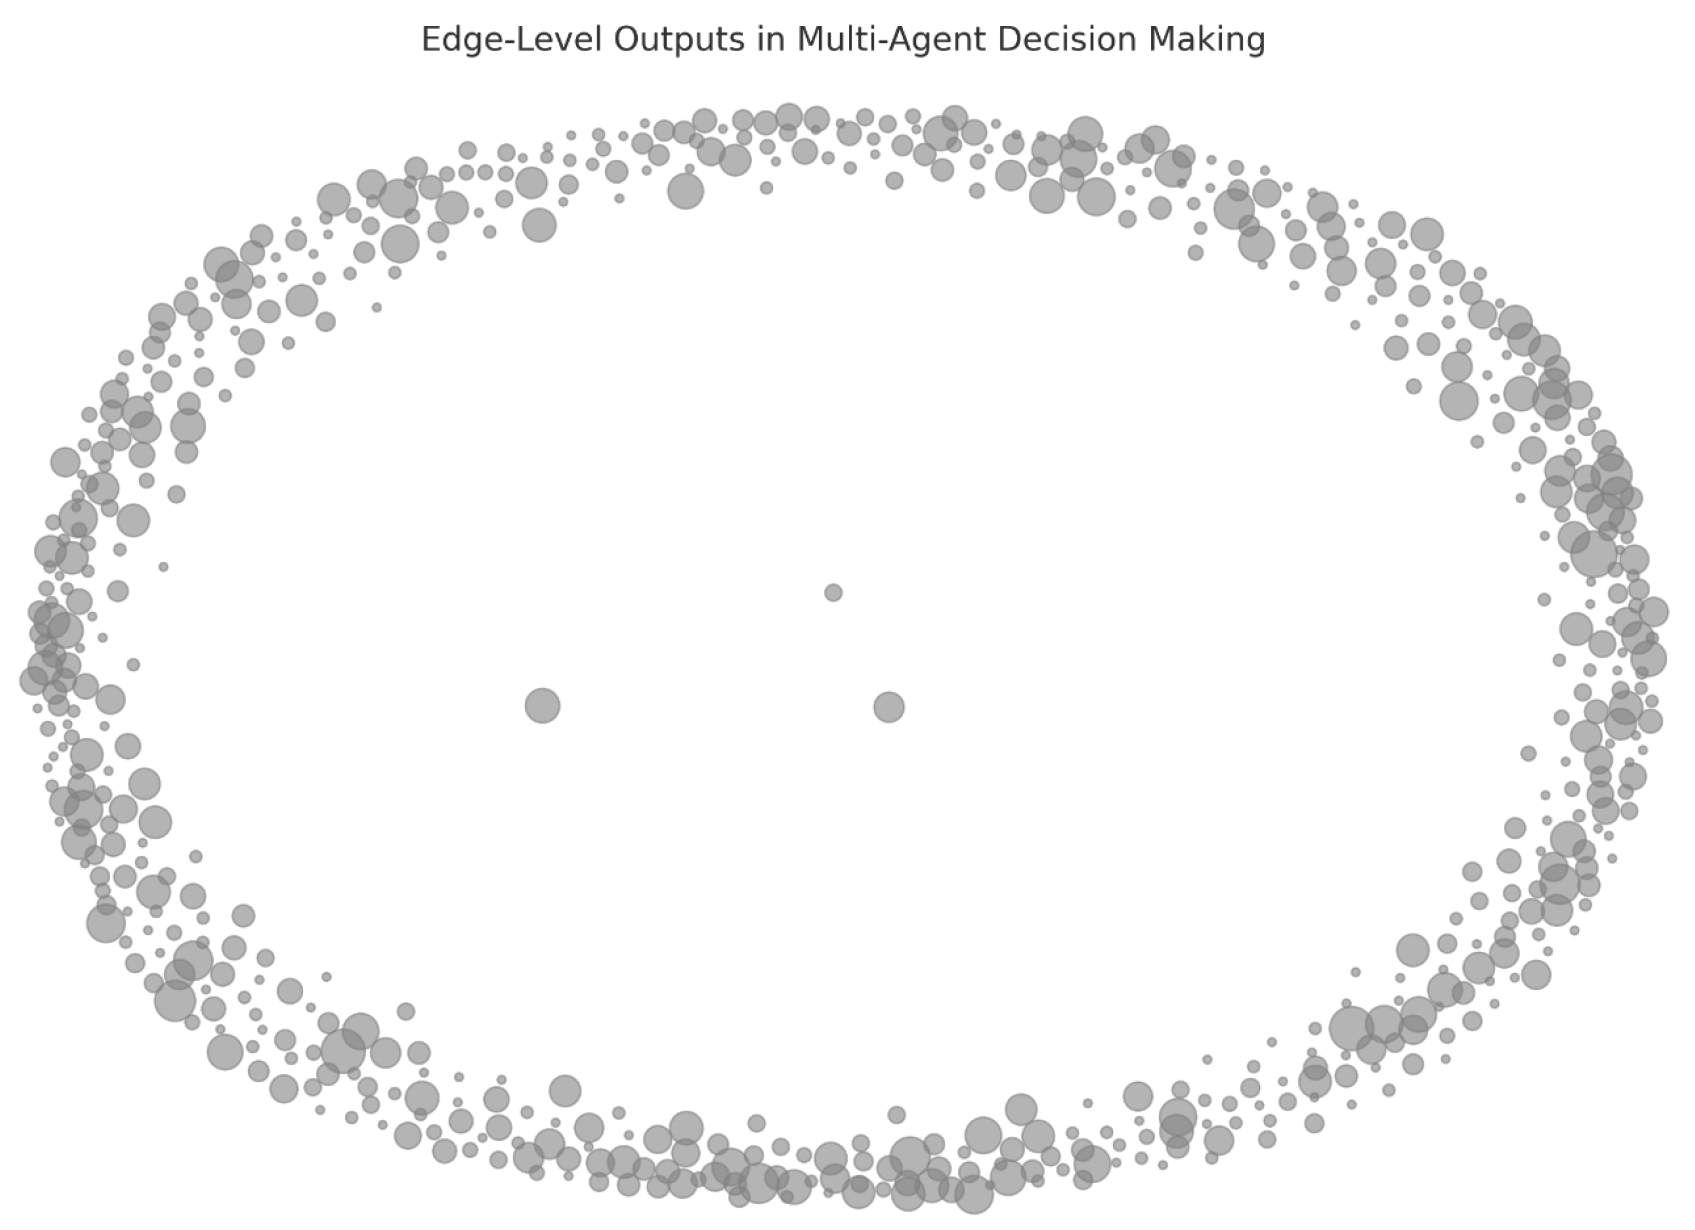
Figure 11.
Reward distribution diagram for GNN.
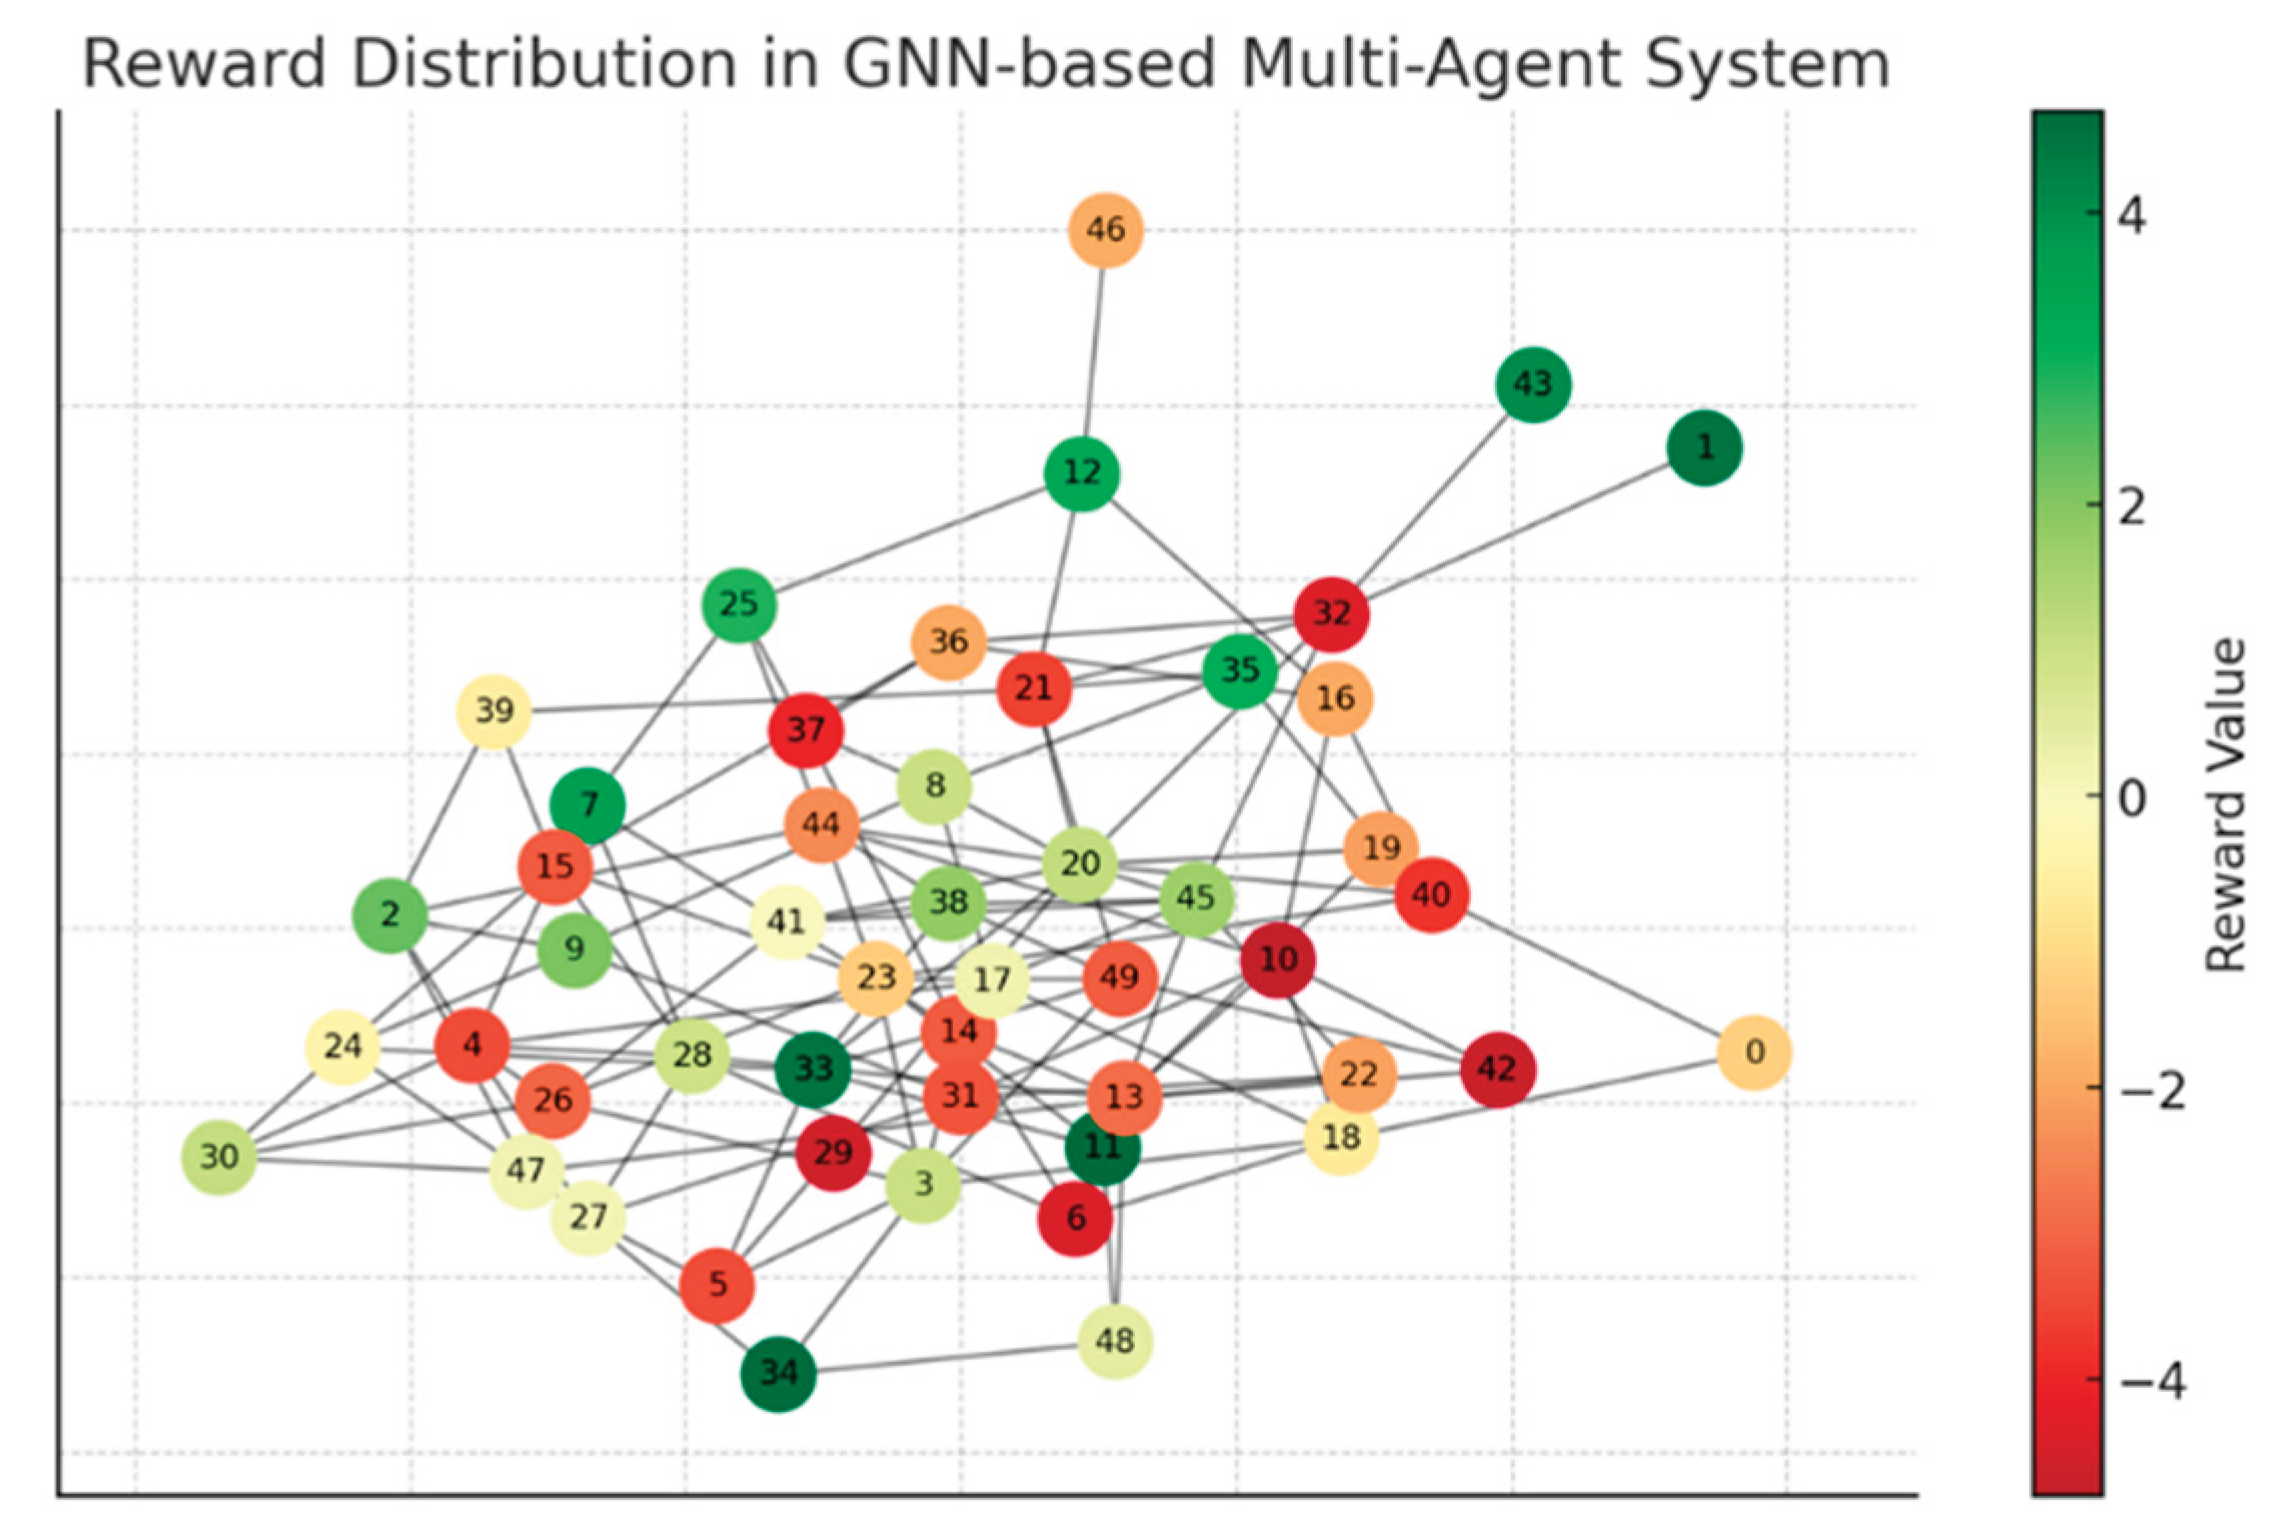
Figure 12.
AMAGNN performance in VANET congestion control using PDR.
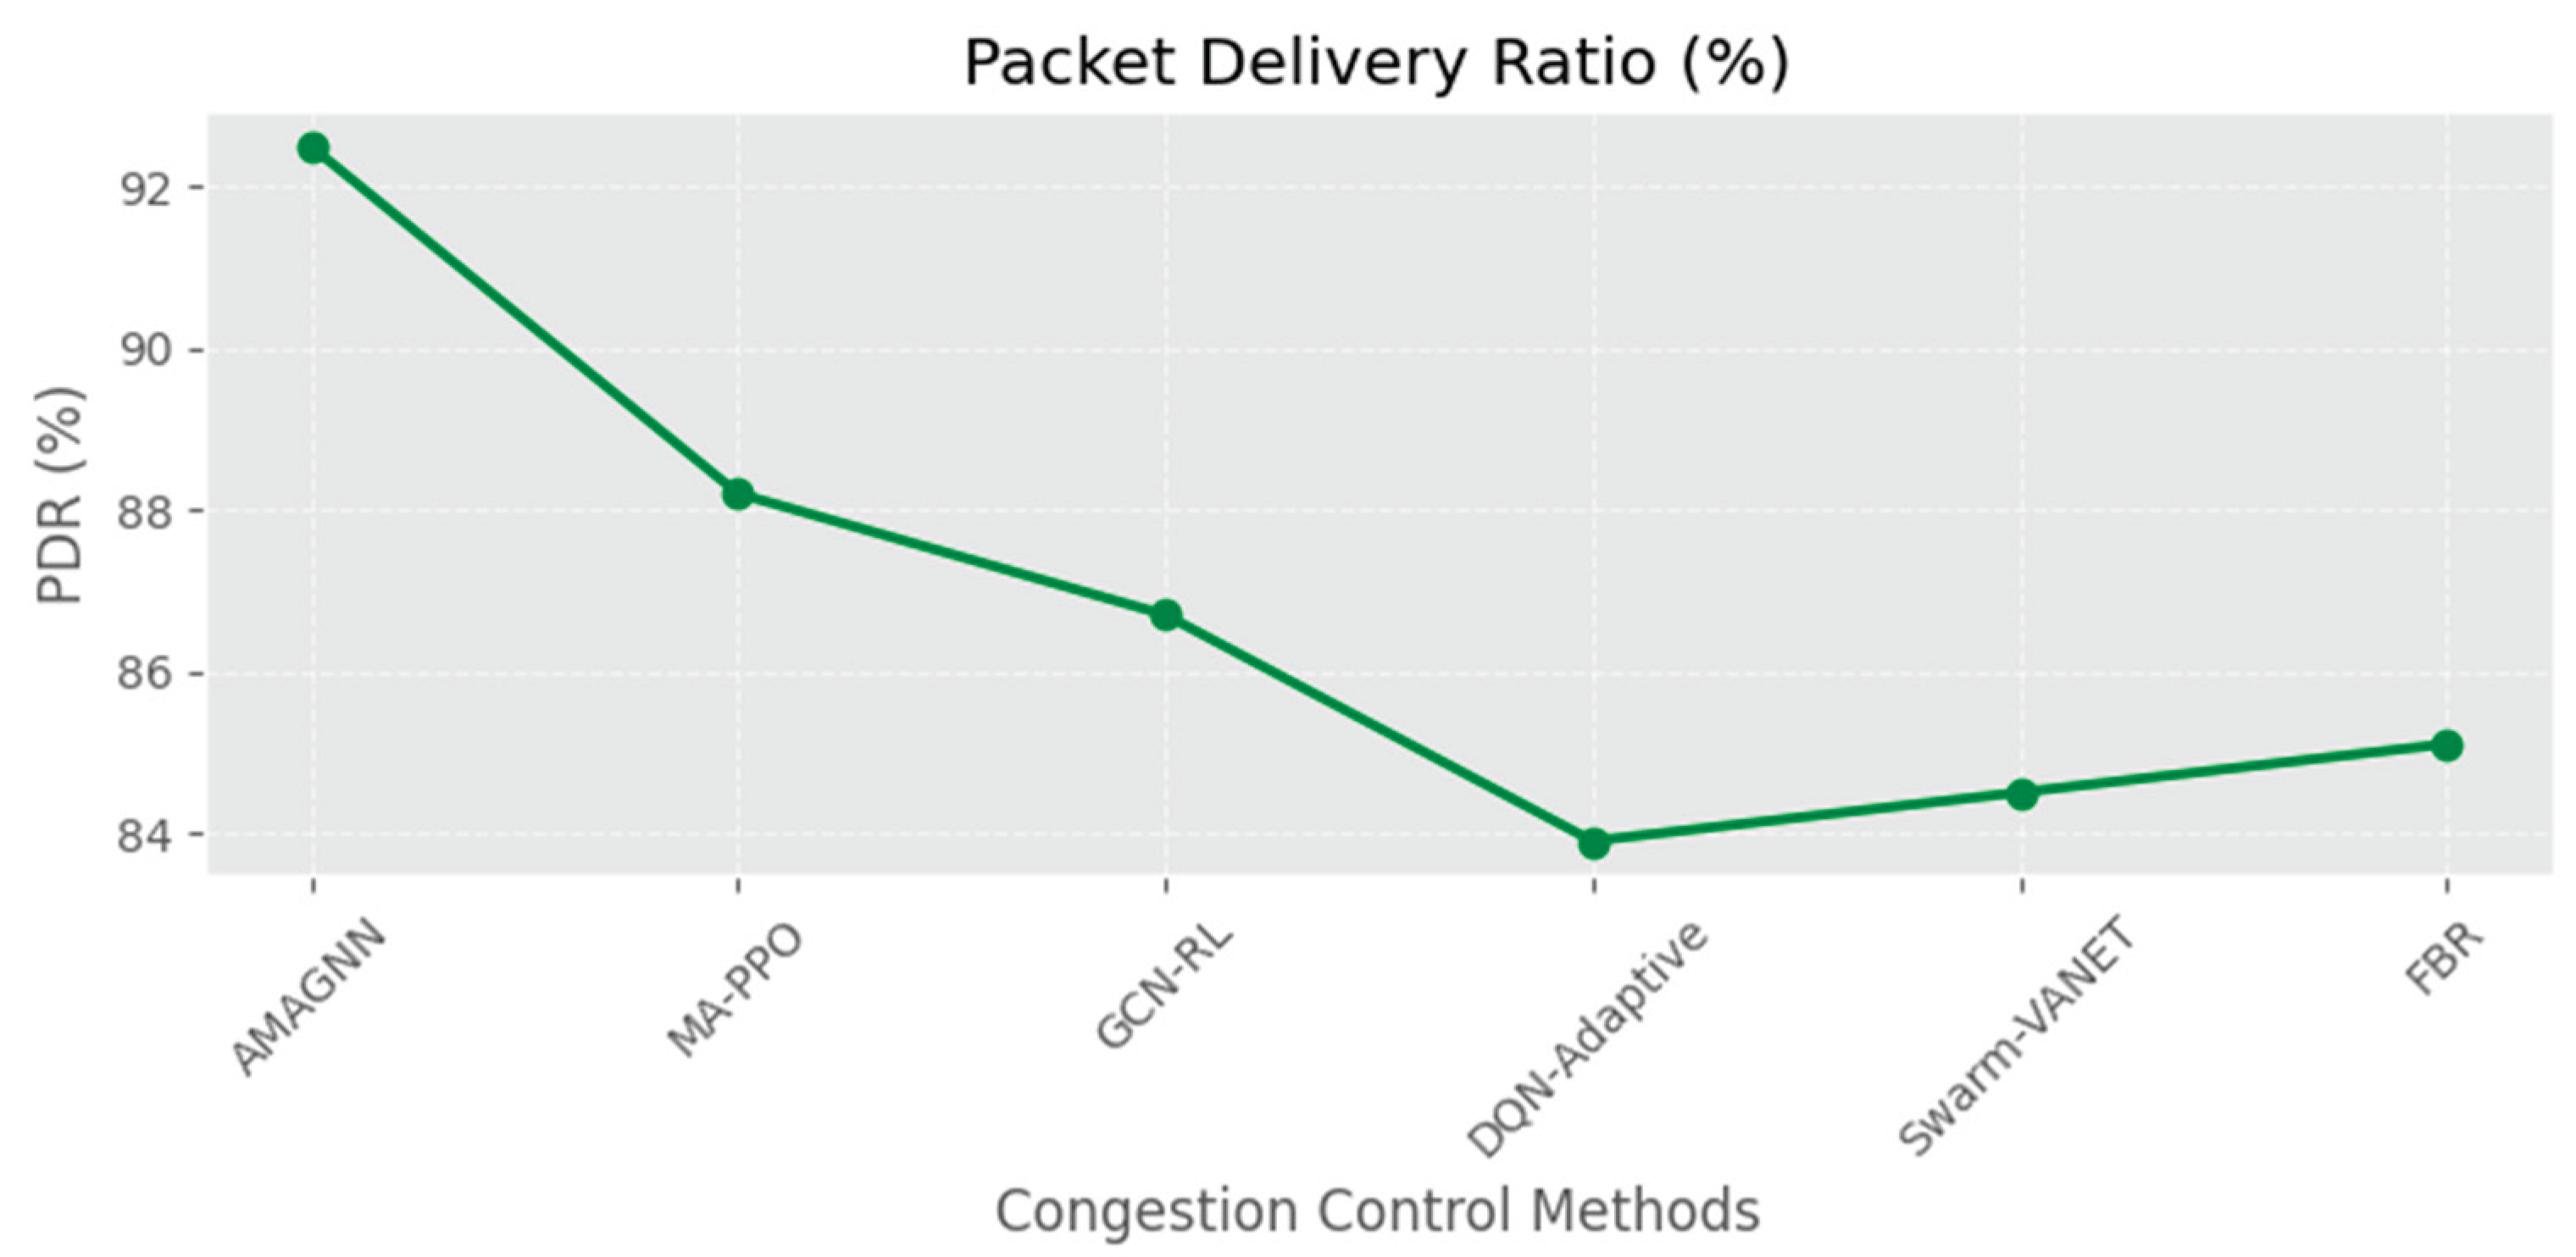
Figure 13.
AMAGNN performance in VANET congestion control using E2E delay.
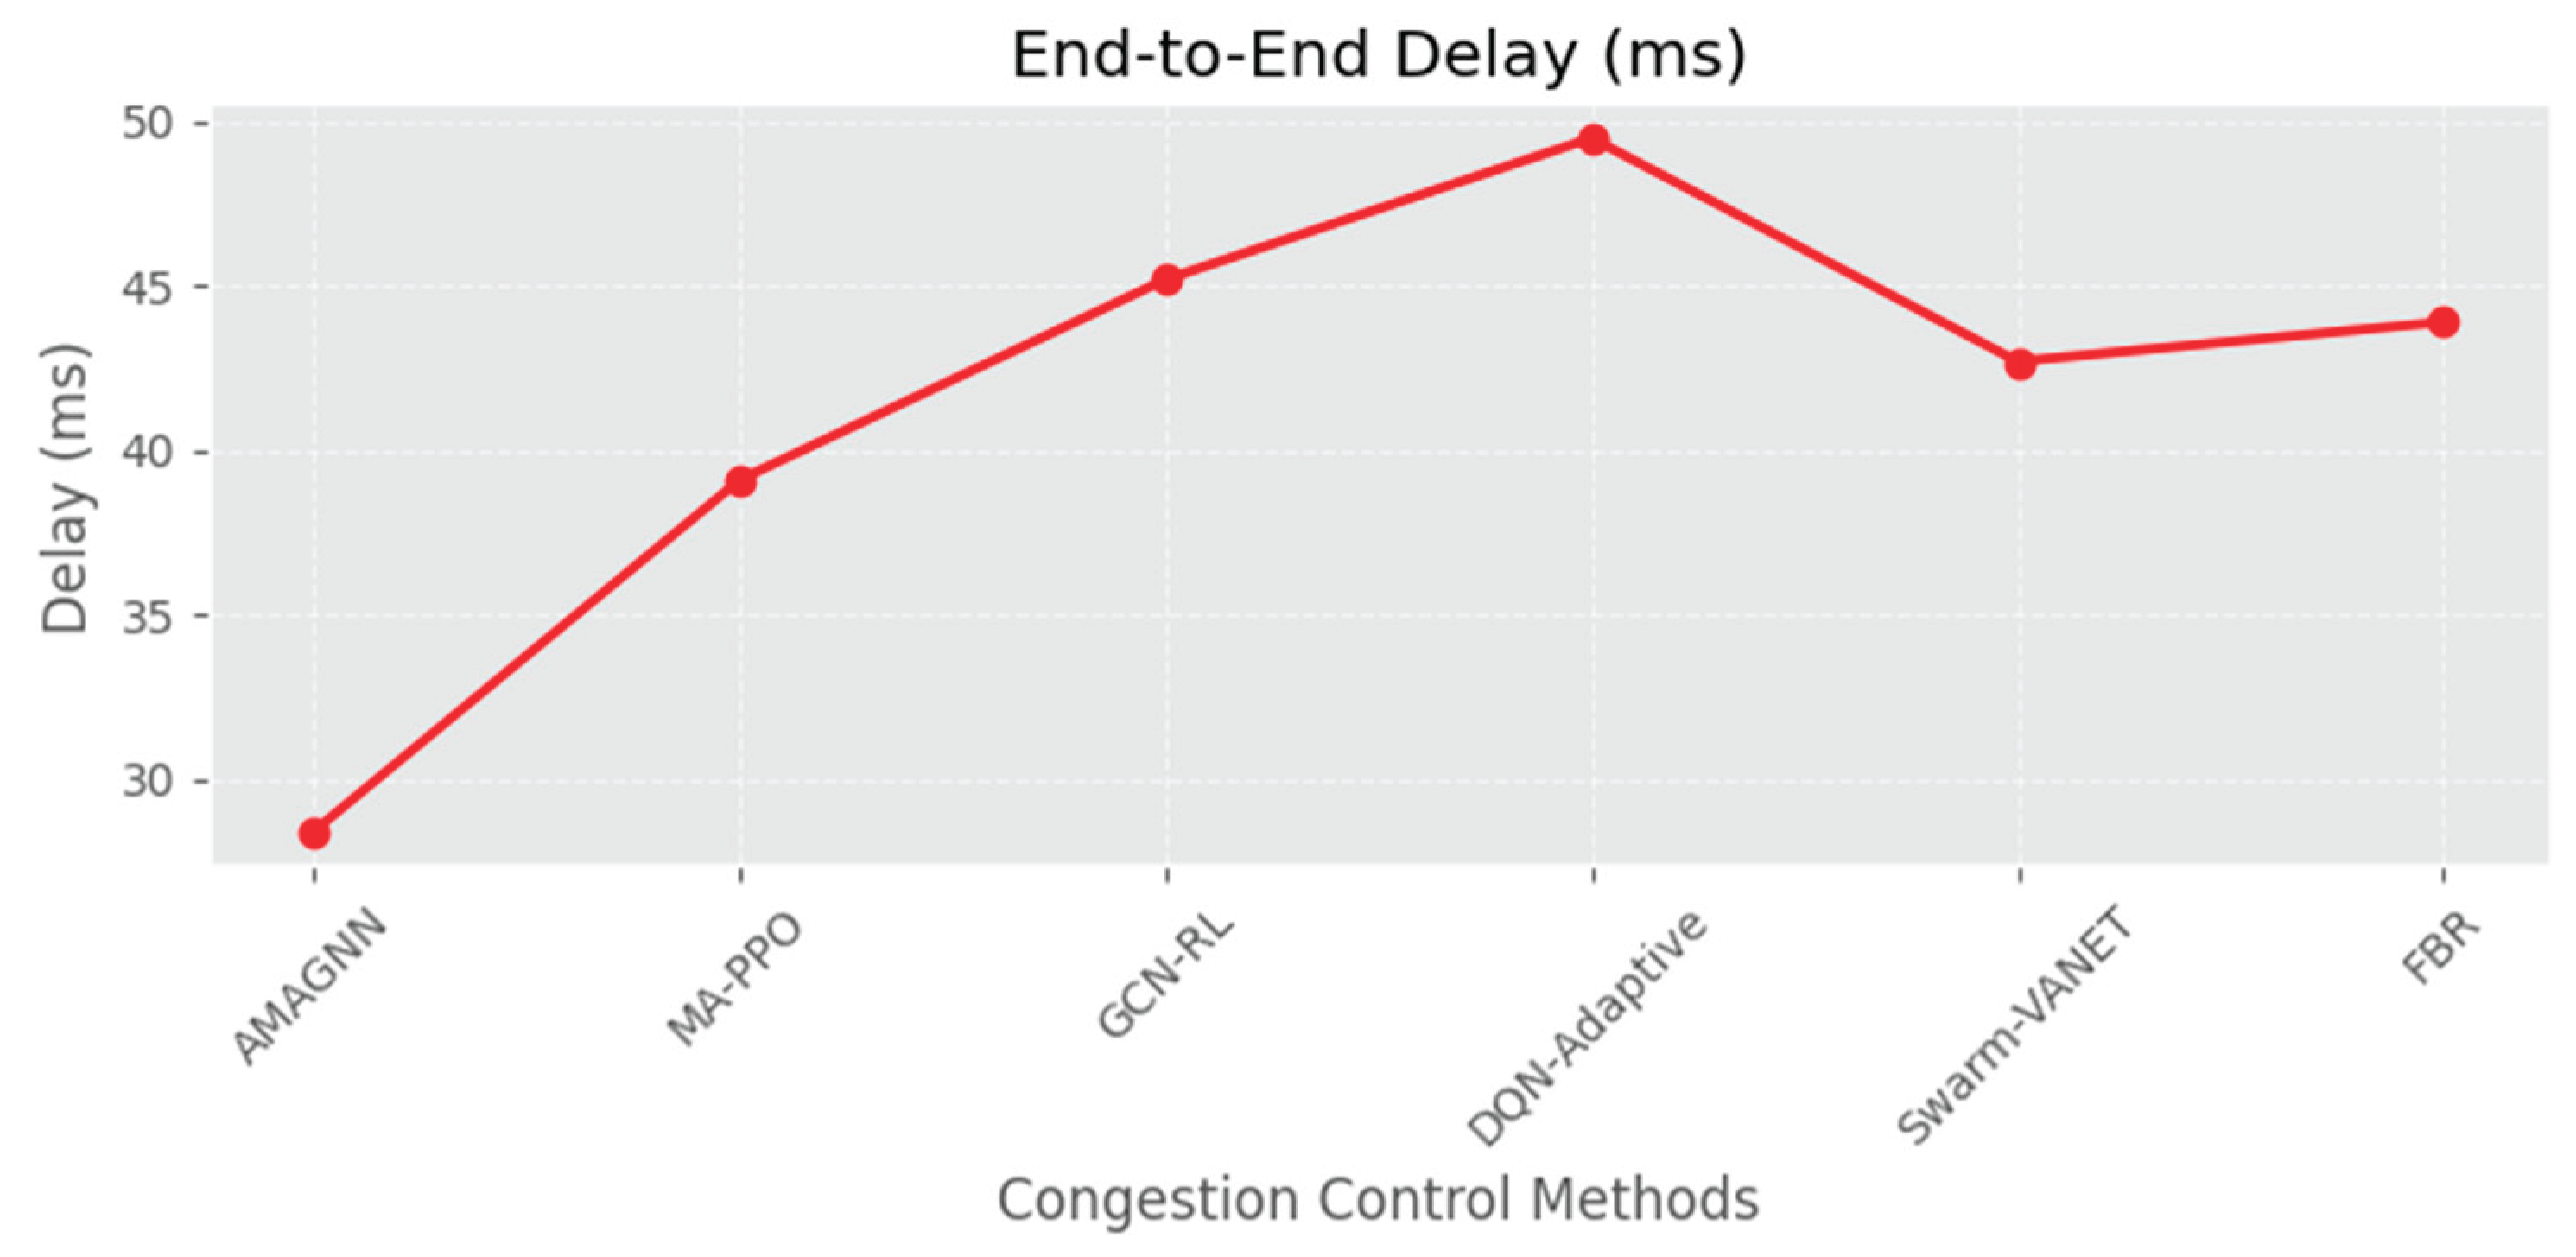
Figure 14.
AMAGNN performance in VANET congestion control using throughput.
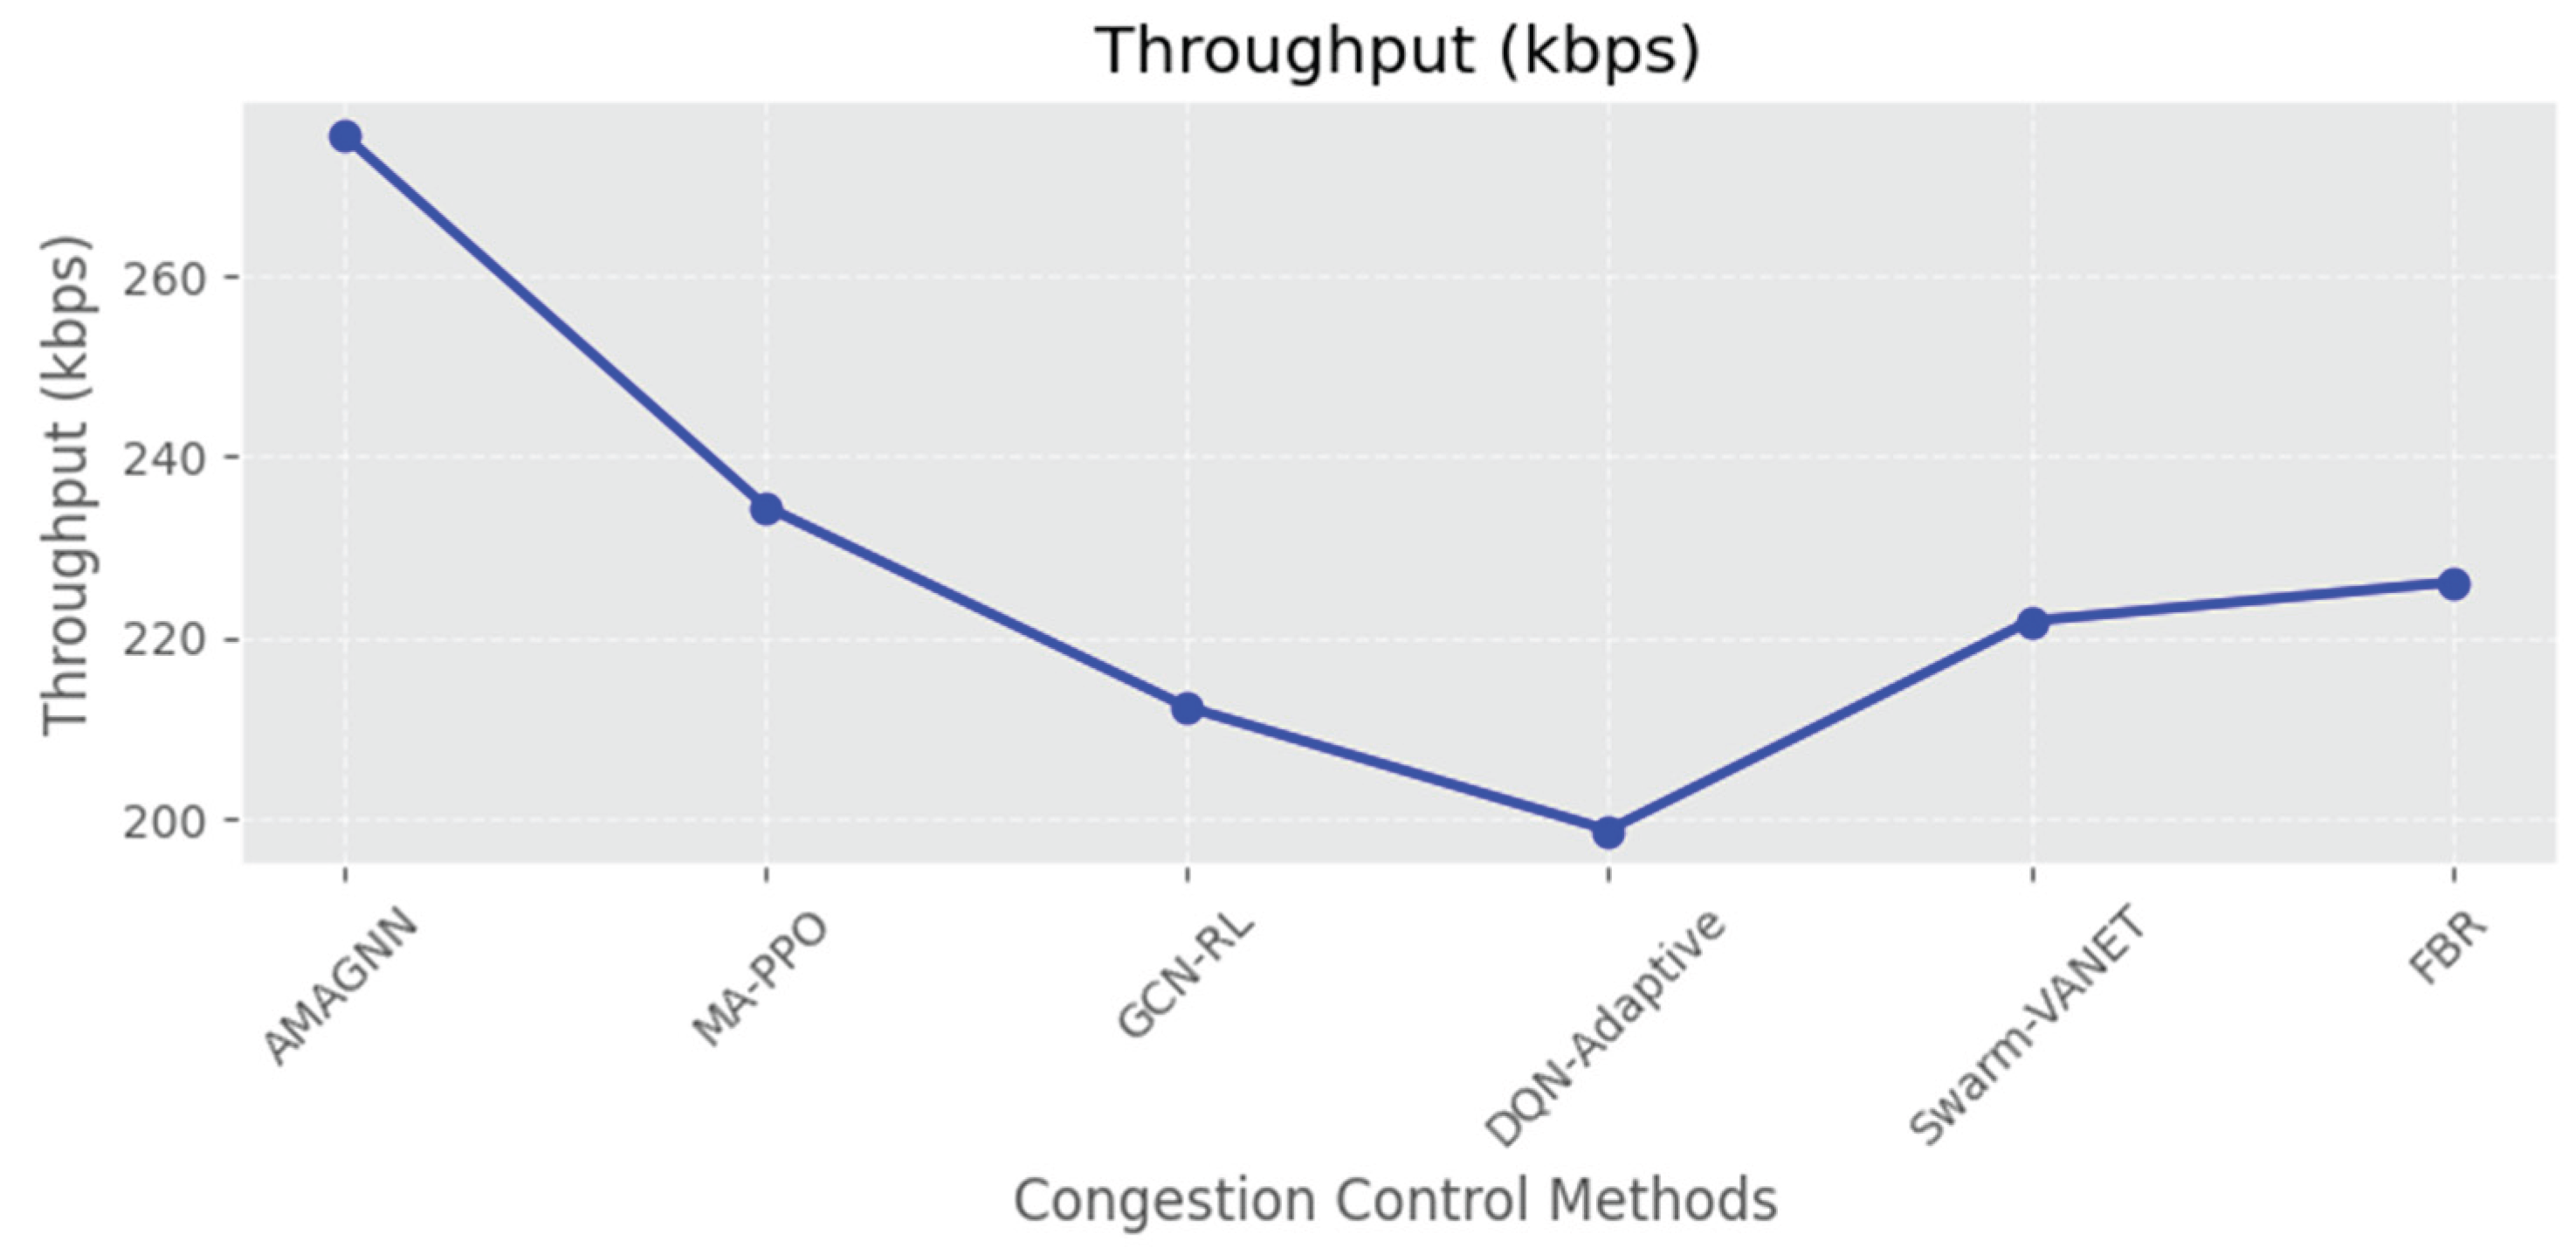
Figure 15.
AMAGNN performance in VANET congestion control using AWT.
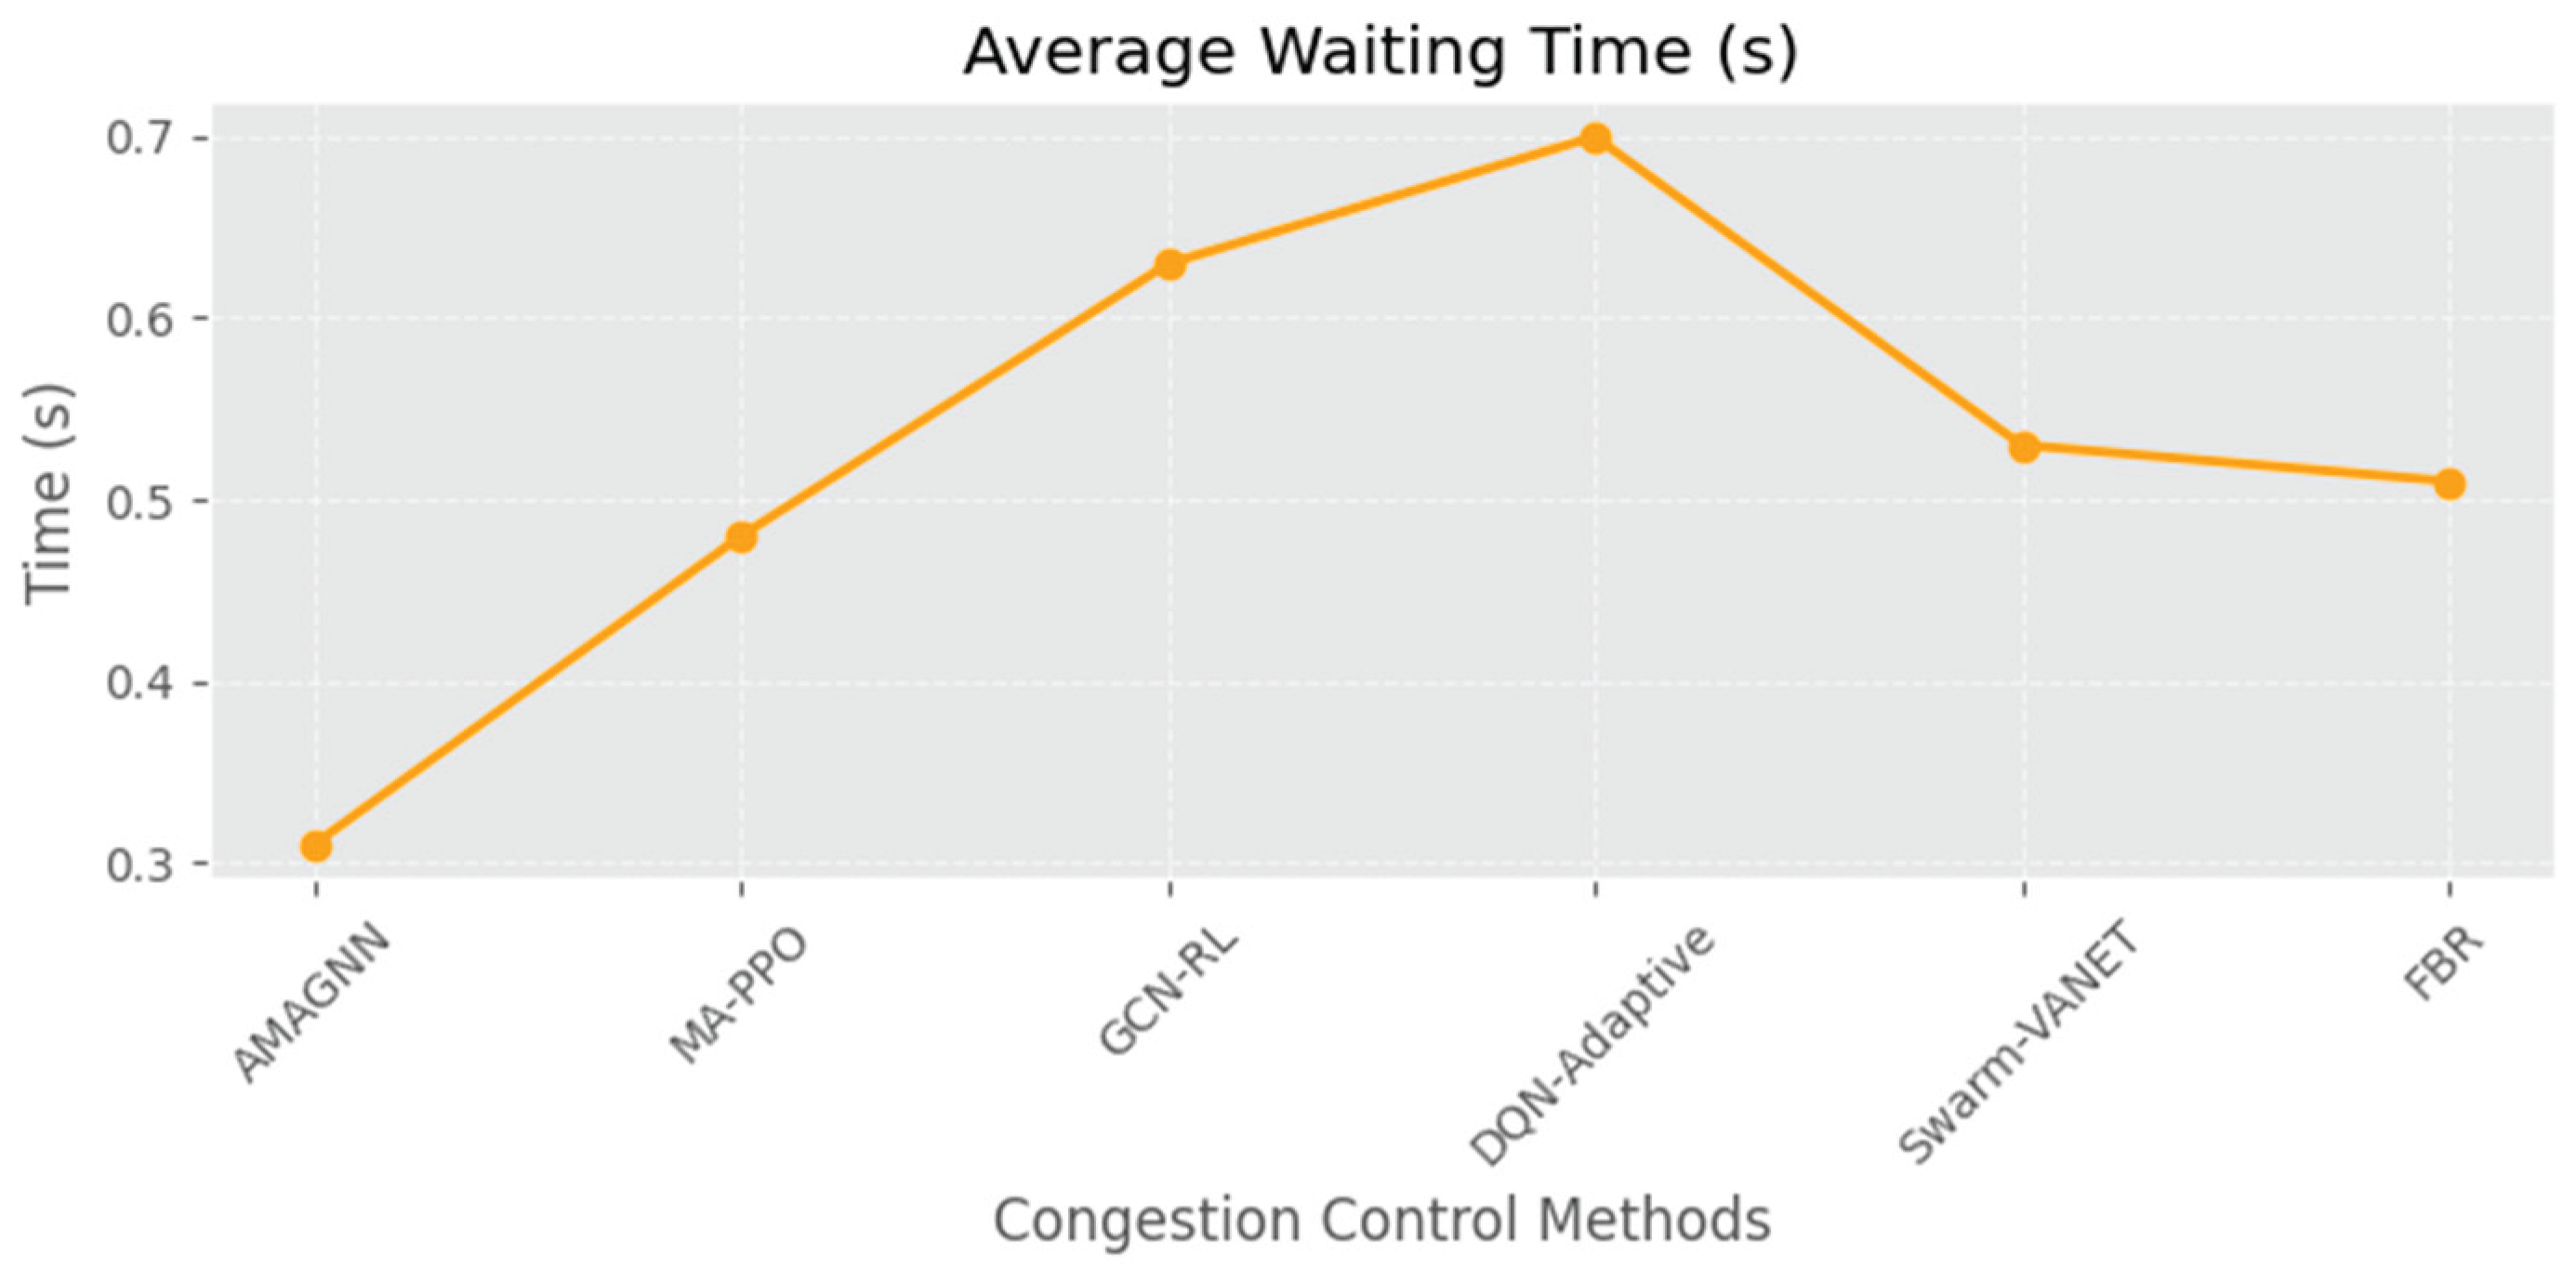
Figure 16.
AMAGNN performance in VANET congestion control using CI.
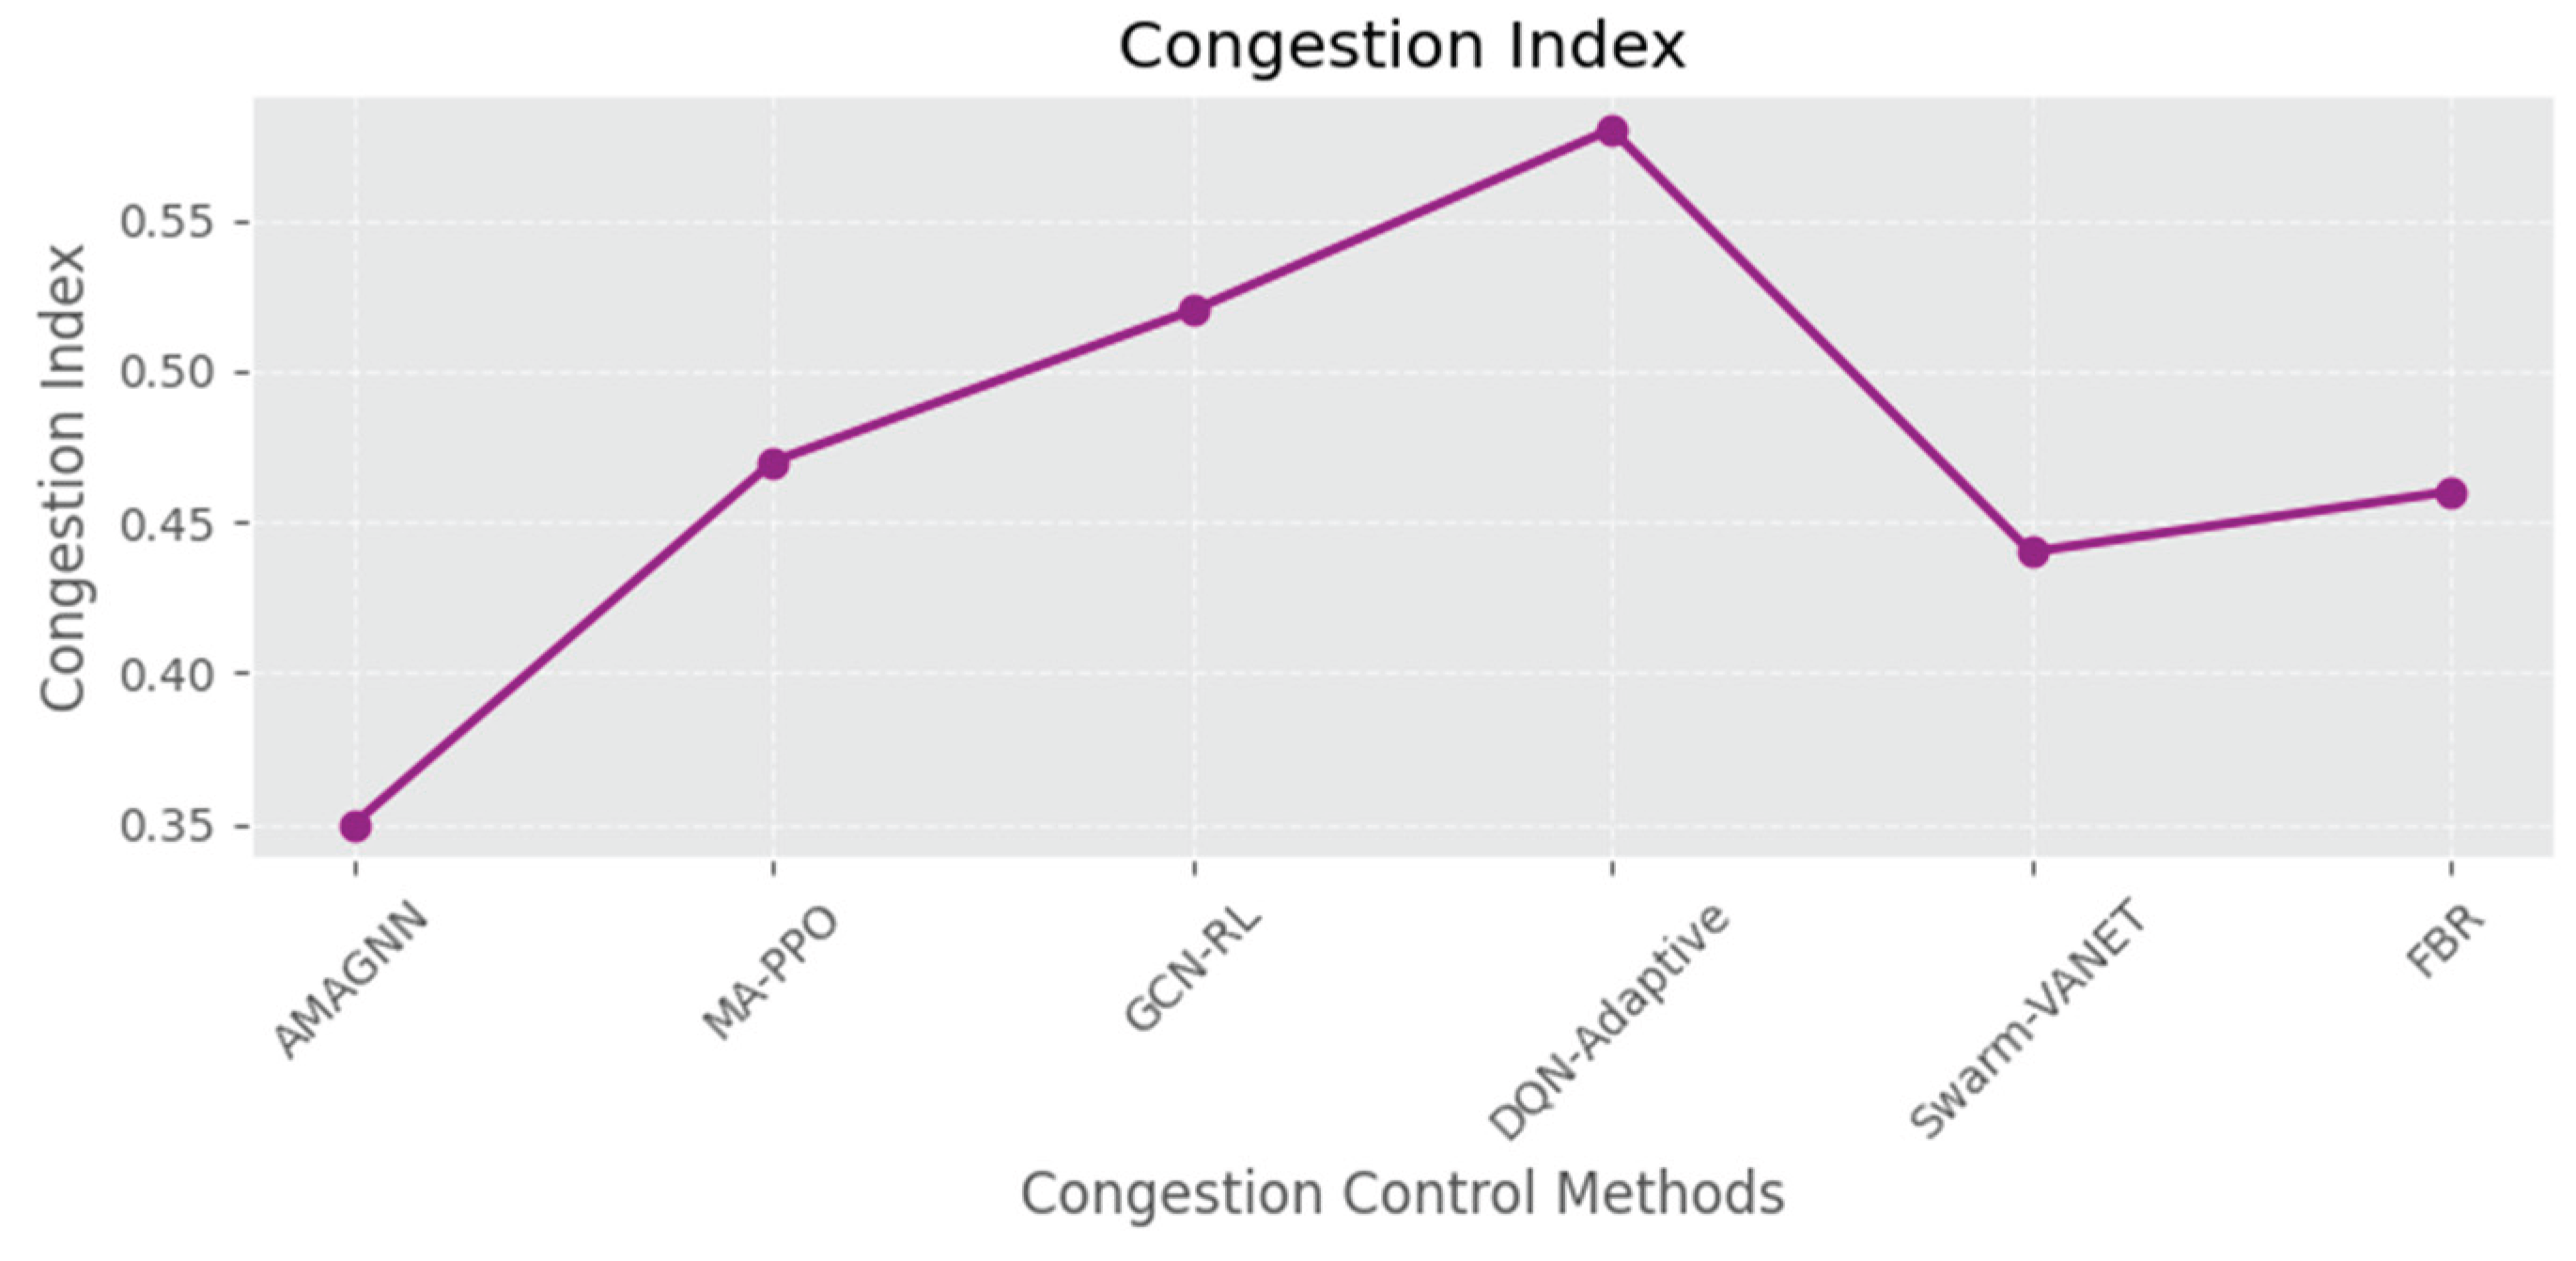
Figure 17.
Comparative study of all performance measurement metrices.
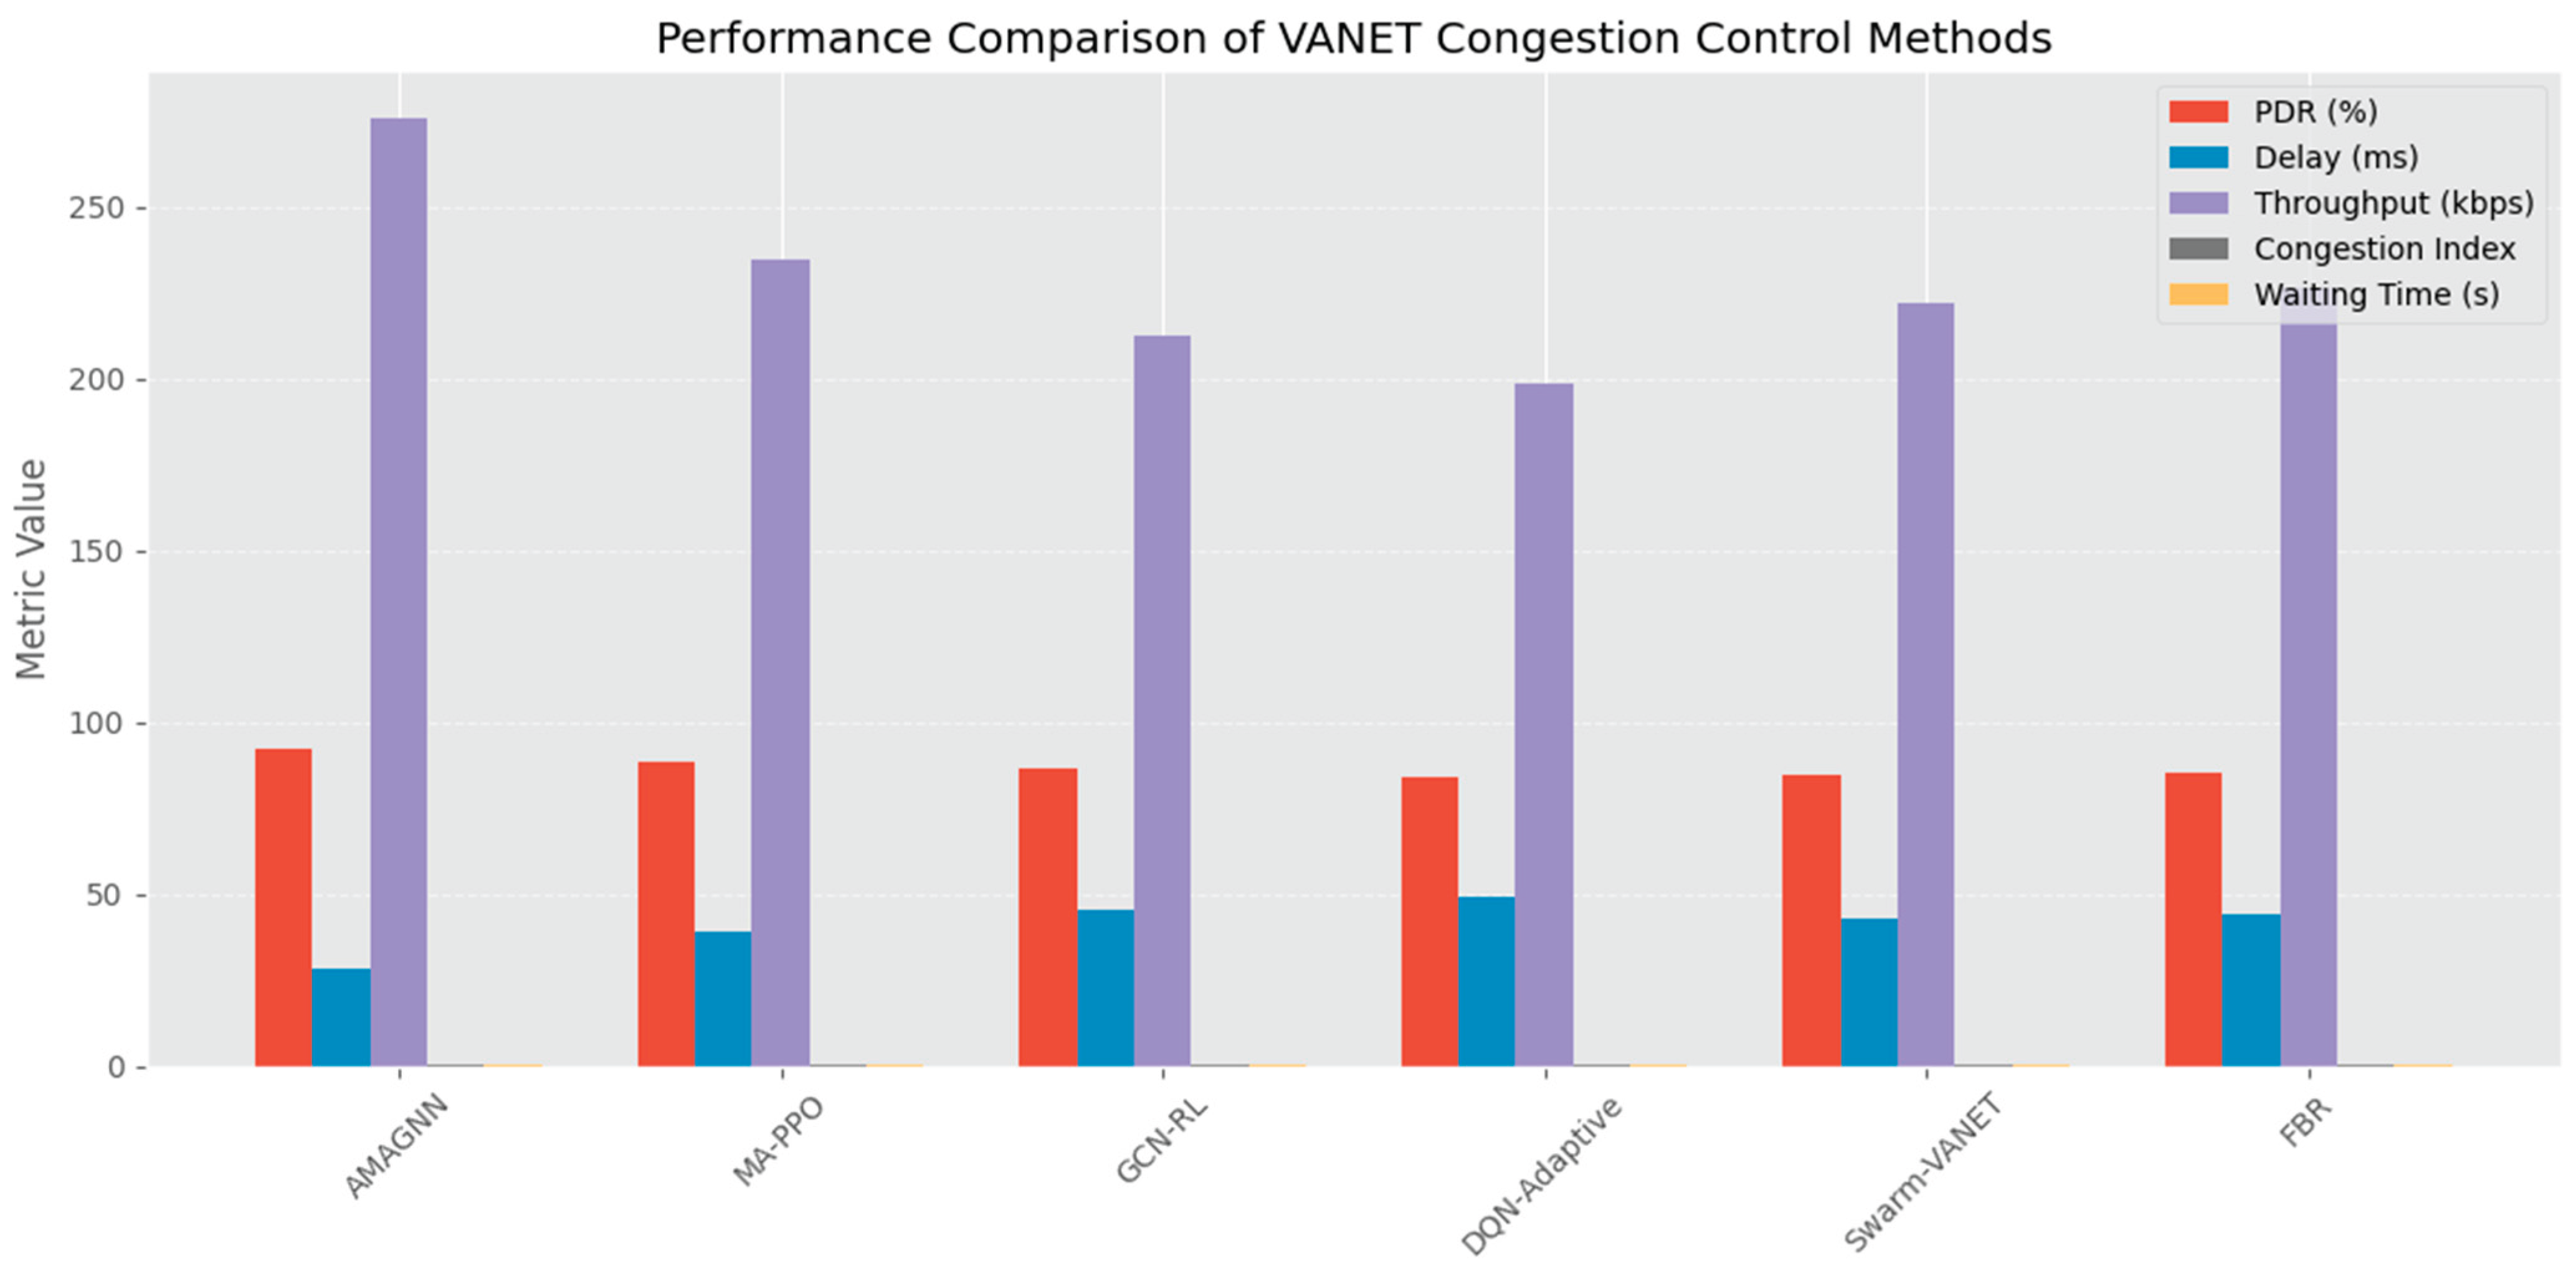
Figure 18.
Comparative study of error metrices between AMAGNN and other methods.
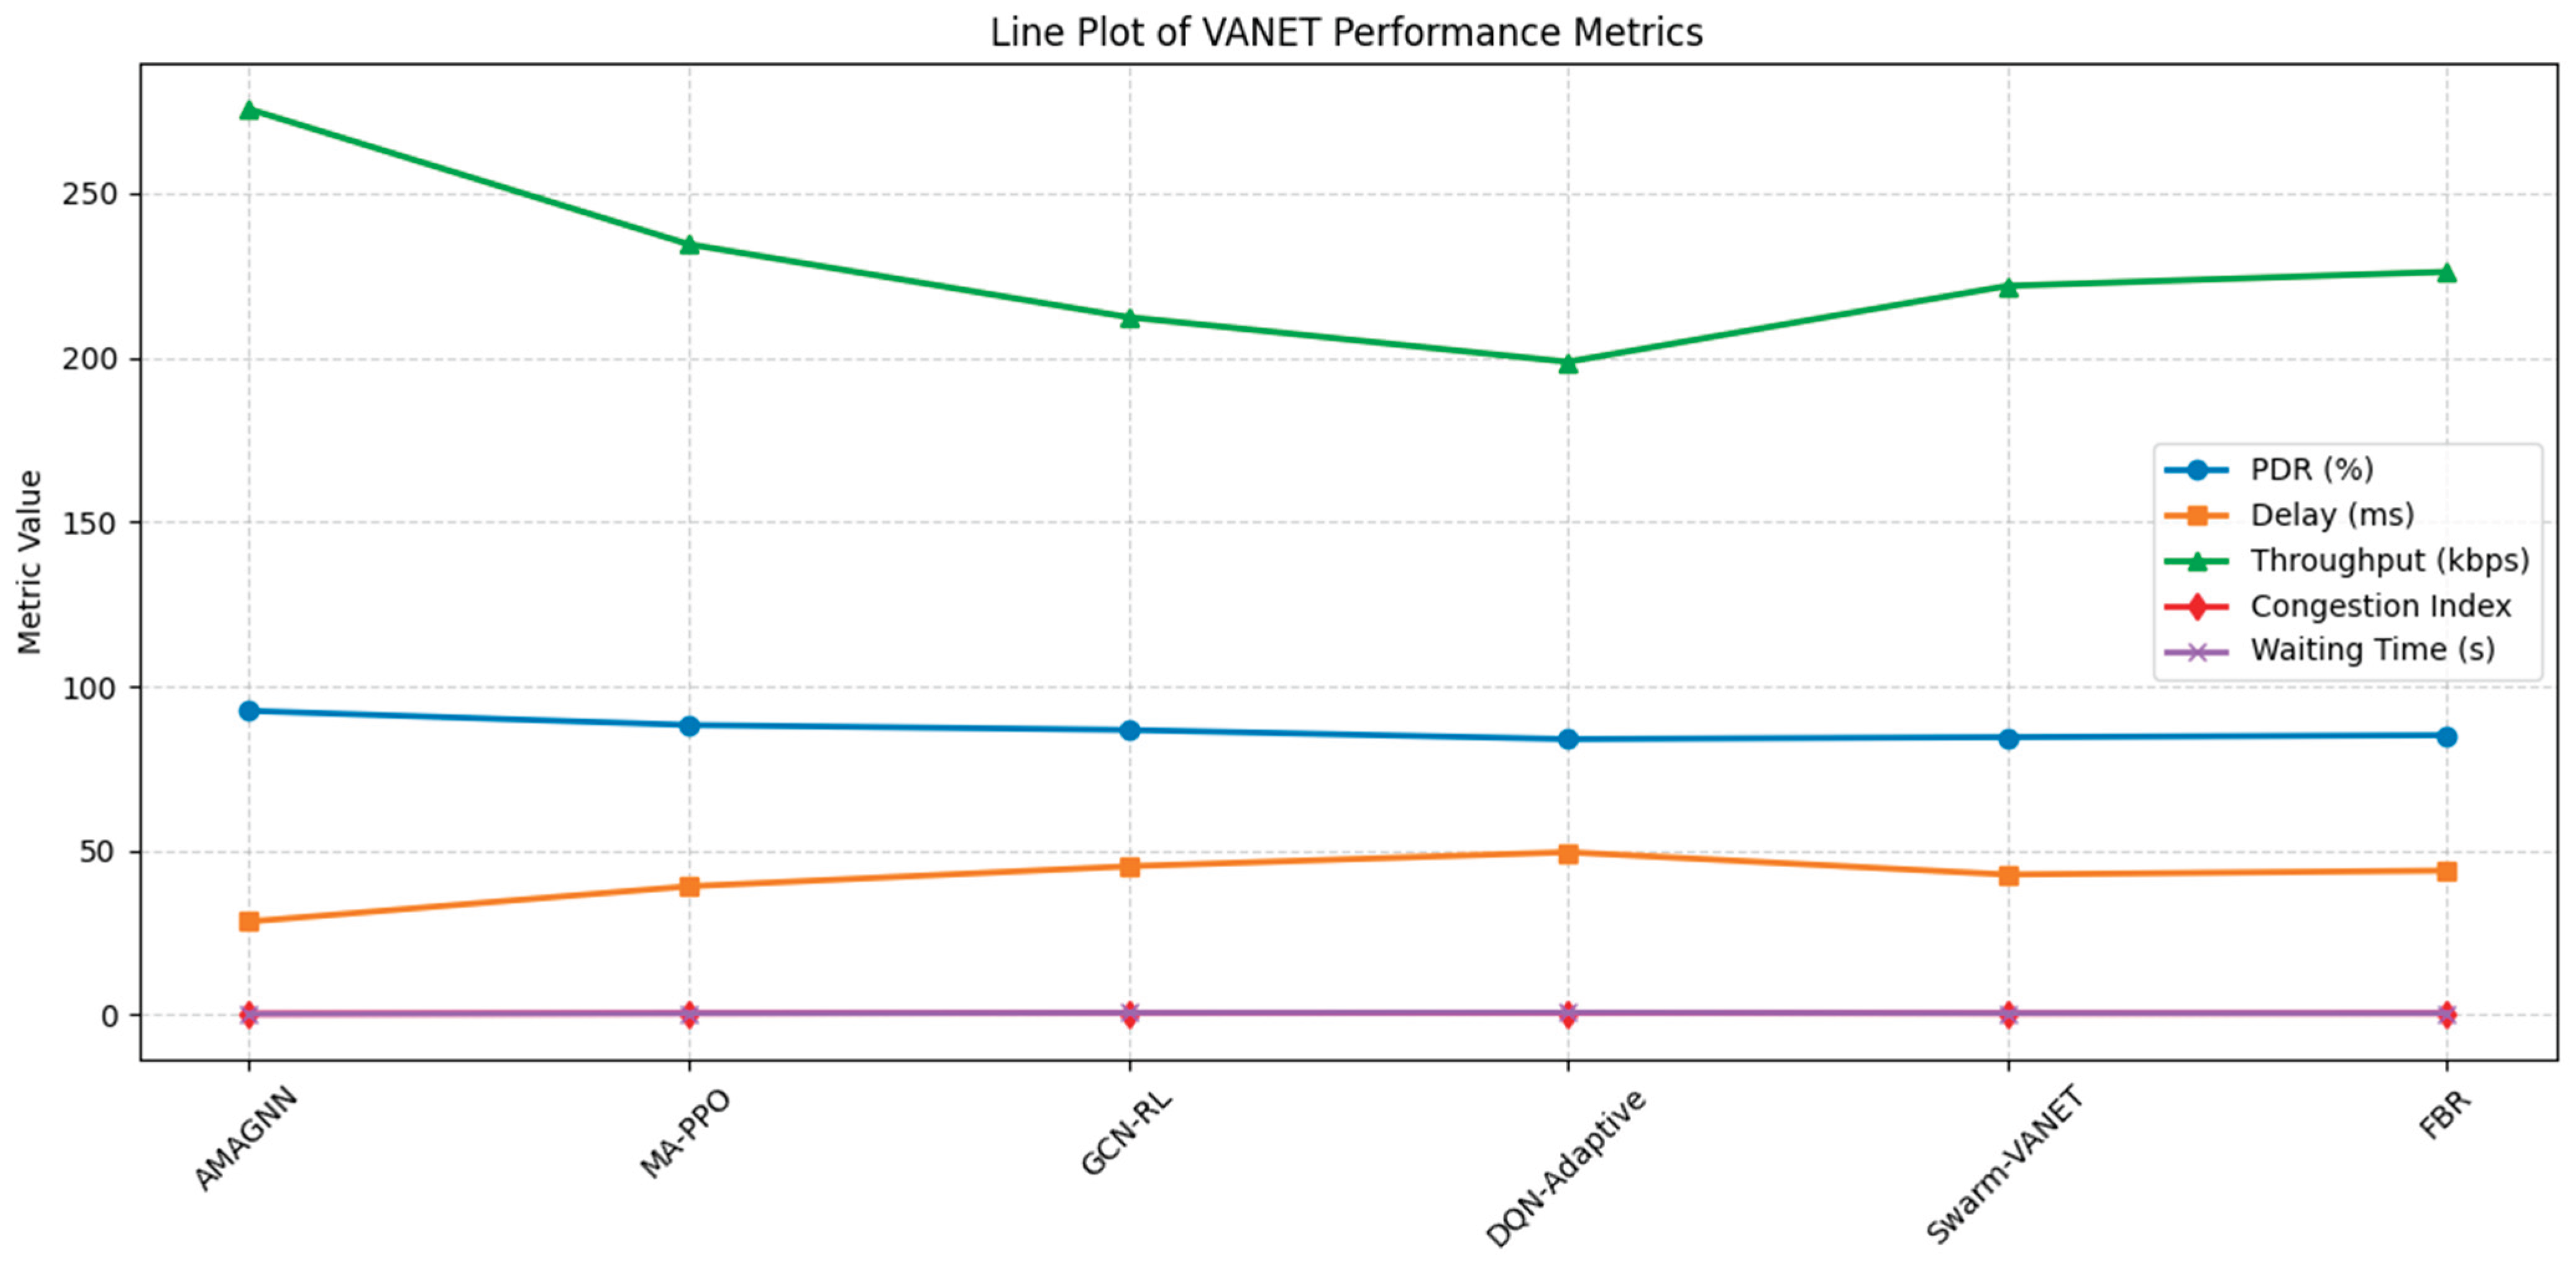
Figure 19.
Convergence curve.
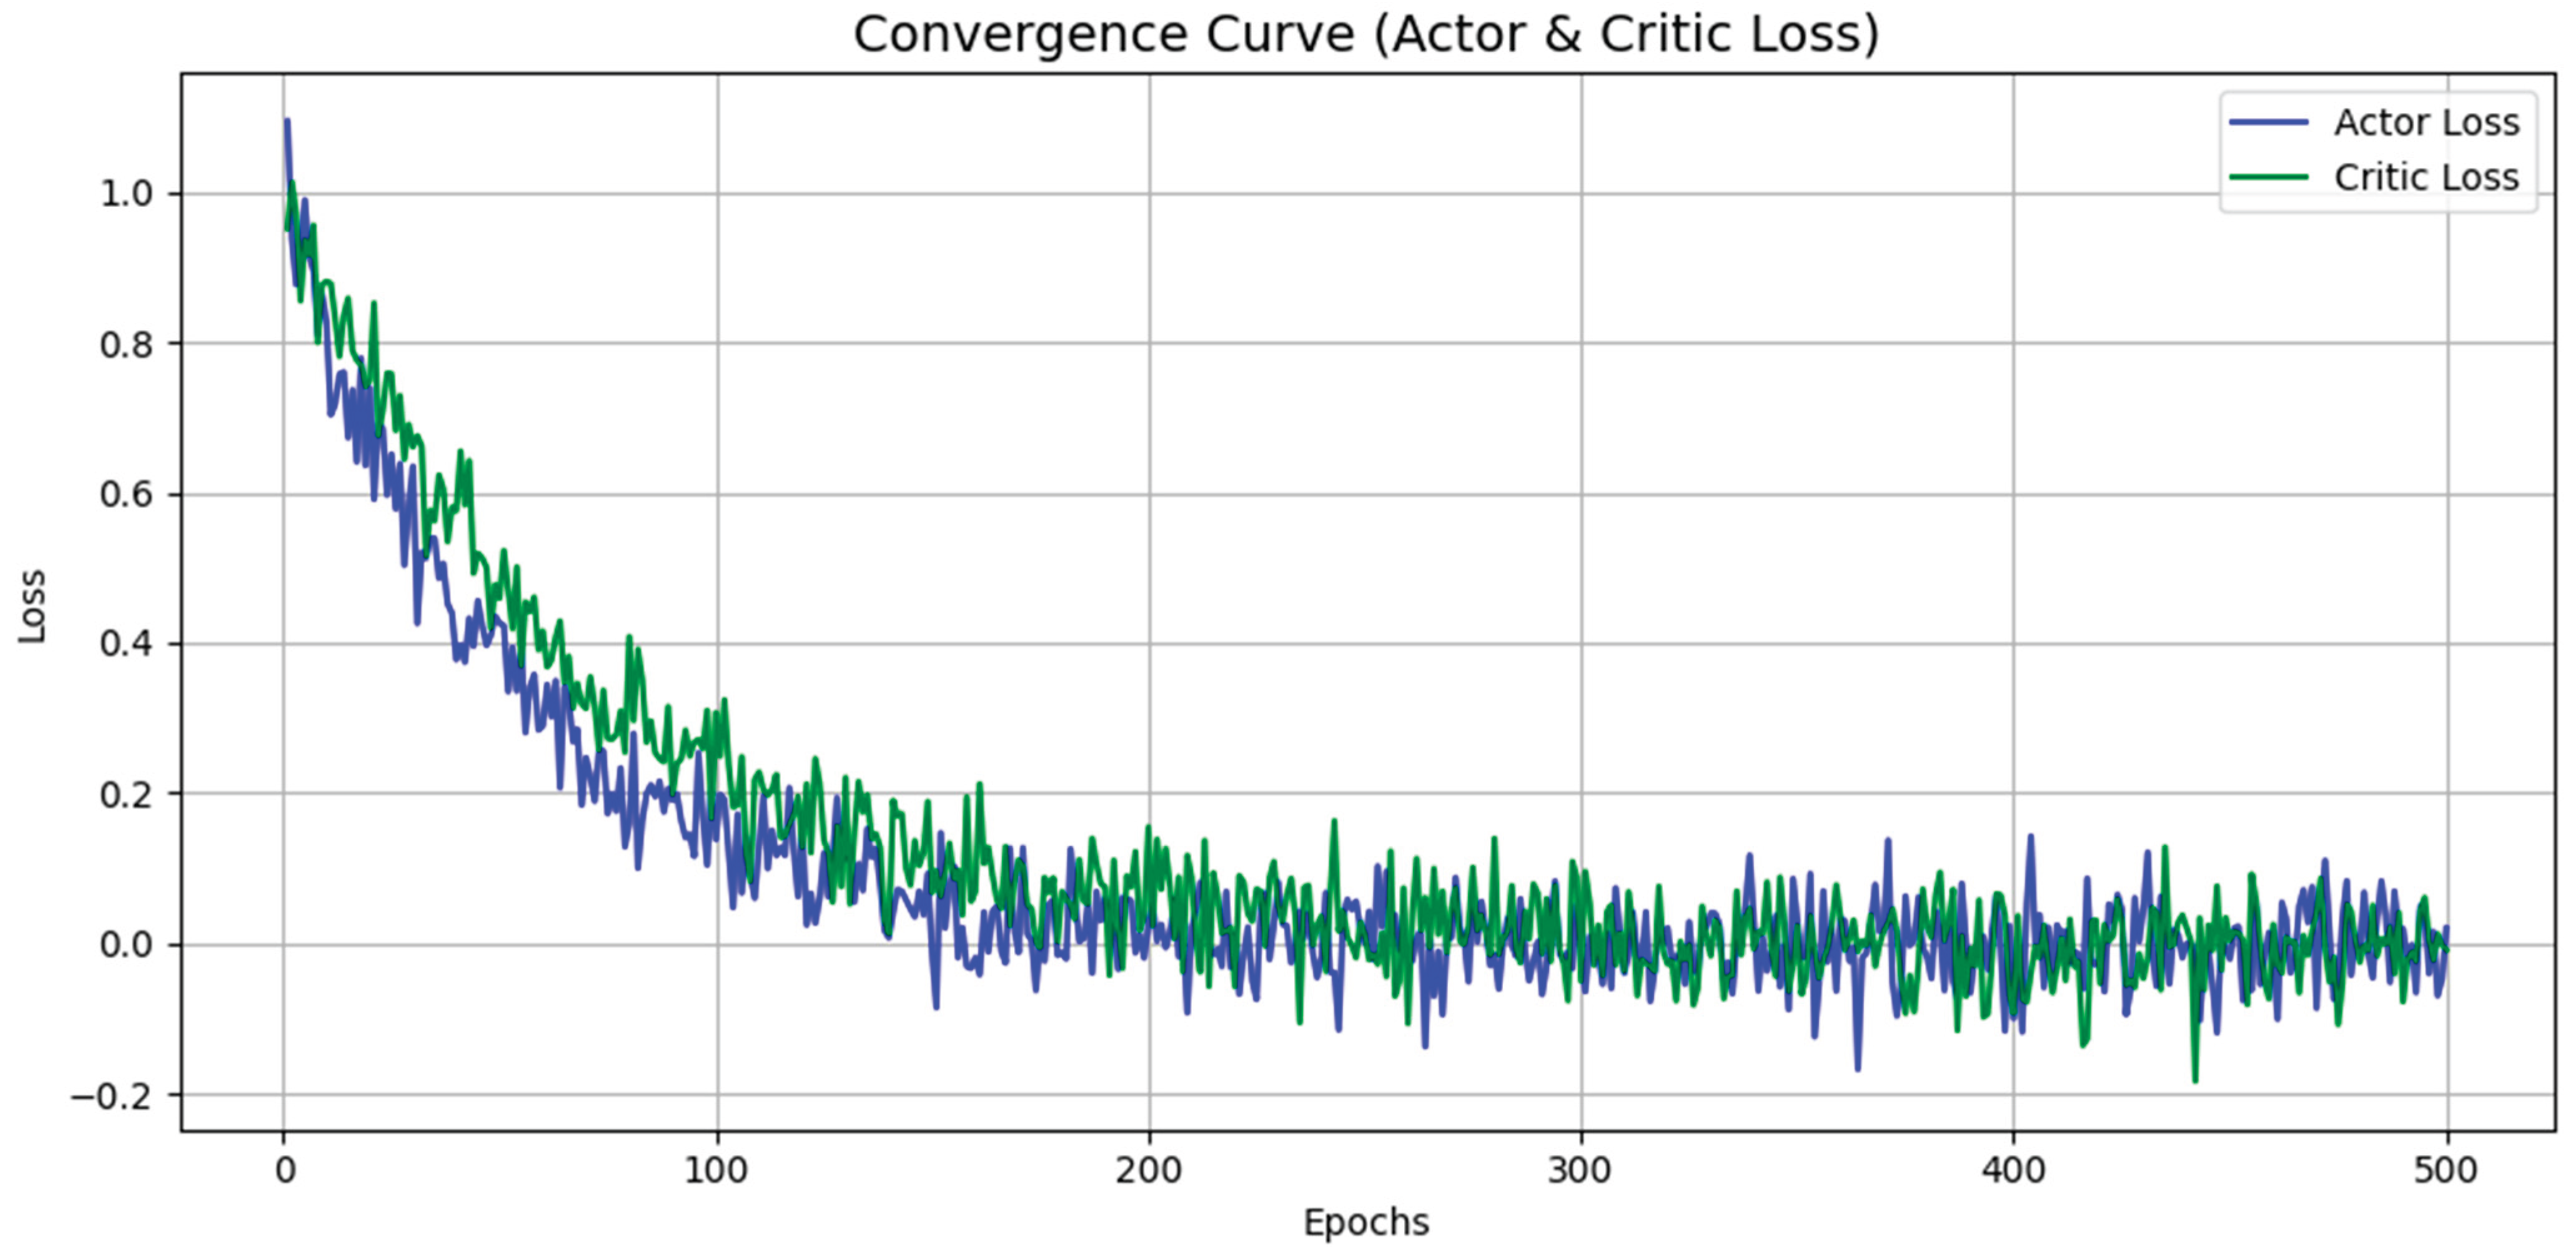
Figure 20.
Ablation study: PDR.
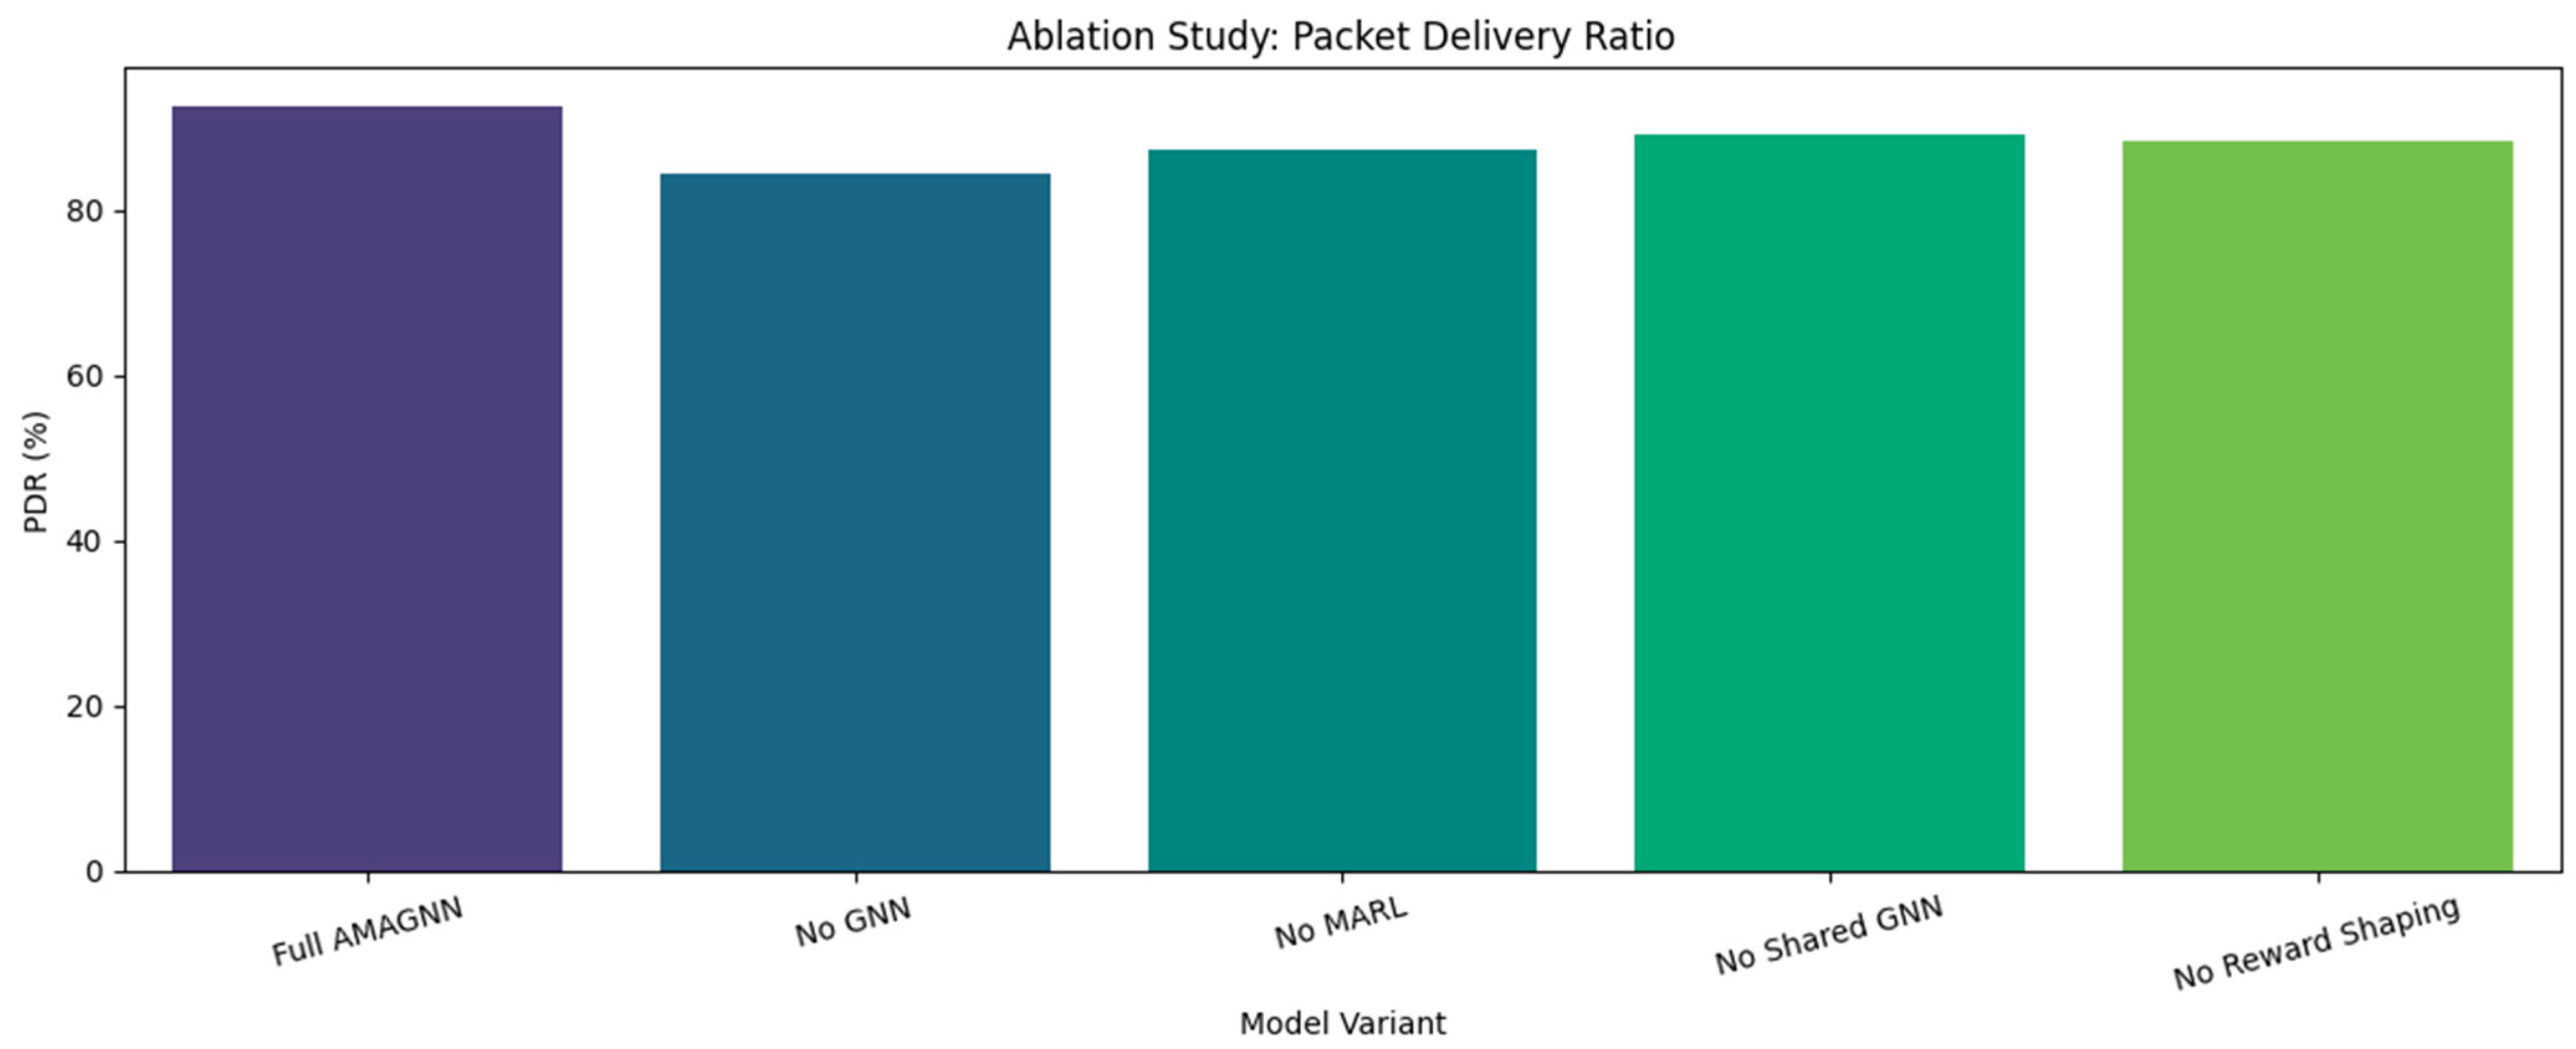
Figure 21.
Ablation study using CI
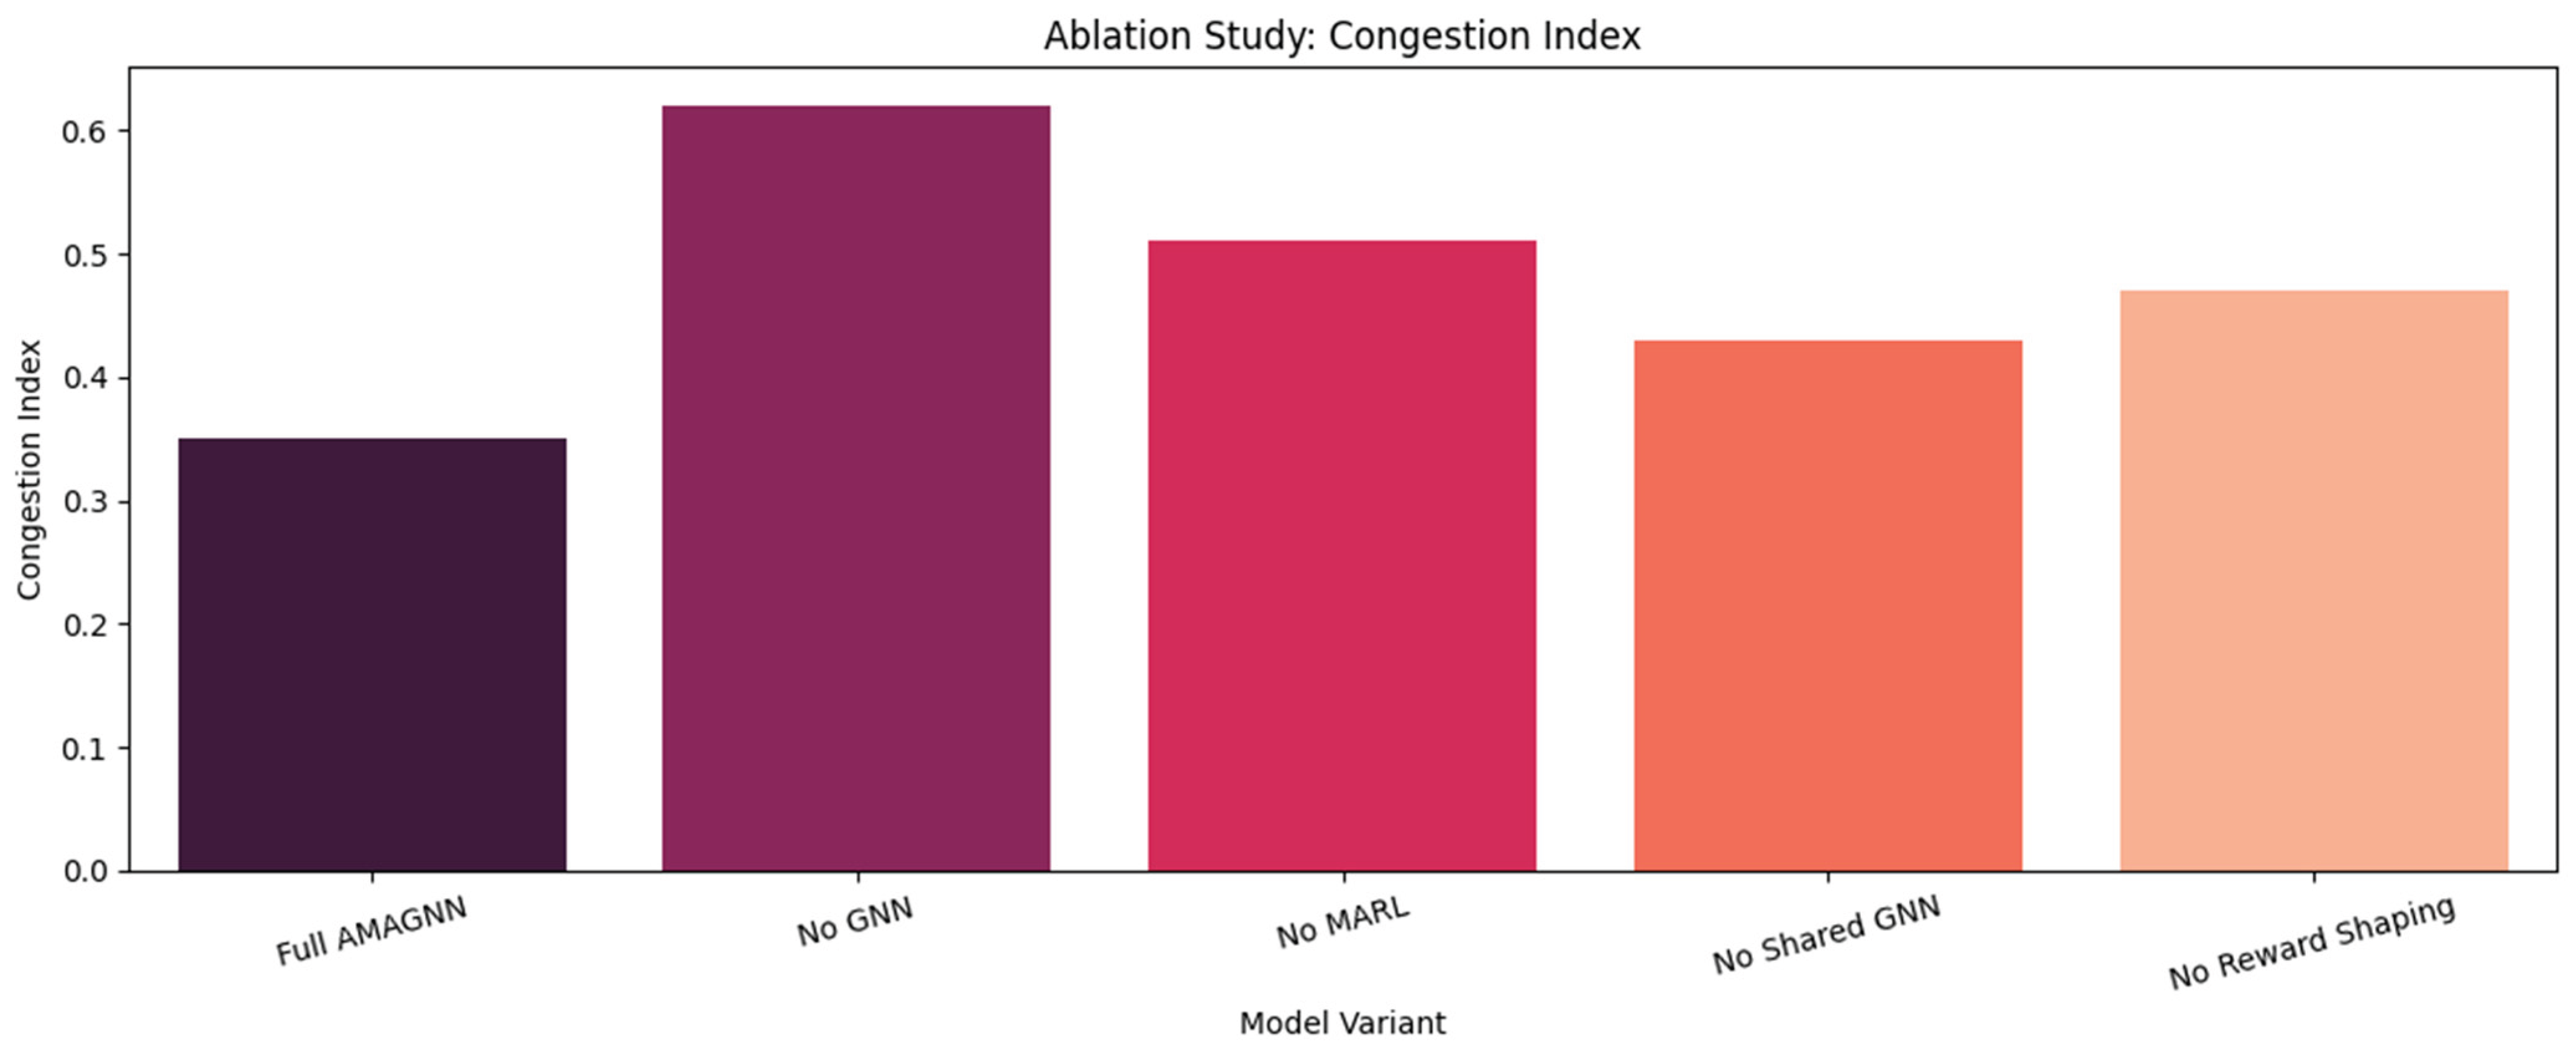
Figure 22.
Ablation study using E2E.
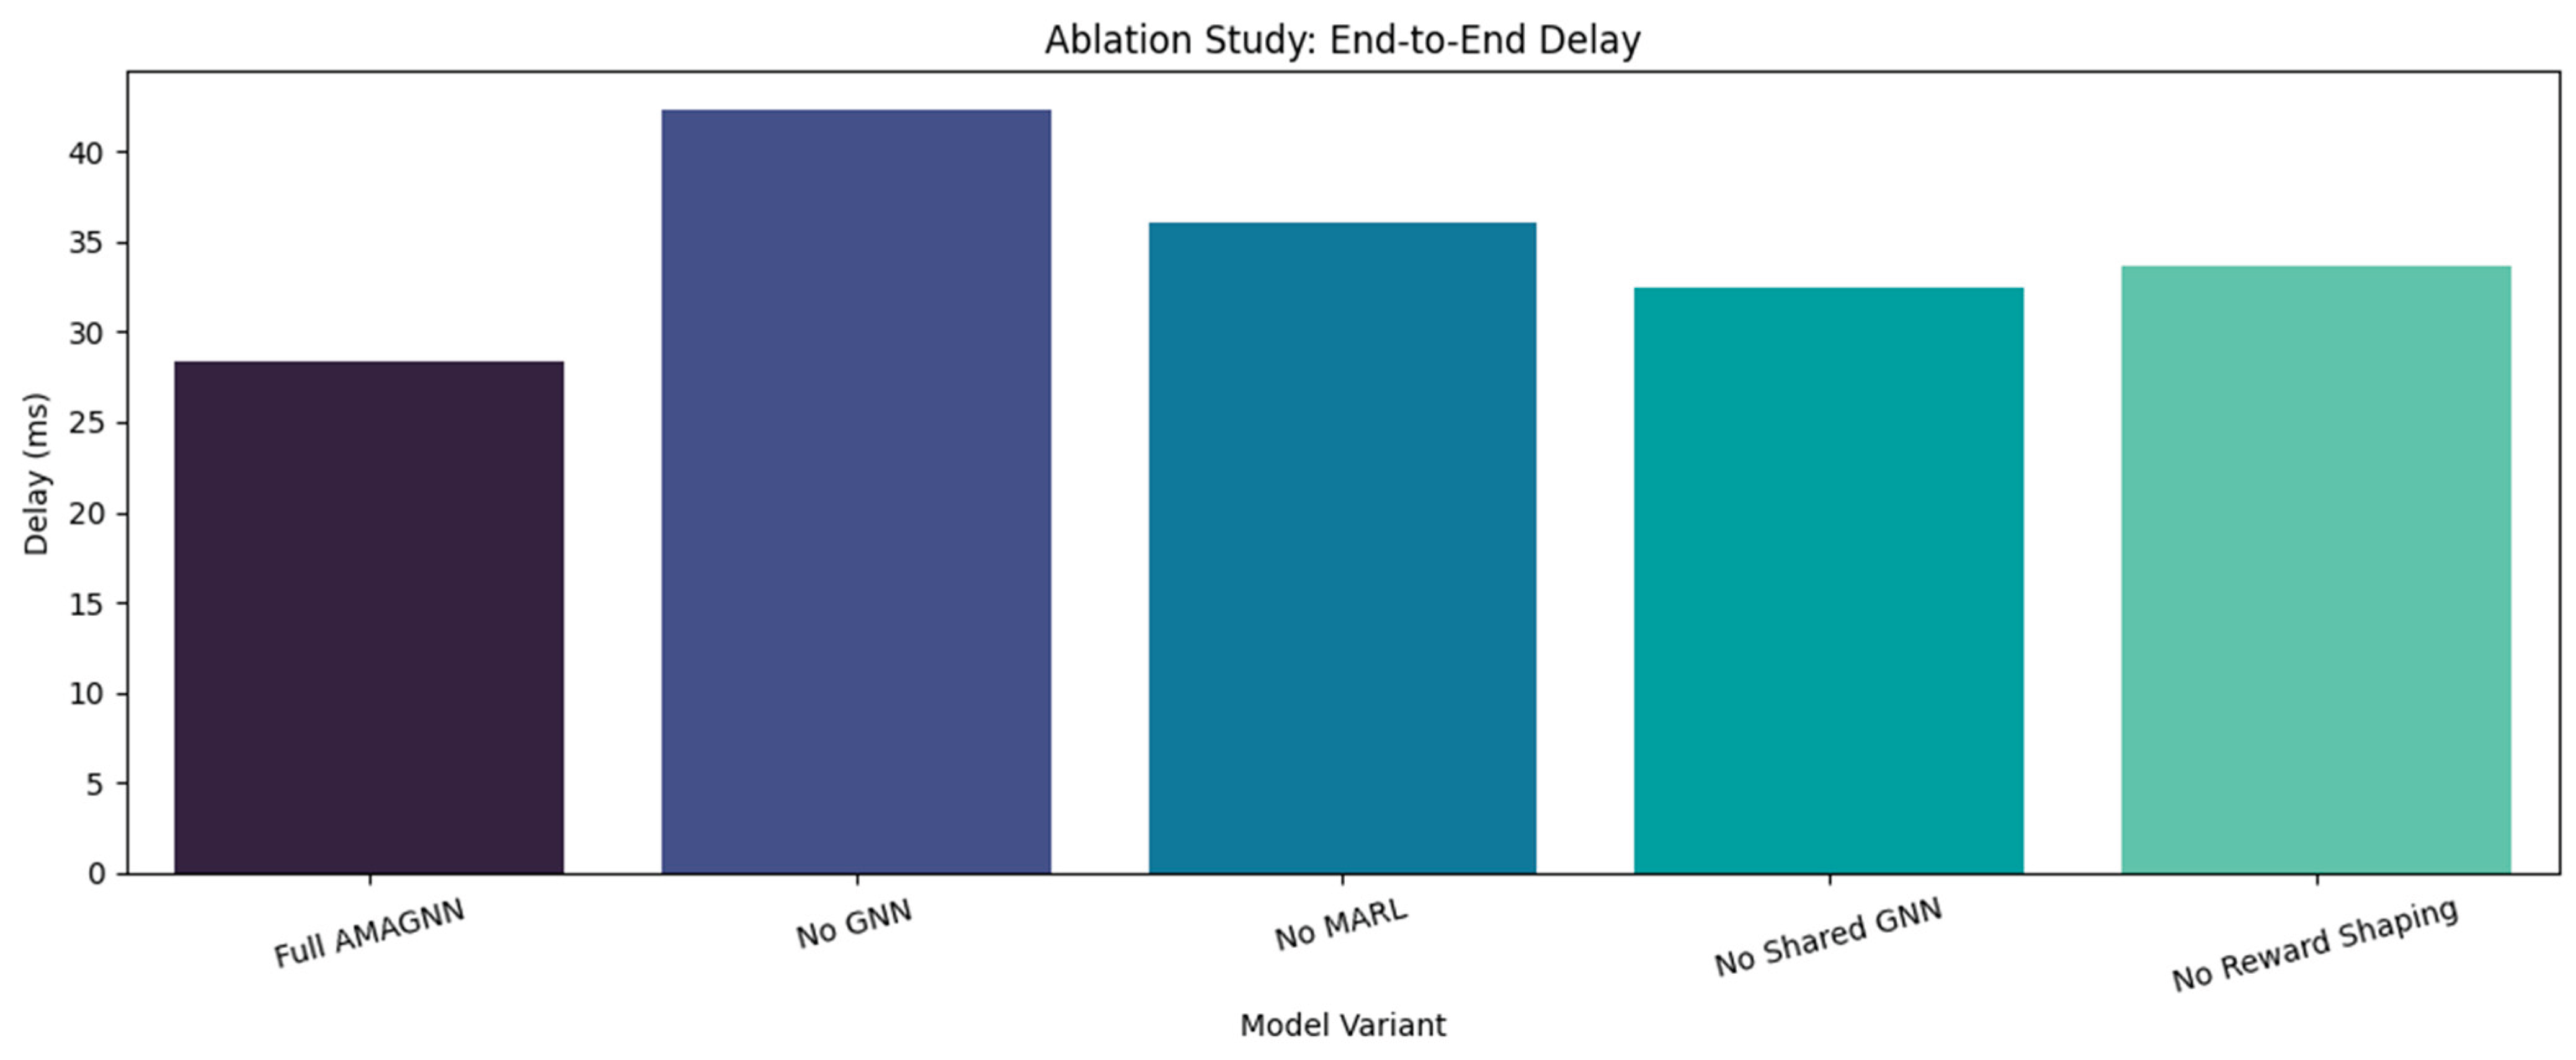
Figure 23.
Sensitivity analysis.
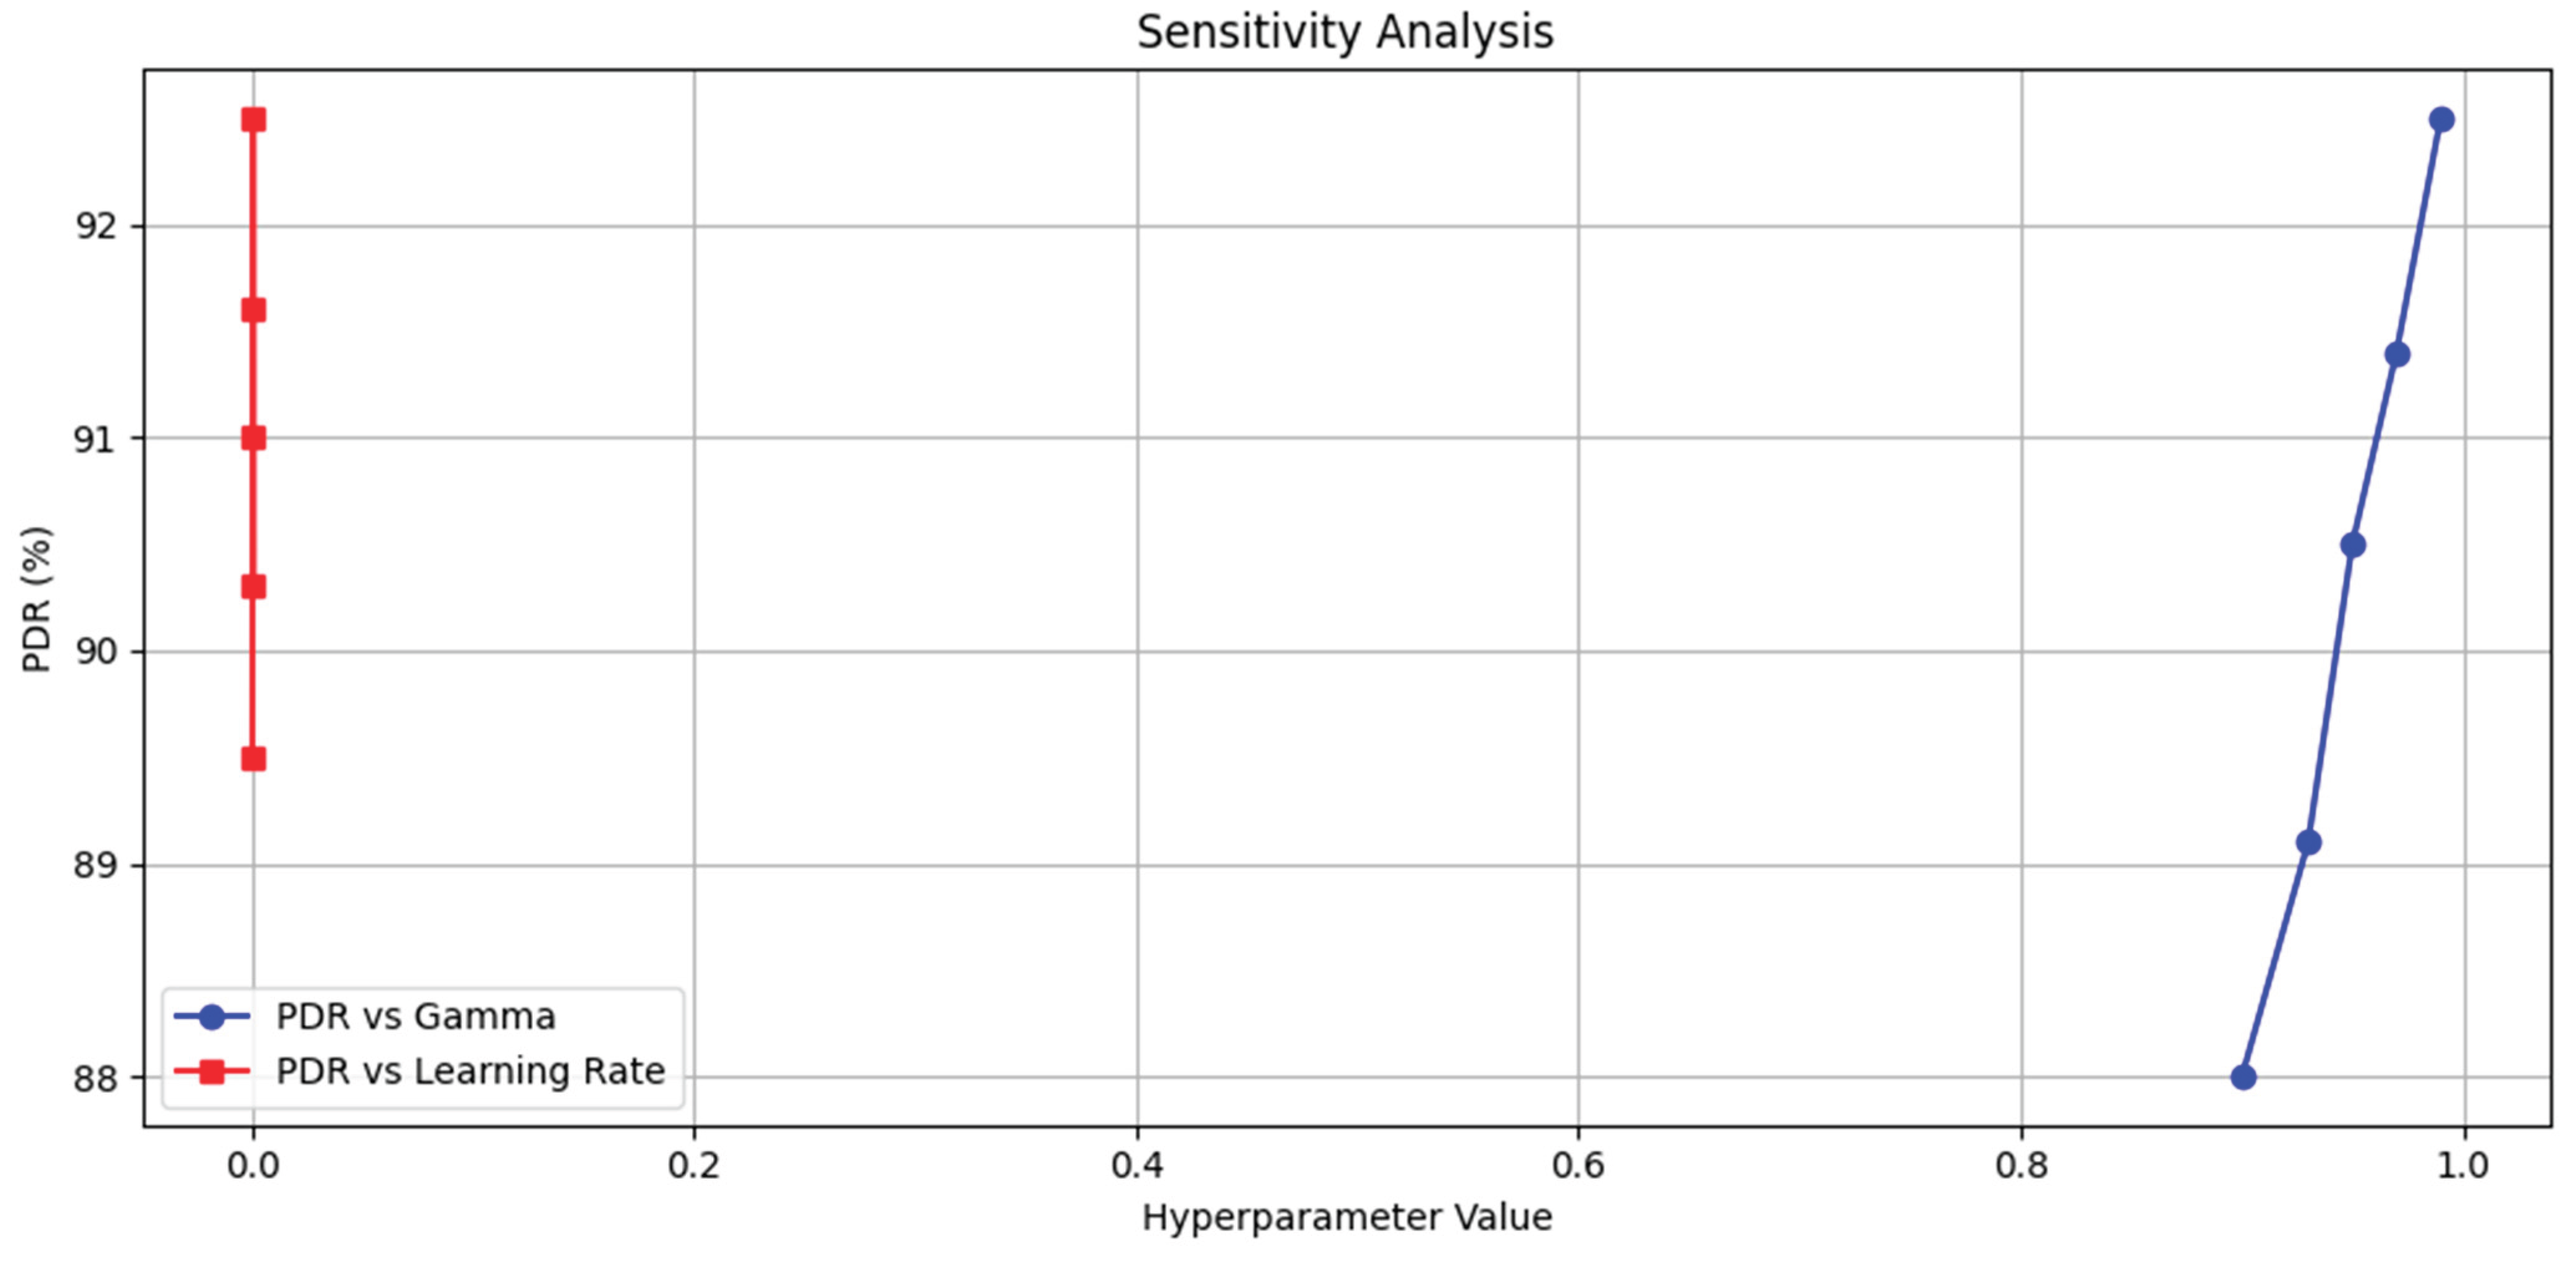
Figure 24.
Extended sensitivity analysis.
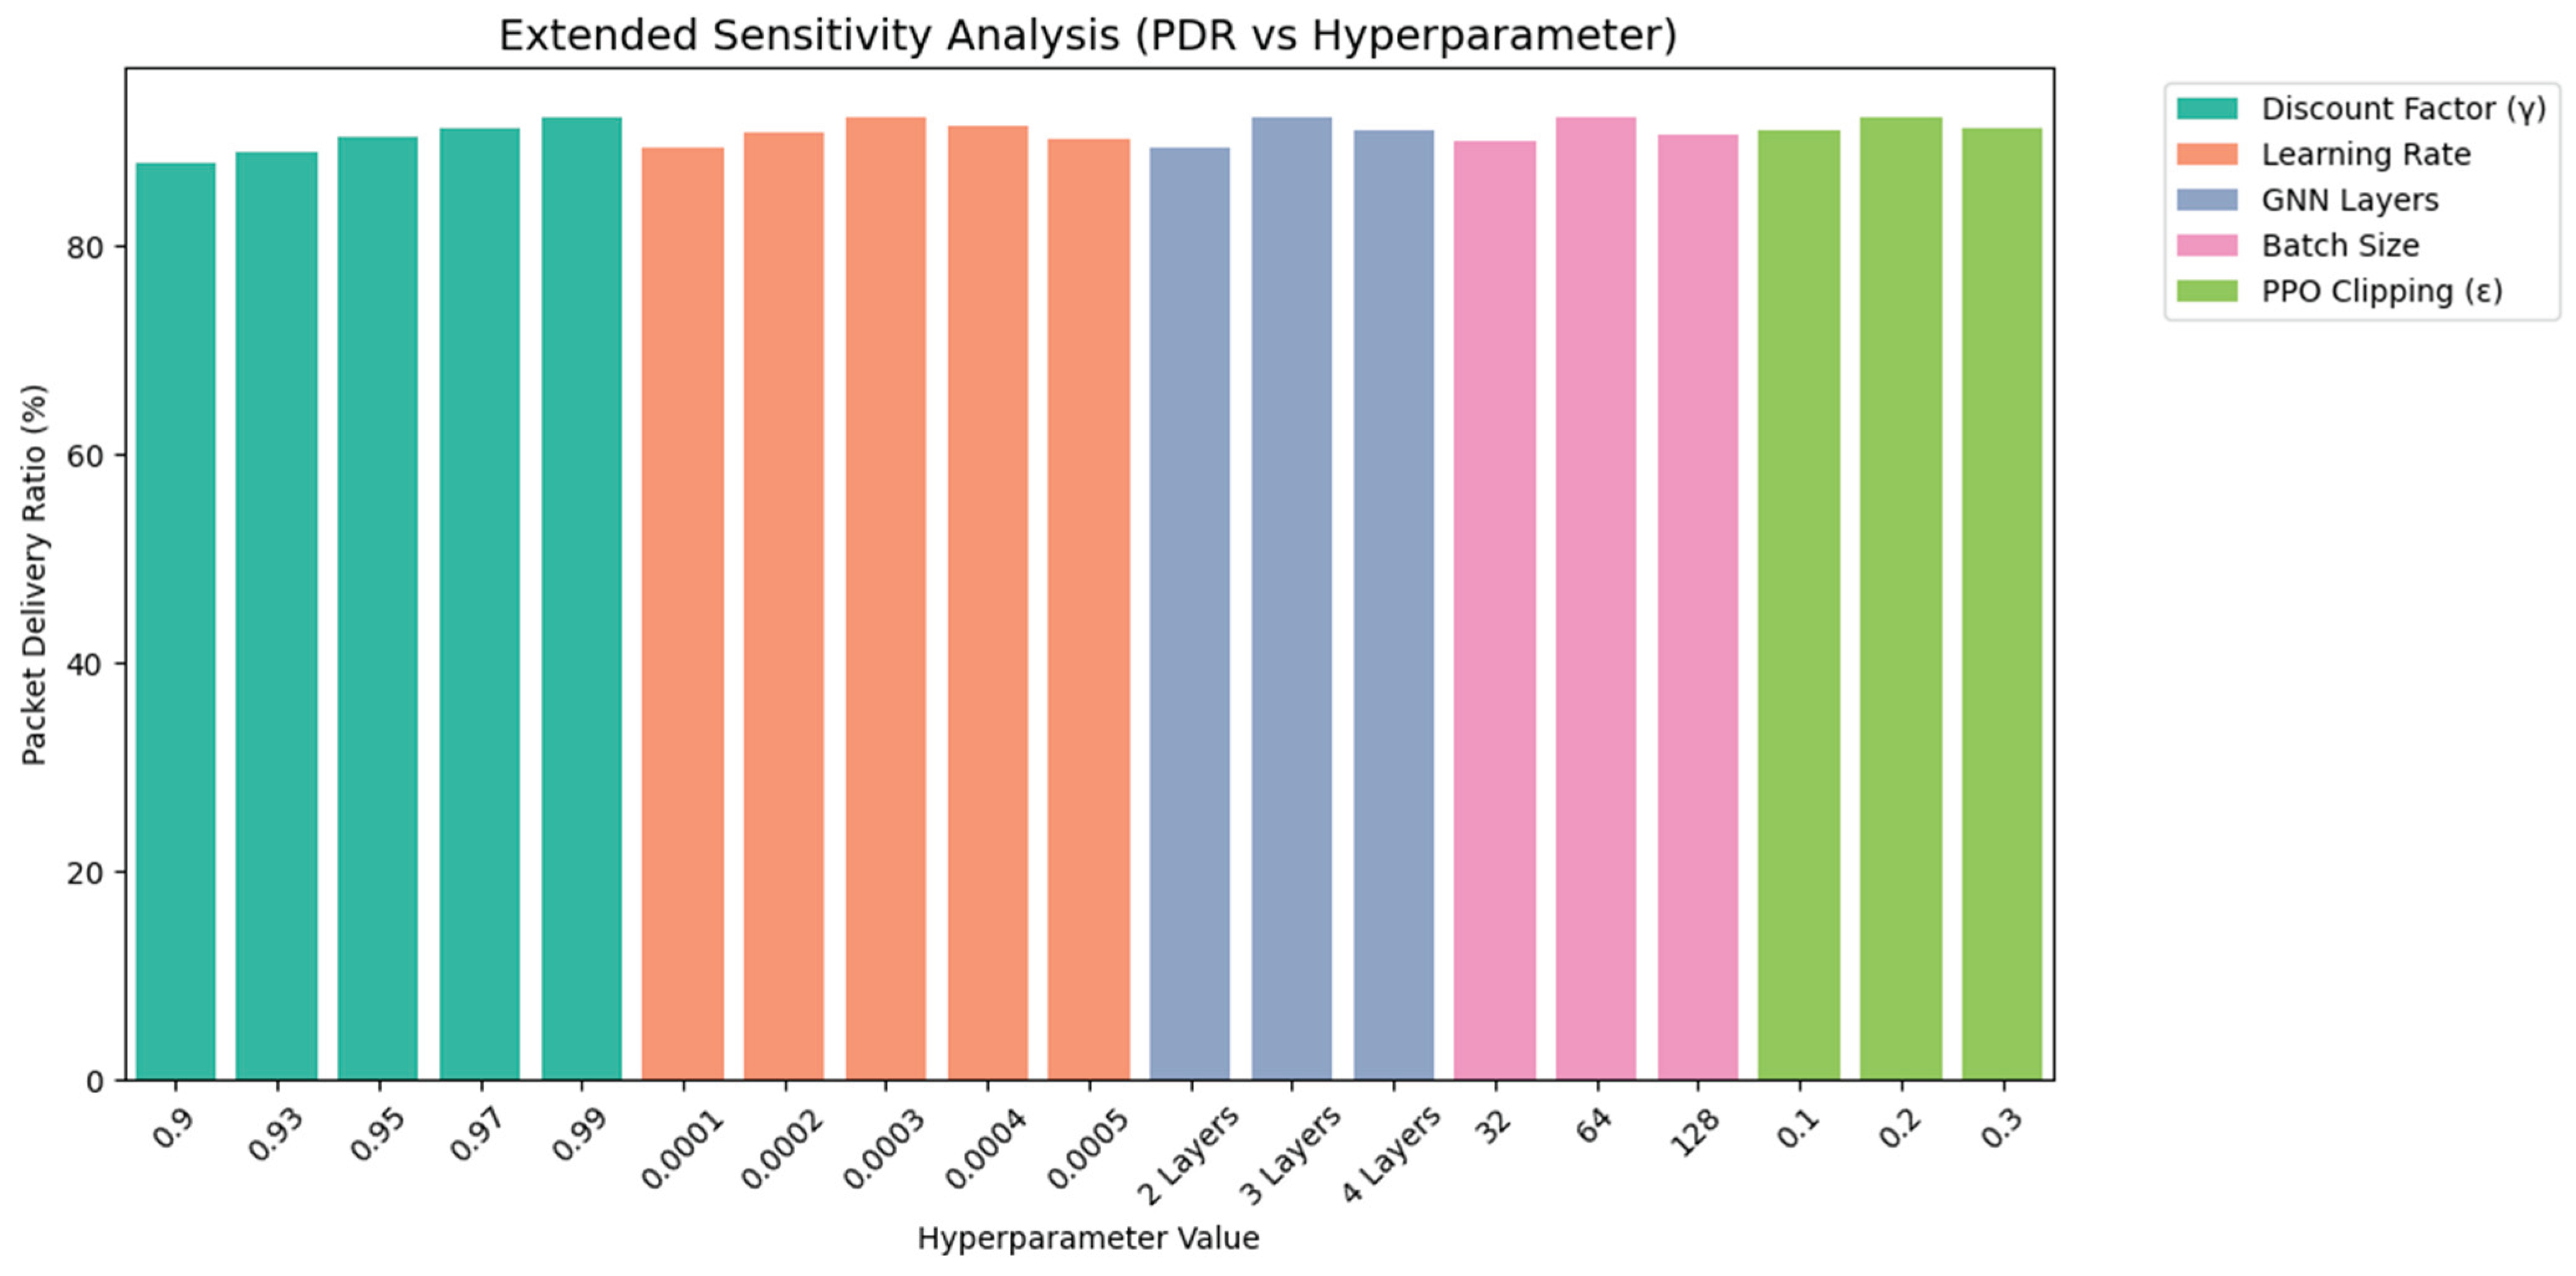

Table 1.
Literature Review of recent work.
| Author(s) | Method | PDR (%) | Delay (ms) | Throughput (kbps) | Congestion Index | Limitations |
|---|---|---|---|---|---|---|
| Zareei & Rajabioun [17] | Swarm Intelligence (SI) | 88.3 | 35.7 | — | 0.42 | Slower convergence; may fail under high node mobility |
| Verma et al. [1] | Q-learning Adaptive Control | 90.1 | 32.5 | 260.7 | — | Performance degradation in unseen environments |
| Arslan et al. [2] | Ant Colony Optimization (ACO) | 87.5 | 36.8 | — | 0.45 | High overhead due to pheromone updates |
| Karthik et al. [18] | Pelican Optimization Algorithm (POA) | 89 | 34.2 | 255.3 | — | Slow response to sudden topology changes |
| Al-Saedi et al. [19] | ANN-based AODV Routing | 86.7 | 38 | — | 0.47 | Requires large training data; higher complexity |
| Liu et al. [3] | DQN (Deep Q-Network) | 91.4 | 30.2 | 270.1 | 0.39 | High computational requirements and training time |
| Ahamed et al. [4] | Genetic Algorithm (GA) | 85.9 | 37.5 | 248 | 0.48 | Slower in real-time adaptation; needs tuning |
| Lu et al. [5] | Fuzzy Logic System | 84.2 | 40 | — | 0.5 | Limited learning/adaptation to dynamic changes |
| Amour [6] | Bee Colony Optimization (BCO) | 87.1 | 36 | 251.4 | 0.44 | Suboptimal path selection in large-scale networks |
| Han et al. [7] | Particle Swarm Optimization + ANN | 88.9 | 33.6 | 262.5 | 0.41 | Complex integration increases processing delay |
| Fedus et al. [8] | Bat Algorithm | 86.5 | 37.2 | 249.2 | 0.46 | Sensitive to parameter tuning; unstable in dense traffic |
| Ning & Xie [9] | Multi-Agent Deep Q-Network (MADQN) | 91.8 | 29.6 | 273.9 | 0.38 | Communication overhead between agents; scalability |
| Su et al. [10] | Genetic Algorithm + ACO | 89.2 | 33 | 258.6 | 0.43 | Increased algorithmic complexity; may cause delay |
| Su et al. [20] | Learning Automata | 85.6 | 38.7 | 245.5 | 0.49 | Slow learning in highly dynamic conditions |
| Gündogan et al. [21] | Deep Belief Network (DBN) | 88.5 | 34 | 256.2 | 0.42 | Requires offline training; difficult to retrain on-the-fly |
Table 2.
Hyperparameters.
| Parameter | Value | Justification |
| Learning rate | 0.0003 | Balances convergence speed and stability; widely used in PPO [5,16] |
| Discount factor (γ) | 0.99 | Long-term reward propagation; standard in high-delay environments [3,7] |
| PPO clipping parameter (ϵ) | 0.2 | Recommended by original PPO paper; prevents large updates [5] |
| GNN layers | 3 (64→128→64) | Sufficient for extracting spatial features in medium-sized VANET graphs [1,11] |
| Dropout rate | 0.3 | Prevents overfitting, especially in sparse VANETs [4,14] |
| Batch size | 64 | Ensures stable gradient estimation while allowing parallelism |
| Rollout length | 2048 steps | Balances data efficiency and convergence speed in on-policy updates [5,8] |
| Epochs per PPO update | 4 | Matches typical PPO implementations; avoids overfitting to mini-batches |
| Number of agents | 20–50 | Reflects realistic VANET scale for medium-size city simulations |
Table 3.
Experimental parameters used in simulation.
| Parameter | Value | Value |
|---|---|---|
| Selected area | Selected Area of Kanpur, India | Urban Raipur / Raipur–Bhilai Expressway |
| Node average speed | 40-80 km/h | 40–60 km/h (drops to ~20 km/h during peak hours) |
| Number of Vehicles | 20 – 100 /second | 20 – 100 vehicles/second |
| Range of transmission | 200 m | 200 meters |
| Size of Packet | 256 bytes | 256 bytes |
| Time for Simulation | 200 s | 200 seconds |
Table 4.
Types of output in multi-agent decision making.
| Output Type | Description | Example Use Case |
| Node-Level Output | Each agent (node) receives a unique decision/output. | Vehicles decide optimal speed or lane change. |
| Edge-Level Output | Determines interaction outcomes between agent pairs. | Traffic light control based on congestion at intersections. |
| Global Output | A single decision influencing all agents. | Coordinated traffic rerouting plan. |
Table 5.
Results Comparison (AMAGNN vs. Traditional Approaches).
| Method | Packet Delivery Ratio (%) ↑ | End-to-End Delay (ms) ↓ | Throughput (kbps) ↑ | Congestion Index ↓ | Avg. Waiting Time (s) ↓ |
| AMAGNN | 92.5 | 28.4 | 275.6 | 0.35 | 0.31 |
| MA-PPO | 88.2 | 39.1 | 234.5 | 0.47 | 0.48 |
| GCN-RL | 86.7 | 45.2 | 212.3 | 0.52 | 0.63 |
| DQN-Adaptive | 83.9 | 49.5 | 198.7 | 0.58 | 0.7 |
| Swarm-VANET | 84.5 | 42.7 | 221.8 | 0.44 | 0.53 |
| Fuzzy Bee Routing (FBR) | 85.1 | 43.9 | 226.1 | 0.46 | 0.51 |
Table 6.
Accuracy Assessment Results.
| Method | MAPE (%) ↓ | RMSE (Delay) (ms) ↓ |
| AMAGNN | 4.2 | 2.6 |
| MA-PPO | 6.8 | 4.1 |
| GCN-RL | 7.5 | 4.8 |
| DQN-Adaptive | 8.9 | 5.2 |
| Swarm-VANET | 6.4 | 3.9 |
| FBR | 6.2 | 4 |
Table 7.
Different model used in ablation study.
| Variant | Description |
| Full AMAGNN | The complete proposed model with all components enabled. |
| No GNN | Replaces GNN with MLP — tests the effect of graph-based neighbourhood encoding. |
| No MARL | Uses single-agent RL — tests the benefit of multi-agent coordination. |
| No Shared GNN | Each agent has its own GNN — tests effect of encoder weight sharing. |
| No Reward Shaping | Removes additional congestion-aware penalties from reward function. |
Table 8.
Summary of Sensitivity Results.
| Hyperparameter | Optimal Value | PDR (%) | Sensitivity | Reason |
| Discount Factor (γ) | 0.99 | 92.5 | High | Encourages long-term routing optimization |
| Learning Rate | 0.0003 | 92.5 | Medium | Balances convergence speed and stability |
| GNN Layers | 3 (64→128→64) | 92.5 | Medium-High | Captures adequate spatial context without overfitting |
| Batch Size | 64 | 92.5 | Medium | Ensures gradient stability with responsiveness |
| PPO Clipping (ϵ) | 0.2 | 92.5 | Low-Medium | Preserves policy monotonicity; prevents learning spikes |
Table 9.
Variation in parameters.
| Parameter | 0.0001 | 0.0002 | 0.0003 | 0.0004 | 0.0005 | 0.1 | 0.2 | 0.3 | 0.9 | 0.93 | 0.95 | 0.97 | 0.99 | 32 | 64 | 128 | 2 Layers | 3 Layers | 4 Layers |
|---|---|---|---|---|---|---|---|---|---|---|---|---|---|---|---|---|---|---|---|
| Batch Size | – | – | – | – | – | – | – | – | – | – | – | – | – | 90.1 | 92.5 | 90.8 | – | – | – |
| Discount Factor | – | – | – | – | – | – | – | – | 88 | 89.1 | 90.5 | 91.4 | 92.5 | – | – | – | – | – | – |
| GNN Layers | – | – | – | – | – | – | – | – | – | – | – | – | – | – | – | – | 89.4 | 92.5 | 91.2 |
| Learning Rate | 89.5 | 91 | 92.5 | 91.6 | 90.3 | – | – | – | – | – | – | – | – | – | – | – | – | – | – |
| PPO Clipping | – | – | – | – | – | 91.1 | 92.5 | 91.3 | – | – | – | – | – | – | – | – | – | – | – |
Table 10.
Summary of time and space complexity analysis.
| Component | Time Complexity | Space Complexity | Notes |
|---|---|---|---|
| MARL (Multi-Agent RL) | O(K ⋅ A ⋅ B ⋅ (∣S∣ + ∣A∣)) | O(A ⋅ B ⋅ (∣S∣ + ∣A∣)) + O(Policy + Value Network size) | K: gradient steps, A: agents, B: batch size |
| CTDE (Joint Value Updates) | O(A²) (additional in worst case) | Depends on centralized critic architecture | Centralized value function during training only |
| GNN (per iteration) | O(L ⋅ (N ⋅ F ⋅ H + E ⋅ H)) | O(N ⋅ H + E) | L: GNN layers, N: nodes, F: features, H: hidden dim, E: edges |
| AMAGNN (Total) | O(L ⋅ (N ⋅ F ⋅ H + E ⋅ H)) + O(K ⋅ N ⋅ B ⋅ (∣S∣ + ∣A∣)) | O(N ⋅ H + E) + O(N ⋅ B ⋅ (∣S∣ + ∣A∣)) + O(NN parameter sizes) | Combines GNN embeddings with MARL updates per agent |
Disclaimer/Publisher’s Note: The statements, opinions and data contained in all publications are solely those of the individual author(s) and contributor(s) and not of MDPI and/or the editor(s). MDPI and/or the editor(s) disclaim responsibility for any injury to people or property resulting from any ideas, methods, instructions or products referred to in the content. |
© 2025 by the authors. Licensee MDPI, Basel, Switzerland. This article is an open access article distributed under the terms and conditions of the Creative Commons Attribution (CC BY) license (http://creativecommons.org/licenses/by/4.0/).
Copyright: This open access article is published under a Creative Commons CC BY 4.0 license, which permit the free download, distribution, and reuse, provided that the author and preprint are cited in any reuse.


