
Submitted:
05 January 2026
Posted:
06 January 2026
You are already at the latest version
Abstract
Prostate cancer is one of the most prevalent and deadly neoplasias in the male population. Despite the availability of therapies that increase the long-term survival of patients with localized tumors, metastatic prostate cancer is challenging to treat. A previous study revealed that the 2-aminopyridine derivative (named Neq0440) inhibited the PI3K-AKT-mTOR pathway and presented selective cytotoxicity toward the metastatic prostate cancer cell line PC-3. Here, we further analyzed the mechanism of action of these molecules by using cell-based colorimetric, fluorometric, epifluorescence microscopy, and Western blot assays. Mitochondrial depolarization increased the AMPK level at 24 h inhibition with Neq0440, which led to the PI3K-AKT-mTOR pathway downregulation after 48 h. The phosphorylation was inhibited for AKT and the downstream quinases (S6RP and 4EBP1) from the PI3K-AKT-mTOR pathway, which can work together with the mitochondrial depolarization, lowering the pH of the medium, increasing ROS levels, and translocating the lysosomes toward the nucleus to trigger cell death. Therefore, Neq0440 can be used as a lead compound to obtain derivatives with a novel anticancer mechanism of action.
Keywords:
cell-based assays
; mechanism of action
; AMPK activity
; ROS formation
; kinase modulation
; lysosome modulation
1. Introduction
The prostate is an exocrine gland that comprises the male reproductive system. It is located below the bladder and in front of the rectum in the lower abdomen. Factors contributing to prostate cancer development include genetics, increased life expectancy, and unhealthy lifestyle habits [1].
Prostate cancer (PC) is a global public health problem affecting men worldwide. It is the most frequently diagnosed disease in the male population in 112 countries/territories out of 185 [2]. The incidence and mortality are correlated with age, especially above 60 years [3]. Treatment depends on tumor classification and may involve surgical removal, radiation therapy, hormone therapy, and chemotherapy [4].
Drugs administered for prostate cancer treatment may not lead to tumor elimination or disease cure. Nevertheless, they prolong patients' lives and can improve their quality of life when combined with other therapies [5]. Although chemotherapy presents promising results for prostate cancer treatment, resistance is one of the main problems [6]. Therefore, the search for new therapeutic approaches is a continuous field of study. In this sense, PI3K-AKT-mTOR pathway inhibitors are being studied, including the clinical phase candidates apitolisib (the PI3K/mTOR competitive inhibitor), capivasertib and ipatasertib (AKT competitive inhibitors) [7].
A previous cell-based study by our group demonstrated that 2-aminopyridine derivatives inhibited the PI3K-AKT-mTOR signaling pathway, with cytotoxic activity against the metastatic prostate cancer cell line PC-3 [8]. A previous hypothesis indicated that these 2-aminopyridines could directly inhibit the mammalian target of rapamycin (mTOR) kinase because of their chemical similarity to the potent and selective mTOR inhibitor XL388 [9]. Here, the mechanism of action was elucidated for Neq0440 (Figure 1) against the prostate cancer cell line (PC-3) to evaluate its antineoplastic effects and selectivity in comparison with the non-tumoral prostate cells (PNT-2).
2. Results
The results are presented in sections detailing the bioactivity profiling of Neq0440, which provides a putative mechanism of action for this chemical compound.
2.1. Cytotoxicity Assays
Neq0440 was tested against bone metastatic prostate cancer (PC-3) and epithelial (PNT-2) cells via the MTT method (Table 1 and Figure S2). As expected, Neq0440 had the same potency as previously described for PC-3 [8] and was selective toward prostate cancer cells (SI > 1). The cytotoxicity of Neq0440 against metastatic prostate cancer to the brain cells (DU145) was too low (IC50 > 100 µM, not shown) to be considered for further assays (not shown), confirming our previous assay [8]. Hence, the studies continued using PC-3 and PNT-2 cells.
Doxorubicin is not a useful chemotherapeutic drug for prostate cancer, but it can trigger reactive oxygen species that also target mitochondria in cells [10]; hence, it was also tested (Table 1). Ultimately, the mitochondrial activity could be linked with the mode of action for Neq0440, as described in the next section.
Moreover, our in-house test for doxorubicin combined with Neq0440 in triple-negative breast cancer cells revealed an eight-fold improvement in the cytotoxic response (unpublished results). Therefore, we tested whether the combination of Neq0440 at an inactive concentration of 1.0 µM with a set of doxorubicin concentrations could induce differential sensitivity toward prostate cancer cells in an exploratory approach. The results (Table 1) showed that the combination could cause differential sensitization of PC-3 cancer cells compared with non-tumoral PNT-2 (reducing the effect). Nevertheless, it was not striking, according to the highest single agent approach [11], but it was not selective for prostate cancer cells (SI < 1). More studies will be necessary for an in-depth evaluation of the combination index.
2.2. Analysis of Mitochondrial Function
The half-maximal concentration of Neq0440 was used with a mitochondrial marker (MitoPotential) to analyze the health state of these organelles inside the cells (Table 2, Figure 2 and Figure S3). The positive control was composed of doxorubicin at concentrations of 1.0 µM (near the IC50 for PC-3) or 10 µM (where more than 90% cell death was observed for PC-3 via the MTT assay). After 72 hours of compound administration, PC-3 and PNT-2 cells were labeled with reagents, and images were collected with the EVOS FL epifluorescence microscope (Thermo Fisher Scientific).
The functional mitochondria are labeled in red, and the depolarized mitochondria (with loss of membrane potential) are labeled in green. The corrected total cell fluorescence (CTCF) corresponds to the amount of fluorescence from the area divided by the total number of cells (Table 2 and Figure S4). The assay was performed in duplicate, and the presented value is the result of the average of the analyses. The ratio of the CTCF values (red/green) reflects the relationship between functional and depolarized mitochondria: (i) cells with healthy mitochondria had a score above 1, and (ii) cells with depolarized mitochondria had a score below 1 and could trigger the death process.
The PC-3 cell line presented a characteristic elongated morphology with many polarized (active) mitochondria (red/green = 1.59) in the negative control wells (Figure 2a and Table 2). PNT-2 cells are naturally rounder than PC-3 cells, with a high ratio of polarized/depolarized mitochondria (red/green = 1.97) for healthy cells.
The positive controls made with doxorubicin at 1.0 and 10 μM led to cell rounding and mitochondria depolarization (red/green ratio = 0.88 and 0.48, respectively) of the PC-3 cells, indicating concentration‒response activity. As expected, the highest concentration of doxorubicin (10 µM) induced extensive cell death, which was considered too dramatic to be useful for further consideration. Therefore, a 1.0 μM concentration of doxorubicin was chosen for additional assays with PNT-2 cells. The detachment of PNT-2 cells and reduction in mitochondrial polarization (red/green ratio = 1.37) were promoted by doxorubicin (Figure 2b and Table 2).
The Neq0440 compound induced round morphology and the presence of several vacuoles in the cytoplasm of the PC-3 cells. Cytoplasmic vacuolation can occur in various cellular compartments via different mechanisms and is often associated with cell death [12]. Among the stimuli that lead to vacuole formation, exposure to chemical agents is one of the leading causes [13]. The nuclei of the PC-3 cells presented chromatin fragmentation more often than the other compounds did, which may represent an advanced cell death process with genetic material damage. Rounded cells with reduced cytoplasmic content and some nuclei with DNA condensation were also observed. The cells treated with Neq0440 appeared to have a larger volume than the non-tumoral PNT-2 cells did. Although the compound was cytotoxic to PC-3 cells and caused morphological changes, the number of functional mitochondria was still greater than the number of depolarized mitochondria (red/green ratio = 1.12). These findings indicated that the activity of the compound did not solely depend on mitochondrial alterations.
2.3. Studying the Mechanism of Action Using Western Blot
Partial mitochondrial depolarization may trigger cell death via the canonical activation of 5’ AMP-activated protein kinase (AMPK) [14]. Hence, it was analyzed by Western blotting, along with the PI3K-AKT-mTOR pathway (Figure 3 and Figure S3). As expected, the p-AMPK and AMPK concentrations arose after 24 h incubation, being the most pronounced alteration observed in this timeframe. The PI3K-AKT-mTOR pathway was also affected by Neq0440 at 24 h to a lower extent, showing reduced phosphorylation of AKT, mTOR, and the downstream S6RP and 4EBP1. Therefore, the mitochondrial stress that elevated AMPK level led to the inhibition of the PI3K-AKT-mTOR pathway after 48 h, where the ratio of phosphorylated kinases (but not mTOR) was reduced when the IC50 concentration was used (Figure 3 and Figure S3).
2.4. Reactive Oxygen Species (ROS) Formation
The PI3K-AKT-mTOR pathway may control the level of intracellular ROS [15]. Moreover, the drug doxorubicin is known to increase the amount of ROS inside PC-3 cells [16]. Hence, ROS formation was quantified in PC-3 and PNT-2 cell lines treated with Neq0440 and doxorubicin (Figure 4 and Table 3). The analyses were performed for short, middle, and prolonged exposure intervals (24, 48, and 72 h, respectively). The culture medium with 0.5% DMSO was used as a negative control, and hydrogen peroxide (H2O2) at a concentration of 500 μM was used as a positive control. The graph shown in Figure 4 represents the percentage of ROS over time, where the negative control corresponds to 100%.
Short-term exposure (24 h) did not induce ROS in PC-3 cells. However, after 48 h of exposure, Neq0440 increased the mean level of ROS formation in PC-3 cells to the same extent as doxorubicin at the highest concentration (Table 3). After a 72-hour interval, there was a reduction in ROS formation for all the treatments due to cell death. ROS formation for all treatments was greater in PC-3 cancer cells than in non-tumoral PNT-2 prostate cells, considering the mean values at all time points (Table 3).
2.5. Location and Quantification of the Lysosomes
Active AMPK may also work via the non-canonical pathway to modulate lysosomes and mTORC1 [18]. Therefore, the lysosomes were labeled with the LysoTracker marker after 72 hours of incubation with Neq0440 or doxorubicin at the half-maximal concentration (Figure 5 and Table 4). The opposite effects were identified for Neq0440 and doxorubicin in terms of the percentage of lysosomes relative to that in the negative control (untreated) cells. An increased lysosomal concentration was observed in cells with more aberrant morphological changes triggered by Neq0440, where lysosomes were more evident in larger cells. The addition of Neq0440 induced lysosome accumulation around the nucleus. Small vesicles dispersed in the cytoplasm or near the membrane were observed in several cells, which may be related to the processes of recycling and degrading molecules.
Doxorubicin had the opposite effect on the two cell lines, decreasing the lysosomal population in PNT-2 cells and abruptly increasing it in PC-3 cells (Figure 5, Figures S5 and S6, Table 4). Lysosomes were more concentrated in cells with vacuoles, indicating their high activity.
3. Discussion
Our current data revealed that the 2-aminopyridine derivative Neq0440 had the same profile in terms of the previously described cytotoxicity, with downstream effects on the PI3K-AKT-mTOR-S6 pathway according to cell-based assays [7]. The link between the previous identification of PI3K-AKT-mTOR pathway inhibition and the putative target was based on the observation of the pH of the culture medium, which is a phenotypic indication of altered cell metabolism.
PC-3 prostate cancer cells have increased use of anaerobic metabolism, which also affects the pH of the extracellular medium, according to exometabolomic data [22]. Furthermore, PC-3 cells tend to produce more acids because of the 56:44 ratio for oxidative phosphorylation and lactate production from anaerobic metabolism, indicating mitochondrial stress [23]. The empirical observation of the pH reduction caused by incubation of PC-3 cells with 2-aminopyridine chemicals provided indirect evidence that mitochondrial metabolism could be further affected. Hence, the MitoPotential reagent was used to quantify mitochondrial function after treatment (Table 1). The PC-3 prostate cancer cells were depolarized to a greater extent than the non-tumoral PNT-2 cells were after Neq0440 treatment (Table 2), which could indicate that the mitochondria in the cancer cells were more sensitive. This result can also help explain the selective cytotoxicity of Neq0440 toward PC-3 cells (Table 1). Doxorubicin, a known anticancer drug, was used as a positive control for these assays because it led to cell death via interaction with topoisomerase II, the formation of ketone bodies, and the generation of free radicals within the cell [24]. It leads to apoptotic cell death, which is characterized by cell shrinkage, the expansion of the plasma membrane, such as blebs, the loss of normal organelle positioning, and the condensation and fragmentation of DNA [25]. Some of these characteristics are also shown in Figure 2, especially for treatment with 1.0 µM doxorubicin.
The mitochondrial stress caused by oxygen deprivation and nutrient deficiency decreases ATP levels and increases reactive oxygen species (ROS) levels. Reactive oxygen species also influence mitochondrial function and mediate intracellular calcium levels to activate programmed cell death, as previously described for the prostate cancer PC-3 cell line [26,27].
ATP consumption also increases the AMP/ADP intracellular concentration that activates AMPK, resulting in protein phosphorylation [18]. Interestingly, AMPK levels increased at 24 h, but the ratio p-AMPK/AMPK increased only after 48 h incubation with Neq0440 (Figure 3 and Figure S3). Higher levels of p-AMPK can also trigger the PI3K-AKT-mTOR pathway inhibition. The reduction in the intermembrane potential was lower for the non-tumoral PNT-2 cells, showing selectivity for the PC-3 lineage (Table 2). These findings indicate that the mitochondria in PNT-2 cells were more resistant to the treatment than those in PC-3 cells.
Under conditions of nutritional balance, lysosomes produce large amounts of amino acids, activating the mTORC1 complex on the lysosomal membrane through a mechanism involving amino acid transporters [28,29]. However, nutrient deficiency triggers the movement of proteins involved in lysosome movement toward the nucleus via dissociation from lysosomal membranes [30]. In addition, lysosomes interact with mitochondria and the endoplasmic reticulum for homeostatic regulation [31], which can also be affected by the mitochondrial stress promoted by the treatment. The location of the lysosomes around the nucleus may indicate metabolic stress. The metabolic stress caused by Neq0440 treatment kept the lysosomes close to the nucleus in PC-3 cells (Figure 5), reinforcing nutritional deprivation conditions. In addition, Neq0440 induced differential lysosome biogenesis in favor of non-tumoral cells.
The Western blot results provided a clear picture of the Neq0440 bioactivity against the PC-3 cells (Figure 3 and Figure S3). Neq0440 downregulated the PI3K-AKT-mTOR pathway via the high AMPK level from mitochondrial stress. It is important to note that EBP1 and S6RP are linked to the development of prostate cancer, and the PC-3 lineage presents high levels of these kinases [32,33].
Finally, it should be noted that this in vitro study brings its own limitations in terms of the in vivo physiological context. Therefore, a deeper analysis of the proposed mechanism in vivo can also provide more valuable insights.
In summary, compound Neq0440 was cytotoxic and selective against PC-3 prostate cancer cells, triggering the PI3K-AKT-mTOR pathway inhibition (Figure 6). The ratio of polarized versus depolarized mitochondria was reduced after 72 h of incubation in PC-3 cells, along with the pH reduction and an increase in ROS after 48 h. Neq0440 could not promote lysosome biogenesis for PC-3 cells to the same extent as PNT-2 cells. Moreover, the lysosomes were located near the nucleus of the PC-3 cells after Neq0440 treatment (another indicator of metabolic stress). Overall, this study improved the current knowledge of the bioactivity of this 2-aminopyridine chemical that can be used to evaluate novel derivatives in an anticancer drug discovery effort.
4. Materials and Methods
4.1. Chemicals
Compound Neq0440 was acquired from ChemBridge Corporation (12935164 and #18144428, respectively), with purity above 95%, as previously described [8]. The free-base form of doxorubicin (CAS 23214-92-8) was obtained from MedKoo Biosciences, Inc. (code 100960). According to the HPLC data provided by the companies, the purity was greater than 95%.
All compounds were solubilized in DMSO at a concentration of 50 mM and stored at -20 °C. The working solutions were prepared at the desired concentrations with 0.5% (v/v) of DMSO of the stock compound diluted in the culture medium.
4.2. Cell Culture
Prostate (PNT-2) and metastatic adenocarcinoma (PC-3) cell lines were acquired from the Cell Bank of Rio de Janeiro (BCRJ), codes 0269 and 0047, respectively. The metastatic prostate carcinoma cell line PC-3, derived from bone metastasis, was cultured in F-12K medium (Cultilab®, Brazil). The non-tumoral human prostate cell line PNT-2 was cultured in RPMI 1640 medium supplemented with 0.35% (w/v) glucose. All culture media were supplemented with 0.15% sodium bicarbonate (w/v), 10% inactivated fetal bovine serum (v/v), and 1.0% penicillin/streptomycin (v/v) solution. The cells were cultured in T75 flasks and maintained in an incubator at 37 °C, 90% humidity, and 5% CO2 until they reached 80% confluence. All cells were used until passage 15.
4.3. Cell Viability Assay
The cells were seeded at a concentration of 1.0x10⁴ cells/well (100 µL at 1.0x10⁵ cells/mL) in 96-well plates, followed by 24 hours of incubation for adhesion. The compounds were then pipetted into each well and incubated at 37 °C and 5% CO2 for 72 hours. Culture medium supplemented with 0.5% (v/v) DMSO was used as a negative control. Doxorubicin (Dox) was administered as a positive control for cell death. The viability was measured after 3 h of incubation with MTT at a concentration of 1.0 mg/mL [8]. The absorbance was quantified at 570 nm via a Biotek Synergy HT plate reader. All analyses were performed in quintuplicate with two independent assays. The same method was used to determine the IC50. Cell viability was evaluated for all compounds at concentrations of 1.0, 10, 33.3, 66.6, 100, 150, and 250 μM. The selectivity index (SI) of these substances was determined by considering the ratio between the IC50 values of the nontumoral cell and the cancer cell, with higher selectivity indicating lower drug side effects.
The selectivity index (SI) was calculated via the IC50 response:
SI = IC50 PNT-2/ IC50 PC-3,
SI < 1 indicates that the treatment was more cytotoxic to non-tumoral cells. When the SI was > 1, the treatment was more cytotoxic (selective) to the prostate cancer cell line. For SI ≈ 1, there was no selectivity.
The cytotoxicity of DMSO was evaluated, and a final concentration of 0.5% (v/v) was chosen, as it was found to be inactive for PC-3 cells (Figure S1).
4.4. Combined Therapy
The cells were seeded in 96-well plates at a concentration of 1.0x10⁴ cells/well and maintained at 5% CO2 in a humidified incubator for 24 hours to promote cell adhesion. The therapeutic scheme was designed for each plate containing doxorubicin at concentrations of 0.0010, 0.0030, 0.010, 0.030, 0.10, 0.33, 1.0, 10, and 100 μM (for the standalone therapy) or in combination with the inactive concentration of 1.0 μM for Neq0440. Culture medium supplemented with 0.5% (v/v) DMSO was used as a negative control. After 72 hours, the absorbance was quantified at 570 nm via a Biotek Synergy HT plate reader. All analyses were performed in quintuplicate in two independent assays. The data are presented as percentages, and the negative control was considered 100%.
4.5. Epifluorescence Microscopy
The cells were seeded at a density of 1.0 × 10⁴ cells/well in 96-well black plates with a crystal flat bottom (CellViewTM, Greiner Bio-One) and incubated in a humidified chamber at 37 °C and 5% CO2 to promote cell adhesion to the plate surface. After 24 hours, the cells were treated with test compounds and incubated for 72 hours. After incubation, the wells were washed with PBS, and the fluorescent markers were added. Each reagent was prepared according to the manufacturer's instructions. The nuclei were stained with Hoechst 33342 (λexc = 350 nm; λem = 461 nm) and detected using a DAPI cube (blue). Mitochondrial polarization was quantified with a Guava Mitochondrial Depolarization Kit (4500-0250) and observed at the corresponding wavelengths for JC-1 (λexc = 514 nm; λem = 529 nm) and 7-AAD (λexc = 549 nm; λem = 644 nm) via GFP (green) and Texas Red (red) cubes, respectively. LysoTrackerTM (Thermo Fisher Scientific) was used to stain the lysosomes red. Images of the morphological structures and fluorophores were obtained with an EVOS FL epifluorescence microscope (Thermo Fisher Scientific) at 60x magnification. All steps for obtaining the images were standardized to avoid bias. The cells were photographed with 60% illumination, and image editing was performed via FIJI/ImageJ v. 1.54 software [33]. Image standardization was achieved by subtracting the background (50.0 pixels), with contrast and brightness increasing from 0 to 70. The ratio between the fluorescence of the image area and the total number of cells provided the CTCF values. The data refer to the mean CTCF of the assay performed in duplicate (N = 2).
4.6. Western Blot
Total protein extraction from PC-3 cells incubated for 24 h without any treatment or with graded concentrations of Neq0440 (vehicle, 10, 50, or 100 μM) was performed with buffer containing 100 mM Tris (pH 7.6), 1.0% Triton X-100, 150 mM NaCl, 2.0 mM PMSF, 10 mM Na3VO4, 100 mM NaF, 10 mM Na4P2O7, and 4.0 mM EDTA. The extracted proteins were quantified via the Bradford method. Equal amounts of protein (50 μg) were used from total extracts, followed by SDS‒PAGE and Western blotting analysis with the indicated antibodies as previously described [34]. The percentage of the polyacrylamide gels ranged from 8 to 15%, and nitrocellulose membranes (GE Healthcare) were used. Antibodies against p-mTOR (cat. no. 2971), mTOR (cat. no. 2972), p-AKT (cat. no. 4060), AKT (cat. no. 4685), p-4EBP1 (cat. no. 9455), 4EBP1 (cat. no. 9452), p-S6RP (cat. no. 4858), S6RP (cat. no. 2217), p-AMPK (cat. no. 2535), AMPK (cat. no. 2532), and α-tubulin (cat. no. 2144) were obtained from Cell Signaling Technology, Inc. All primary antibodies used were diluted 1:2000 and incubated for 16 h. α-tubulin was used as the loading control. The secondary antibodies anti-rabbit IgG (cat. no. 7074P2) and anti-mouse IgG (cat. no. 7076P2) conjugated with horseradish peroxidase were obtained from Cell Signaling Technology, Inc. and were used at a 1:2000 dilution with a 2 h incubation. The SuperSignalTM West Dura Extended Duration Substrate system (Thermo Fisher Scientific, Inc.) and G:BOX Chemi XX6 gel document system (Syngene Europe) were used for blot visualization.
4.7. Investigation of Reactive Oxygen Species (ROS) Formation
The cells were trypsinized at 80% confluence, and the cell concentration was adjusted to 1.0x10⁴ cells/well in 96-well plates. The plates were incubated in a humidified chamber at 37 °C and 5% CO2 for 24 hours. After adhesion, the cells were treated with compounds of interest. The analyses were performed at 24-, 48-, and 72-hour intervals. All the wells were washed twice with PBS, followed by incubation with DCFH-DA (500 µM in PBS) for 30 minutes. After all the wells were washed, the fluorescence was immediately measured via a Biotek Synergy HT plate reader (λexc = 485/40 nm and λem = 532/40 nm). The negative control consisted of culture medium supplemented with 0.5% DMSO. The positive control contained 500 µM H2O2. All analyses were performed in quintuplicate with two independent assays. The relative percentage was calculated from the raw data to the negative control (100% response).
4.8. Statistical Analysis
All the data were gathered and transformed via MS Excel® and analyzed with GraphPad v. 6. The values are shown as the means ± errors unless otherwise stated. Comparisons among groups were performed with two-way ANOVA with Dunnett's post hoc test considering the mean values. The values of p <0.05 were considered significant.
Supplementary Materials
The following supporting information can be downloaded at the website of this paper posted on Preprints.org, The following supporting information is available for download: Figures S1-S6.
Author Contributions
A.L., J.A.M.N., and C.A.M. designed the project, analyzed the results, and provided funding. T.A.V., S.M.B., and K.L. performed all the cell-based assays. Writing—review and editing were performed by T.A.V. and A.L. All the authors have read and agreed with the current manuscript.
Funding
This research was funded by the São Paulo Research Foundation (FAPESP) 2020/16799-1 (S.M.B.), 2023/12246-6 (J.A.M.N.), 2023/16111-8 (A.L.); the National Research Council (CNPq) 312086/2023-7 (A.L.); and Coordenação de Aperfeiçoamento de Pessoal de Nível Superior - Brazil (CAPES) - Finance Code 001 (T.A.V.).
Data Availability Statement
All images and data are available as supplementary information. Further data can be sent upon request.
Acknowledgments
During the preparation of this manuscript/study, the author(s) used Grammarly to improve the writing. The authors have reviewed and edited the output and take full responsibility for the content of this publication.
Conflicts of Interest
The authors declare no conflicts of interest.
Abbreviations
The following abbreviations are used in this manuscript:
| 4EBP1 | Eukaryotic initiation factor 4E-binding protein 1 |
| 7-AAD | 7-Aminoactinomycin D |
| AKT | Protein kinase B |
| AMPK | 5' AMP-activated protein kinase |
| BCRJ | Cell Bank of Rio de Janeiro |
| CTFC | Corrected total cell fluorescence |
| Dox | Doxorubicin |
| DMSO | Dimethyl sulfoxide |
| DU145 | Prostate cancer cell line |
| HPLC | High-performance liquid chromatography |
| IC50 | Half maximal inhibitory concentration |
| mTOR | Mammalian target of rapamycin |
| MTT | 3-(4,5-di methyl thiazol-2-yl)-2,5-diphenyltetrazolium bromide |
| PC-3 | Prostate cancer cell line |
| PI3K | Phosphoinositide 3-kinase |
| PNT-2 | Prostate cell line |
| ROS | Reactive oxygen species |
| S6RP | Ribosomal protein S6 |
| SI | Selectivity index |
References
- Siegel, R. L.; Kratzer, T. B.; Giaquinto, A. N.; Sung, H.; Jemal, A. Cancer Statistics, 2025. CA Cancer J Clin 2025, 75 (1), 10–45. [CrossRef]
- Bergengren, O.; Pekala, K.R.; Matsoukas, K.; Fainberg, J.; Mungovan, S.F.; Bratt, O.; Bray, F.; Brawley, O.; Luckenbaugh, A.N.; Mucci, L.; Morgan, T.M.; Carlsson, S.V. 2022 Update on Prostate Cancer Epidemiology and Risk Factors—A Systematic Review. Eur. Urol. 2023, 84, 191-206. [CrossRef]
- Giona, S. The Epidemiology of Prostate Cancer. In Prostate Cancer; Bott, S. R., Ng, K. L., Eds.; Exon Publications: Brisbane (AU), 2021; pp. 1-16.
- Sekhoacha, M.; Riet, K.; Motloung, P.; Gumenku, L.; Adegoke, A.; Mashele, S. Prostate Cancer Review: Genetics, Diagnosis, Treatment Options, and Alternative Approaches. Molecules 2022, 27, 5730. [CrossRef]
- Achard, V.; Putora, P.M.; Omlin, A.; Zilli, T.; Fischer, S. Metastatic Prostate Cancer: Treatment Options. Oncology 2021, 100, 48-59. [CrossRef]
- Naseer, F.; Ahmad, T.; Kousar, K.; Anjum, S. Advanced Therapeutic Options for Treatment of Metastatic Castration Resistant Prostatic Adenocarcinoma. Front Pharmacol. 2021, 12, 728054. [CrossRef]
- Huang, F.; Li, K.; Shevach, J.W.; Wang, Q. Emerging therapies to overcome antiandrogen resistance and beyond in lethal prostate cancer. J. Natl. Cancer Cent. 2025, in press. [CrossRef]
- Saidel, M.E.; dos Santos, K.C.; Nagano, L.F.P.; Montanari, C.A.; Leitão, A. Novel anti-prostate cancer scaffold identified by the combination of in silico and cell-based assays targeting the PI3K-AKT-mTOR pathway. Bioorg. Med. Chem. Lett. 2017, 27, 4001-4006. [CrossRef]
- Mao, B.; Zhang, Q.; Ma, L.; Zhao, D.-S.; Zhao, P.; Yan, P. Overview of Research into mTOR Inhibitors. Molecules 2022, 27, 5295. [CrossRef]
- Kciuk, M.; Gielecińska, A.; Mujwar, S.; Kołat, D.; Kałuzińska-Kołat, Ż.; Celik, I.; Kontek, R. Doxorubicin—An Agent with Multiple Mechanisms of Anticancer Activity. Cells 2023, 12, 659. [CrossRef]
- Foucquier, J.; Guedj, M. Analysis of drug combinations: current methodological landscape. Pharmacol. Res. Perspect. 2015, 3, e00149. [CrossRef]
- Yan, G.; Elbadawi, M.; Efferth, T. Multiple Cell Death Modalities and Their Key Features (Review). World. Acad. Sci. J. 2020, 2, 39–48. [CrossRef]
- Shubin, A.V.; Demidyuk, I.V.; Komissarov, A.A.; Rafieva, L.M.; Kostrov, S.V. Cytoplasmic vacuolization in cell death and survival. Oncotarget 2016, 7, 55863–55889. [CrossRef]
- Steinberg, G.R.; Hardie, D.G. New Insights into Activation and Function of the AMPK. Nat. Rev.. Mol. Cell Biol. 2023, 24, 255–272. [CrossRef]
- Kma, L.; Baruah, T.J. The Interplay of ROS and the PI3K/Akt Pathway in Autophagy Regulation. Biotechnol. Appl. Biochem. 2022, 69, 248–264. [CrossRef]
- Wagner, B.A.; Evig, C.B.; Reszka, K.J.; Buettner, G.R.; Burns, C.P. Doxorubicin Increases Intracellular Hydrogen Peroxide in PC3 Prostate Cancer Cells. Arch. Biochem. Biophys. 2005, 440, 181-190. [CrossRef]
- Lima, A.R.; Araújo, A.M.; Pinto, J.; Jerónimo, C.; Henrique, R.; Bastos, M.L.; Carvalho, M.; Guedes de Pinho, P. Discrimination between the Human Prostate Normal and Cancer Cell Exometabolome by GC-MS. Sci. Rep. 2018, 8, 5539. [CrossRef]
- Higgins, L.H.; Withers, H.G.; Garbens, A.; Love, H.D.; Magnoni, L.; Hayward, S.W.; Moyes, C.D. Hypoxia and the Metabolic Phenotype of Prostate Cancer Cells. Biochim. Biophys. Acta Bioenerg. 2009, 1787, 1433-1443. [CrossRef]
- Kciuk, M.; Gielecińska, A.; Mujwar, S.; Kołat, D.; Kałuzińska-Kołat, Ż.; Celik, I.; Kontek, R. Doxorubicin—An Agent with Multiple Mechanisms of Anticancer Activity. Cells 2023, 12, 659. [CrossRef]
- Yan, G.; Elbadawi, M.; Efferth, T. Multiple Cell Death Modalities and Their Key Features (Review). World Acad. Sci. J. 2020, 2, 39-48. [CrossRef]
- Lee, W.; Kim, K.-Y.; Yu, S.‒N.; Kim, S.-H.; Chun, S.‒S.; Ji, J.-H.; Yu, H.-S.; Ahn, S.-C. Pipernonaline from Piper longum Linn. induces ROS-mediated apoptosis in human prostate cancer PC-3 cells. Biochem. Biophys. Res. Commun. 2013, 430, 406-412. [CrossRef]
- Shao, L.; Shao, Y.; Yuan, Y. Pinocembrin flavanone inhibits cell viability in PC-3 human prostate cancer by inducing cellular apoptosis, ROS production and cell cycle arrest. Acta. Pharm. 2021, 71, 669-678. [CrossRef]
- Rebsamen, M.; Pochini, L.; Stasyk, T.; de Araújo, M.E.G.; Galluccio, M.; Kandasamy, R.K.; Snijder, B.; Fauster, A.; Rudashevskaya, E.L.; Bruckner, M.; Scorzoni, S.; Filipek, P.A.; Huber, K.V.M.; Bigenzahn, J.W.; Heinz, L.X.; Kraft, C.; Bennett, K.L.; Indiveri, C.; Huber, L.A.; Superti-Furga, G. SLC38A9 is a component of the lysosomal amino acid sensing machinery that controls mTORC1. Nature 2015, 519, 477-481. [CrossRef]
- Wang, S.; Tsun, Z.-Y.; Wolfson, R.L.; Shen, K.; Wyant, G.A.; Plovanich, M.E.; Yuan, E.D.; Jones, T.D.; Chantranupong, L.; Comb, W.; Wang, T.; Bar-Peled, L.; Zoncu, R.; Straub, C.; Kim, C.; Park, J.; Sabatini, B.L.; Sabatini, D.M. Lysosomal amino acid transporter SLC38A9 signals arginine sufficiency to mTORC1. Science 2015, 347, 188-194. [CrossRef]
- Korolchuk, V.I.; Saiki, S.; Lichtenberg, M.; Siddiqi, F.H.; Roberts, E.A.; Imarisio, S.; Jahreiss, L.; Sarkar, S.; Futter, M.; Menzies, F.M.; O'Kane, C.J.; Deretic, V.; Rubinsztein, D.C. Lysosomal positioning coordinates cellular nutrient responses. Nat. Cell Biol. 2011, 13, 453-460. [CrossRef]
- Wong, Y.C.; Kim, S.; Peng, W.; Krainc, D. Regulation and Function of Mitochondria–Lysosome Membrane Contact Sites in Cellular Homeostasis. Trends Cell Biol. 2019, 29, 500-513. [CrossRef]
- Wang, K.; Wang, K.; Ma, Q. The Expression and Significance of p4E-BP1/4E-BP1 in Prostate Cancer. J. Clin. Lab. Anal. 2022, 36, e24332. [CrossRef]
- Cronin, R.; Brooke, G.N.; Prischi, F. The Role of the P90 Ribosomal S6 Kinase Family in Prostate Cancer Progression and Therapy Resistance. Oncogene 2021, 40, 3775–3785. [CrossRef]
- Ghasemi M, Turnbull T, Sebastian S, Kempson I. The MTT Assay: Utility, Limitations, Pitfalls, and Interpretation in Bulk and Single-Cell Analysis. Int. J. Mol. Sci. 2021, 22, 12827. [CrossRef]
- Schindelin, J.; Arganda-Carreras, I.; Frise, E.; Kaynig, V.; Longair, M.; Pietzsch, T.; Preibisch, S.; Rueden, C.; Saalfeld, S.; Schmid, B.; Tinevez, J.-Y.; White, D. J.; Hartenstein, V.; Eliceiri, K.; Tomancak, P.; Cardona, A. Fiji: An Open-Source Platform for Biological-Image Analysis. Nat. Methods 2012, 9, 676–682. [CrossRef]
- Lima, K.; Carlos, J.; Alves-Paiva, R.M.; Vicari, H.P.; Souza Santos, F.P.; Hamerschlak, N.; Costa-Lotufo, L.V.; Traina, F.; Machado-Neto, J.A. Reversine exhibits antineoplastic activity in JAK2(V617F)-positive myeloproliferative neoplasms. Sci. Rep. 2019, 9, 9895. [CrossRef]
Figure 1.
Chemical representation of Neq0440.
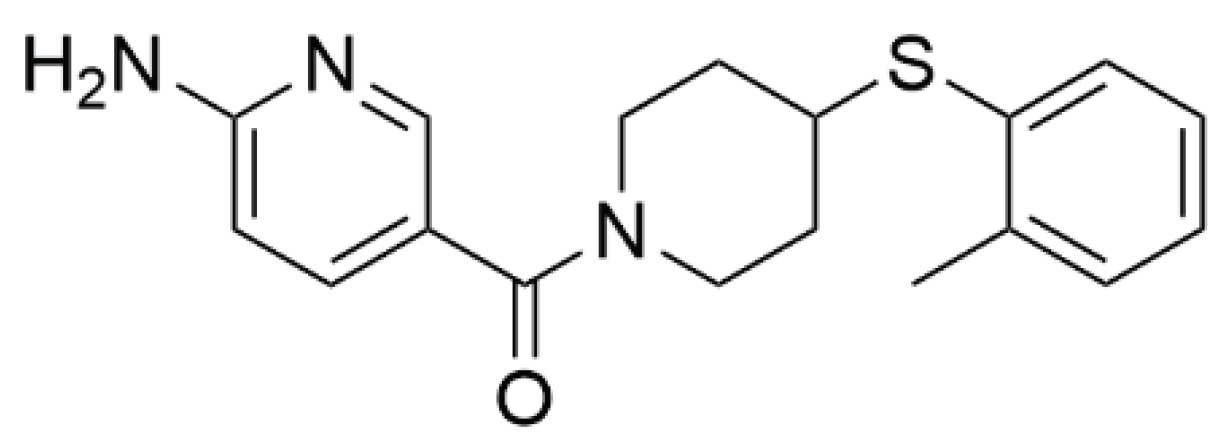
Figure 2.
Morphology and the mitochondrial membrane potential of PC-3 (a) and PNT-2 (b) cells (bright-field microscopy) after 72 h of incubation with Neq0440 and doxorubicin (Dox). The cell constituents were labeled blue with Hoechst 33452 (nuclei) and red/green with MitoTracker (polarized/depolarized mitochondria). Neg. Control: negative control. The white bar represents 50 µm. No image edition was made. The details can be found in Figure S2.
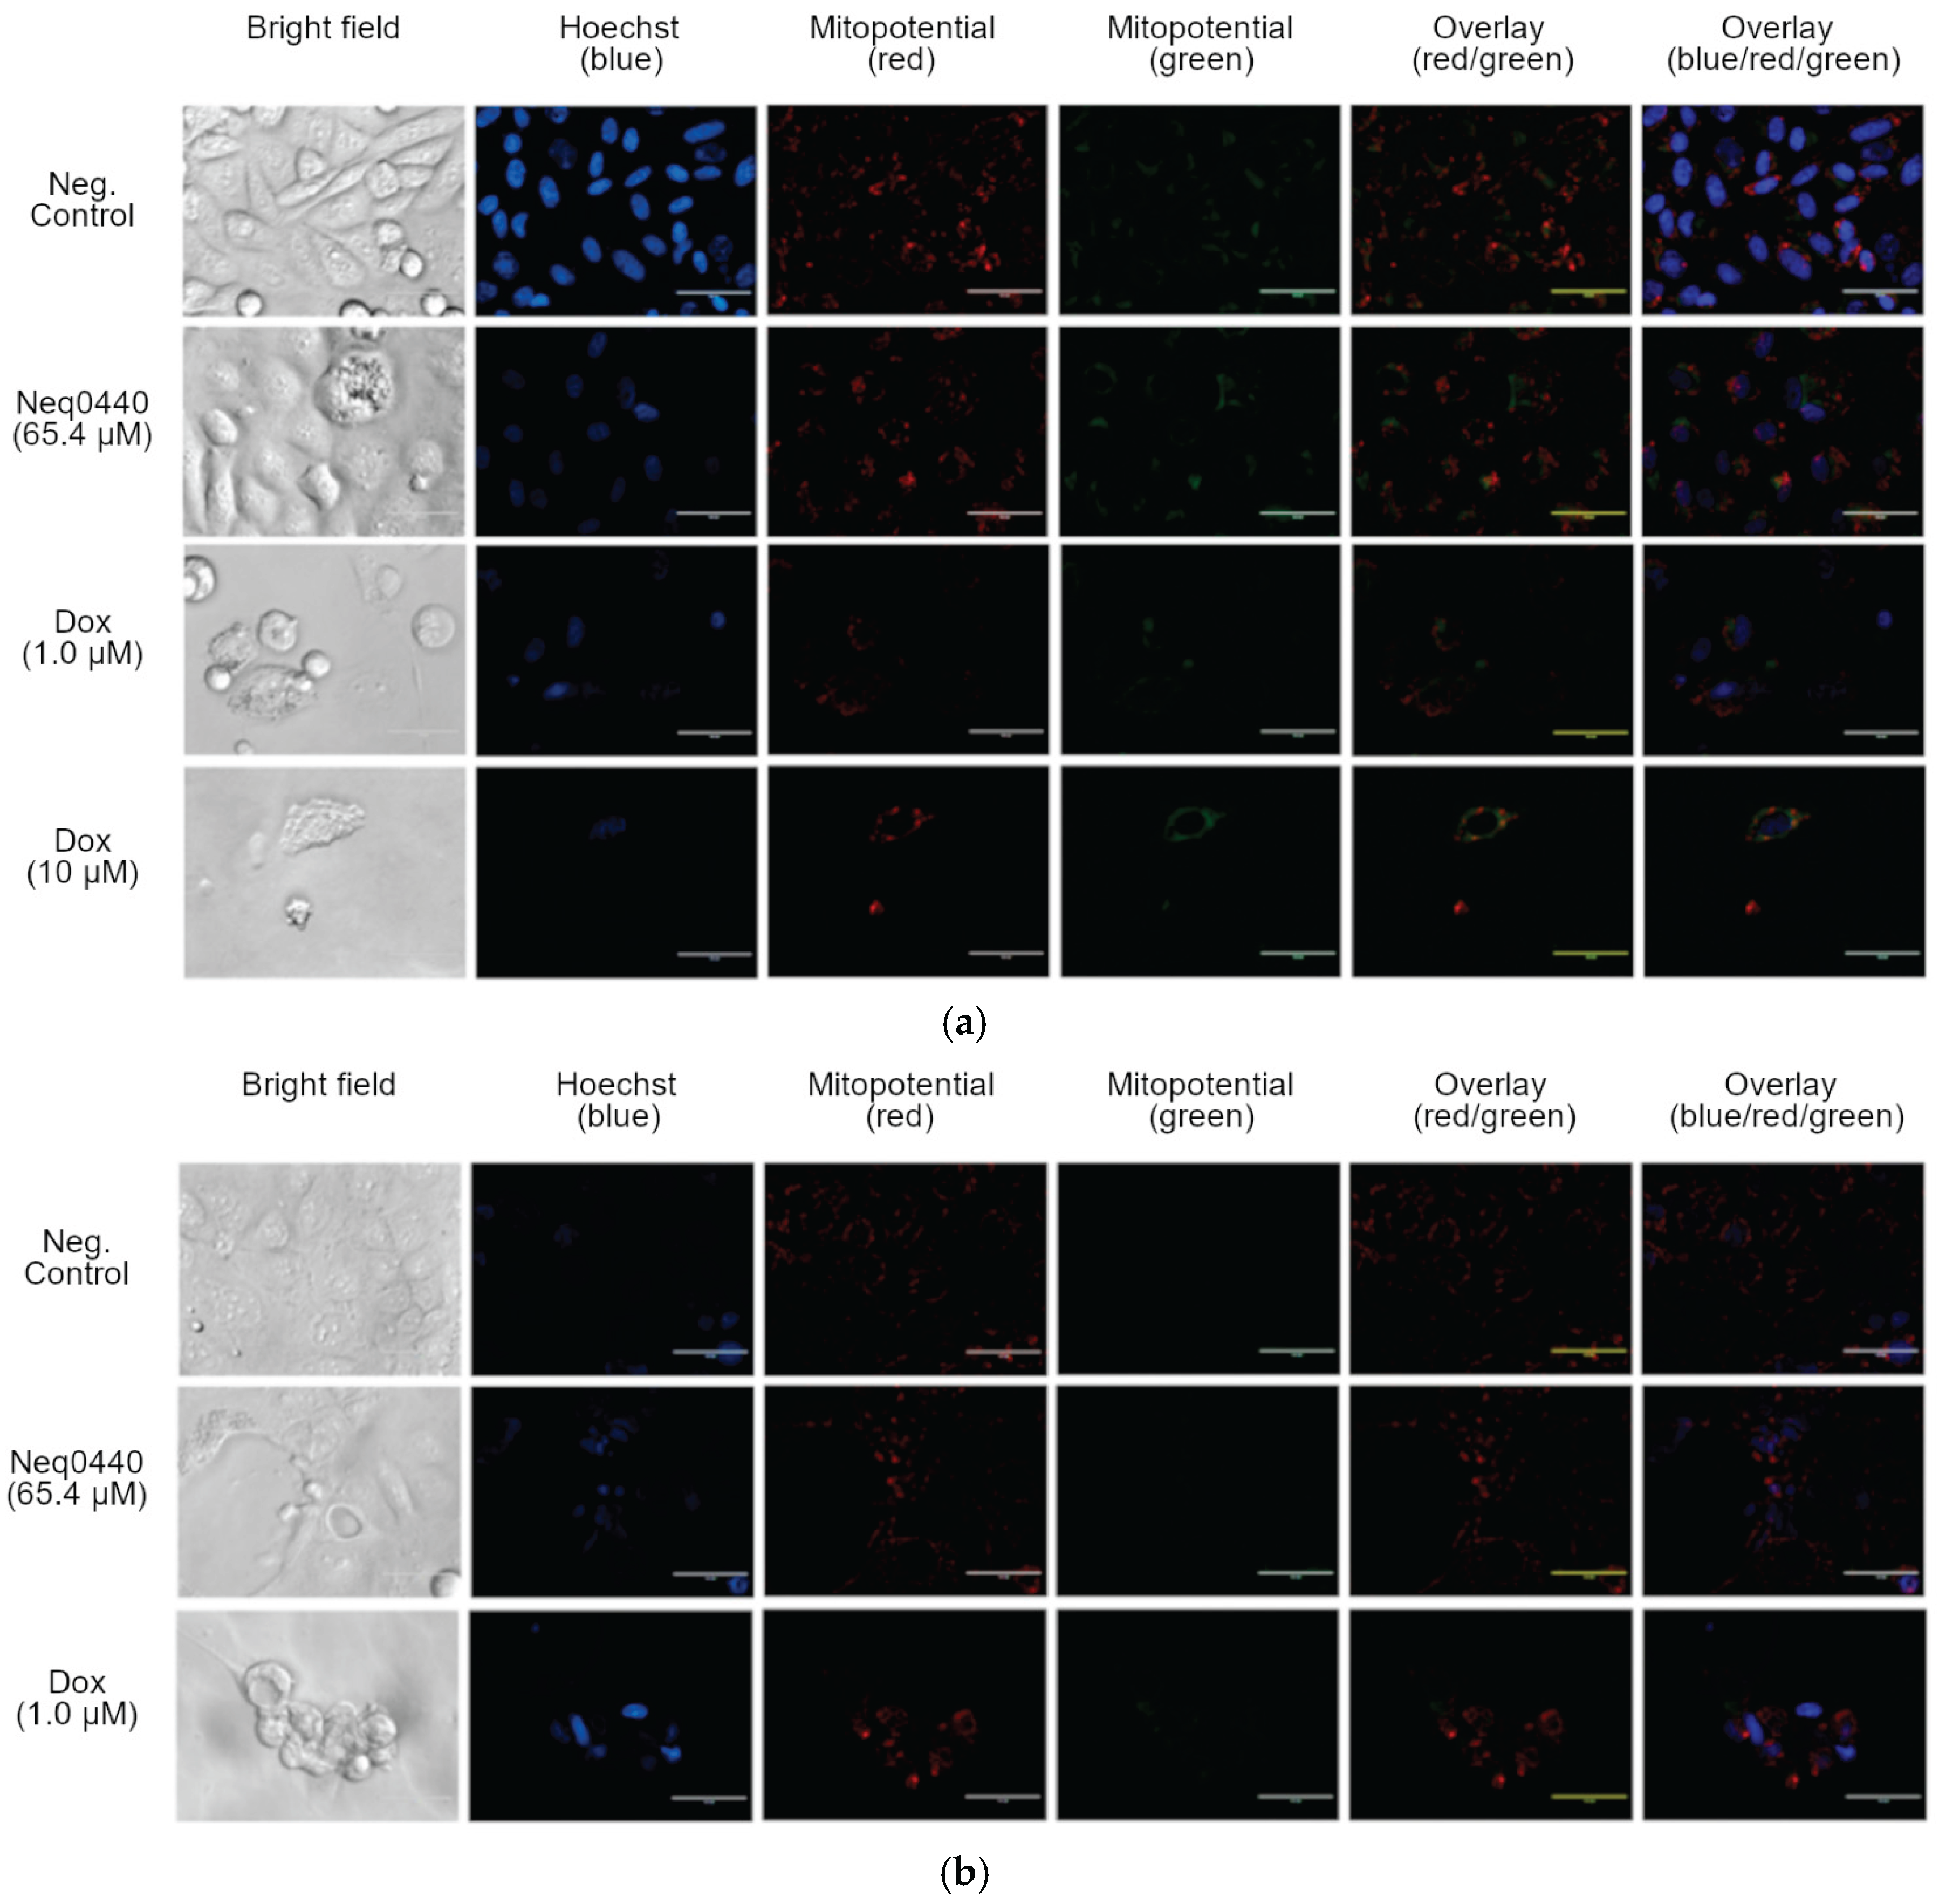
Figure 3.
Western blot analyses of the kinase phosphorylation modulation in PC-3 cells after 24 h (a) and 48 h (b) of incubation with compound Neq0440.
Figure 3.
Western blot analyses of the kinase phosphorylation modulation in PC-3 cells after 24 h (a) and 48 h (b) of incubation with compound Neq0440.
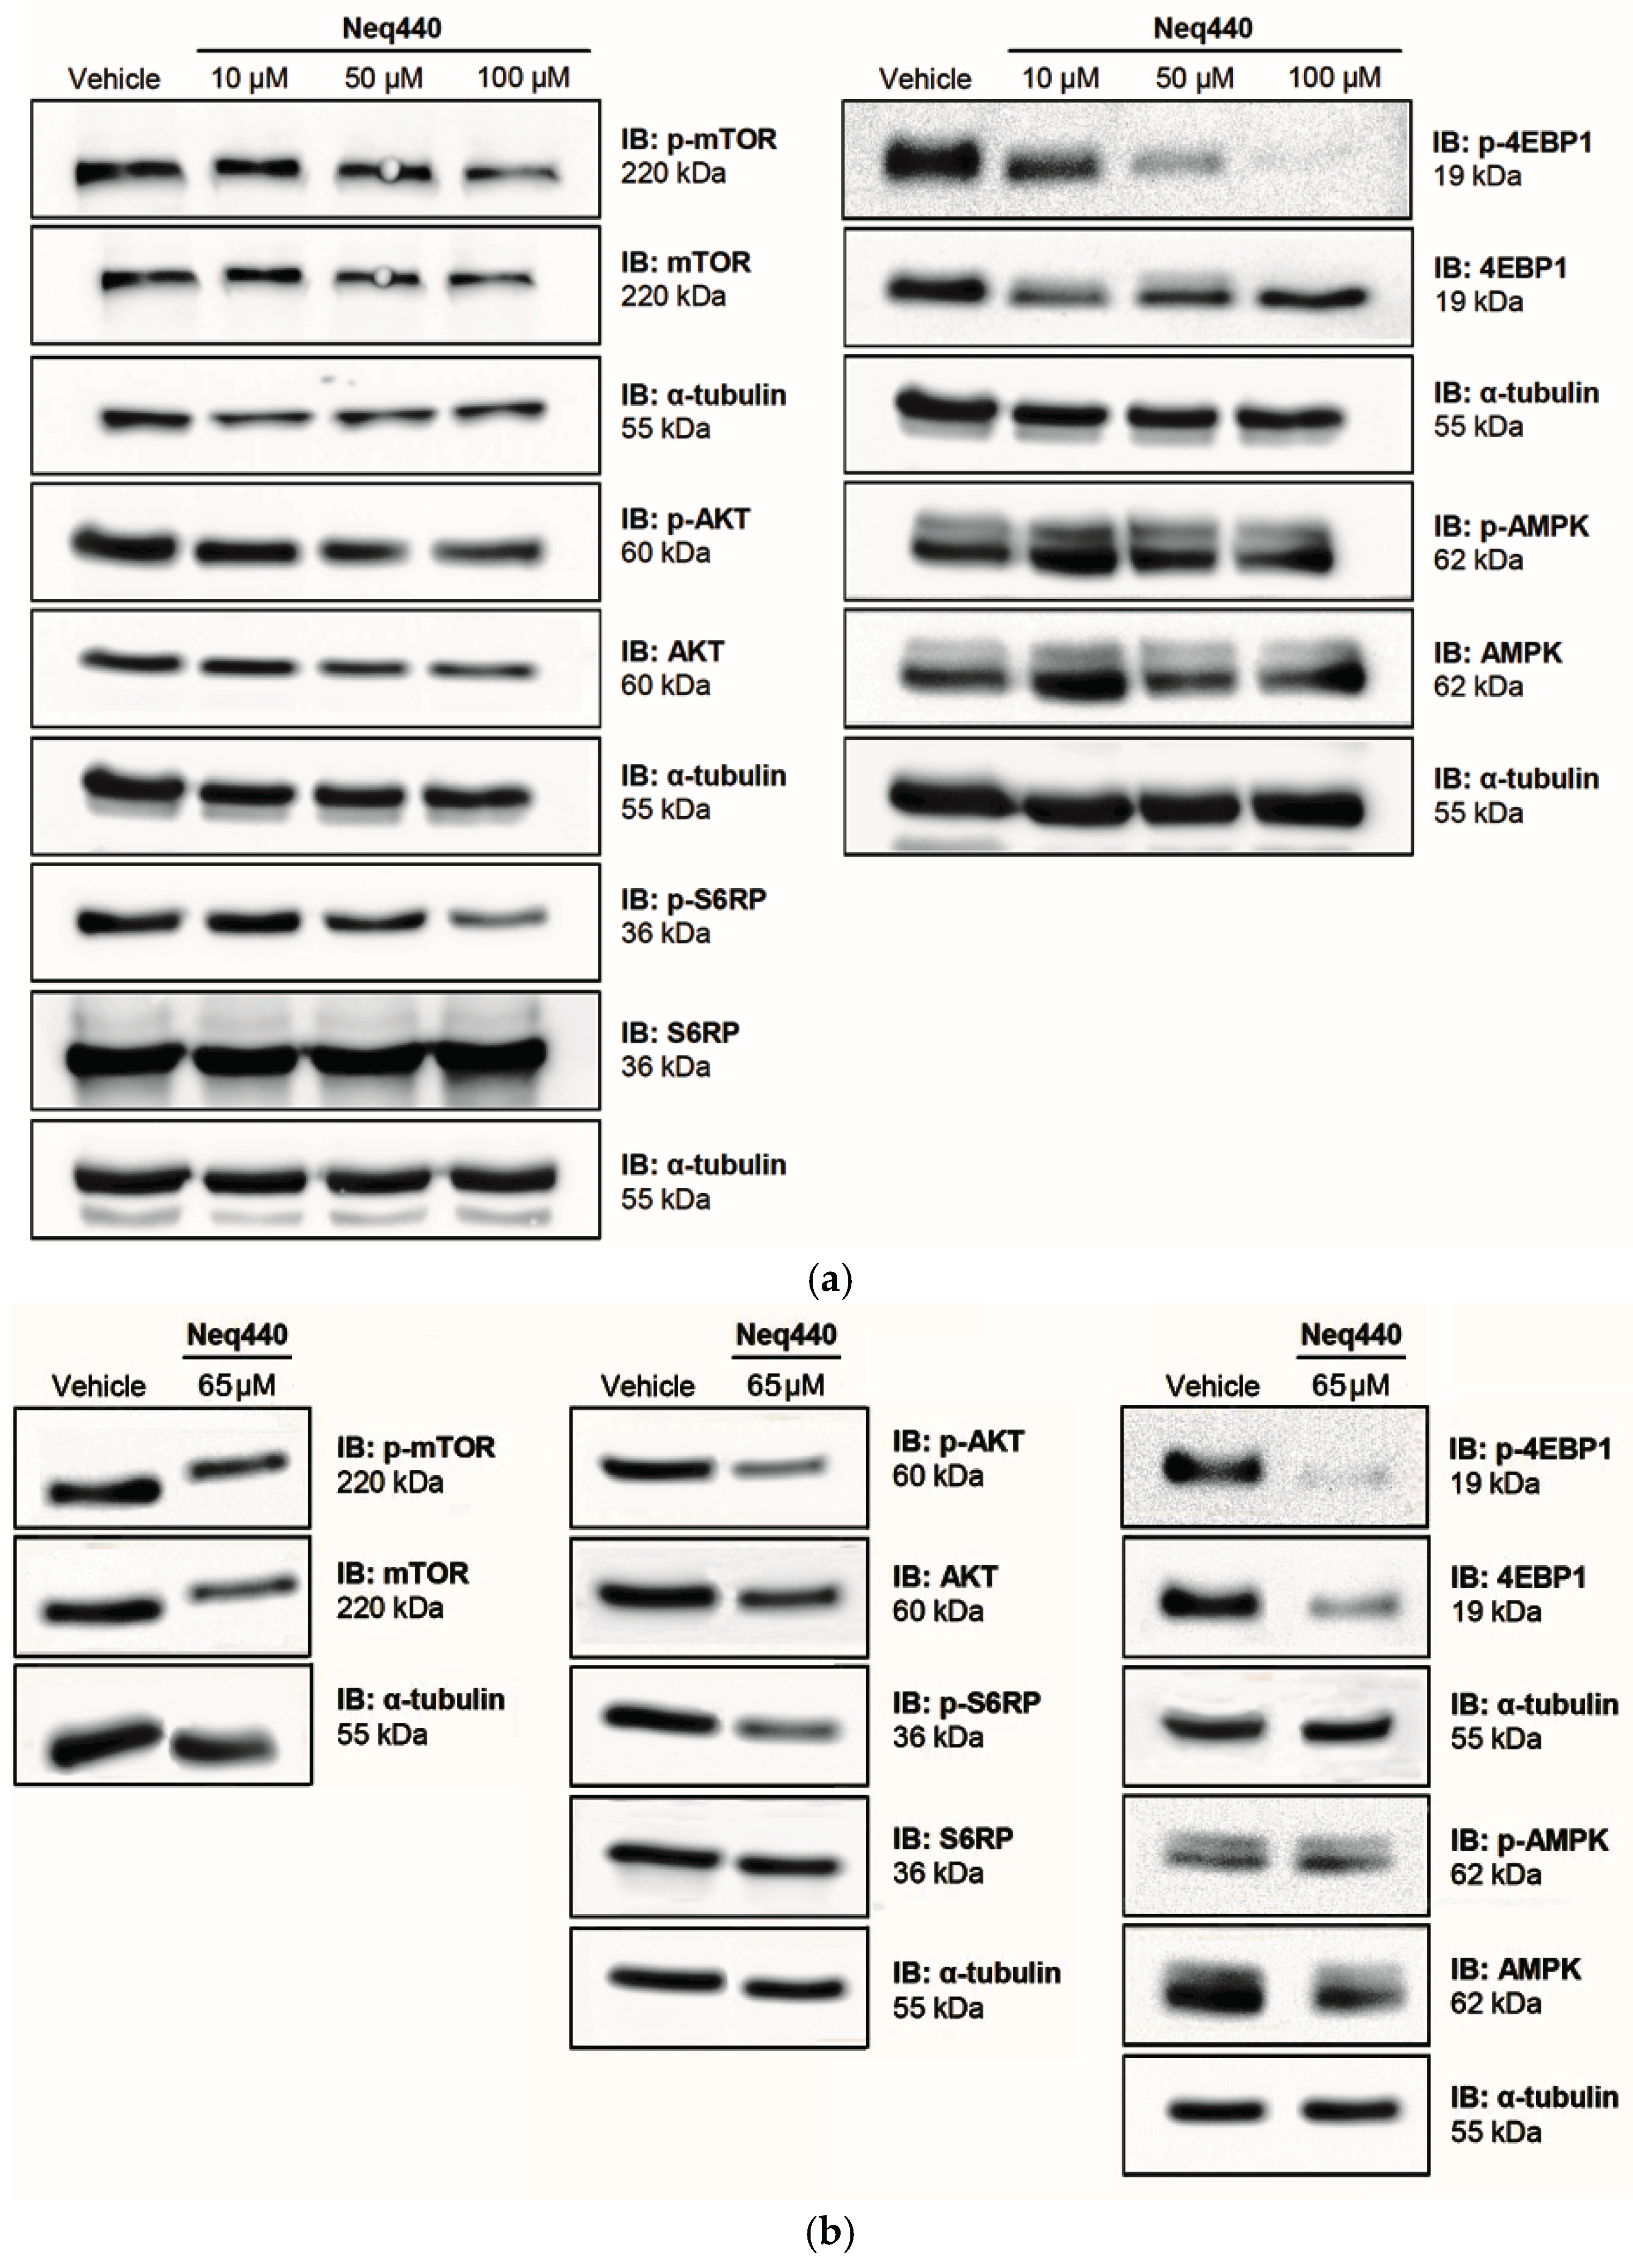
Figure 4.
Reactive oxygen species (ROS) were generated by PC-3 and PNT-2 cells after 24, 48, and 72 h of incubation with Neq0440 (65.4 µM) and doxorubicin (1.0 and 10 µM). The negative control is shown as the dotted line at 100%. H2O2 at 500 μM was used as a positive control. N=2.
Figure 4.
Reactive oxygen species (ROS) were generated by PC-3 and PNT-2 cells after 24, 48, and 72 h of incubation with Neq0440 (65.4 µM) and doxorubicin (1.0 and 10 µM). The negative control is shown as the dotted line at 100%. H2O2 at 500 μM was used as a positive control. N=2.
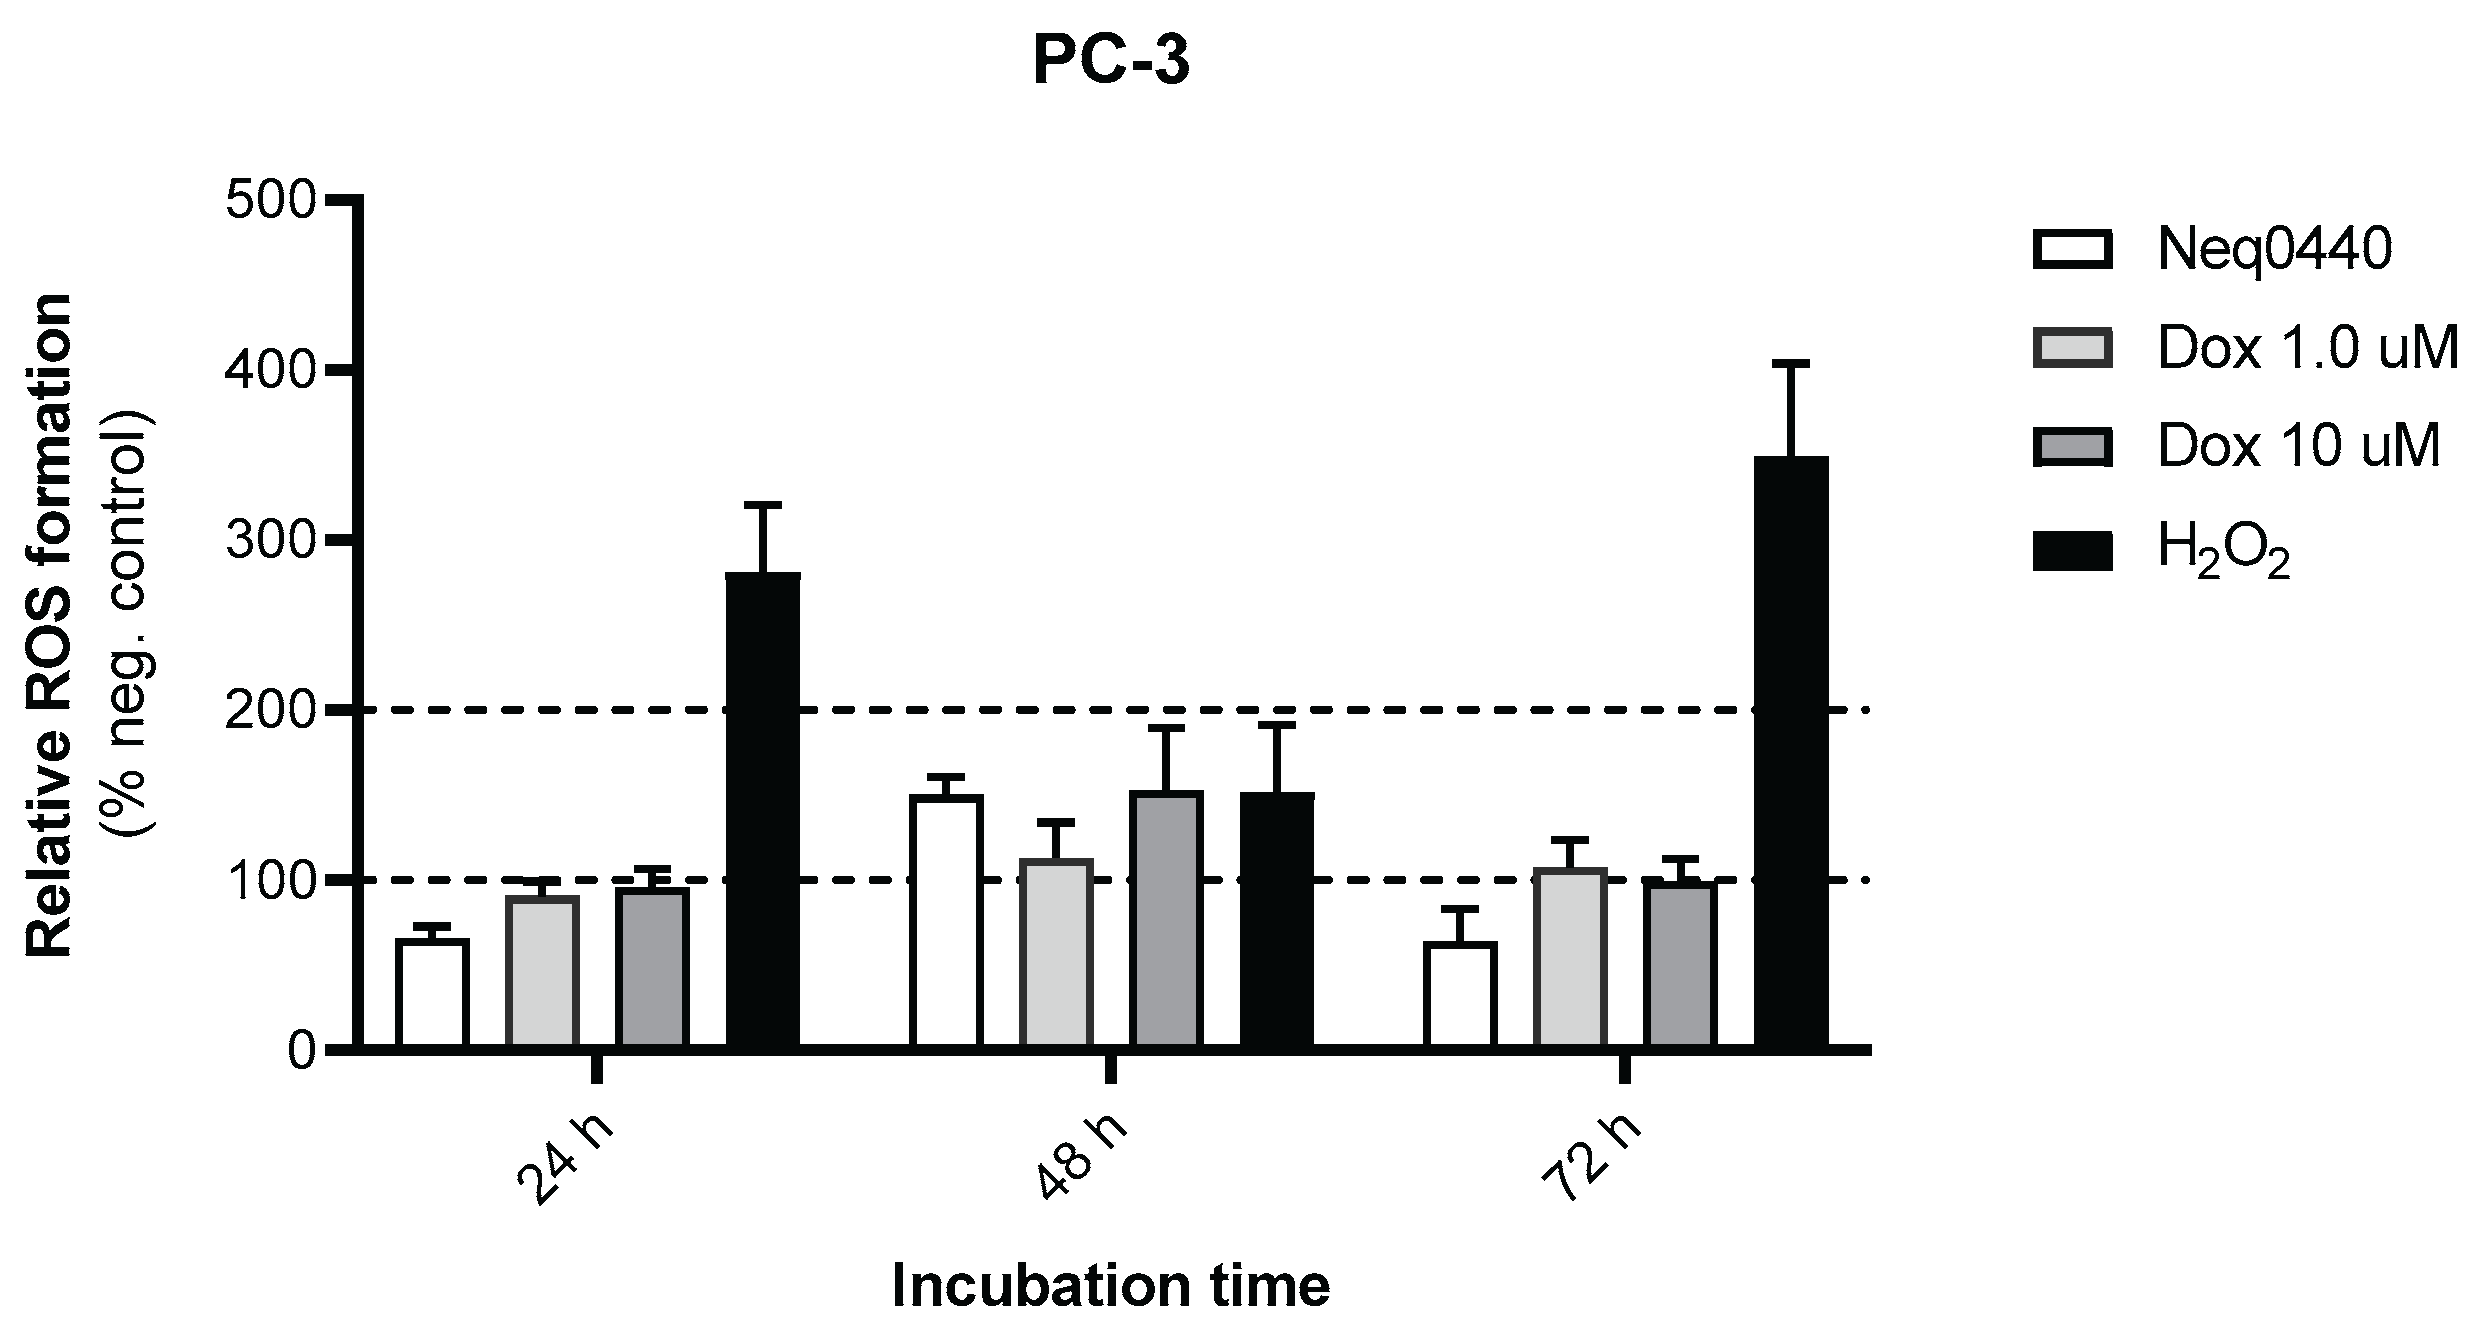
Figure 5.
Morphological aspects and fluorescence markers of the nucleus and lysosomes of PC-3 (a) and PNT-2 (b) cells after 72 h of incubation with Neq0440 and doxorubicin. The negative control contained the culture medium supplemented with 0.5% (v/v) DMSO. Hoechst 33342 (blue) and LysoTracker (red) labeled nuclei and lysosomes, respectively. Scale bars represent 50 µm. No image edition was made. Details can be identified in Figures S5 and S6.
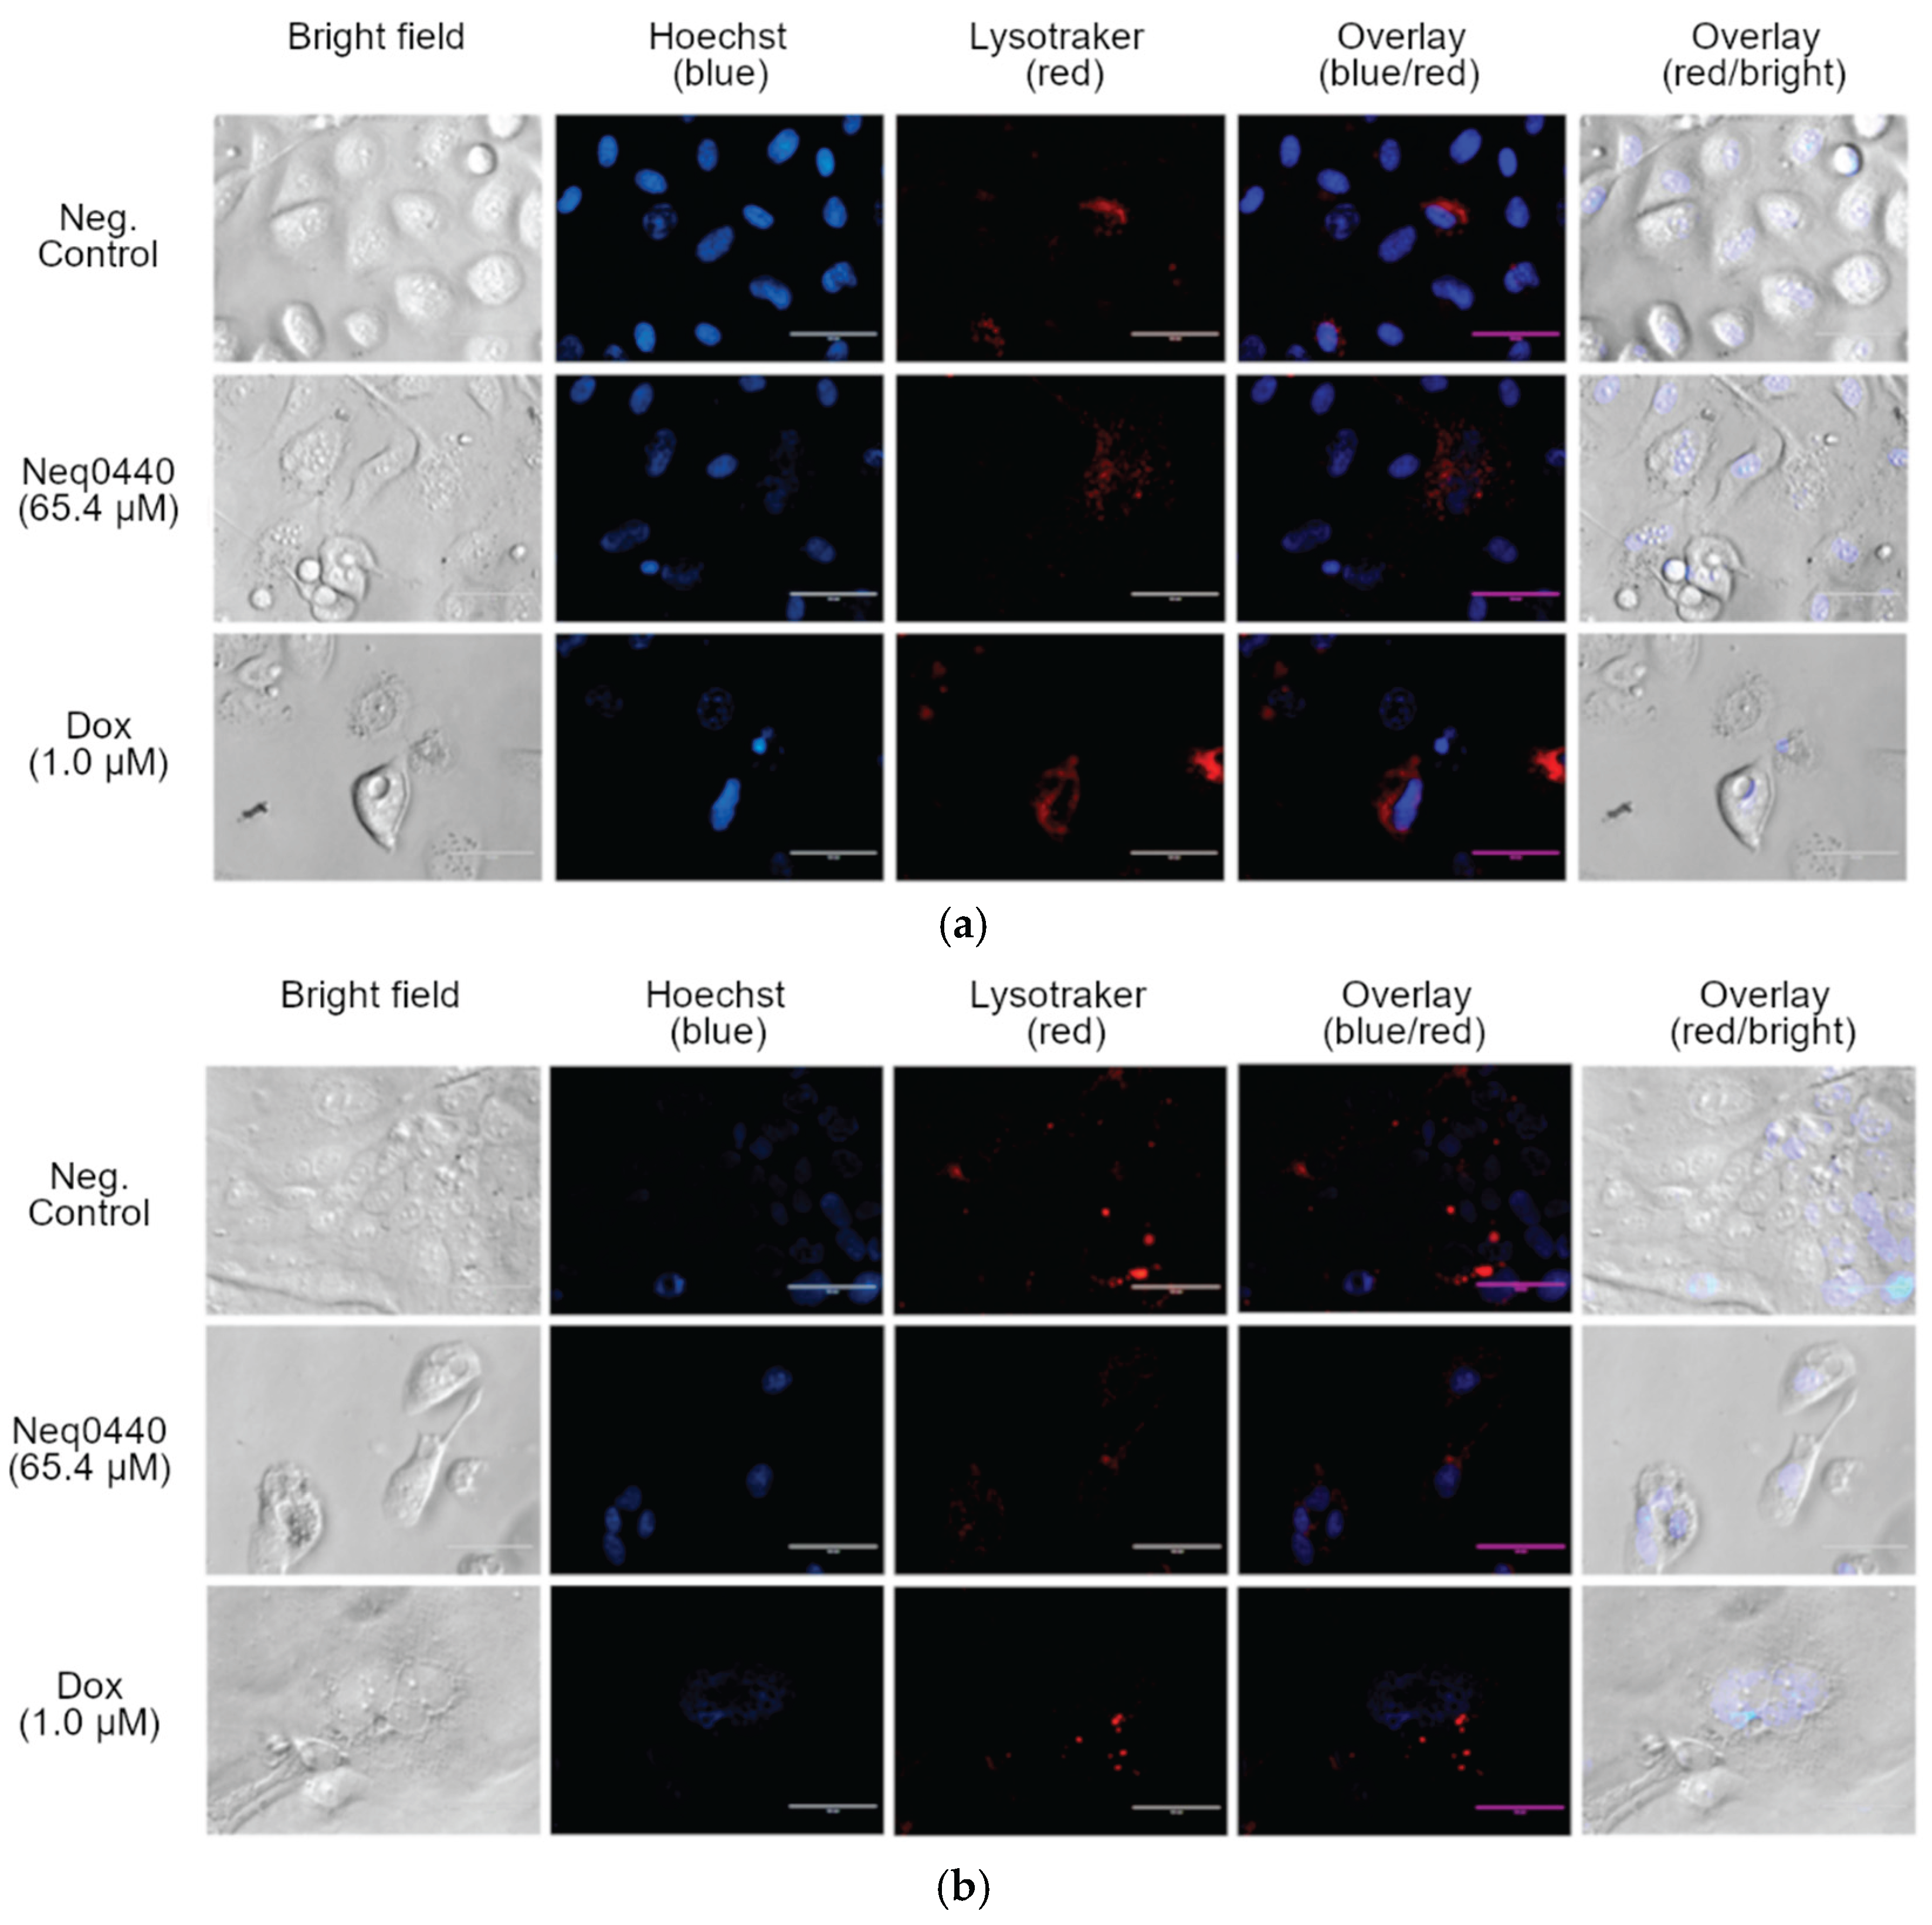
Figure 6.
The proposed mechanism of action of Neq0440 in PC-3 prostate cancer cells.
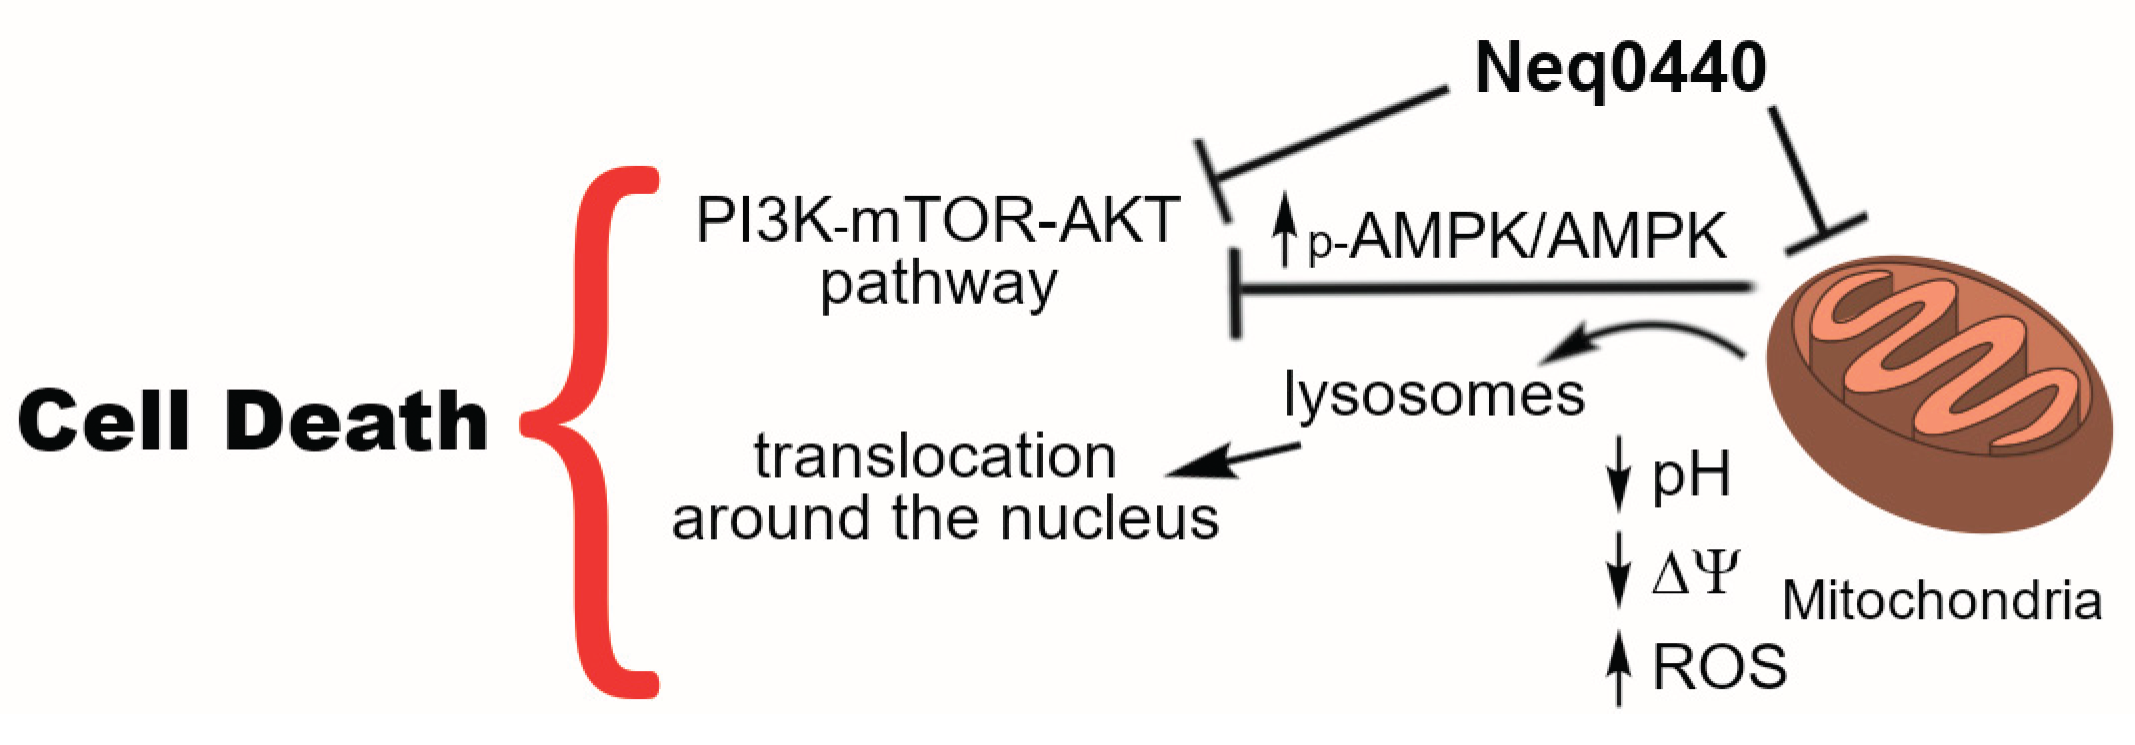

Table 1.
Potency (IC50) and selectivity index (SI) for Neq0440 and doxorubicin as monotherapies or in combination after 72 h of incubation against prostate cancer (PC-3) and epithelial (PNT-2) cell lines.
Table 1.
Potency (IC50) and selectivity index (SI) for Neq0440 and doxorubicin as monotherapies or in combination after 72 h of incubation against prostate cancer (PC-3) and epithelial (PNT-2) cell lines.
| Sample | IC50 PNT-2 ± SE (µM) | IC50 PC3 ± SE (µM) | SI |
|---|---|---|---|
| Neq0440 | > 250 | 65.4 ± 8.68 | > 3.8 |
| Doxorubicin | 0.12 ± 0.01 | 1.13 ± 0.18 | 0.11 |
| Dox + Neq04401 | 0.21 ± 0.02 | 0.57 ± 0.11 | 0.37 |
1 The combination therapy comprises a set of concentrations of doxorubicin (Dox) + 1.0 µM Neq0440. SE: standard error; selectivity index (SI) = IC50 PNT-2/IC50 PC-3; SI > 1: selective toward the cancer cell; SI ≈ 1: no selectivity; SI < 1: selective toward the nontumoral cell.
Table 2.
Mitochondrial potential quantification with Red/Green MitoPotential reagent against nontumoral (PNT-2) and prostate cancer cells (PC-3) after 72 h of incubation.
Table 2.
Mitochondrial potential quantification with Red/Green MitoPotential reagent against nontumoral (PNT-2) and prostate cancer cells (PC-3) after 72 h of incubation.
| MitoPotential quantification | ||||||
| Samples | CTCF (PNT-2) | CTCF (PC-3) | ||||
| Polarized (red) |
Depolarized (green) |
Ratio (red/green) | Polarized (red) |
Depolarized (green) |
Ratio (red/green) | |
| Neg. Control | 154 298 | 78 007 | 1.97 | 108 307 | 68 115 | 1.59 |
| Neq0440 65.4 µM | 165 926 | 90 390 | 1.83 | 186 067 | 164 861 | 1.12 |
| Dox 1.0 µM1 | 190 854 | 139 255 | 1.37 | 156 648 | 177 272 | 0.88 |
| Dox 10 µM | - | - | - | 416 210 | 857 987 | 0.48 |
1 Dox: doxorubicin. CTCF: amount of fluorescence from the cells/total area of the cells in the field (N=2). A ratio (red/green) >1.0 corresponds to functional mitochondria. A ratio (red/green) < 1.0 indicates that depolarized mitochondria are associated with cell death.
Table 3.
Reactive oxygen species level spikes in PC-3 cancer cells after 48 h treatment with Neq0440.
Table 3.
Reactive oxygen species level spikes in PC-3 cancer cells after 48 h treatment with Neq0440.
| Relative ROS response to negative control (%) | ||||||||||
|---|---|---|---|---|---|---|---|---|---|---|
| Samples | 24 h | 48 h | 72 h | |||||||
| PC-3 | PNT-2 | Ratio1 | PC-3 | PNT-2 | Ratio1 | PC-3 | PNT-2 | Ratio1 | ||
| Neq0440 65.4 µM | 65.9 | 44.2 | 0.67 | 150 | 123 | 0.82 | 64.2 | 50.8 | 0.79 | |
| Dox 1.0 µM | 90.9 | 76.7 | 0.84 | 113 | 108 | 0.95 | 108 | 67.8 | 0.62 | |
| Dox 10 µM | 96.0 | 63.8 | 0.66 | 1523 | 77 | 0.50 | 99.4 | 52.7 | 0.53 | |
1 Ratio (PNT-2/PC-3) < 1: increased ROS formation in the prostate cancer cell line (PC-3); ratio > 1: increased ROS formation in the nontumoral cell line (PNT-2). N=2.
Table 4.
Quantification of the lysosome marker LysoTracker in tumoral (PC-3) and nontumoral (PNT-2) prostate cell lines after 72 h of incubation after Neq0440 treatment in PC-3 and PNT-2 cells.
Table 4.
Quantification of the lysosome marker LysoTracker in tumoral (PC-3) and nontumoral (PNT-2) prostate cell lines after 72 h of incubation after Neq0440 treatment in PC-3 and PNT-2 cells.
| LysoTracker quantification | |||||
|---|---|---|---|---|---|
| Samples | PNT-2 | PC-3 | CTCF ratio (PNT-2/PC-3) |
||
| CTCF | % lysosomes1 | CTCF | % lysosomes1 | ||
| Neg. Control | 83 992.13 | 100 | 117 724.38 | 100 | 0.71 |
| Neq0440 65.4 µM | 181 477.90 | 216 | 129 859.07 | 110 | 1.39 |
| Dox 1.0 µM | 135 939.77 | 61 | 465 620.60 | 395 | 0.29 |
1 % lysosomes: relative percentage of lysosomes inside the cells compared with the negative control (100%). Dox: doxorubicin. CTCF: amount of fluorescence from the cells/total area of the cells in the field (N=2). A ratio of CTCF (PNT-2/PC-3) < 1.0 indicates that the lysosomal population is high in cancer cells. A ratio of CTCF (PNT-2/PC-3) > 1.0 indicates a greater lysosomal population in PNT-2 cells.
Disclaimer/Publisher’s Note: The statements, opinions and data contained in all publications are solely those of the individual author(s) and contributor(s) and not of MDPI and/or the editor(s). MDPI and/or the editor(s) disclaim responsibility for any injury to people or property resulting from any ideas, methods, instructions or products referred to in the content. |
© 2026 by the authors. Licensee MDPI, Basel, Switzerland. This article is an open access article distributed under the terms and conditions of the Creative Commons Attribution (CC BY) license (http://creativecommons.org/licenses/by/4.0/).
Copyright: This open access article is published under a Creative Commons CC BY 4.0 license, which permit the free download, distribution, and reuse, provided that the author and preprint are cited in any reuse.


