
Submitted:
03 August 2025
Posted:
05 August 2025
You are already at the latest version
Abstract
This exploratory eye-tracking study investigates how the emotional content of food bank advertisements influences food donor perception and visual attention addressing a gap in literature on eye-tracking applications in food donation contexts. Globally, food waste contributes significantly to hunger and malnourishment, straining social support systems like food banks. The economic consequences of food waste equate to futile and avoidable financial losses culminating in a reduction of the overall economic well-being. In our study, 98 participants were recruited from Poland, we utilized an eye-tracker to monitor visual attention to four distinct food bank posters (negative, dissonance, neutral, positive tone). Key eye-tracking metrics including Fixation Count (FC), Time to First Fixation (TFF) and Average Fixation Duration (ADF) were analysed using repeated-measures ANOVAs across defined Areas of Interest (AOIs): logo, picture, and sponsor. Results indicate that participants were most quickly attracted to negative imagery (lowest TFF) supporting the negativity bias. Conversely, dissonance-toned posters elicited the highest FC and ADF on their pictures, suggesting deeper cognitive processing effort. Positive posters also showed high ADF for pictures, indicating strong emotional appeal. Overall, visual attention was primarily drawn to pictures over text or logos particularly in positive and dissonance stimuli. The findings underscore that emotional content significantly impacts visual behaviour towards food bank advertisements. While negative imagery captures initial attention rapidly, positive and dissonance-inducing visuals engage donors for longer durations and require more processing. This study highlights the critical role of visual design in motivating food bank donations, emphasizing the importance of adequate messaging and imagery. Limitations include a non-versatile sample size and a non-experimental design, which restrict causal inferences but establish valuable exploratory insights for future research.
Keywords:
eye-tracking
; food bank advertisements
; emotional content
; visual attention
; food donation
; food security
; fixation count (FC)
; time to first fixation (TFF)
; average fixation duration (ADF)
; areas of interest (AOIs)
; negativity bias
; cognitive processin
1. Introduction
All over the world 783 million people go hungry annually out of which 150 million are children under the age of five who are worst affected by this evitable malaise through its irreversible effects such as the stunting of physical and mental growth. This hunger assumes multifarious forms such as availability of food yet one that is devoid of essential nutrients [1]. The causes of the aforementioned problems can be attributable at various levels to global food waste, ranking food waste amongst the most significant economic, social and environmental issue faced by a number of countries worldwide.
The economic consequences of food waste equate to futile and avoidable financial losses brought upon by inefficient investments across the board culminating in a reduction of the overall economic well-being of all subjects spread across the chain of food value. Food waste widen the gaps between abundant resource and scarce resource people [2]. The social issue is about the wasted nutrients that could have been used to alleviate poverty in many countries regrades their level of development. The waste of resources is detrimental not only to human but also animals and other actors of ecosystem [3]. The environmental damage caused by food waste has been an issue causing much global distress. Studies by environmentalists indicate that greenhouse gas emitted by food waste worldwide result in more damage than coal power plants in some cases [4].
To mitigate the depletion of natural resources and build a socially and economically resilient food system, reducing food waste seems to be essential [5]. Consequently, there is an increasing need to support civic initiatives aimed at preventing food waste, such as food banks. Food banks are the centres for food donations where food is collected, stored and distributed to the targeted beneficiaries which are usually the most vulnerable population of the society [6]. Currently in Poland there are 31 food banks actively working, cooperating with 3200 other charity organisation (https://bankizywnosci.pl). However, one of the key challenges they continue to face is the lack of public awareness and basic consumer understanding—not only regarding their mission and operations, but also the broader social, economic, and environmental impacts of food waste. Thus, an open question remains: how can food banks design their advertisements in order to effectively engage potential donors and raise social awareness?
The objective of this research is to investigate how emotional content of existing food bank advertisement in Poland is associated with the way potential food donors perceive food bank posters on a cognitive and behavioural level. The idea is to provide recommendations for food banks to help them promote their operations among potential donors and strengthen the support they receive.
We used eye-tracking techniques to examine the eye movements and visual attention of 98 potential food bank donors in response to four distinct food bank posters, each conveying a different tone: negative, dissonant, neutral, and positive. We hypothesised that individuals were more likely to exhibit increased visual attention toward negative stimuli compared to neutral or positive stimuli, demonstrating a negativity bias. This bias is expected to be positively correlated with specific eye-tracking measures, including a higher fixation count, longer average fixation duration, and shorter time to first fixation on negative stimuli. In other words, participants will fixate more frequently and for longer periods on negative content, and they will also direct their initial gaze to such stimuli more quickly than to neutral or positive stimuli. We also hypothesised that individuals would exhibit increased visual attention toward dissonance-like content compared to neutral or positive content. This heightened attention was expected to be positively correlated with eye-tracking metrics, such as higher fixation count, longer total fixation duration, and shorter time to first fixation. It is anticipated that dissonance-like content, due to its conflicting or incongruent nature, will elicit cognitive processing patterns similar to those observed in negativity bias.
The outline of the paper is as follows. First, we present a brief review of the literature on the food waste problem, as well as short explanation of as eye-tracking techniques. Second, we describe the study method. Third, we use eye-tracking study results to judge how emotional content of real food bank advertisement impacts the way food donors perceive food bank posters. Finally, we present conclusion and provide recommendations.
2. Literature Review
Approximately, one third of all food produced for human consumption is lost or wasted before reaching its consumers. The annual financial impact of food waste is equivalent to more than USD 1 trillion. Its annual environmental impact on the other hand is an estimated 8-10 per cent of global greenhouse gas emissions. The food so wasted would have already utilised a quarter of all the water pumped into agriculture plus a significant size of arable land. This food waste also carries a significant environmental impact of an estimated 8 percent of global greenhouse gas emissions [1]. Sustainable Development Goal 12, target 12.3 (SDG 12.3) aims to measure the total tonnage of food waste. It comprises of two sections viz. 12.3.1 (a) that is food loss and 12.3.3 (b) that is food waste. SDG 12.3 aims to reduce and halve global food waste at the retail and consumer level by 2030 and reduce food losses in supply chains [1]. SDG 12.3 has a key role to play in the delivery of other Sustainable Development Goals, including those around Zero Hunger (SDG 2), Sustainable Cities (SDG 11) and Climate Action (SDG 13). The connection between food waste and biodiversity loss, moreover, is now recognized in the Kunming-Montreal Global Biodiversity Framework, which specifically calls out halving global food waste by 2030 in target 16 [1].
According to the Food Waste Report 2024 [7], in 2022 there was 1.05 billion tonnes of food waste spread across three sectors viz household, food service and retail. In the European Union, over 59 million tonnes of food waste (132 kg/inhabitant) is generated annually [8] with an associated market value estimated at 132 billion euros (SWD (2023) 421). In Poland, 4.8 million tons of food is wasted annually, and consumers are responsible for 60% of the total discarded food at the household level. However, the frequency of food waste has increased in the recent years. Compared to previous research there has been a significant increase in the percentage of people who discard food once a month (23%) or less often (25%). At the same time, fewer people declare wasting food a few times a week (6%) or a few times a month (24%). As many as 76% admitted to reducing food waste due to rising living costs [9].
In households alone, each person on an average wastes food significantly more than the average mass of an adult human per year with food waste from retail, food service and households weighing more than twice the average human.
Food waste is an urban issue. With more than half of the global population now living in urban areas, the role of local governments in tackling food waste is expected to only increase in the coming years. Food waste calculated at the household level according to Food Waste Index 2024 is 81 kilogram per capita per year in high income countries followed by 88 kilogram per capita per year in upper-middle income countries and 86 kilograms per capita per year in lower middle income countries. Also study by Hermanussen and Loy [10] shows that a higher Gross Domestic Product (GDP) goes along with higher levels of food waste.
Food wastage at household level is increasing due to a change in fundamental change in food consumption habit, food as a result of perennially flush supply chain that serve to invoke an otherwise latent feelings of hoarding that lie deep inside the consumer psyche. Amongst other factors, there are socio-demographic changes, an increase in the frequency and availability of convenience food and a culture of consumerism [11]. Addressing food waste problem is central to create a sustainable food system and vice versa. Creating a sustainable food production practices and systems help reduce food wastage across supply chains. While practices such as precision agriculture, efficient harvesting, crop diversification and integrated pest management can help minimize food waste at the farm level. Cultivation of shorter chain can lead to sustainable supply chain management of food [12]. In a study "Food Waste and Food Prosumption - A Case Study for Sustainable Households in Poland" it was observed that 69% of respondents identified as food prosumers, and 77% of respondents admitted that food waste was an important topic [13].
Food waste policy is focused on reducing perfectly edible food that is discarded at various stages of the food supply chain from the production stages to the consumption stage. The current global food waste policies for strategic decision making are concentrated at the national level via. approaches viz. awareness programes, food donation, recycling of waste and legislation. Gathering of food waste data is also an important factor that would help in the policies of waste reduction. Simultaneously, Shen et al. [14] summed up in their findings that the prevalent experience of developed countries in policy formulation and implementation can be used to guide developing countries in their own policy making and implementation. Effective policies aim for early stage waste prevention via ensuring data-driven decision-making and developing systems to quantify food waste facilitating redistribution by supporting the development of such logistics systems that transport the surplus edible food. The awareness of food label before buying can also help food wastage.
To effectively reduce food waste, a combination of individual, corporate, and government efforts is essential. Governments should introduce various regulatory measures such as tax incentives to those businesses and households which promote food waste reduction measures. Food bank protection laws such as reducing the liability to safeguard those who donate to food banks should be encouraged. These measures should align with global sustainability goals such as the United Nations' Sustainable Development Goals 12.3 which aims to halve food waste per capita by 2030. Food donation is an important strategy for food waste reduction in the case of Uruguayan stakeholders because it was perceived as an efficient strategy to reduce food insecurity [15]. There should be a field waste reduction strategy where farmers are encouraged to sell such produce that do not meet the standard quality requirements. The markets must be encouraged to sell such products at discounted prices which fail to match certain minimum quality standards. There should be supply chain level coordination amongst producers, sellers and consumers so as to balance supply and demand. Businesses should be mandated to disclose their annual waste data. International collaboration between governments by for the purpose of sharing best practices, technology and innovation must be fostered.
Waste reduction not only prevents an aggressive exploitation of natural resources thus conserving them for posterity but also contributes to an environmentally friendly and sustainable food ecosystem. Therefore, an efficient food waste reduction policy is need of the hour whereby food donation has emerged as a central strategy to combat the problem. Food donation is an older concept but in modern times, first food banks and food rescue programmes were established in USA in late 1960s [16]. Food banks are the first line of response to alleviate food hunger and problems of food insecurity [17] providing essential nutrients to needy individuals and families. Food banks help ease the pressure on low income households that can divert those resources which they would otherwise have spent on food, towards other necessities such as education and housing. Food banks are also central hubs where food is received, sorted, stored and further distributed. These banks not only provide food for the needy but also utilise discarded food generated by hospitality businesses. They often rely on voluntary contribution from good Samaritans. Few papers also talk about the shame associated with food bank receivers. Horst et. al. [18] in their study themed ‘The dark side of food banks’ stated that a quantitative study of a food bank in the Netherlands revealed that shame emerged in relation to the basic three reasons: the contents of the crate, the interaction with volunteers and the understanding of one's positioning in the social hierarchy.
Eye tracking has been used for assessing consumer behaviour since long. It has been a time tested concept tracing its beginnings back to 1879 when the French ophthalmologist Louise Èmile Javal referred to saccades when describing rapid changes in accommodation during reading. To be more precise, the experiment was conducted by M. Lamare in Javal's laboratory, where he demonstrated that the horizontal movements of the eyes during reading are by no means continuous, but proceed by saccades [19]. In 1908, Edmund Huey [20] built the first eye tracker device designed to track eye movements during the reading process. As time progressed, eye tracker methodology and technology fundamentally transformed thus advancing various studies on eye trackers which are still in use across various sectors. There are several studies that have leveraged the power of eye trackers in carrying out near precise consumer studies. To cite a few noteworthy amongst those are titled "Are fish products healthy? Eye tracking as a new food technology tool for a better understanding of consumer perception" [21] and "Food Captures Attention, but Not the Eyes” [22]. The latter study tests how mindset and BMI (Body Mass Index) influences attentional bias (AB) and food intake in which the stationary eye tracker was used.
In recent times, eye tracker has been used to investigate sustainable products that contributes to sustainable development. Eye tracking is used to track eye movement and visual attention of consumers or end users as they look for food products and conclusions can be drawn about their sustainable consumption [23]. Each stakeholder active in this network can make their own small contribution in helping manage such as producers, policy makers, middlemen and consumers can help manage food waste and help building sustainable food systems with their integrated efforts.
There has been limited research where eye-tracking was applied directly in the food bank concept. Existing literature mainly focusses on eye-tracking and sustainable food consumption [23], capturing consumer’s attention, decision making and preferences for a particular food. These insights can be extended into food bank donation and impact of advertisements which also involves various value based decisions. In a conference paper titled “Development of Food Bank Data Visualizations Using Eye Tracking”, [24] demonstrated users' interaction with various food bank data visualization. The aim of this research was better design the visualization and findings were used to improve the effectiveness and efficiency of food bank operations. Similarly, [25] in their research studied that effective resource allocation in hunger-relief agencies relies on data-driven decision-making. This study was mostly focussed on improving data visualizations as a fundamental tool for presenting and comprehending analytics. While eye-tracking has gained traction in exploring various topics like sustainable food consumption behaviours [23] and food bank data visualization [24] its application to food bank donation while exploring various posters (via donor’s side) has largely remained unexplored.
3. Materials and Methods
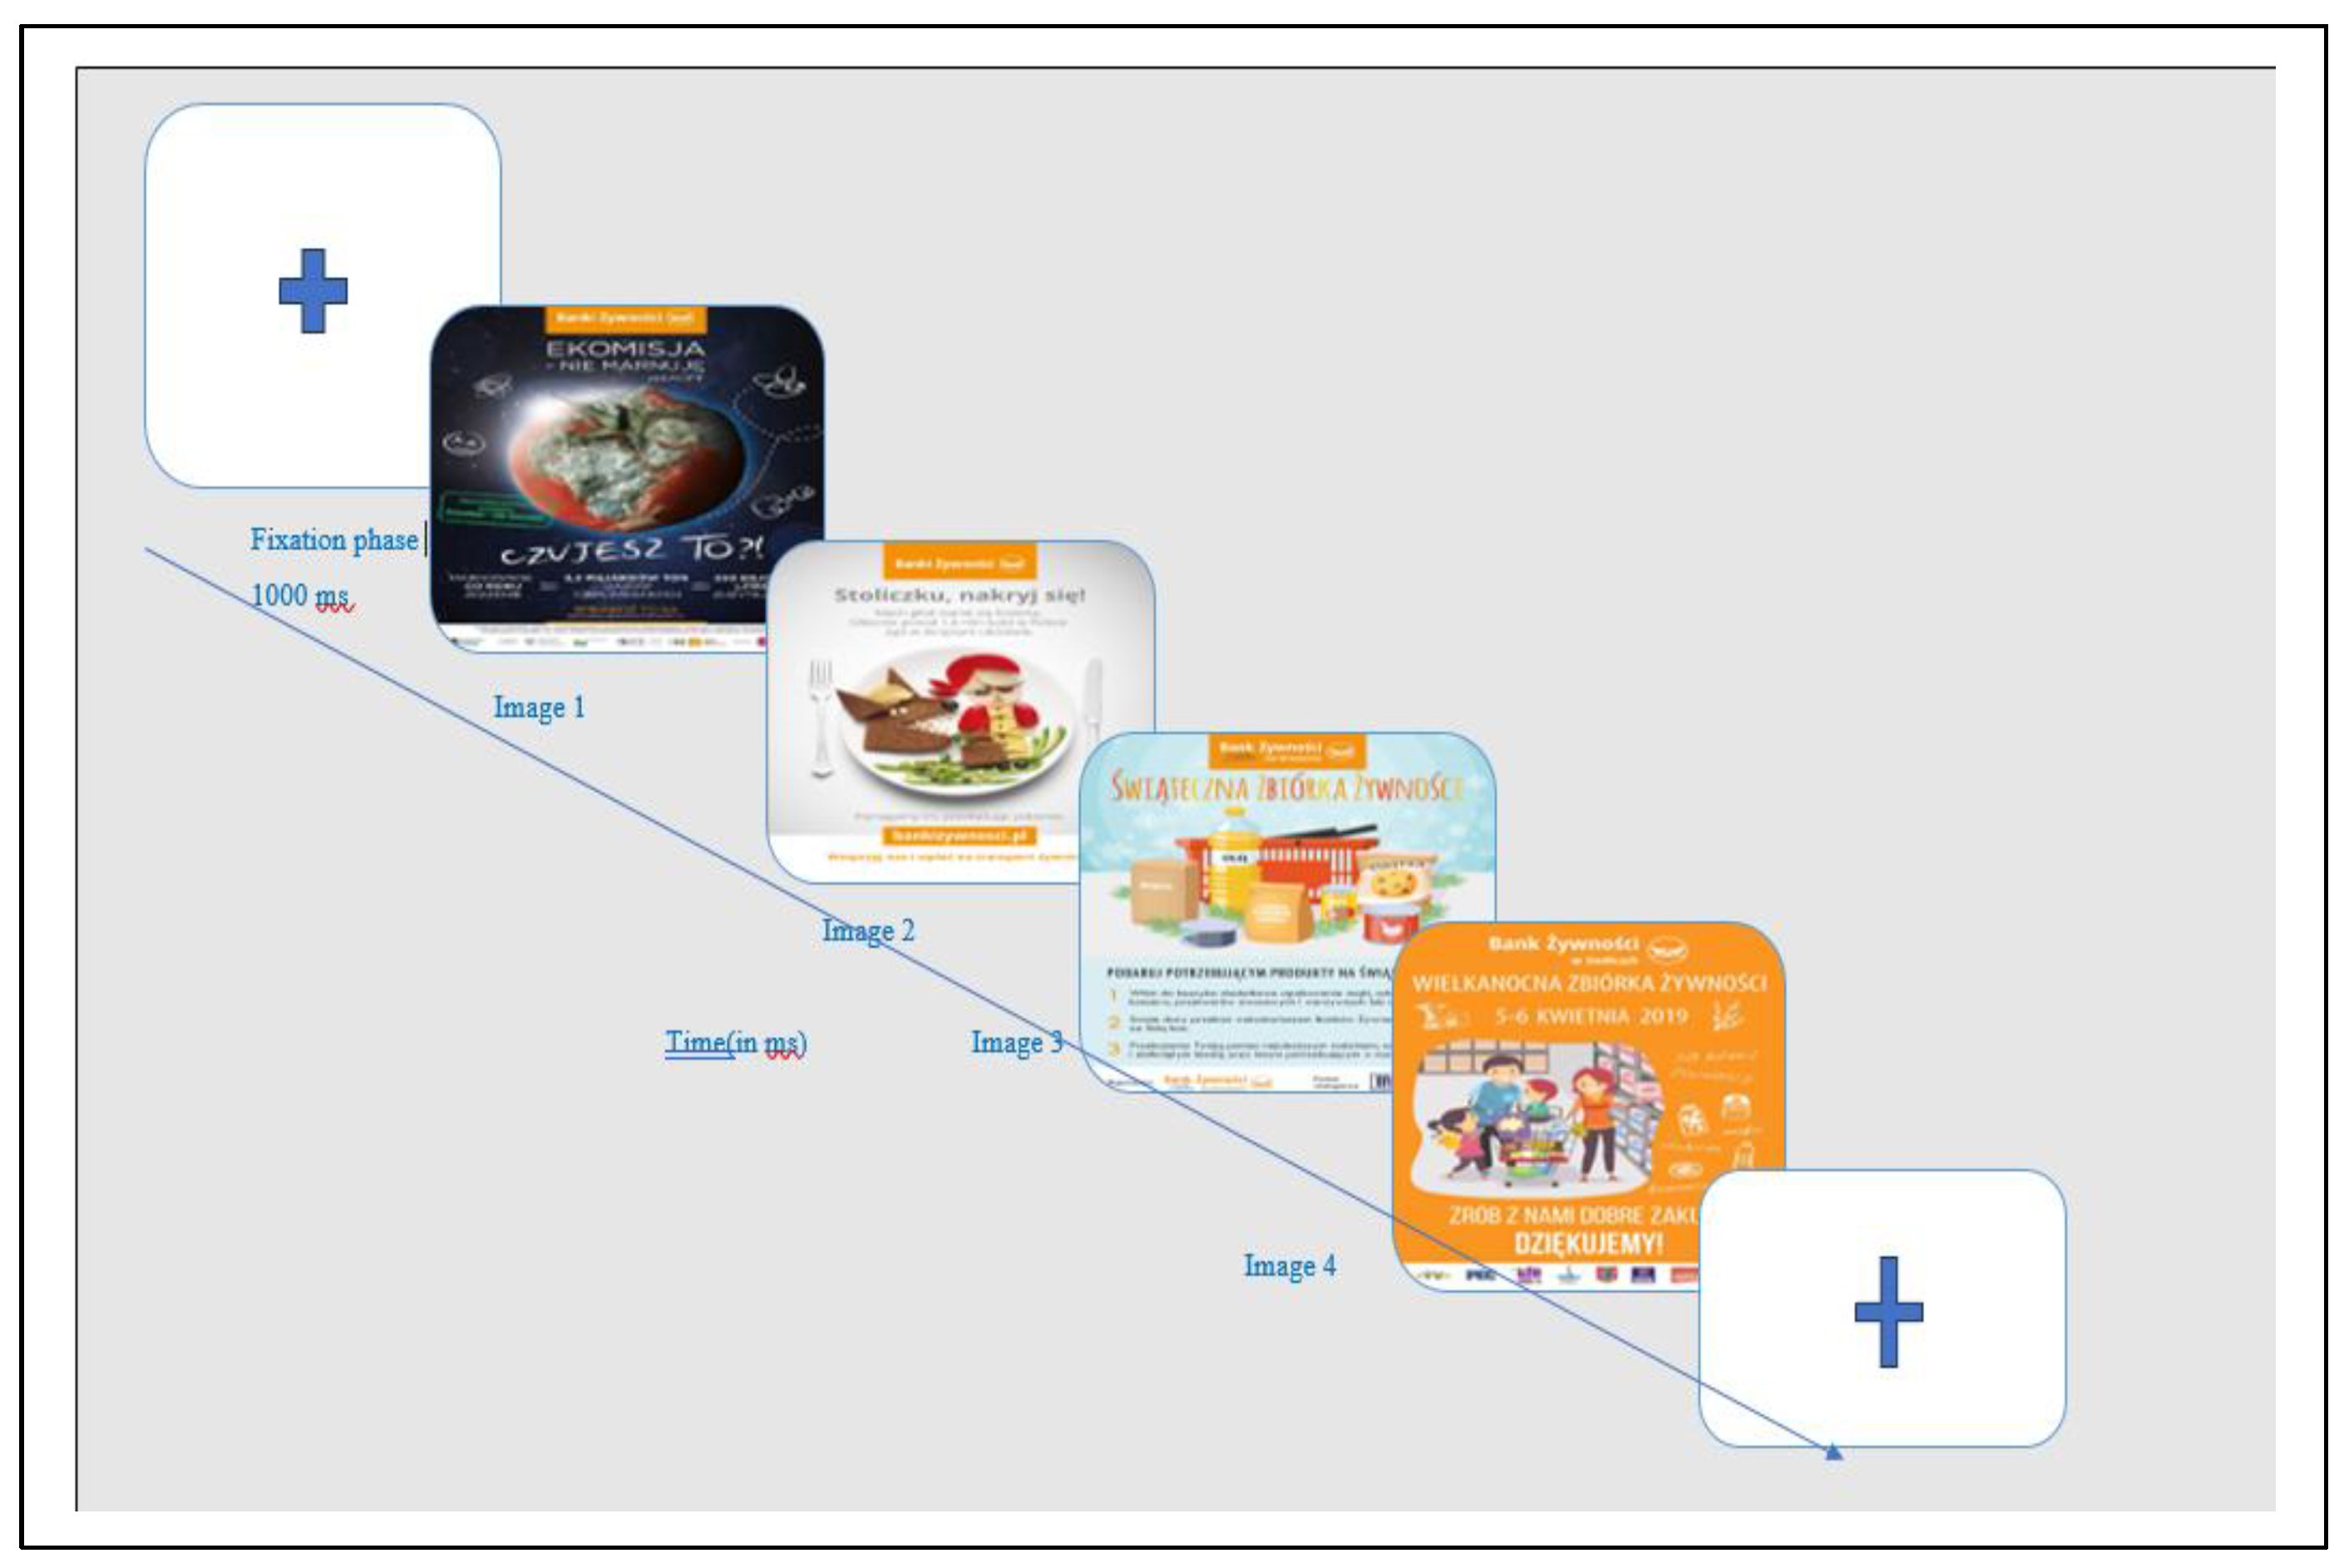
This study was conducted in Agri-Food Economics Experimental Laboratory (A-FEEL) at the Poznan University of Life Sciences, Poland in February to July 2023. Each participant was required to complete and sign an approved consent form to ensure the anonymity and privacy of the participant. Participants (N =109) were screened initially to exclude anyone under the age of 18 years old. Eleven participants were unable to finish the eye-tracking experiment because they had contact lenses, eye makeup, and hair blocking their eyes. Final sample size was 98 which underwent an eye tracking experiment. The study protocol was presented on the figure 1. We presented four posters advertising food banks that had been used in real-world social campaigns in Poland in the years preceding the study. A Tobii Pro series screen-based eye tracker was used where participants were seated approximately 60 cm from the screen. Two calibration procedure was done; the first was done to ensure accurate eye position and head alignment and the second one involved a standard 9-point calibration to map gaze coordinates. Tobii Pro Lab software was used to collect all the eye tracking data throughout the experiment. Then the data was exported in excel sheet for further statistical calculations.
We have attempted to provide an explanation on the association of emotional aspects of food bank advertisement/campaign with visual behaviour. We used four types of food bank advertisements:
(1) The poster titled “Bank Zywnosci Ekomisja” (ie. Image 1: Eco) had a negative orientation and was expected to evoke negative emotional responses.
(2) The poster titled “Bank Zywnosci Stoliczku” (ie. Image 2: Red Riding Hood) has a biased tone and presents dissonance-like information, aiming to evoke both emotionally positive and negative responses.
(3) The poster titled "Bank Zywnosci we Wroclawiu" (ie. Image 3: Products) represents a neutral tone and is not expected to evoke strong emotional responses.
(4) The poster titled "Bank Zywnosci w Siedlcach” (ie. Image 4: Family) represents an emotionally positive tone.
Following eye-tracking metrices have been explained in this research:
- Fixation Count (FC): Total number of fixations counted in an Area of Interest (AOI) or in a task [26].
- Fixation Count Percentage (FC%): The percentage of counts that were observed inside the given Area of Interest (AOI) [27].
- Time to First Fixation (TFF): The measure of how many milliseconds it takes to first view a given AOI from the onset of stimulus which appears on the computer screen. Lower the TFF, more attention on a given AOI [28].
- Fixation Duration (FD): Duration of fixation inside a given AOI or the time during which an eye rests on a given AOI. It is defined as the time between the end of a saccade and start of next saccade [29]. Total Fixation Duration (TFD) refers to the cumulative time (usually measured in milliseconds) that a participant's gaze remains fixated on a specific Area of Interest (AOI) during a task. Average Fixation Duration (AFD) is the mean length of time, typically in milliseconds, that each individual fixation lasts within a defined period or Area of Interest (AOI) [30].
Figure 1.
Experimental protocol of Eye Tracking experiment. It starts with a Fixation cross which is shown for 1000 ms and then proceeds to show four different food bank posters for 30 seconds each and it ends with a fixation cross.
Figure 1.
Experimental protocol of Eye Tracking experiment. It starts with a Fixation cross which is shown for 1000 ms and then proceeds to show four different food bank posters for 30 seconds each and it ends with a fixation cross.
4. Results
4.1. Descriptive Statistics of Participants
Table 1 provides a detailed overview of the socio-economic characteristics of the study participants. The sample had more female participants with the age group 19-20 years old, majority of the participants had 1-4 household members, predominantly located in the villages or large cities, main source of household income was through employment based on the contract, financial situation was assessed as bad by majority of them subjectively but they managed it well, in contrast their household income rate was 5000 PLN or above.
Figures 2b and 2d provide the Areas of Interest (AOIs) that were defined. There are three AOIs namely logo, picture and sponsors. These posters are taken in their original form to create a real life expe-rience in a laboratory situation. There are studies that have used real life products and their packaging. While working on buying decision making process with a focus on sustainable consumption [31] used products with highest sustainability labels in a supermarket. The study also attempts to elicit diverse emotional responses from four posters. In order to explain the above mentioned statement, the poster with rotten tomatoes evoke negative emotions and an intense heat map is seen on it (Figure 2c). The heat map for the dissonance-like poster (Image 2) is presented on Figure 2a. Out of all the visual atten-tion the most intense responses are highlighted in darker heat maps on the given Area of Interest (AOI).
In eye tracking researches, fixation durations can be the most frequent measures reported with other measures such as fixation count (FC), total duration of whole fixation (TDF), average whole fixation pupil diameter (AFPD) and average duration of visit (ADV) [30]. FC (Fixation Count) is the number of fixations in a particular AOI. It is measured in units in absolute amount. Fixations can be counted either over the entire stimuli or within a single AOI [30]. In a study by Recarte et. al. [32] they observed that distracted drivers had lower fixation counts in the mirror/speedometer AOI than the control subjects. A higher fixation count is often associated with greater levels of participants’ attentional concentration. Fixation durations (FD) are elapsed time between the first gaze point and the last gaze point in the sequence of gaze points that makes up the fixation. Regarding total/average duration of whole fixation (TDF/ADF it is the total/average amount of time, a participant spends inside a given AOI. FD is measured in milliseconds and typically ranges from 150 to 300 ms [33]. The more is the average or total fixation duration, more likely it is going to translate into a decision goal and is also influenced by preference formation [34]. Time to First Fixation (TFF) marks the onset of the first fixation following an initial saccade. It measures how quickly a participant’s attention is drawn to a specific object. A lower TFF indicates faster and earlier attention toward that object. Each poster was presented for 30 seconds, and we analyzed each poster separately before comparing the eye-tracking metrics for the AOIs related to pictures.
4.2. Eye Tracking Metrices for Images

Table 1.
1: Eye tracking metrices for Image 1 (average values).
| Image 1: Eco | ||||
| AOIs | Fixation Count, FC | FC % | Time to First Fixation, TFF (ms) | Average Duration of Fixation, ADF (ms) |
| Logo | 3.82 | 11.55% | 6580.96 | 295.14 |
| Picture | 24.26 | 73.34% | 702 | 366.23 |
| Sponsor | 5 | 15.11% | 10928.55 | 243.94 |
The analysis of the poster titled “Bank Żywności Ekomisja” (Image 1: Eco) indicates that participants’ visual attention was primarily drawn to the picture, which carried a negative connotation. This is evidenced by the highest Average Duration of Fixation (ADF) on the picture (366.23 ms), the shortest Time to First Fixation (TFF) (702 ms), and the highest Fixation Count (FC) (24.26) among the three areas of interest (Table 1.1). These results suggest that participants not only noticed the picture first but also spent more time and fixated more frequently on it compared to the logo and sponsor. In contrast, the sponsor area received the least attention, as shown by the highest TFF and the lowest fixation metrics, indicating minimal participant interest and less intensive cognitive processing. Overall, the findings demonstrate that negatively framed visual elements effectively captured and held participants’ attention.
Table 1.
2: Eye tracking metrices for Image 2 (average values).
| Image 2: Red Riding Hood | ||||
| AOIs | Fixation Count, FC | FC % | Time to First Fixation, TFF (ms) | Average Duration of Fixation, ADF (ms) |
| Logo | 3.67 | 12.31% | 4876.00 | 274.52 |
| Picture | 26.15 | 87.7% | 2390.26 | 387.71 |
| Sponsor | n/a (no data) | n/a (no data) | n/a (no data) | n/a (no data) |
The findings from the poster “Bank Żywności Stoliczku” (Image 2: Red Riding Hood) suggest that the dissonance-like image elicited heightened visual attention from participants. The image, while depicting appealing food, carries a cultural association with the Red Riding Hood story, which may introduce cognitive dissonance through underlying themes of danger and deception. This is supported by the higher Average Duration of Fixation (ADF) on the picture (387.71 ms) compared to the logo (274.52 ms), as well as the highest Fixation Count (FC) and a shorter Time to First Fixation (TFF) for the picture (Table 1.2). These results indicate that participants' attention was more strongly and quickly directed toward the picture that evoked dissonance-like processing. Interestingly, this attentional pattern aligns with previous research [35] which found that total fixation duration is positively correlated with liking. In the present study, however, increased attention appears to reflect the complex interplay between attraction and cognitive conflict, rather than simple positive evaluation. This suggests that dissonance-like stimuli can effectively capture and sustain attention, potentially overriding neutral branding elements such as logos.
Table 1.
3: Eye tracking metrices for Image 3 (average values).
| Image 3: Products | ||||
| AOIs | Fixation Count, FC | FC % | Time to First Fixation, TFF (ms) | Average Duration of Fixation, ADF (ms) |
| Logo | 4.14 | 15.52% | 4751.82 | 341.9 |
| Picture | 18.04 | 67.62% | 1859.46 | 315.85 |
| Sponsor | 4.5 | 16.87% | 12808.76 | 219.63 |
The analysis of the neutral poster titled “Bank Żywności we Wrocławiu” (Image 3: Products) indicates that, despite its neutral tone, the picture consistently attracted the most visual attention from participants. This is evidenced by the higher Average Duration of Fixation (ADF) on the picture (315.85 ms) compared to the logo and sponsor, as well as the shortest Time to First Fixation (TFF) (1859.46 ms), suggesting that participants were drawn to the picture first. Additionally, the picture exhibited the highest Fixation Count (FC) (18.04), indicating sustained visual engagement (Table 1.3). These findings emphasize the dominant role of visual elements, even in neutral stimuli, in guiding attention. Interestingly, participants showed less interest in the informational components such as the logo and sponsor, which is consistent with the common assumption that participants would prioritize meaningful graphics areas. This suggests that even in neutral contexts, visual appeal can overshadow textual or brand-related elements, underscoring the importance of graphics selection in the design of educational or promotional materials.
Table 1.
4: Eye tracking metrices for Image 4 (average values).
| Image 4: Family | ||||
| AOIs | Fixation Count, FC | FC % | Time to First Fixation, TFF (ms) | Average Duration of Fixation, ADF (ms) |
| Logo | 7.16 | 25.45% | 1487.54 | 313.39 |
| Picture | 16.66 | 59.22% | 3890.47 | 350.64 |
| Sponsor | 4.31 | 15.32% | 9260.43 | 271.47 |
The analysis of food bank posters with a positive tone, particularly “Bank Żywności w Siedlcach” (Image 4: Family), highlights the significant role of emotionally positive appealing imagery in capturing participants’ visual attention. The highest Average Duration of Fixation (ADF) was recorded on the picture (350.64 ms), suggesting that images depicting familial bonds effectively engage viewers (Table 1.4). This finding supports the importance of incorporating positive, emotionally resonant visuals in promotional materials to encourage pro-social behaviours, such as food donations. Additionally, the Time to First Fixation (TFF) values indicate that in the case of this poster participants first directed their attention to the logo (1487.54 ms), which is often critical for effective information delivery, aligning with the intended communication goals of the poster. The longest TFF for the sponsor (9260.43 ms) suggests minimal initial interest in sponsorship information, which was expected. Furthermore, the Fixation Count (FC) distribution shows that participants allocated the majority of their visual attention to the picture (59.22%), with significantly less attention to the logo (7.16%) and the sponsor (4.31%) (Table 1.4). Overall, these results demonstrate that positive, relatable imagery may serve as a key driver of attention and emotional engagement in food bank communications, potentially enhancing the motivation to donate.
4.3. Eye-Tracking Results for Repeated-Measures ANOVAs
A series of repeated-measures ANOVAs were conducted to examine the effect of emotional content (negative, dissonance, neutral, and positive) on three eye-tracking metrics: Total Duration of Fixation (TDF), Time to First Fixation (TFF), and Fixation Count (FC) across four images (Image 1: Eko – Negative; Image 2: Red Riding Hood – Dissonance; Image 3: Products – Neutral; Image 4: Family – Positive).
For TDF, Mauchly’s test indicated that the assumption of sphericity was not violated, W = 0.906, χ²(5) = 9.43, p = .093. The ANOVA revealed a significant effect of emotional appeal on TDF, F(3, 291) = 45.28, p < .001 (Table 2.2). Pairwise comparisons (Bonferroni-adjusted) showed that the neutral (Image 3) and positive (Image 4) images resulted in significantly lower TDF values compared to both the negative (Image 1) and dissonance (Image 2) images (all p < .001). No significant difference was found between the negative and dissonance images, nor between the neutral and positive images (Table 2.3). Descriptive statistics for TDF are presented in Table 2.1.
Table 2.
1 Descriptive statistics for TDF.
| Type of image | Mean (ms) | Std. Deviation | N |
| Image 1: Eco – Negative | 8914.85 | 3649.432 | 98 |
| Image 2: Red Riding Hood – Dissonance | 10134.29 | 4145.151 | 98 |
| Image 3: Products – Neutral | 5707.11 | 3199.510 | 98 |
| Image 4: Family – Positive | 6150.14 | 4585.474 | 98 |
Table 2.
2 Tests of Within-Subjects Effects for TDF across the images.
| Source | Type III Sum of Squares | df | Mean Square | F | Sig. |
|
Emotional_appeal Sphericity Assumed |
1349698061.847 | 3 | 449899353.949 | 45.282 | .000 |
Table 2.
3 Results of Repeated-Measures ANOVA for TDF across various images.
| (I) emotional appeal | (J) emotional appeal | Mean Difference (I-J) | Std. Error | Sig.b | 95% Confidence Interval for Difference b | |
| Lower Bound | Upper Bound | |||||
| Image 1 | Image 2 | -1219.439* | 448.432 | .047 | -2427.263 | -11.614 |
| Image 3 | 3207.735* | 411.840 | .000 | 2098.468 | 4317.001 | |
| Image 4 | 2764.704* | 514.556 | .000 | 1378.777 | 4150.631 | |
| Image 2 | Image 1 | 1219.439* | 448.432 | .047 | 11.614 | 2427.263 |
| Image 3 | 4427.173* | 442.412 | .000 | 3235.563 | 5618.784 | |
| Image 4 | 3984.143* | 428.195 | .000 | 2830.824 | 5137.462 | |
| Image 3 | Image 1 | -3207.735* | 411.840 | .000 | -4317.001 | -2098.468 |
| Image 2 | -4427.173* | 442.412 | .000 | -5618.784 | -3235.563 | |
| Image 4 | -443.031 | 449.479 | 1.000 | -1653.676 | 767.614 | |
| Image 4 | Image 1 | -2764.704* | 514.556 | .000 | -4150.631 | -1378.777 |
| Image 2 | -3984.143* | 428.195 | .000 | -5137.462 | -2830.824 | |
| Image 3 | 443.031 | 449.479 | 1.000 | -767.614 | 1653.676 | |
Based on estimated marginal means; *. The mean difference is significant at the .05 level. b. Adjustment for multiple comparisons: Bonferroni.
For TFF, Mauchly’s test indicated a violation of sphericity, W = 0.632, χ²(5) = 43.42, p < .001. Therefore, degrees of freedom were corrected using the Greenhouse-Geisser estimate (ε = 0.805) (Table 3.2). The analysis showed a significant effect of emotion on TFF, F(2.414, 231.77) = 12.28, p < .001 (Table 3.3). Bonferroni-corrected comparisons indicated that the negative image (Eco) had a significantly shorter TFF than the dissonance (Red Riding Hood; p = .000) and positive (Family; p = .000) images. The positive image also showed a significantly longer TFF than the neutral image (Products; p = .004), while no significant difference was found between the negative and neutral images (p = .131), or between the dissonance and positive images (p = .090) (Table 3.4). Descriptive statistics for TFF are presented in Table 3.1.
Table 3.
1: Descriptive statistics for Time to First Fixation (TFF).
| Type of image | Mean (ms) | Std. Deviation | N |
| Image 1: Eco – Negative | 719.74 | 695.175 | 97 |
| Image 2: Red Riding Hood – Dissonance | 2179.97 | 3031.808 | 97 |
| Image 3: Products – Neutral | 1718.36 | 4183.862 | 97 |
| Image 4: Family – Positive | 3602.15 | 5165.247 | 97 |
Table 3.
2 Mauchly's Test of SphericityaMeasure: eye_TFF .
| Within Subjects Effect | Mauchly's W | Approx. Chi-Square | df | Sig. | Epsilonb | ||
| Greenhouse-Geisser | Huynh-Feldt | Lower-bound | |||||
| emot | .632 | 43.419 | 5 | .000 | .805 | .827 | .333 |
Table 3.
3 Tests of Within-Subjects Effects for Time to First Fixation (TFF).
| Source | Type III Sum of Squares | df | Mean Square | F | Sig. |
| emot Greenhouse-Geisser | 417637756.237 | 2.414 | 172984399.769 | 12.283 | .000 |
Table 3.
4 Results of Repeated-Measures ANOVA for TFF across various images.
| Pairwise Comparisons | ||||||
| Measure: eye_TFF | ||||||
| (I) emot | (J) emot | Mean Difference (I-J) | Std. Error | Sig.b | 95% Confidence Interval for Differenceb | |
| Lower Bound | Upper Bound | |||||
| Image 1 | Image 2 | -1460.227* | 313.594 | .000 | -2305.059 | -615.394 |
| Image 3 | -998.619 | 428.339 | .131 | -2152.576 | 155.338 | |
| Image 4 | -2882.412* | 523.574 | .000 | -4292.934 | -1471.891 | |
| Image 2 | Image 1 | 1460.227* | 313.594 | .000 | 615.394 | 2305.059 |
| Image 3 | 461.608 | 485.818 | 1.000 | -847.199 | 1770.416 | |
| Image 4 | -1422.186 | 574.079 | .090 | -2968.772 | 124.400 | |
| Image 3 | Image 1 | 998.619 | 428.339 | .131 | -155.338 | 2152.576 |
| Image 2 | -461.608 | 485.818 | 1.000 | -1770.416 | 847.199 | |
| Image 4 | -1883.794* | 529.685 | .004 | -3310.780 | -456.807 | |
| Image 4 | Image 1 | 2882.412* | 523.574 | .000 | 1471.891 | 4292.934 |
| Image 2 | 1422.186 | 574.079 | .090 | -124.400 | 2968.772 | |
| Image 3 | 1883.794* | 529.685 | .004 | 456.807 | 3310.780 | |
| Based on estimated marginal means | ||||||
| *. The mean difference is significant at the .05 level. | ||||||
| b. Adjustment for multiple comparisons: Bonferroni. | ||||||
For FC, Mauchly’s test confirmed the assumption of sphericity was met, W = 0.893, χ²(5) = 10.78, p = .056, and uncorrected degrees of freedom were used (Table 4.2). The effect of emotional content on FC was significant, F(3, 291) = 34.24, p < .001 (Table 4.3). Bonferroni-corrected pairwise comparisons revealed that participants fixated significantly more on the neutral and positive images (Products, Family) than on the negative and dissonance images (Eco, Red Riding Hood; all p < .001). No significant differences were observed between the negative and dissonance images (p = .423) or between the neutral and positive images (p = 1.000) (Table 4.4). Descriptive statistics for FC are presented in Table 4.1.
Table 4.
1: Descriptive statistics: Fixation Count (FC).
| Mean | Std. Deviation | N | |
| Image 1: Eco – Negative | 24.42 | 9.203 | 98 |
| Image 2: Red Riding Hood – Dissonance | 26.35 | 9.775 | 98 |
| Image 3: Products – Neutral | 17.98 | 9.310 | 98 |
| Image 4: Family – Positive | 17.18 | 10.882 | 98 |
Table 4.
2 Mauchly's Test of SphericityaMeasure: eye_FC .
| Within Subjects Effect | Mauchly's W | Approx. Chi-Square | df | Sig. | Epsilonb | ||
| Greenhouse-Geisser | Huynh-Feldt | Lower-bound | |||||
| emot | .893 | 10.783 | 5 | .056 | .926 | .956 | .333 |
| Tests the null hypothesis that the error covariance matrix of the orthonormalized transformed dependent variables is proportional to an identity matrix. | |||||||
| a. Design: Intercept Within Subjects Design: emot | |||||||
| b. May be used to adjust the degrees of freedom for the averaged tests of significance. Corrected tests are displayed in the Tests of Within-Subjects Effects table. | |||||||
Table 4.
3 Tests of Within-Subjects Effects for Fixation Count (FC).
| Source | Type III Sum of Squares | df | Mean Square | F | Sig. |
| Emot Sphericity Assumed | 6177.171 | 3 | 2059.057 | 34.237 | .000 |
Table 4.
4 Results of Repeated-Measures ANOVA for FC across various images.
| Pairwise Comparisons | ||||||
| Measure: eye_FC | ||||||
| (I) emot | (J) emot | Mean Difference (I-J) | Std. Error | Sig.b | 95% Confidence Interval for Differenceb | |
| Lower Bound | Upper Bound | |||||
| Image 1 | Image 2 | -1.929 | 1.055 | .423 | -4.769 | .912 |
| Image 3 | 6.439* | 1.102 | .000 | 3.472 | 9.406 | |
| Image 4 | 7.235* | 1.305 | .000 | 3.719 | 10.750 | |
| Image 2 | Image 1 | 1.929 | 1.055 | .423 | -.912 | 4.769 |
| Image 3 | 8.367* | .959 | .000 | 5.783 | 10.952 | |
| Image 4 | 9.163* | 1.084 | .000 | 6.243 | 12.083 | |
| Image 3 | Image 1 | -6.439* | 1.102 | .000 | -9.406 | -3.472 |
| Image 2 | -8.367* | .959 | .000 | -10.952 | -5.783 | |
| Image 4 | .796 | 1.113 | 1.000 | -2.202 | 3.794 | |
| Image 4 | Image 1 | -7.235* | 1.305 | .000 | -10.750 | -3.719 |
| Image 2 | -9.163* | 1.084 | .000 | -12.083 | -6.243 | |
| Image 3 | -.796 | 1.113 | 1.000 | -3.794 | 2.202 | |
| Based on estimated marginal means | ||||||
| *. The mean difference is significant at the .05 level. | ||||||
b. Adjustment for multiple comparisons: Bonferroni.
5. Discussion and Conclusions
The effectiveness of food banks largely relies on the attitudes and engagement of both donors and food collectors. These attitudes can be shaped by food banks advertising. McNaughton et al. [36] concludes that food collectors go through embarrassment, humiliation, a sense of failure, stigma and shame specially when they collect food for the first time. Bennett et. al. [37] suggest that to address this issue, there is a need to create an image of beneficiaries as those who are deserving individuals who are morally worthy of assistance. At the same time food bank advertising posters need not only to catch the attention of potential donors but also impact the donation decision.
The objective of this research was to investigate how emotional content of food bank advertisement is associated with the way potential food donors perceive food bank posters on a cognitive and behavioural level. Using eye-tracking method we investigated how emotional properties of visual stimuli are linked to the attentional processes. Out of four different toned posters, participants were attracted towards the negative picture fastest. The mean of TFF was lowest in viewing negative poster which was characterised by a rotten tomato. This supports the negativity bias which states that humans are likely first to approach negative stimuli or aversive stimuli. In a study, titled “The Face in the Crowd Revisited: A Threat Advantage With Schematic Stimuli” Öhman et. al. [38] found out that a threatening target among neutral distractors was more quickly and accurately detected than a friendly target. Similarly, Calvo et. al. [39] in research investigated emotionality hypothesis and negativity hypothesis. In their findings, it was reported that both injury and threat pictures were equally likely to attract initial orienting of gaze. Additionally, the dissonance image evoked the highest FC on its picture and longer TDF which indicated that it took more mental effort to cognitively process the dissonance picture. The present study provides robust evidence that emotional content significantly modulates visual attention patterns. Specifically, negative and dissonance-like images elicited prolonged fixation durations, suggesting deeper visual engagement, whereas neutral and positive images were associated with shorter fixation times, indicating more efficient visual processing. The TFF analysis further revealed that negative stimuli captured attention more rapidly than dissonance and positive stimuli, highlighting a potential attentional bias toward negatively valenced content. Notably, participants fixated more frequently on neutral and positive images compared to negative and dissonance images, suggesting that although negative and dissonance stimuli quickly captured attention, they did not sustain it to the same extent as more positively framed content. These findings align with established theories of negativity bias and cognitive dissonance, illustrating how negative and conflicting stimuli rapidly attract initial attention, while positive and neutral stimuli may promote sustained viewing.
This nuanced interplay between emotional valence and attentional dynamics offers valuable insights for optimizing visual communication strategies, particularly in contexts such as social marketing and public awareness campaigns, where the balance between capturing attention and maintaining engagement is critical. Future experimental research on Food bank posters can reveal how visual attention is correlated to willingness to donate. Key limitation of the current experiment methodology was the deployment of a less versatile sample size which if repeated can restrict the extrapolation of the findings to a broader population. Also, the non-experimental design of the undertaken study hinders the ability to establish solid causal relationships between gaze pattern and psychological/behavioural outcomes.
However, owing to the lack of ample contemporary studies conducted on the establishment of the effectiveness of food banks via deployment of eye tracking methodologies as a means of measurement of willingness to donate to such banks, the current study offers the advantage of maintaining pure exploratory value and can pave the path for developing more targeted methodologies in future studies.
Author’s Contribution: O.G.C., E.K.D, and E.M.A. conceptualized and designed the study. O.G.C. developed the methodology, and performed the formal analysis. O.G.C. and A.R. was responsible for data collection, validation, and investigation. O.G.C. and A.R contributed to writing the original draft. E.K.D and O.G.C. collaboratively reviewed and edited the manuscript. All authors have read and approved the final version of the manuscript.
Funding
This research received no external funding.
Institutional Review Board Statement
Not applicable.
Informed Consent Statement
Written informed consent was obtained from all participants involved in the study.
Data Availability Statement
The data presented in this study are available on request from the corresponding author. The data are not publicly available due to privacy or ethical restrictions.
Acknowledgments
The authors would like to express their sincere gratitude to the members of Agri-Food Economics and Trade, Faculty of Economics, Poznan University of Life Sciences, Poznan, Poland for their invaluable support and contributions to this research. Their insights and assistance greatly enhanced the quality and depth of the study. We also thank all participants and collaborators who made this work possible.
Conflicts of Interest
The author declares no conflict of interest.
References
- United Nations Environment Programme (2024) Food Waste Index report 2024: Think Eat Save: Tracking progress to halve global food waste Nairobi:, U.N.E.P. Available online: https://www.unep.org/resources/publication/food-waste-index-report-2024 (accessed on 14 December 2024).
- Sarangi, P.K.; Pal, P.; Singh, A.K.; Sahoo, U.K.; Prus, P. Food waste to food security: Transition from bioresources to sustainability. Resources 2024, 13, 164. [Google Scholar] [CrossRef]
- Newsome, T.M.; Van Eeden, L.M. The effects of food waste on wildlife and humans. Sustainability 2017, 9, 1269. [Google Scholar] [CrossRef]
- Kohli, K.; Prajapati, R.; Shah, R.; Das, M.; Sharma, B. Food waste: Environmental impact and possible solutions. Sustainable Food Technology 2023, 2, 61–74. [Google Scholar] [CrossRef]
- Bajzelj, B.; Quested, T.; Röös, E.; Swannell, R. The role of reducing food waste for resilient food systems. Ecosystem Services 2020, 45, 101140. [Google Scholar] [CrossRef] [PubMed]
- Campbell, E.C.; Ross, M.; Webb, K.L. Improving the nutritional quality of emergency food: A study of food bank organizational culture, capacity, and practices. Journal of Hunger & Environmental Nutrition 2013, 8, 261–280. [Google Scholar] [CrossRef]
- Food Agriculture Organization of the United Nations The State of Food Security Nutrition in the World 2022: Repurposing food agricultural policies to make healthy diets more affordable, F.A.O. Available online: https://www.fao.org/publications/sofi/2022/en/ (accessed on 12 February 2025).
- Eurostat. Food waste: 132 kg per inhabitant in the EU in 2022. European Commission. Available online: https://ec.europa.eu/eurostat/web/products-eurostat-news/w/ddn-20240927-2 (accessed on 27 September 2024).
- Federation of Polish Food Banks. More than half of Poles waste food in their homes – Food Banks publish latest research. Available online: https://bankizywnosci.pl/en/more-than-half-of-poles-waste-food-in-their-homes-food-banks-publish-latest-research/ (accessed on 17 October 2022).
- Hermanussen, H.; Loy, J.-P. Determinants of food waste from household food consumption: A case study from field survey in Germany. International Journal of Environmental Research and Public Health 2022, 19, 14253. [Google Scholar] [CrossRef] [PubMed]
- Nunkoo, R.; Bhadain, M.; Baboo, S. Household food waste: Attitudes, barriers and motivations. British Food Journal 2021, 123, 2016–2035. [Google Scholar] [CrossRef]
- Swetha, S.; Prabhakar, I.; Pujar, V.; Ainapur, S. Food waste reduction and sustainable food systems: Strategies, challenges, and future directions. Journal of Scientific Research and Reports 2024, 30, 328–336. [Google Scholar] [CrossRef]
- Trębska, P.; Biernat-Jarka, A. Food waste and food prosumption—A case study for sustainable households in Poland. Sustainability 2025, 17, 3616. [Google Scholar] [CrossRef]
- Shen, G.; Li, Z.; Hong, T.; Zhang, Z.; Wang, Y. The status of the global food waste mitigation policies: Experience and inspiration for China. Environment, Development and Sustainability 2024, 26, 8329–8357. [Google Scholar] [CrossRef]
- Montoli, P.; Ares, G.; Aschemann-Witzel, J.; Varela, P. Food donation as a strategy to reduce food waste in an emerging Latin American country: A case study in Uruguay. Nutrire 2023, 48, 22. [Google Scholar] [CrossRef]
- Schneider, F. The evolution of food donation with respect to waste prevention. Waste Management 2013, 33, 755–763. [Google Scholar] [CrossRef]
- Tarasuk, V.; Fafard St-Germain, A.-A.; Loopstra, R. The relationship between food banks and food insecurity: Insights from Canada. VOLUNTAS: International Journal of Voluntary and Nonprofit Organizations 2019, 31, 841–853. [Google Scholar] [CrossRef]
- Horst, H.; Pascucci, S.; Bol, W. The "dark side" of food banks? Exploring emotional responses of food bank receivers in the Netherlands. British Food Journal 2014, 116, 1506–1520. [Google Scholar] [CrossRef]
- Wade, N.J.; Tatler, B.W. Did Javal measure eye movements during reading? Journal of Eye Movement Research 2009, 2, 1–7. [Google Scholar] [CrossRef]
- Huey, E.B. The psychology and pedagogy of reading. Macmillan, 1908.
- Mitterer-Daltoé, M.L.; Queiroz, M.I.; Fiszman, S.; Varela, P. Are fish products healthy? Eye tracking as a new food technology tool for a better understanding of consumer perception. LWT - Food Science and Technology 2014, 55, 459–465. [Google Scholar] [CrossRef]
- Pimpini, L.; Kochs, S.; van Zoest, W.; Jansen, A.; Roefs, A. Food captures attention, but not the eyes: An eye-tracking study on mindset and BMI's impact on attentional capture by high-caloric visual food stimuli. Journal of Cognition 2022, 5, 19. [Google Scholar] [CrossRef]
- Ruppenthal, T. Eye-tracking studies on sustainable food consumption: A systematic literature review. Sustainability 2023, 15, Article–16434. [Google Scholar] [CrossRef]
- Jiang, S.; Ivuawuogu, H.; Javadi, A.; Hamilton, M.; Davis, L. Development of food bank data visualizations using eye tracking. Proceedings of the 2024 AHFE International Conference on Human Factors and Ergonomics. 2024. [CrossRef]
- Hilliard, K.; Hamilton, M.; Jiang, S.; Davis, L. Usability evaluation of food bank data visualizations using eye-tracking technology. In T. Ahram & C. Falcão (Eds.), Human-centered design and user experience; (Vol. 114). AHFE Open Access, 2023.
- Lai, M.-L.; Tsai, M.-J.; Yang, F.-Y.; Hsu, C.-Y.; Liu, T.-C.; Lee, S.W.-Y.; Lee, M.-H.; Chiou, G.-L.; Liang, J.-C.; Tsai, C.-C. A review of using eye-tracking technology in exploring learning from 2000 to 2012. Educational Research Review 2013, 10, 90–115. [Google Scholar] [CrossRef]
- Balaskas, S.; Rigou, M. The effects of emotional appeals on visual behavior in the context of green advertisements: An exploratory eye-tracking study. Proceedings of the 2024 CHI Conference on Human Factors in Computing Systems 2024. [Google Scholar] [CrossRef]
- Behe, B.; Campbell, B.; Khachatryan, H.; Hall, C.; Dennis, J.; Huddleston, P.; Fernandez, R. Incorporating eye tracking technology and conjoint analysis to better understand the green industry consumer. HortScience 2014, 49, 1550–1557. [Google Scholar] [CrossRef]
- Galley, N.; Betz, D.; Biniossek, C. Fixation durations: Why are they so highly variable? Journal of Eye Movement Research 2015, 8, 1–25. [Google Scholar] [CrossRef]
- Holmqvist, K.; Nyström, M.; Andersson, R.; Dewhurst, R.; Jarodzka, H.; Van de Weijer, J. Eye tracking: A comprehensive guide to methods and measures, 2011, Oxford University Press.
- Eisinger Balassa, B.; Koteczki, R. Eye tracker experiment buying decision-making process with a focus on sustainable consumption: Case study. Chemical Engineering Transactions 2023, 107, 547–552. [Google Scholar] [CrossRef]
- Recarte, M.A.; Nunes, L.M. Effects of verbal and spatial-imagery tasks on eye fixations while driving. Journal of Experimental Psychology: Applied 200, 6, 31–43. [Google Scholar] [CrossRef]
- Tullis, T.; Albert, W. Behavioral and physiological metrics. In Measuring the user experience, 2013, (2nd ed., pp. 163–186). Morgan Kaufmann. [CrossRef]
- van der Laan, L.N.; Hooge, I.T.C.; De Ridder, D.T.D.; Viergever, M.A.; Smeets, P.A.M. Do you like what you see? The role of first fixation and total fixation duration in consumer choice. Food Quality and Preference 2015, 39, 46–55. [Google Scholar] [CrossRef]
- Skaramagkas, V.; Giannakakis, G.; Ktistakis, E.; Manousos, D.; Karatzanis, I.; Tachos, N.; Tripoliti, E.; Marias, K.; Fotiadis, D.; Tsiknakis, M. Review of eye tracking metrics involved in emotional and cognitive processes. IEEE Reviews in Biomedical Engineering 2021, 14, 340–351. [Google Scholar] [CrossRef]
- McNaughton, D.; Middleton, G.; Mehta, K.; Booth, S. Food charity, shame/ing and the enactment of worth. Medical Anthropology 2021, 40, 98–109. [Google Scholar] [CrossRef]
- Bennett, R.; Vijaygopal, R.; Kottasz, R. Who gives to food banks? A study of influences affecting donations to UK food banks by individuals. Journal of Nonprofit & Public Sector Marketing 2023, 35, 243–264. [Google Scholar] [CrossRef]
- Öhman, A.; Lundqvist, D.; Esteves, F. The face in the crowd revisited: A threat advantage with schematic stimuli. Journal of Personality and Social Psychology 2001, 80, 381–396. [Google Scholar] [CrossRef] [PubMed]
- Calvo, M.G.; Lang, P.J. Gaze patterns when looking at emotional pictures: Motivationally biased attention. Motivation and Emotion 2004, 28, 221–243. [Google Scholar] [CrossRef]
Figure 2.
a: Heat map Dissonance toned poster 2.b AOIs on Dissonance toned poster Fig 2c: Heat map negatively toned poster 2.d AOIs on negatively toned poster.
Figure 2.
a: Heat map Dissonance toned poster 2.b AOIs on Dissonance toned poster Fig 2c: Heat map negatively toned poster 2.d AOIs on negatively toned poster.
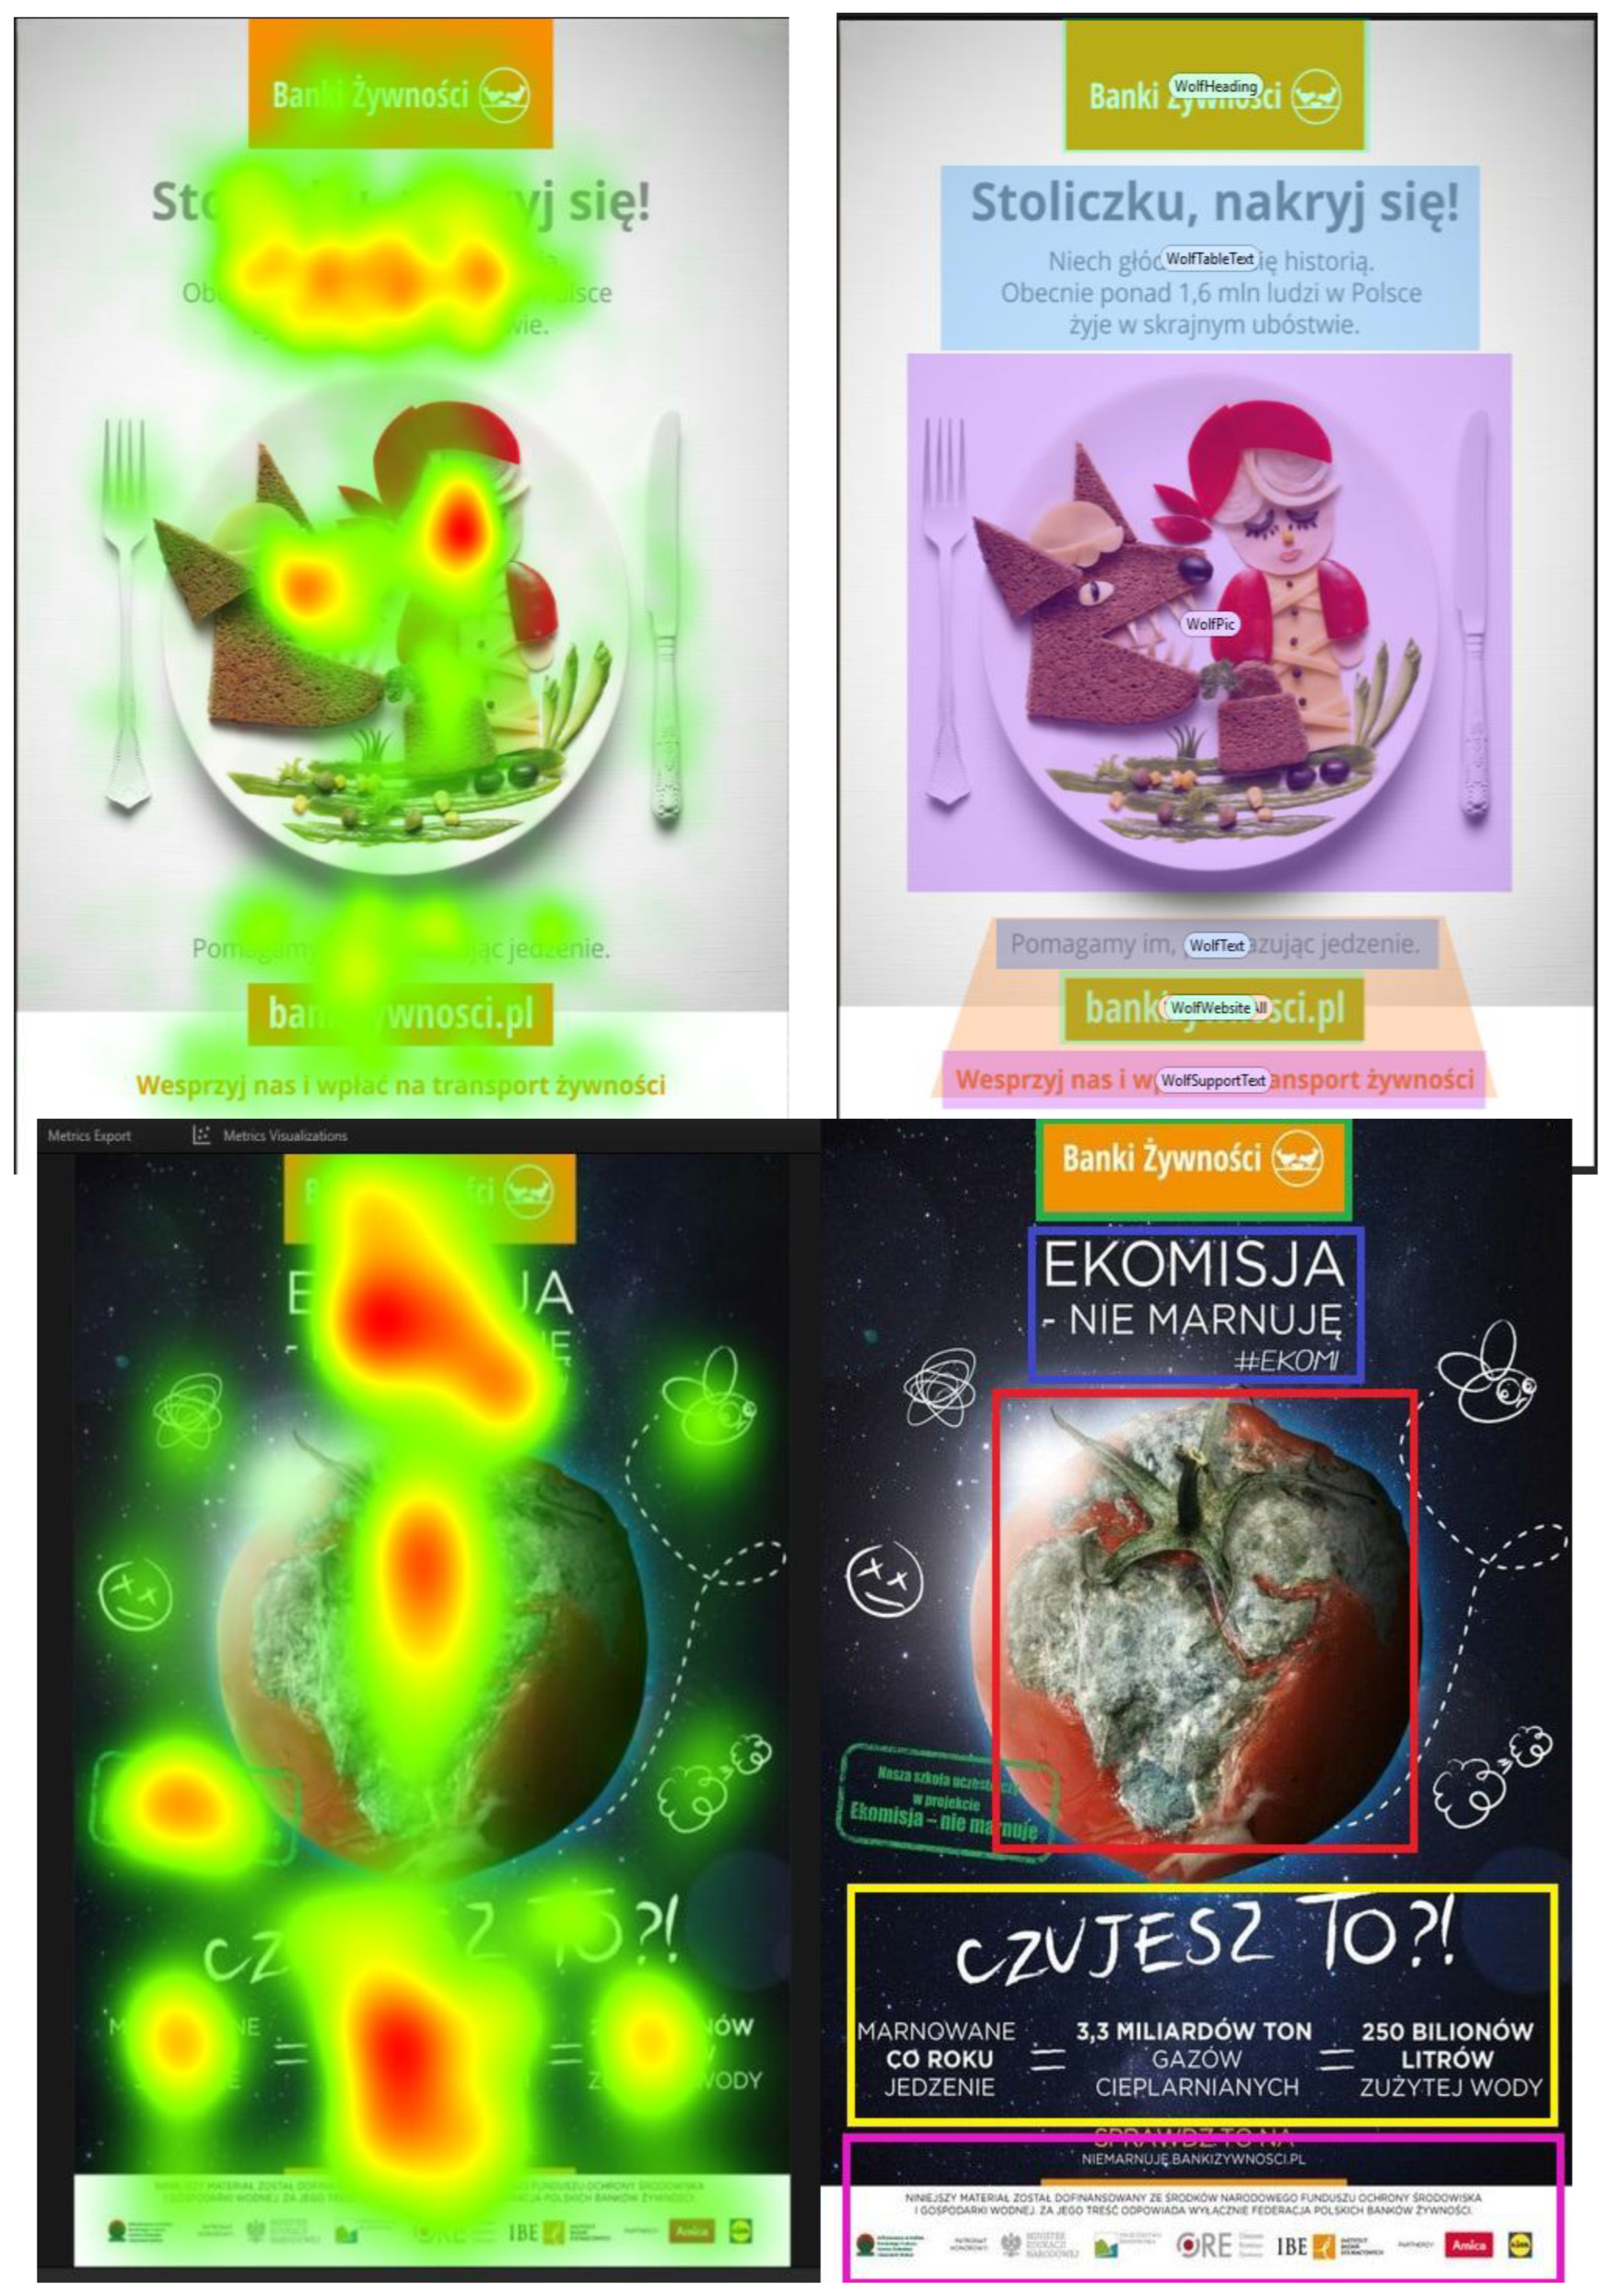
Table 1.
Socio-economic profile of the participants.
| Category | Subcategory | Frequency | Percentage |
| Gender | Female | 67 | 68.37 |
| Male | 31 | 31.63 | |
| Age | 19–20 | 62 | 63.27 |
| 21–22 | 9 | 9.18 | |
| 23–24 | 23 | 23.47 | |
| 25–26 | 4 | 4.08 | |
| Household Members | 1–4 | 76 | 77.55 |
| 5–8 | 22 | 22.44 | |
| Place of Residence | Village (without city rights) | 32 | 32.65 |
| Small town – less than 20,000 inhabitants | 16 | 16.33 | |
| Medium city – 20,000 to 100,000 inhabitants | 19 | 19.39 | |
| Large city – more than 100,000 inhabitants | 31 | 31.63 | |
| Main Source of Household Income | Hired work (employment based on a contract) | 56 | 57.14 |
| Self-employment in non-agricultural sectors | 13 | 13.27 | |
| Self-employment on an individual farm | 9 | 9.18 | |
| Pension, annuity | 2 | 2.04 | |
| Unearned sources of income | 18 | 18.37 | |
| Subjective Financial Situation | Very good | 1 | 1.02 |
| Good | 1 | 1.02 | |
| Neither good nor bad | 18 | 18.37 | |
| Bad | 55 | 56.12 | |
| Very bad | 23 | 23.47 | |
| Self-Description of Finance management | We live very poorly | 0 | 0.00 |
| We live modestly. I have to be very frugal in my daily life. | 7 | 7.14 | |
| We live an average life. | 25 | 25.51 | |
| We live well. | 53 | 54.08 | |
| We live very well. I can afford some luxury. | 13 | 13.27 | |
| Household_IncomeRate | Up to 2400 PLN | 28 | 28.57 |
| 2401 PLN- 5000 PLN | 32 | 32.65 | |
| 5001 PLN- Above | 38 | 38.78 |
Disclaimer/Publisher’s Note: The statements, opinions and data contained in all publications are solely those of the individual author(s) and contributor(s) and not of MDPI and/or the editor(s). MDPI and/or the editor(s) disclaim responsibility for any injury to people or property resulting from any ideas, methods, instructions or products referred to in the content. |
© 2025 by the authors. Licensee MDPI, Basel, Switzerland. This article is an open access article distributed under the terms and conditions of the Creative Commons Attribution (CC BY) license (http://creativecommons.org/licenses/by/4.0/).
Copyright: This open access article is published under a Creative Commons CC BY 4.0 license, which permit the free download, distribution, and reuse, provided that the author and preprint are cited in any reuse.


