Submitted:
31 July 2025
Posted:
05 August 2025
You are already at the latest version
Abstract
Background: Traumatic brain injury (TBI) is a major public health concern. Creatinine (Cr) has been well studied as a marker of renal function, specifically the development of acute kidney injury (AKI) in TBI patients. We aimed to evaluate the effect of Cr on various clinical outcomes in patients with severe TBI. Methods: We investigated the relationship between Cr levels at various time points and a range of clinical variables, using parametric (ANOVA, two-tailed t-test, and linear regression modeling) statistical testing. Results: 1,000 patients were included in our study. We found a significant association between sex and Cr level at intensive care unit (ICU) admission (p=0.001) and ICU discharge (p=0.005). Degree of creatinemia had a significant effect on both mean ISS (p=0.0003) and GCS (p=0.004) scores at ICU admission as well as ISS (p=0.017) and GCS (p=0.001) scores at patient death timepoints. Change in Cr from Hospital to ICU admission was significantly correlated with vent days (p=0.045). Change in Cr from ICU admission to ICU discharge was significantly correlated with hospital length of stay (LOS; p=0.001), ICU LOS (p=0.000), and vent days (p=0.011). Overall, there were significant correlations between Cr at admission and ICU LOS (p=0.043), Cr at ICU admission and ICU LOS (p=0.001), and Cr at ICU admission and vent days (p=0.031). Conclusion: Our findings support existing literature that demonstrates a positive relationship between Cr levels, ICU LOS, and vent days amongst patients with severe TBI.
Keywords:
1. Introduction
2. Methods
- -
- Analysis 1: Creatinine levels were compared at five time points against demographic and clinical factors using two-tailed t-test for 2-category analyses (sex, injury type) and ANOVA one-way test, with Welch’s transformation when Bartlett’s assumptions of equal variance were violated, for analyses of more than 2-categories (age range, injury mechanism, diagnosis, number of injuries).
- -
- Analysis 2: Degree of creatinemia was related to mean GCS and ISS scores across various time points using a one-way ANOVA test, with Welch’s transformation when Bartlett’s assumptions of equal variance were violated.
- -
- Analysis 3: Linear regression modeling was used to assess correlations between the continuous independent variable (change in creatinine level) and continuous (hospital length of stay, Intensive Care Unit length of stay, ventilator days) and categorical (mortality) dependent variables.
- -
- Analysis 4: Linear regression modeling was used to assess correlations between the continuous independent variable (creatinine levels across admission) and continuous (hospital length of stay, Intensive Care Unit length of stay, ventilator days) and categorical (mortality) dependent variables.
3. Results
4. Discussion
5. Conclusion
Author Contributions
Funding
Institutional Review Board Statement
Informed Consent Statement
Data Availability Statement
Conflicts of Interest
References
- Ávila M, Mora Sánchez MG, Bernal Amador AS, Paniagua R. The Metabolism of Creatinine and Its Usefulness to Evaluate Kidney Function and Body Composition in Clinical Practice. Biomolecules 2025, 15, 41. [Google Scholar] [CrossRef] [PubMed]
- Ronco C, Bellomo R, Kellum JA. Acute kidney injury. Lancet 2019, 394, 1949–1964. [Google Scholar] [CrossRef] [PubMed]
- Robba C, Banzato E, Rebora P, Iaquaniello C, Huang CY, Wiegers EJA, Meyfroidt G, Citerio G; Collaborative European NeuroTrauma Effectiveness Research in Traumatic Brain Injury (CENTER-TBI) ICU Participants and Investigators. Acute Kidney Injury in Traumatic Brain Injury Patients: Results From the Collaborative European NeuroTrauma Effectiveness Research in Traumatic Brain Injury Study. Crit Care Med. 2021, 49, 112–126. [Google Scholar] [CrossRef] [PubMed]
- Barea-Mendoza JA, Chico-Fernández M, Quintana-Díaz M, Serviá-Goixart L, Fernández-Cuervo A, Bringas-Bollada M, Ballesteros-Sanz MÁ, García-Sáez Í, Pérez-Bárcena J, Llompart-Pou JA; Neurointensive Care and Trauma Working Group of the Spanish Society of Intensive Care Medicine (SEMICYUC). Traumatic Brain Injury and Acute Kidney Injury-Outcomes and Associated Risk Factors. J Clin Med. 2022, 11, 7216. [Google Scholar] [CrossRef] [PubMed] [PubMed Central]
- Zhang Y, Diao H, Ding J, Lu G, Jiang S, Zhang Y, Wei Q, Wang Z, Yu H, Shao J, Li Y. Risk factors associated with acute kidney injury in patients with traumatic brain injury: A systematic review and meta-analysis. J Crit Care. 2025, 89, 155126. [Google Scholar] [CrossRef] [PubMed]
- Wang RR, He M, Ou XF, Xie XQ, Kang Y. The Predictive Value of Serum Uric Acid on Acute Kidney Injury following Traumatic Brain Injury. Biomed Res Int. 2020, 2020, 2874369. [Google Scholar] [CrossRef] [PubMed] [PubMed Central]
- Udy AA, Jarrett P, Lassig-Smith M, Stuart J, Starr T, Dunlop R, Deans R, Roberts JA, Senthuran S, Boots R, Bisht K, Bulmer AC, Lipman J. Augmented Renal Clearance in Traumatic Brain Injury: A Single-Center Observational Study of Atrial Natriuretic Peptide, Cardiac Output, and Creatinine Clearance. J Neurotrauma. 2017, 34, 137–144. [Google Scholar] [CrossRef] [PubMed]
- Campassi ML, Repetto FG, Banegas Litardo DM, Castor R, Gómez G, Tiseyra B, Flores L, Ramirez I, Maspoli D, Báez J, Boroni I, Bertola R, Estenssoro E, Dubin A. Incidence and determinants of augmented renal clearance in traumatic brain injury: A prospective observational study. J Crit Care. 2022, 70, 154065. [Google Scholar] [CrossRef] [PubMed]
- Blennow K, Brody DL, Kochanek PM, Levin H, McKee A, Ribbers GM, Yaffe K, Zetterberg H. Traumatic brain injuries. Nat Rev Dis Primers. 2016, 2, 16084. [Google Scholar] [CrossRef] [PubMed]
- Capizzi A, Woo J, Verduzco-Gutierrez M. Traumatic Brain Injury: An Overview of Epidemiology, Pathophysiology, and Medical Management. Med Clin North Am. 2020, 104, 213–238. [Google Scholar] [CrossRef] [PubMed]
- Eapen BC, Allred DB, O’Rourke J, Cifu DX. Rehabilitation of moderate-to-severe traumatic brain injury. Semin Neurol. 2015, 35, e1–e3. [Google Scholar] [CrossRef] [PubMed]
- Jain S, Iverson LM. Glasgow Coma Scale. [Updated 2023 Jun 12]. In: StatPearls [Internet]. Treasure Island (FL): StatPearls Publishing; 2025 Jan-. Available from: https://www.ncbi.nlm.nih.gov/books/NBK513298/.
- Civil ID, Schwab CW. The Abbreviated Injury Scale, 1985 revision: a condensed chart for clinical use. J Trauma. 1988, 28, 87–90. [Google Scholar] [CrossRef] [PubMed]
- Palmer CS, Gabbe BJ, Cameron PA. Defining major trauma using the 2008 Abbreviated Injury Scale. Injury. 2016, 47, 109–15. [Google Scholar] [CrossRef] [PubMed]
- Mott TF, McConnon ML, Rieger BP. Subacute to chronic mild traumatic brain injury. Am Fam Physician. 2012, 86, 1045–51. [Google Scholar] [PubMed]
- Bielanin JP, Metwally SAH, Paruchuri SS, Sun D. An overview of mild traumatic brain injuries and emerging therapeutic targets. Neurochem Int. 2024, 172, 105655. [Google Scholar] [CrossRef] [PubMed]
- Orr TJ, Lesha E, Kramer AH, Cecia A, Dugan JE, Schwartz B, Einhaus SL. Traumatic Brain Injury: A Comprehensive Review of Biomechanics and Molecular Pathophysiology. World Neurosurg. 2024, 185, 74–88. [Google Scholar] [CrossRef] [PubMed]
- CDC. TBI Data. Traumatic Brain Injury & Concussion. Published April 29, 2024. https://www.cdc.gov/traumatic-brain-injury/data-research/index.html.
- Luu D, Komisarow J, Mills BM, Vavilala MS, Laskowitz DT, Mathew J, James ML, Hernandez A, Sampson J, Fuller M, Ohnuma T, Raghunathan K, Privratsky J, Bartz R, Krishnamoorthy V. Association of Severe Acute Kidney Injury with Mortality and Healthcare Utilization Following Isolated Traumatic Brain Injury. Neurocrit Care. 2021, 35, 434–440. [Google Scholar] [CrossRef] [PubMed] [PubMed Central]
- de Cássia Almeida Vieira R, de Barros GL, Paiva WS, de Oliveira DV, de Souza CPE, Santana-Santos E, de Sousa RMC. Severe traumatic brain injury and acute kidney injury patients: factors associated with in-hospital mortality and unfavorable outcomes. Brain Inj. 2024, 38, 108–118. [Google Scholar] [CrossRef] [PubMed]
- KDIGO. “KDIGO Clinical Practice Guideline for Acute Kidney Injury.” Journal of the International Society of Nephrology, Mar. 2012.
- Zheng B, Fan J, He R, Yin R, Wang J, Zhong Y. Antioxidant status of uric acid, bilirubin, albumin, and creatinine during the acute phase after traumatic brain injury: sex-specific features. Int J Neurosci. 2021, 131, 833–842. [Google Scholar] [CrossRef] [PubMed]
- Wu CL, Kor CT, Chiu PF, Tsai CC, Lian IB, Yang TH, Tarng DC, Chang CC. Long-term renal outcomes in patients with traumatic brain injury: A nationwide population-based cohort study. PLoS One. 2017, 12, e0171999. [Google Scholar] [CrossRef] [PubMed] [PubMed Central]
- Mo H, Fan F, Liu J, Zhang W, Wang Q, Yuan X. Chronic kidney disease as a predictive factor for poor prognosis in traumatic brain injury among older adults: a case-control study. Front Neurol. 2023, 14, 1286592. [Google Scholar] [CrossRef] [PubMed] [PubMed Central]
- Maragkos GA, Cho LD, Legome E, Wedderburn R, Margetis K. Prognostic Factors for Stage 3 Acute Kidney Injury in Isolated Serious Traumatic Brain Injury. World Neurosurg. 2022, 161, e710–e722. [Google Scholar] [CrossRef] [PubMed]
- Böhmer AB, Just KS, Lefering R, Paffrath T, Bouillon B, Joppich R, Wappler F, Gerbershagen MU. Factors influencing lengths of stay in the intensive care unit for surviving trauma patients: a retrospective analysis of 30,157 cases. Crit Care. 2014, 18, R143. [Google Scholar] [CrossRef] [PubMed] [PubMed Central]
- Corral L, Javierre CF, Ventura JL, Marcos P, Herrero JI, Mañez R. Impact of non-neurological complications in severe traumatic brain injury outcome. Crit Care. 2012, 16, R44. [Google Scholar] [CrossRef] [PubMed] [PubMed Central]
- Søvik S, Isachsen MS, Nordhuus KM, Tveiten CK, Eken T, Sunde K, Brurberg KG, Beitland S. Acute kidney injury in trauma patients admitted to the ICU: a systematic review and meta-analysis. Intensive Care Med. 2019, 45, 407–419. [Google Scholar] [CrossRef] [PubMed]
- Harrois A, Soyer B, Gauss T, Hamada S, Raux M, Duranteau J; Traumabase® Group. Prevalence and risk factors for acute kidney injury among trauma patients: a multicenter cohort study. Crit Care. 2018, 22, 344. [Google Scholar] [CrossRef] [PubMed] [PubMed Central]
- Al-Thani H, Ramzee AF, Asim M, El-Menyar A. Predisposing Factors and Outcome of Acute Kidney Injury After Blunt Trauma: A 10-Year Study. J Surg Res. 2023, 284, 193–203. [Google Scholar] [CrossRef] [PubMed]
- Ahmed N, Mathew RO, Kuo YH, Md AA. Risk of severe acute kidney injury in multiple trauma patients: Risk estimation based on a national trauma dataset. Injury 2020, 51, 45–50. [Google Scholar] [CrossRef] [PubMed]

| Male | Female | |
| N (%) | 768 (77%) | 232 (23%) |
| Age (mean ± SD) | 52.95 ± 9.83 years | 72.4 ± 4.26 years |
| Creatinine at Hospital Admission (mean ± SD) | 0.87 ± 0.07 mg/dL | 0.755 ± 0.08 mg/dL |
| Creatinine at ICU Admission (mean ± SD) | 0.75 ± 0.17 mg/dL | 0.66 ± 0.055 mg/dL |
| Creatinine at ICU Discharge (mean ± SD) | 0.625 ± 0.005 mg/dL | 0.635 ± 0.065 mg/dL |
| Creative at Hospital Discharge (mean ± SD) | 0.76 ± 0.04 mg/dL | 0.325 ± 0.325 mg/dL |
| Creatinine at Death (mean ± SD) | 0.00 ± 0.00 mg/dL | 0.00 ± 0.00 mg/dL |
| Race (n, %) | ||
| White | 128 (17%) | 53 (23%) |
| Black | 61 (8%) | 16 (7%) |
| Asian | 92 (12%) | 55 (23%) |
| Native Hawaiian or Other Pacific Islander | 2 (0.25%) | 2 (1%) |
| Other | 469 (61%) | 102 (44%) |
| Unknown | 14 (2%) | 4 (2%) |
| Ethnicity (n, %) | ||
| Hispanic | 384 (50%) | 80 (34%) |
| Non-Hispanic | 352 (46%) | 142 (61%) |
| Unknown | 31 (4%) | 10 (5%) |
| Trauma Type (n, %) | ||
| Blunt | 749 (98%) | 230 (99%) |
| Penetrating | 19 (2%) | 2 (1%) |
| Patient Weight (mean ± SD) | 66.5 ± 8.5 kg | 93 ± 39 kg |
| Glasgow Coma Score (mean ± SD) | 9 ± 6 | 15 ± 0 |
| Injury Severity Score (mean ± SD) | 19.5 ± 1.5 | 20 ± 2 |
| Hospital Length of Stay (mean ± SD) | 13.5 ± 12.5 | 8.5 ± 2.5 |
| ICU Length of Stay (mean ± SD) | 4.92 ± 4.92 | 1.165 ± 1.165 |
| Ventilator Days (mean ± SD) | 0 ± 0 | 0.38 ± 0.38 |
| Injury Pattern (n, %) | ||
| EDH | 0 (0%) | 1 (0%) |
| SDH | 1 (0%) | 0 (0%) |
| SAH | 338 (28%) | 86 (26%) |
| IPH | 603 (50%) | 190 (57%) |
| Concussion | 11 (1%) | 4 1(%) |
| Other | 248 (21%) | 55 (16%) |
| Mortality (n, %) | 83 (11%) | 25 (11%) |
| Admission Cr | ICU Admission Cr | ICU Discharge Cr | Hospital Discharge Cr | Death Cr | ||
| Sex | Female | 0.894 | 0.454 | 0.373 | 0.821 | 0.063 |
| Male | 0.963 | 0.603 | 0.577 | 0.740 | 1.475 | |
| p-value | 0.241 | 0.001 | 0.005 | 0.770 | 0.303 | |
| Age Range | Under 18 | 0.696 | 0.530 | 0.434 | 0.440 | 0.000 |
| 18-45 | 0.903 | 0.552 | 0.608 | 0.548 | 0.077 | |
| 46-74 | 0.973 | 0.593 | 0.494 | 0.800 | 2.866 | |
| 75+ | 0.974 | 0.563 | 0.455 | 1.08 | 0.151 | |
| p-value | 0.283 | 0.947 | 0.806 | 0.443 | 0.804 | |
| Injury Type | Blunt | 0.9455 | 0.569 | 0.532 | 0.760 | 1.168 |
| Penetrating | 0.978 | 0.519 | 0.416 | 0.6901 | 0.138 | |
| p-value | 0.754 | 0.657 | 0.309 | 0.617 | 0.339 | |
| Injury Mechanism | Fall | 0.981 | 0.555 | 0.520 | 0.880 | 1.781 |
| Blunt Assault | 0.909 | 0.634 | 0.578 | 0.636 | 0.071 | |
| MVC | 0.886 | 0.554 | 0.600 | 0.464 | 0.171 | |
| Pedestrian Struck | 0.871 | 0.616 | 0.530 | 0.532 | 0.158 | |
| Micro MVC | 0.846 | 0.564 | 0.501 | 0.534 | 0.026 | |
| Penetrating Assault | 0.996 | 0.545 | 0.437 | 0.696 | 0.145 | |
| Other | 0.843 | 0.302 | 0.209 | 0.672 | 0.000 | |
| p-value | 0.693 | 0.802 | 0.992 | 0.888 | 0.997 | |
| Diagnosis | Subdural | 1.550 | 0.000 | 0.000 | 0.000 | 0.000 |
| Subarachnoid | 0.942 | 0.605 | 0.628 | 0.600 | 0.129 | |
| Epidural | 0.640 | 0.460 | 0.530 | 0.610 | 0.000 | |
| Intraparenchymal | 0.962 | 0.577 | 0.556 | 0.809 | 1.433 | |
| Concussion | 1.160 | 0.786 | 0.707 | 0.489 | 0.293 | |
| Other | 0.884 | 0.560 | 0.486 | 0.560 | 0.097 | |
| p-value | >0.05 | >0.05 | >0.05 | >0.05 | >0.05 | |
| Number of Injuries | One | 0.979 | 0.550 | 0.457 | 0.936 | 2.140 |
| Two | 0.886 | 0.546 | 0.595 | 0.548 | 0.119 | |
| Three | 1.040 | 0.734 | 0.700 | 0.689 | 0.165 | |
| Four+ | 0.844 | 0.732 | 0.498 | 0.465 | 0.104 | |
| p-value | 0.217 | 0.124 | 0.469 | 0.399 | 0.831 |
| Extreme Hyper-creatinemia | Hyper-creatinemia | Normo-creatinemia | Hypo-creatinemia | Extreme Hypo-creatinemia | p-Value | ||
| Cr at Hospital Admission | ISS | 19.78 | 21.75 | 18.17 | 17.34 | 18.05 | 0.056 |
| GCS | 12.05 | 12.28 | 12.74 | 13.32 | 13.00 | 0.230 | |
| Cr at ICU Admission | ISS | 20.81 | 22.16 | 19.89 | 18.90 | 17.29 | 0.0003 |
| GCS | 11.79 | 12.61 | 12.16 | 13.48 | 13.10 | 0.004 | |
| Cr at ICU Discharge | ISS | 19.95 | 17.64 | 19.21 | 18.44 | 18.20 | 0.607 |
| GCS | 11.84 | 14.64 | 12.75 | 12.53 | 12.74 | 0.326 | |
| Cr at Hospital Discharge | ISS | 20.32 | 19.18 | 17.83 | 17.79 | 18.91 | 0.448 |
| GCS | 12.26 | 14.47 | 13.07 | 12.86 | 12.43 | 0.055 | |
| Cr at Death | ISS | 21.00 | 26.25 | 19.10 | 38.50 | 18.36 | 0.017 |
| GCS | 10.33 | 11.75 | 11.14 | 6.50 | 12.84 | 0.001 |
| Timeframe | Outcome | P-value | Coefficient ± 95% CI |
| Change in Cr Level from Hospital Admission to ICU Admission | Hospital LOS | 0.497 | -0.550 ± -2.14 – 1.04 |
| ICU LOS | 0.265 | 0.321 ± -0.887 – 0.244 | |
| Ventilator Days | 0.045 | -0.500 ± -0.989 – -0.011 | |
| Mortality | 0.139 | -0.019 ± -0.043 – 0.006 | |
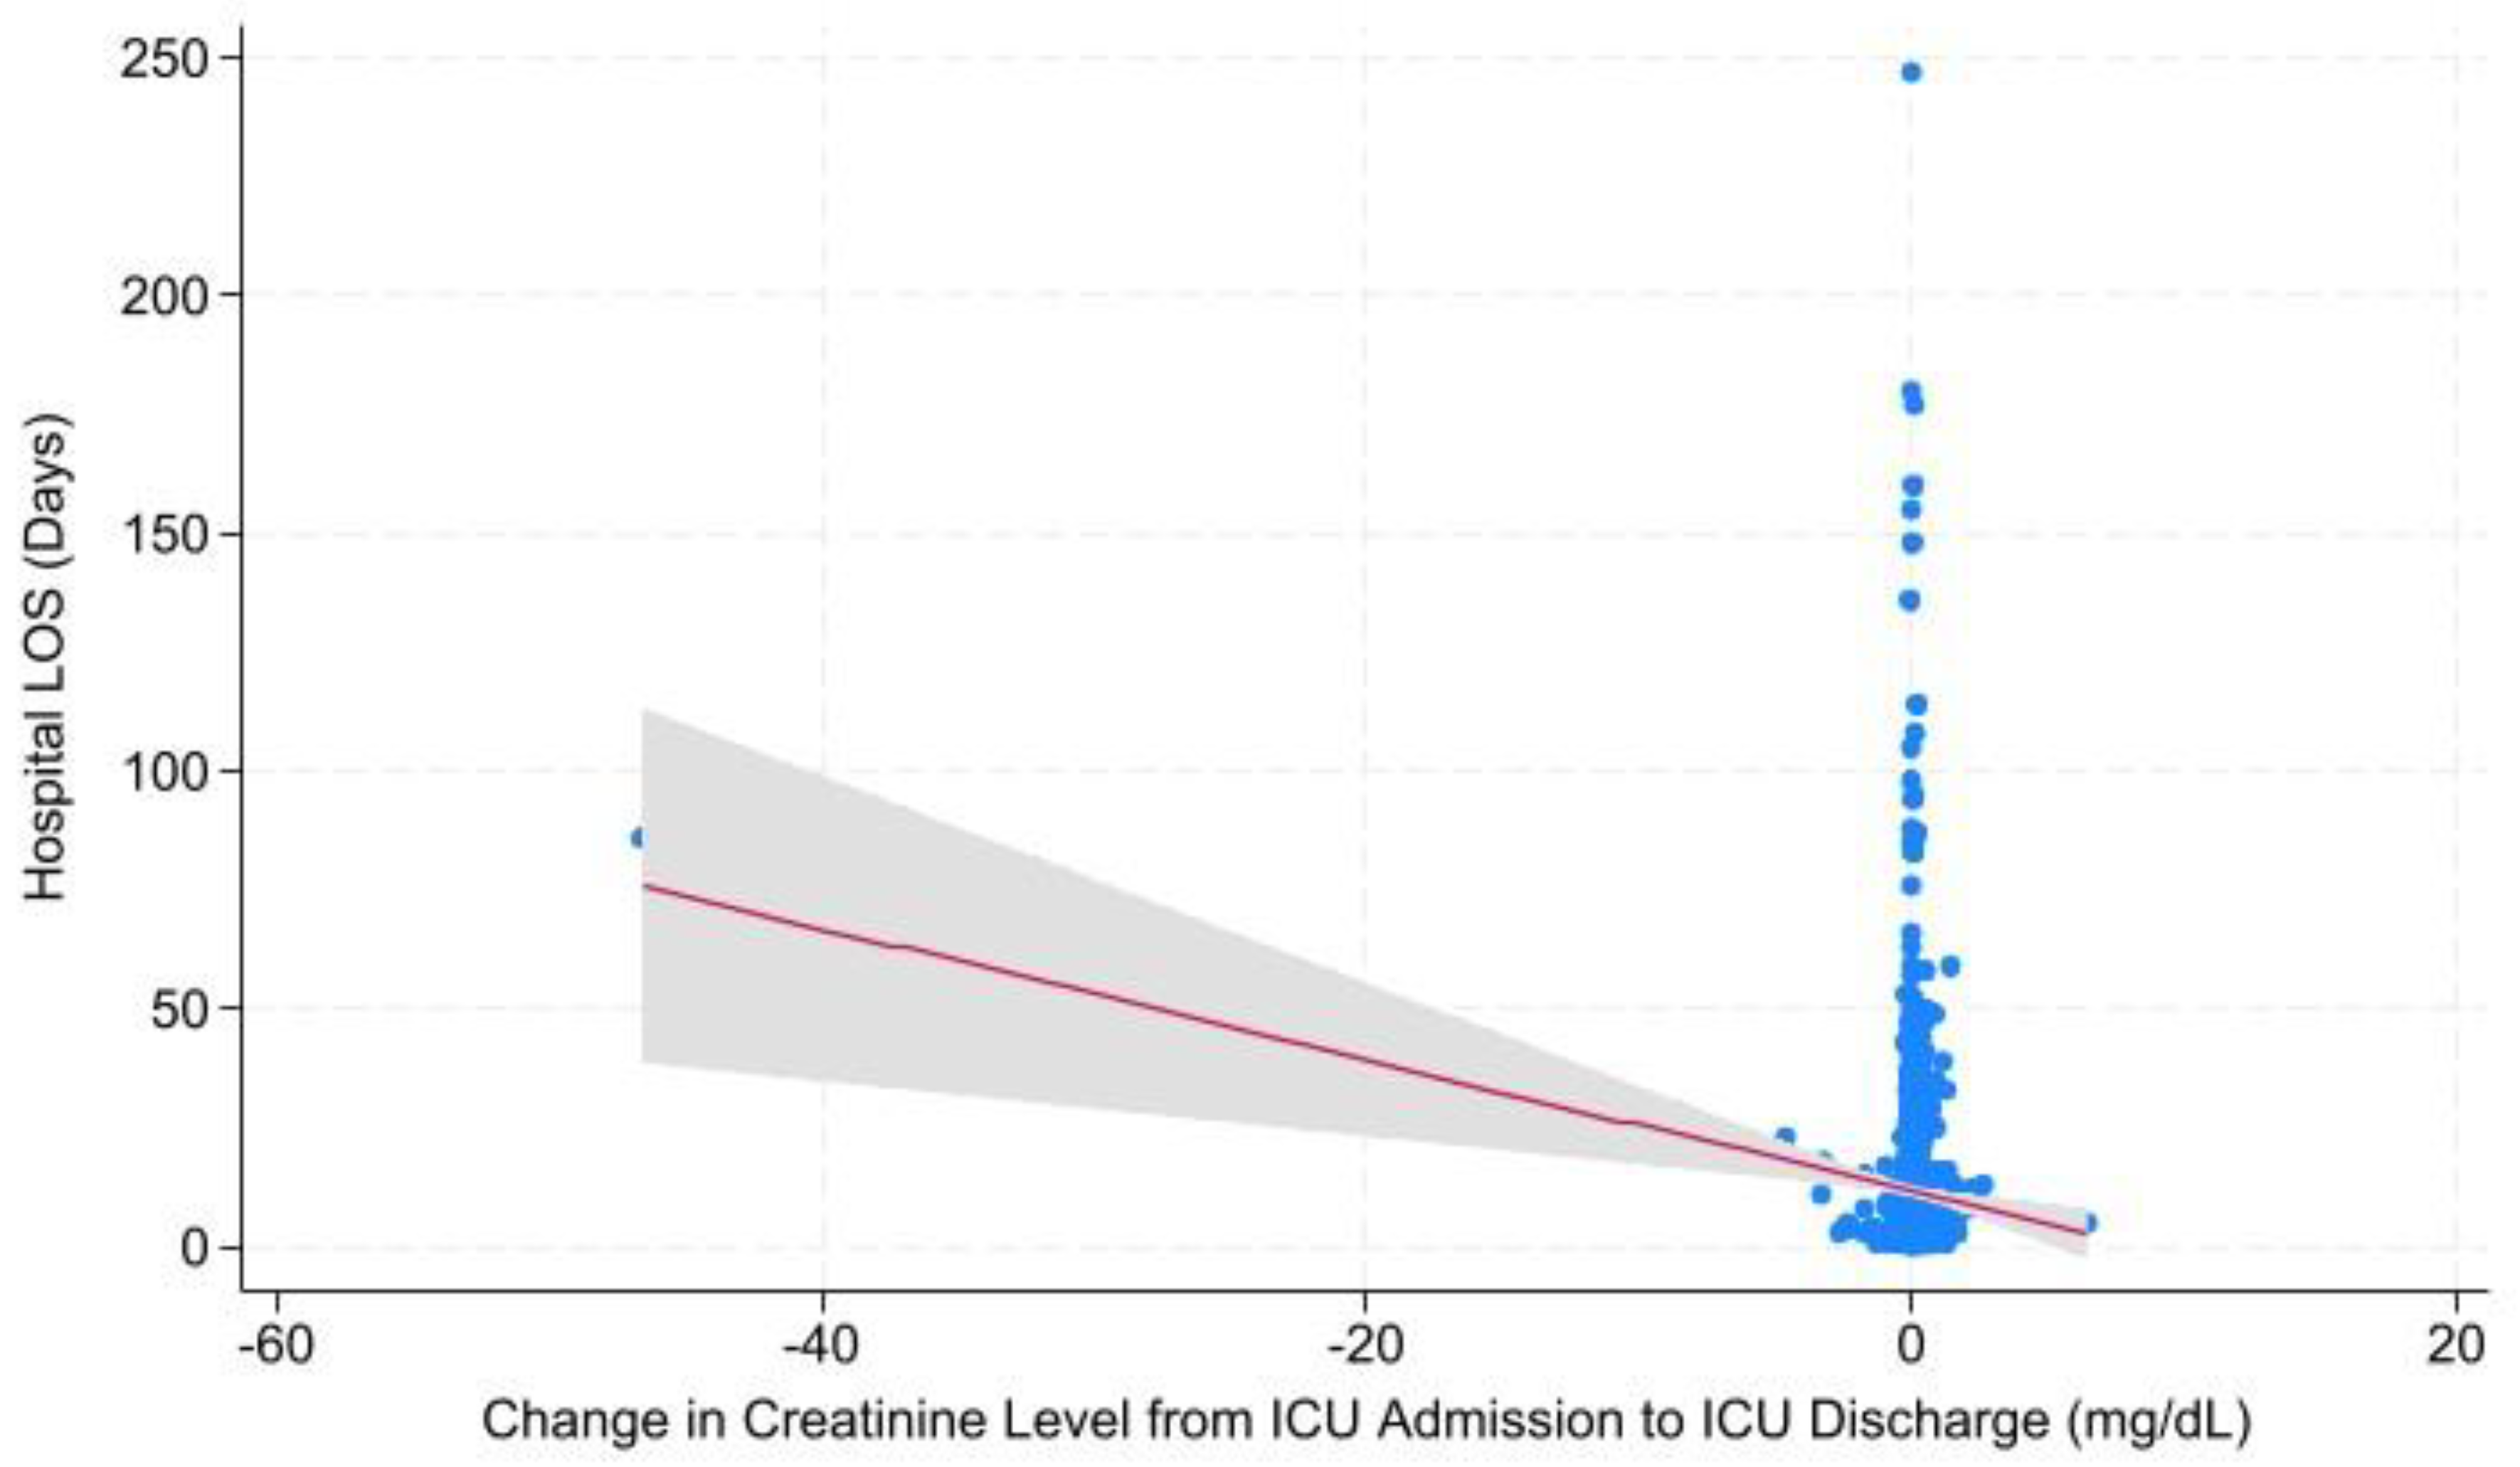
| Change in Cr Level from ICU Admission to ICU Discharge | Hospital LOS | 0.001 | -1.380 ± -2.180 – -0.580 |
| ICU LOS | 0.000 | -0.542 ± -0.827 – -0.257 | |
| Ventilator Days | 0.011 | -0.322 ± -0.569 – -0.074 | |
| Mortality | 0.148 | 0.009 ± -0.003 – 0.022 |
| Timeframe | Outcome | P-value | Coefficient ± 95% CI | |
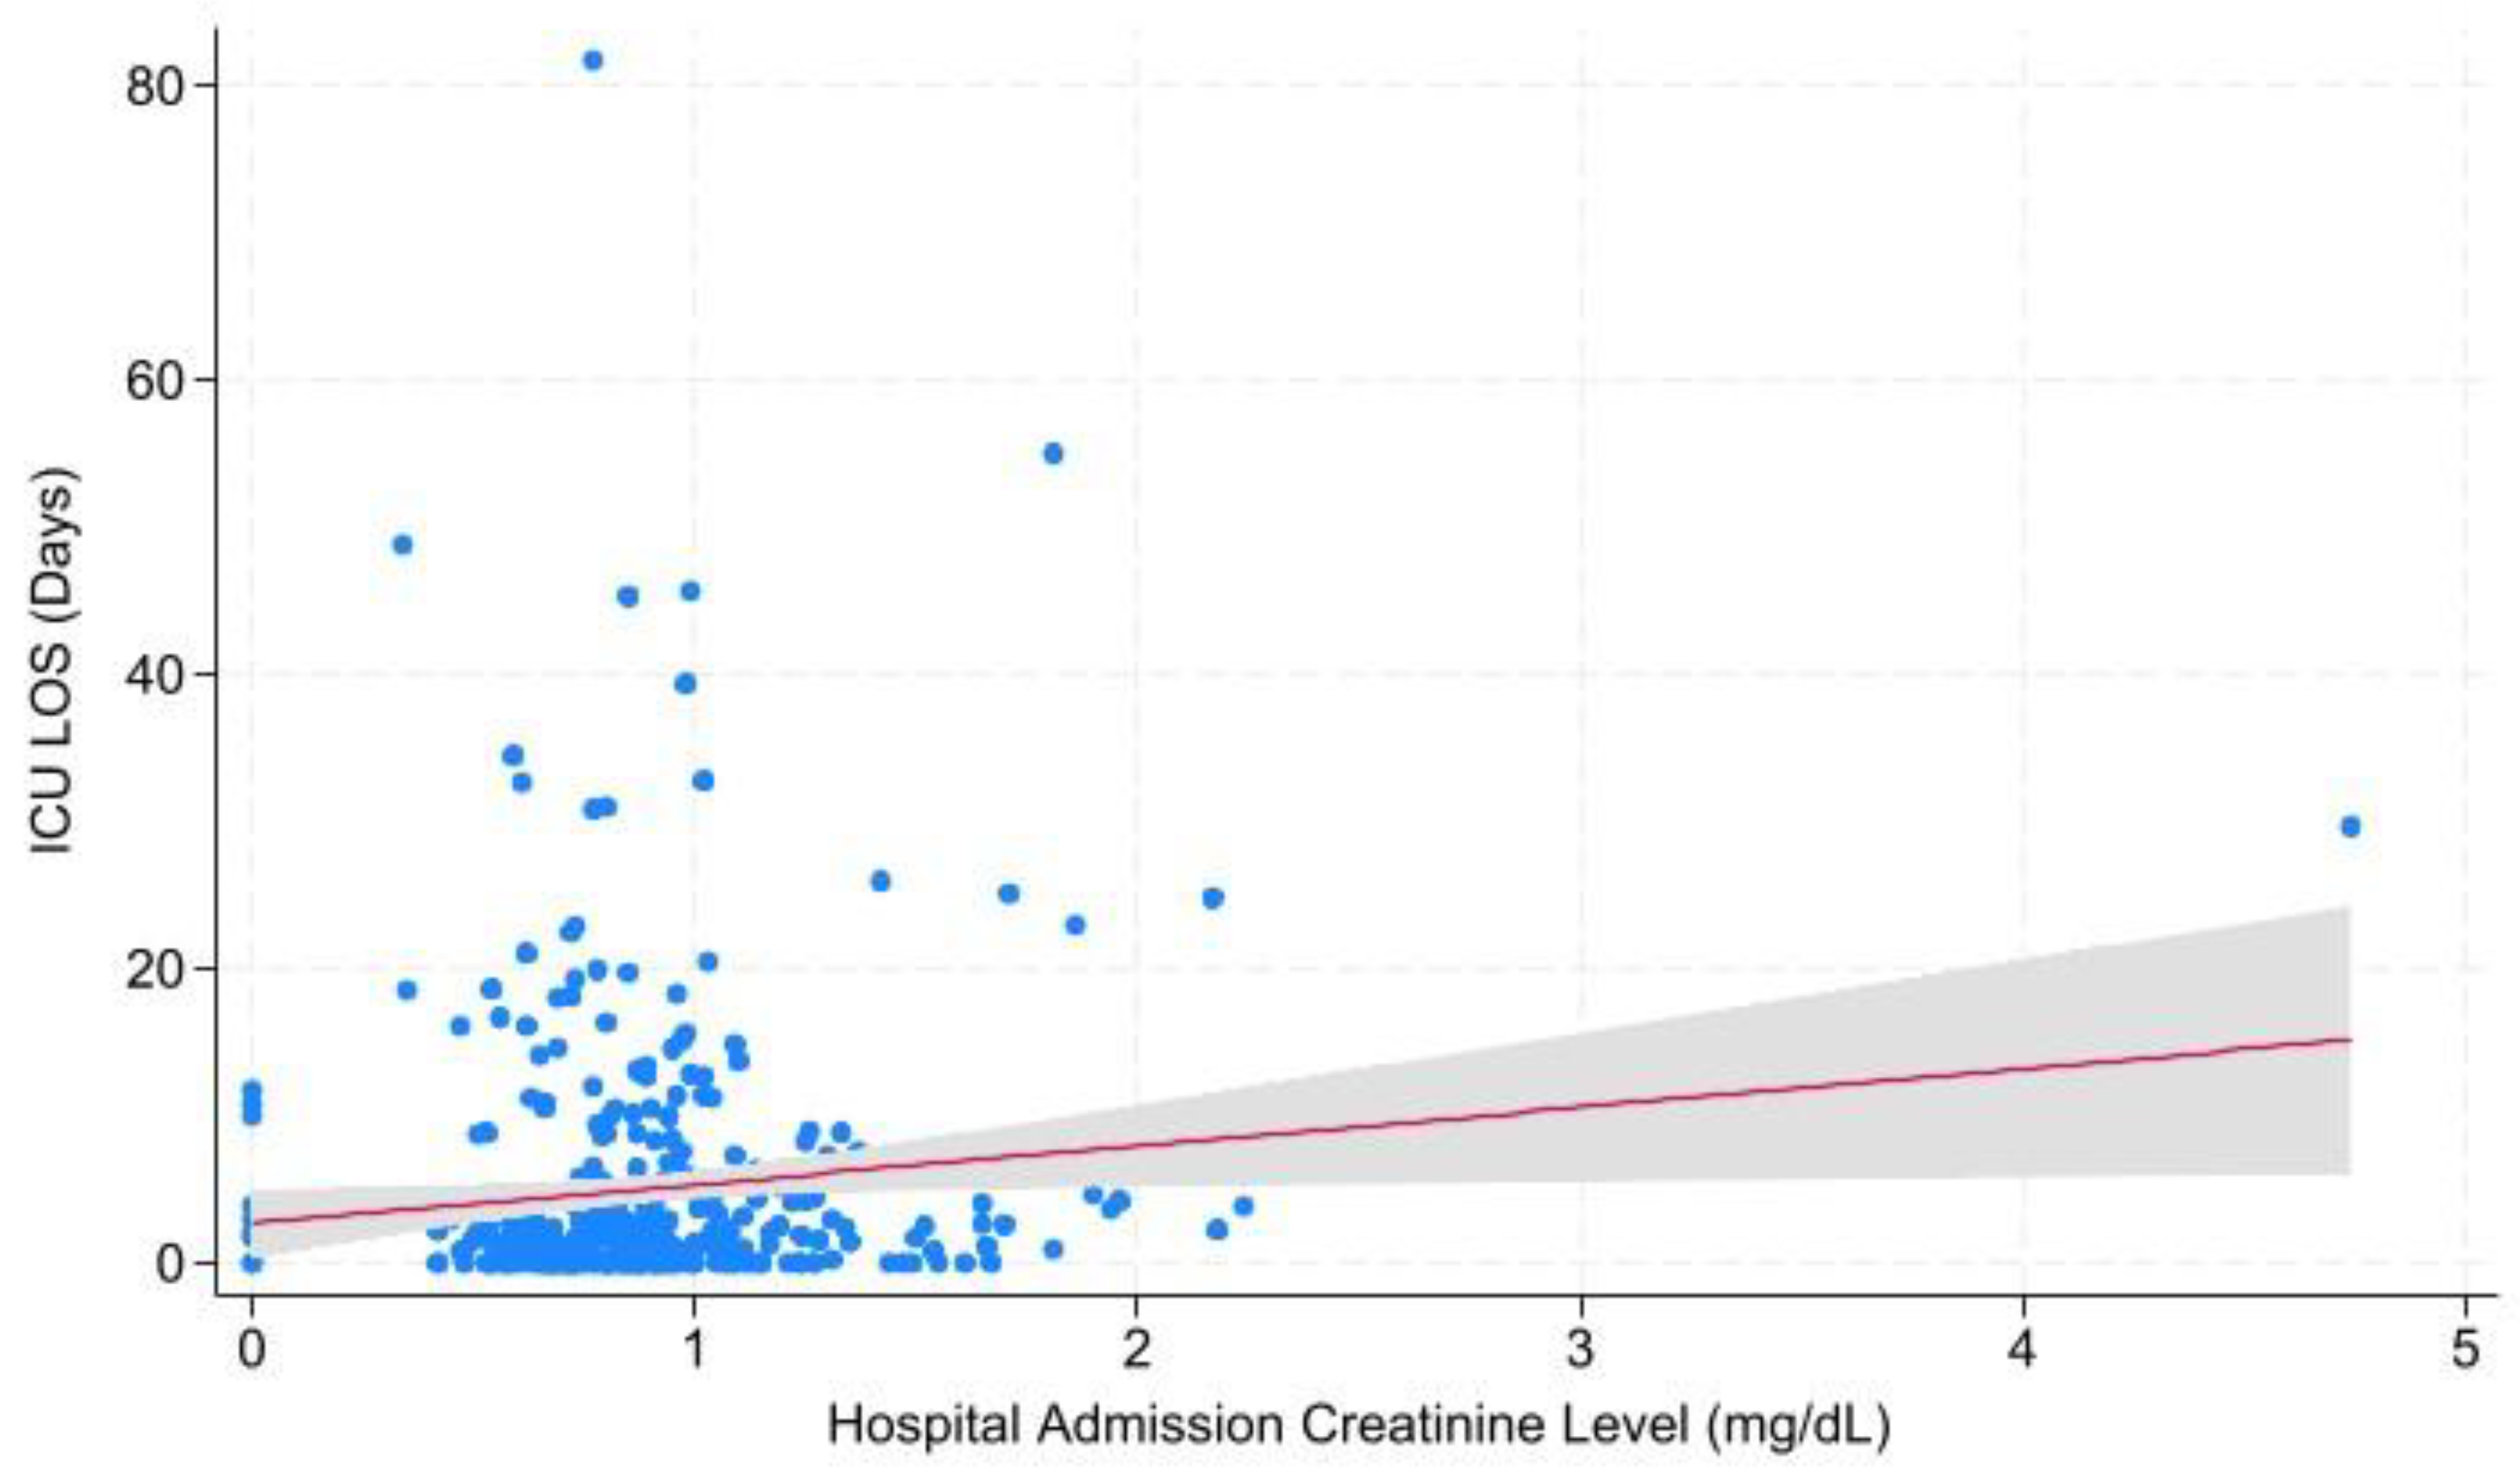
| Overall | Cr at Admission | Hospital LOS | 0.472 | 0.584 ± -1.008 – 2.175 |
| ICU LOS | 0.043 | 0.586 ± 0.019 – 1.152 | ||
| Ventilator Days | 0.981 | 0.006 ± -0.486 – 0.497 | ||
| Mortality | 0.755 | -0.004 ± -0.029 – 0.021 | ||
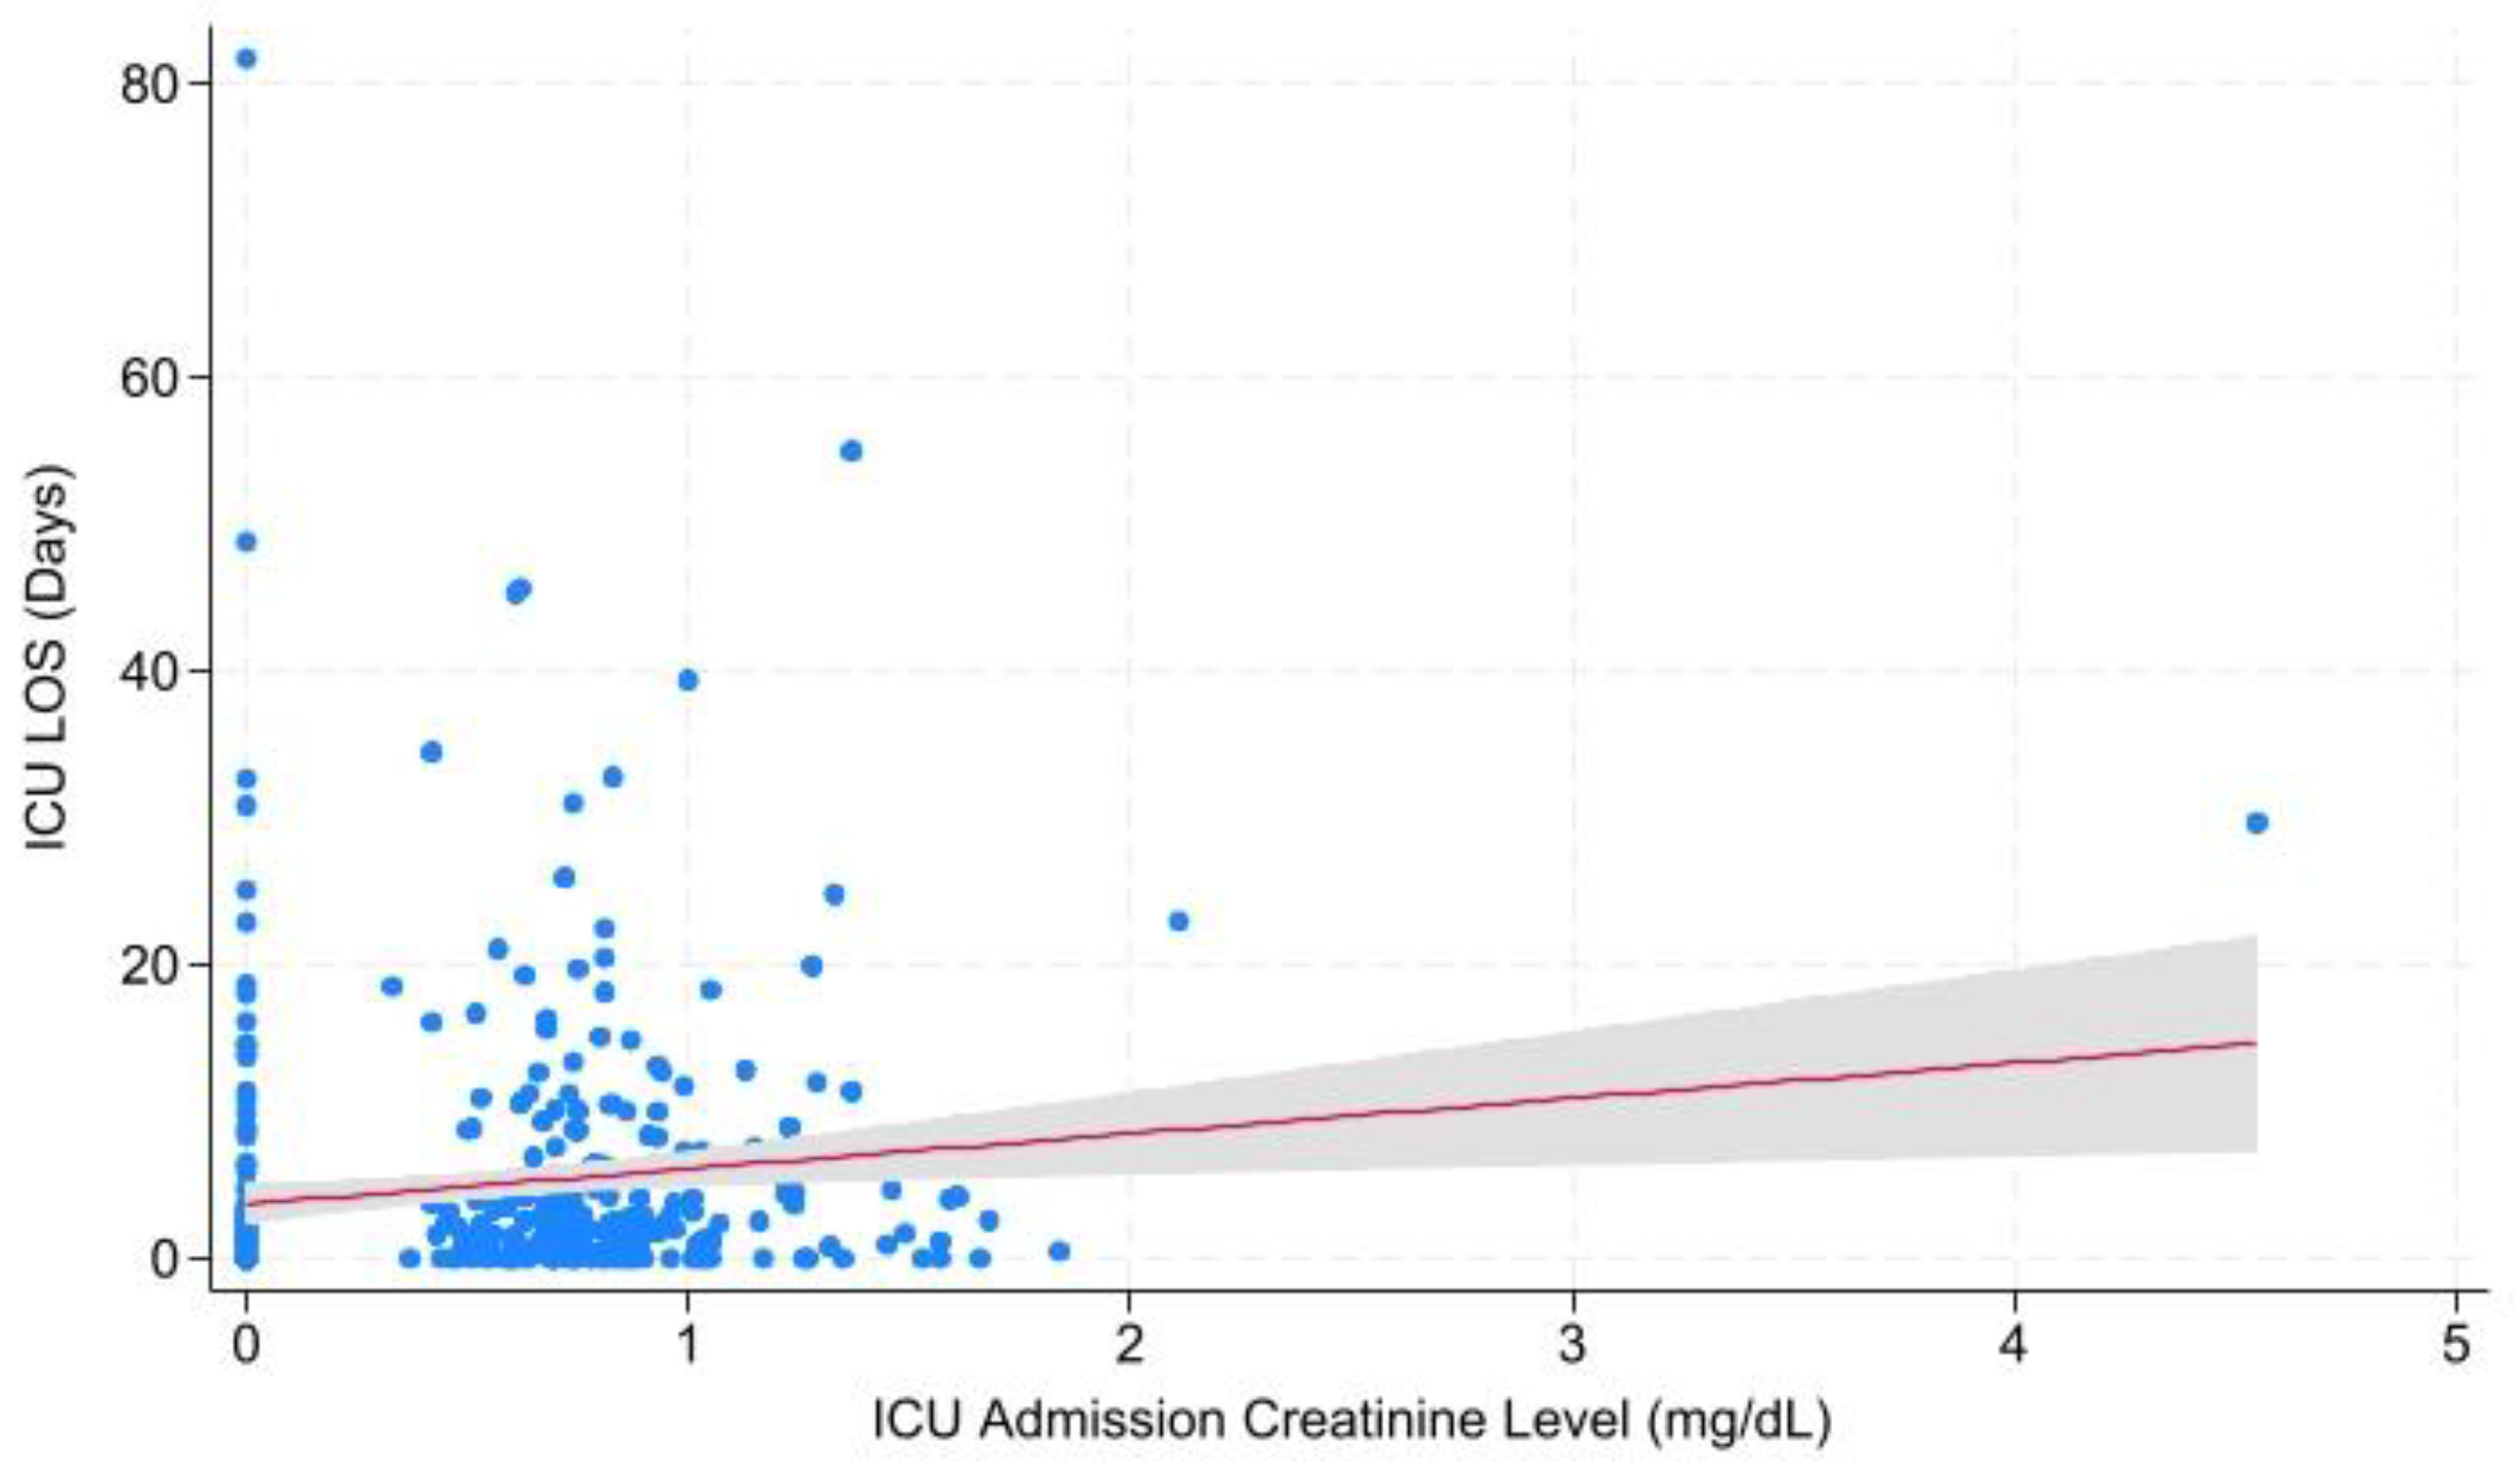
| Cr at ICU Admission | Hospital LOS | 0.135 | 1.289 ± -0.404 – 2.982 | |
| ICU LOS | 0.001 | 1.029 ± 0.429 – 1.630 | ||
| Ventilator Days | 0.031 | 0.576 ± 0.054 – 1.098 | ||
| Mortality | 0.211 | 0.017 ± -0.010 – 0.043 | ||
| Cr at ICU Discharge | Mortality | 0.417 | -0.005 ± -0.017 – 0.007 | |
| 1 Injury | Cr at Admission | Hospital LOS | 0.174 | 0.617 ± -0.272 – 1.506 |
| ICU LOS | 0.061 | 0.404 ± -0.019 – 0.826 | ||
| Ventilator Days | 0.408 | 0.113 ± -0.155 – 0.391 | ||
| Mortality | 0.948 | 0.001 ± -0.022 – 0.023 | ||
| Cr at ICU Admission | Hospital LOS | 0.024 | 1.238 ± 0.162 – 2.315 | |
| ICU LOS | 0.003 | 0.766 ± 0.255 – 1.276 | ||
| Ventilator Days | 0.002 | 0.508 ± 0.186 – 0.831 | ||
| Mortality | 0.197 | 0.018 ± -0.009 – 0.045 | ||
| Cr at ICU Discharge | Mortality | 0.274 | -0.017 ± -0.049 – 0.014 | |
| 2 Injuries | Cr at Admission | Hospital LOS | 0.927 | 0.314 ± -6.437 – 7.065 |
| ICU LOS | 0.029 | 2.629 ± 0.277 – 4.980 | ||
| Ventilator Days | 0.516 | 0.562 ± -1.139 – 2.263 | ||
| Mortality | 0.613 | 0.024 ± -0.070 – 0.119 | ||
| Cr at ICU Admission | Hospital LOS | 0.420 | 2.151 ± -3.083 – 7.385 | |
| ICU LOS | 0.010 | 2.399 ± 0.572 – 4.227 | ||
| Ventilator Days | 0.154 | 0.960 ± -0.362 – 2.285 | ||
| Mortality | 0.602 | 0.019 ± -0.053 – 0.093 | ||
| Cr at ICU Discharge | Mortality | 0.577 | -0.004 ± -0.019 – 0.011 | |
| 3 Injuries | Cr at Admission | Hospital LOS | 0.824 | 0.802 ± -6.337 – 7.942 |
| ICU LOS | 0.699 | 0.365 ± -1.504 – 2.234 | ||
| Ventilator Days | 0.478 | -1.111 ± -4.209 – 1.988 | ||
| Mortality | 0.420 | -0.028 ± -0.098 – 0.041 | ||
| Cr at ICU Admission | Hospital LOS | 0.747 | -0.938 ± -6.691 – 4.816 | |
| ICU LOS | 0.936 | 0.061 ± -1.443 – 1.566 | ||
| Ventilator Days | 0.956 | -0.070 ± -2.569 – 2.429 | ||
| Mortality | 0.958 | -0.001 ± -0.058 – 0.055 | ||
| Cr at ICU Discharge | Mortality | 0.943 | -0.002 ± -0.058 – 0.054 | |
| 4+ Injuries | Cr at Admission | Hospital LOS | 0.469 | 10.642 ± -20.387 – 41.671 |
| ICU LOS | 0.159 | 7.644 ± -3.435 – 18.723 | ||
| Ventilator Days | 0.406 | 3.980 ± -6.090 – 14.050 | ||
| Mortality | 0.203 | -0.478 ± -1.251 – 0.296 | ||
| Cr at ICU Admission | Hospital LOS | 0.549 | -7.523 ± -34.124 – 19.078 | |
| ICU LOS | 0.863 | 0.832 ± -9.435 – 11.098 | ||
| Ventilator Days | 0.924 | 0.397 ± -8.432 – 9.225 | ||
| Mortality | 0.198 | 0.411 ± -0.246 – 1.068 | ||
| Cr at ICU Discharge | Mortality | 0.133 | -0.547 ± -1.285 – 0.192 |
Disclaimer/Publisher’s Note: The statements, opinions and data contained in all publications are solely those of the individual author(s) and contributor(s) and not of MDPI and/or the editor(s). MDPI and/or the editor(s) disclaim responsibility for any injury to people or property resulting from any ideas, methods, instructions or products referred to in the content. |
© 2025 by the authors. Licensee MDPI, Basel, Switzerland. This article is an open access article distributed under the terms and conditions of the Creative Commons Attribution (CC BY) license (http://creativecommons.org/licenses/by/4.0/).


