
Submitted:
02 August 2025
Posted:
04 August 2025
You are already at the latest version
Abstract
The paper presents two series representations of a L{\'e}vy process for the Generalized Tempered Stable (GTS) distribution: a series representation generated by the inverse tail integral and a short noise representation. Both series representations are used to simulate the daily returns of Bitcoin and Ethereum. The Q-Q plot analysis shows smooth linear patterns, indicating strong agreement between the empirical and theoretical GTS distributions.
Keywords:
Generalized Tempered Stable (GTS) distribution
; heavy-tailed distributions
; bitcoin
; ethereum
; Q–Q plots
; series representation
; shot noise method
; simulation algorithms
1. Introduction
The Lévy measure of the GTS distribution () is defined in (1) as a product of a tempering function and a Lévy measure of the -stable distribution :
where , , , , and .
The six parameters hold significant interpretations. and are the indexes of stability bounded below by zero and above by 2 [1]. They capture the peakedness of the distribution similarly to the -stable distribution. If increases (decreases), then the peakedness decreases (increases). and are the scale parameters, also called the process intensity [2]; they determine the arrival rate of jumps for a given size. and control the decay rate on the positive and negative tails. Additionally, and are also skewness parameters. If (), then the distribution is skewed to the left (right), and if , then it is symmetric [3,4]. For more details on the tempering function and the associated Lévy measure, refer to [3,5,6].
In this paper, Generalized Tempered Stable (GTS) random variables with finite variation are simulated using two series-based methods: the inverse tail integral representation and the short noise representation.
The structure of the paper is as follows: Section 2 reviews key properties of the GTS distribution. Section 3 presents the GTS parameter values used in the simulations. Section 4 introduces the series representation framework of Lévy processes. Section 5 describes and implements the inverse tail integral representation. Section 6 describes and implements the short noise representation.
2. Properties of the GTS Distribution with Finite variation: Review
The activity process of the GTS distribution can be studied from the integral (2) of the Lévy measure (1):
As shown in Eq (2), if and , the Lévy density () is not integrable as it goes off to infinity too rapidly as x goes to zero, due to a large number of very small jumps. The GTS distribution is said to be an infinite activity process with infinite jumps in any given time interval.
In addition to the infinite activities process, the variation of the process can be studied by solving the following integral[7]:
As shown in Eq (3), is a finite variation process, and generates a type B Lévy process [9], which is a purely non-Gaussian infinite activity Lévy process of finite variation whose sample paths have an infinite number of small jumps and a finite number of large jumps in any finite time interval. In particular, being of bounded variation shows that can be written as a difference of two independent subordinators [7,10].
where and are subordinators on the positive half-line and belong to the class of Tempered Stable distributions, denoted .
By adding a drift parameter, we have the following expression
Theorem 1.
Consider a variable . The characteristic exponent can be written as:
3. Parameter Estimation Results: Bitcoin versus Ethereum
The GTS parameter estimation results for Bitcoin and Ethereum are summarized in Table 1 and Table 2, respectively. The brackets indicate the asymptotic standard errors, calculated using the inverse of the Hessian matrix.. Both Bitcoin and Ethereum’s log-likelihood estimates show that is negative, but the asymptotic standard error is quite large, suggesting that is not statistically significant at 5% level.
For Bitcoin returns, the skewness parameters (, ), the process intensity parameters (, ), the index of stability parameters (, ) are all statistically significant at the 5% level.
Table 2 provides a summary of the estimation results for Ethereum returns. The parameters for Ethereum returns data are statistically significant at 5%, except and .
However, the difference (), the difference () are not statistically significant. Contrary to the Bitcoin return, the Ethereum return has a larger process intensity, which provides evidence that Ethereum has a lower level of peakedness and a higher level of thickness.
Remark 1.
The methodology for fitting a seven-parameter GTS distribution and the parameter estimation results can be further studied in [12], notably
- Bitcoin (BTC) and Ethereum (ETH) prices were extracted from CoinMarketCap. The period spans from April 28, 2013, to July 04, 2024, for Bitcoin, and from August 07, 2015, to July 04, 2024, for Ethereum.
- The log-likelihood, Akaike’s information Criteria (AIC), and Bayesian information criteria (BIK) statistics show that the GTS distribution with seven parameters performs better than the two-parameter Normal distribution (GBM)
- The goodness-of-fit to GTS distribution was assessed through Kolmogorov-Smirnov, Anderson-Darling, and Pearson’s chi-squared tests.
- It was shown that the GTS distribution outperforms the Kobol distributionKobol (), the Carr–Geman–Madan–Yor (CGMY) distribution ( and ), and Bilateral Gamma distribution ().
4. Series Representations of Lévy processes
We start this section by presenting a result from Rosiński [14], which provides a general framework for representing Lévy processes with almost surely convergent series expansions. Both the inverse tail integral and shot noise methods are applied to the GTS distribution.
An interesting feature of tempered stable Lévy processes is that they behave like stable processes in a short period of time while in a long time frame they are approximately Gaussian.
Let , be a d-dimensional Lévy process with stationary, independent increments, stochastically continuous, and starting at zero. Its characteristic function is
where
with
- is the characteristic exponent
- : drift vector,
- : Lévy measure, defining the intensity and distribution of jumps in the process, and satisfying ,
- : the characteristic triplet of X.
According to the Lévy–Itô decomposition theorem [14,15], admits the following decomposition
where N is a Poisson random measure on . Equivalently,
with i.i.d. and the associated jump sizes, independent from the . For further details, please refer to [14,16,17].
For , we define
As , this converges almost surely to
And we have:
In the special case of Generalized Tempered Stable (GTS) distribution where , and the characteristic exponent becomes:
5. Sampling GTS distribution via the Inverse Tail Integral Method
Let a Tempered Stable distributions, denoted . The Lévy measure of is concentrated on and the tail integral function is defined as follows:
Using integration by parts, Eq.(17) becomes
where is the upper incomplete gamma function.
The inverse of the tail integral function is defined as follows:
The series representation generated by the inverse tail integral method of has the following expression:
where
- , are i.i.d. exponential random variables with mean 1, and we set ;
- are i.i.d. uniform random variables on ;
- All the random elements , are mutually independent.
Algorithm 1 outlines the Simulation of on [0, 1] using the series representation generated by the inverse tail integral method.
| Algorithm 1:Series Representation using the inverse tail integral method |
|
Daily return samples for Bitcoin and Ethereum were generated using the algorithm (1). The GTS parameter values come from Table 1 for Bitcoin and Table 2 for Ethereum.
For each asset, empirical quantiles were computed and compared to their theoretical counterparts using Q–Q plots. As depicted in Figure 1, Panel(Figure 1), and Figure 2, Panel(Figure 2), the Q–Q plots display smooth linear patterns, indicating a strong agreement between the empirical and the theoretical GTS distributions.
Remark 2.
The theoretical quantiles ( represented by the red line in the Q-Q plot) and the observed quantiles were computed by the Enhanced Fast Fractional Fourier Transform (FRFT) scheme. The Enhanced Fast FRFT scheme improves the accuracy of the one-dimensional fast FRFT by leveraging closed Newton-Cotes quadrature rules[18,19]. For more details on the methodology and its applications, refer to [20,21,22,23,24,25].
6. Sampling GTS distribution via the shot noise representation
The inverse of the tail of the Lévy measure for a tempered stable distribution lacks a closed-form expression, as shown in Eq.(). As a result, the inverse tail integral method becomes practically intractable. To address this difficulty, Rosiński [14,26,27] proposes a series representation based on the generalized shot noise framework, which is more revealing about the structure of the Tempered stable distribution.
Theorem 2
(Theorem 5.1 [27]). Let , , be a tempered stable Lévy process in with If , or ν is symmetric and , then
where the equality holds in the sense of finite-dimensional distributions, and the infinite series converges almost surely, uniformly in . Here,
- , are i.i.d. uniform random variables on ;
- , are i.i.d. exponential random variables with mean 1, and we set ;
- are i.i.d. random vectors in with common distribution , defined via the Lévy measure ν by
- All the random elements , , , , and are mutually independent.
Refer to [26] for the proof of Theorem 2
For the one-sided case, let denote a Tempered Stable distribution. The Lévy measure of is concentrated on with dimension . Using the notation from [26], we have for a time horizon .
The common distribution is related to the Dirac measure , implying that is deterministic.
The sampling of daily returns for Bitcoin, Ethereum, the S&P 500, and the SPY ETF was performed using Eq. (), which corresponds to a version of Eq. (23) with time horizon .
Algorithm 2 describes how to simulate using the shot-noise series representation.
| Algorithm 2:Shot-noise series simulation for |
|
Daily return samples for Bitcoin and Ethereum were generated using the algorithm (2). The GTS parameter values come from Table 1 (Bitcoin) and Table 2 (Ethereum).
For each asset, empirical quantiles were computed and compared to the corresponding theoretical quantiles via Q–Q plots. As shown in Figure 3, Panel(Figure 3), and Figure 4, Panel(Figure 4), the Q–Q plots exhibit smooth, linear trends, indicating a strong alignment between the empirical and the theoretical GTS distributions.
Remark 3.
In a quantile-quantile (Q-Q) plot, the quantiles of an observed distribution are plotted against the quantiles of the theoretical distribution. If the two distributions are similar, then the quantiles will also be similar, and the points will fall close to the line . Any deviation from the reveals how the distributions differ [28,29].
- Q-Q Plots and Skewed Distributions: the distribution is left-skewed when the Q-Q plot would be concave downward; the distribution is right-skewed when the data show a U-shaped or "humped" pattern; and a Q-Q plot of any symmetric distribution is typically symmetric and linear in the center of the data.
- Q-Q Plots and Short-Tailed Distributions: Short-tailed distributions may show an S-shaped curve, but the more specific characteristic is the deviation from the straight line in the opposite direction at the tails compared to long tails ( above the line in the lower tail and below the line in the upper tail).
- Q-Q Plots and Long-Tailed Distributions[30]:Long-tailed distributions typically show deviations from the straight line at both ends of the Q-Q plot, where the lower tail turns downward and the upper tail curves upward.
- S-shaped Curves in Q-Q Plotscan indicate several things, including: Heavier tails than the theoretical distribution, Light tails, and systematic differences between the distributions being compared.
7. Conclusions
This study presents a comprehensive review and empirical implementation of the inverse tail integral representation and short noise representation for the Generalized Tempered Stable (GTS) distribution. We demonstrate how these approaches can generate realistic samples from heavy-tailed distributions that are well-suited to the erratic behavior of cryptocurrency markets. The simulation results showed that the series representation methods provided not only a theoretically sound but also a practically viable method for simulating financial data with complex statistical features. Our findings reinforce the practical utility of the Generalized Tempered Stable (GTS) models and series-based simulation in accurately reflecting the dynamic nature of cryptocurrency markets.
References
- S. Borak, W. Härdle, and R. Weron, “Stable distributions,” in Statistical Tools for Finance and Insurance. Berlin, Heidelberg: Springer Berlin Heidelberg, 2005, pp. 21–44.
- S. Boyarchenko and S. Z. Levendorskii, Non-Gaussian Merton-Black-Scholes Theory. Singapore: World Scientific Publishing, 2002, vol. 9.
- S. T. Rachev, Y. S. Kim, M. L. Bianchi, and F. J. Fabozzi, “Stable and tempered stable distributions,” in Financial Models with Lévy Processes and Volatility Clustering, ser. The Frank J. Fabozzi Series, M. B. S.T. Rachev, Y.S. Kim and F. Fabozzi, Eds. Hoboken, New Jersey: John Wiley & Sons, Ltd, 2011, vol. 187, ch. 3, pp. 57–85.
- H. A. Fallahgoul, D. H. A. Fallahgoul, D. Veredas, and F. J. Fabozzi, “Quantile-based inference for tempered stable distributions,” Computational Economics, vol. 53, pp. 51–83, 2019.
- U. Küchler and S. Tappe, “Tempered stable distributions and processes,” Stochastic Processes and their Applications, vol. 123, no. 12, pp. 4256–4293, 2013.
- M. L. Bianchi, S. V. M. L. Bianchi, S. V. Stoyanov, G. L. Tassinari, F. J. Fabozzi, and S. M. Focardi, Handbook of Heavy-Tailed Distributions in Asset Management and Risk Management, ser. Financial Economics. Singapore: World Scientific Publishing, 2019, vol. 7.
- A. E. Kyprianou, Fluctuations of Lévy processes with applications: Introductory Lectures. Edinburgh: Springer Science & Business Media, 2014.
- A. H. Nzokem, “Self-decomposable laws associated with general tempered stable (gts) distribution and their simulation applications,” e-prints ArXiv:2405.16614, 2024. [Online]. Available: https://arxiv.org/pdf/2405.16614.
- S. Ken-Iti, “Basic results on lévy processes,” in Lévy processes: theory and applications, O. E. Barndorff-Nielsen, T. Mikosch, and S. I. Resnick, Eds. New York, NY: Springer Science & Business Media, 2001, pp. 1–37.
- P. Tankov, “Financial modeling with lévy processes: Lecture notes,” 2010, available online: https://cel.hal.science/cel-00665021v1 Last accessed: 2025-02-02.
- A. H. Nzokem and D. Maposa, “Bitcoin versus s&p 500 index: Return and risk analysis,” Mathematical and Computational Applications, vol. 29, no. 3, 2024. [Online]. Available: https://www.mdpi.com/2297-8747/29/3/44.
- A. Nzokem and D. Maposa, “Fitting the seven-parameter generalized tempered stable distribution to financial data,” Journal of Risk and Financial Management, vol. 17, no. 12, 2024. [Online]. Available: https://www.mdpi.com/1911-8074/17/12/531.
- A. H. Nzokem, “Fitting infinitely divisible distribution: Case of gamma-variance model,” e-prints ArXiv:2104.07580, 2021. [Online]. Available: https://arxiv.org/abs/2104.07580.
- J. Rosiński, “Series representations of lévy processes from the perspective of point processes,” in Lévy processes: theory and applications. Springer, 2001, pp. 401–415.
- D. Ivanenko, V. Knopova, and D. Platonov, “On approximation of some lévy processes,” Austrian Journal of Statistics, vol. 54, no. 1, pp. 177–199, 2025.
- O. Kallenberg and O. Kallenberg, Foundations of modern probability. Springer, 1997, vol. 2.
- T. S. Ferguson and M. J. Klass, “A representation of independent increment processes without gaussian components,” The Annals of Mathematical Statistics, vol. 43, no. 5, pp. 1634–1643, 1972.
- A. H. Nzokem, “Numerical solution of a gamma - integral equation using a higher order composite newton-cotes formulas,” Journal of Physics: Conference Series, vol. 2084, no. 1, p. 012019, 2021.
- A. H. Nzokem, “Stochastic and renewal methods applied to epidemic models,” Ph.D. dissertation, York University, YorkSpace institutional repository, 2020.
- A. Nzokem, “Enhanced the fast fractional fourier transform (frft) scheme using the closed newton-cotes rules,” e-prints, ArXiv:2311.16379, 2023. [Online]. Available: https://arxiv.org/abs/2311.16379.
- A. H. Nzokem, “European option pricing under generalized tempered stable process: Empirical analysis,” e-prints ArXiv:2304.06060, 2023. [Online]. Available: https://arxiv.org/abs/2311.16379.
- A. Nzokem and V. Montshiwa, “The ornstein–uhlenbeck process and variance gamma process: Parameter estimation and simulations,” Thai Journal of Mathematics, pp. 160–168, Sep. 2023. [Online]. Available: https://thaijmath2.in.cmu.ac.th/index.php/thaijmath/article/view/1477.
- A. H. Nzokem, “Five-parameter variance-gamma process: Lévy versus probability density,” AIP Conference Proceedings, vol. 3005, no. 1, p. 020030, 12 2024.
- A. H. Nzokem, “Pricing european options under stochastic volatility models: Case of five-parameter variance-gamma process,” Journal of Risk and Financial Management, vol. 16, no. 1, 2023.
- A. H. Nzokem, “Gamma variance model: Fractional fourier transform (FRFT),” Journal of Physics: Conference Series, vol. 2090, no. 1, p. 012094, 2021. [Online]. Available. [CrossRef]
- J. Rosiński, “Tempering stable processes,” Stochastic Processes and their Applications, vol. 117, no. 6, pp. 677–707, 2007.
- J. Rosiński, “Tempered stable processes,” in Proceedings of the Second MaPhySto Conference on Lévy Processes: Theory and Applications, ser. MaPhySto Misc. Publ., E. B.-N. O. Ed., vol. 22, Aarhus, Denmark, 01 2002, pp. 215–220, http://www.maphysto.dk/publications/MPS-misc/2002/22.pdf.
- A. Loy, L. Follett, and H. H. and, “Variations of q–q plots: The power of our eyes!” The American Statistician, vol. 70, no. 2, pp. 202–214, 2016.
- M. C. Wang and B. J. Bushman, “Using the normal quantile plot to explore meta-analytic data sets.” Psychological Methods, vol. 3, no. 1, p. 46, 1998.
- H. Thode, Testing For Normality, ser. Statistics, textbooks and monographs. New York: CRC Press, 2002, vol. 164. [Online]. Available: https://books.google.com/books?id=gbegXB4SdosC.
Figure 1.
Bitcoin return sample simulation
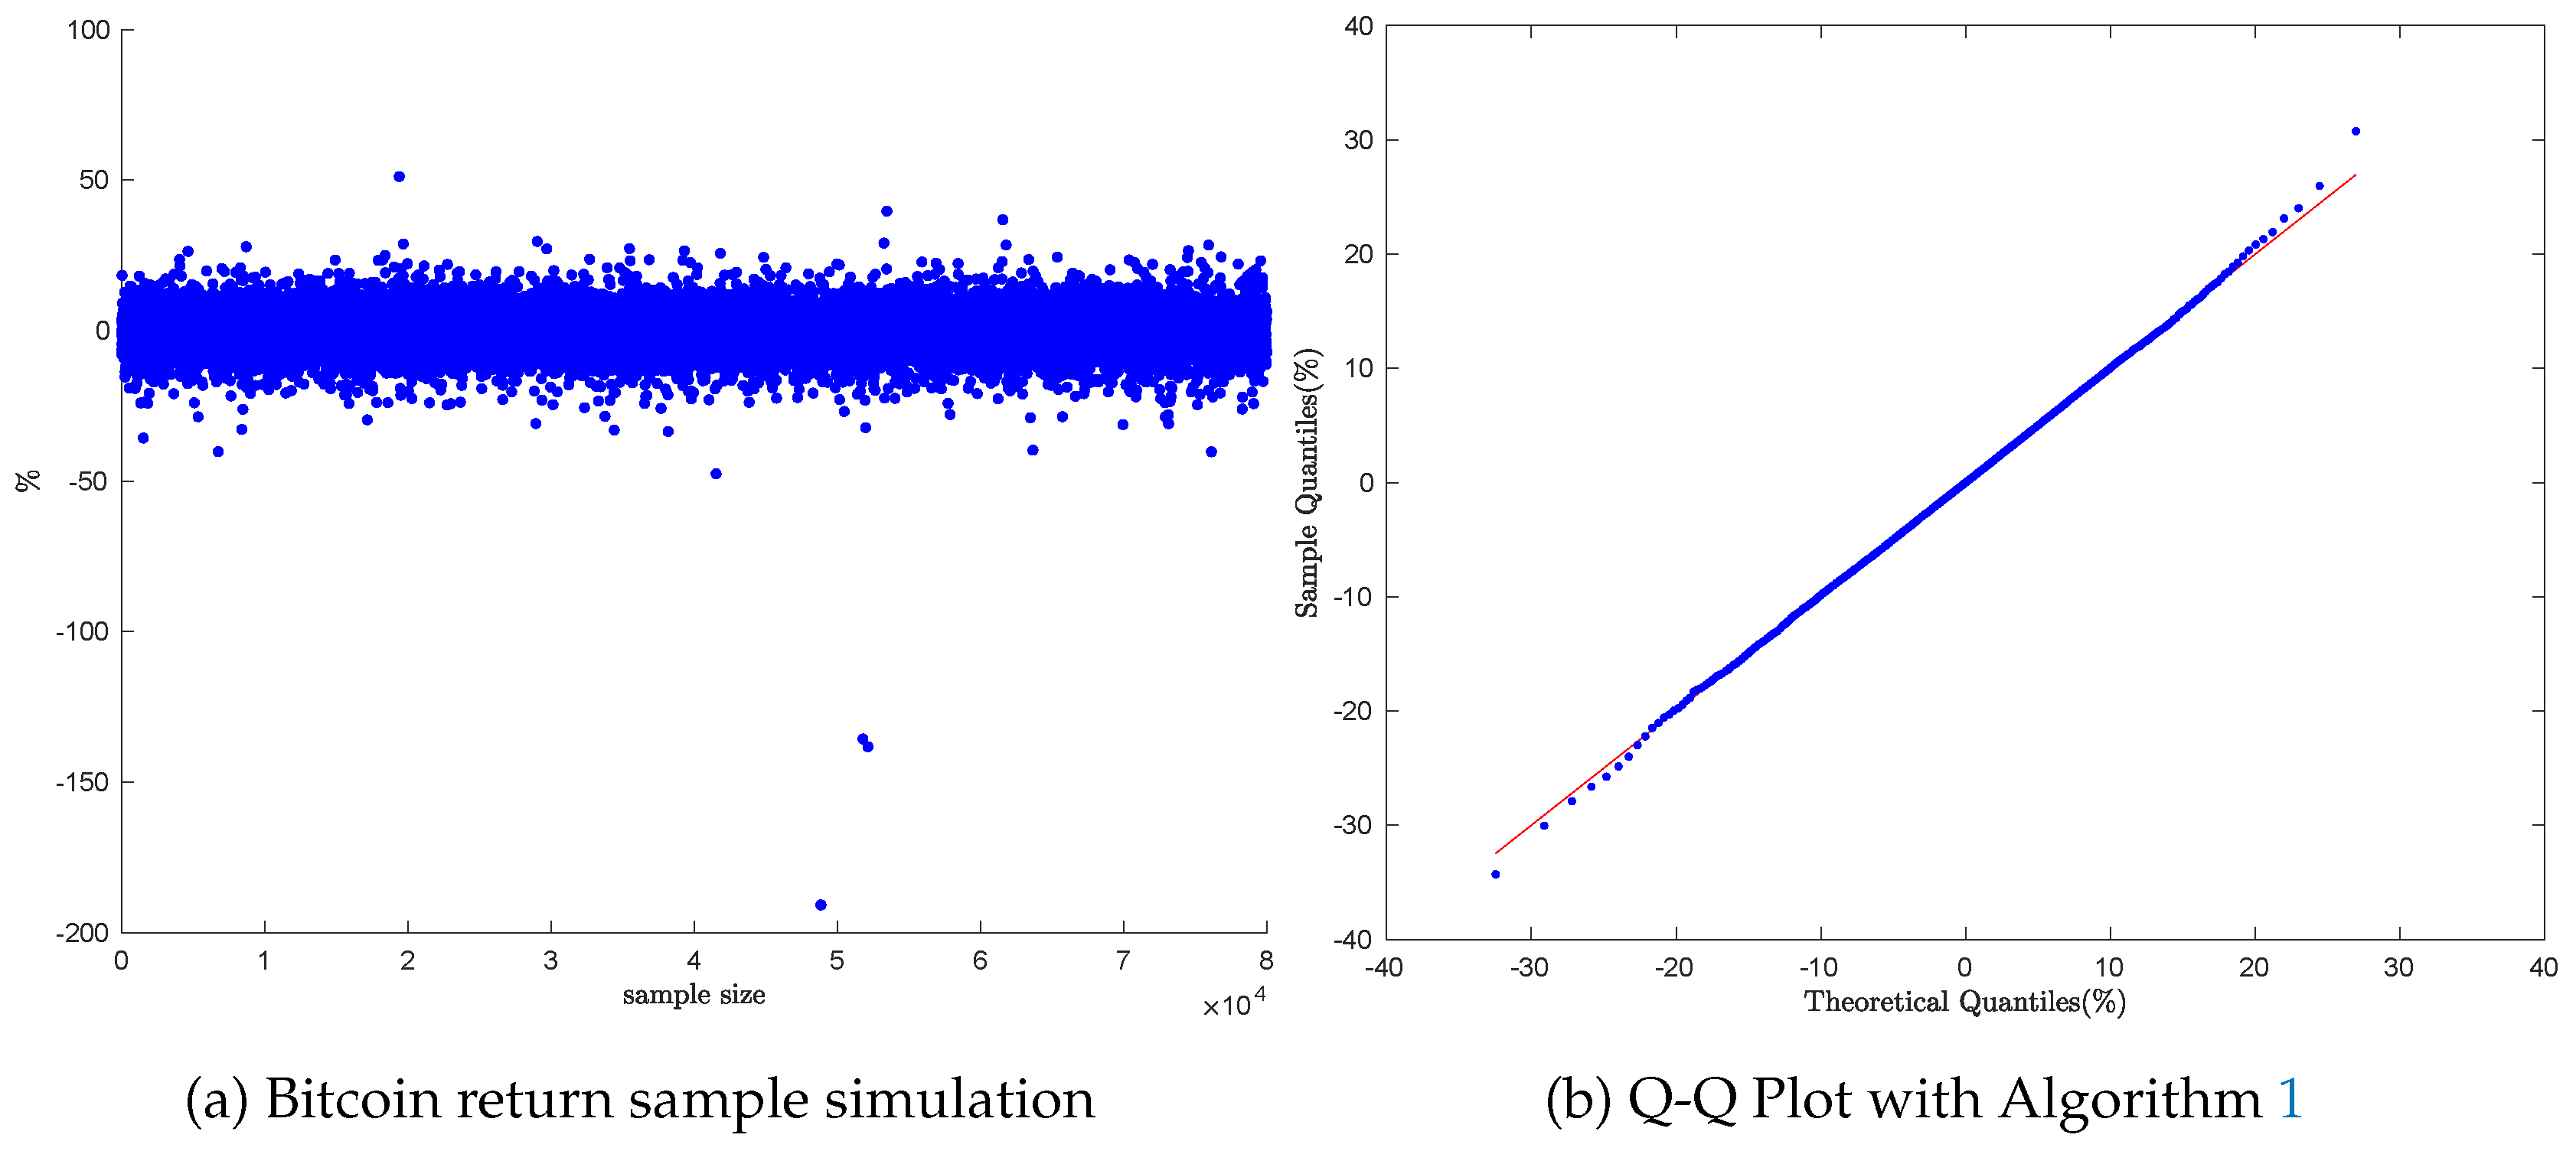
Figure 2.
Ethereum return sample simulation

Figure 3.
Bitcoin return simulation

Figure 4.
Ethereum return simulation
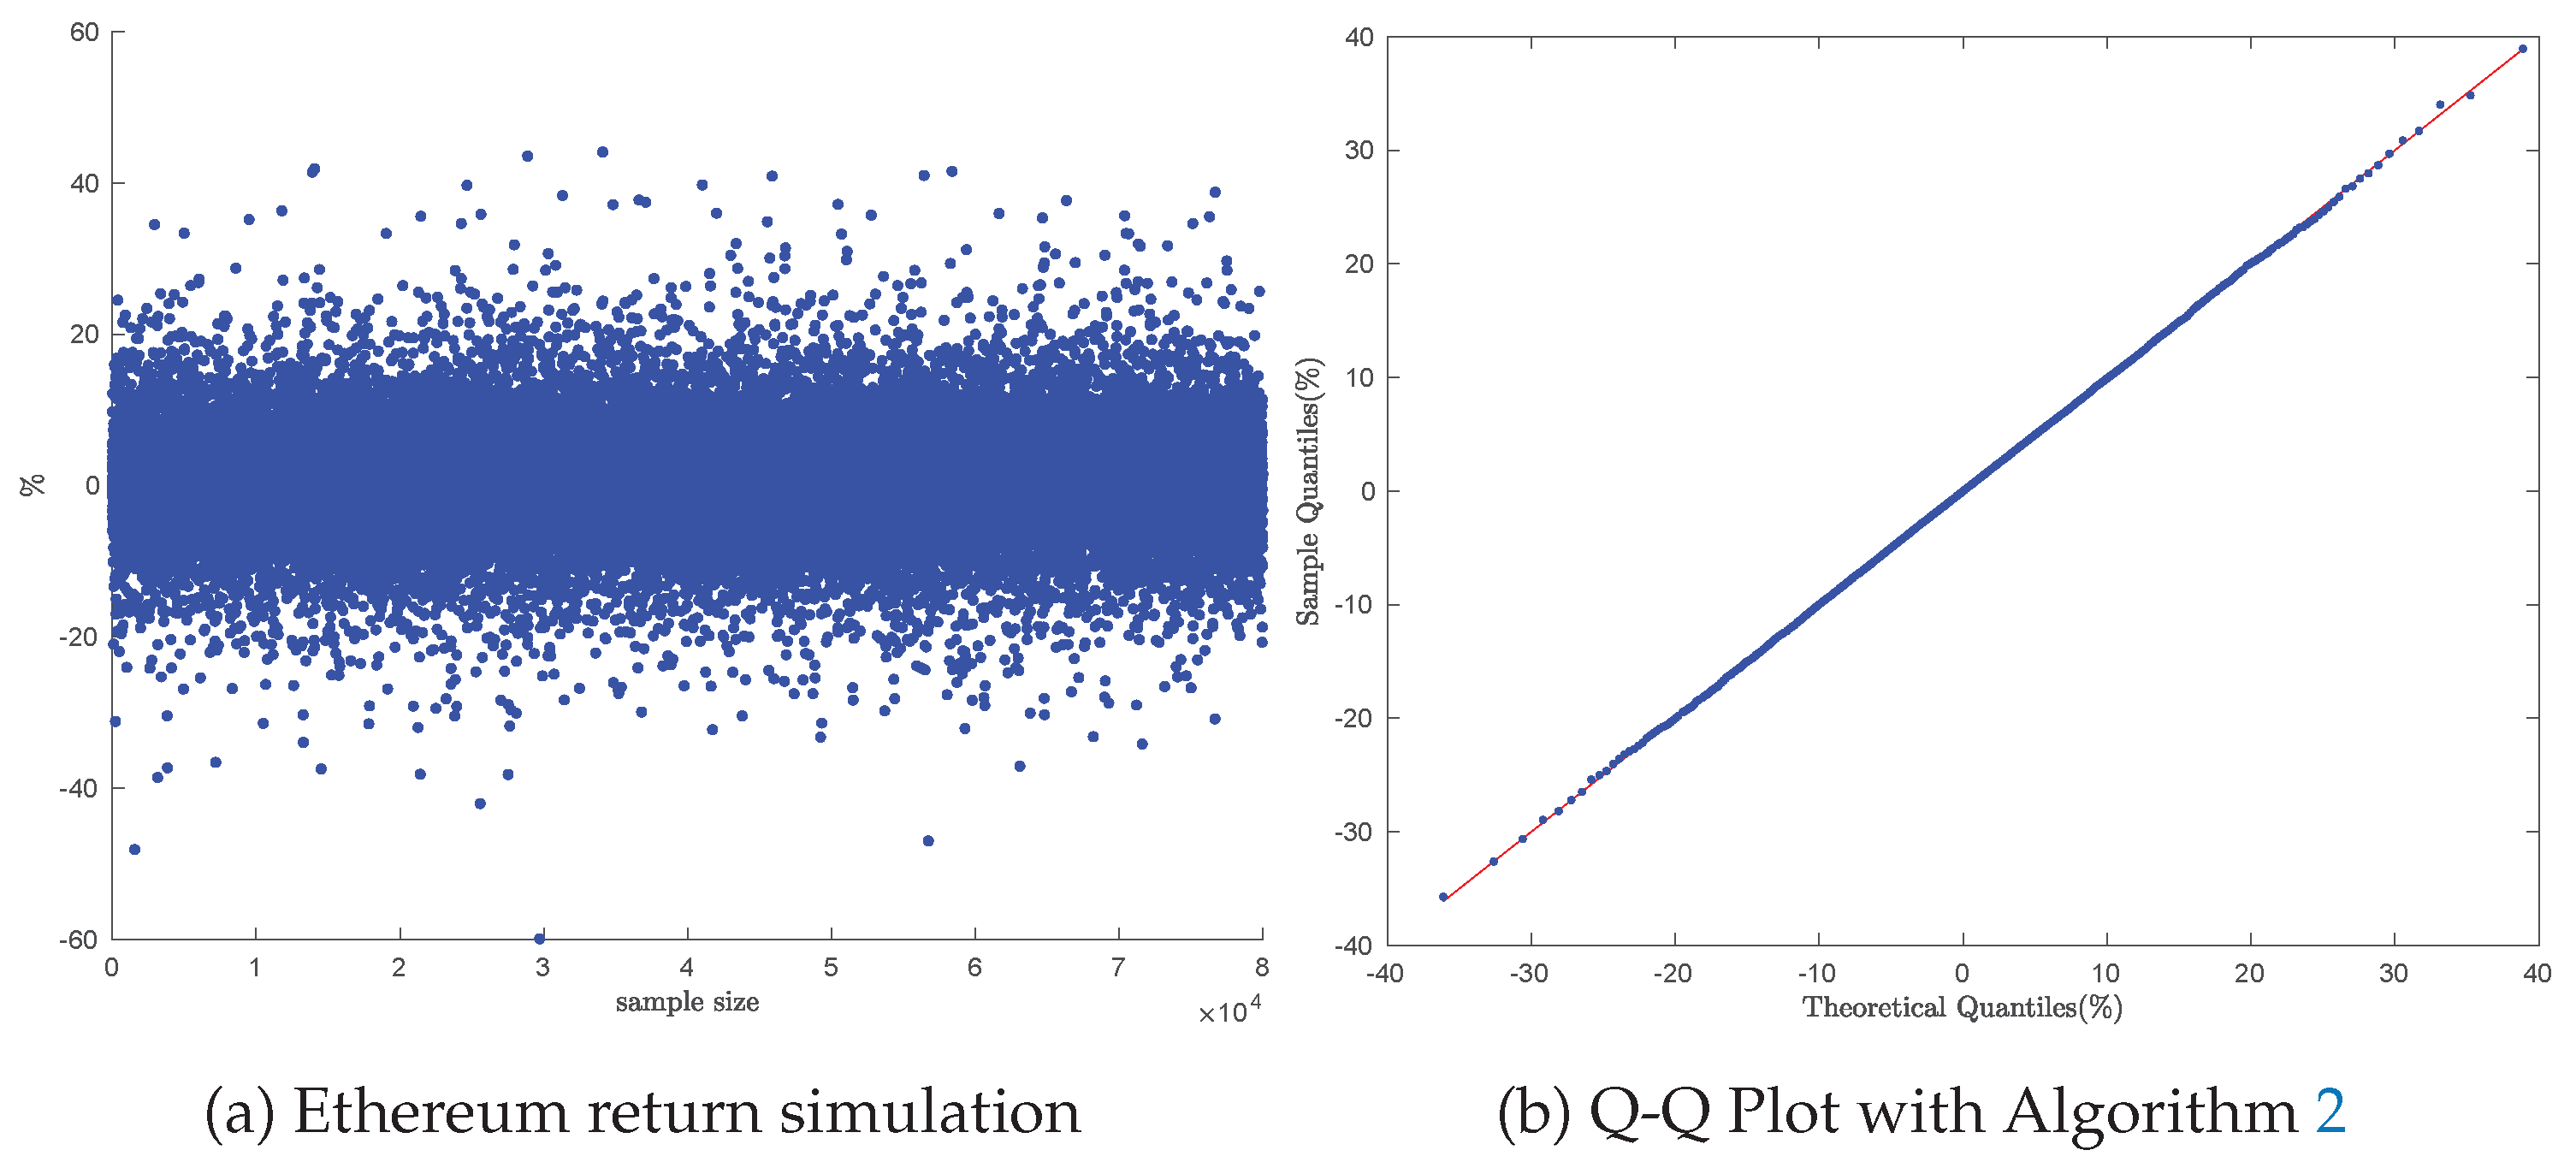

Table 1.
GTS Parameter Estimation for Bitcoin
| Model | Parameter | Estimate | Std Err | |
|---|---|---|---|---|
| GTS | -0.121571 | (0.375) | ||
| 0.315548 | (0.136) | |||
| 0.406563 | (0.117) | |||
| 0.747714 | (0.047) | |||
| 0.544565 | (0.037) | |||
| 0.246530 | (0.036) | |||
| 0.174772 | (0.026) |
Table 2.
GTS Parameter Estimation for Ethereum
| Model | Param | Estimate | Std Err | |
|---|---|---|---|---|
| GTS | -0.4854 | (1.008) | ||
| 0.3904 | (0.164) | |||
| 0.4045 | (0.210) | |||
| 0.9582 | (0.106) | |||
| 0.8005 | (0.110) | |||
| 0.1667 | (0.029) | |||
| 0.1708 | (0.036) |
Disclaimer/Publisher’s Note: The statements, opinions and data contained in all publications are solely those of the individual author(s) and contributor(s) and not of MDPI and/or the editor(s). MDPI and/or the editor(s) disclaim responsibility for any injury to people or property resulting from any ideas, methods, instructions or products referred to in the content. |
© 2025 by the author. Licensee MDPI, Basel, Switzerland. This article is an open access article distributed under the terms and conditions of the Creative Commons Attribution (CC BY) license (https://creativecommons.org/licenses/by/4.0/).
Copyright: This open access article is published under a Creative Commons CC BY 4.0 license, which permit the free download, distribution, and reuse, provided that the author and preprint are cited in any reuse.


