Submitted:
01 August 2025
Posted:
06 August 2025
Read the latest preprint version here
Abstract
Smartphone overdependence among South Korean adolescents, affecting nearly 40%, poses a growing public health concern, with usage patterns varying by regional context. Leveraging conceptually informed AI/ML models, this study (1) develops a high-performing, low-risk screening tool to monitor disease burden, (2) leverages AI/ML to explore psychologically meaningful constructs, and (3) provides place-based policy implication profiles to inform public health policy. Using data from 1,873 adolescents in the 2023 Smartphone Overdependence Survey, we conceptually selected 131 features across 12 identified constructs. A nested modeling approach identified a low-risk screening tool using 59 features that achieved strong predictive accuracy (AUC = 81.5%), with smartphone use case features contributing approximately 20% to performance. Construct-specific models confirmed the importance of Smartphone Use Cases, Perceived Digital Competence & Risk, and Consequences & Dependence (AUC range: 80.6%–89.1%) and uncovered cognitive patterns warranting further study. Place-stratified analysis revealed substantial regional variation in model performance (AUC range: 71.4%–91.1%) and distinct local feature effects. Overall, this study demonstrated the value of integrating conceptual frameworks with AI/ML to detect adolescent smartphone overdependence, offering novel approaches to monitoring disease burden, advancing construct-level insights, and providing targeted, place-based public health policy recommendations within the South Korean context.
Keywords:
smartphone overdependence
; adolescents
; conceptually informed modeling
; artificial intelligence (AI)
; machine learning (ML)
; low-risk screening tools
; construct-level analysis
; explainable AI (XAI)
; urbanicity / place-based analysis
; South Korea
1. Introduction
Smartphone overdependency among adolescents in South Korea has become a critical public health issue, with over 98% of youth owning smartphones and engaging in unprecedented screen time levels [1]. The prevalence rate among Korean adolescents, ranging from 37% to 40%, is the highest among all age groups [2,3]. This raises concerns due to its strong associations with mental health issues, negative emotions, suicidal ideation, and substance use [4,5,6]. Excessive smartphone use is linked to psychological problems such as depression, anxiety, OCD, and ADHD, as well as elevated stress and loneliness [7]. Furthermore, a recent meta-analysis found that smartphone overdependence negatively affects academic achievement among adolescents and young adults [8].
In response, policies have emphasized early identification and intervention, with schools playing a central role in risk assessment [9]. These policies reflect global trends recognizing the impact of smartphones on educational settings. For instance, in France, using a smartphone in class is prohibited for students who are under 15 years old [10]. In the United States, at least 18 states have enacted laws or policies banning or restricting student smartphone use during the school day in K–12 settings [11]. In Korea, schools utilize structured self-report screening tools to classify students by risk level and deliver interventions, including psychological counseling, parental education, and behavioral therapy. These efforts reflect a coordinated public health strategy that integrates educational institutions, mental health services, and family support systems to address youth risk in a comprehensive manner. However, this traditional approach relies heavily on lengthy structured self-report surveys, requiring multiple reporters and asking psychologically intrusive items to determine intervention needs. These embedded survey concerns have been discussed in a large body of research.
First, the reliance on invasive psychological questions that probe deeply into adolescents’ emotional and private experiences can be problematic. Items commonly ask whether students feel hopeless without their phones, experience declines in academic performance, or feel depressed after extended smartphone use [3]. While these items aim to identify risk, their intrusive nature, particularly those involving hopelessness or depressive symptoms, may raise ethical concerns when used at scale in educational settings. Such invasiveness may be particularly distressing for adolescents, who may have a more limited capacity to tolerate the emotional stress associated with self-reflection on sensitive topics compared to adults. As a result, questions that may appear relatively benign to adults can feel psychologically intrusive to adolescents, potentially triggering anxiety, embarrassment, or emotional discomfort. According to the literature, intrusive surveys are associated with increased response bias, reduced accuracy, and, in some cases, participant disengagement [12], particularly among youth concerned about privacy or stigma [13,14]. According to major ethical guidelines such as the Belmont Report, researchers are obligated to respect the dignity and welfare of participants and adhere to the principle of beneficence, which emphasizes “doing no harm, maximizing possible benefits, and minimizing potential risks” [15]. Similarly, Standard 3.04 of the APA Code of Ethics [16] states that psychologists must avoid causing harm to research participants and minimize unavoidable potential harm. Hasking et al. [17] found that 15% of adolescents with poorer psychological functioning than their peers reported feeling upset during survey completion, and experienced a decline in psychosocial functioning afterward. This suggests that particular attention must be paid to the potential for emotional distress among at-risk youth in their smartphone related problems when designing and administering surveys.
Given these concerns, predictive modeling using artificial intelligence and machine learning (AI/ML) has recently gained attention as a promising alternative. AI/ML technologies are already well-established across various domains for enabling precise classification and prediction [18]. In the context of public health and mental health, they are increasingly recognized for their potential to serve as efficient and sensitive screening tools [19]. Unlike traditional approaches that rely on lengthy and often intrusive questionnaires, AI/ML models can identify high-risk individuals with high performance and potentially reduce the number of indicators needed. Kim et al. [20] reported a precision of 87.60% when predicting adolescent smartphone overdependence from full-length surveys across five years of data, while Lee and Kim [21] used a small set of loggable smartphone-related variables yielding high performance when stratifying by age groups between 3 to 69 years old. International studies further validate this approach, showing that models built on psychological and demographic variables can accurately predict smartphone overdependency, offering alternatives to conventional assessments [22,23]. However, to the best of our knowledge, no prior study has developed a low-dimensional (i.e., minimal input) AI/ML model to predict smartphone overdependence specifically among adolescents. Furthermore, no existing models have explicitly utilized conceptually informed feature selection or been designed with the goal of minimizing psychological discomfort and ethical risk in assessment.
A second concern in current assessments is the insufficient attention to contextual factors such as region or urbanicity, despite emerging evidence that this context significantly shapes smartphone usage patterns. For instance, Sapienza et al. [24] explored the impact of urbanicity on smartphone use among approximately 500,000 users across 22 countries. The result shows that urban residents spend more time on their smartphones overall compared to rural users. Specifically, rural users dedicate proportionally more time to entertainment activities like gaming and social media, while urban users favor utility applications such as navigation, business, and productivity tools. The researchers suggest these patterns reflect environmental differences where rural users may turn to smartphones for entertainment due to limited physical recreation options, while urban users employ them as tools to navigate complex city environments. A study in Bangladesh shows that the overall prevalence of smartphone addiction is higher among preschoolers in urban areas than rural ones. One of the characteristics of urbanicity, high population density, has been shown to influence smartphone addiction among Koreans [25]. On the other hand, research in China found that adolescents in rural areas showed higher levels of smartphone addiction compared to their urban counterparts, driven by heightened feelings of loneliness and anxiety when not using smartphones [26,27]. These differences suggest that the relationship between adolescents’ smartphone use and risk for overdependency may vary depending on urbanicity and regional contexts. Nevertheless, to our knowledge, no AI/ML-based models in smartphone overdependency are developed or evaluated with sufficient attention to urbanicity and regional contexts. This limits their ability to deliver place-sensitive predictions and policy implications.
Given these gaps, researchers have called for a shift toward predictive models that are not only accurate but are also ethically informed and sensitive to local variation. Such models should incorporate minimal yet high-yield features, reducing respondent burden while maintaining predictive power. Specifically, these predictors should strategically combine indicators and non-intrusive data to enhance predictive efficiency and ethical soundness. In addition, conceptually chosen predictors are crucial to not only improve interpretability but also ensure generalizability across different populations [28]. Additionally, carefully selected predictors reduce computational costs and data collection burdens, facilitating more sustainable and accessible implementations of predictive tools in real-world settings [29]. By combining these techniques with place-stratified eXplainability [30,31] evaluations, AI/ML-based models can effectively address public health imperatives to deliver tailored interventions while minimizing risk and burden.
1.1. Research Aims & Contributions
This study aims to advance the understanding, detection, and policy implications of adolescent smartphone overdependence in South Korea through the integration of conceptual frameworks and AI/ML methods. Grounded in public health and social sciences, we outline three aims:
- 1.
- Develop a high-performing, low-risk screening tool to detect adolescents at risk for smartphone overdependence using conceptually informed AI/ML modeling;
- 2.
- Leverage AI/ML toward construct exploration of contributing factors; and
- 3.
- Provide place-based policy profiles that offer insights into local variation in risk factors and model performance, enabling targeted intervention.
The study contributes methodologically by introducing a framework that prioritizes conceptually meaningful constructs over purely data-driven feature sets. Practically, it informs the design of adolescent-friendly screeners aligned with ethical research principles. Conceptually, it shows how AI/ML can illuminate patterns in adolescent behavior that align with psychologically meaningful constructs, offering new directions for behavioral research. From a policy perspective, it advances place-sensitive approaches to digital well-being, providing insights that can support regionally adaptive public health interventions.
2. Materials and Methods
The following sections outline our data, approach to feature selection and grouping, and analyses.
2.1. Data
Secondary data, collected by the National Information Society Agency (NISA) in South Korea, was used. The full sample consisted of 22,844 household members who had used a smartphone within the past month and were present and available for the interview, which took place from September to November 2023. During the interview, each participant was asked approximately 192 questions covering demographic characteristics, smartphone usage, online video services, counseling and education, awareness of overdependency, and psychosocial characteristics. In the current study, we focused on a total of 1,873 adolescent participants aged 10-18 from the full sample.
2.2. Outcome
The outcome variable in this study is smartphone overdependence. NISA measured this by administering the validated Smartphone Overdependence Scale [32]. This scale has ten questions measuring three facets: 1) the level of difficulty in controlling smartphone use, 2) concentration disruption due to smartphone use, and 3) the incidence of health, academic, or interpersonal conflicts caused by smartphone use. The scale uses a 4-point Likert ranging from Strongly disagree (1) to Strongly agree (4). Based on total scores, adolescents are categorized as high-risk (≥31 points), potential risk (23–30 points), or no risk (<23 points). In our AI/ML models, we use the binary any-risk vs no-risk target as our label by combining the potential risk and high-risk groups. This is in line with our research aim to develop a low-risk screener for public health detection.
2.3. Conceptual Feature Selection & Construct Grouping
From the NISA survey, all individual items related to adolescents were considered candidates for inclusion. While the original NISA survey includes five broad domains (smartphone use, online video use, prevention and counseling, problem perception, and psychosocial characteristics), we regrouped items based on theoretical grounding. Two overarching domains (demographics and urbanicity) and ten theoretically grounded constructs were identified. Only items aligning with one of these domains or constructs were retained for analysis. This resulted in a total of 92 final items. After one-hot encoding, these 92 study items become 132 features.1 In Appendix A, Table A1 and Table A2 outline the 2 domains and 10 constructs, and their respective 132 features. Below, we define each construct and summarize its relevance to adolescent smartphone overdependence.
- 1.
- Intent to Seek Smartphone Education. This construct captures adolescents’ intention to engage in preventive education related to smartphone use [33]. Higher intention to seek education has been associated with reduced risk of overdependence.
- 2.
- Preventive Education Experiences. This reflects actual participation in educational or intervention programs designed to prevent smartphone addiction [34]. Although evidence for their effectiveness remains mixed, adolescents who have received such education often demonstrate greater awareness and are more likely to engage in help-seeking behaviors.
- 3.
- Smartphone Use Cases. This measures the frequency of engagement with different smartphone functions (e.g., gaming, video streaming, navigation) [35]. Entertainment and social networking applications, in particular, have been linked to increased overdependence due to their reward structures and habit-forming properties [36].
- 4.
- Home Environment. The home environment includes both physical and psychological aspects of the household context [37]. Prior studies have shown that conditions such as socioeconomic status, family structure, and parental support can shape adolescent behavior and potentially influence smartphone use [38,39].
- 5.
- Parental Prevention Efforts. Parental prevention efforts refer to the strategies parents use to manage and guide their children’s media use, including rule-setting, supervision, and open dialogue [40]. Active parental prevention efforts have been found to reduce risk for smartphone addiction, while overly restrictive or absent parenting may increase it [41,42].
- 6.
- 7.
- 8.
- Perceived Digital Competence & Risk. This construct refers to individuals’ perceived abilities to effectively navigate digital environments (e.g., digital content creation, privacy awareness) as well as their perceived smartphone issues (e.g., excessive use, difficulty controlling short-form video consumption). These perceptions may shape how individuals engage with digital technology and manage potential overdependence [47].
- 9.
- 10.
2.4. Artificial Intelligence/Machine Learning Models
This section describes our conceptual framework and development of AI/ML models, and then presents our evaluation methods. All analyses were conducted using Python version 3.10.13, with commonly used data science and machine learning libraries (e.g., scikit-learn, pandas, XGBoost, LightGBM). The codebase can be made available upon reasonable request to the corresponding author.
2.4.1. Conceptual Framework
We build various AI/ML models using two primary approaches: 1) nested modeling and 2) construct-based modeling. In the nested modeling, we begin with simple demographics and add sets of features one construct at a time. The sequence of nesting is based on the risk for psychological discomfort. In other words, we consider the ethical considerations with implementation-informed design. This conceptual approach was chosen to develop the low-risk screener. This would also identify the screener with the minimum features needed for high prediction accuracy. Next, we take a construct-based modeling approach to identify which construct feature sets have the most predictive power and examine the feature importance within. This provides a conceptual approach toward the construct exploration of contributing factors leveraging AI/ML.
2.4.2. AI/ML Classification Modeling
To examine smartphone overdependency among adolescents, we developed classification models to predict our binary outcome of any risk for adolescent smartphone overdependency. Here we discuss our data processing and AI/ML procedures.
Data Processing
Our dataset comprises of numerical and categorical variables. First, we one-hot encode the categorical variables in our dataset. To standardize our data, we then train a scalar on our training set using the StandardScalar function from the scikit-learn library [51]. This resulting scalar is then applied to the test set to prevent data leakage.
AI/ML Procedures
We applied widely used high-performing algorithms to maximize classification performance. They include logistic regression (LogReg), decision trees (DT), random forest (RF), extreme gradient boosting (XGBoost), multi-layer perceptron (MLP), and light gradient-boosting machine (LightGBM) [52,53,54,55,56]. We then split the data into an 80/20 training and out-of-sample test sets. The training set had 1,498 adolescents, and the test set had 375 adolescents, which were held constant across algorithms and all experiments. We use 5-fold cross-validation, nested within the training set, for hyperparameter tuning and out-of-sample testing for final performance evaluation. We tune hyperparameters specific to each algorithm using Optuna (an automatic hyperparameter optimization framework) with 50 iterations to minimize mean logarithmic loss across the 5-fold cross-validation (mean val loss) [57]. For MLP and gradient boosting algorithms, we utilize early stopping to prevent overfitting. We report the search spaces and hyperparameters for our reported models in Appendix B. In the final testing, model performance was assessed using three metrics: mean val loss, test loss, and the out-of-sample area under the receiver operating characteristic curve (AUC). The consistency between mean val loss and test loss was used to assess model generalizability, while the out-of-sample AUC was employed to evaluate the model’s ability to discriminate between classes on unseen data [58,59].
2.4.3. eXplainable AI (XAI) Techniques
We apply XAI techniques to improve the interpretability of the model by identifying features that meaningfully contribute to its predictions [30,31]. This ensures transparency and interpretability of our classification models for predicting adolescent smartphone overdependency. We use two XAI tools, Shapley Additive exPlanations (SHAP) and Partial Dependence Plots (PDPs) [60,61].
SHAP assess both global (mean feature impact) and local (instance-specific) contributions of each predictor, clarifying how features influence predictions [61]. Additionally, we employed PDPs to analyze key nonlinearities, inflection points, and interaction thresholds in predictor-outcome relationships [62]. Section 3 presents SHAP beeswarm plots and PDPs to illustrate SHAP value distributions and the functional effects of high-impact predictors. We compute SHAP values to quantify and examine the rank and directionality of features, providing insights into how predictors influence predictions. We generate PDPs to visualize global marginal effects on the average prediction, providing insights into nonlinear relationships and slope inflection points.
2.4.4. Place-Stratified Predictive Analysis
We conduct a place-stratified predictive analysis by evaluating the performance of our AI/ML models on sample subsets stratified by urbanicity: 1) Metropolitan City, 2) Medium or Small City, and 3) Town or Rural District. Group comparisons found 31 significant differences by urbanicity out of 128 one-hot encoded features (Table 1). This may lead to nationally trained models missing key place-based nuances or inconsistent performance. Using our out-of-sample test set and stratifying the predictions by urbanicity, we recalculate the AUCs, SHAP, and PDPs only for those sample subsets and examine differences in feature importance and trends (see Table A4-Table A6 in Appendix C for group comparisons across all study variables). We use these insights to provide place-based policy profiles in Section 4.1.
3. Results
The following sections present the results the sample descriptive results, an overview of AI/ML results from each modeling approach (nested and construct-based), and further explore four exemplar models.
3.1. Sample Descriptive
A total of 1,873 adolescents aged 18 years or younger were included in the analysis, with 1,498 in the training set and 375 in the test set. No significant group differences between the training and test sets were observed in any of the study variables (see Appendix Table A9-Table A13 for detailed analysis).
Within the total sample, the mean age was 14.34 years (SD = 2.40), and 51.9% of participants were female. 44.4% of participants residing in Metropolitan Cities, 38.1% in Medium/Small Cities, and 17.5% in Town/Rural Districts. A majority (71.8%) reported that both parents were working, while 7.8% lived in single-parent households and 0.7% identified as being from multicultural families i.e., having at least one foreign-born parent. About 21.8% lived in single-family homes, while the remainder resided in apartments or other multi-unit dwellings. The average monthly household income was 4.25 million KRW (SD = 1.12; approximately 3,100 USD).
3.2. Overview of AI/ML Results
The following sections present the AI/ML results from the nested and construct-based modeling frameworks.
Performance Comparison for Nested AI/ML Classifiers
In the nested framework, 12 nested AI/ML classifiers were trained. Overall, the results show generalizability across training and test sets with consistent mean val loss and test loss of each nested classifier. The baseline model (M0 [Demographics]) performed at chance (AUC = 0.51), and M1 (+Urbanicity) modestly improved performance (AUC = 0.57). Adding a single intent to seek smartphone education item in M2 increased the AUC to 0.63, but further smartphone prevention education-related features in M3 did not yield gains. A substantial improvement emerged in M4 (+Smartphone Use Cases), which added behavioral features related to smartphone use. This model achieved an AUC of 0.81, an 18-point increase, indicating it as a “good test" [58]. We identify the M4 (+Smartphone Use Cases) as our low-risk screener as it offers high performance while using low-burden, non-intrusive features and requires no psychological assessments.
Subsequent models added features related to social context (M5–M7), self-regulation (M8), and perceived digital competence & risk (M9), leading to incremental improvements. The highest performance was observed in M11 (+Consequences & Dependence), which reached an AUC of 0.92 and qualifies as an “excellent test" [58]. However, the inclusion of psychologically sensitive content and longer assessments makes later models less suitable for early-stage or population-level screening for public health surveillance goals. The strength of the M4 (+Smartphone Use Cases) model lies in its balance between predictive power and feasibility (see Table A14 in Appendix D for more details).
Performance Comparison Between Construct-Based AI/ML Classifiers
In our construct-based modeling framework, we train 12 individual, construct-specific AI/ML classifiers. Overall, we find stable performances between the mean val loss and the test loss, indicating generalizability. Three constructs – Smartphone Consequences & Dependence (Smart CD), Perceived Digital Competence & Risk (Perceived DCR), and Smartphone Use Cases (Use Case) – achieve high performances, indicating a “good test” while all others indicate “poor tests” [58]. Notably, we find that the Parental Prevention Efforts and constructs related to smartphone education result in “poor tests” despite qualitatively being related to smartphone overdependence.
3.3. Four Exemplar Models
We present four exemplar models: 1) the M4 (+Smartphone Use Cases) nested model, 2) the Smartphone Consequences & Dependence (Smart CD) construct-based model, 3) the Perceived Digital Competence & Risk (Perceived DCR) construct-based model, and 4) the Smartphone Use Cases (Use Case) construct-based model. For each model, we present the mean val loss, test loss, and AUC (see Table 2 and Figure 1). Next, using XAI techniques, we examine the feature importance across models (see Figure 2 and PDP plots below). We then present the place-stratified results regarding each model’s performance (see Table 3) and relative SHAP feature importance (see Figure 3).
3.3.1. M4 (+Smartphone Use Cases) Nested Model
Of the 12 nested classifiers, the M4 (+Smartphone Use Cases) model is the best candidate for a low-risk screener with detection and public health surveillance goals in mind. This model is parsimonious, using 59/131 features, and balances the tradeoff between high-performance (AUC=0.81; Figure 1) and minimizing psychological discomfort. The majority of the predictive power comes from the adolescent’s behavioral use cases of their smartphone requiring no psychological reflection, assessment, or discomfort. These features added a substantial improvement of 18 percentage points, going from an AUC of 0.63 in M3 to 0.81 in M4, achieving a “good test” designation [58]. In addition, this model shows good generalizability across training and test sets with stable mean val loss (0.58) and test loss (0.55) scores.
Feature Importance
The SHAP beeswarm plot for M4 (+Smartphone Use Cases) is presented in Figure 2, subplot (a). Overall, higher endorsement of these features predicted a higher likelihood of being at risk for smartphone overdependency. Some notable nuances are that "Edu Intent" (3-point Likert) was the most important and appears to have a thresholding effect, where only high endorsement (red) led to a higher likelihood of smartphone overdependency. In the PDP, this results in only the endorsement of 3 being associated with a likelihood of overdependency (Figure 4, subplot A.). In contrast, the "Gaming" (8-point Likert) and "Short Form Video Usage Portion" (4-point Likert) features indicate a clear positive relationship where higher endorsement (red) is associated with a higher likelihood of overdependency. The PDPs for both features show a linear trend (Figure 4, subplot B. and subplot C.). The PDPs also revealed a notable nonlinear trend in the marginal effect of "Phone Use Case - Navigation" (7-point Likert), where extreme low (0-1) and high (4-6) levels of endorsement led to a higher likelihood of overdependency while only medium (2-3) levels of endorsement led to a lower likelihood (Figure 4, subplot D.). This may be due to the integral use of smartphones for navigation, where not using it at all is out of the norm and may indicate overuse of other use cases, while overuse would increase reliance and dependency on one’s smartphone (See Appendix E for all other PDPs).
Place-Stratified Results
Place-stratified analyses revealed that Metropolitan City adolescents have the highest performance, with an AUC of 0.87 (compared to 0.81 in the National performance; Table 3). In contrast, the performance among Medium/Small City adolescents is the lowest, with an AUC of 0.75, which would only indicate a “fair test” [58]. Among Town/Rural District adolescents, the discriminative power remains about the same, with an AUC of 0.80.
Placed-Stratified Feature Importance
Place-stratified analysis of SHAP feature importance found that across all strata, "Edu Intent - Intent to Participate in Prevention Program", "Phone Use Case - Gaming", and "Phone Use Case Video - Short Form consistently ranked as the top three predictors of smartphone overdependency. "Phone Use Case - Navigation" ranked moderately across all regions, appearing between 7th and 8th in all strata, with no major fluctuations in relative importance. Additionally, “Phone Use Case-Online Learning” ranked higher in Metropolitan Cities (7th) compared to the National and Town/Rural District strata (both 9th), and was the lowest in Medium/Small Cities (10th). In Town/Rural Districts, "Phone Use Case - Webtoon" was ranked 4th—one position higher than in other regions—exceeding "Phone Use Case - Selling Goods and Services”, which ranked 5th. Overall, the place-stratified results show strong consistency in the top-ranked predictors, with minor differences in mid- and lower-ranked features by regional context.
3.3.2. Smartphone Consequences & Dependence Classifier Results
The Smart CD model had the highest performance across all construct-based models with an AUC of 0.89. However, this construct asks adolescents to do the highest degree of intrusive reflection specific to their potential problems and dependency issues related to their smartphone use. Therefore, it is not surprising that it is the most predictive, but it also carries the largest potential for psychological discomfort.
Feature Importance
The SHAP beeswarm plot for the Smart CD model is presented in Figure 2, subplot (b). We find that consequences are more predictive than the dependence on smartphones for "Stress Relief". PDPs revealed three patterns of marginal effects: 1) linear, step-wise increase, 2) thresholding effect, and 3) binary effect. "Social Isolation" (3-point Likert) followed the linear, step-wise increase. "Physical Effects" (4-point Likert) and "Depression" (4-point Likert) followed the thresholding effect, where there was an initial increase in predicted probability of overdependence that later flattens out. "Stress Relief" (4-point Likert), "Low Battery Nervousness" (4-point Likert), "Sleep Issues" (4-point Likert), and "Periodic Check Nervousness" (4-point Likert) followed the binary effect. Figure 5 shows examples of each pattern (See Appendix F for all other PDPs).
Place-Stratified Results
The Smart CD model performance between the National and stratified by urbanicity samples are presented in Table 3. The results show that the performance among Metropolitan City adolescents is the highest with an AUC of 0.91, indicating an “excellent test” [58]. Both the performances among Medium/Small City and Town/Rural District adolescents are the same, with an AUC of 0.87, performing slightly worse than the National model but still in the “good test” range [58].
Placed-Stratified Feature Importance
Place-stratified analysis of SHAP feature importance found that across all strata—National, Metropolitan City, Medium/Small City, and Town/Rural District— "Low Battery Nervousness", "Physical Effects", and "Periodic Check Nervousness" consistently appeared as the top contributors to the predicted probability of smartphone overdependence. In the Metropolitan City stratum, "Physical Effects" was the most important feature, followed by "Low Battery Nervousness" and "Periodic Check Nervousness". This ordering differs from the overall National model, where "Physical Effects" ranked slightly lower. In the Medium/Small City stratum, the top-ranked features mirrored those of the National sample, with "Low Battery Nervousness" and "Physical Effects" leading in importance. In the Town/Rural District stratum, "Low Battery Nervousness" and "Physical Effects" again ranked highest. Notably, “Sleep Issues” appeared slightly more prominently in this group than in the others. Across all regions, all Smart CD features contributed positively to predicted overdependence when endorsed at higher levels. Feature rank order varied only slightly between strata, indicating overall stability in the predictor structure across places.
3.3.3. Perceived Digital Competence & Risk Classifier Results
Next, the Perceived DCR model achieves an AUC of 0.84 and asks questions regarding one’s self-perceptions rather than experienced harms.
Feature Importance
SHAP analysis revealed mixed results where higher endorsement (red) of perceived phone issues was often associated with a higher likelihood of overdependency and higher endorsement of perceived ability was often protective (Figure 2, subplot (c)). Several deviant cases are discussed. "Perceived Phone Issues - Short Form Video Usage Control Difficulty" (4-point Likert) revealed that moderate endorsement was more protective than low endorsement. This may reflect instances of denial in use control difficulties. "Perceived Ability - Assess Online Information Reliability" and "Perceived Ability - Online Privacy Awareness" were not protective, and higher endorsement (red) predicted higher likelihoods for overdependency, perhaps reflecting illusions of control and cognitive distortions. "Perceived Ability - Online Social Issue Engagement" and "Perceived Ability - Digital Content Creation" were also not protective and may reflect a higher reliance on smartphones for socialization and creativity. Three notable parabolic or higher-order trends emerged for the Perceived DCR model PDPs in their marginal effects: 1) a positive to negative curve, 2) a negative to positive curve, and 3) a positive to negative to positive curve, revealing complex cognitive patterns in smartphone overdependency. Figure 6 shows examples of each pattern (See Appendix G for all other PDPs).
Place-Stratified Results
The performance of the Perceived DCR model stratified by urbanicity is presented in Table 3. Across all strata, the performance remains in the “good test” range. Among Metropolitan City adolescents, the AUC is 0.85, while among both the Medium/Small City and Town/Rural District adolescents, the AUC is 0.83.
Placed-Stratified Feature Importance
Across all strata, three perceived phone issues consistently ranked highest: “Smartphone Overdependence”, “Excessive Smartphone Using Time”, and "Short Form Video Usage Control Difficulty". These self-perceived issues demonstrated stable predictive strength across Metropolitan and Medium/Small cities. In contrast, the Town/Rural District stratum showed slight reordering in feature importance. While “Smartphone Overdependence” and “Excessive Smartphone Using Time” remained top predictors, "Negative side effect on gaming" ranked higher than"Short Form Video Usage Control Difficulty", and "Perceived Ability - Online Social Issue Engagement" appeared more prominently. Specifically, "Online Social Issue Engagement" ranked 5th in the Rural/Town stratum (vs. 7th in others), and "Negative Side Effects on Messenger" ranked 6th (vs. 10th in others). Overall, while the top self-perceived dependence and usage difficulty features remained stable across regions, the Town/Rural District model showed relatively greater importance for social and emotional factors—such as issue engagement and messaging-related effects—while cognitive-evaluative skills and digital production activities showed relatively reduced predictive influence.
3.3.4. Smartphone Use Cases Results
The final “good test” classifier is the Use Case model with an AUC of 0.80, which only uses behavioral tracking related indicators. The Use Case model suggests potential in leveraging raw behavioral tracking data directly from smartphones.
Feature Importance
SHAP analysis revealed nuances in which types of smartphone use cases are predictive of overdependency (Figure 2, subplot (d)). 13 of the top 20 important use cases had a predominantly positive relationship, where higher endorsement (red) was associated with overdependency. The three most important features of this pattern were "Gaming", "Short Form Video Usage Portion", and "Webtoon". Four of the top 20 features had a predominantly negative relationship, where lower endorsement (blue) was associated with overdependency. The three most important features of this pattern were "Navigation", "News", and "Health". This may reflect a bifurcation where smartphone use cases for entertainment are more likely to predict overdependency, while use cases that capture a non-entertainment utility value are more protective. The Use Case PDPs generally supported the SHAP findings with minor nuances or thresholding effects across Likert responses, but still held overall positive or negative trends. Notably, the PDP of the "Navigation" (7-point Likert) feature was consistent with the nested M4 (+Smartphone Use Cases) model, where the same trend and cutoffs were found. Extreme low (0-1) and high (4-6) levels of endorsement led to a higher likelihood of overdependency while only medium (2-3) levels of endorsement led to a lower likelihood. This consistency across models supports the robustness of this feature’s relationship. Figure 7 shows examples and presents the "Navigation" PDPs (See Appendix H for all other PDPs).
Place-Stratified Results
The performance of the Use Case model stratified by urbanicity is presented in Table 3. These results show that among Metropolitan City adolescents, there is a substantial jump in performance with an increase of 8 percentage points for an AUC of 0.88. However, the performance substantially drops for the Medium/Small City adolescents with a decrease of 10 percentage points for an AUC of 0.70 falling into the “fair test” range [58]. The performance among Town/Rural Districts decreases marginally to 0.79 but falls from a “good test” to “fair test” [58].
Placed-Stratified Feature Importance
Across all strata, four features consistently emerged as top predictors: "Gaming", "Short-Form Video Usage Portion", "Webtoon", and "Navigation". "Gaming", "Short-Form Video Usage Portion", and "Webtoon" consistently showed strong positive contributions to predicted risk. "Navigation" was the only feature with a mixed effect, consistently ranked in the top but associated with slightly lower predicted risk at moderate levels of use. In the Metropolitan City stratum, "Gaming" ranked first, followed by "Navigation", "Webtoon", and "Short-Form Video Usage Portion". Phone use for "News" showed negative contributions to predictions in this stratum. Overall, behavioral features with immersive or compulsive qualities dominated. In the Medium/Small City stratum, "Navigation" and "Short-Form Video Usage Portion" were the top predictors, followed by "Gaming" and "Webtoon". Notably, "Listening to Music" ranked 10th only in this region, indicating that more passive forms of phone use may be more salient here. In the Town/Rural District stratum, the top four features mirrored those in the National sample. However, there was greater diversity in the top 10 features, including "Photography" (ranked 9th), which did not appear in other regions. This suggests that expressive and leisure-oriented smartphone behaviors play a more prominent role in rural contexts. Features like "Selling Goods & Services", "Online Learning", "Messenger", "Online Shopping", and "Scheduling" were present across all strata with moderate contributions, while "Listening to Music" appeared in all regions except Metropolitan cities, ranking the lowest in predictive strength but showing regional relevance.
4. Discussion
This study is the first to develop a high-performing, low-risk, AI/ML-based screener for adolescent smartphone overdependence in South Korea using conceptually informed modeling and a place-stratified analysis approach. By combining ethical considerations with conceptually-informed design, we identified a parsimonious screening model that balances predictive power with psychological safety. The M4 (+Smartphone Use Cases) model, leveraging only behavioral use data and demographic characteristics, achieved an AUC of 0.81 nationally, and 0.87 in Metropolitan Cities, comparable to more invasive models using psychological assessments. This confirms our working hypothesis that a minimal set of non-invasive indicators can yield strong predictive power.
These results align with prior literature emphasizing the importance of smartphone use patterns, particularly entertainment-related activities, in predicting overdependence [20,63]. Our XAI analyses provided further insight, showing that use cases like gaming and short-form video were strong predictors of risk, while utilitarian use cases such as navigation exhibited a nonlinear pattern, where both low and high engagement signaled higher risk. This thresholding and parabolic trend in use mirrors earlier findings in digital addiction and behavioral tracking, suggesting that moderate use may reflect healthy regulation, whereas extremes indicate dependency [24].
In parallel, our construct-based models expand on the potential of AI/ML conceptual exploration. Our models confirmed the theoretical relevance of both perception and consequence-based constructs. The Smartphone Consequences & Dependence model achieved the highest performance (AUC = 0.89), but its predictive strength likely reflects conceptual redundancy with the overdependence outcome itself. Many items in this construct directly assess perceived harm and experienced behavioral symptoms that closely mirror the criteria used to define smartphone overdependence, limiting their theoretical distinctiveness despite high classification accuracy.
In contrast, the Perceived Digital Competence & Risk model (AUC = 0.84) provides more meaningful theoretical insight. It aligns closely with cognitive-behavioral frameworks by examining how adolescents evaluate and perceive their own ability and issues with smartphone use. Features related to perceived control, awareness of usage patterns, and beliefs about digital competencies correspond to key mechanisms in models of behavioral addiction and cognitive distortions. The nonlinear and parabolic trends observed in this model’s PDPs suggest that adolescents’ cognitive self-perceptions are complex, potentially involving both denial and overconfidence—patterns well-documented in cognitive-behavioral theory [64]. Notably, some indicators, such as overconfidence in digital literacy, were associated with increased risk, perhaps reflecting distorted cognitions or rationalizations, which merit further psychological investigation. In the following section, we present place-based policy implication profiles based on our place-stratified analysis.
4.1. Place-Based Policy Implication Profiles
We identify tangible implications that can guide place-based policy responses across regional contexts for the prevention and intervention of smartphone overdependence among adolescents.
Metropolitan Cities
In metropolitan areas, adolescents at risk for smartphone overdependency exhibit significant engagement in immersive digital entertainment activities such as gaming and short-form video consumption. These activities frequently coincide with comparatively higher perceived digital competency and varied smartphone uses. Policy approaches in urban contexts should emphasize enhancing self-assessment of abilities and balancing screen engagement with offline activities rather than implementing broad restrictions. School-based initiatives can effectively incorporate media literacy components focused on self-monitoring techniques and healthy smartphone usage discussions among peers. Additionally, considering the high association between anxiety-driven behaviors and smartphone overdependence, integrating targeted mental health services within school systems to directly address compulsive smartphone use behaviors is recommended.
Medium & Small Cities
Adolescents residing in medium and small cities who are at risk of overdependency exhibit diverse smartphone use patterns, including practical applications such as online shopping, scheduling, and educational platforms. Nevertheless, compulsive use of smartphones, notably for stress relief, remains a relevant factor. Policy and interventions in these contexts should deliver contextually tailored educational programs that recognize and address entertainment-driven risks and the normalization of smartphone-based emotional coping strategies. Offering adolescents practical alternatives to smartphone-based coping by enhancing emotional literacy, digital citizenship education, and providing habit-tracking resources could effectively mitigate the risks associated with overdependence.
Towns & Rural Districts
In towns and rural areas, at-risk adolescents predominantly use smartphones for expressive and leisure-related activities such as video streaming and engagement in online social interactions. These patterns may be related to limited offline social opportunities in rural settings. Policy measures for rural adolescents should thus extend beyond limitations on screen time to address underlying structural needs. These measures could include expanding access to offline youth facilities, promoting community-driven activities, and fostering healthy online interaction guidelines. Additionally, considering the moderate predictive value of smartphone use for stress coping, interventions should seek input from adolescents regarding their daily smartphone usage patterns, thereby informing the creation of meaningful and accessible offline alternatives.
4.2. Limitations & Future Research
This study has several limitations. First, all data were derived from self-report surveys, including behavioral indicators. Future research should explore the integration of passive smartphone tracking data, which may offer higher ecological validity and remove social desirability bias. In addition, Ecological Momentary Assessment methods can improve these studies. Second, while we stratified models by urbanicity, other contextual variables—such as school type or family environment—could further refine prediction. Third, while our models were interpretable using SHAP and PDP, further work using longitudinal data is needed to establish causal pathways.
Future studies should also investigate protective features and resilience factors, particularly in adolescents who report high usage but do not develop dependency. Additionally, given the complex, nonlinear relationships found in perceived digital competence & risk indicators, qualitative or mixed-methods research may help unpack underlying cognitive distortions of smartphone use.
5. Conclusions
This study’s contributions are both methodological and practical. Methodologically, this study demonstrates the utility of conceptually informed construct modeling over “kitchen sink” approaches. Psychologically salient constructs-particularly those relating to use patterns, perceived digital competence & risk, and consequences—outperform broader demographic or contextual predictors. Practically, our work supports the adoption of low-burden, adolescent-friendly screeners in school settings, aligning with ethical frameworks (e.g., the Belmont Report; APA Code of Ethics) that call for minimal harm in youth research. Conceptually, this study illustrates the use of AI/ML to uncover potential theoretical phenomena. In our case, cognitive patterns point to potential cognitive distortions. Policy-wise, our work contributes to the growing field of place-based AI/ML by demonstrating that predictive accuracy and feature importance vary significantly by urbanicity. Our results suggest that risk for overdependence is not uniform across regions. Local social, technological, and cultural contexts shape which factors matter most. These findings support the development of regionally tailored public health messaging and digital wellness interventions. Adolescents from medium or small cities consistently showed lower model performance across classifiers, suggesting that these communities may exhibit more heterogeneous or undercaptured patterns of smartphone use. This nuance emphasizes the need for locally adaptive tools and supports critiques that national models risk obscuring regional variation [65].
Author Contributions
Conceptualization, A.H.K. and U.L.; Methodology, A.H.K. and X.X.; Software, A.H.K. and V.S.; Validation, A.H.K., Y.Y. and Z.Z.; Formal Analysis, A.H.K. and X.X.; Investigation, A.H.K., U.L., and Y.C.; Resources, A.H.K., U.L., and Y.C.; Data Curation, A.H.K., U.L., S.K., and V.S.; Writing – Original Draft Preparation, A.H.K., U.L., Y.C., S.K., and V.S.; Writing – Review & Editing, A.H.K., U.L., Y.C., S.K., and V.S.; Visualization, A.H.K. and U.L.; Supervision, A.H.K. and X.X.; Project Administration, A.H.K. and U.L.
Funding
“This research received no external funding.”
Institutional Review Board Statement
This study involved a secondary analysis of publicly available data. The Institutional Review Board at the University of Alabama (ID: 25-02-8385, February 17, 2025) reviewed the protocol and determined that ethical approval was not required, as this manuscript does not involve human subjects research as defined by DHHS and FDA regulations.
Data Availability Statement
The data used in this study were obtained from the Public Data Portal of the Republic of Korea (https://www.data.go.kr/data/15038425/fileData.do). This is a publicly available dataset provided by a government agency and does not require special access permission.
Conflicts of Interest
“The authors declare no conflicts of interest.”
Appendix
Appendix A. Conceptual Feature Selection & Construct Grouping
Appendix B. Hyperparameters for Our 4 Exemplar Models
In Table A3, we present the hyperparameters for our four best-performing models.
Appendix C. Sample Descriptives
The following sections present tables outlining place-stratified and training vs test set descriptive comparisons across all study variables.
Appendix C.1. Place-Stratified Descriptive Comparisons
Appendix C.2. Training vs Test Set Descriptive Comparisons
Appendix D. AI/ML Results
Appendix D.1. Performance Comparison for Nested AI/ML Classifiers
We present the model performance of the 12 nested AI/ML classifiers in Table A14, which presents the AUCs for several high-performing models.
Appendix D.2. Performance Comparison Between Construct-Based AI/ML Classifiers
We present the model performances of the 12 construct-based AI/ML classifiers in Table A15.
Appendix E. M4 (+Smartphone Use Cases) PDPs
Appendix F. Smart CD PDPs
Appendix G. Perceived DCR PDPs
Additional Perceived DCR PDPs are presented in Figure A10, Figure A11, Figure A12, Figure A13, Figure A14, Figure A15.
Appendix H. Use Case Only PDPs
Additional Use Case Only PDPs are presented in Figure A16, Figure A17, Figure A18, Figure A19, Figure A20, Figure A21, Figure A22.

Table A1.
Conceptual Feature Selection & Construct Grouping (Part 1).
| Domains/Constructs | Features |
|---|---|
| Demographics | Male |
| Age | |
| Elementary School | |
| Middle School | |
| High School | |
| Urbanicity | Metropolitan City |
| Medium/Small City | |
| Town/Rural District | |
| Preventive Education Experiences | Smartphone Overdependence Prevention Education |
| Awareness of Smartphone Overdependence Treatment | |
| Intent to Seek Smartphone Education | Intent to Participate in Prevention Program |
| Smartphone Use Cases | Phone Use Case - Email |
| Phone Use Case - Messenger | |
| Phone Use Case - Making New Friends | |
| Phone Use Case - Scheduling | |
| Phone Use Case - Health | |
| Phone Use Case - Zoom Meetings | |
| Phone Use Case - Online Shopping | |
| Phone Use Case - Selling Goods & Services | |
| Phone Use Case - Banking | |
| Phone Use Case - Investment | |
| Phone Use Case - Gaming | |
| Phone Use Case - Watching Videos | |
| Phone Use Case - Listening Music | |
| Phone Use Case - Listening Radio | |
| Phone Use Case - Webtoon | |
| Phone Use Case - Photography | |
| Phone Use Case - Travel | |
| Phone Use Case - Adult Content | |
| Phone Use Case - Gambling | |
| Phone Use Case - News | |
| Phone Use Case - Educational Web Search | |
| Phone Use Case - Hobby Web Search | |
| Phone Use Case - Navigation | |
| Phone Use Case - Online Learning | |
| Smartphone Online Video Usage | |
| Phone Use Case Video - Short Form Platform YouTube | |
| Phone Use Case Video - Short Form Platform TikTok | |
| Phone Use Case Video - Short Form Platform Reels | |
| Phone Use Case Video - Short Form Platform Etc | |
| Phone Use Case Video - Short Form Platform Never | |
| Phone Use Case Video - Short Form Video Usage Portion | |
| Phone Use Case Video - Mostly Food | |
| Phone Use Case Video - Mostly Sports | |
| Phone Use Case Video - Mostly Fashion/Beauty | |
| Phone Use Case Video - Mostly Gaming | |
| Phone Use Case Video - Mostly Dramas/Variety Show | |
| Phone Use Case Video - Mostly Animation/Comics | |
| Phone Use Case Video - Mostly TV/Entertainment | |
| Phone Use Case Video - Mostly Music/Dance | |
| Phone Use Case Video - Mostly Talk/Streaming | |
| Phone Use Case Video - Mostly Movies | |
| Phone Use Case Video - Mostly Products | |
| Phone Use Case Video - Mostly Current Affairs | |
| Phone Use Case Video - Mostly Lifestyle | |
| Phone Use Case Video - Mostly Edu | |
| Phone Use Case Video - Mostly Kids | |
| Phone Use Case Video - Mostly Vlog | |
| Phone Use Case Video - Mostly Other | |
| Home Environment | House |
| Apartment | |
| Mansion | |
| etc | |
| Multicultural Family | |
| Single Parent Family | |
| Both Parents Work | |
| Monthly Family Income | |
| Parental Prevention Efforts | Complete Smartphone Use Restriction |
| Limit Smartphone Usage Time | |
| Restrict Smartphone Apps | |
| Teach Smartphone Usage | |
| Smartphone Use Pros and Cons | |
| Recommended Beneficial Smartphone Apps | |
| Use Beneficial Apps Together | |
| Use Beneficial Games Together | |
| Family Smartphone Rules | |
| Social Support | Family Support Generosity |
| Friend Support In Difficulty | |
| Society Fair Opportunities and Benefits |
Note: Part 2 of this table is presented in Table A2.
Table A2.
Conceptual Feature Selection & Construct Grouping (Part 2).
| Domains/Constructs | Features |
|---|---|
| Self-Regulation Assessments | Smartphone Usage Avoid While Walking |
| Smartphone Usage Habits Check | |
| Smartphone Usage History Check | |
| Digital Detox | |
| Designated Smartphone Placement | |
| Use Work Mode | |
| Direct Conversation | |
| Hobby Engagement | |
| Perceived Digital Competence & Risk | Perceived Phone Issues - Smartphone Usage Dependence Comparison |
| Perceived Phone Issues - Neg Side Effects on SNS | |
| Perceived Phone Issues - Neg Side Effects on Email | |
| Perceived Phone Issues - Neg Side Effects on Messenger | |
| Perceived Phone Issues - Neg Side Effects on New Friends | |
| Perceived Phone Issues - Neg Side Effects on Scheduling | |
| Perceived Phone Issues - Neg Side Effects on Health | |
| Perceived Phone Issues - Neg Side Effects on Zoom | |
| Perceived Phone Issues - Neg Side Effects on Shopping | |
| Perceived Phone Issues - Neg Side Effects on Selling | |
| Perceived Phone Issues - Neg Side Effects on Banking | |
| Perceived Phone Issues - Neg Side Effects on Investment | |
| Perceived Phone Issues - Neg Side Effects on Gaming | |
| Perceived Phone Issues - Neg Side Effects on Watching Videos | |
| Perceived Phone Issues - Neg Side Effects on Listening Music | |
| Perceived Phone Issues - Neg Side Effects on Listening Radio | |
| Perceived Phone Issues - Neg Side Effects on Webtoon | |
| Perceived Phone Issues - Neg Side Effects on Photography | |
| Perceived Phone Issues - Neg Side Effects on Travel | |
| Perceived Phone Issues - Neg Side Effects on X-Rated Content | |
| Perceived Phone Issues - Neg Side Effects on Gambling Game | |
| Perceived Phone Issues - Neg Side Effects on News | |
| Perceived Phone Issues - Neg Side Effects on Edu | |
| Perceived Phone Issues - Neg Side Effects on Interests | |
| Perceived Phone Issues - Neg Side Effects on Navigation | |
| Perceived Phone Issues - Neg Side Effects on Distance Class | |
| Perceived Phone Issues - Excessive Smartphone Usage | |
| Perceived Phone Issues - Short Form Video Usage Control Difficulty | |
| Perceived Competence - Necessary Information Access | |
| Perceived Competence - Assess Online Information Reliability | |
| Perceived Competence - Online Social Issue Engagement | |
| Perceived Competence - Digital Content Creation | |
| Perceived Competence - Online Privacy Awareness | |
| Perceived Competence - Use Online Information Academia Work | |
| Life Satisfaction | Relationship Satisfaction |
| Work Satisfaction | |
| Leisure Activities Satisfaction | |
| Overall Life Satisfaction | |
| Smartphone Consequences & Dependence | Smartphone Periodic Check Nervousness |
| Smartphone Low Battery Nervousness | |
| Smartphone Usage Depression | |
| Smartphone Usage Physical Effects | |
| Smartphone Usage Sleep Issues | |
| Smartphone Communication Social Isolation | |
| Stress Relief Through Smartphone |
Note: Part 1 of this table is presented in Table A1. Neg. stands for Negative.
Table A3.
Hyperparameters for our 4 Best Models
| Model Name | Algorithm | Hyperparameters |
| Nest M4 model | Random Forest | n_estimators = 1967; max_depth = 81; min_samples_split = 4; min_samples_leaf = 1 |
| SmartCD Only | LightGBM | n_estimators = 254; learning_rate = 0.064495018055983; max_depth = 3; num_leaves = 222; min_child_samples = 17; feature_fraction = 0.469378476101846; bagging_fraction = 0.52804982292064; bagging_freq = 6; lambda_l1 = 0.186535833027839; lambda_l2 = 0.0000131738014410991 |
| Perceived DCR Only | XGBoost | num_boost_round = 674; subsample = 0.85597440455654; min_child_weight = 1; max_depth = 38; learning_rate = 0.0127554708475019; = 0.229654735805916; colsample_bytree = 0.287803548558039; reg_alpha = 0.00651358918568053; reg_lambda = 0.791652034688638 |
| Use Case Only | XGBoost | num_boost_round = 562; subsample = 0.583206150016204; min_child_weight = 1; max_depth = 74; learning_rate = 0.0113916452910645; = 0.00109214155684023; colsample_bytree = 0.300084001241431; reg_alpha = 0.277286668793397; reg_lambda = 0.0305140602390746 |
Table A4.
All 128 One-Hot Encoded Features of Adolescents by Urbanicity: Adolescents Aged 18 Years or Younger (N = 1,873)
Table A4.
All 128 One-Hot Encoded Features of Adolescents by Urbanicity: Adolescents Aged 18 Years or Younger (N = 1,873)
| Variable Category | Variable | Metropolitan City (n=831) | Medium/Small City (n=714) | Town/Rural District (n=328) | p-value |
|---|---|---|---|---|---|
| Demographics | |||||
| Age (mean, SD) | 14.35 (2.35) | 14.35 (2.45) | 14.29 (2.4) | 0.917 | |
| Sex (Male; n (%)) | 401 (48.3%) | 355 (49.7%) | 144 (43.9%) | 0.215 | |
| Elementary School Students (n (%)) | 205 (24.7%) | 189 (26.5%) | 88 (26.8%) | 0.637 | |
| Middle School Students (n (%)) | 317 (38.1%) | 263 (36.8%) | 127 (38.7%) | 0.802 | |
| High School Students (n (%)) | 309 (37.2%) | 262 (36.7%) | 113 (34.5%) | 0.679 | |
| Home Environment | |||||
| House (n (%)) | 167 (20.1%) | 152 (21.3%) | 90 (27.4%) | 0.022* | |
| Apartment (n (%)) | 473 (56.9%) | 394 (55.2%) | 172 (52.4%) | 0.377 | |
| Mansion (n (%)) | 170 (20.5%) | 129 (18.1%) | 53 (16.2%) | 0.197 | |
| Other Housing (n (%)) | 21 (2.5%) | 39 (5.5%) | 13 (4.0%) | - | |
| Multicultural Family (n (%)) | 7 (0.8%) | 2 (0.3%) | 4 (1.2%) | - | |
| Single-Parent Family (n (%)) | 55 (6.6%) | 60 (8.4%) | 31 (9.5%) | 0.200 | |
| Both Parents Working (n (%)) | 588 (70.8%) | 520 (72.8%) | 236 (72.0%) | 0.664 | |
| Monthly Household Income (mean, SD) | 3.26 (0.75) | 3.2 (0.82) | 3.23 (0.77) | 0.424 | |
| Smartphone Use Cases | |||||
| Email (M (SD)) | 1.85 (1.89) | 1.89 (1.89) | 1.98 (2.05) | 0.601 | |
| Messenger (M (SD)) | 5.31 (1.46) | 5.41 (1.42) | 5.02 (1.75) | <0.001*** | |
| Making New Friends (M (SD)) | 1.45 (1.98) | 1.25 (1.79) | 1.33 (1.85) | 0.126 | |
| Scheduling (M (SD)) | 2.06 (2.13) | 1.86 (2.06) | 1.62 (2.08) | 0.004** | |
| Health (M (SD)) | 1.76 (2.04) | 1.59 (1.91) | 1.46 (1.98) | 0.045* | |
| Zoom Meetings (M (SD)) | 0.73 (1.57) | 0.54 (1.33) | 0.59 (1.41) | 0.030* | |
| Online Shopping (M (SD)) | 2.1 (2.16) | 2.04 (2.13) | 2.18 (2.32) | 0.596 | |
| Selling Goods & Services (M (SD)) | 1.65 (2.06) | 1.51 (2.0) | 1.77 (2.27) | 0.149 | |
| Banking (M (SD)) | 1.49 (1.93) | 1.39 (1.85) | 1.35 (2.01) | 0.411 | |
| Investment (M (SD)) | 0.86 (1.52) | 0.63 (1.28) | 0.62 (1.29) | <0.001*** | |
| Gaming (M (SD)) | 4.89 (1.83) | 4.92 (1.73) | 4.63 (1.97) | 0.052 | |
| Watching Videos (M (SD)) | 5.25 (1.62) | 5.32 (1.58) | 5.02 (1.81) | 0.018* | |
| Listening Music (M (SD)) | 4.51 (1.97) | 4.48 (2.04) | 4.03 (2.35) | <0.001*** | |
| Listening Radio (M (SD)) | 1.55 (2.03) | 1.69 (2.08) | 1.54 (2.09) | 0.380 | |
| Webtoon (M (SD)) | 3.35 (2.27) | 3.32 (2.2) | 3.11 (2.33) | 0.241 | |
Table A5.
All 128 One-Hot Encoded Features of Adolescents by Urbanicity (continued): Smartphone Use Cases
Table A5.
All 128 One-Hot Encoded Features of Adolescents by Urbanicity (continued): Smartphone Use Cases
| Variable Category | Variable | Metropolitan City (n=831) | Medium/Small City (n=714) | Town/Rural District (n=328) | p-value |
|---|---|---|---|---|---|
| Photography (M (SD)) | 3.5 (1.96) | 3.43 (1.94) | 3.42 (2.2) | 0.745 | |
| Travel (M (SD)) | 1.71 (1.94) | 1.6 (1.86) | 1.84 (2.04) | 0.144 | |
| Adult Content (M (SD)) | 0.5 (1.15) | 0.33 (0.94) | 0.3 (0.94) | <0.001*** | |
| Gambling (M (SD)) | 0.48 (1.2) | 0.29 (0.87) | 0.32 (1.04) | <0.001*** | |
| News (M (SD)) | 2.57 (2.21) | 2.3 (2.04) | 2.16 (2.16) | 0.004** | |
| Educational Web Search (M (SD)) | 4.06 (1.81) | 3.84 (1.78) | 3.64 (2.26) | 0.002** | |
| Hobby Web Search (M (SD)) | 3.87 (1.9) | 3.73 (1.9) | 3.68 (2.25) | 0.234 | |
| Navigation (M (SD)) | 2.42 (1.92) | 2.37 (1.95) | 2.12 (2.0) | 0.049* | |
| Online Learning (M (SD)) | 3.63 (2.23) | 3.45 (2.2) | 3.62 (2.33) | 0.274 | |
| Smartphone Online Video Usage (n (%)) | 798 (96.0%) | 694 (97.2%) | 313 (95.4%) | 0.285 | |
| Short Form Platform YouTube (n (%)) | 443 (53.3%) | 315 (44.1%) | 162 (49.4%) | 0.002** | |
| Short Form Platform TikTok (n (%)) | 145 (17.4%) | 165 (23.1%) | 68 (20.7%) | 0.021* | |
| Short Form Platform Reels (n (%)) | 77 (9.3%) | 81 (11.3%) | 34 (10.4%) | 0.405 | |
| Short Form Platform Etc (n (%)) | 8 (1.0%) | 6 (0.8%) | 2 (0.6%) | - | |
| Short Form Platform Never (n (%)) | 125 (15.0%) | 127 (17.8%) | 47 (14.3%) | 0.229 | |
| Short Form Video Usage (M (SD)) | 1.67 (1.1) | 1.73 (1.15) | 1.8 (1.17) | 0.207 | |
| Mostly Food (n (%)) | 130 (15.6%) | 80 (11.2%) | 47 (14.3%) | 0.038* | |
| Mostly Sports (n (%)) | 40 (4.8%) | 39 (5.5%) | 14 (4.3%) | - | |
| Mostly Fashion/Beauty (n (%)) | 38 (4.6%) | 37 (5.2%) | 20 (6.1%) | - | |
| Mostly Gaming (n (%)) | 250 (30.1%) | 222 (31.1%) | 90 (27.4%) | 0.489 | |
| Mostly Dramas/Variety Show (n (%)) | 83 (10.0%) | 54 (7.6%) | 24 (7.3%) | - | |
| Mostly Animation/Comics (n (%)) | 56 (6.7%) | 63 (8.8%) | 24 (7.3%) | - | |
| Mostly TV/Entertainment (n (%)) | 42 (5.1%) | 46 (6.4%) | 19 (5.8%) | - | |
| Mostly Music/Dance (n (%)) | 45 (5.4%) | 53 (7.4%) | 24 (7.3%) | - | |
| Mostly Talk/Streaming (n (%)) | 17 (2.0%) | 16 (2.2%) | 5 (1.5%) | - | |
| Mostly Movies (n (%)) | 18 (2.2%) | 9 (1.3%) | 8 (2.4%) | - | |
| Mostly Products (n (%)) | 12 (1.4%) | 11 (1.5%) | 2 (0.6%) | - | |
| Mostly Current Affairs (n (%)) | 3 (0.4%) | 10 (1.4%) | 2 (0.6%) | - | |
| Mostly Lifestyle (n (%)) | 4 (0.5%) | 2 (0.3%) | 5 (1.5%) | - | |
| Mostly Edu (n (%)) | 49 (5.9%) | 34 (4.8%) | 26 (7.9%) | - | |
| Mostly Kids (n (%)) | 6 (0.7%) | 11 (1.5%) | 2 (0.6%) | - | |
| Mostly Vlog (n (%)) | 4 (0.5%) | 7 (1.0%) | 1 (0.3%) | - | |
| Mostly Other (n (%)) | 1 (0.1%) | 0 (0.0%) | 0 (0.0%) | - |
Table A6.
All 128 One-Hot Encoded Features of Adolescents by Urbanicity (continued): Psychosocial Factors, Consequences, Regulation, Support, Satisfaction
Table A6.
All 128 One-Hot Encoded Features of Adolescents by Urbanicity (continued): Psychosocial Factors, Consequences, Regulation, Support, Satisfaction
| Variable Category | Variable | Metropolitan City (n=831) | Medium/Small City (n=714) | Town/Rural District (n=328) | p-value |
|---|---|---|---|---|---|
| Perceived Digital Risk | |||||
| Smartphone Usage Dependence Comparison (M (SD)) | 2.71 (0.74) | 2.76 (0.75) | 2.72 (0.78) | 0.376 | |
| Side Effects on SNS (n (%)) | 48 (5.8%) | 56 (7.8%) | 22 (6.7%) | - | |
| Side Effects on Email (n (%)) | 15 (1.8%) | 11 (1.5%) | 4 (1.2%) | - | |
| Side Effects on Messenger (n (%)) | 23 (2.8%) | 28 (3.9%) | 16 (4.9%) | - | |
| Side Effects on New Friends (n (%)) | 21 (2.5%) | 16 (2.2%) | 14 (4.3%) | - | |
| Side Effects on Scheduling (n (%)) | 13 (1.6%) | 4 (0.6%) | 0 (0.0%) | - | |
| Side Effects on Health (n (%)) | 7 (0.8%) | 2 (0.3%) | 1 (0.3%) | - | |
| Side Effects on Zoom (n (%)) | 3 (0.4%) | 5 (0.7%) | 0 (0.0%) | - | |
| Side Effects on Shopping (n (%)) | 34 (4.1%) | 24 (3.4%) | 13 (4.0%) | - | |
| Side Effects on Selling (n (%)) | 8 (1.0%) | 7 (1.0%) | 6 (1.8%) | - | |
| Side Effects on Banking (n (%)) | 1 (0.1%) | 3 (0.4%) | 2 (0.6%) | - | |
| Side Effects on Investment (n (%)) | 9 (1.1%) | 3 (0.4%) | 3 (0.9%) | - | |
| Side Effects on Gaming (n (%)) | 353 (42.5%) | 313 (43.8%) | 108 (32.9%) | 0.003** | |
| Side Effects on Watching Videos (n (%)) | 68 (8.2%) | 52 (7.3%) | 21 (6.4%) | - | |
| Side Effects on Listening Music (n (%)) | 0 (0.0%) | 2 (0.3%) | 3 (0.9%) | - | |
| Side Effects on Listening Radio (n (%)) | 1 (0.1%) | 1 (0.1%) | 1 (0.3%) | - | |
| Side Effects on Webtoon (n (%)) | 28 (3.4%) | 13 (1.8%) | 7 (2.1%) | - | |
| Side Effects on Photography (n (%)) | 2 (0.2%) | 0 (0.0%) | 1 (0.3%) | - | |
| Side Effects on Travel (n (%)) | 1 (0.1%) | 1 (0.1%) | 0 (0.0%) | - | |
| Side Effects on X-Rated Content (n (%)) | 30 (3.6%) | 9 (1.3%) | 8 (2.4%) | - | |
| Side Effects on Gambling Game (n (%)) | 2 (0.2%) | 12 (1.7%) | 2 (0.6%) | - | |
| Side Effects on News (n (%)) | 3 (0.4%) | 1 (0.1%) | 2 (0.6%) | - | |
| Side Effects on Edu (n (%)) | 1 (0.1%) | 3 (0.4%) | 0 (0.0%) | - | |
| Side Effects on Interests (n (%)) | 1 (0.1%) | 0 (0.0%) | 0 (0.0%) | - | |
| Side Effects on Navigation (n (%)) | 2 (0.2%) | 3 (0.4%) | 0 (0.0%) | - | |
| Side Effects on Distance Class (n (%)) | 1 (0.1%) | 5 (0.7%) | 4 (1.2%) | - | |
| Excessive Smartphone Usage (M (SD)) | 2.57 (0.69) | 2.62 (0.69) | 2.62 (0.77) | 0.218 | |
| Short Form Video Usage Control Difficulty (M (SD)) | 1.71 (1.09) | 1.81 (1.15) | 1.81 (1.08) | 0.139 | |
| Perceived Digital Competence | |||||
| Necessary Information Access (M (SD)) | 3.25 (0.64) | 3.25 (0.66) | 3.3 (0.67) | 0.404 | |
| Assess Online Information Reliability (M (SD)) | 2.98 (0.75) | 2.94 (0.77) | 3.05 (0.78) | 0.070 | |
| Online Social Issue Engagement (M (SD)) | 2.8 (0.85) | 2.7 (0.85) | 2.81 (0.81) | 0.037* | |
| Digital Content Creation (M (SD)) | 2.49 (0.98) | 2.43 (0.98) | 2.62 (0.99) | 0.012* | |
| Online Privacy Awareness (M (SD)) | 2.66 (0.88) | 2.57 (0.86) | 2.79 (0.86) | <0.001*** | |
| Use Online Information for Academia/Work (M (SD)) | 2.89 (0.87) | 2.67 (0.94) | 2.81 (0.92) | <0.001*** | |
Table A7.
All 128 One-Hot Encoded Features of Adolescents by Urbanicity (continued): Psychosocial Factors, Consequences, Regulation, Support, Satisfaction
Table A7.
All 128 One-Hot Encoded Features of Adolescents by Urbanicity (continued): Psychosocial Factors, Consequences, Regulation, Support, Satisfaction
| Variable Category | Variable | Metropolitan City (n=831) | Medium/Small City (n=714) | Town/Rural District (n=328) | p-value |
|---|---|---|---|---|---|
| Smartphone Consequences & Dependence | |||||
| Low Battery Nervousness (M (SD)) | 2.71 (0.83) | 2.85 (0.86) | 2.75 (0.85) | 0.004** | |
| Smartphone Usage Depression (M (SD)) | 2.16 (0.87) | 2.23 (0.81) | 2.17 (0.83) | 0.250 | |
| Physical Effects (M (SD)) | 2.27 (0.89) | 2.35 (0.86) | 2.32 (0.89) | 0.170 | |
| Periodic Check Nervousness (M (SD)) | 2.57 (0.75) | 2.61 (0.76) | 2.52 (0.73) | 0.175 | |
| Smartphone Usage Sleep Issues (M (SD)) | 2.21 (0.84) | 2.29 (0.86) | 2.21 (0.89) | 0.174 | |
| Social Isolation (M (SD)) | 2.05 (0.79) | 2.13 (0.81) | 2.11 (0.73) | 0.133 | |
| Stress Relief Through Smartphone (M (SD)) | 2.41 (0.83) | 2.43 (0.85) | 2.35 (0.85) | 0.437 | |
| Preventative Education | |||||
| Received Preventive Education (n (%)) | 589 (31.4%) | 466 (31.1%) | 123 (32.8%) | 0.819 | |
| Awareness of Treatment Options (n (%)) | 958 (51.1%) | 768 (51.3%) | 190 (50.7%) | 0.979 | |
| Intent to Seek Smartphone Education | |||||
| Participation Intention (M (SD)) | 2.25 (0.71) | 2.21 (0.72) | 2.27 (0.74) | 0.370 | |
| Parental Prevention Efforts | |||||
| Complete Restriction (n (%)) | 81 (9.7%) | 71 (9.9%) | 33 (10.1%) | 0.984 | |
| Teaches How to Use the Phone Use (n (%)) | 397 (47.8%) | 284 (39.8%) | 130 (39.6%) | 0.002** | |
| Restrict Smartphone Apps (n (%)) | 508 (61.1%) | 439 (61.5%) | 185 (56.4%) | 0.256 | |
| Teaches Pros and Cons (n (%)) | 514 (61.9%) | 422 (59.1%) | 176 (53.7%) | 0.037* | |
| Recommends Good Apps (n (%)) | 396 (47.7%) | 277 (38.8%) | 152 (46.3%) | <0.001*** | |
| Uses Good Apps Together (n (%)) | 252 (30.3%) | 210 (29.4%) | 93 (28.4%) | 0.793 | |
| Plays Good Games Together (n (%)) | 225 (27.1%) | 206 (28.9%) | 75 (22.9%) | 0.130 | |
| Family Smartphone Rules (n (%)) | 354 (42.6%) | 272 (38.1%) | 133 (40.5%) | 0.199 | |
| Social Support | |||||
| Family Support (M (SD)) | 3.29 (0.69) | 3.17 (0.75) | 3.26 (0.66) | 0.005** | |
| Friend Support (M (SD)) | 3.13 (0.67) | 3.07 (0.69) | 3.17 (0.68) | 0.044* | |
| Societal Fairness Perception (M (SD)) | 2.93 (0.71) | 2.81 (0.75) | 3.03 (0.79) | <0.001*** | |
Table A8.
All 128 One-Hot Encoded Features of Adolescents by Urbanicity (continued): Psychosocial Factors, Consequences, Regulation, Support, Satisfaction
Table A8.
All 128 One-Hot Encoded Features of Adolescents by Urbanicity (continued): Psychosocial Factors, Consequences, Regulation, Support, Satisfaction
| Variable Category | Variable | Metropolitan City (n=831) | Medium/Small City (n=714) | Town/Rural District (n=328) | p-value |
|---|---|---|---|---|---|
| Social Support | |||||
| Family Support (M (SD)) | 3.29 (0.69) | 3.17 (0.75) | 3.26 (0.66) | 0.005** | |
| Friend Support (M (SD)) | 3.13 (0.67) | 3.07 (0.69) | 3.17 (0.68) | 0.044* | |
| Societal Fairness Perception (M (SD)) | 2.93 (0.71) | 2.81 (0.75) | 3.03 (0.79) | <0.001*** | |
| Self-Regulation Assessments | |||||
| Smartphone Usage Avoid While Walking (n (%)) | 518 (62.3%) | 455 (63.7%) | 223 (68.0%) | 0.195 | |
| Smartphone Usage Habits Check (n (%)) | 226 (27.2%) | 186 (26.1%) | 96 (29.3%) | 0.554 | |
| Smartphone Use History Check (n (%)) | 164 (19.7%) | 162 (22.7%) | 72 (22.0%) | 0.347 | |
| Digital Detox (n (%)) | 210 (25.3%) | 153 (21.4%) | 55 (16.8%) | 0.006** | |
| Designated Placement (n (%)) | 286 (34.4%) | 200 (28.0%) | 105 (32.0%) | 0.026* | |
| Use of Work Mode (n (%)) | 414 (49.8%) | 316 (44.3%) | 136 (41.5%) | 0.015* | |
| Engaging in Conversation (n (%)) | 374 (45.0%) | 285 (39.9%) | 134 (40.9%) | 0.109 | |
| Hobby Engagement (n (%)) | 208 (25.0%) | 212 (29.7%) | 94 (28.7%) | 0.106 | |
| Life Satisfaction | |||||
| Relationship Satisfaction (M (SD)) | 3.25 (0.58) | 3.28 (0.6) | 3.31 (0.6) | 0.193 | |
| Work Satisfaction (M (SD)) | 2.91 (0.7) | 2.89 (0.73) | 2.99 (0.72) | 0.077 | |
| Leisure Satisfaction (M (SD)) | 2.86 (0.7) | 2.84 (0.71) | 2.91 (0.77) | 0.300 | |
| Overall Life Satisfaction (M (SD)) | 3.08 (0.57) | 3.04 (0.59) | 3.08 (0.65) | 0.462 | |
Note. p-values are based on comparisons between the different urbanicity strata when cell sizes . One-way ANOVA was used for continuous variables; Pearson’s chi-square test was used for categorical variables. *p < .05, **p < .01, ***p < .001 considered statistically significant.
Table A9.
All 131 One-Hot Encoded Features of Descriptive Characteristics of the Sample by Training and Test Sets (Aged 18 or Younger, )
Table A9.
All 131 One-Hot Encoded Features of Descriptive Characteristics of the Sample by Training and Test Sets (Aged 18 or Younger, )
| Variable Category | Variable | Total Sample (N=1,873) | Training Set (n=1,498) | Test Set (n=375) | p-value |
|---|---|---|---|---|---|
| Demographics | |||||
| Age (mean, SD) | 14.34 (2.40) | 14.34 (2.39) | 14.34 (2.42) | 1.000 | |
| Sex (Male; n (%)) | 900 (48.1%) | 728 (48.6%) | 172 (45.9%) | 0.639 | |
| Elementary School Students (n (%)) | 482 (25.7%) | 389 (26.0%) | 93 (24.8%) | 0.898 | |
| Middle School Students (n (%)) | 707 (37.7%) | 565 (37.7%) | 142 (37.9%) | 0.999 | |
| High School Students (n (%)) | 684 (36.5%) | 544 (36.3%) | 140 (37.3%) | 0.935 | |
| Urbanicity | |||||
| Metropolitan City (n (%)) | 831 (44.4%) | 656 (43.8%) | 175 (46.7%) | 0.605 | |
| Medium or Small City (n (%)) | 714 (38.1%) | 571 (38.1%) | 143 (38.1%) | 1.000 | |
| Town or Rural District (n (%)) | 328 (17.5%) | 271 (18.1%) | 57 (15.2%) | 0.420 | |
| Home Environment | |||||
| House (n (%)) | 409 (21.8%) | 331 (22.1%) | 78 (20.8%) | 0.863 | |
| Apartment (n (%)) | 1,039 (55.5%) | 829 (55.3%) | 210 (56.0%) | 0.974 | |
| Mansion (n (%)) | 352 (18.8%) | 276 (18.4%) | 76 (20.3%) | 0.716 | |
| Other Housing (n (%)) | 73 (3.9%) | 62 (4.1%) | 11 (2.9%) | - | |
| Multicultural Family (n (%)) | 13 (0.7%) | 11 (0.7%) | 2 (0.5%) | - | |
| Single-Parent Family (n (%)) | 146 (7.8%) | 114 (7.6%) | 32 (8.5%) | 0.837 | |
| Both Parents Working (n (%)) | 1,344 (71.8%) | 1,086 (72.5%) | 258 (68.8%) | 0.364 | |
| Monthly Household Income (mean, SD) | 3.23 (0.78) | 3.24 (0.79) | 3.18 (0.76) | 0.442 | |
Table A10.
All 131 One-Hot Encoded Features (continued): Smartphone Use Cases
| Variable Category | Variable | Total Sample (N=1,873) | Training Set (n=1,498) | Test Set (n=375) | p-value |
|---|---|---|---|---|---|
| Smartphone Use Cases | |||||
| Email (M (SD)) | 1.89 (1.91) | 1.89 (1.94) | 1.87 (1.81) | 0.983 | |
| Messenger (M (SD)) | 5.3 (1.51) | 5.29 (1.51) | 5.32 (1.49) | 0.966 | |
| Making New Friends (M (SD)) | 1.35 (1.89) | 1.36 (1.89) | 1.3 (1.9) | 0.857 | |
| Scheduling (M (SD)) | 1.91 (2.1) | 1.89 (2.11) | 2.0 (2.06) | 0.652 | |
| Health (M (SD)) | 1.64 (1.98) | 1.63 (1.97) | 1.67 (2.03) | 0.945 | |
| Zoom Meetings (M (SD)) | 0.63 (1.46) | 0.64 (1.47) | 0.61 (1.4) | 0.938 | |
| Online Shopping (M (SD)) | 2.09 (2.17) | 2.08 (2.17) | 2.13 (2.18) | 0.934 | |
| Selling Goods & Services (M (SD)) | 1.62 (2.08) | 1.62 (2.08) | 1.61 (2.07) | 0.987 | |
| Banking (M (SD)) | 1.43 (1.91) | 1.47 (1.94) | 1.24 (1.78) | 0.110 | |
| Investment (M (SD)) | 0.73 (1.4) | 0.71 (1.36) | 0.81 (1.54) | 0.529 | |
| Gaming (M (SD)) | 4.85 (1.82) | 4.84 (1.85) | 4.92 (1.67) | 0.718 | |
| Watching Videos (M (SD)) | 5.24 (1.64) | 5.22 (1.65) | 5.3 (1.6) | 0.695 | |
| Listening Music (M (SD)) | 4.42 (2.07) | 4.44 (2.05) | 4.32 (2.16) | 0.625 | |
| Listening Radio (M (SD)) | 1.6 (2.06) | 1.61 (2.07) | 1.58 (2.02) | 0.976 | |
| Webtoon (M (SD)) | 3.3 (2.25) | 3.27 (2.25) | 3.42 (2.28) | 0.519 | |
| Photography (M (SD)) | 3.46 (2.0) | 3.46 (2.02) | 3.49 (1.91) | 0.967 | |
| Travel (M (SD)) | 1.69 (1.93) | 1.71 (1.94) | 1.61 (1.86) | 0.652 | |
| Adult Content (M (SD)) | 0.4 (1.04) | 0.4 (1.04) | 0.41 (1.06) | 0.956 | |
| Gambling (M (SD)) | 0.38 (1.06) | 0.37 (1.04) | 0.43 (1.13) | 0.570 | |
| News (M (SD)) | 2.4 (2.14) | 2.38 (2.16) | 2.47 (2.05) | 0.770 | |
| Educational Web Search (M (SD)) | 3.9 (1.89) | 3.91 (1.91) | 3.88 (1.82) | 0.971 | |
| Hobby Web Search (M (SD)) | 3.78 (1.97) | 3.78 (1.96) | 3.81 (2.0) | 0.947 | |
| Navigation (M (SD)) | 2.35 (1.95) | 2.34 (1.97) | 2.37 (1.88) | 0.978 | |
| Online Learning (M (SD)) | 3.56 (2.23) | 3.56 (2.26) | 3.55 (2.13) | 0.999 | |
| Smartphone Online Video Usage (n (%)) | 1,805 (96.4%) | 1,441 (96.2%) | 364 (97.1%) | 0.722 | |
| Short Form Platform YouTube (n (%)) | 920 (49.1%) | 740 (49.4%) | 180 (48.0%) | 0.889 | |
| Short Form Platform TikTok (n (%)) | 378 (20.2%) | 294 (19.6%) | 84 (22.4%) | 0.489 | |
| Short Form Platform Reels (n (%)) | 192 (10.3%) | 146 (9.7%) | 46 (12.3%) | 0.355 | |
| Short Form Platform Etc (n (%)) | 16 (0.9%) | 13 (0.9%) | 3 (0.8%) | 0.992 | |
| Short Form Platform Never (n (%)) | 299 (16.0%) | 248 (16.6%) | 51 (13.6%) | 0.377 | |
| Short Form Video Usage (M (SD)) | 1.72 (1.13) | 1.69 (1.13) | 1.83 (1.13) | 0.109 | |
Table A11.
All 131 One-Hot Encoded Features (continued): Smartphone Use Cases
| Variable Category | Variable | Total Sample (N=1,873) | Training Set (n=1,498) | Test Set (n=375) | p-value |
|---|---|---|---|---|---|
| Smartphone Use Cases | |||||
| Mostly Food (n (%)) | 929 (49.6%) | 742 (49.5%) | 187 (49.9%) | 0.897 | |
| Mostly Sports (n (%)) | 586 (31.3%) | 469 (31.3%) | 117 (31.2%) | 0.961 | |
| Mostly Fashion/Beauty (n (%)) | 429 (22.9%) | 337 (22.5%) | 92 (24.5%) | 0.388 | |
| Mostly Gaming (n (%)) | 770 (41.1%) | 616 (41.1%) | 154 (41.1%) | 0.918 | |
| Mostly Dramas/Variety Show (n (%)) | 730 (39.0%) | 580 (38.7%) | 150 (40.0%) | 0.642 | |
| Mostly Animation/Comics (n (%)) | 631 (33.7%) | 510 (34.0%) | 121 (32.3%) | 0.541 | |
| Mostly TV/Entertainment (n (%)) | 620 (33.1%) | 491 (32.8%) | 129 (34.4%) | 0.548 | |
| Mostly Music/Dance (n (%)) | 612 (32.7%) | 491 (32.8%) | 121 (32.3%) | 0.869 | |
| Mostly Talk/Streaming (n (%)) | 563 (30.1%) | 446 (29.8%) | 117 (31.2%) | 0.607 | |
| Mostly Movies (n (%)) | 537 (28.7%) | 424 (28.3%) | 113 (30.1%) | 0.500 | |
| Mostly Products (n (%)) | 529 (28.2%) | 419 (28.0%) | 110 (29.3%) | 0.625 | |
| Mostly Current Affairs (n (%)) | 497 (26.5%) | 394 (26.3%) | 103 (27.5%) | 0.647 | |
| Mostly Lifestyle (n (%)) | 493 (26.3%) | 394 (26.3%) | 99 (26.4%) | 0.974 | |
| Mostly Edu (n (%)) | 488 (26.1%) | 391 (26.1%) | 97 (25.9%) | 0.946 | |
| Mostly Kids (n (%)) | 439 (23.4%) | 350 (23.4%) | 89 (23.7%) | 0.879 | |
| Mostly Vlog (n (%)) | 1,032 (55.2%) | 775 (54.6%) | 257 (57.1%) | 0.703 | |
| Mostly Other (n (%)) | 1,870 (99.8%) | 1,496 (99.9%) | 374 (99.7%) | 0.323 | |
| Perceived Digital Risk | |||||
| Smartphone Usage Dependence Comparison (M (SD)) | 2.73 (0.75) | 2.72 (0.74) | 2.74 (0.79) | 0.889 | |
| Side Effects on SNS (n (%)) | 126 (6.7%) | 112 (7.5%) | 14 (3.7%) | - | |
| Side Effects on Email (n (%)) | 30 (1.6%) | 24 (1.6%) | 6 (1.6%) | - | |
| Side Effects on Messenger (n (%)) | 67 (3.6%) | 53 (3.5%) | 14 (3.7%) | - | |
| Side Effects on New Friends (n (%)) | 51 (2.7%) | 37 (2.5%) | 14 (3.7%) | - | |
| Side Effects on Scheduling (n (%)) | 17 (0.9%) | 12 (0.8%) | 5 (1.3%) | - | |
| Side Effects on Health (n (%)) | 10 (0.5%) | 10 (0.7%) | 0 (0.0%) | - | |
| Side Effects on Zoom (n (%)) | 8 (0.4%) | 7 (0.5%) | 1 (0.3%) | - | |
| Side Effects on Shopping (n (%)) | 71 (3.8%) | 55 (3.7%) | 16 (4.3%) | - | |
| Side Effects on Selling (n (%)) | 21 (1.1%) | 19 (1.3%) | 2 (0.5%) | - | |
| Side Effects on Banking (n (%)) | 6 (0.3%) | 5 (0.3%) | 1 (0.3%) | - | |
| Side Effects on Investment (n (%)) | 15 (0.8%) | 12 (0.8%) | 3 (0.8%) | - | |
| Side Effects on Gaming (n (%)) | 774 (41.3%) | 607 (40.5%) | 167 (44.5%) | 0.369 | |
Table A12.
All 131 One-Hot Encoded Features (continued): Smartphone Use Cases
| Variable Category | Variable | Total Sample (N=1,873) | Training Set (n=1,498) | Test Set (n=375) | p-value |
|---|---|---|---|---|---|
| Side Effects on Watching Videos (n (%)) | 141 (7.5%) | 113 (7.5%) | 28 (7.5%) | - | |
| Side Effects on Listening Music (n (%)) | 5 (0.3%) | 5 (0.3%) | 0 (0.0%) | - | |
| Side Effects on Listening Radio (n (%)) | 3 (0.2%) | 3 (0.2%) | 0 (0.0%) | - | |
| Side Effects on Webtoon (n (%)) | 48 (2.6%) | 36 (2.4%) | 12 (3.2%) | - | |
| Side Effects on Photography (n (%)) | 3 (0.2%) | 2 (0.1%) | 1 (0.3%) | - | |
| Side Effects on Travel (n (%)) | 2 (0.1%) | 2 (0.1%) | 0 (0.0%) | - | |
| Side Effects on X-Rated Content (n (%)) | 47 (2.5%) | 35 (2.3%) | 12 (3.2%) | - | |
| Side Effects on Gambling Game (n (%)) | 16 (0.9%) | 13 (0.9%) | 3 (0.8%) | - | |
| Side Effects on News (n (%)) | 6 (0.3%) | 6 (0.4%) | 0 (0.0%) | - | |
| Side Effects on Edu (n (%)) | 4 (0.2%) | 4 (0.3%) | 0 (0.0%) | - | |
| Side Effects on Interests (n (%)) | 1 (0.1%) | 1 (0.1%) | 0 (0.0%) | - | |
| Side Effects on Navigation (n (%)) | 5 (0.3%) | 5 (0.3%) | 0 (0.0%) | - | |
| Side Effects on Distance Class (n (%)) | 10 (0.5%) | 5 (0.3%) | 5 (1.3%) | - | |
| Excessive Smartphone Usage (M (SD)) | 2.6 (0.71) | 2.6 (0.69) | 2.59 (0.75) | 0.947 | |
| Short Form Video Usage Control Difficulty (M (SD)) | 1.76 (1.11) | 1.74 (1.12) | 1.85 (1.09) | 0.209 | |
| Perceived Digital Competence | |||||
| Necessary Information Access (M (SD)) | 3.26 (0.65) | 3.25 (0.66) | 3.29 (0.65) | 0.619 | |
| Assess Online Information Reliability (M (SD)) | 2.98 (0.76) | 2.97 (0.76) | 3.0 (0.75) | 0.791 | |
| Online Social Issue Engagement (M (SD)) | 2.77 (0.84) | 2.76 (0.85) | 2.78 (0.82) | 0.972 | |
| Digital Content Creation (M (SD)) | 2.49 (0.99) | 2.47 (0.99) | 2.57 (0.97) | 0.197 | |
| Online Privacy Awareness (M (SD)) | 2.65 (0.88) | 2.64 (0.88) | 2.68 (0.86) | 0.756 | |
| Use Online Information for Academia/Work (M (SD)) | 2.79 (0.91) | 2.79 (0.93) | 2.8 (0.85) | 0.981 | |
| Smartphone Consequences & Dependence | |||||
| Low Battery Nervousness (M (SD)) | 2.77 (0.85) | 2.76 (0.85) | 2.79 (0.84) | 0.790 | |
| Smartphone Usage Depression (M (SD)) | 2.19 (0.84) | 2.18 (0.83) | 2.22 (0.9) | 0.740 | |
| Physical Effects (M (SD)) | 2.31 (0.88) | 2.31 (0.87) | 2.33 (0.91) | 0.923 | |
| Periodic Check Nervousness (M (SD)) | 2.58 (0.75) | 2.57 (0.75) | 2.6 (0.76) | 0.836 | |
| Smartphone Usage Sleep Issues (M (SD)) | 2.24 (0.86) | 2.23 (0.85) | 2.29 (0.9) | 0.539 | |
| Social Isolation (M (SD)) | 2.09 (0.79) | 2.08 (0.78) | 2.14 (0.8) | 0.494 | |
| Stress Relief Through Smartphone (M (SD)) | 2.41 (0.84) | 2.4 (0.84) | 2.42 (0.85) | 0.918 | |
Table A13.
All 131 One-Hot Encoded Features (continued): Risk, Competence, Consequences, Prevention, Support, Regulation, Satisfaction
Table A13.
All 131 One-Hot Encoded Features (continued): Risk, Competence, Consequences, Prevention, Support, Regulation, Satisfaction
| Variable Category | Variable | Total Sample (N=1,873) | Training Set (n=1,498) | Test Set (n=375) | p-value |
|---|---|---|---|---|---|
| Preventative Education | |||||
| Received Preventive Education (n (%)) | 589 (31.4%) | 466 (31.1%) | 123 (32.8%) | 0.819 | |
| Awareness of Treatment Options (n (%)) | 958 (51.1%) | 768 (51.3%) | 190 (50.7%) | 0.979 | |
| Intent to Seek Smartphone Education | |||||
| Participation Intention (M (SD)) | 2.24 (0.72) | 2.25 (0.73) | 2.2 (0.69) | 0.501 | |
| Parental Prevention Efforts | |||||
| Complete Restriction (n (%)) | 1,132 (60.4%) | 912 (60.9%) | 220 (58.7%) | 0.735 | |
| Teaches How to Use the Phone Use (n (%)) | 811 (43.3%) | 652 (43.5%) | 159 (42.4%) | 0.926 | |
| Restrict Smartphone Apps (n (%)) | 1,132 (60.4%) | 912 (60.9%) | 220 (58.7%) | 0.735 | |
| Teaches Pros and Cons (n (%)) | 1,112 (59.4%) | 885 (59.1%) | 227 (60.5%) | 0.877 | |
| Recommends Good Apps (n (%)) | 825 (44.0%) | 650 (43.4%) | 175 (46.7%) | 0.521 | |
| Uses Good Apps Together (n (%)) | 555 (29.6%) | 439 (29.3%) | 116 (30.9%) | 0.827 | |
| Plays Good Games Together (n (%)) | 506 (27.0%) | 393 (26.2%) | 113 (30.1%) | 0.315 | |
| Family Smartphone Rules (n (%)) | 759 (40.5%) | 599 (40.0%) | 160 (42.7%) | 0.640 | |
| Social Support | |||||
| Family Support (M (SD)) | 3.24 (0.71) | 3.23 (0.71) | 3.27 (0.70) | 0.616 | |
| Friend Support (M (SD)) | 3.12 (0.68) | 3.11 (0.67) | 3.13 (0.70) | 0.940 | |
| Societal Fairness Perception (M (SD)) | 2.9 (0.75) | 2.91 (0.74) | 2.86 (0.76) | 0.520 | |
| Self-Regulation Assessments | |||||
| Smartphone Usage Avoid While Walking (n (%)) | 1,196 (63.9%) | 949 (63.4%) | 247 (65.9%) | 0.663 | |
| Smartphone Usage Habits Check (n (%)) | 508 (27.1%) | 408 (27.2%) | 100 (26.7%) | 0.976 | |
| Smartphone Use History Check (n (%)) | 398 (21.2%) | 311 (20.8%) | 87 (23.2%) | 0.587 | |
| Digital Detox (n (%)) | 418 (22.3%) | 349 (23.3%) | 69 (18.4%) | 0.126 | |
| Designated Placement (n (%)) | 591 (31.6%) | 468 (31.2%) | 123 (32.8%) | 0.845 | |
| Use of Work Mode (n (%)) | 866 (46.2%) | 689 (46.0%) | 177 (47.2%) | 0.916 | |
| Engaging in Conversation (n (%)) | 793 (42.3%) | 647 (43.2%) | 146 (38.9%) | 0.328 | |
| Hobby Engagement (n (%)) | 514 (27.4%) | 409 (27.3%) | 105 (28.0%) | 0.964 | |
| Life Satisfaction | |||||
| Relationship Satisfaction (M (SD)) | 3.27 (0.59) | 3.27 (0.60) | 3.25 (0.57) | 0.798 | |
| Work Satisfaction (M (SD)) | 2.92 (0.71) | 2.92 (0.70) | 2.9 (0.75) | 0.853 | |
| Leisure Satisfaction (M (SD)) | 2.86 (0.72) | 2.87 (0.72) | 2.82 (0.69) | 0.384 | |
| Overall Life Satisfaction (M (SD)) | 3.07 (0.59) | 3.06 (0.59) | 3.07 (0.62) | 0.969 | |
Note. p-values are based on comparisons between the training and test sets when cell sizes . One-way ANOVA was used for continuous variables; Pearson’s chi-square test was used for categorical variables. *p < .05 considered statistically significant.
Table A14.
Performance metrics across nested AI/ML models for smartphone overdependence
| Model | Name | Algorithm | AUC | Mean Val Loss | Test Loss | # Features |
|---|---|---|---|---|---|---|
| M0 | Demographics | RF | 0.51 | 0.69 | 0.69 | 5 |
| M1 | +Urbanicity | DT | 0.57 | 0.70 | 0.69 | 8 |
| M2 | +Intent to Seek Smartphone Edu | RF | 0.63 | 0.67 | 0.67 | 9 |
| M3 | +Preventative Education Experiences | LightGBM | 0.63 | 0.67 | 0.67 | 11 |
| M4 | +Smartphone Use Cases | RF | 0.81 | 0.58 | 0.55 | 59 |
| M5 | +Home Environment | LightGBM | 0.80 | 0.59 | 0.54 | 66 |
| M6 | +Parental Prevention Efforts | XGB | 0.82 | 0.58 | 0.53 | 75 |
| M7 | +Social Support | RF | 0.80 | 0.59 | 0.57 | 78 |
| M8 | +Self-Regulation Assessments | XGB | 0.82 | 0.56 | 0.54 | 86 |
| M9 | +Perceived Digital Competence & Risk | XGB | 0.89 | 0.48 | 0.47 | 120 |
| M10 | +Life Satisfaction | RF | 0.88 | 0.51 | 0.47 | 124 |
| M11 | +Smartphone Consequences & Dependence | XGB | 0.92 | 0.45 | 0.39 | 131 |
Note: We compare AUC (area under the receiver operating characteristic curve), mean validation loss, test loss and number of features across models. Algorithms used are Random Forest (RF), Decision Tree (DT), Light Gradient-Boosting Machine (LightGBM), Extreme Gradient Boosting (XGBoost).
Table A15.
Performance metrics between construct-based AI/ML models for smartphone overdependence
| Construct | Shorthand | Algorithm | AUC | Mean Val Loss | Test Loss | # Features |
|---|---|---|---|---|---|---|
| Smartphone Consequences & Dependence | Smart CD | LightGBM | 0.89 | 0.50 | 0.42 | 7 |
| Perceived Digital Competence & Risk | Perceived DCR | XGB | 0.84 | 0.52 | 0.49 | 34 |
| Smartphone Use Cases | Use Case | XGB | 0.80 | 0.59 | 0.54 | 48 |
| Self-Regulation Assessments | Self-Reg | RF | 0.64 | 0.67 | 0.66 | 8 |
| Parental Prevention Efforts | Par Prev | XGB | 0.62 | 0.68 | 0.67 | 9 |
| Intent to Seek Smartphone Edu | Intent Edu | LogReg | 0.61 | 0.67 | 0.67 | 1 |
| Urbanicity | Urb | LogReg | 0.58 | 0.69 | 0.69 | 3 |
| Home Environment | Home Envir | LogReg | 0.56 | 0.70 | 0.69 | 8 |
| Preventative Education Experiences | Prev Edu | DT | 0.55 | 0.69 | 0.69 | 2 |
| Life Satisfaction | Life Sat | RF | 0.54 | 0.69 | 0.69 | 4 |
| Social Support | SoSu | RF | 0.53 | 0.70 | 0.69 | 3 |
| Demographics | Demo | RF | 0.51 | 0.69 | 0.69 | 5 |
Note: We compare AUC (area under the receiver operating characteristic curve), mean validation loss, test loss and number of features across models. Algorithms used are Random Forest (RF), Decision Tree (DT), Light Gradient-Boosting Machine (LightGBM), Extreme Gradient Boosting (XGBoost), and Logistic Regression (LogReg).
Figure A1.
PDP plot of Webtoon in the M4 (+Smartphone Use Cases) model.
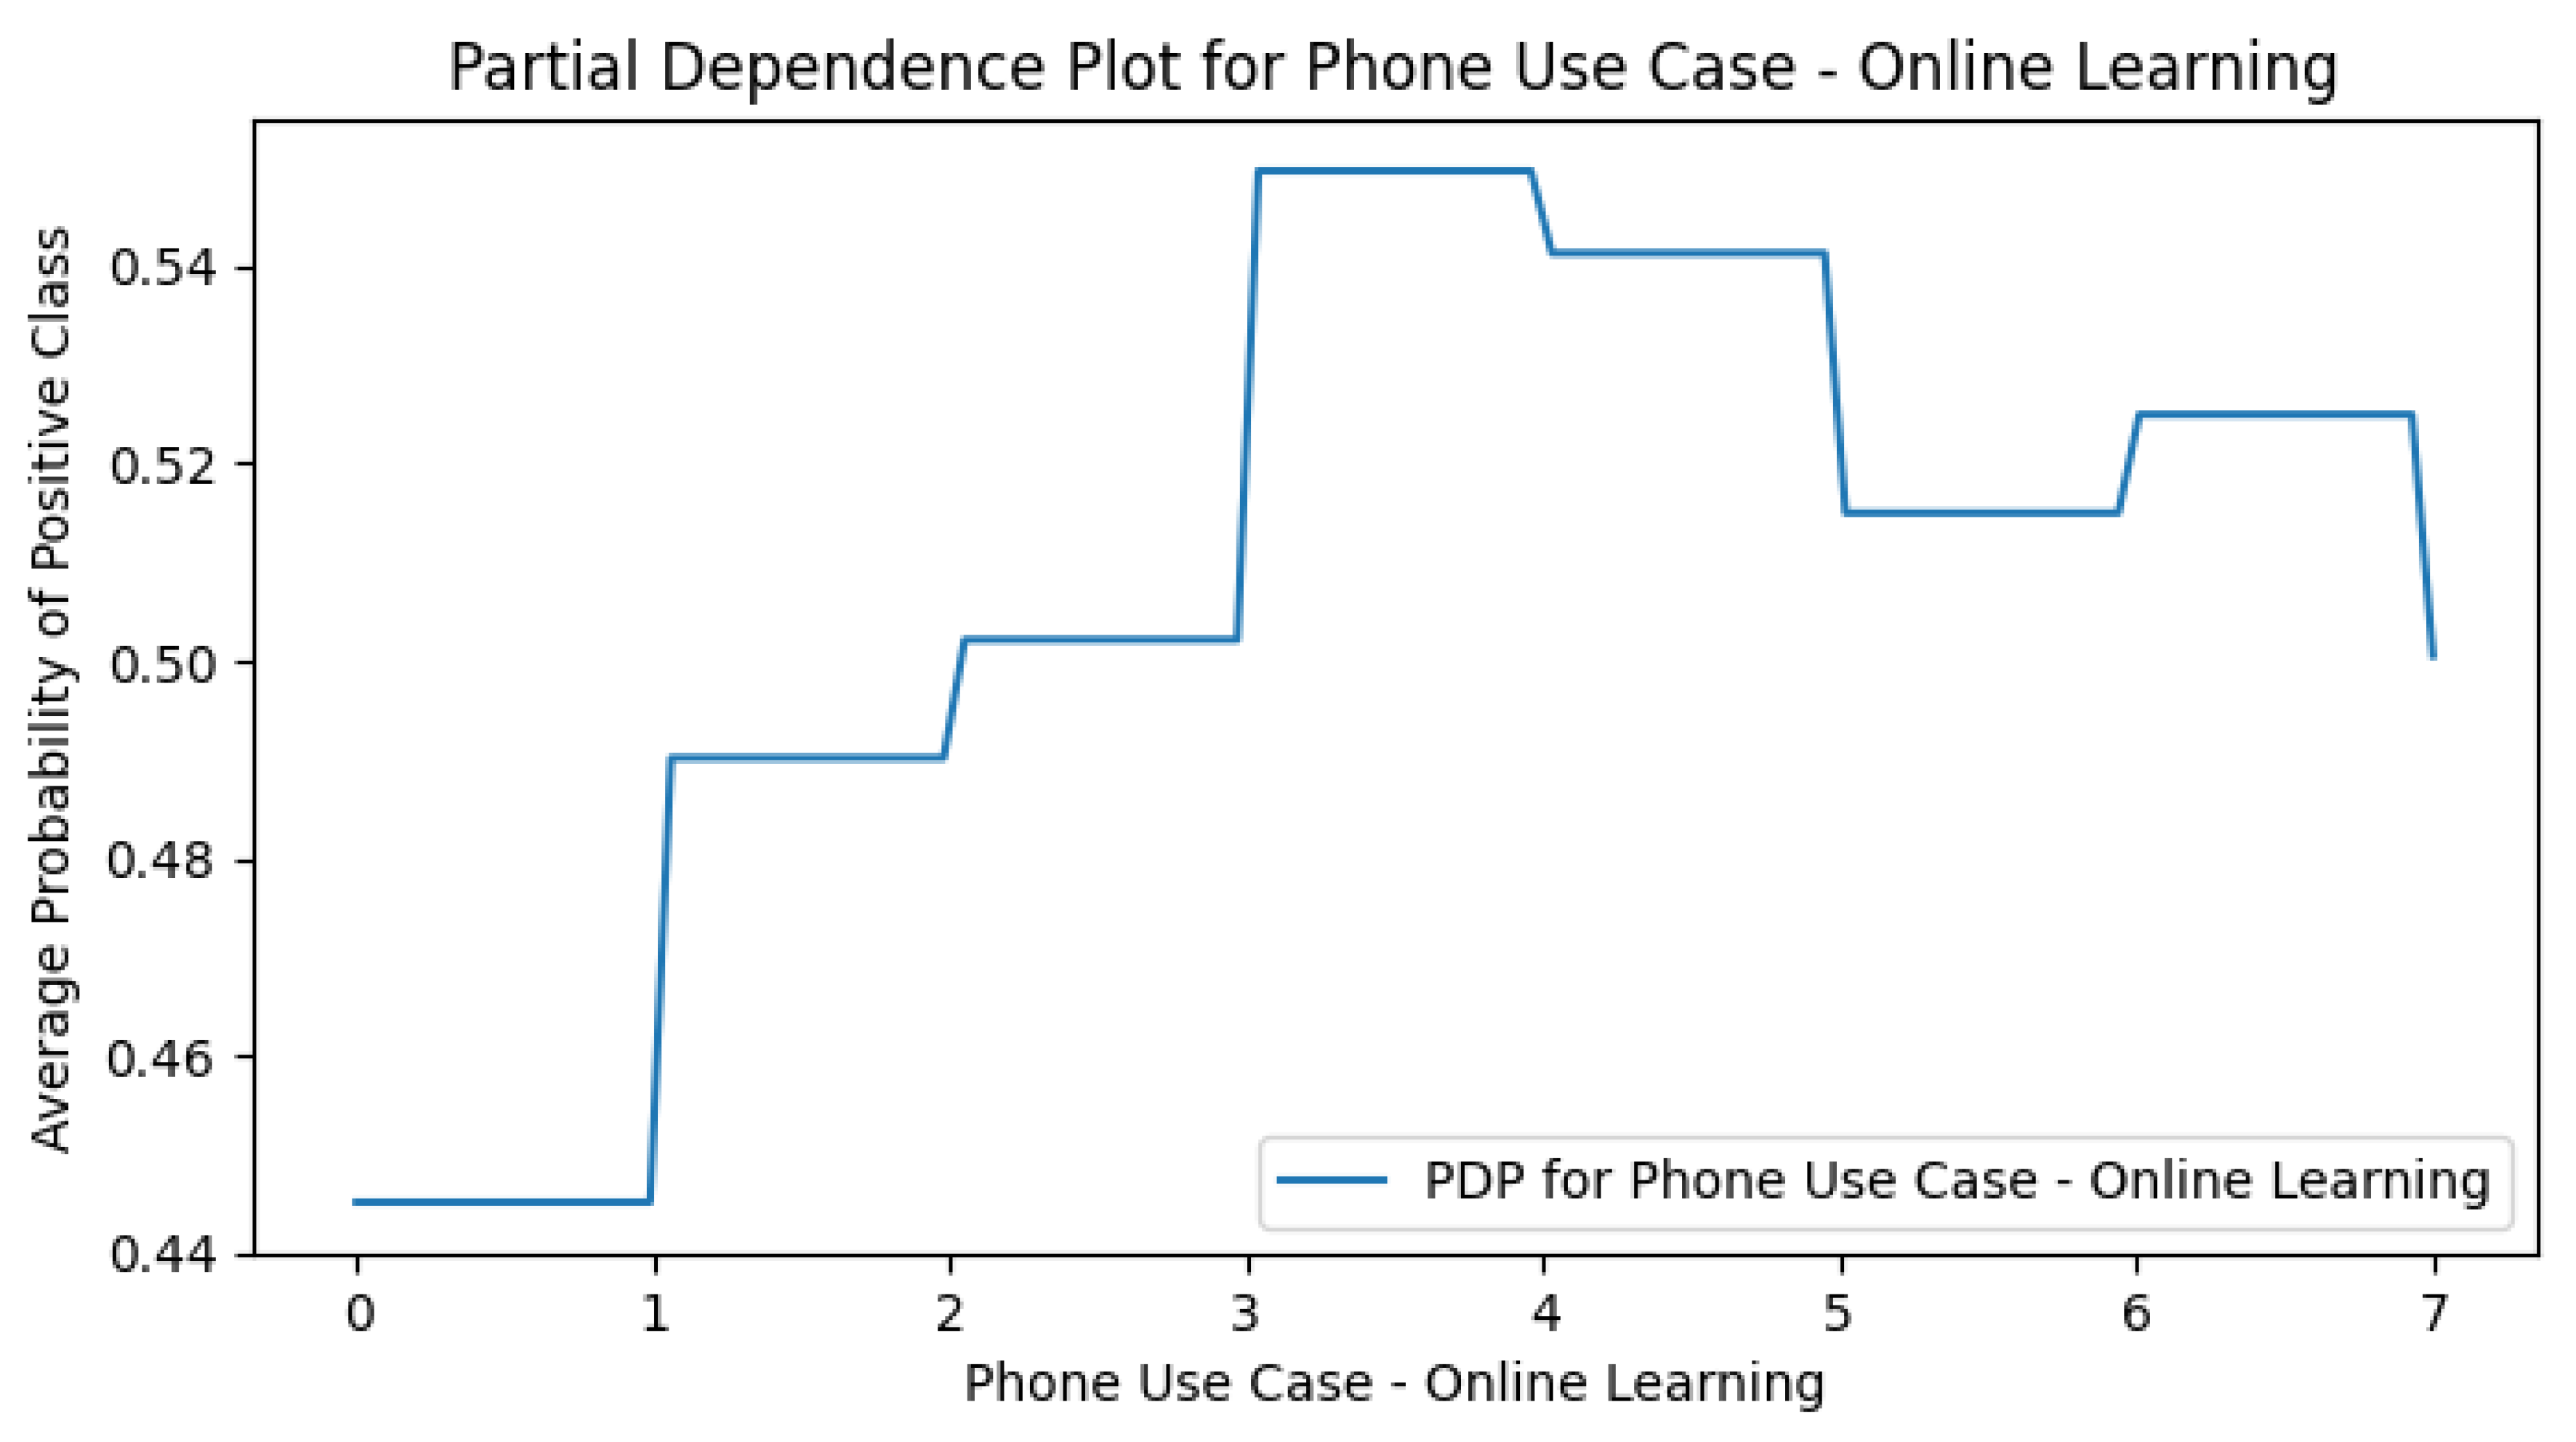
Figure A2.
PDP plot of Messenger in the M4 (+Smartphone Use Cases) model.
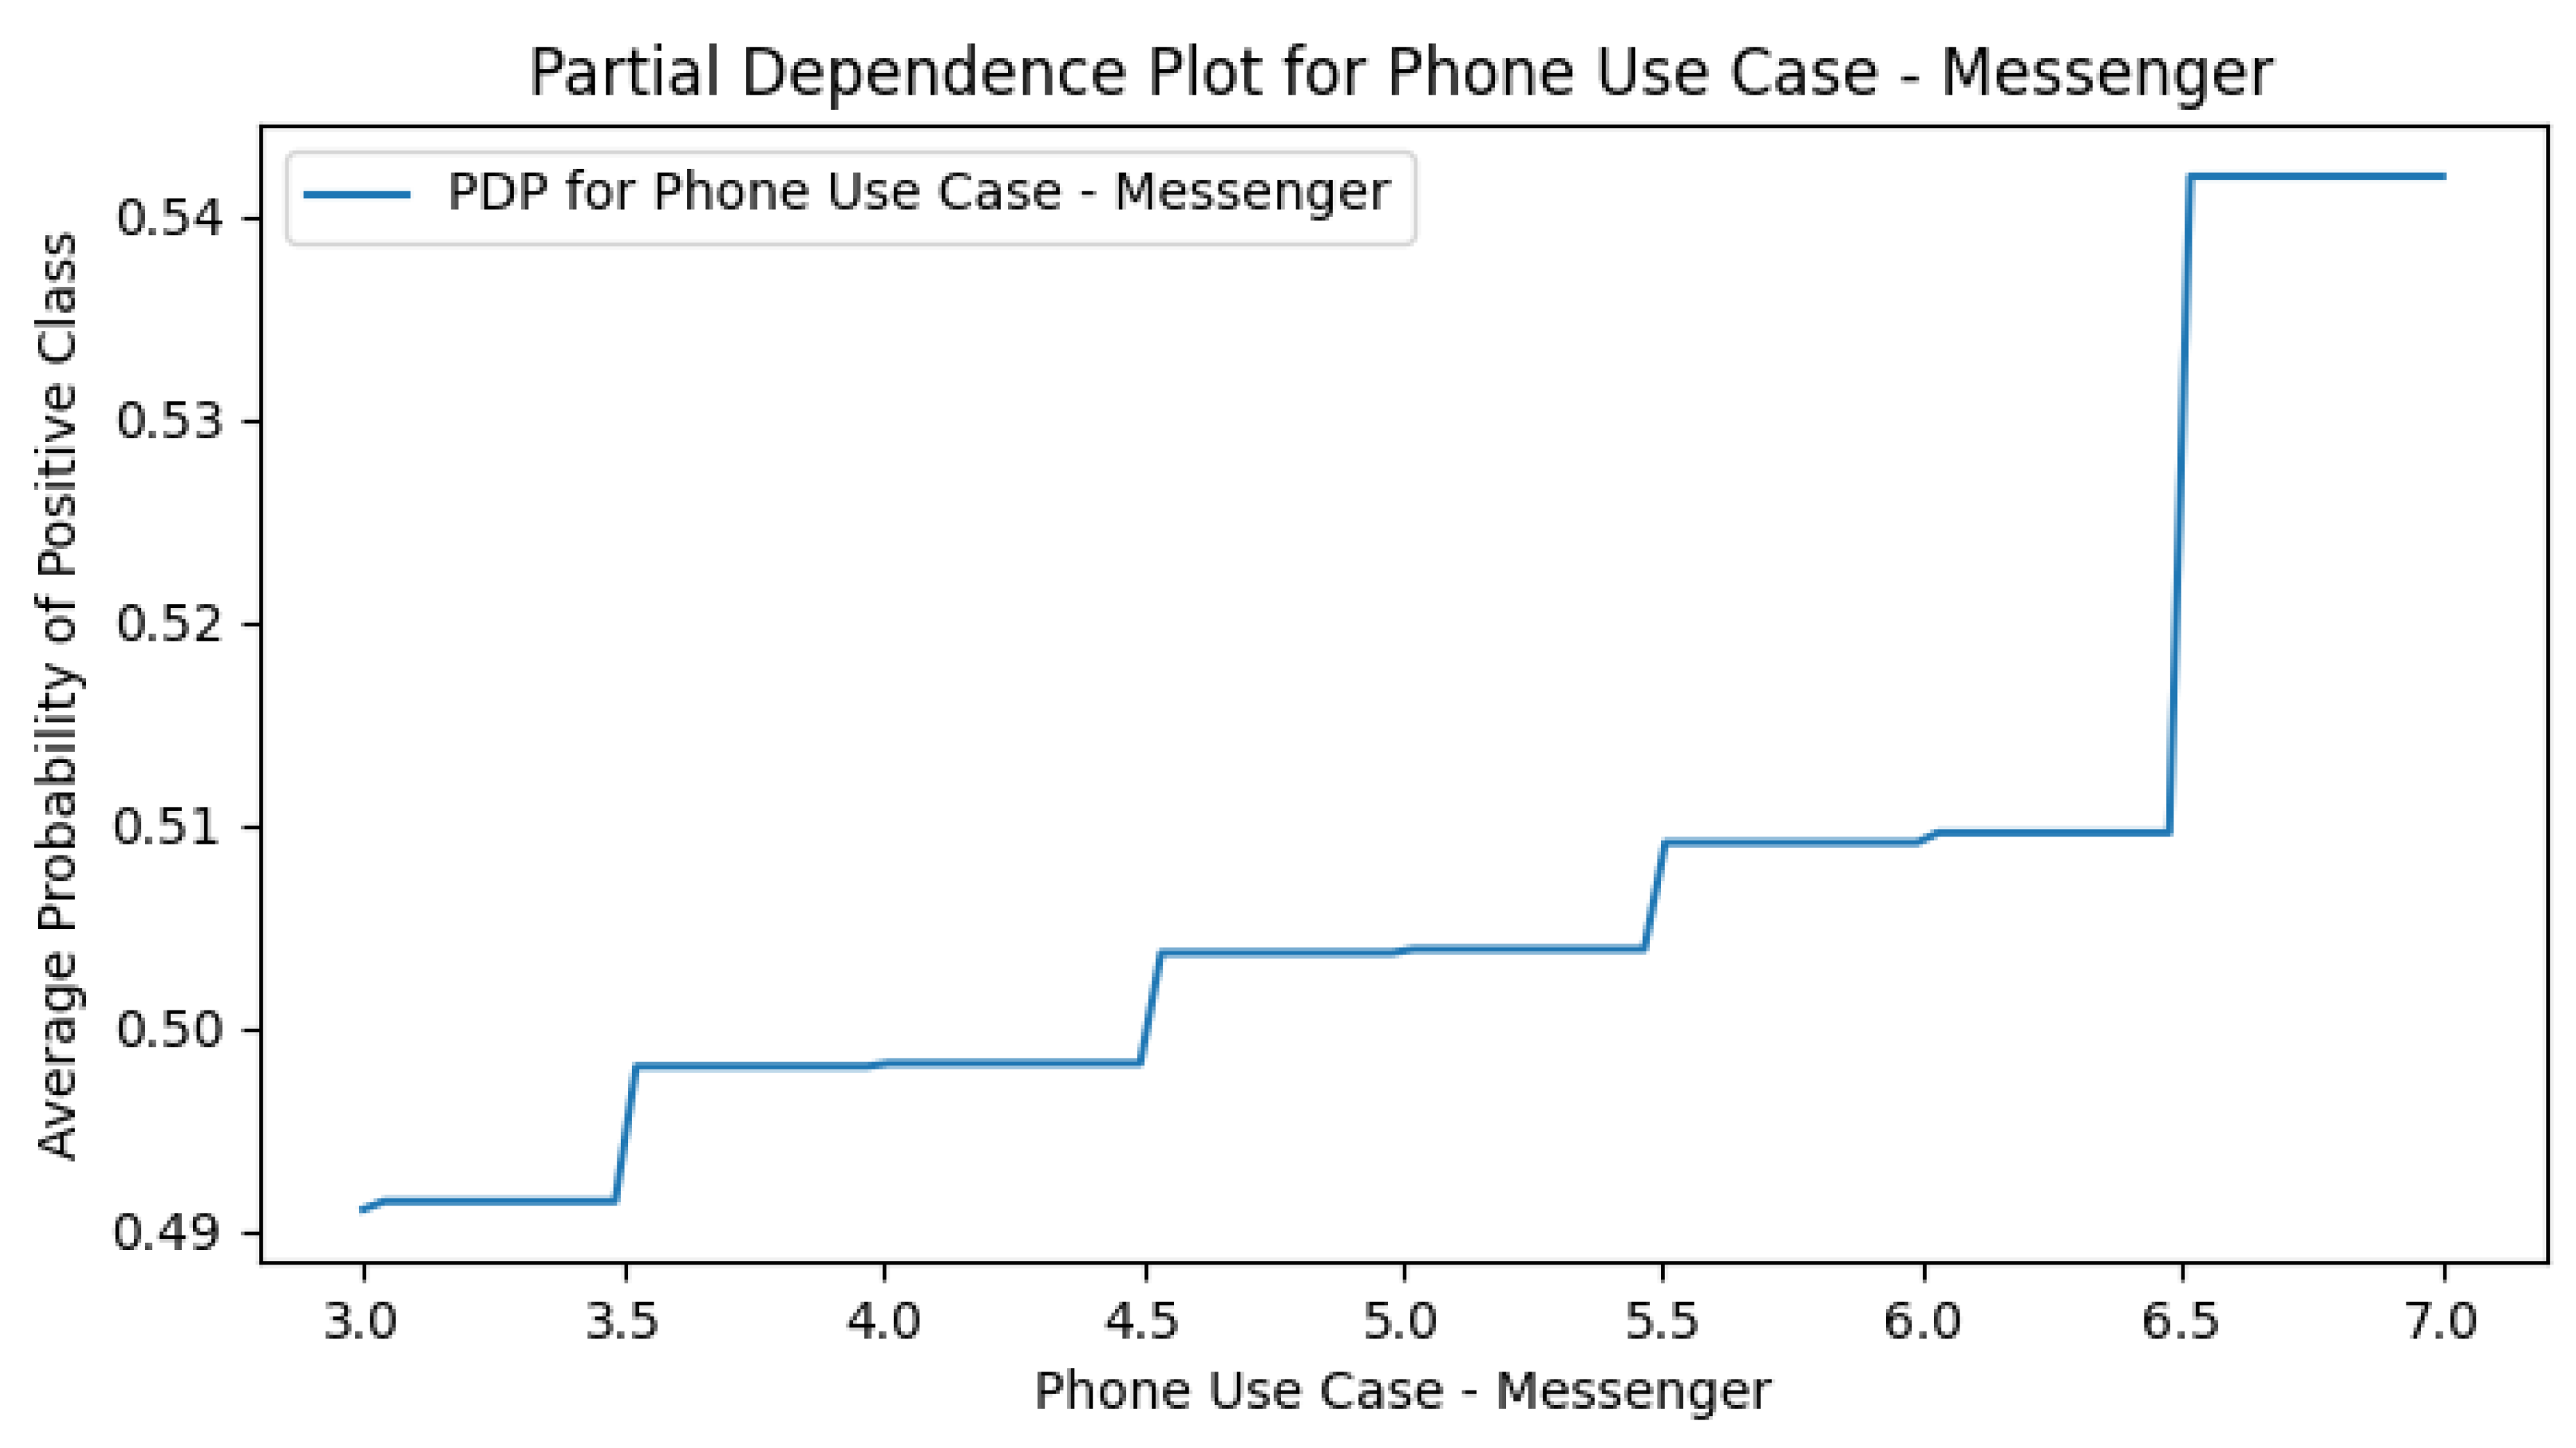
Figure A3.
PDP plot of Scheduling in the M4 (+Smartphone Use Cases) model.
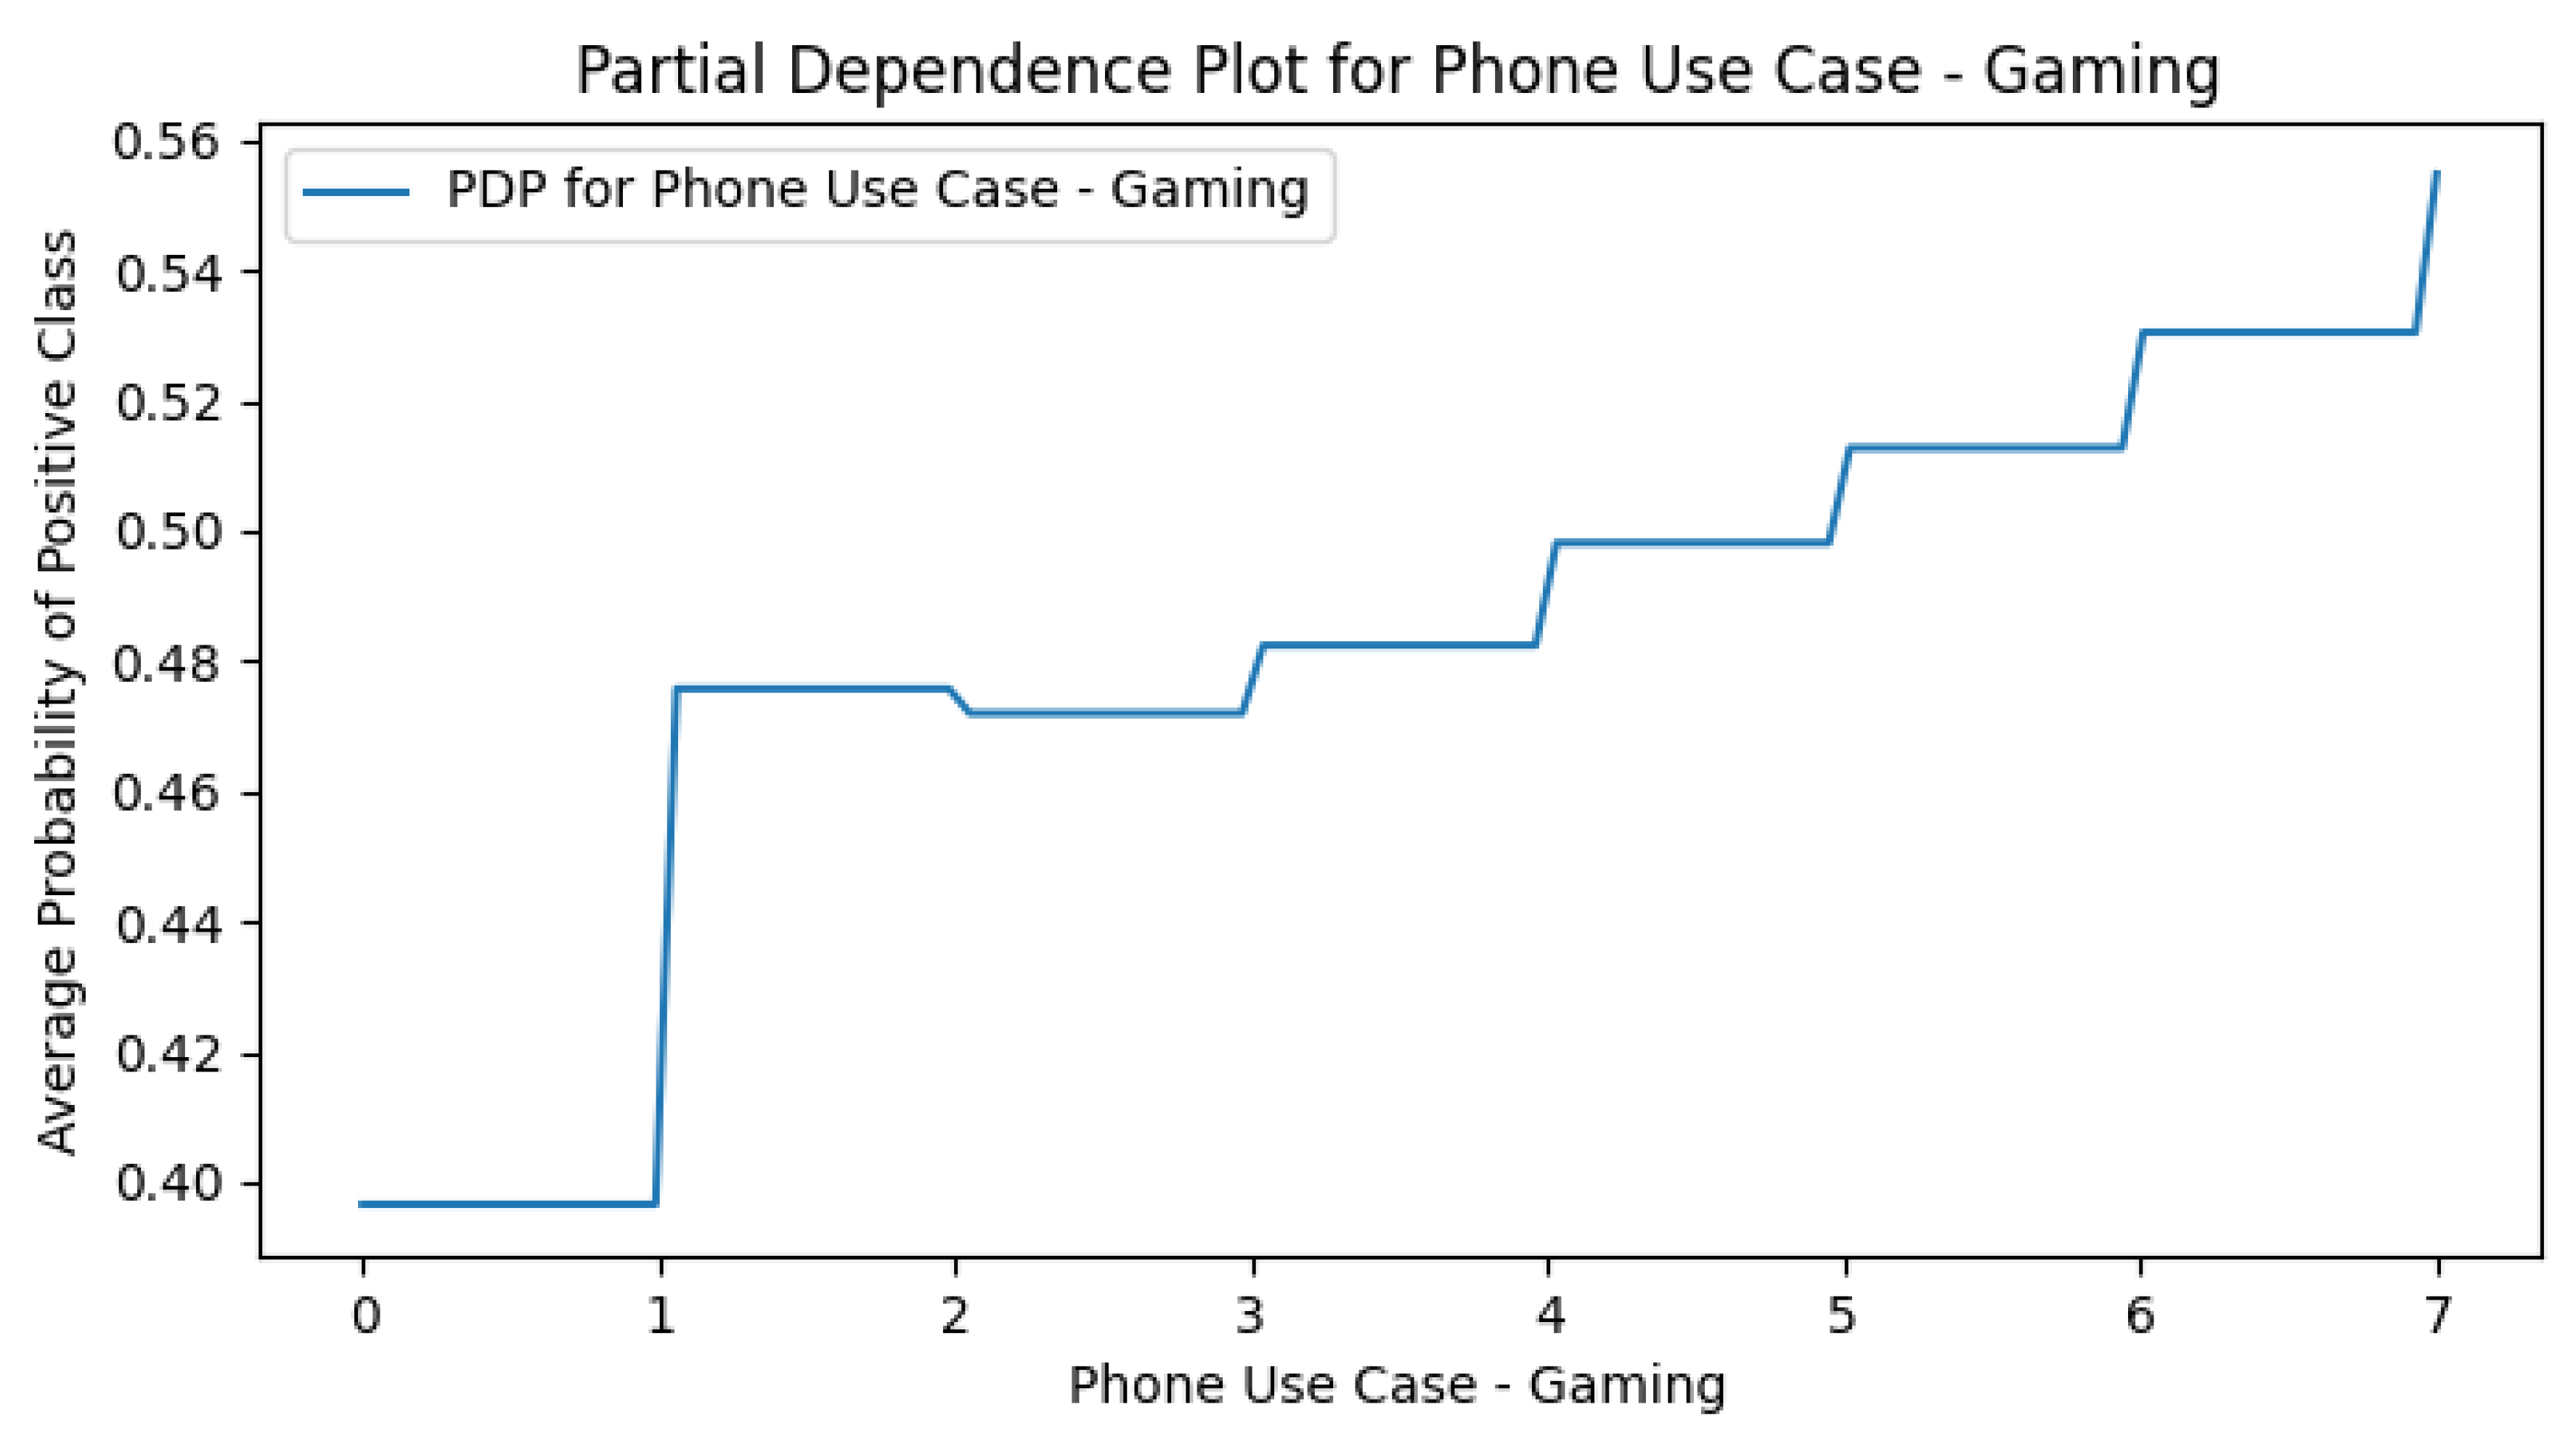
Figure A4.
PDP plot of Online Learning in the M4 (+Smartphone Use Cases) model.
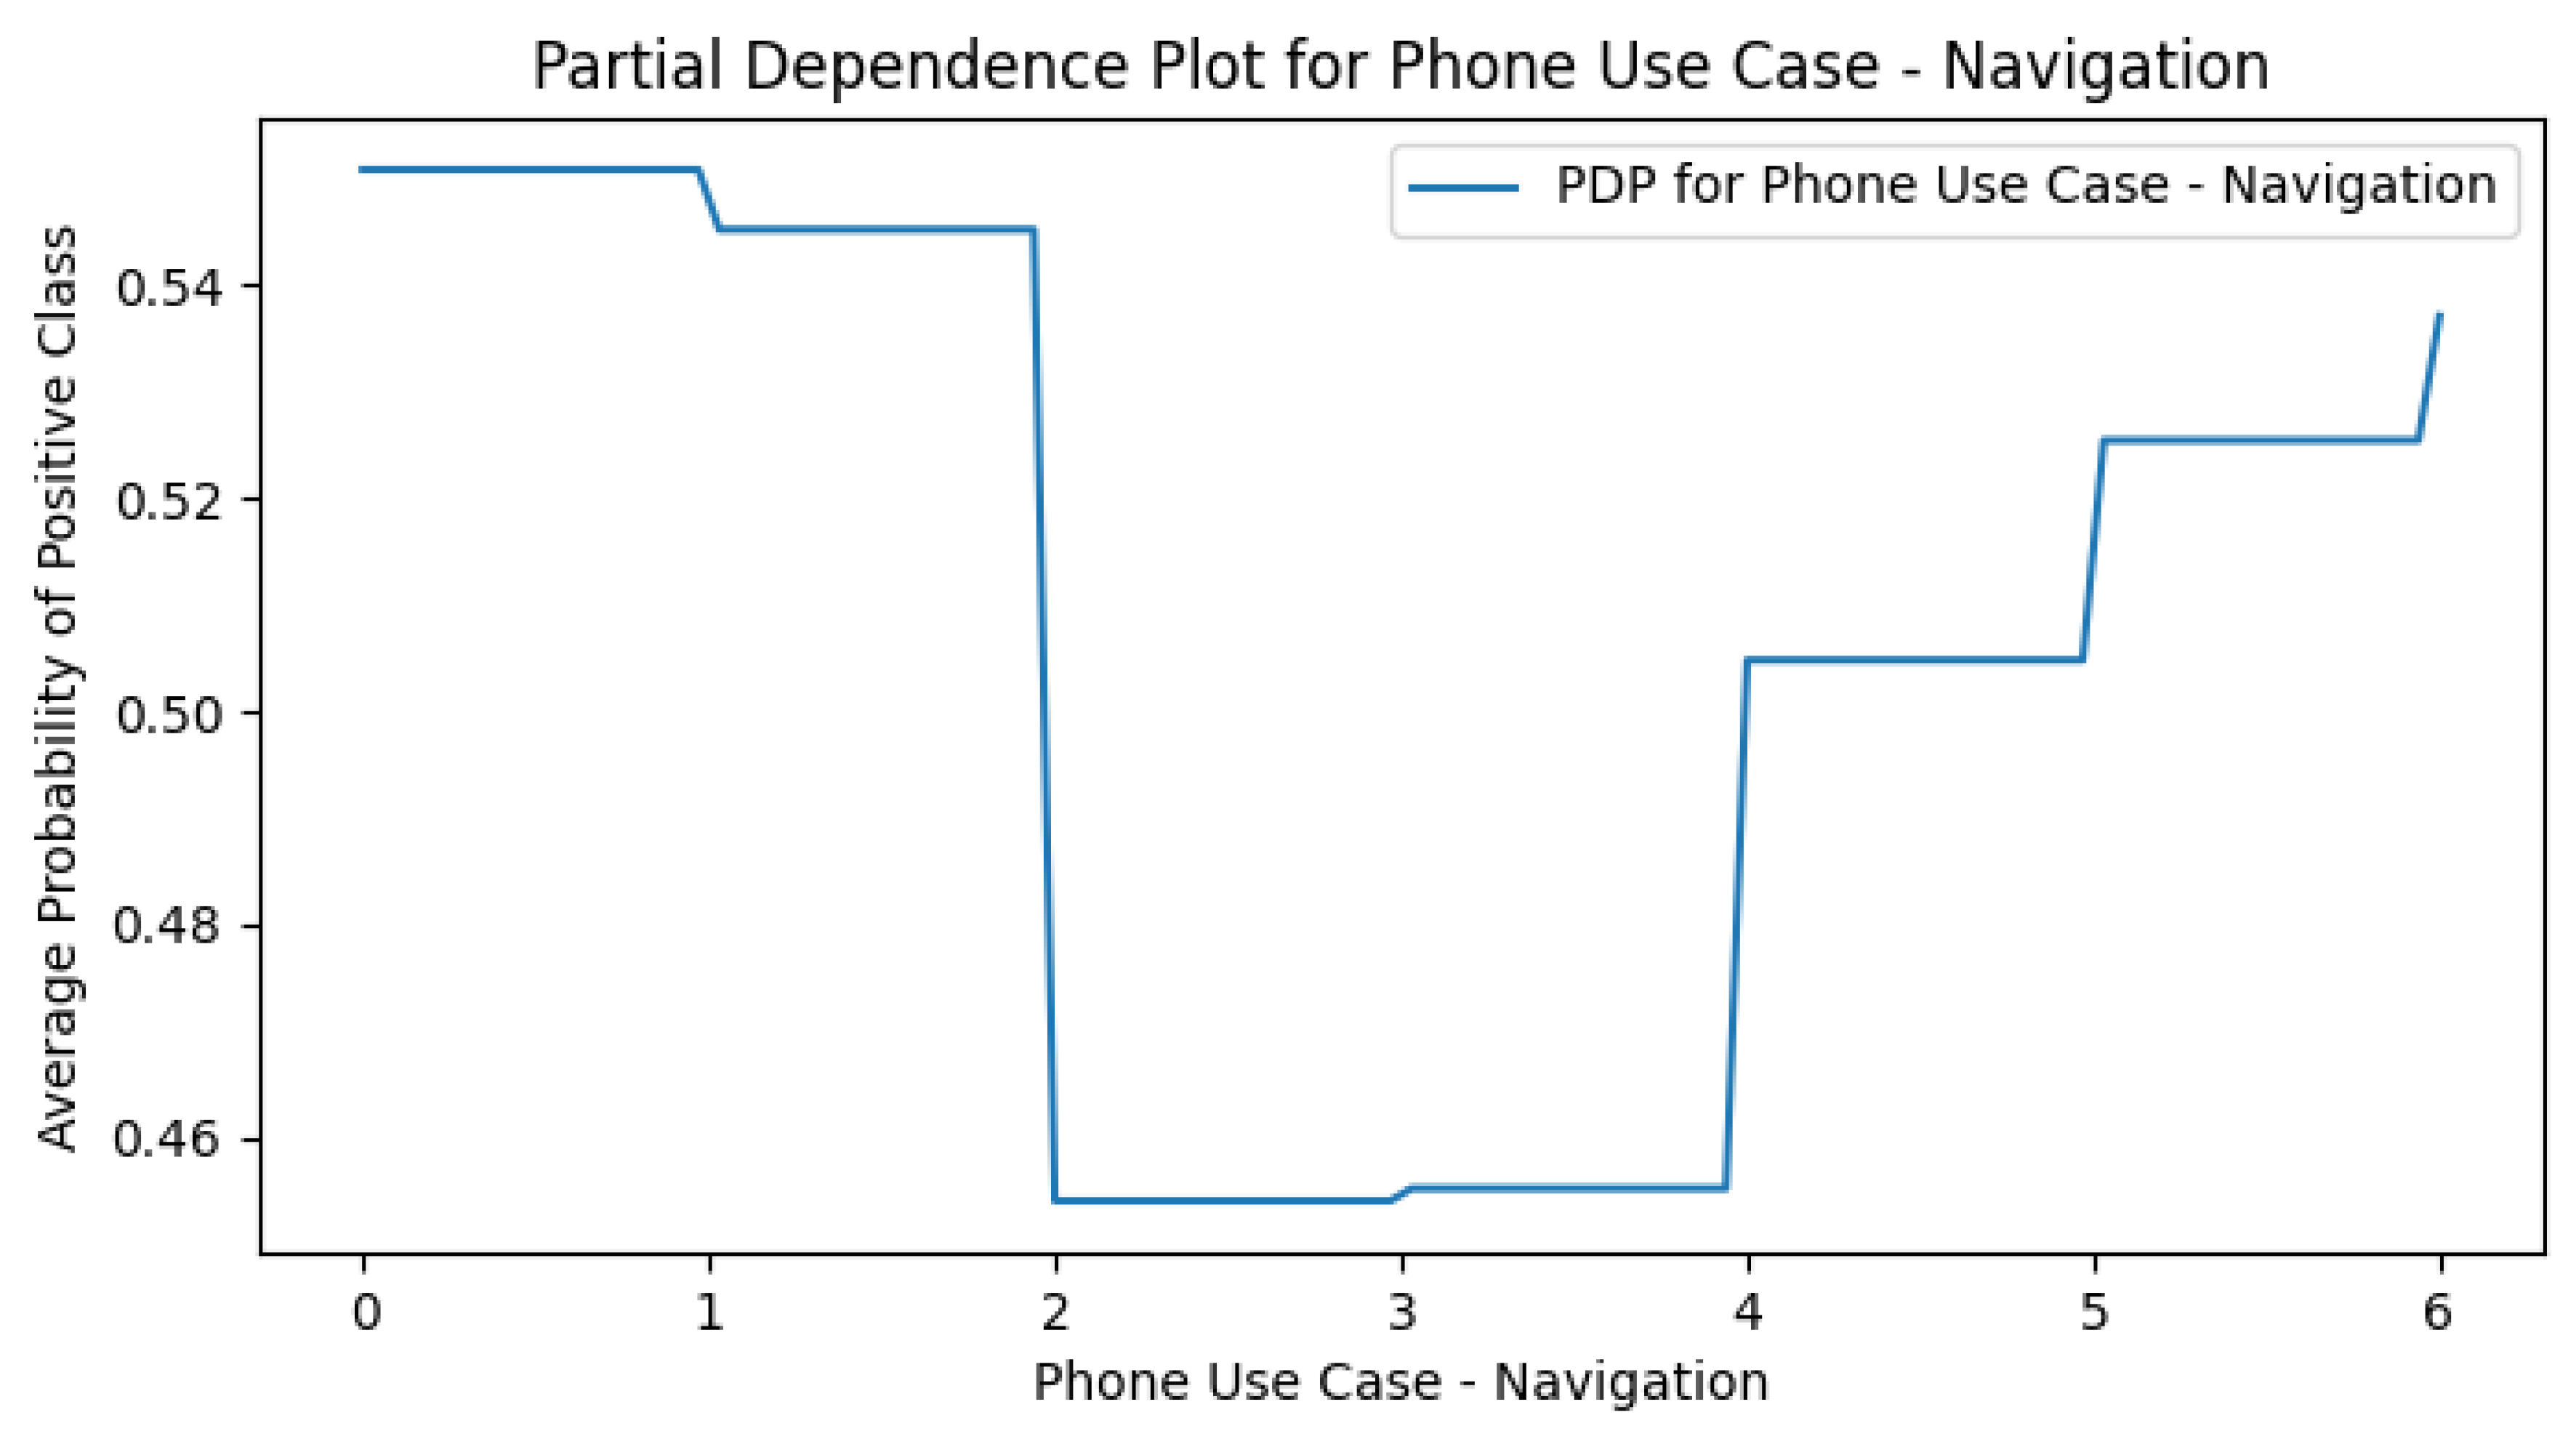
Figure A5.
PDP plot of Online Shopping in the M4 (+Smartphone Use Cases) model.
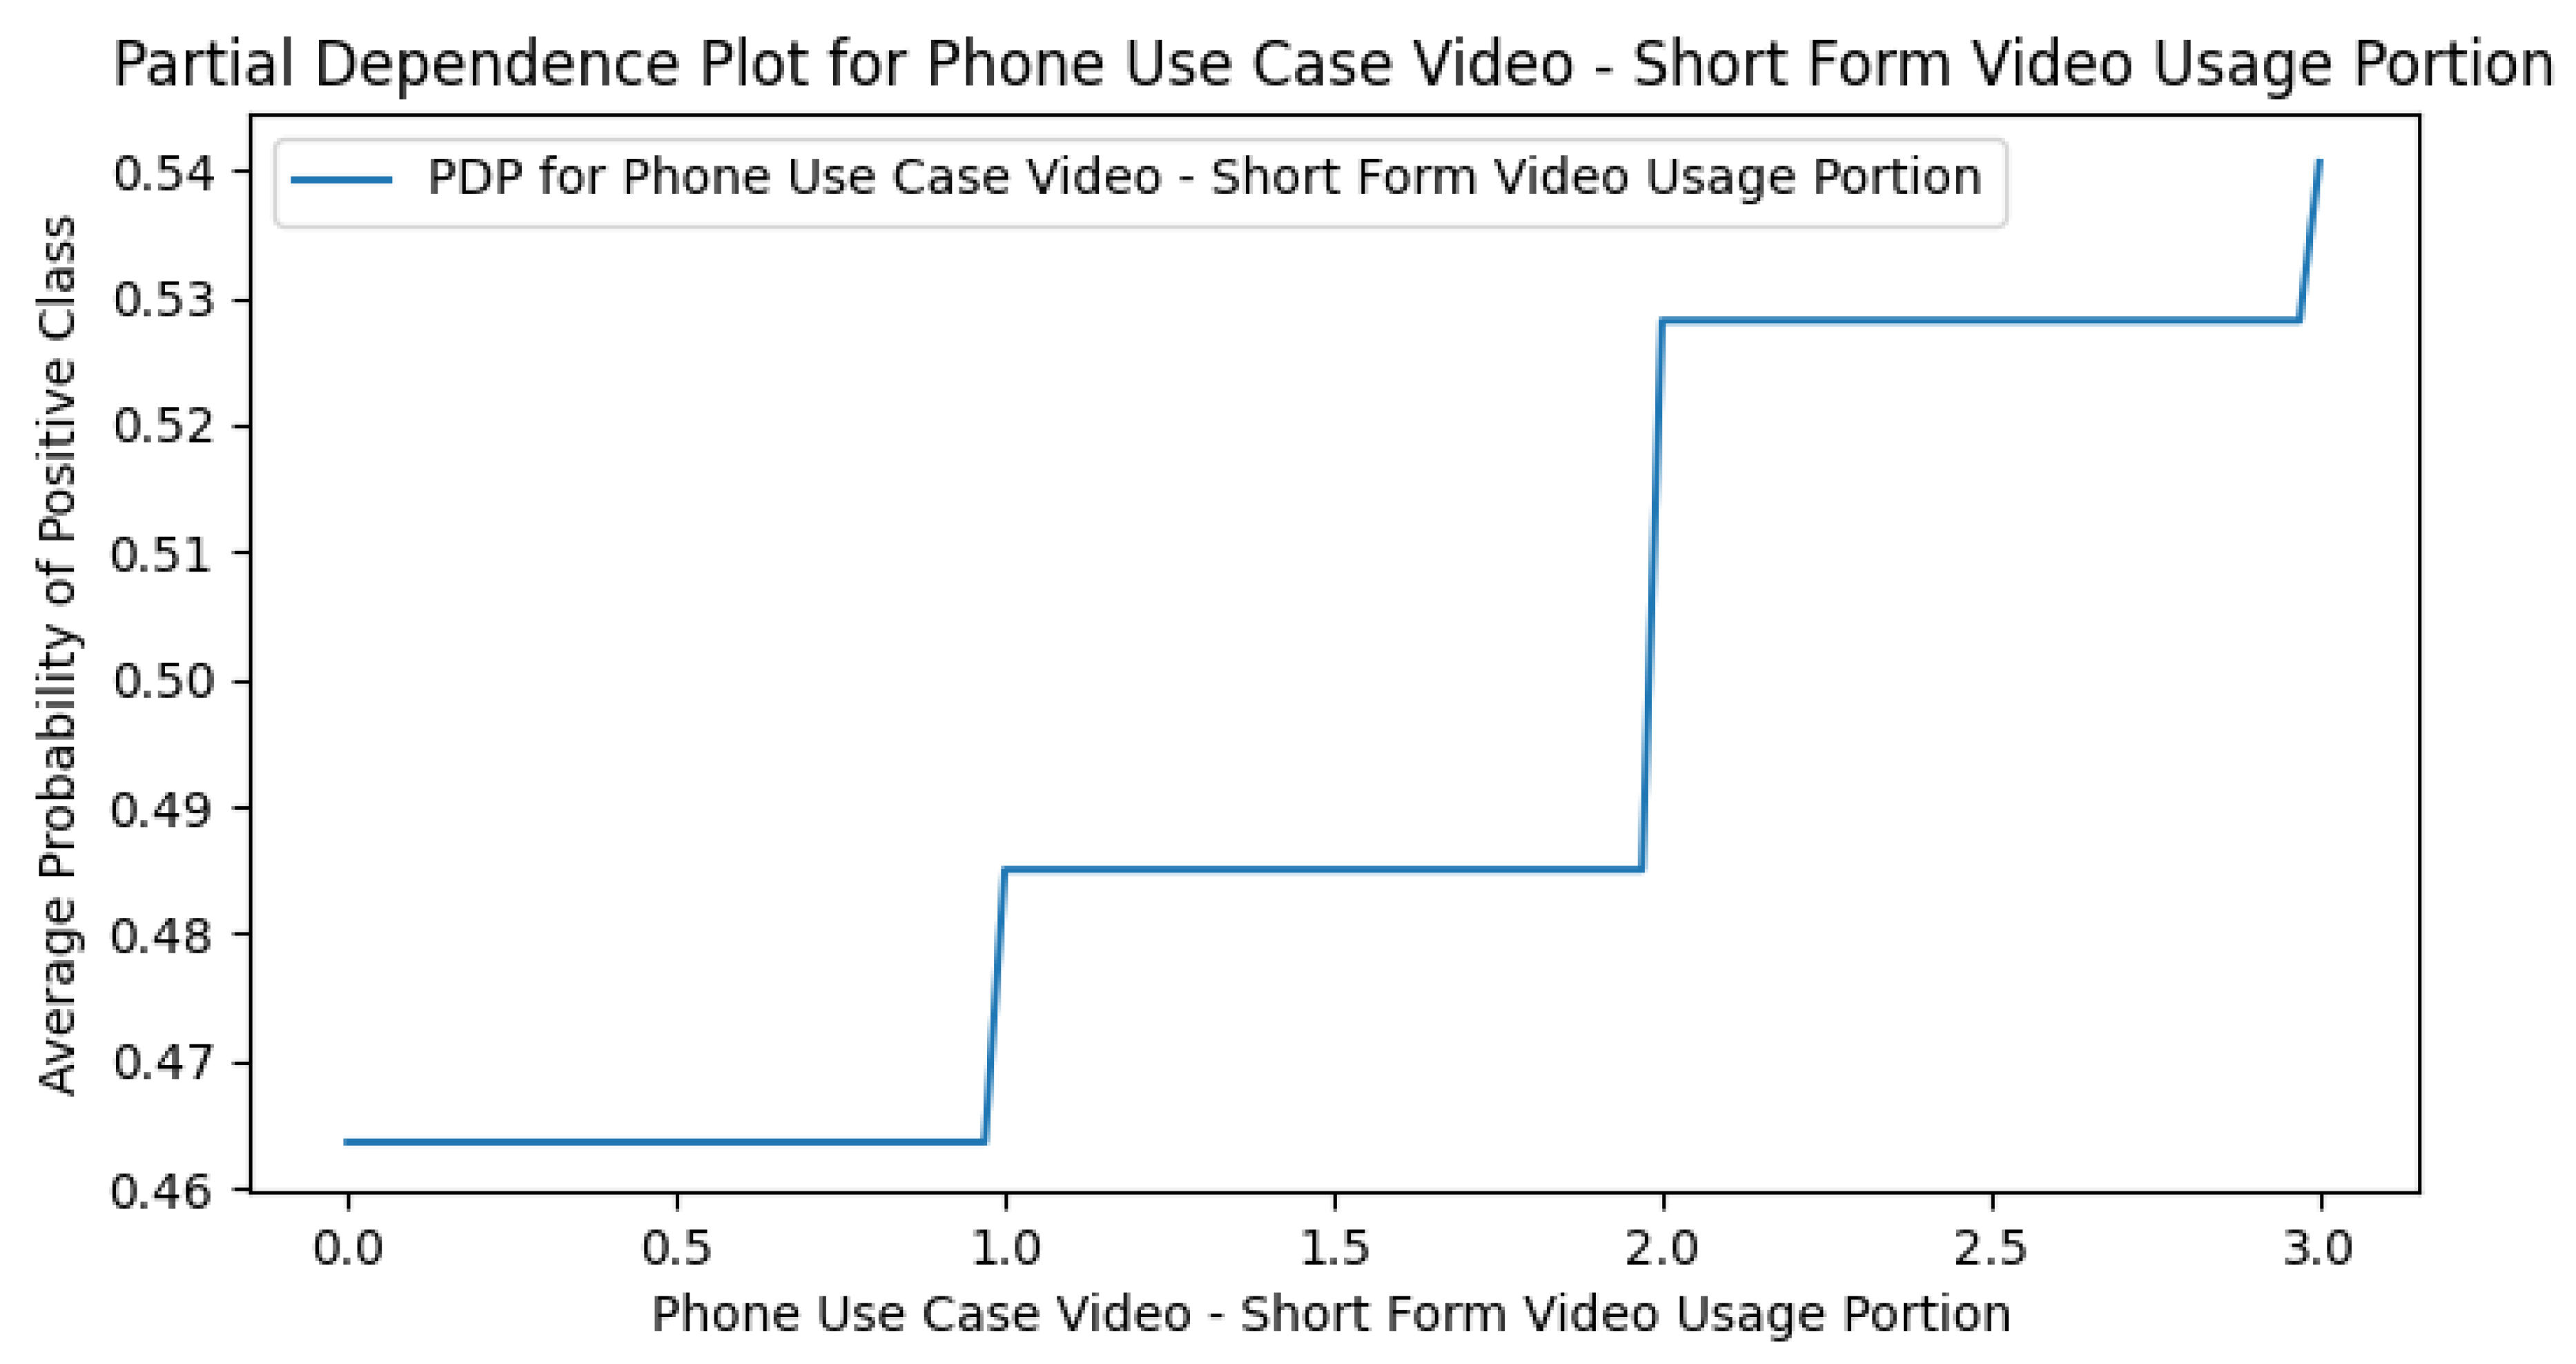
Figure A6.
PDP plot of Selling Goods & Services in the M4 (+Smartphone Use Cases) model.
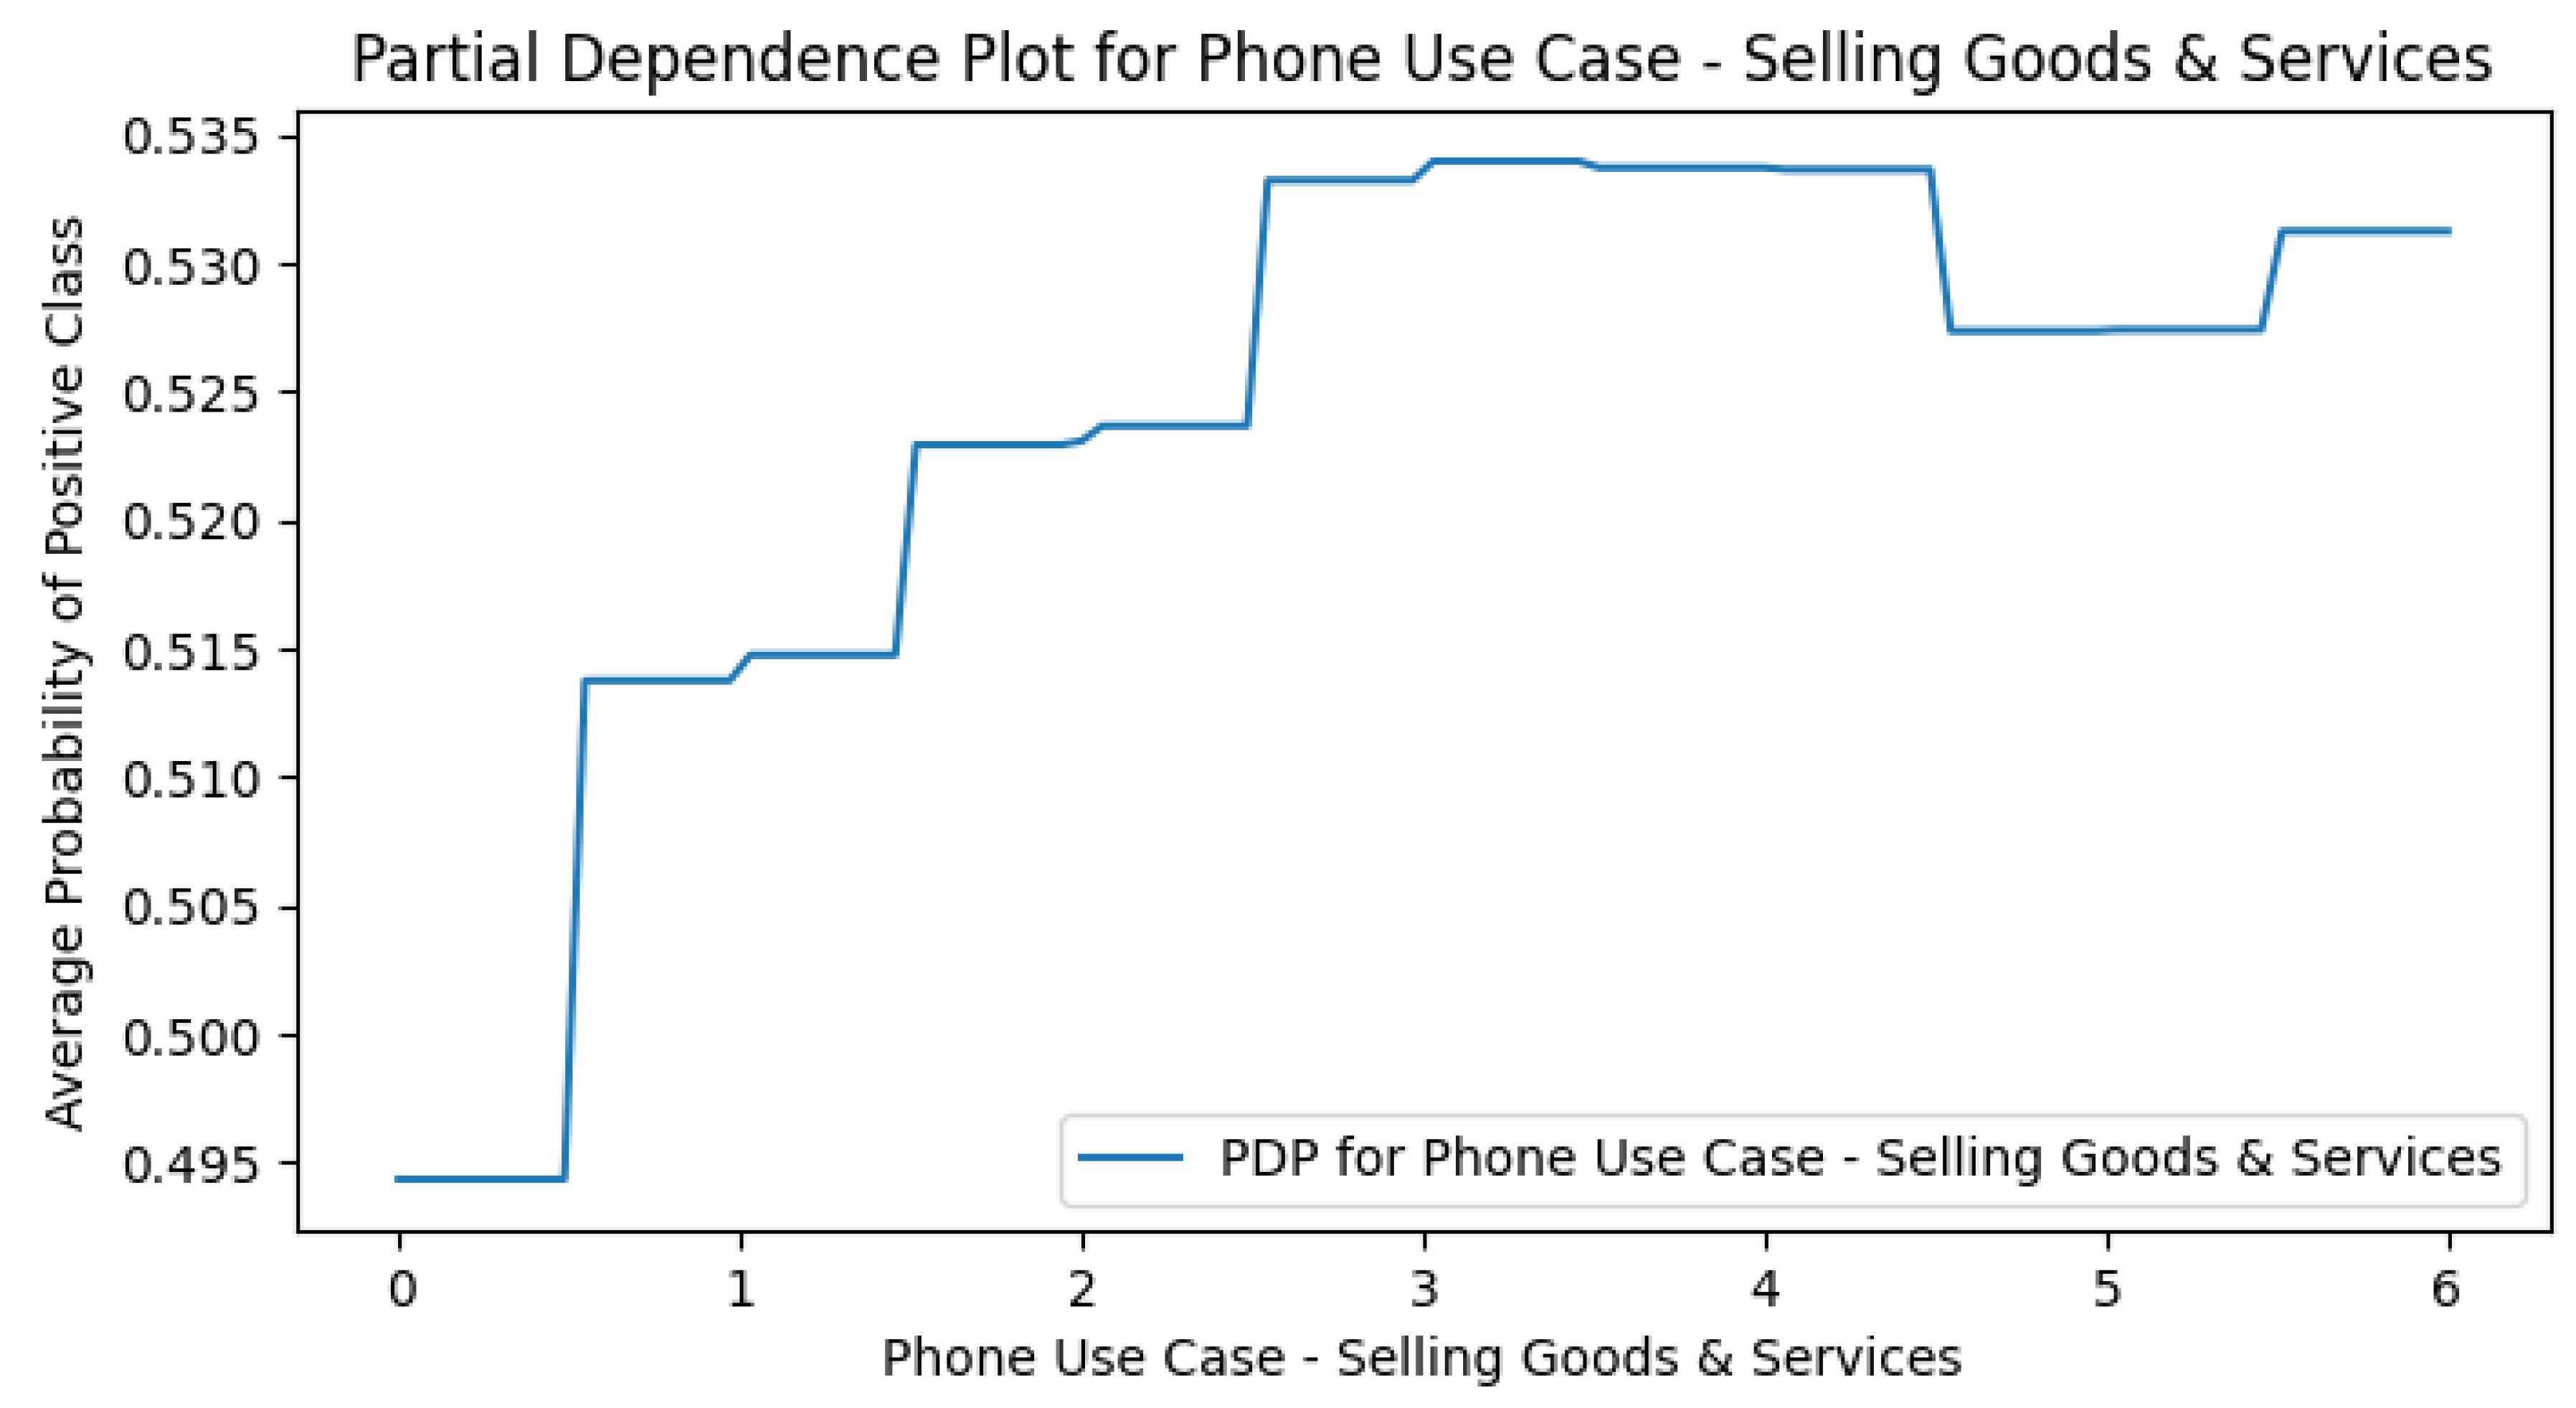
Figure A7.
PDP plot of Depression in the Smart CD model.
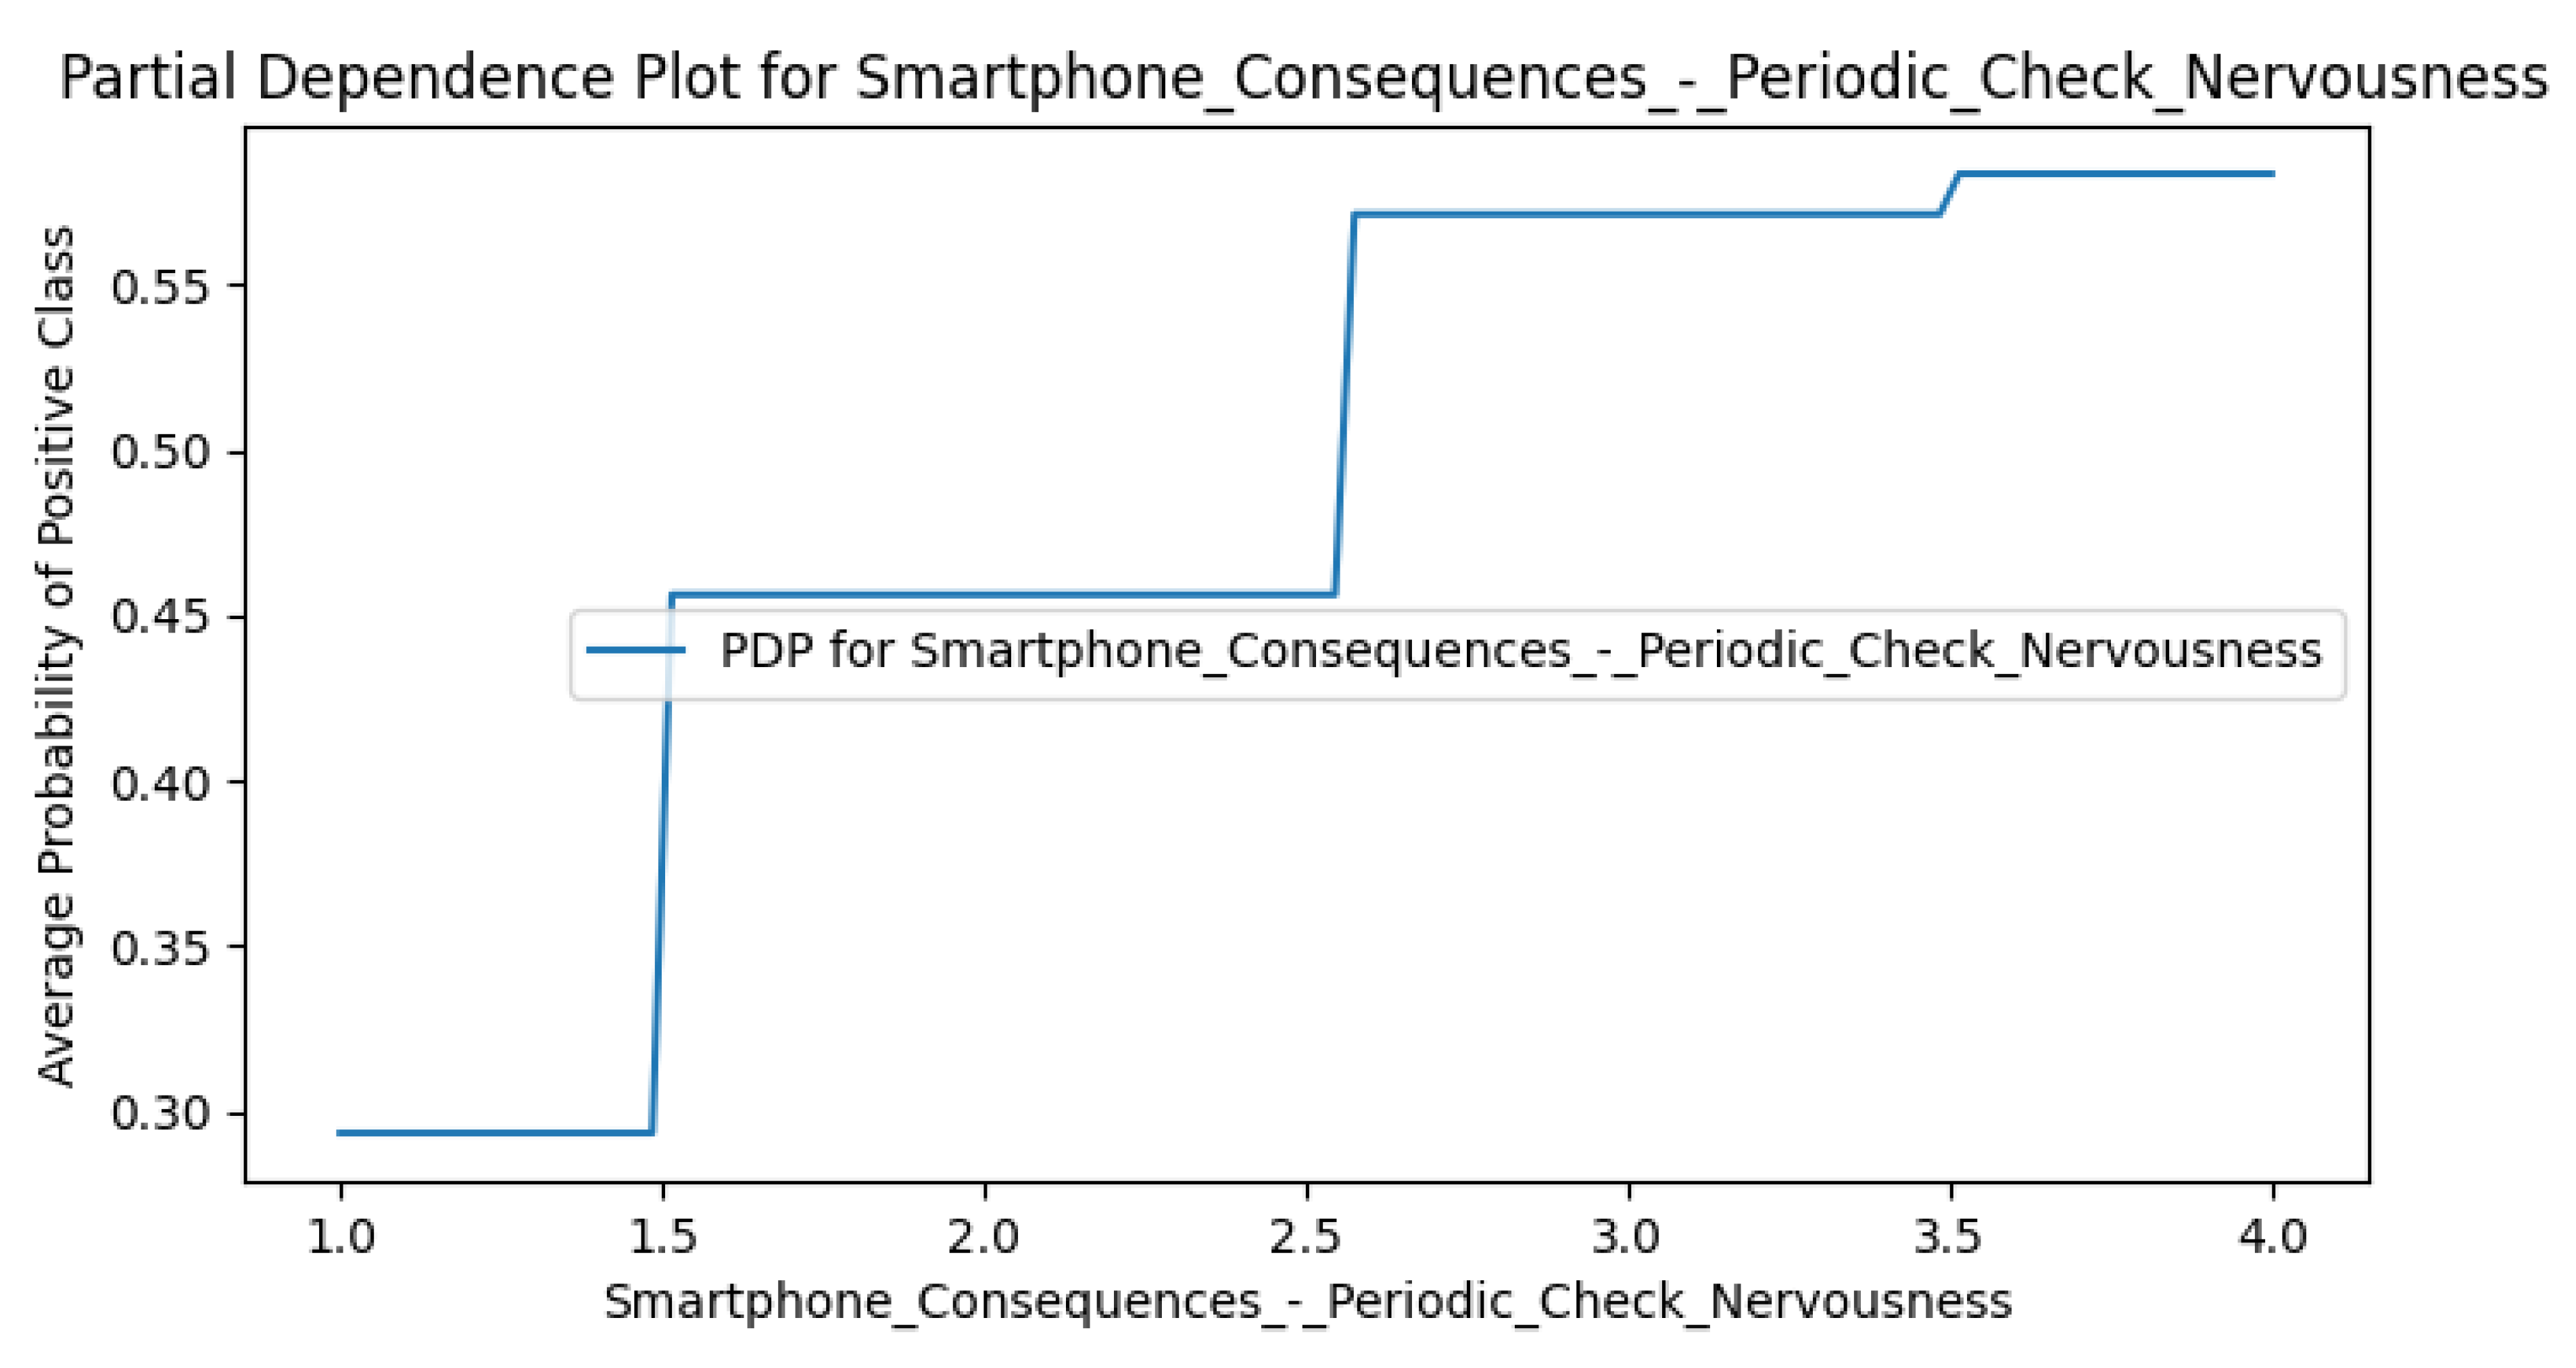
Figure A8.
PDP plot of Sleep Issues in the Smart CD model.
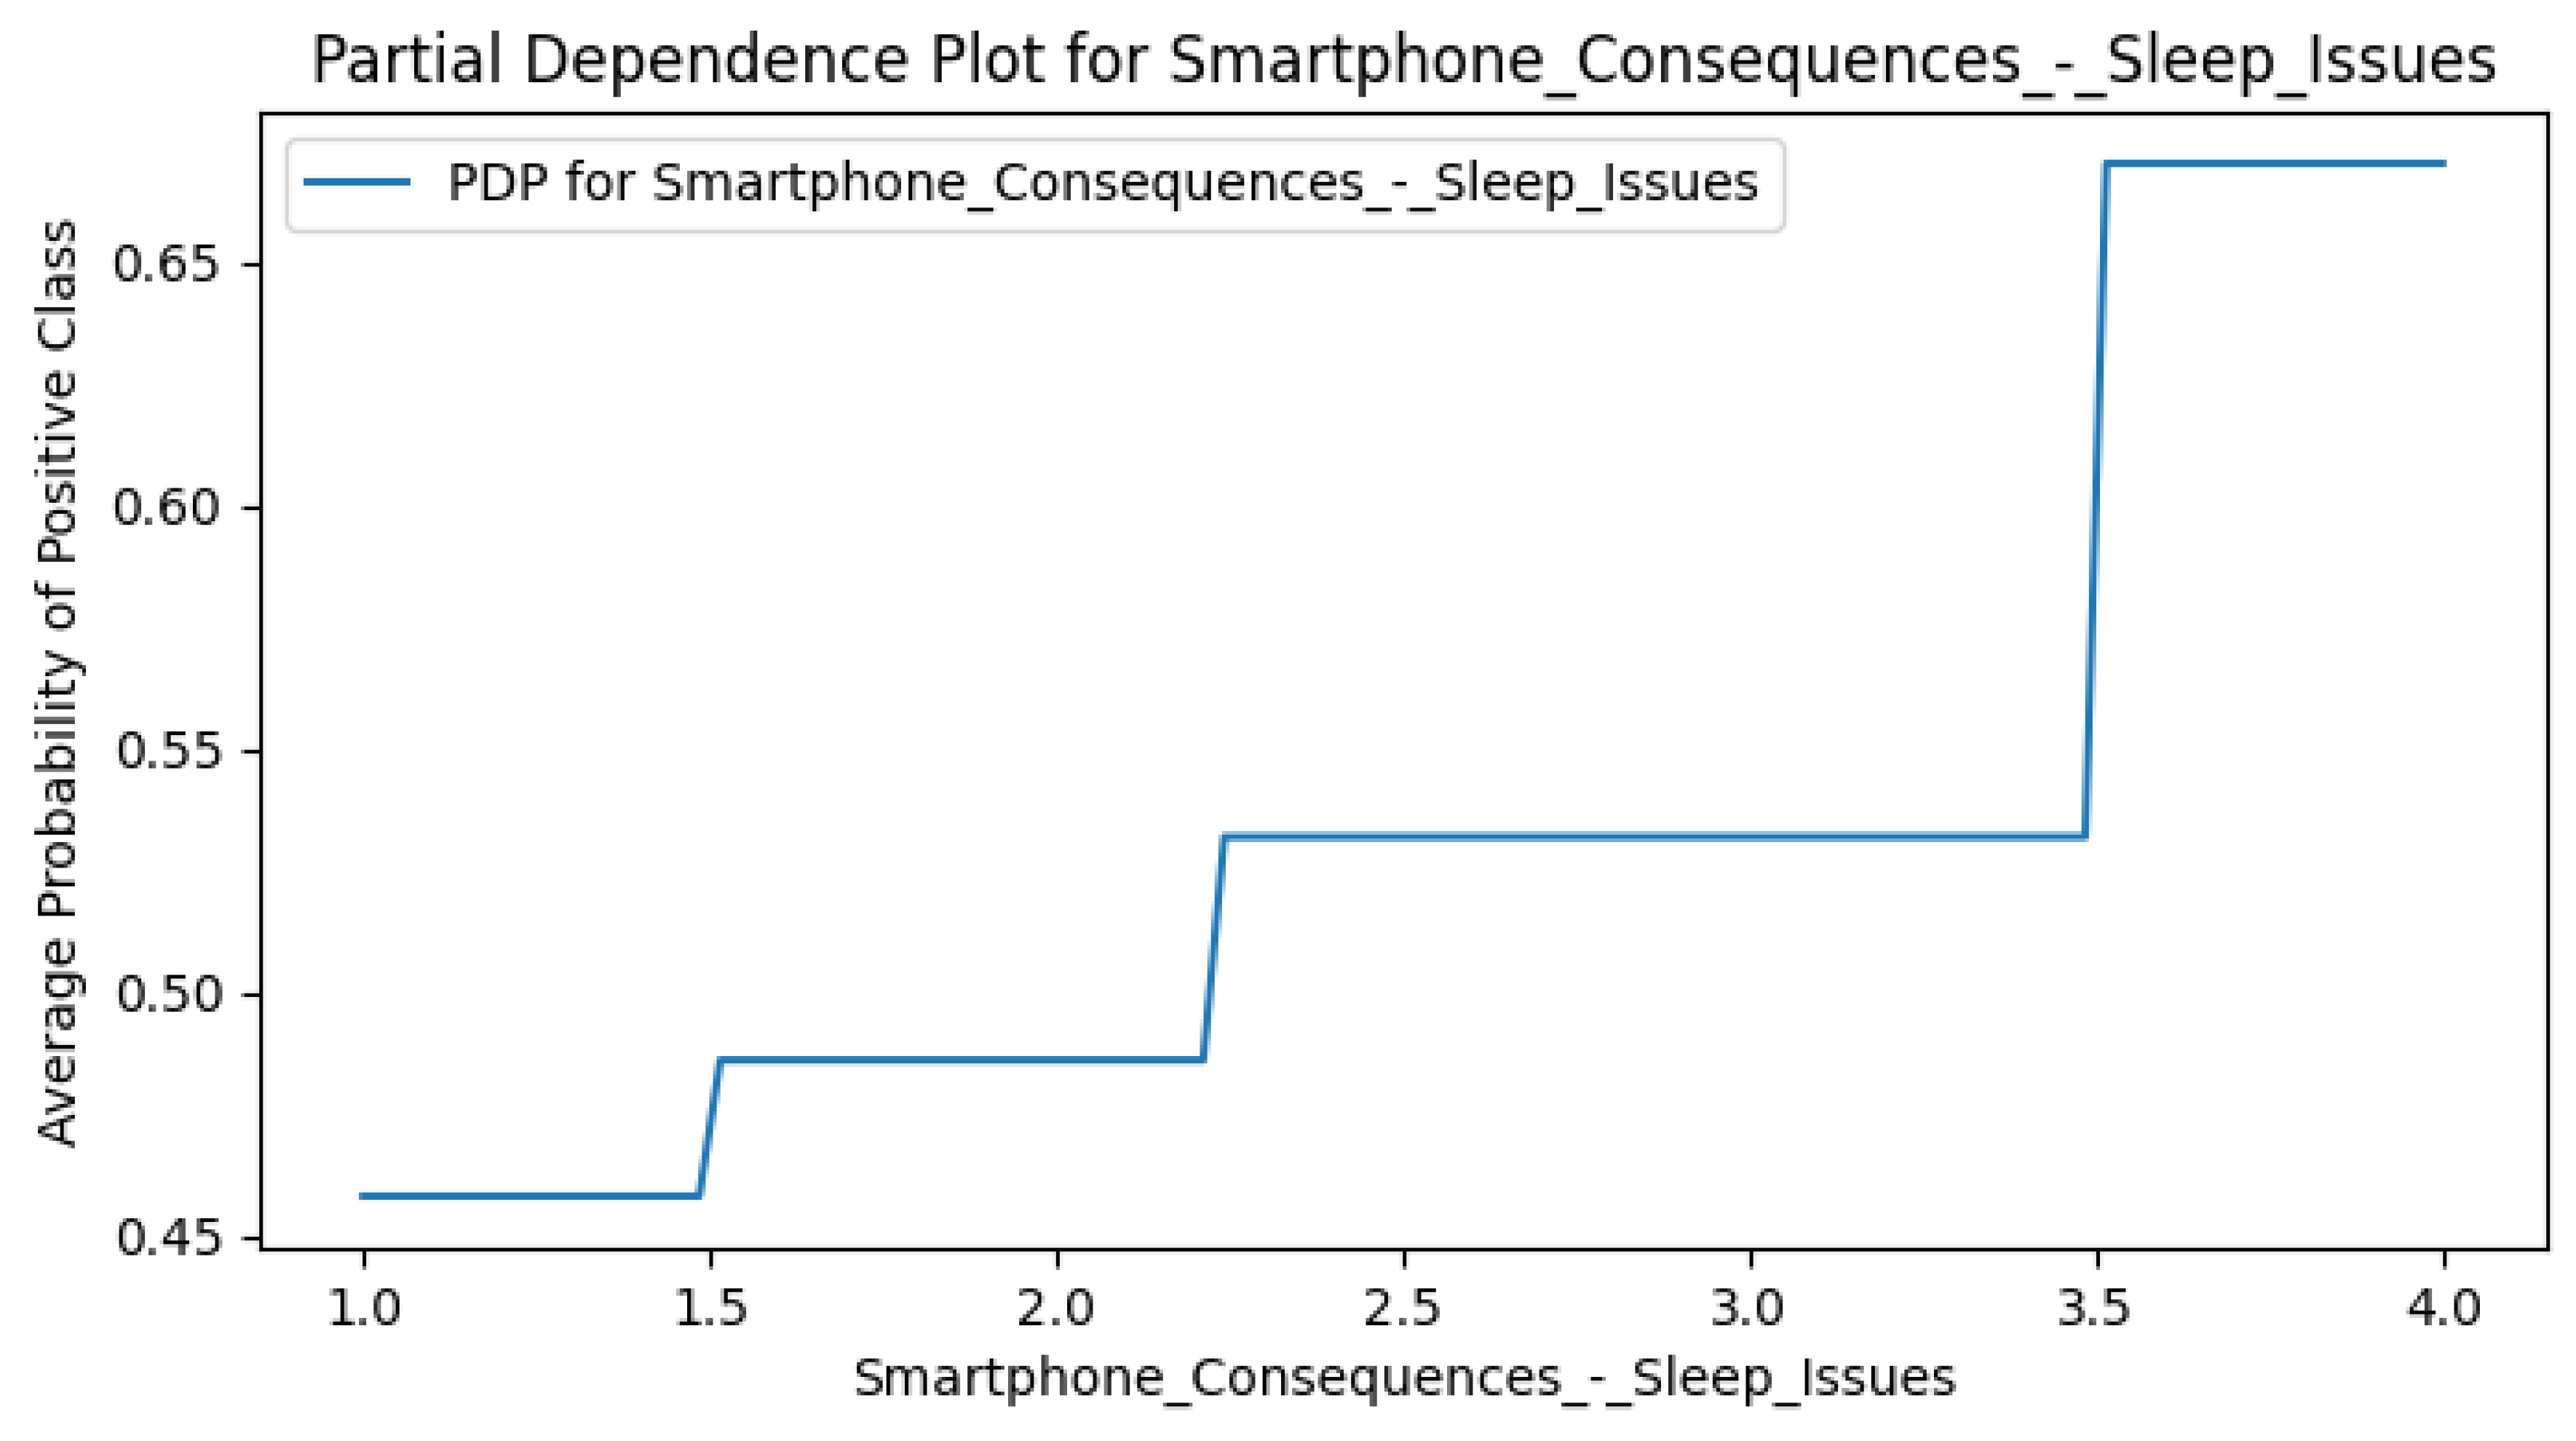
Figure A9.
PDP plot of Stress Relief in the Smart CD model.
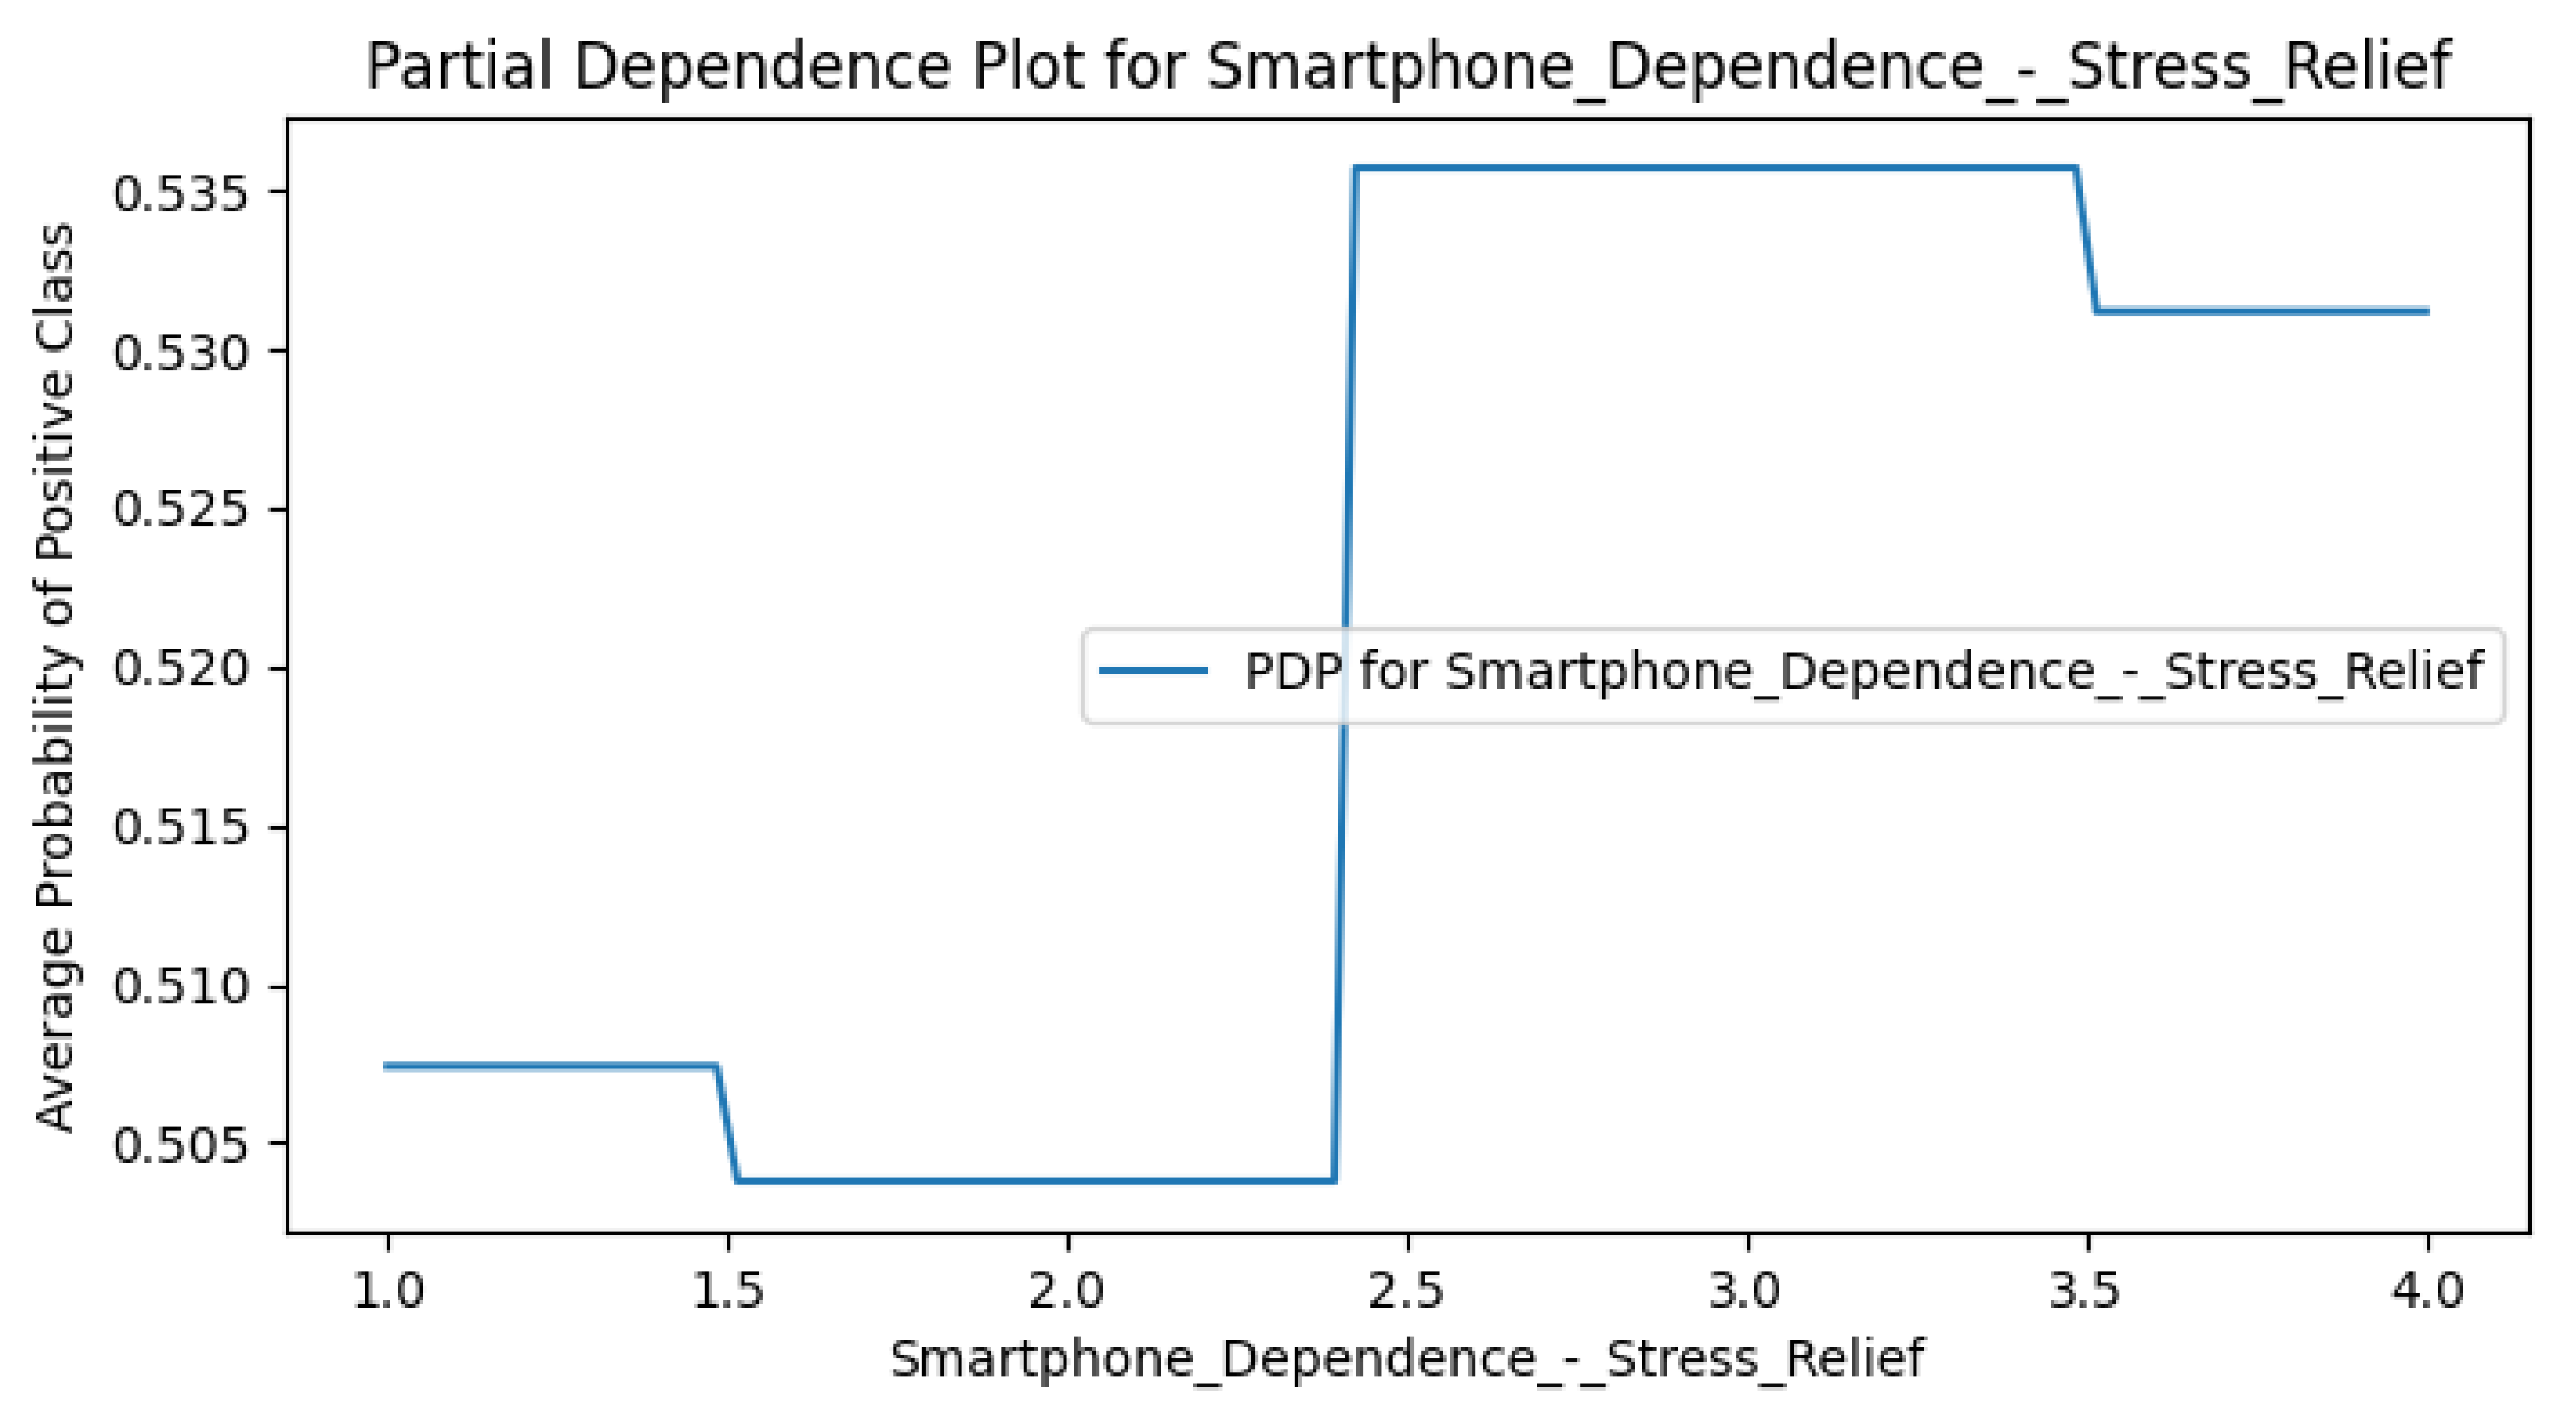
Figure A10.
PDP plot of Usage Dependence in the Perceived DCR model.
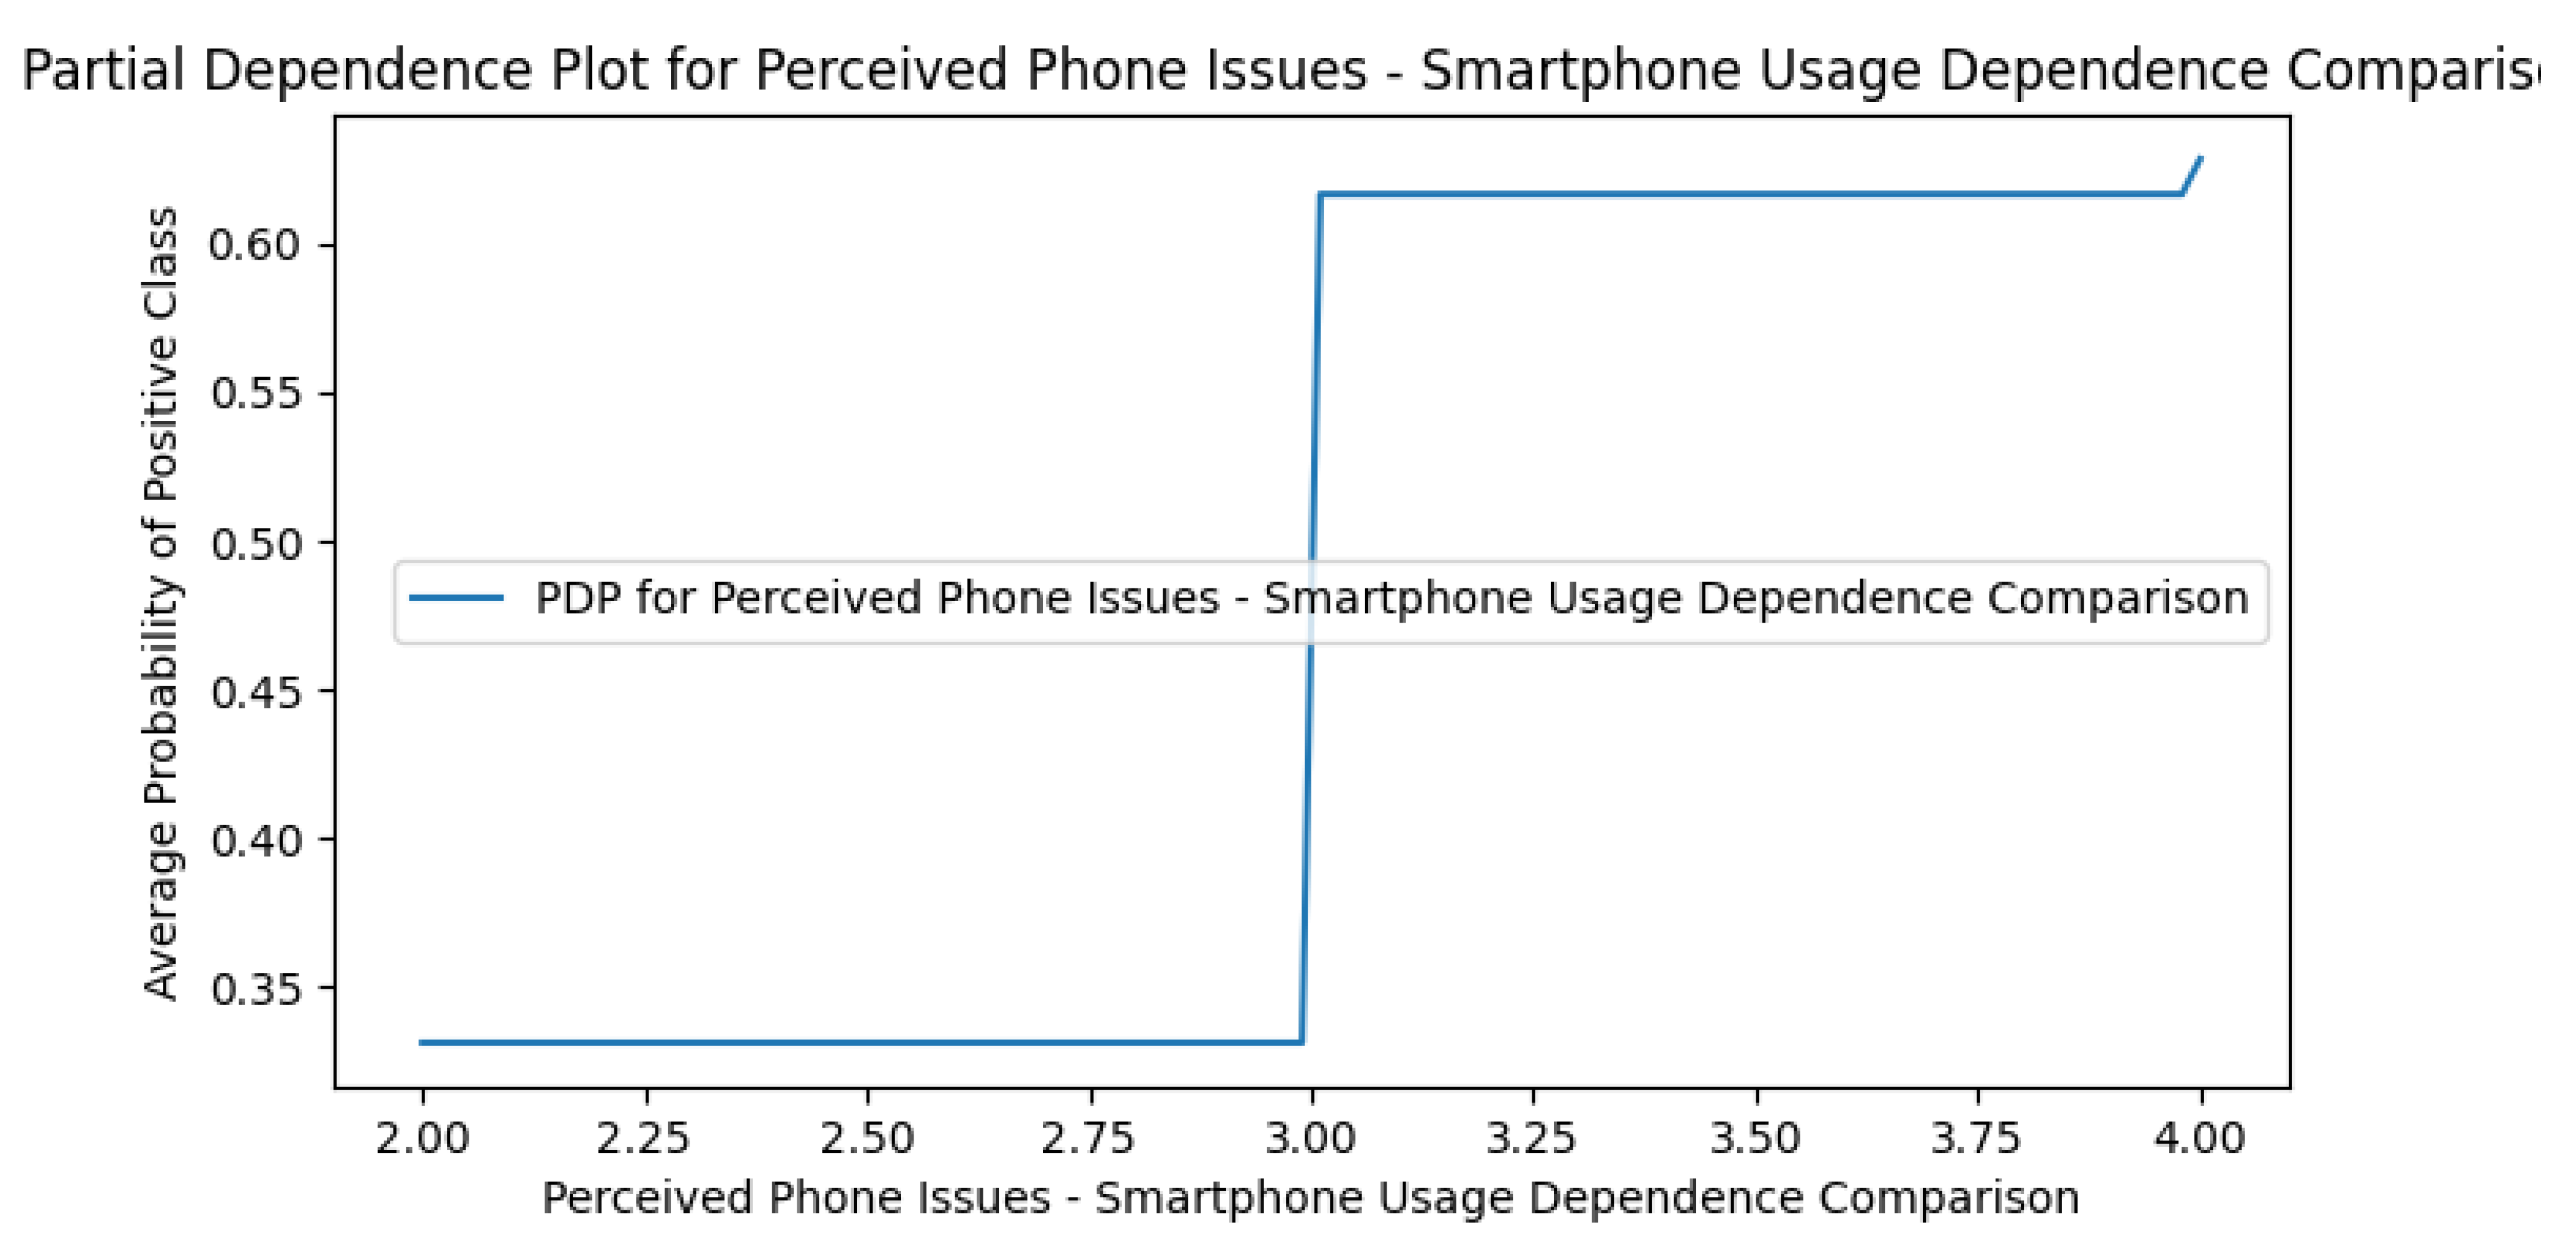
Figure A11.
PDP plot of Excessive Usage in the Perceived DCR model.
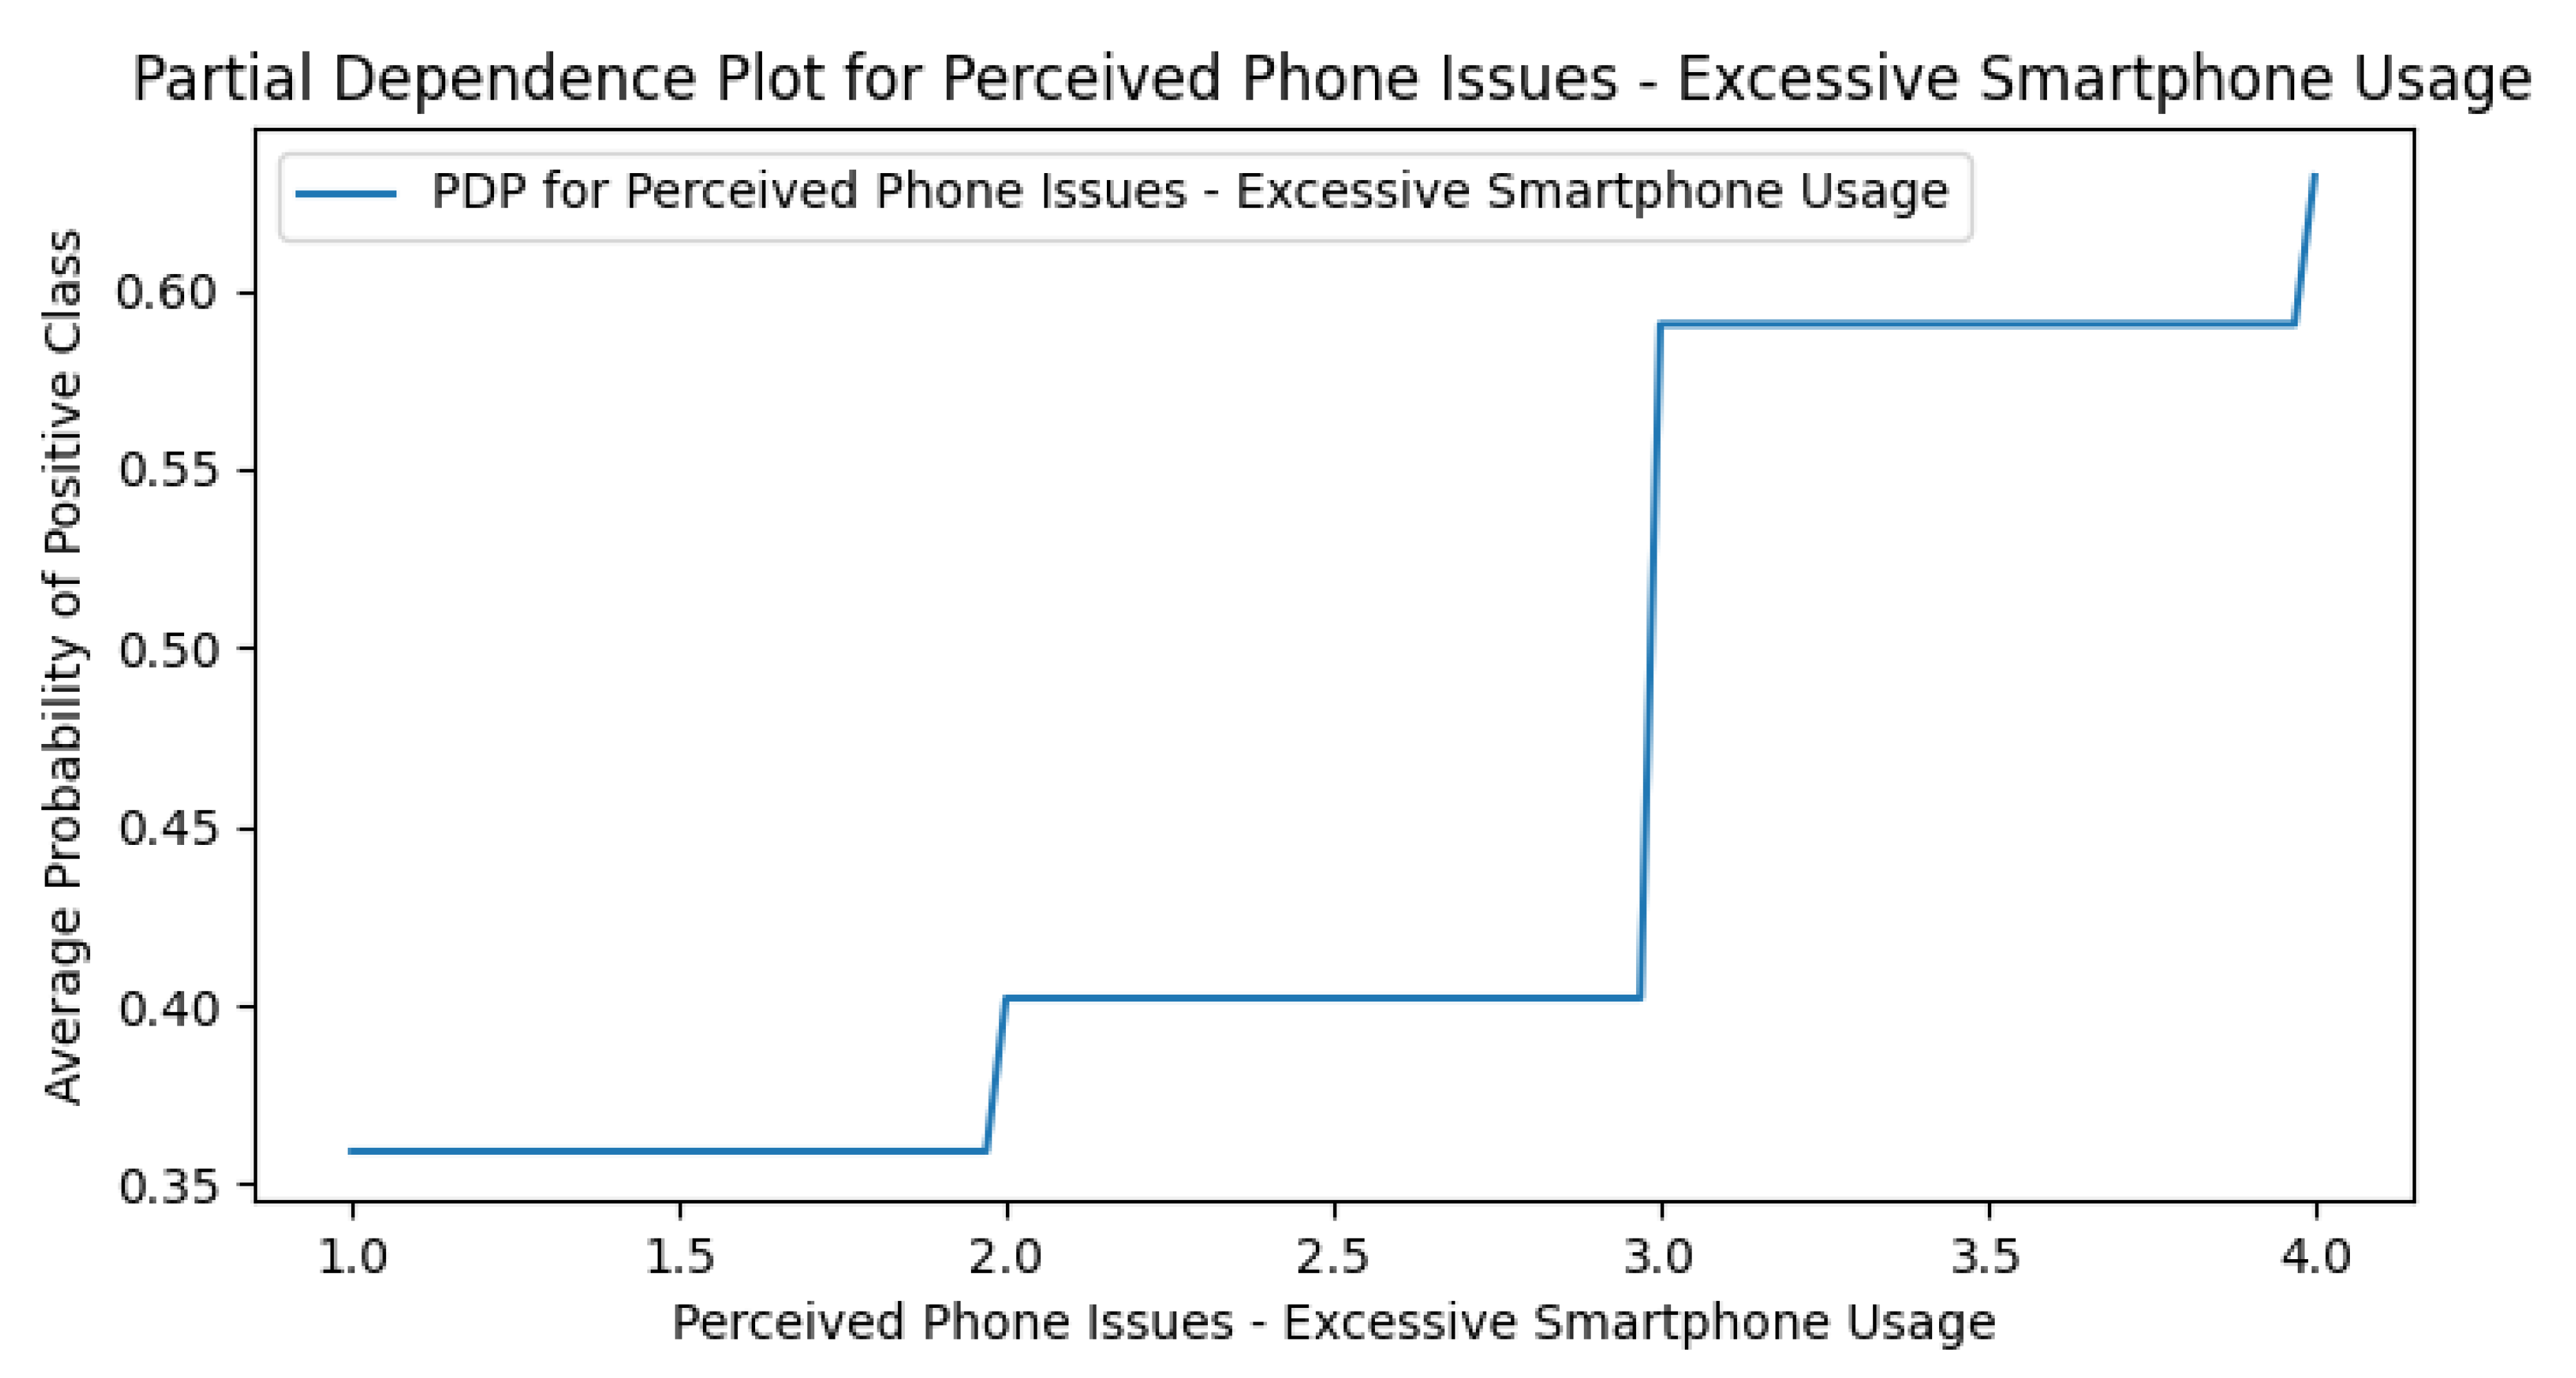
Figure A12.
PDP plot of Short Form Usage Control in the Perceived DCR model.
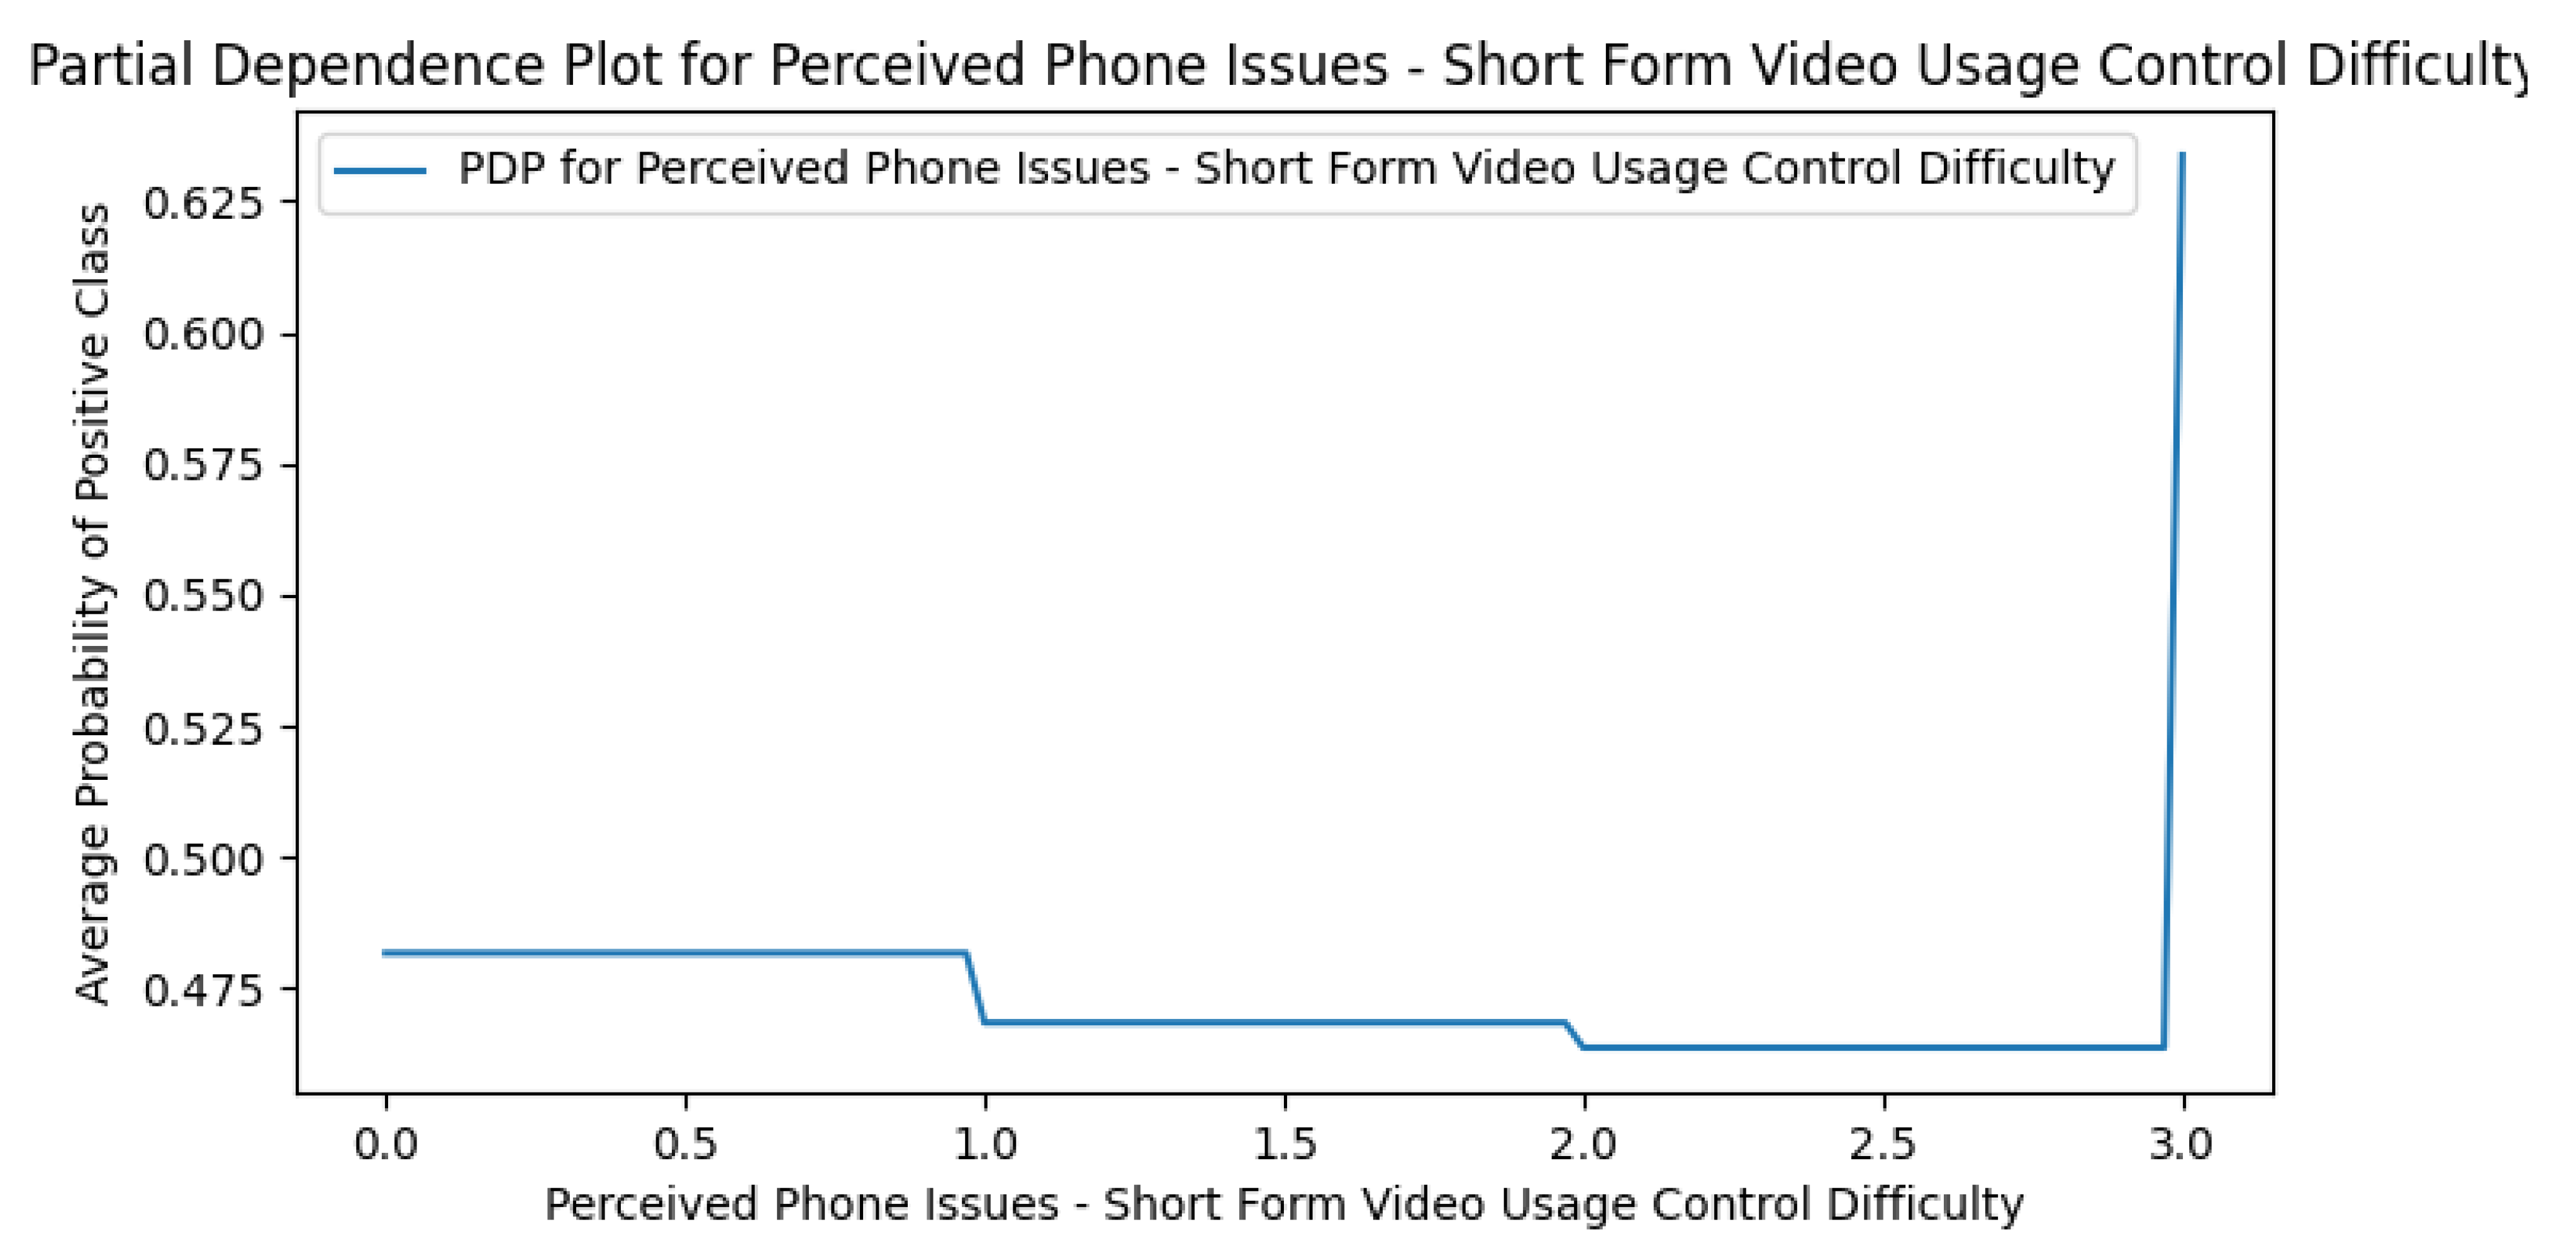
Figure A13.
PDP plot of Neg Side Effects on Gaming in the Perceived DCR model.
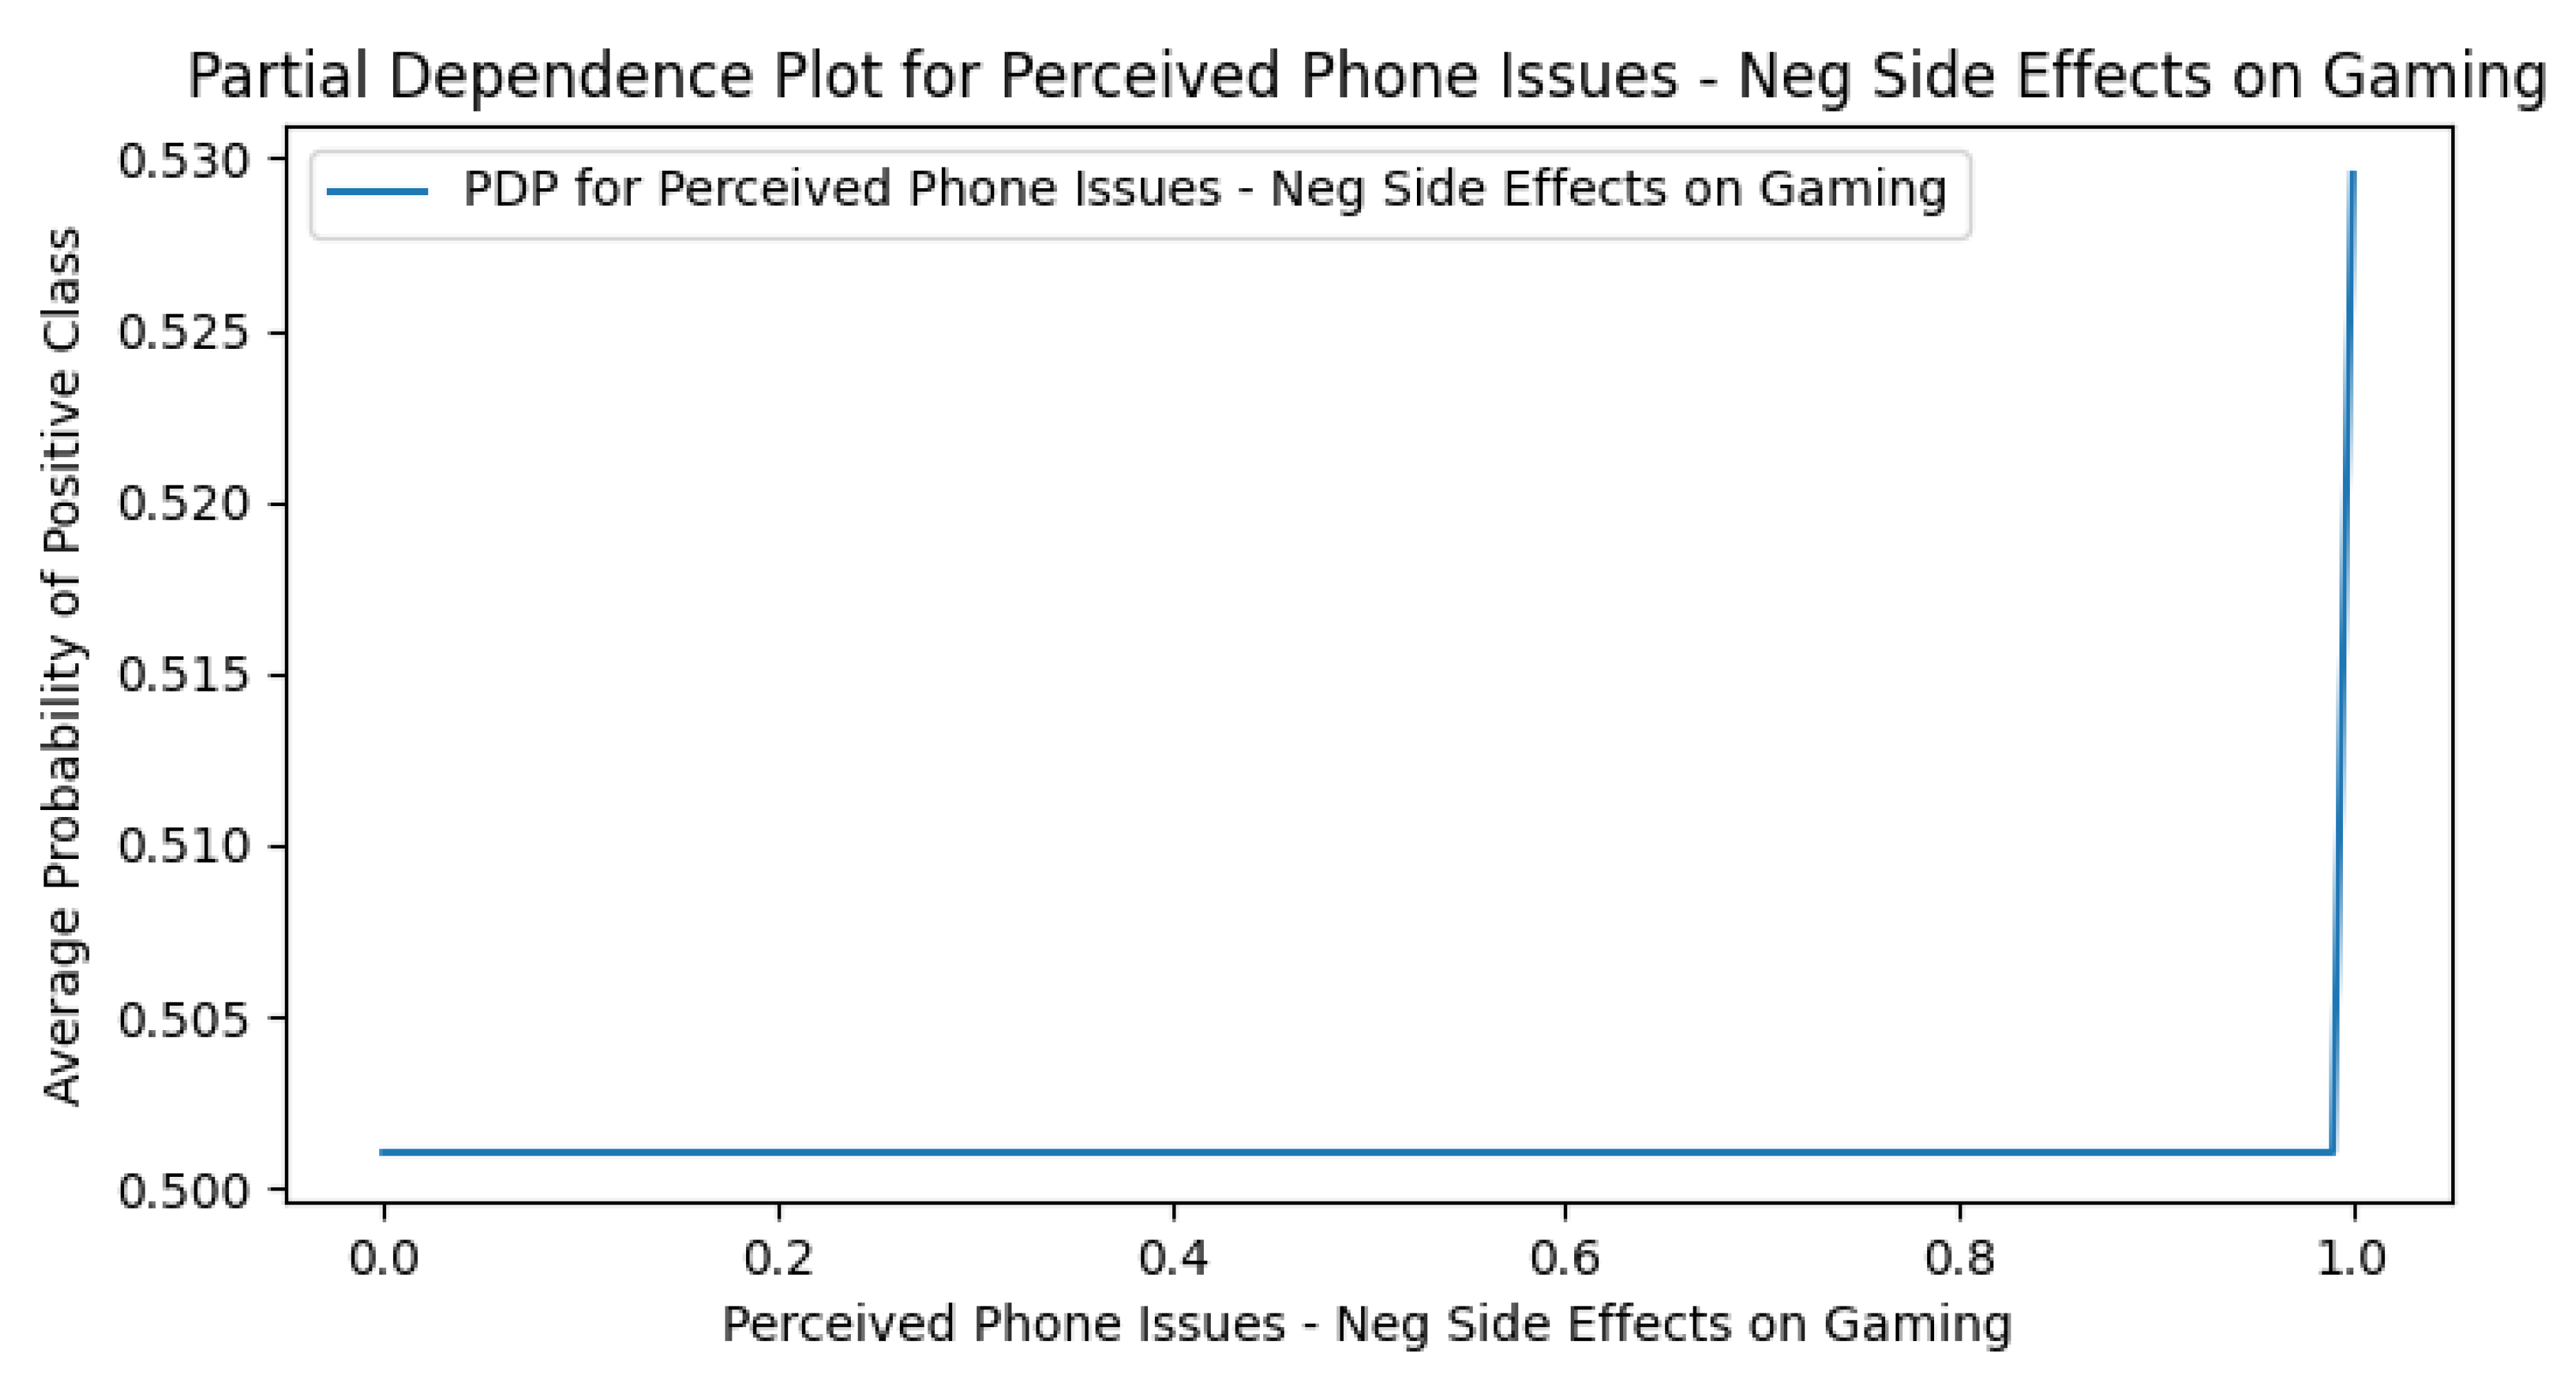
Figure A14.
PDP plot of Online Social Issue Engagement in the Perceived DCR model.
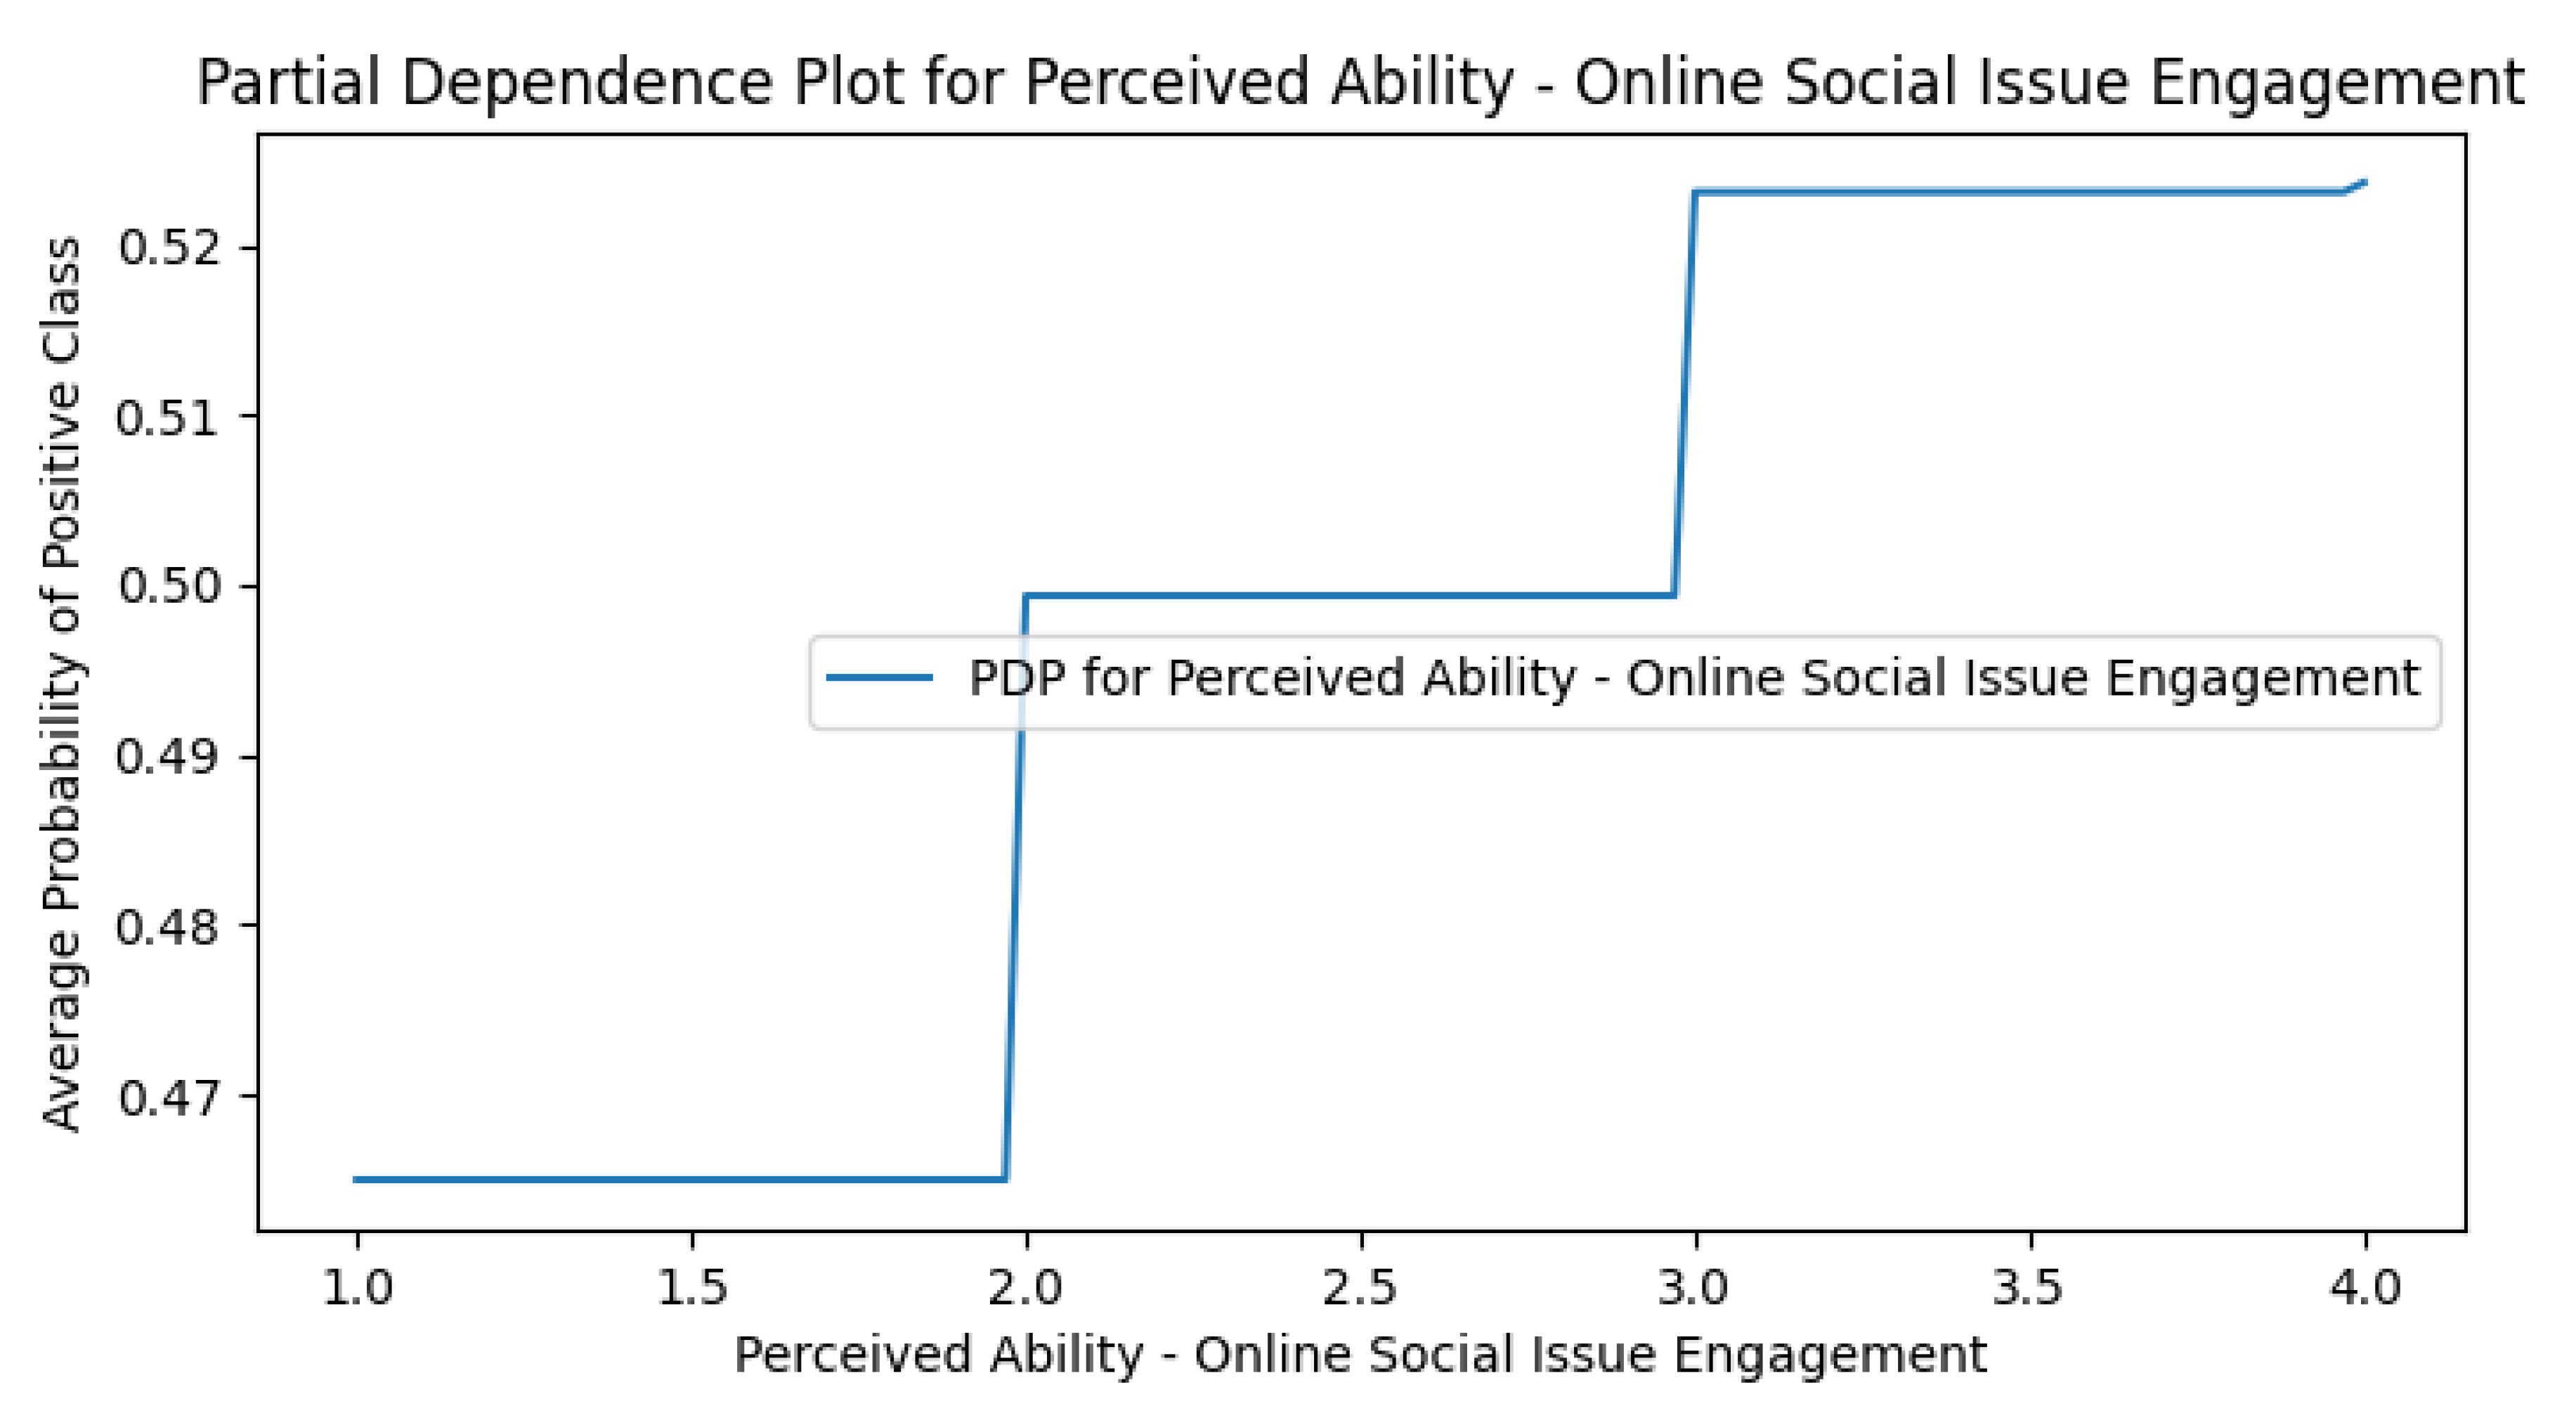
Figure A15.
PDP plot of Neg Side Effects on SNS in the Perceived DCR model.
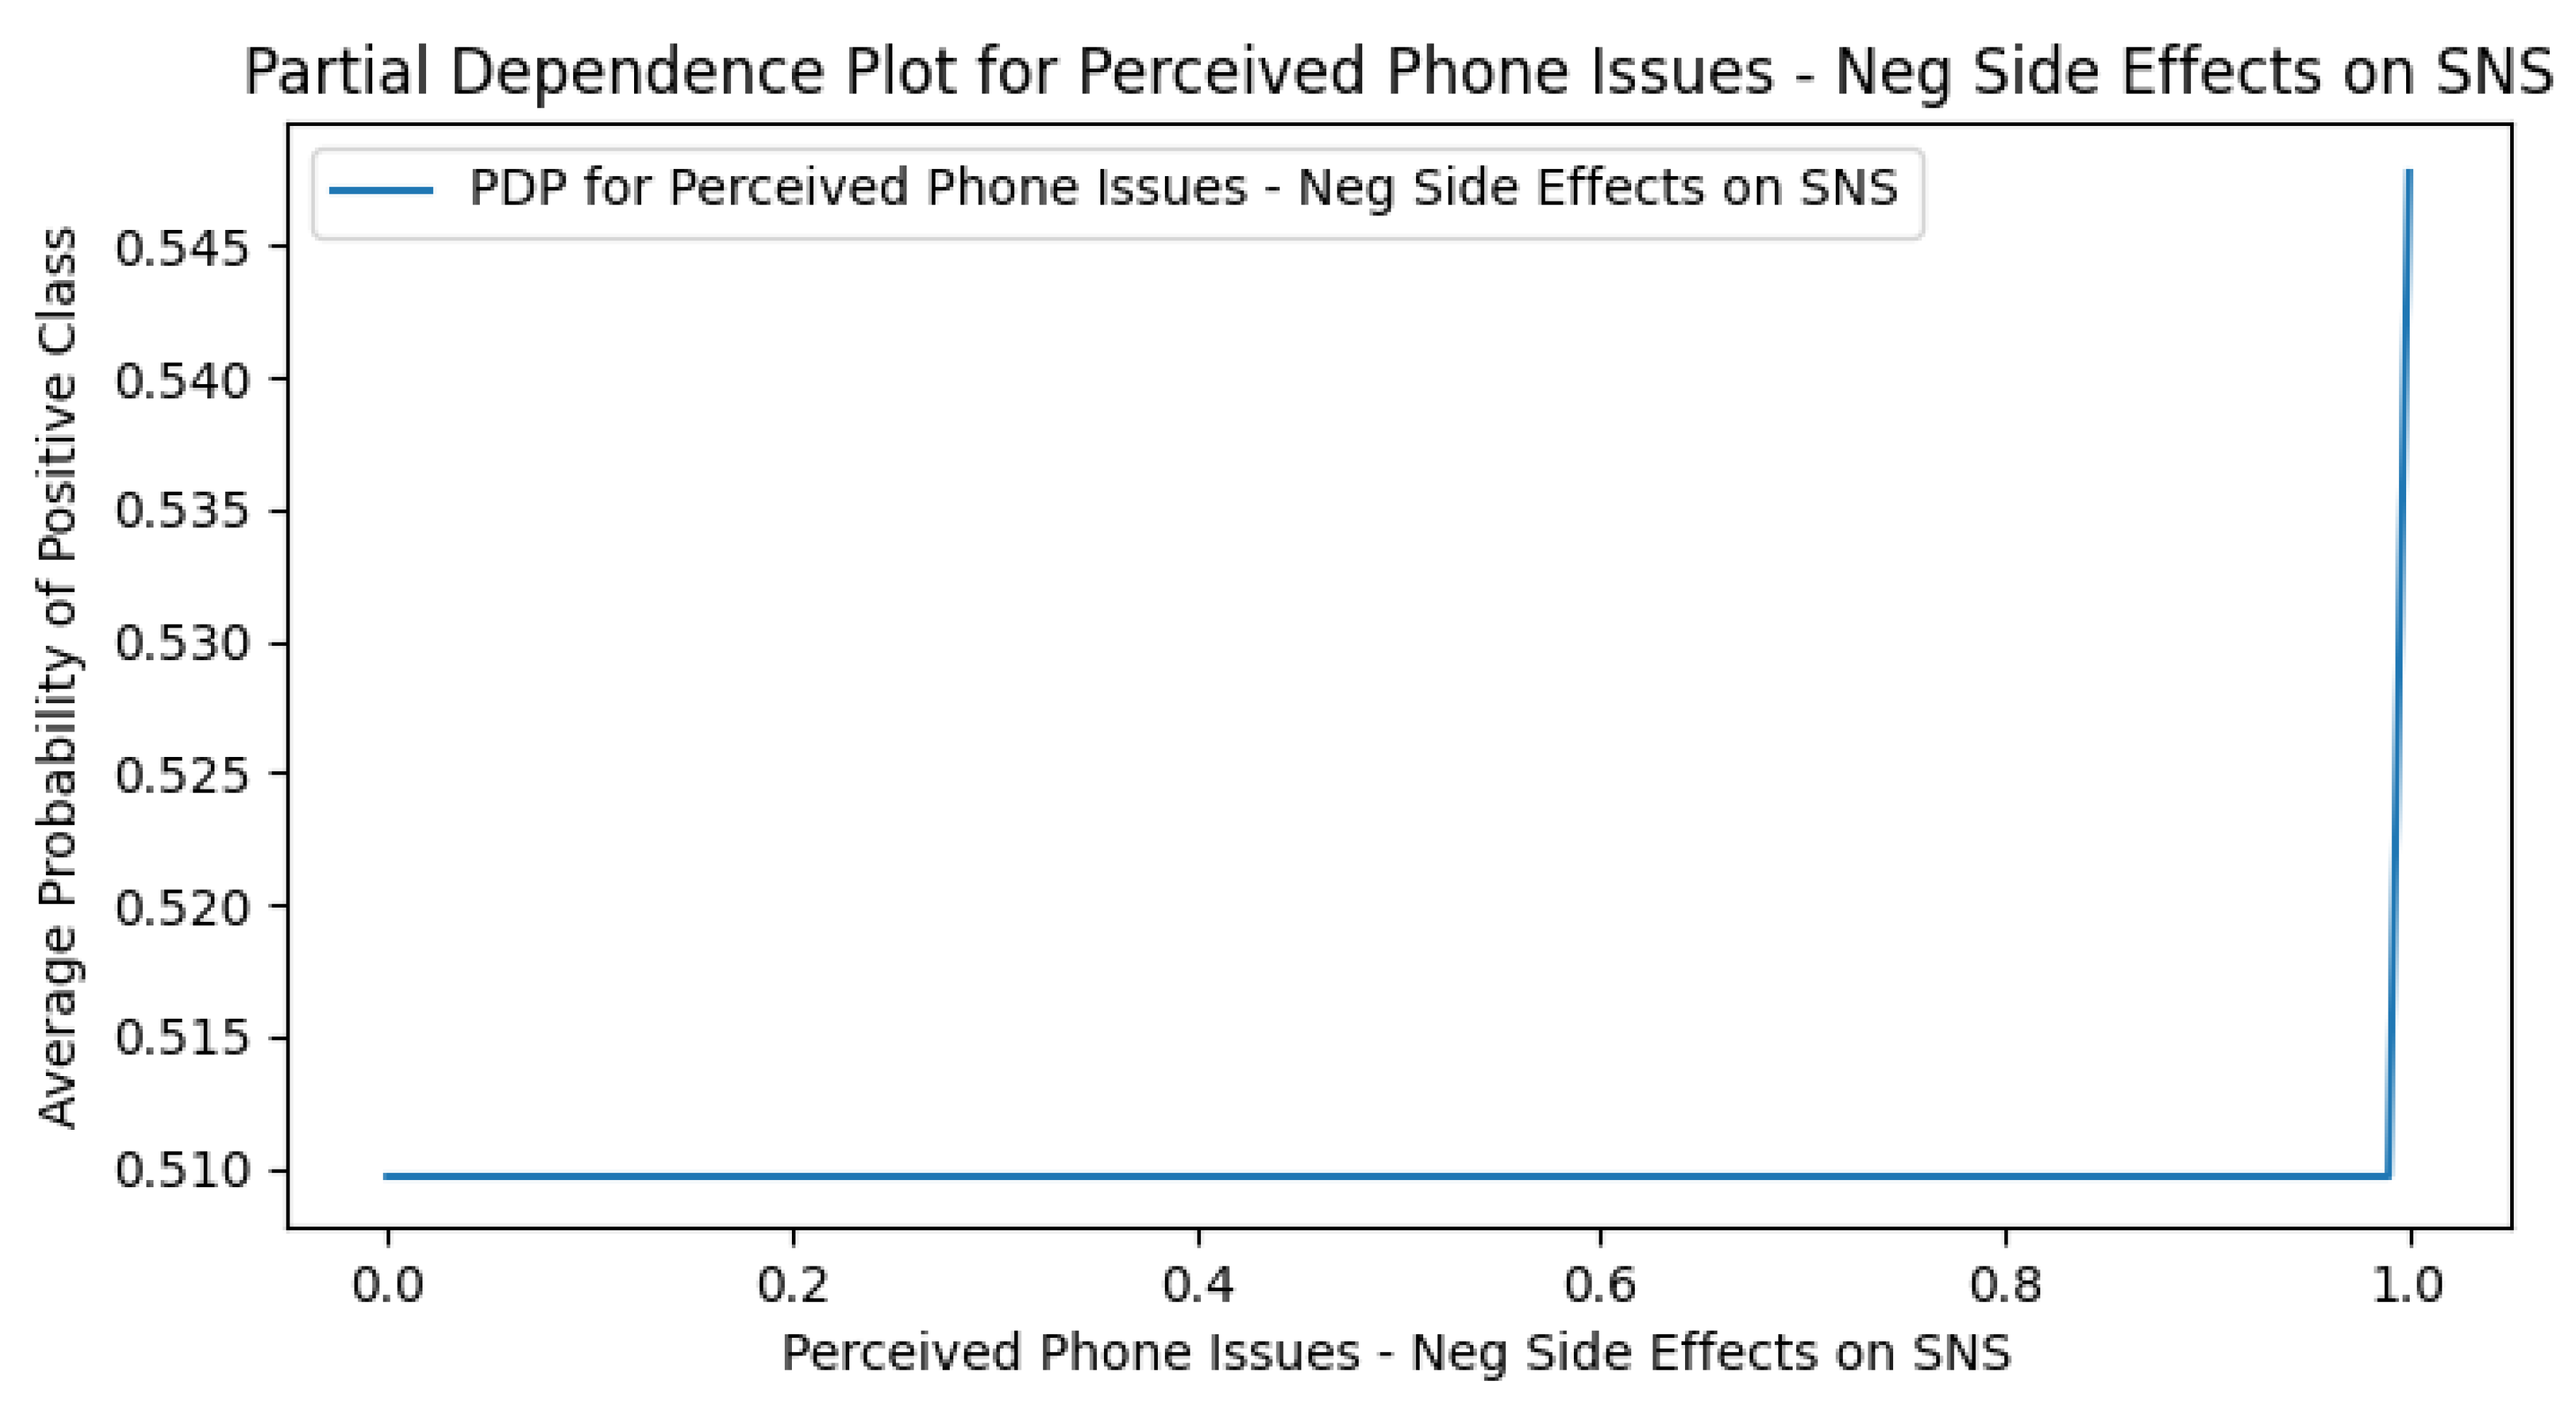
Figure A16.
PDP plot of Selling Goods & Services in the Use Case Only model.
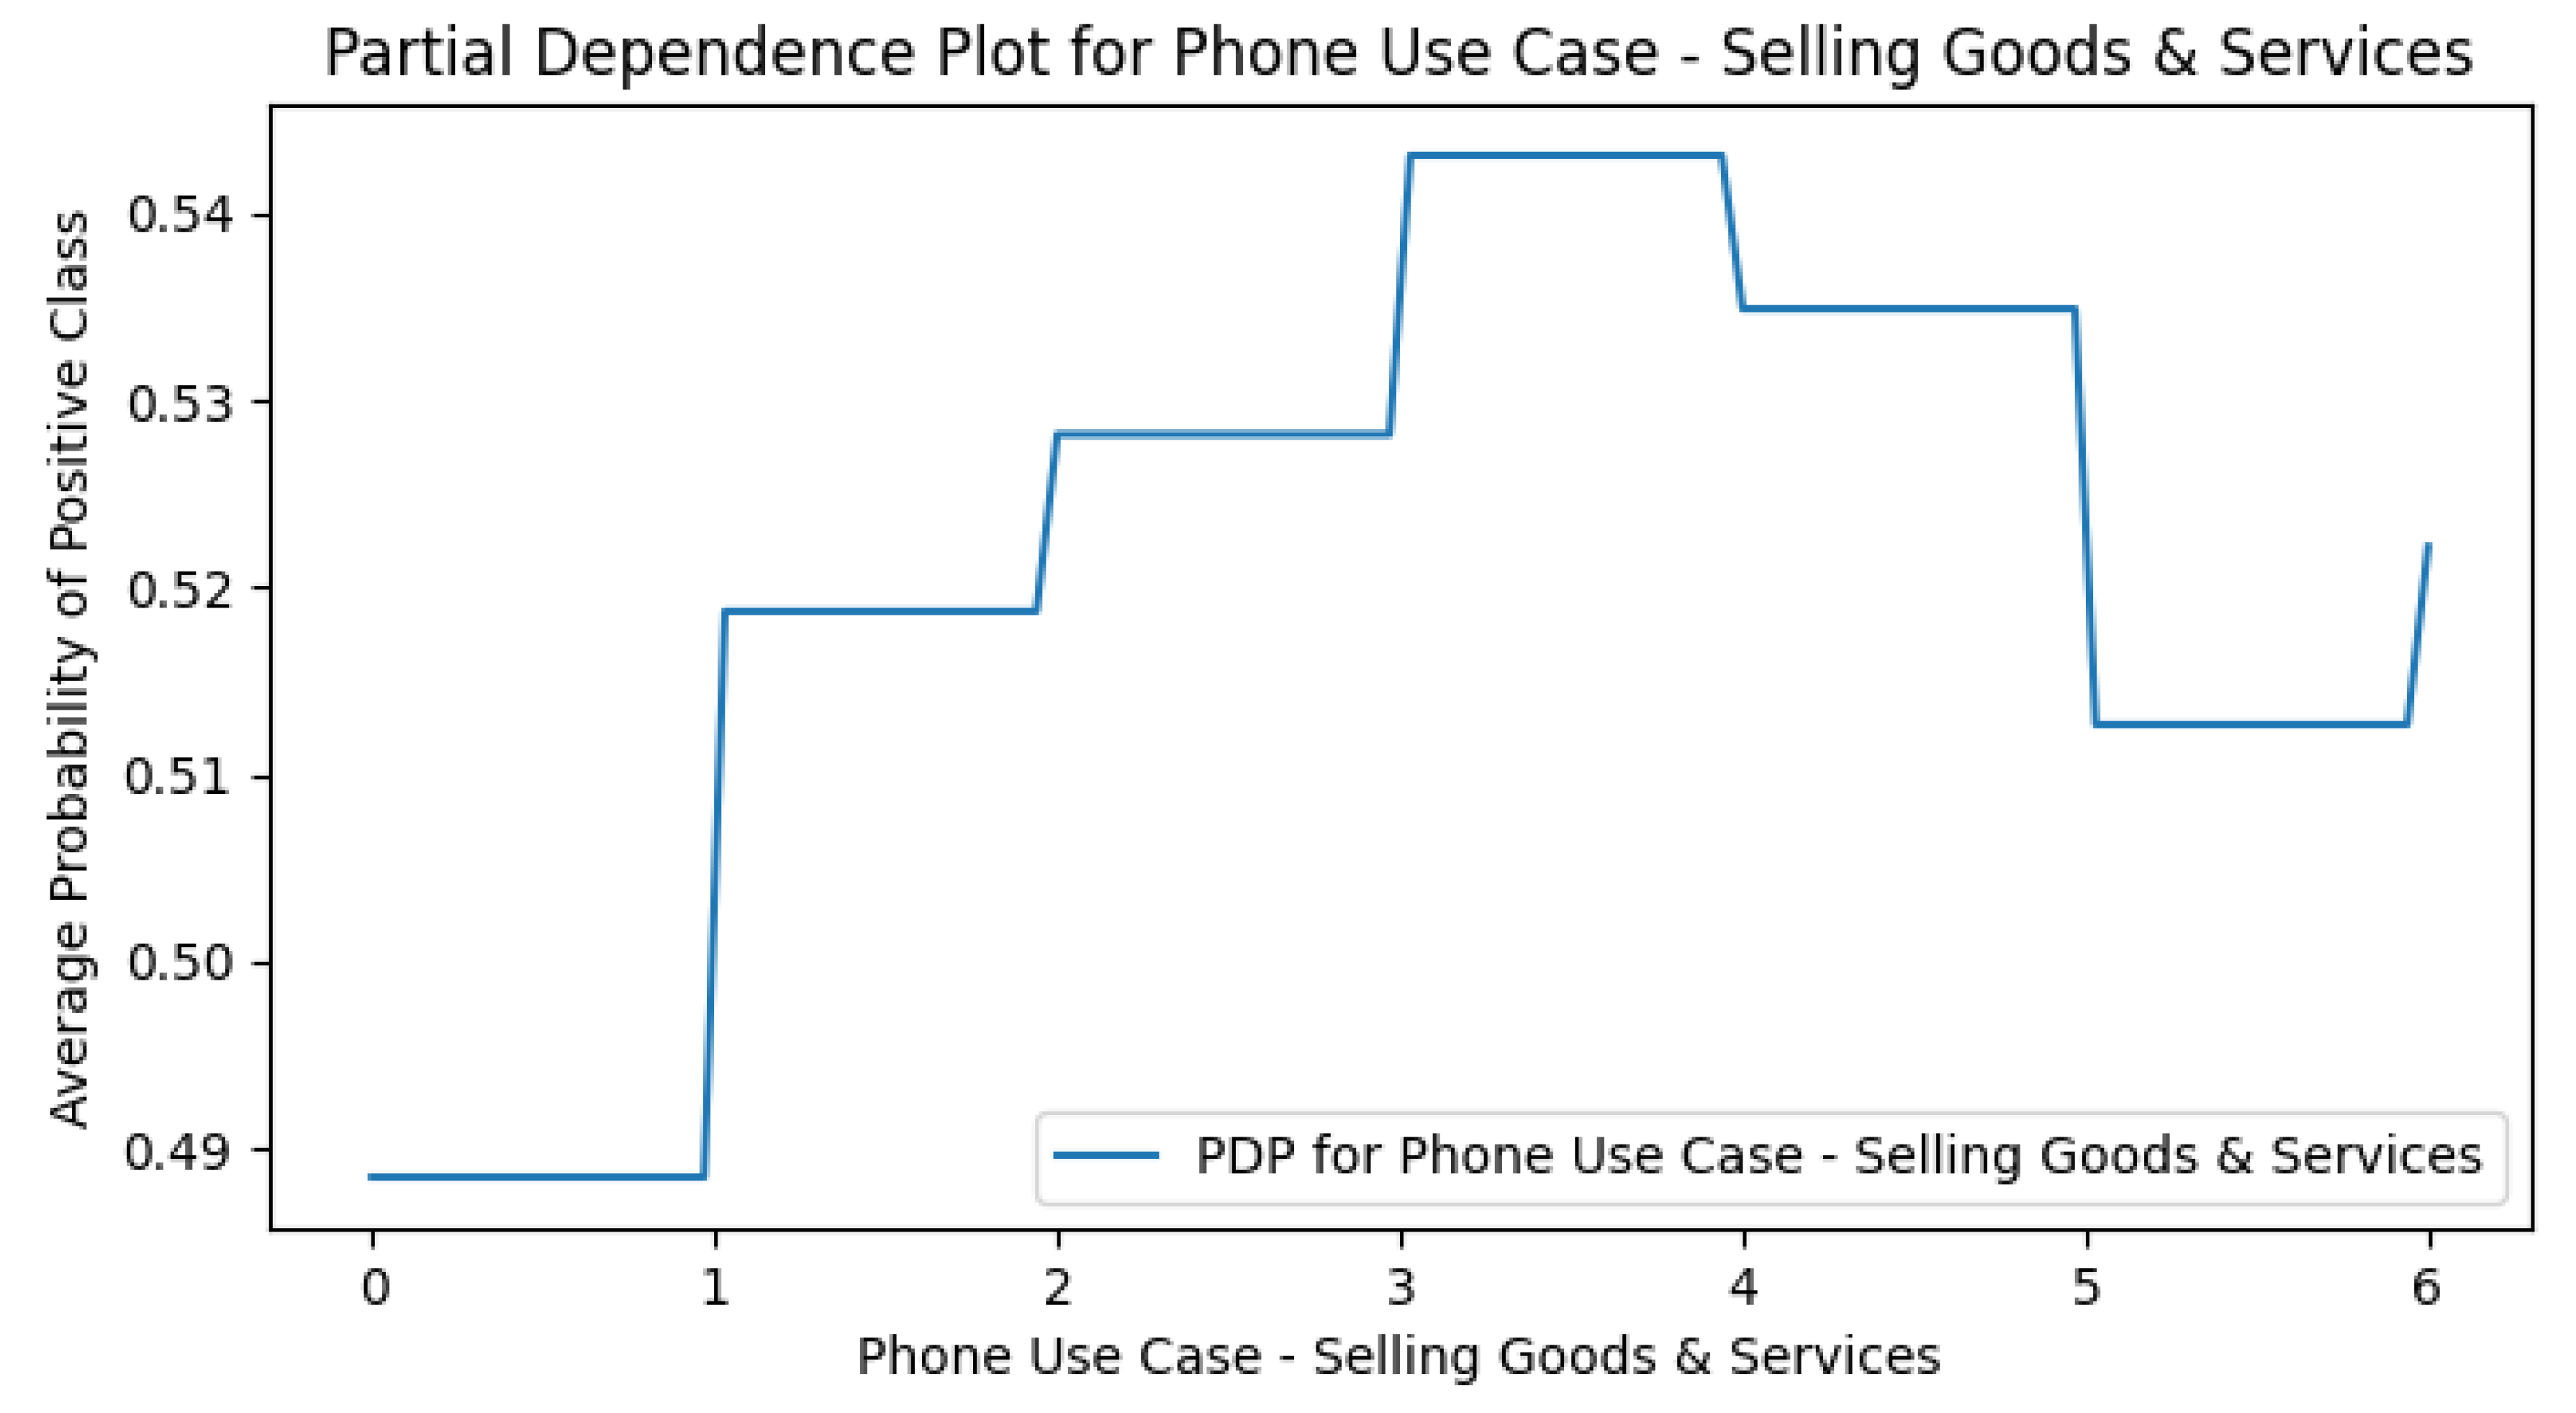
Figure A17.
PDP plot of Webtoon in the Use Case Only model.
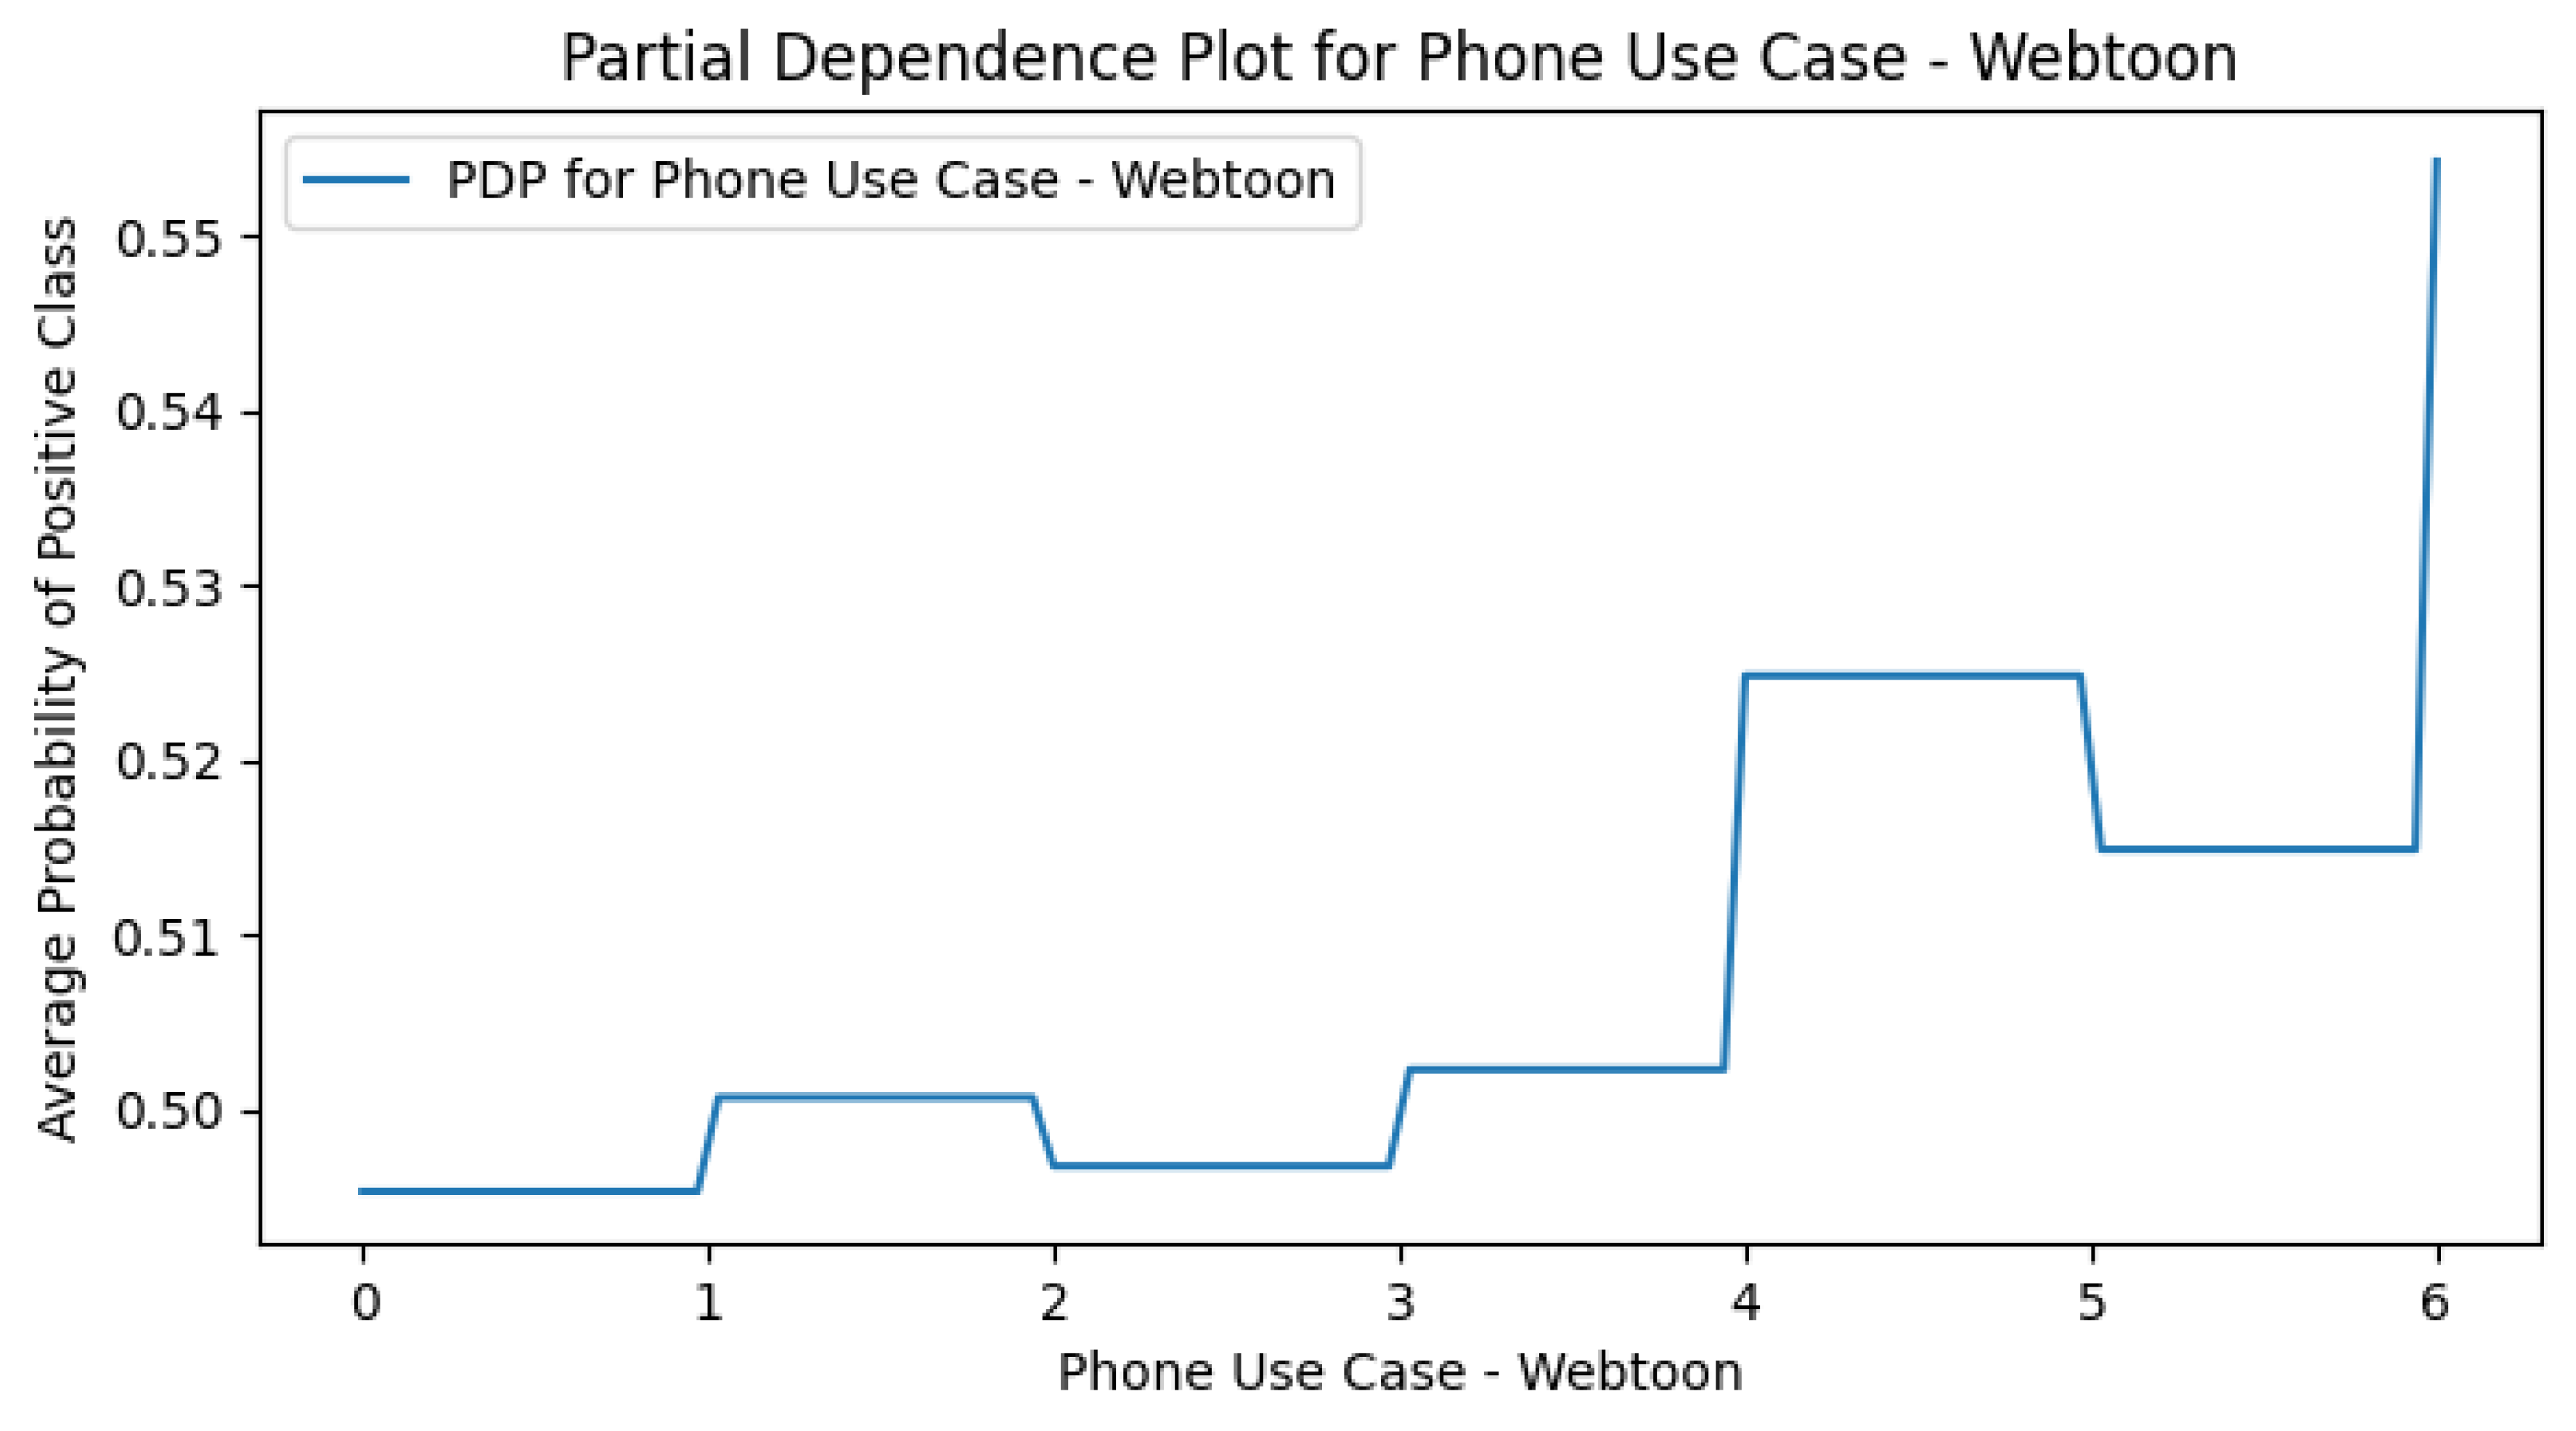
Figure A18.
PDP plot of Scheduling in the Use Case Only model.
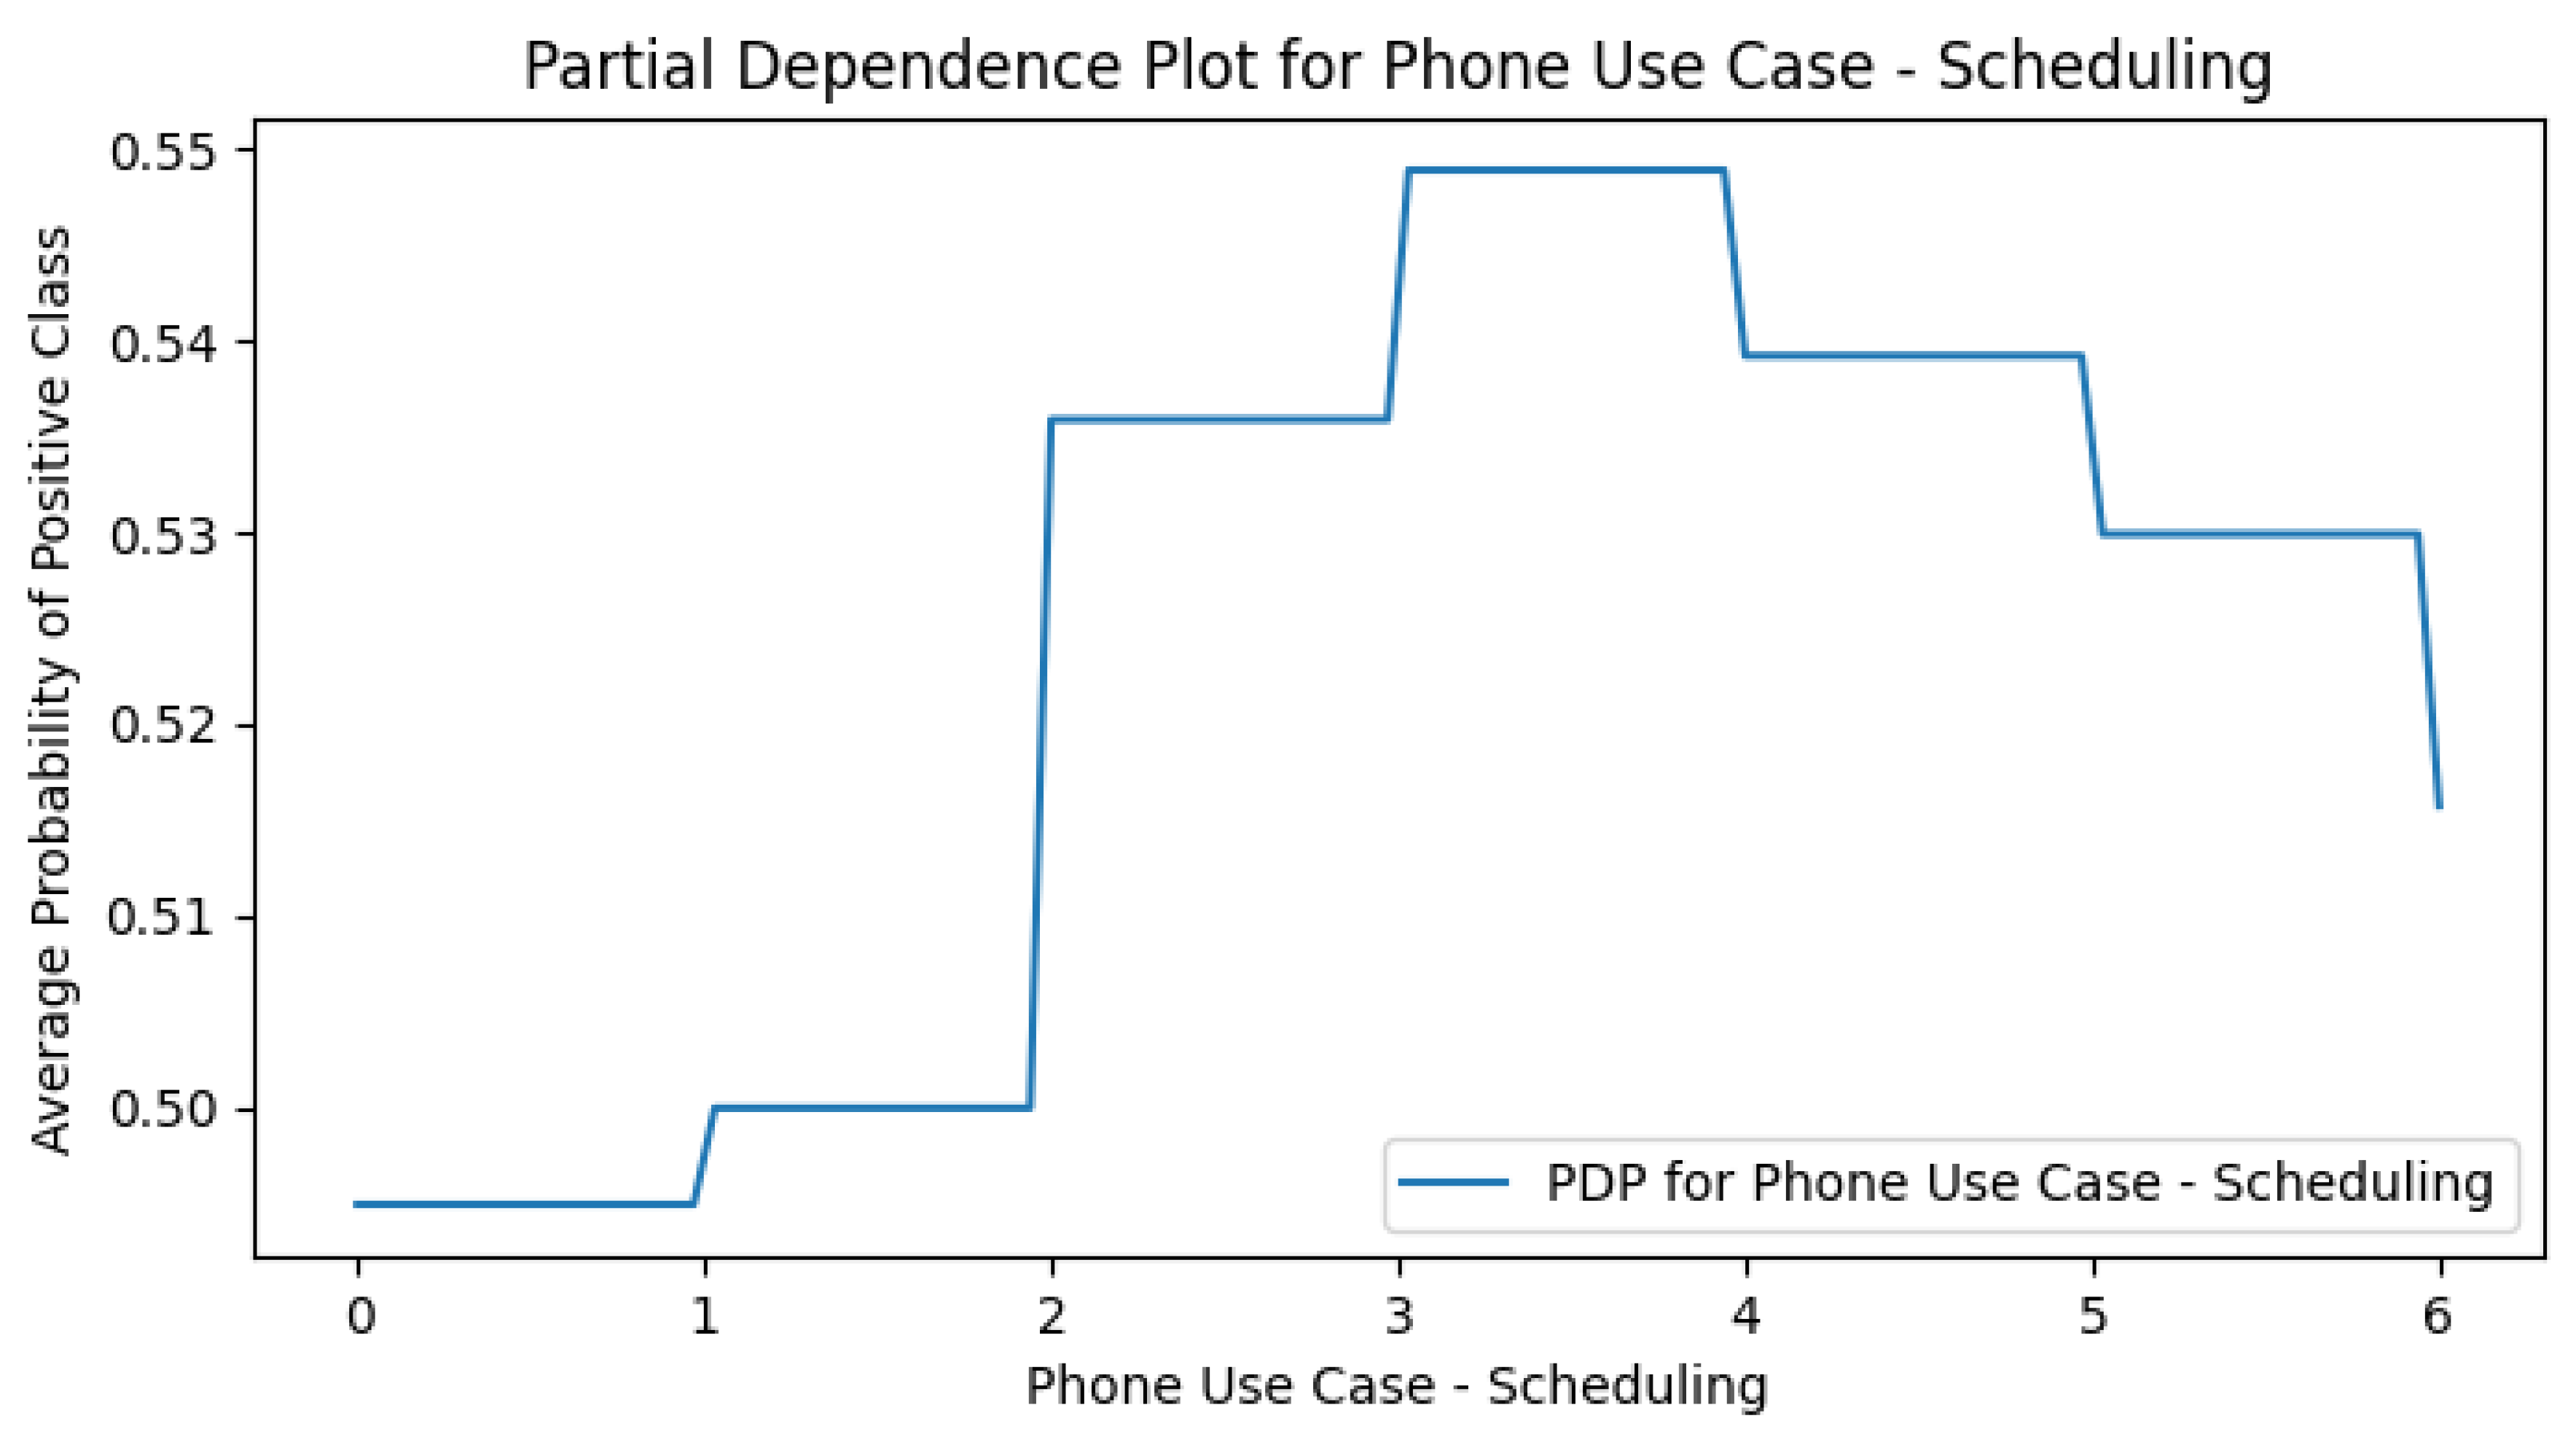
Figure A19.
PDP plot of News in the Use Case Only model.
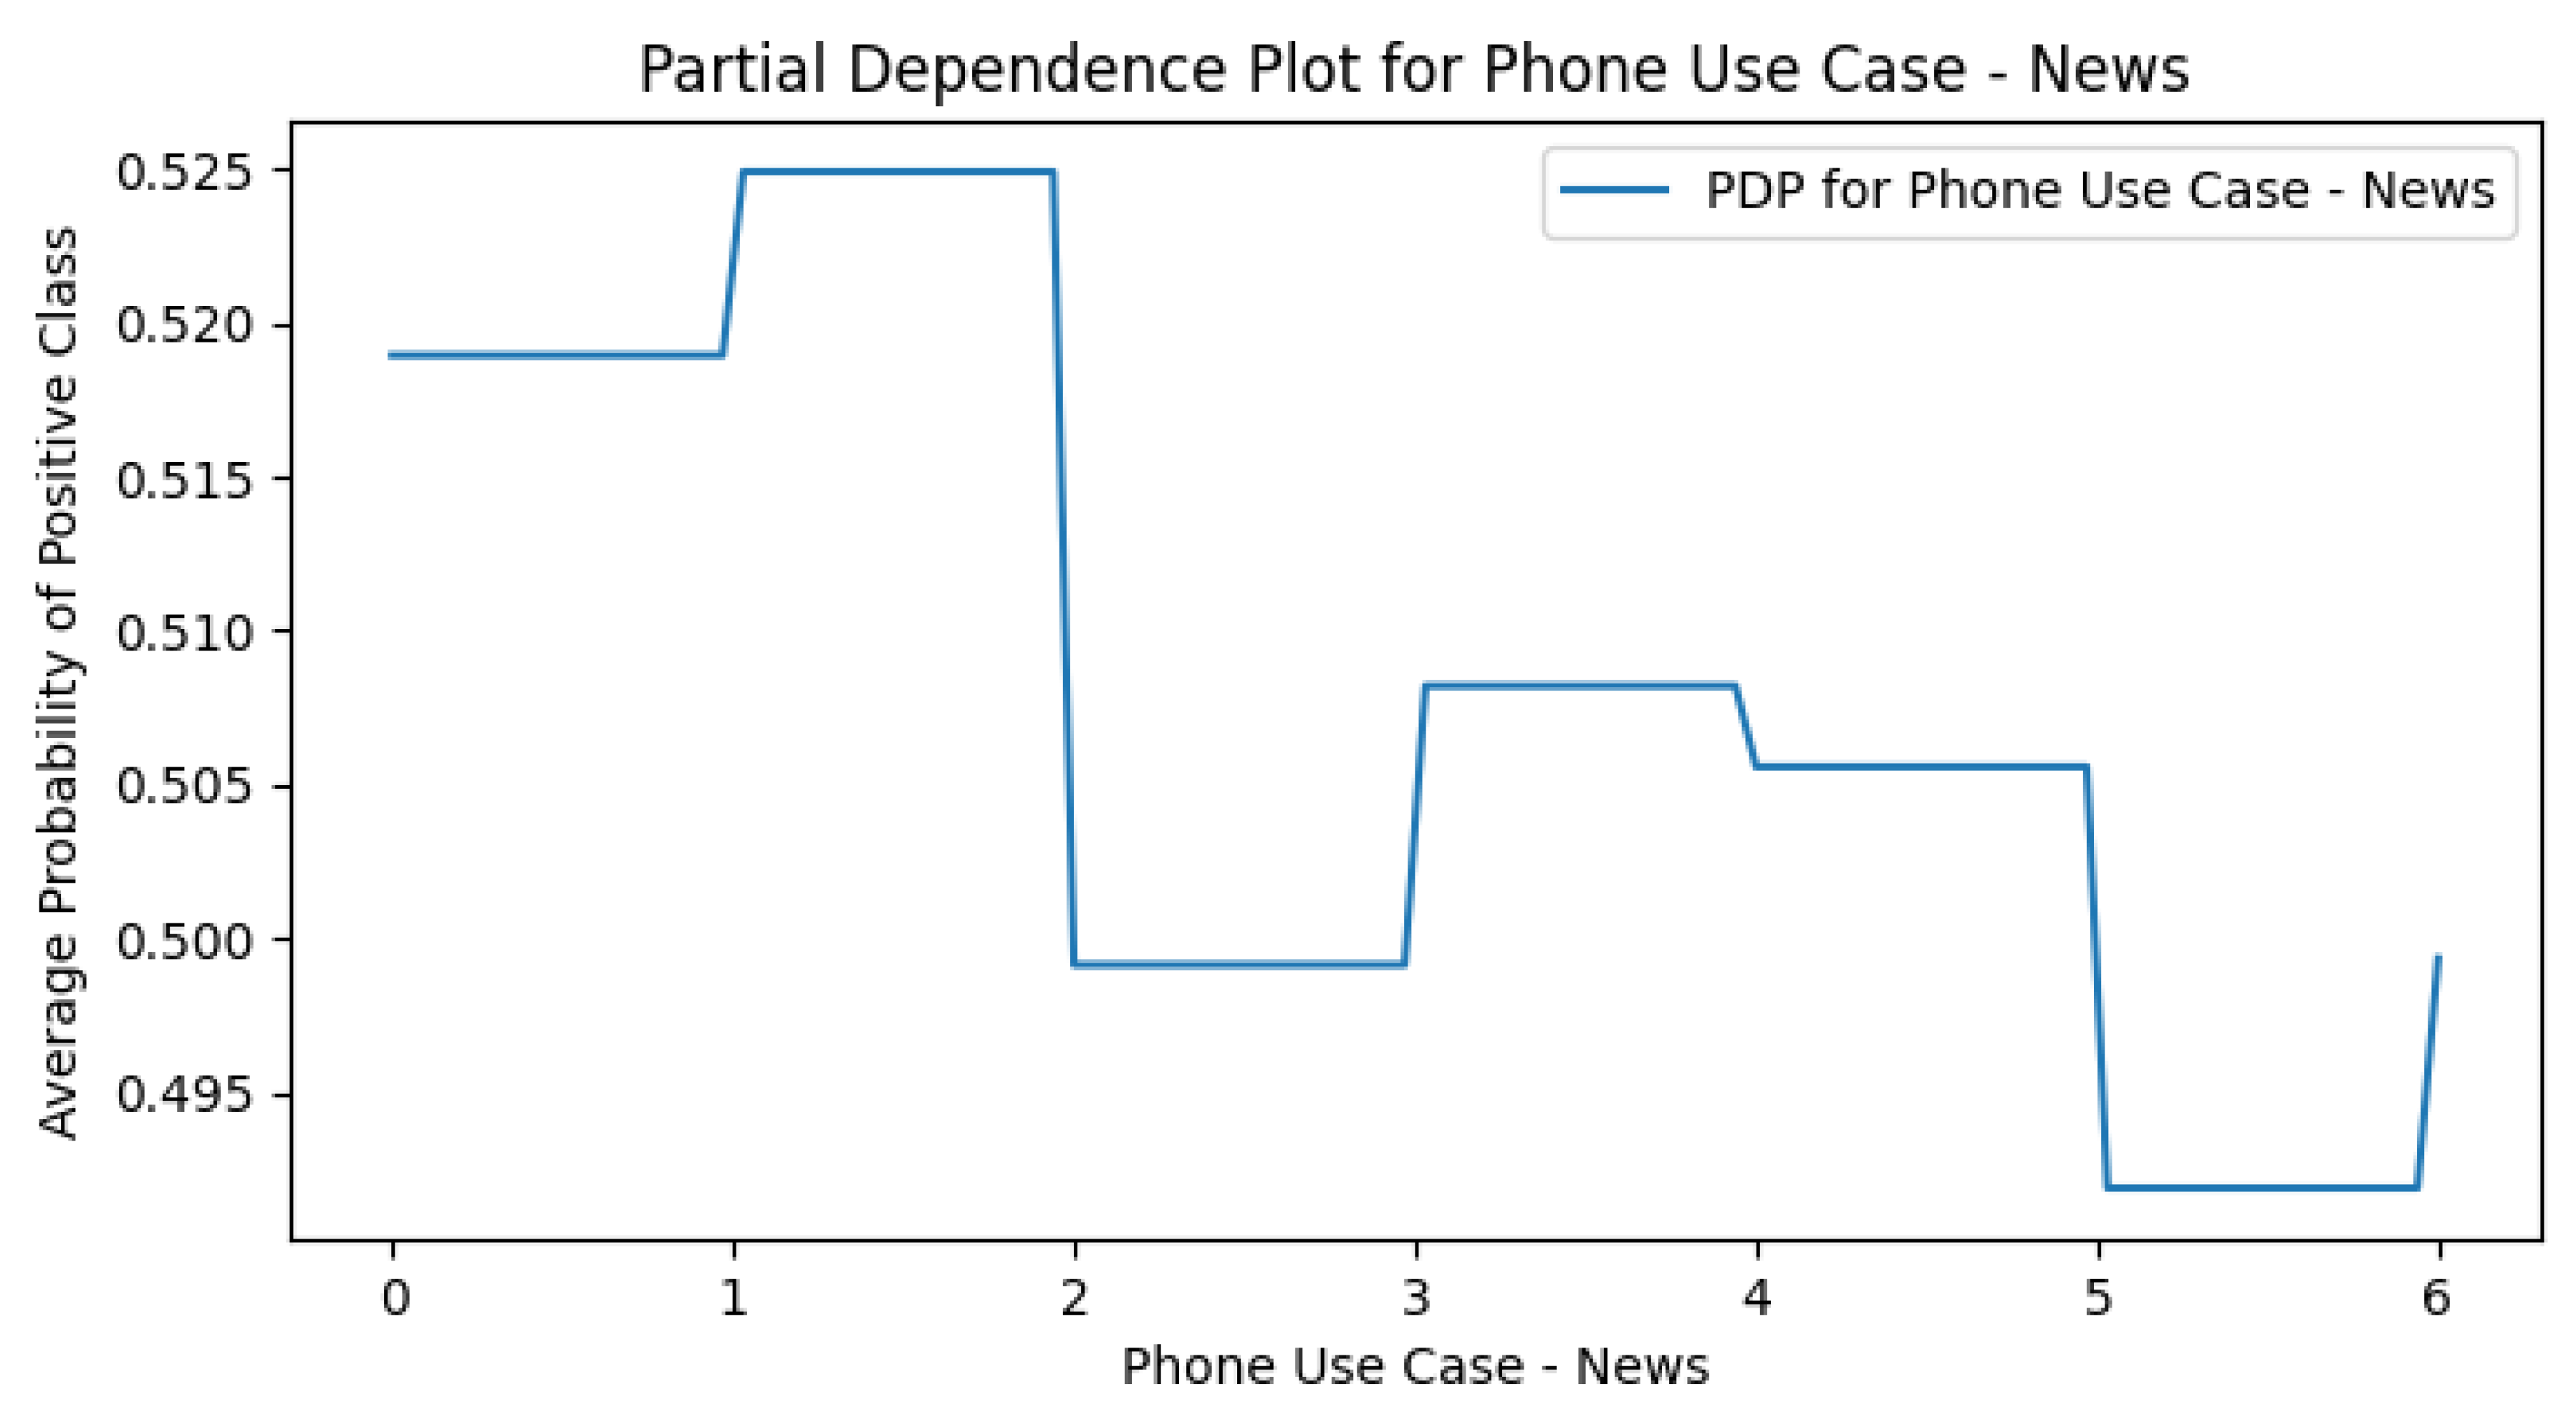
Figure A20.
PDP plot of Messenger in the Use Case Only model.
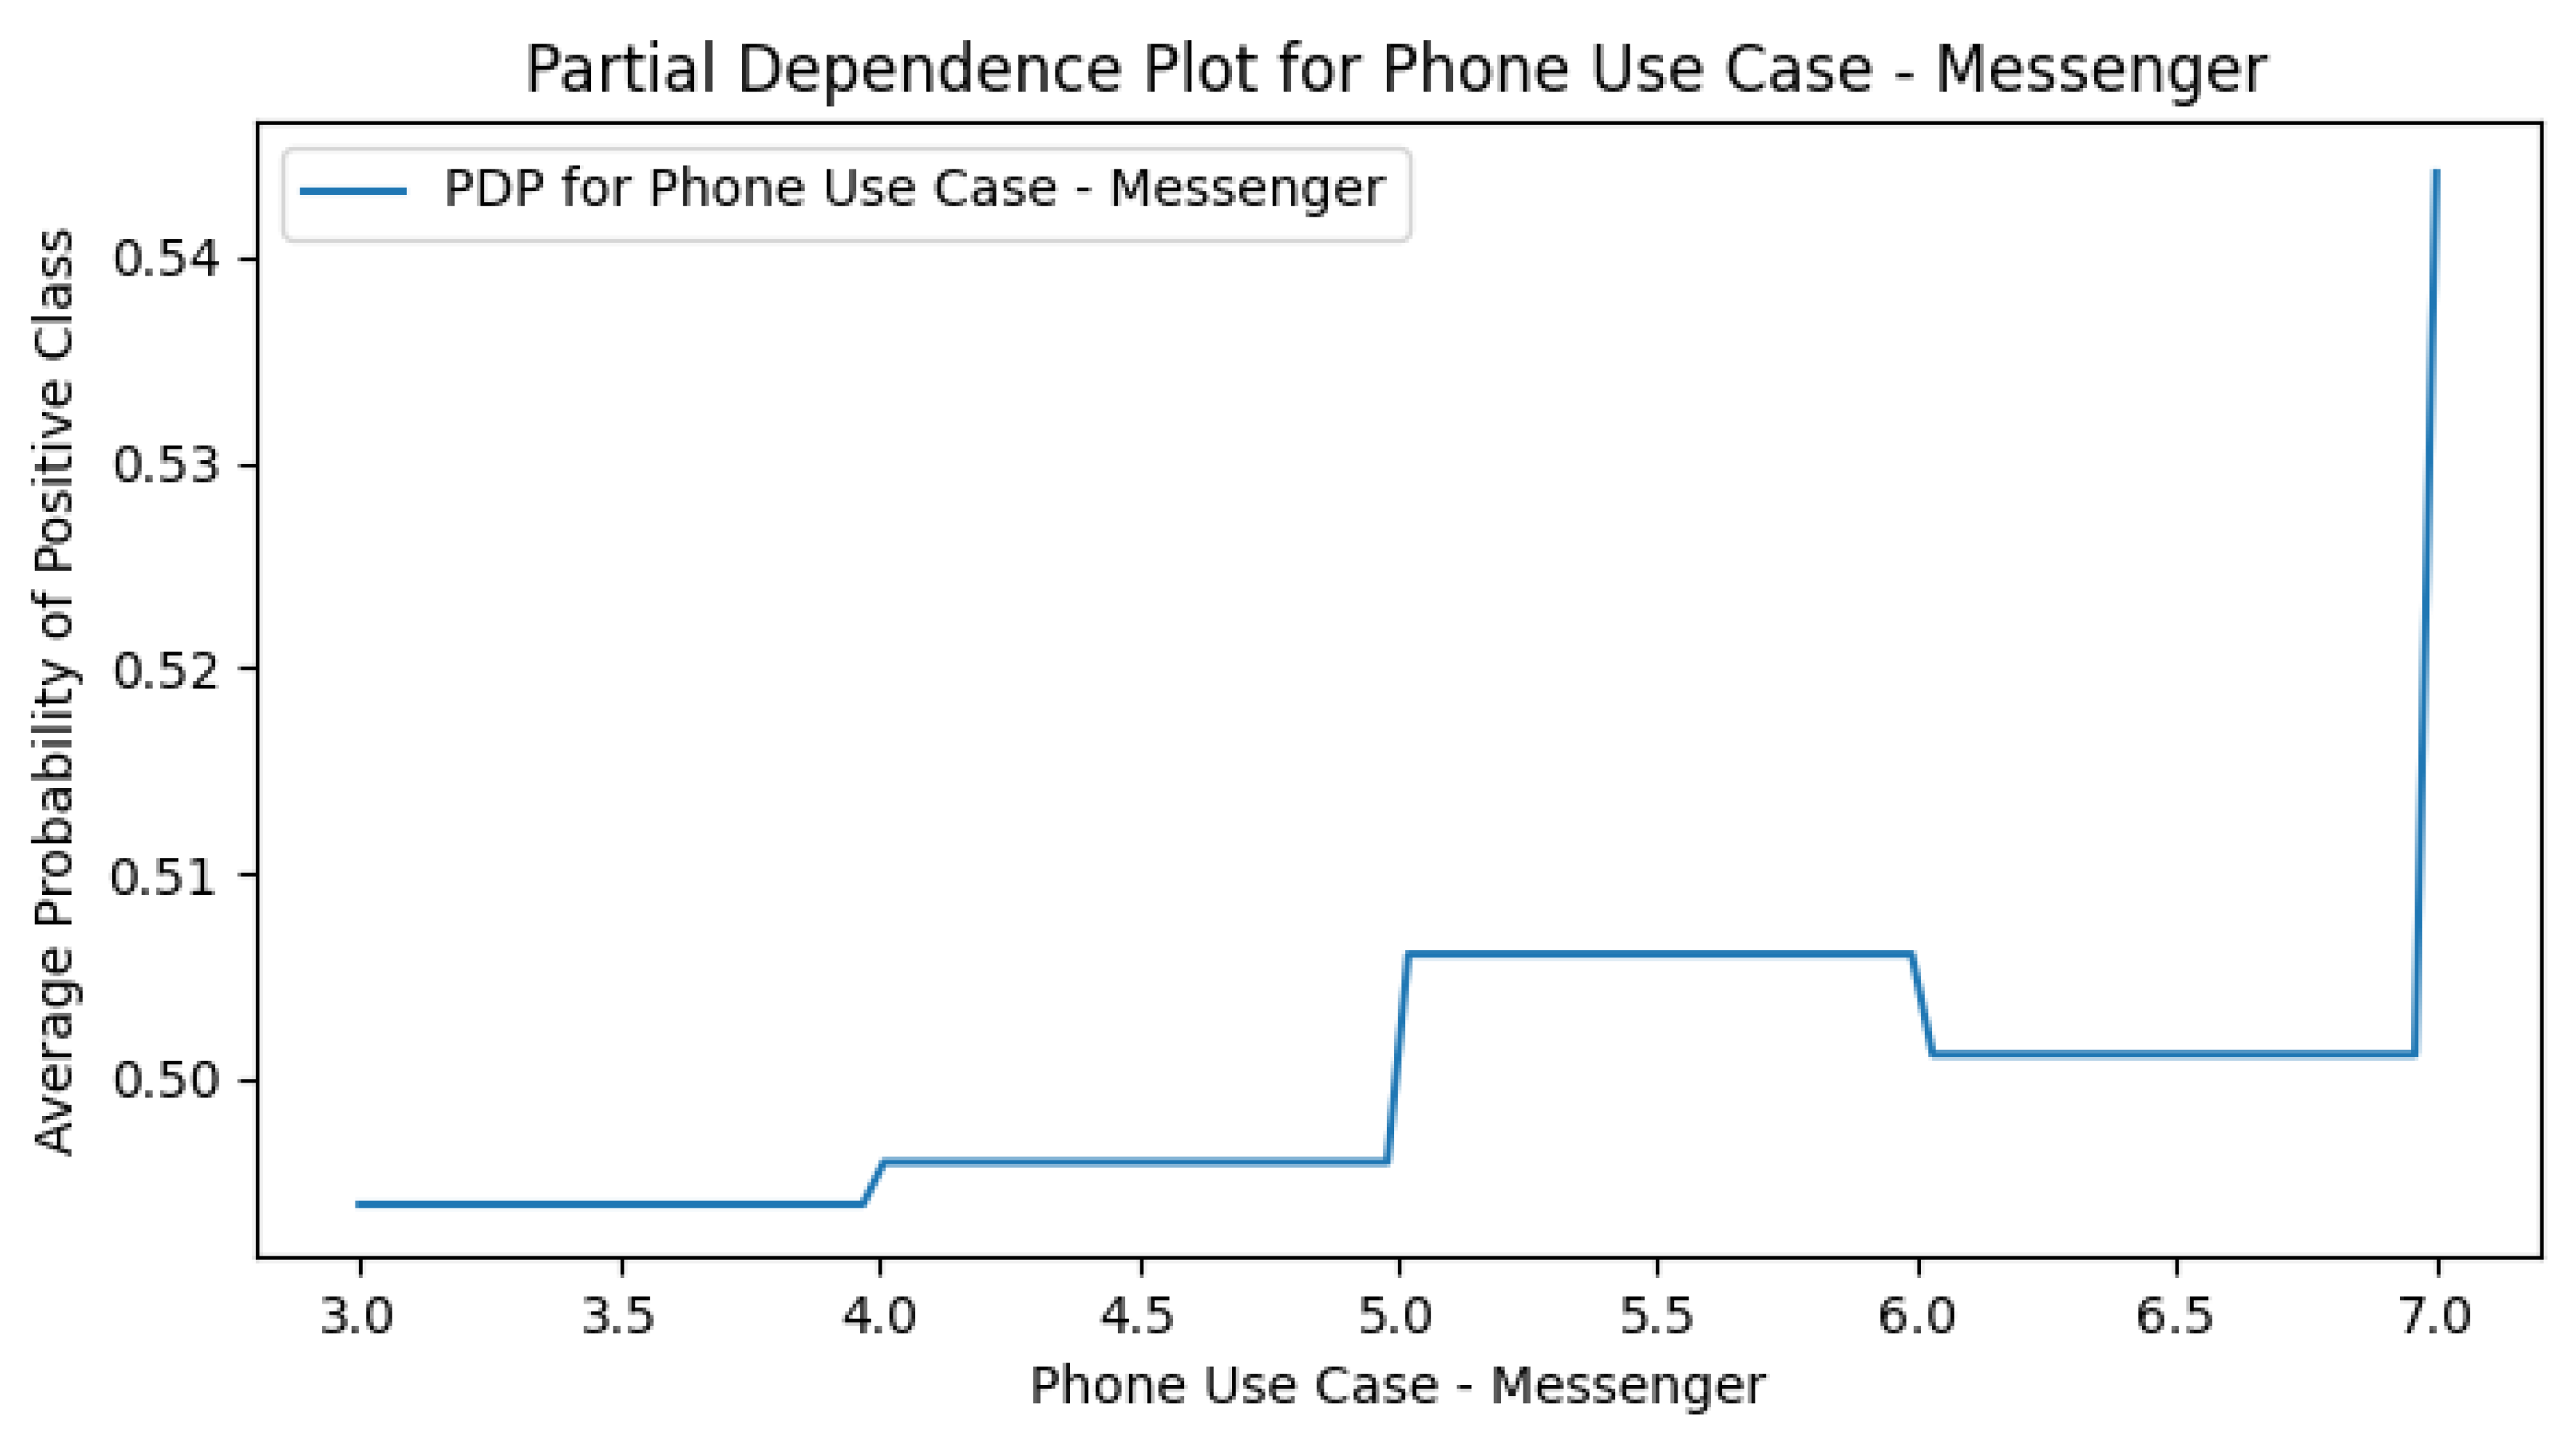
Figure A21.
PDP plot of Online Learning in the Use Case Only model.
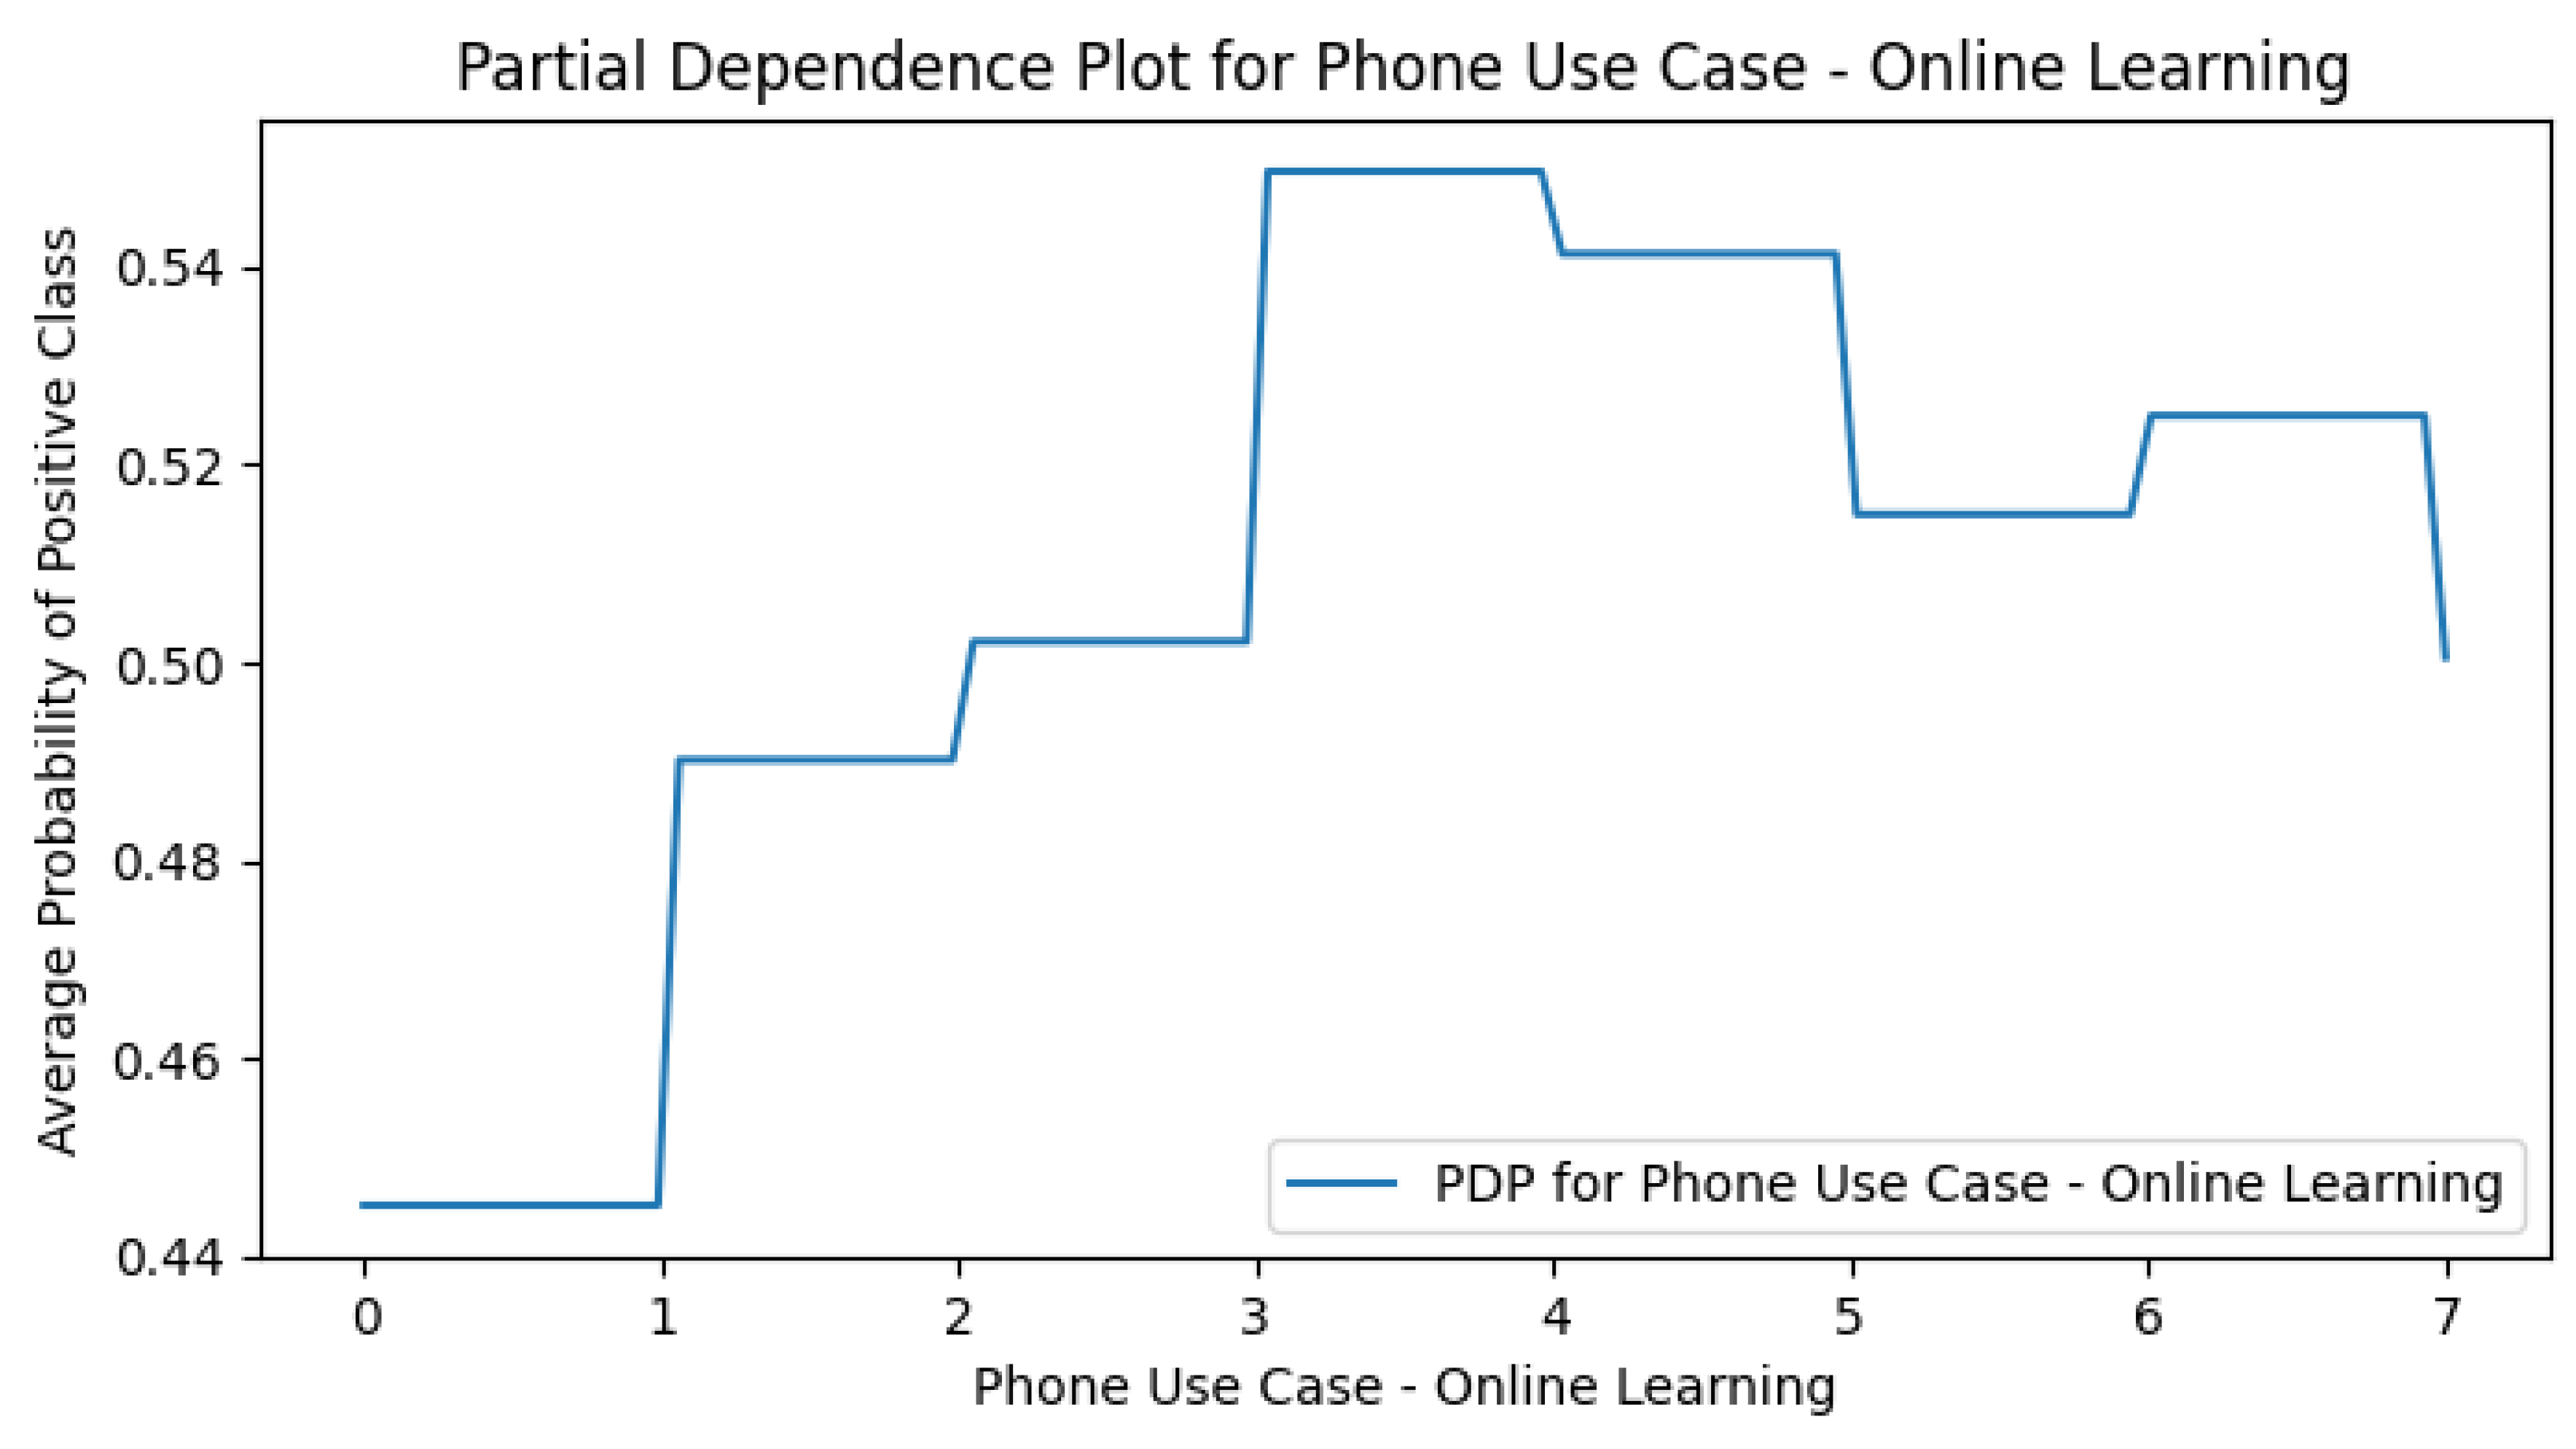
Figure A22.
PDP plot of Short Form Video Usage Portion in the Use Case Only model.
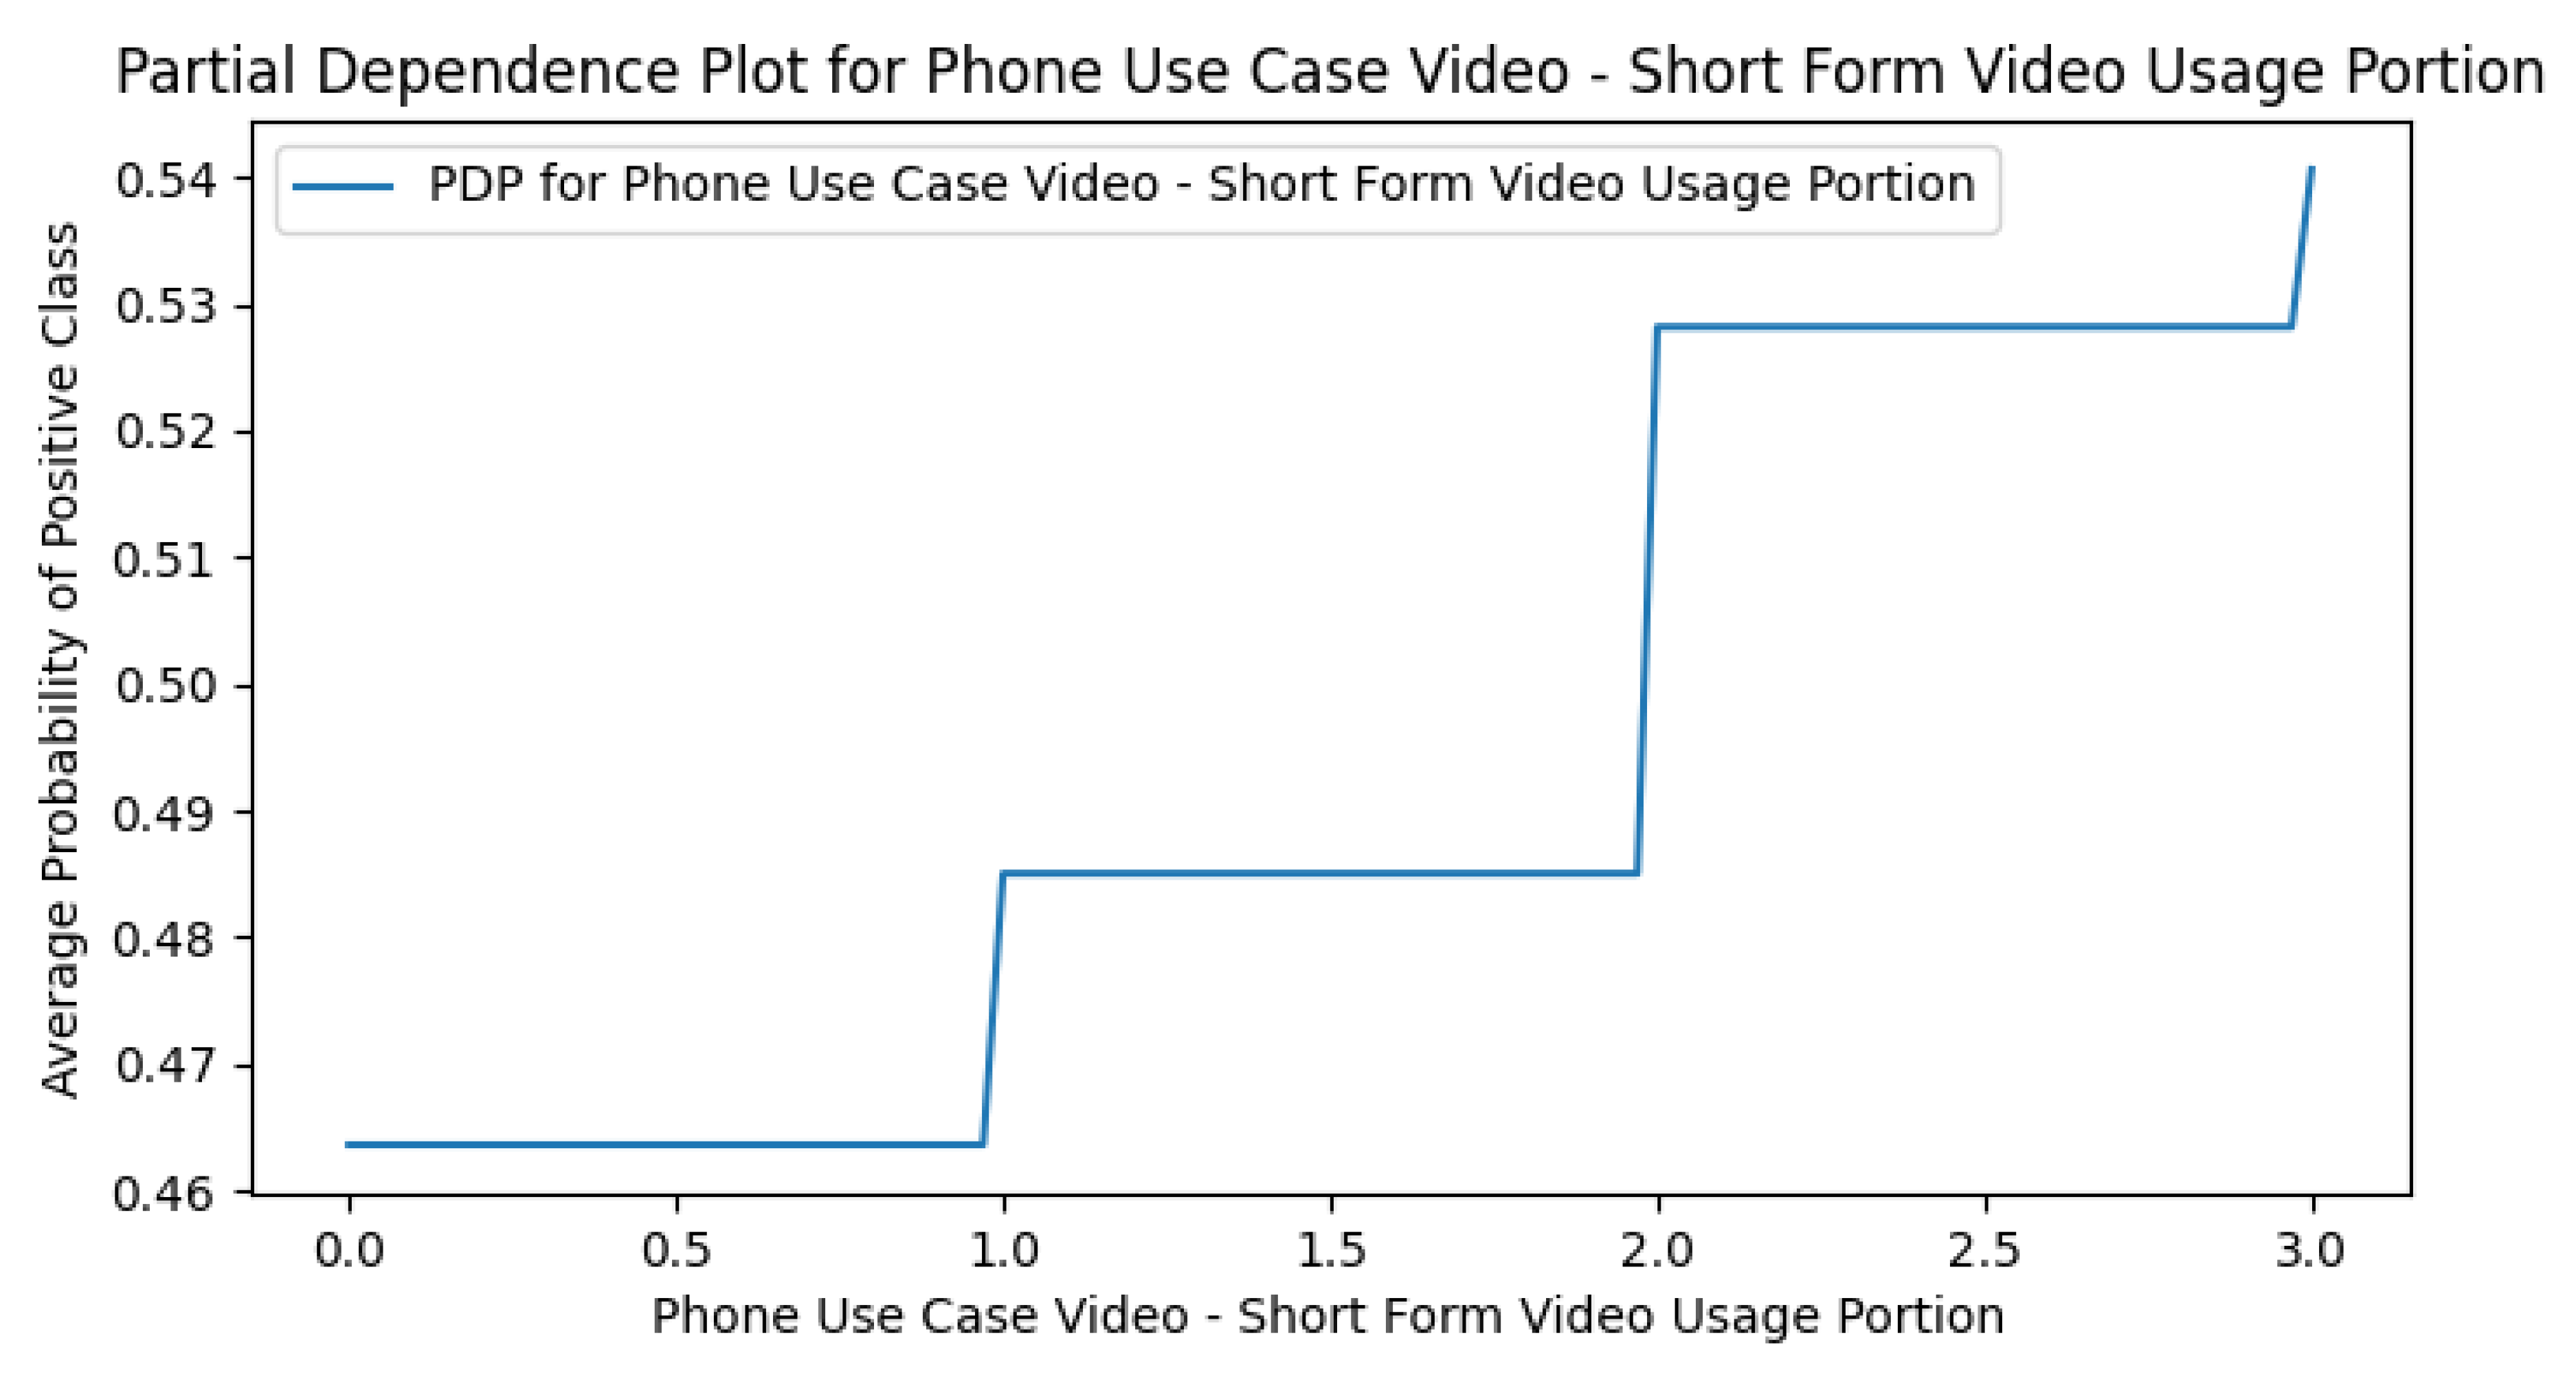
References
- Bae, S.R.; Lee, C.H.; Kim, N.D. A study on the status of media use among adolescents and policy responses by target group II: Teenagers. Technical report, National Youth Policy Institute, 2021.
- Woo, J.J.; Kwak, E.M.; Lee, H.J. The convergence study of smartphone overuse on cyberbullying: Focusing on mediating effects of aggression. Journal of the Korea Convergence Society 2018, 9, 61–67. [CrossRef]
- Qudah, M.F.A.; Albursan, I.S.; Bakhiet, S.F.A.; Hassan, E.M.A.H.; Alfnan, A.A.; Aljomaa, S.S.; Al-Khadher, M.M.A. Smartphone addiction and its relationship with cyberbullying among university students. International Journal of Mental Health and Addiction 2019, 17, 628–643. [CrossRef]
- Cha, J.H.; Choi, Y.J.; Ryu, S.; Moon, J.H. Association between smartphone usage and health outcomes of adolescents: A propensity analysis using the Korea Youth Risk Behavior Survey. PLOS ONE 2023, 18, e0294553. [CrossRef]
- Yun, H.; Choi, E.K. Association between smartphone overdependence and mental health in South Korean adolescents: A secondary data analysis. Child Health Nursing Research 2024, 30, 87–96. [CrossRef]
- Lee, Y.S.; Joo, J.H.; Shin, J.; Nam, C.M.; Park, E.C. Association between smartphone overdependence and generalized anxiety disorder among Korean adolescents. Journal of Affective Disorders 2023, 321, 108–113. [CrossRef]
- Wacks, Y.; Weinstein, A.M. Excessive Smartphone Use Is Associated With Health Problems in Adolescents and Young Adults. Frontiers in Psychiatry 2021, 12, 669042. [CrossRef]
- Paterna, A.; Alcaraz-Ibáñez, M.; Aguilar-Parra, J.M.; Salavera, C.; Demetrovics, Z.; Griffiths, M.D. Problematic smartphone use and academic achievement: A systematic review and meta-analysis. Journal of Behavioral Addictions 2024, 13, 313–326. [CrossRef]
- Ministry of Science and ICT (Republic of Korea). Intelligent Informatization Basic Act [Act No. 17344, revised June 9, 2020, effective December 10, 2020], Article 54, 2020. Retrieved from Ministry of Government Legislation.
- France 24. Digital pause: France pilots school mobile phone ban, 2024.
- Camera, L. Which states ban or restrict cellphones in schools?, 2024. U.S. News & World Report.
- Tourangeau, R.; Yan, T. Sensitive questions in surveys. Psychological Bulletin 2007, 133, 859–883. [CrossRef]
- Agostino, H.; Toulany, A. Considerations for privacy and confidentiality in adolescent health care service delivery. Paediatrics & child health 2023, 28, 172–177. [CrossRef]
- Thrall, J.S.; McCloskey, L.; Ettner, S.L.; Rothman, E.; Tighe, J.E.; Emans, S.J. Confidentiality and adolescents’ use of providers for health information and for pelvic examinations. Archives of Pediatrics & Adolescent Medicine 2000, 154, 885–892. [CrossRef]
- Department of Health, Education, and Welfare. The Belmont Report: Ethical principles and guidelines for the protection of human subjects of research. Technical report, U.S. Government Printing Office, 1979. DHEW Publication No. (OS) 78-0012.
- American Psychological Association. Ethical principles of psychologists and code of conduct (2002, amended June 1, 2010 and January 1, 2017), 2017. Retrieved from https://www.apa.org/ethics/code.
- Hasking, P.; Tatnell, R.C.; Martin, G. Adolescents’ reactions to participating in ethically sensitive research: a prospective self-report study. Child and Adolescent Psychiatry and Mental Health 2015, 9, 39. [CrossRef]
- Cruz-Gonzalez, P.; He, A.W.J.; Lam, E.P.; Ng, I.M.C.; Li, M.W.; Hou, R.; Chan, J.N.M.; Sahni, Y.; Guasch, N.V.; Miller, T.; et al. Artificial intelligence in mental health care: a systematic review of diagnosis, monitoring, and intervention applications. Psychological Medicine 2025, 55, e18. [CrossRef]
- Topol, E. Deep medicine: How artificial intelligence can make healthcare human again; Hachette UK, 2019.
- Kim, K.; Yoon, Y.; Shin, S. Explainable prediction of problematic smartphone use among South Korea’s children and adolescents using a machine learning approach. International Journal of Medical Informatics 2024, 186, 105441. [CrossRef]
- Lee, J.; Kim, W. Prediction of problematic smartphone use: A machine learning approach. International journal of environmental research and public health 2021, 18, 6458. [CrossRef]
- Giraldo-Jiménez, C.F.; Gaviria-Chavarro, J.; Sarria-Paja, M.; Bermeo Varón, L.A.; Villarejo-Mayor, J.J.; Rodacki, A.L.F. Smartphones dependency risk analysis using machine-learning predictive models. Scientific Reports 2022, 12, 22649. [CrossRef]
- Xiao, B.; Parent, N.; Rahal, L.; Shapka, J. Using machine learning to explore the risk factors of problematic smartphone use among Canadian adolescents during COVID-19: The important role of fear of missing out (FoMO). Applied Sciences 2023, 13, 4970. [CrossRef]
- Sapienza, A.; Lítlá, M.; Lehmann, S.; Alessandretti, L. Exposure to urban and rural contexts shapes smartphone usage behavior. PNAS Nexus 2023, 2, pgad357. [CrossRef]
- Yoo, J.D.; Lee, I.S.; Yang, J.H. A Study on Regional Smartphone Addiction with Demographic and Sociodemographic Factors. Journal of Social Science Research 2014, 40, 51–75. [CrossRef]
- Luo, J.; Cai, G.; Zu, X.; Huang, Q.; Cao, Q. Mobile phone addiction and negative emotions: an empirical study among adolescents in Jiangxi Province. Frontiers in Psychiatry 2025, 16, 1541605. [CrossRef]
- Wang, J.; Luo, Y.; Yan, N.; Wang, Y.; Shiferaw, B.D.; Tang, J.; Pei, Y.; Chen, Q.; Zhu, Y.; Wang, W. Network structure of mobile phone addiction and anxiety symptoms among rural Chinese adolescents. BMC Psychiatry 2023, 23, 491. [CrossRef]
- Shmueli, G. To explain or to predict? Statistical Science 2010, 25, 289–310. [CrossRef]
- Hand, D.J. Mining the past to determine the future: Problems and possibilities. International Journal of Forecasting 2009, 25, 441–451. [CrossRef]
- Holzinger, A.; Saranti, A.; Molnar, C.; Biecek, P.; Samek, W., Explainable AI Methods - A Brief Overview. In Explainable AI Methods; Springer International Publishing, 2022; pp. 13–38. [CrossRef]
- Ignatiev, A. Towards Trustable Explainable AI. In Proceedings of the Proceedings of the Twenty-Ninth International Joint Conference on Artificial Intelligence. International Joint Conferences on Artificial Intelligence Organization, 2020, IJCAI-20, pp. 5154–5158. [CrossRef]
- National Information Society Agency. Development of Smartphone Overdependence Scale: Final Report. In Digital Culture Forum Policy Research Report; Agency, N.I.S., Ed.; National Information Society Agency: Daegu, South Korea, 2016; pp. 253–281. Published as part of the 2016 National Information Society Agency Digital Culture Forum Policy Research Report.
- Kim, S.K.; Shin, H.R.; Kim, Y.S. Study on Relation Between Education Level and Overdependence on Smartphone for Middle-Aged and Elderly People: Focused on Mediator Effect of Willingness to Participate in Smartphone Overdependence Prevention Program. Journal of Social Science 2020, 31, 31–46. [CrossRef]
- Lee, Y.G. Factors Affecting Help-Seeking for Smartphone Overdependence Among Adolescents. Journal of Information Policy 2018, 25, 82–98. [CrossRef]
- National Information Society Agency. 2023 Survey on Smartphone Overdependence. Research Report NIA VIII-RSE-C-23065, National Information Society Agency, 2023.
- Cho, S.; Lee, S.; Woo, H.J.; Ko, Y.H.; Jeong, K.H. Relationship Between Types of Smartphone Use Among Adolescents and Smartphone Addiction: Focusing on Gender Differences. Journal of Men’s Health 2025, 21, 33–43. [CrossRef]
- Khan, F.N.; Begum, M.; Imad, M. Relationship Between Students’ Home Environment and Their Academic Achievement at Secondary School Level. Pakistan Journal of Distance & Online Learning 2019, 5, 223–234.
- Conley, D. A Room with a View or a Room of One’s Own? Housing and Social Stratification. Sociological Forum 2001, 16, 263–280. [CrossRef]
- Carlson, M.J.; Corcoran, M.E. Family Structure and Children’s Behavioral and Cognitive Outcomes. Journal of Marriage and Family 2001, 63, 779–792. [CrossRef]
- Sasson, H.; Mesch, G.S. Parental Mediation. In The International Encyclopedia of Media Literacy; Hobbs, R.; Mihailidis, P., Eds.; Wiley, 2019; pp. 1–6. [CrossRef]
- Chen, Y.; Gu, Q.; Xu, Y.; Liang, J.; Ni, C. A Chain Mediation Model Reveals the Association Between Parental Mediation and Smartphone Addiction of Chinese Adolescents. Scientific Reports 2025, 15, 15777. [CrossRef]
- Lee, J.; Lee, S.; Shin, Y. Lack of Parental Control Is Longitudinally Associated With Higher Smartphone Addiction Tendency in Young Children: A Population-Based Cohort Study. Journal of Korean Medical Science 2024, 39, e254. [CrossRef]
- Cobb, S. Social Support as a Moderator of Life Stress. Psychosomatic Medicine 1976, 38, 300–314. [CrossRef]
- Zhong, G.; Shu, Y.; Zhou, Y.; Li, H.; Zhou, J.; Yang, L. The Relationship Between Social Support and Smartphone Addiction: The Mediating Role of Negative Emotions and Self-Control. BMC Psychiatry 2025, 25. [CrossRef]
- Karoly, P. Mechanisms of Self-Regulation: A View. Annual Review of Psychology 1993, 44, 23–52. [CrossRef]
- Ding, Y.; Wan, X.; Lu, G.; Huang, H.; Liang, Y.; Yu, J.; Chen, C. The Associations Between Smartphone Addiction and Self-Esteem, Self-Control, and Social Support Among Chinese Adolescents: A Meta-Analysis. Frontiers in Psychology 2022, 13. [CrossRef]
- Livingstone, S.; Helsper, E. Balancing opportunities and risks in teenagers’ use of the internet: The role of online skills and internet self-efficacy. New media & society 2010, 12, 309–329. [CrossRef]
- Shin, D.C.; Johnson, D.M. Avowed Happiness as an Overall Assessment of the Quality of Life. Social Indicators Research 1978, 5, 475–492. [CrossRef]
- Kartol, A.; Üztemur, S. Let Me Check My Phone: Smartphone Addiction and Its Links to Life Satisfaction and Psychological Resilience. British Journal of Guidance & Counselling 2025, pp. 1–12. [CrossRef]
- Mirowsky, J.; Ross, C.E. Measurement for a Human Science. Journal of Health and Social Behavior 2002, 43, 152–170. [CrossRef]
- Pedregosa, F.; Varoquaux, G.; Gramfort, A.; Michel, V.; Thirion, B.; Grisel, O.; Blondel, M.; Prettenhofer, P.; Weiss, R.; Dubourg, V.; et al. Scikit-learn: Machine Learning in Python. Journal of Machine Learning Research 2011, 12, 2825–2830.
- Hosmer, Jr., D.W.; Lemeshow, S. Applied Logistic Regression, 2 ed.; Wiley: New York, NY, 2000. [CrossRef]
- Quinlan, J.R. Induction of Decision Trees. Machine Learning 1986, 1, 81–106. [CrossRef]
- Breiman, L. Random Forests. Machine Learning 2001, 45, 5–32. [CrossRef]
- Chen, T.; Guestrin, C. XGBoost: A Scalable Tree Boosting System. In Proceedings of the Proceedings of the 22nd ACM SIGKDD International Conference on Knowledge Discovery and Data Mining, New York, NY, USA, 2016; KDD 6, pp. 785–794. [CrossRef]
- Ke, G.; Meng, Q.; Finley, T.; Wang, T.; Chen, W.; Ma, W.; Ye, Q.; Liu, T.Y. LightGBM: A Highly Efficient Gradient Boosting Decision Tree. In Proceedings of the Advances in Neural Information Processing Systems 30, 2017, NIPS 2017, pp. 3146–3154.
- Akiba, T.; Sano, S.; Yanase, T.; Ohta, T.; Koyama, M. Optuna: A Next-generation Hyperparameter Optimization Framework. In Proceedings of the Proceedings of the 25th ACM SIGKDD International Conference on Knowledge Discovery and Data Mining, 2019.
- Carter, J.V.; Pan, J.; Rai, S.N.; Galandiuk, S. ROC-ing along: Evaluation and interpretation of receiver operating characteristic curves. Surgery 2016, 159, 1638–1645. [CrossRef]
- Hastie, T.; Tibshirani, R.; Friedman, J.H.; Friedman, J.H. The elements of statistical learning: data mining, inference, and prediction; Vol. 2, Springer, 2009.
- Aumann, R., The Shapley Value. In Game Theory and Applications; Elsevier, 1990; p. 158–165.
- Lundberg, S.M.; Lee, S.I. A unified approach to interpreting model predictions. Advances in neural information processing systems 2017, 30.
- Molnar, C. Interpretable machine learning; Lulu. com, 2020.
- Cho, S.; Lee, S.; Woo, H.J.; Ko, Y.H.; Jeong, K.H. Relationship between types of smartphone use among adolescents and smartphone addiction: Focusing on gender differences. Journal of Men’s Health 2025, 21, 33–43. [CrossRef]
- Gao, L.; Zhu, X.; Caselli, G.; Wang, Y.; Chu, X.; Chen, H. Distinct roles of specific metacognitive beliefs in adolescent problematic mobile phone use: A cross-lagged panel network analysis. Addictive Behaviors 2025, 165, 108291. [CrossRef]
- Yoo, Y.S.; Cho, O.H.; Cha, K.S. Associations between overuse of the internet and mental health in adolescents. Nursing & Health Sciences 2014, 16, 193–200. [CrossRef]
| 1 | One dummy variable is dropped due to never being endorsed in the sample. |
Figure 1.
The Area Under the Receiver Operating Characteristic curves (AUC) of the M4 (+Smartphone Use Cases) nested model, the Smartphone Consequences & Dependence (Smart CD) construct-based model, the Perceived Digital Competence & Risk (Perceived DCR) construct-based model, and the Smartphone Use Cases (Use Case) construct-based model are presented.
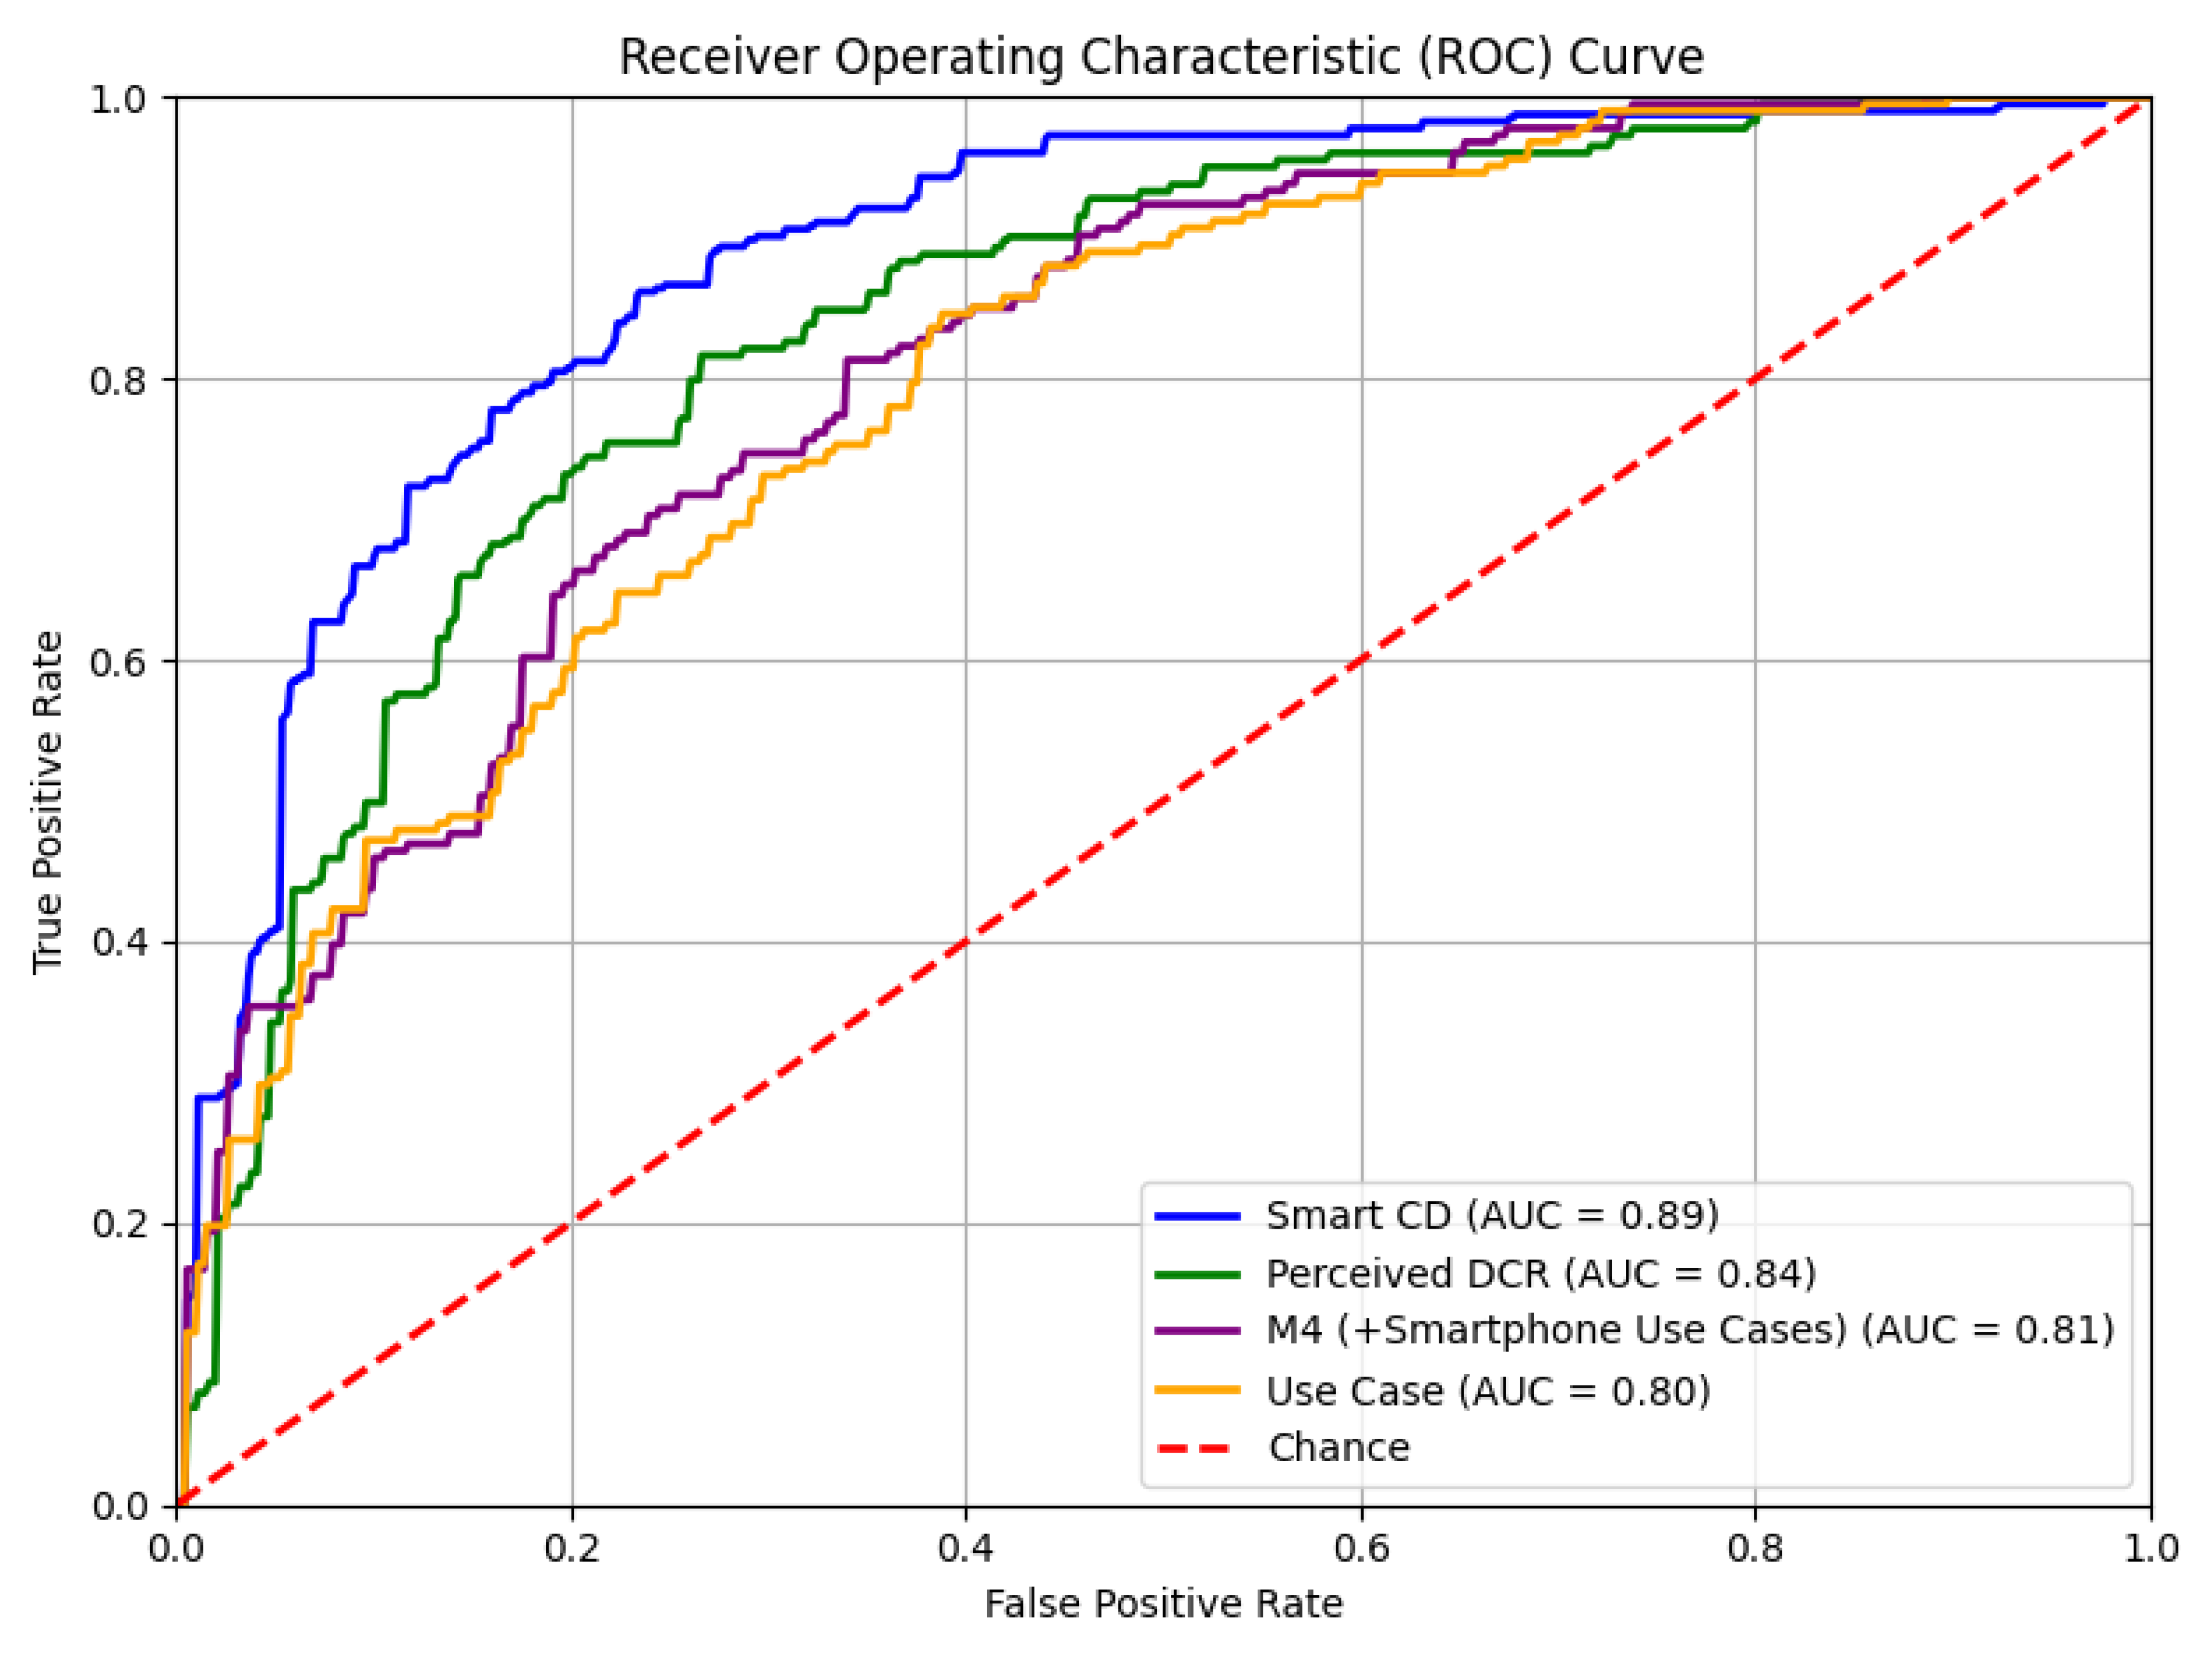
Figure 2.
The SHAP beeswarm plots of the M4 (+Smartphone Use Cases) nested model, the Smartphone Consequences & Dependence (Smart CD) construct-based model, the Perceived Digital Competence & Risk (Perceived DCR) construct-based model, and the Smartphone Use Cases (Use Case) construct-based model are presented.
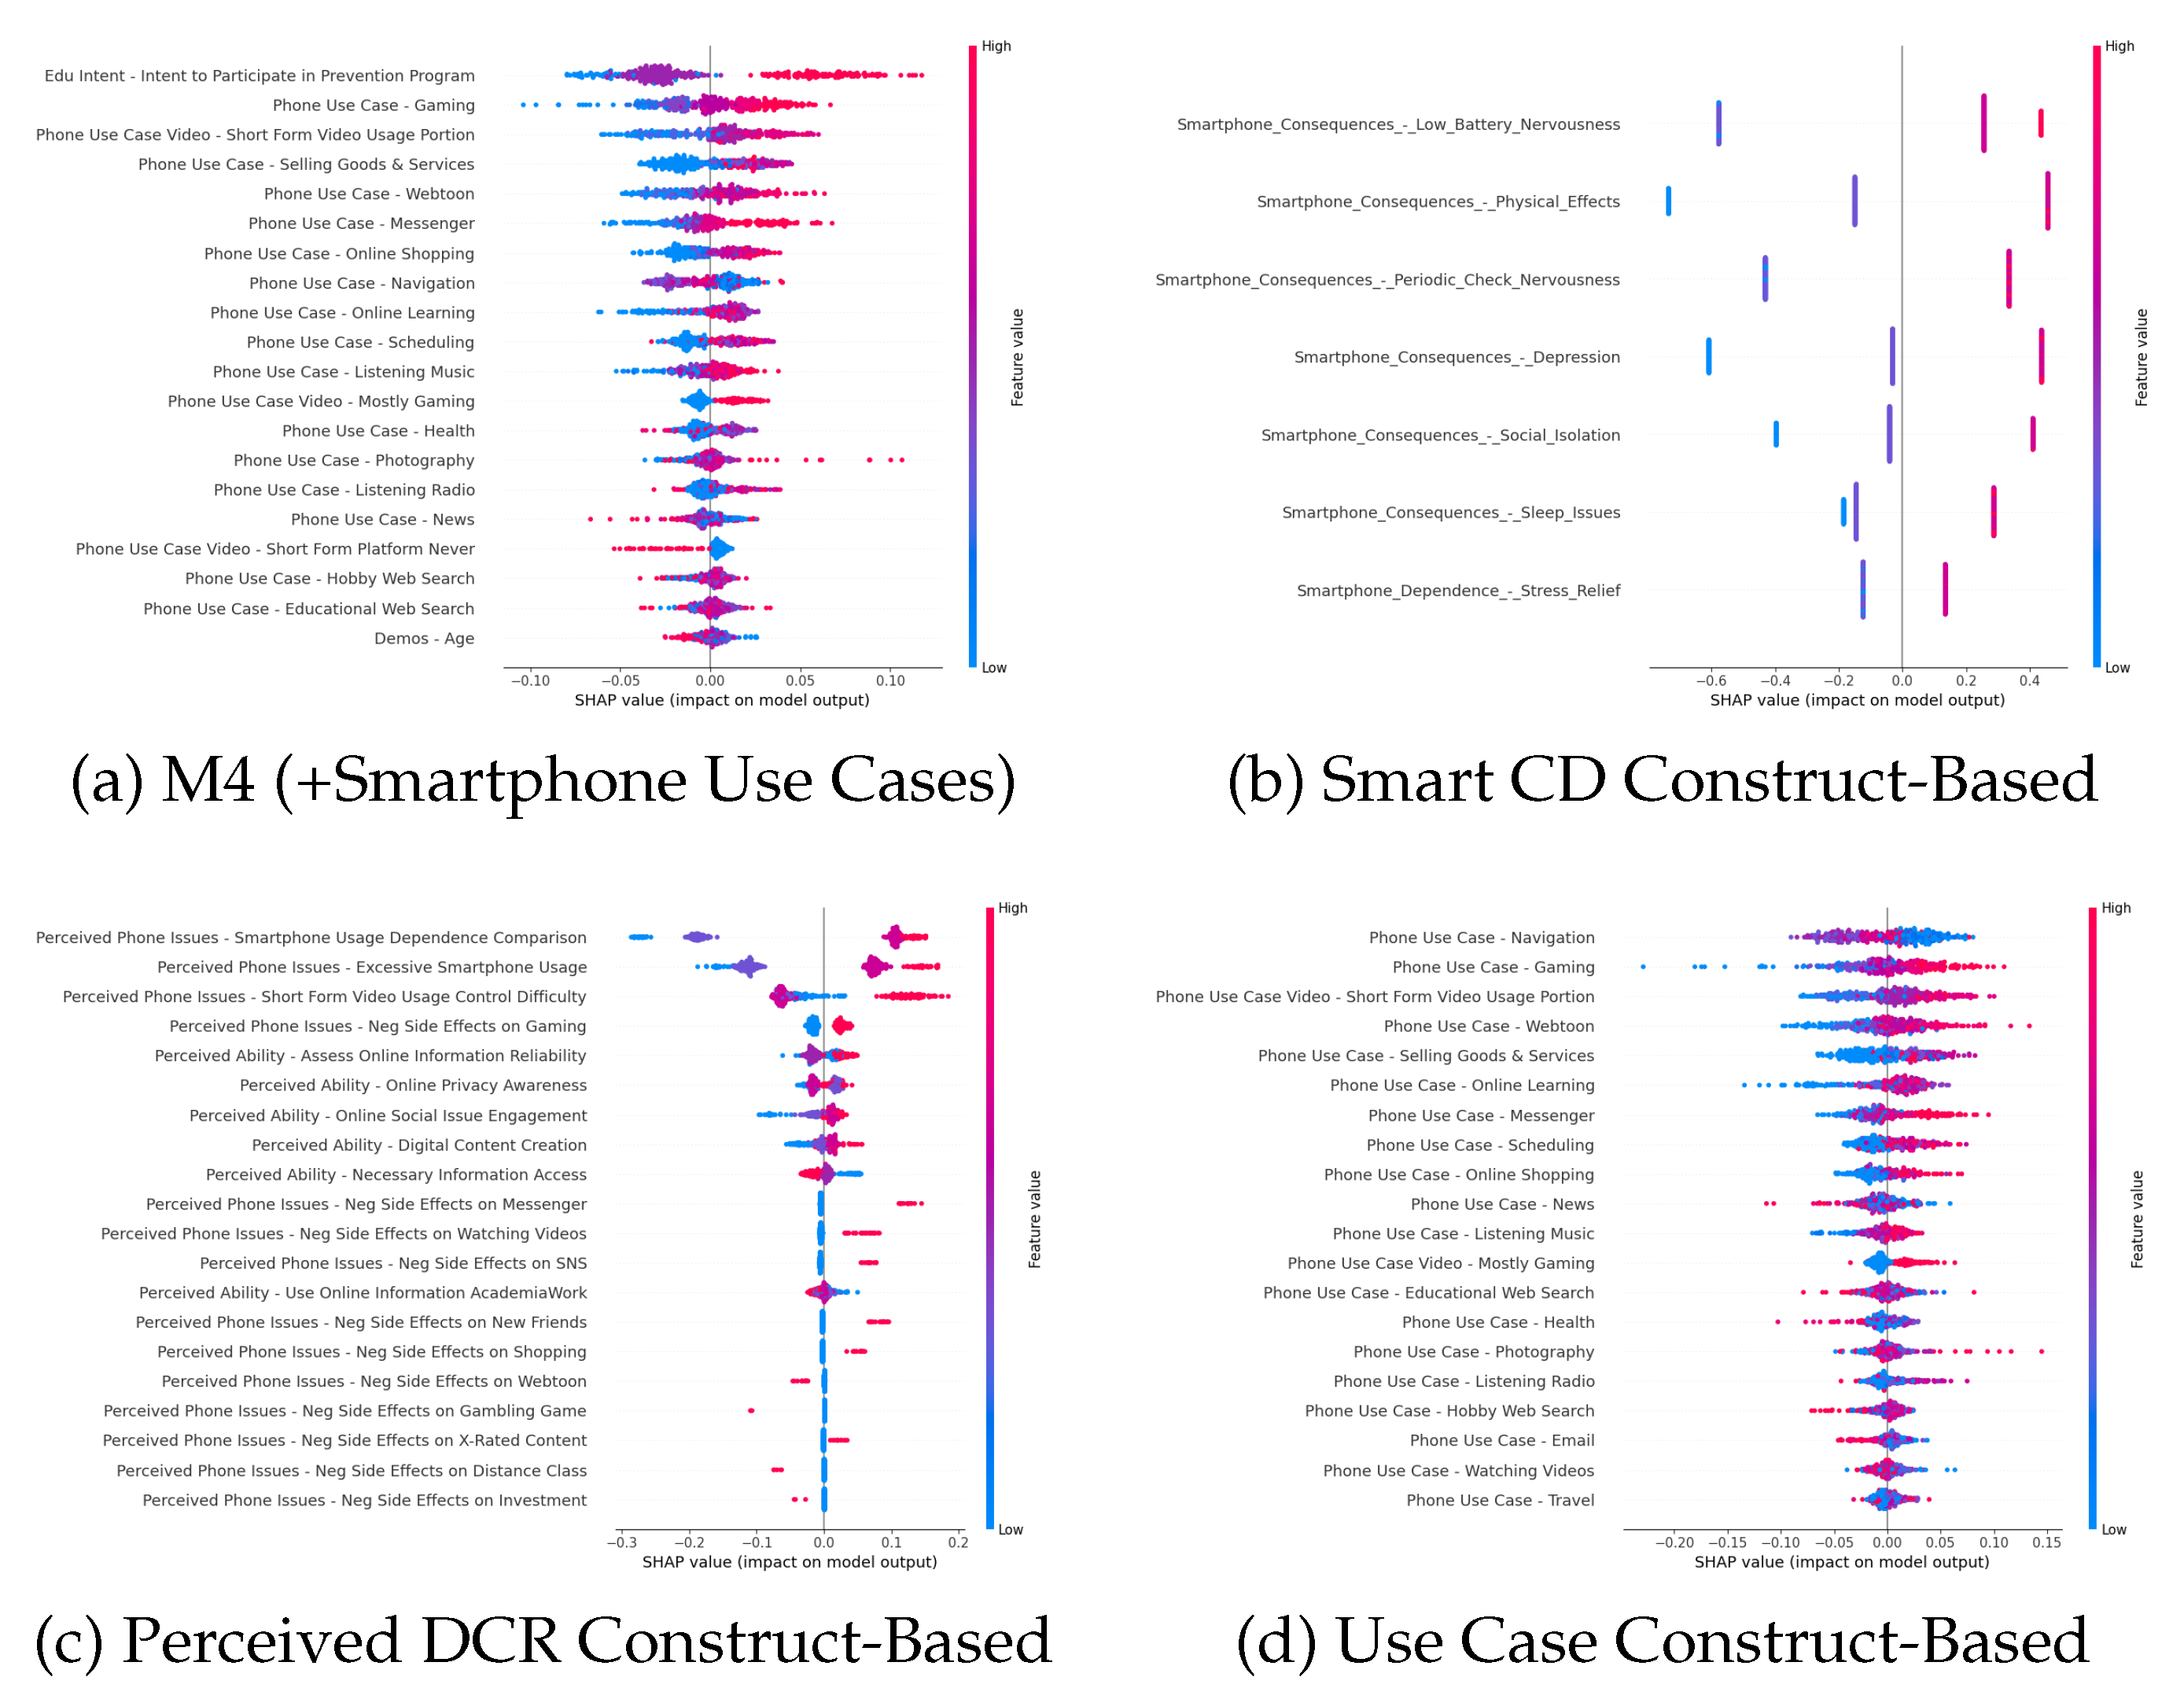
Figure 3.
The place-stratified SHAP feature importance rankings of the M4 (+Smartphone Use Cases) nested model, the Smartphone Consequences & Dependence (Smart CD) construct-based model, the Perceived Digital Competence & Risk (Perceived DCR) construct-based model, and the Smartphone Use Cases (Use Case) construct-based model are presented.
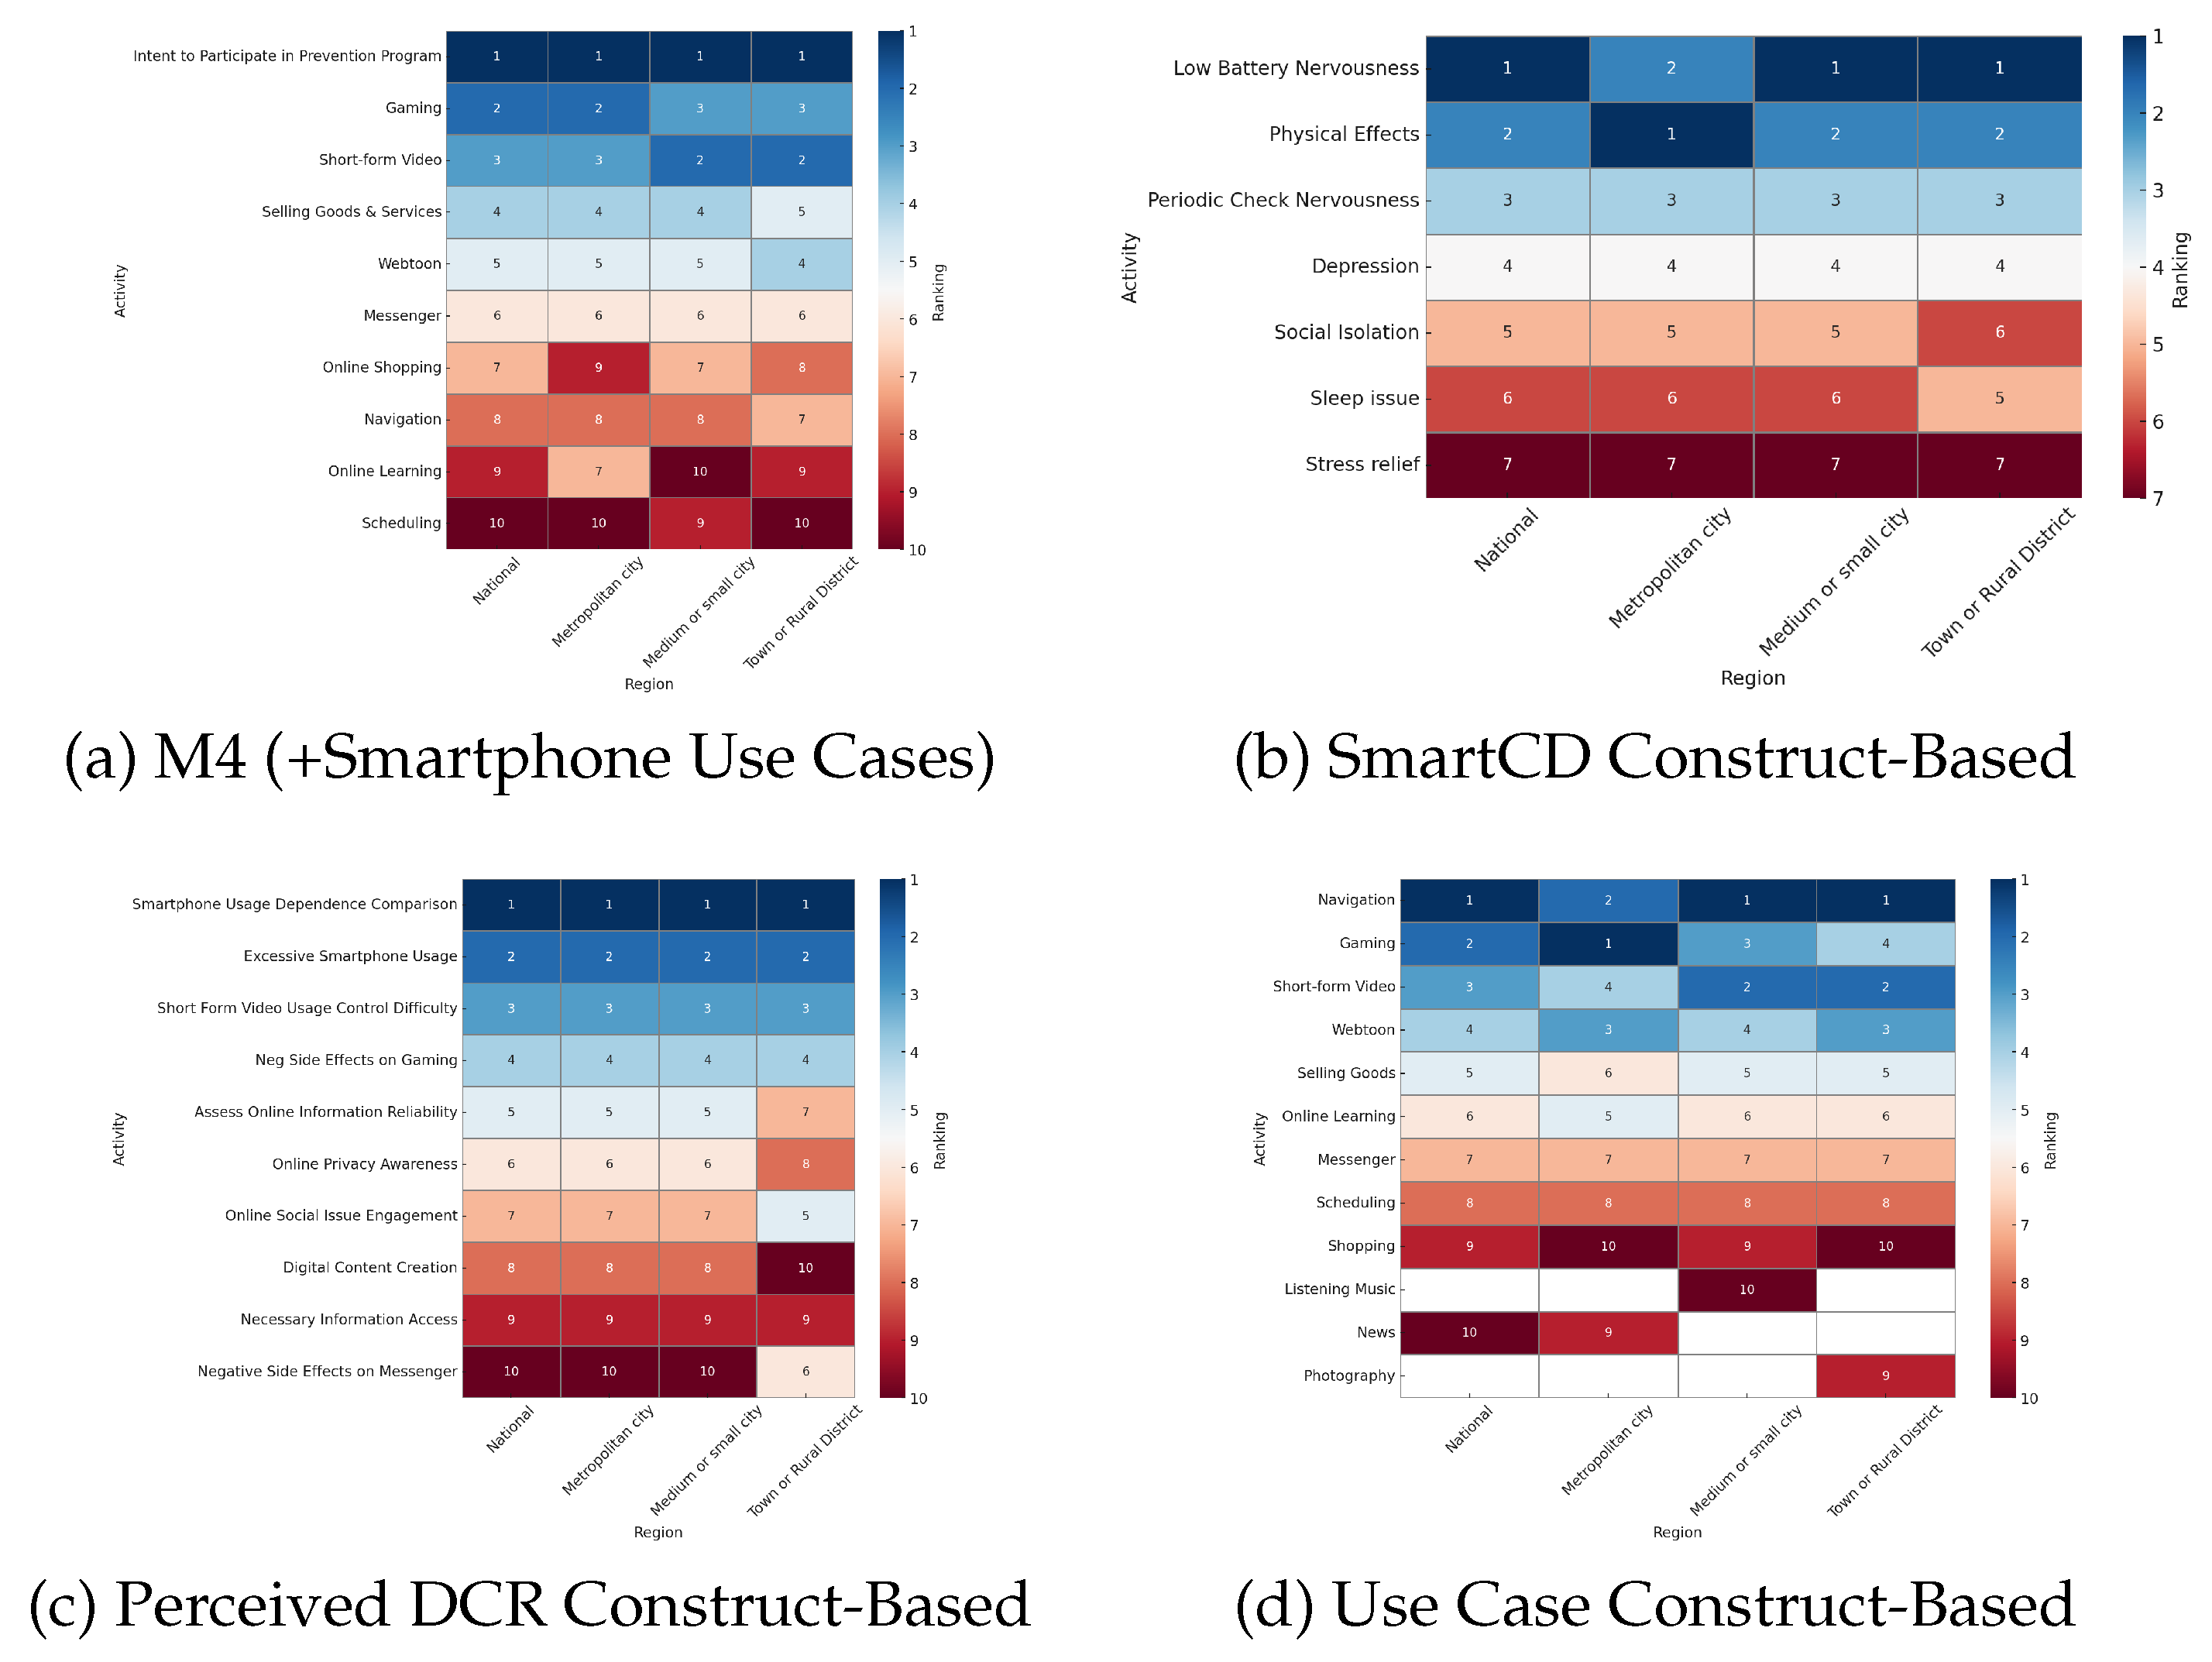
Figure 4.
Partial Dependence Plots (PDP) of select features in the Nested M4 (+Smartphone Use Cases) model. Subplot A. shows the PDP for "Edu Intent - Intent to Participate in Prevention Program". Subplot B. "Phone Use Case - Gaming" shows the PDP for Subplot C. "Phone Use Case Video - Short Form Video Usage Portion" shows the PDP for Subplot D. shows the PDP for "Phone Use Case - Navigation".

Figure 5.
PDP examples of the three marginal effects patterns from the Smart CD model. Subplot A. shows "Social Isolation" as the linear, step-wise increase pattern; Subplot B. shows the "Physical Effects" as the thresholding effect pattern; and Subplot C. shows the "Periodic Check Nervousness" as the binary effect pattern.
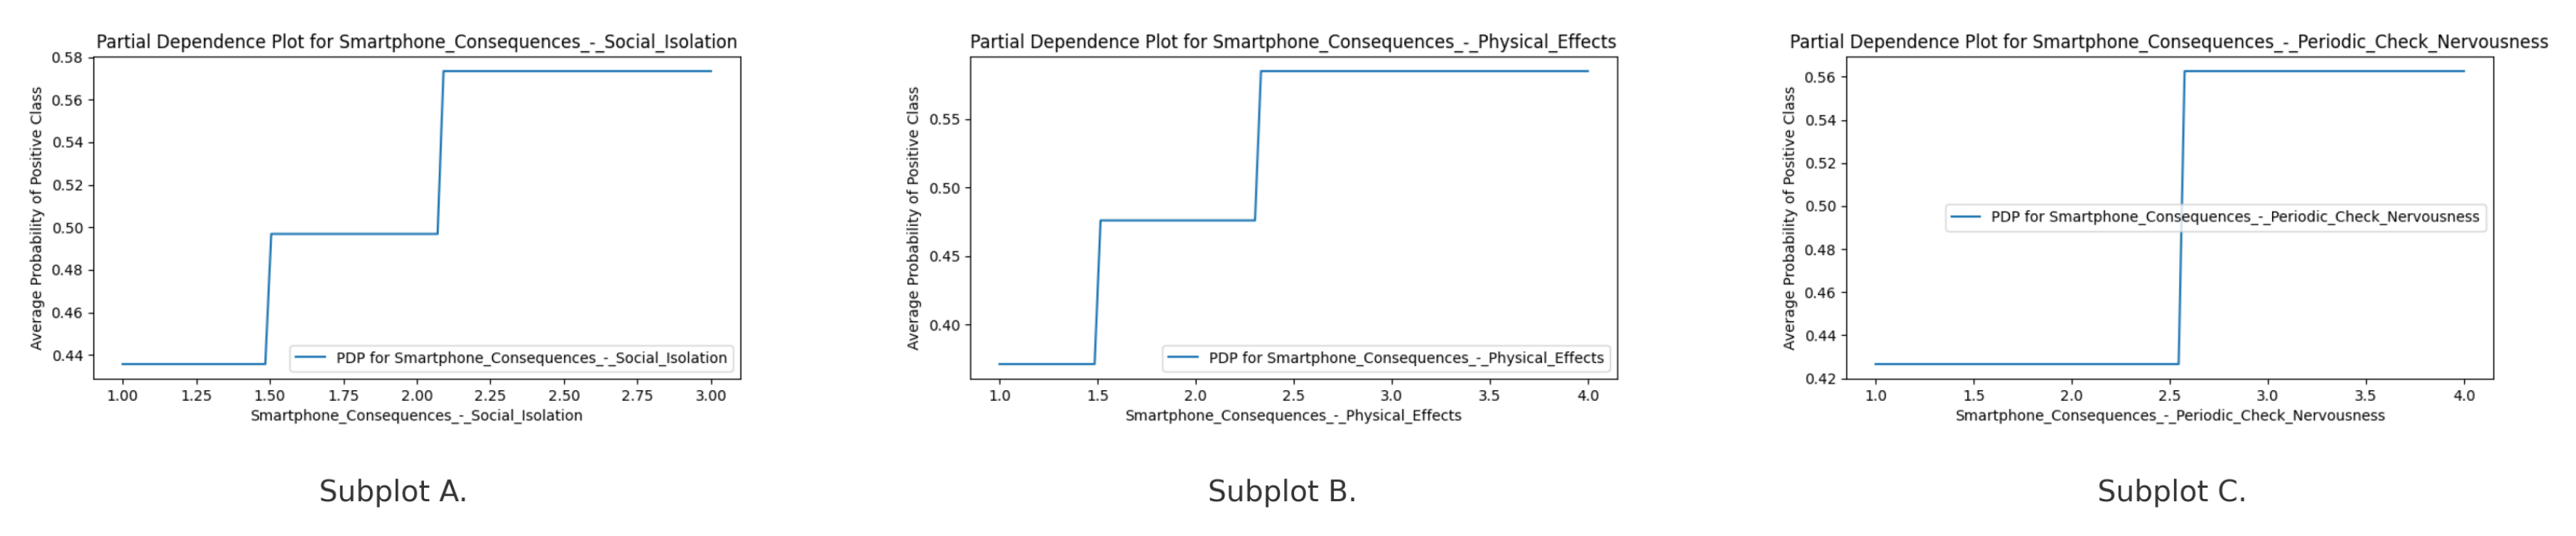
Figure 6.
PDP examples of the three marginal effects patterns from the Perceived DCR model. Subplot A. shows "Perceived Ability – Digital Content Creation" as the positive to negative curve; Subplot B. shows the "Perceived Ability – Assess Online Information Reliability" as the negative to positive curve; and Subplot C. shows the "Perceived Ability – Online Privacy Awareness" as the positive to negative to positive curve.
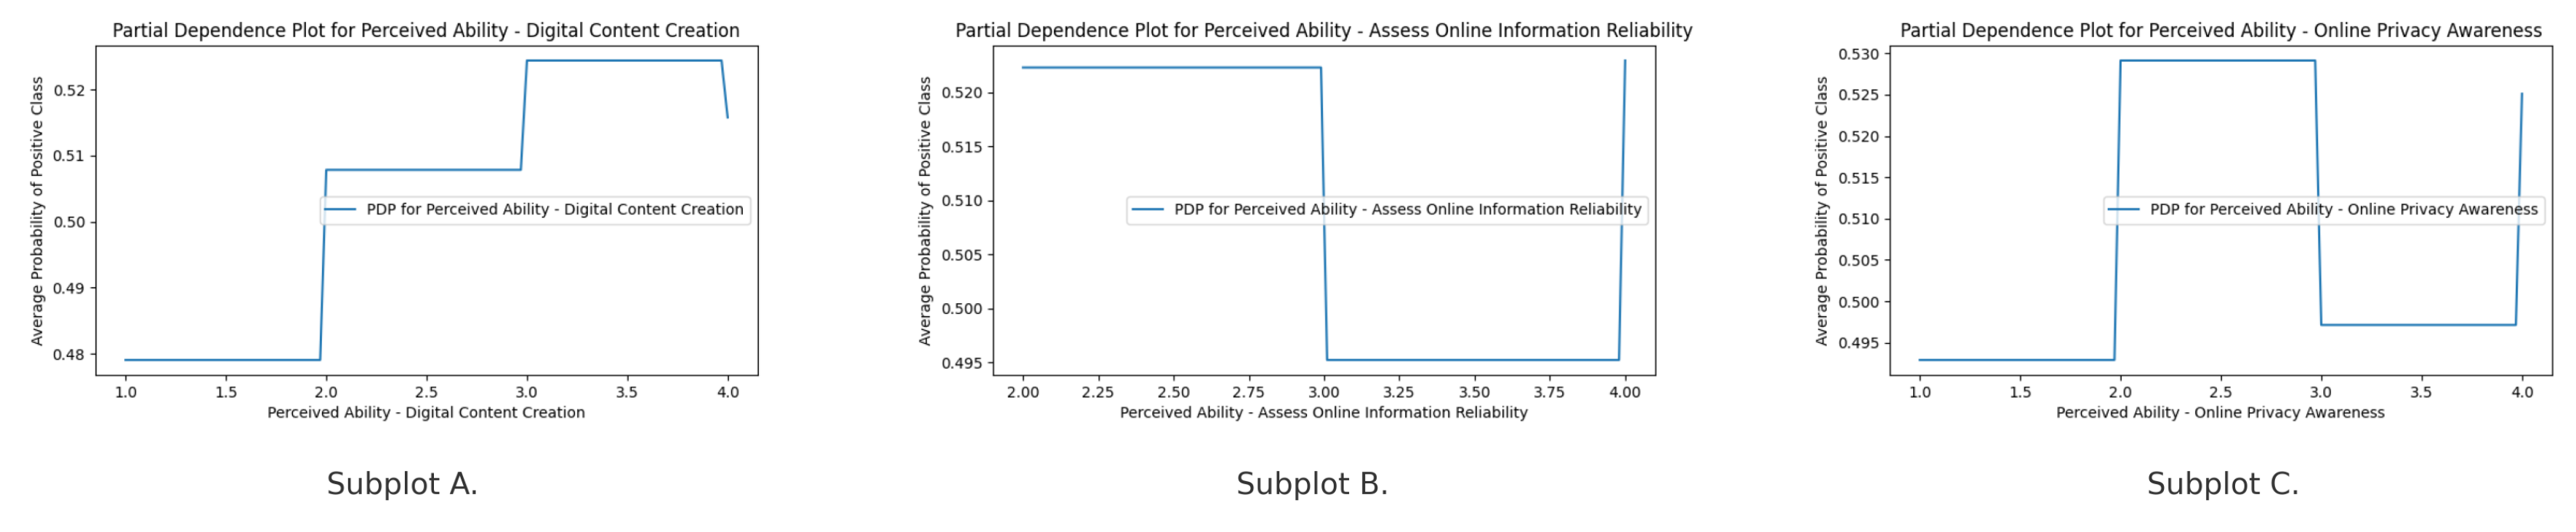
Figure 7.
PDP examples and of the "Navigation" feature from the Use Case model. Subplot A. shows "Phone Use Case – Online Shopping" with several dips but overall retaining a positive relationship; Subplot B. shows the "Phone Use Case – Gaming" with an initial thresholding jump but overall retaining a positive relationship; and Subplot C. shows the "Phone Use Case - Navigation" with a parabolic curve.
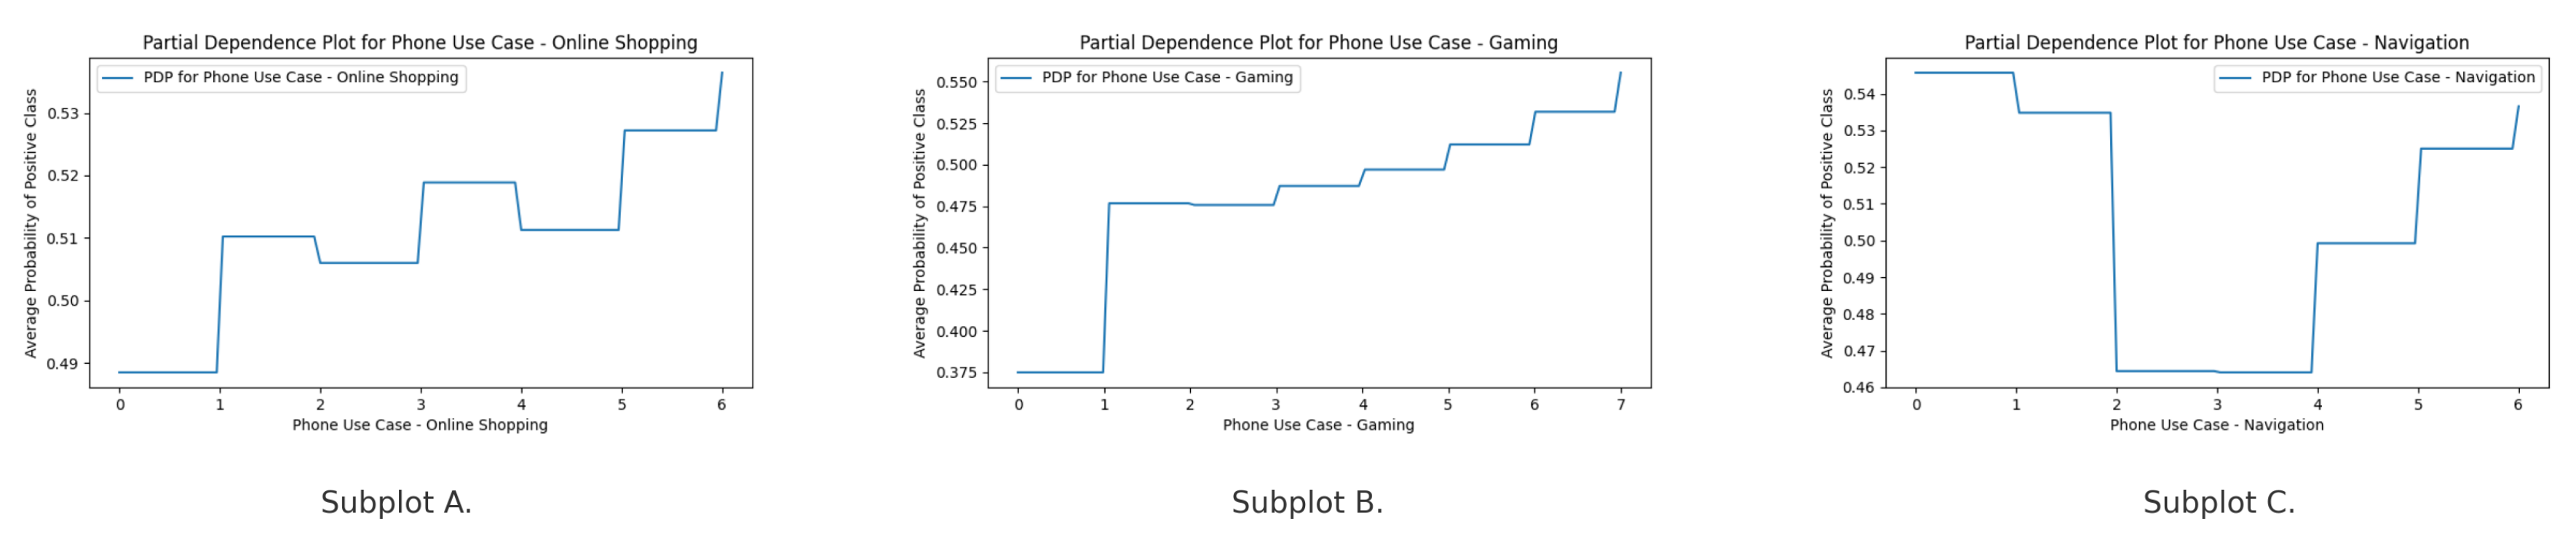
Table 1.
Significantly Different Place-Stratified Features by Urbanicity (N = 1,873)
| Construct | Variable | Metropolitan City | Medium or | Town or |
|---|---|---|---|---|
| Small City | Rural District | |||
| (n=831) | (n=714) | (n=328) | ||
| Home Environment | House (n (%))* | 167 (20.1%) | 152 (21.3%) | 90 (27.4%) |
| Smartphone Use Cases | Messenger (M (SD))*** | 5.31 (1.46) | 5.41 (1.42) | 5.02 (1.75) |
| Scheduling (M (SD))** | 2.06 (2.13) | 1.86 (2.06) | 1.62 (2.08) | |
| Health (M (SD))* | 1.76 (2.04) | 1.59 (1.91) | 1.46 (1.98) | |
| Zoom Meetings (M (SD))* | 0.73 (1.57) | 0.54 (1.33) | 0.59 (1.41) | |
| Investment (M (SD))*** | 0.86 (1.52) | 0.63 (1.28) | 0.62 (1.29) | |
| Watching Videos (M (SD))* | 5.25 (1.62) | 5.32 (1.58) | 5.02 (1.81) | |
| Listening Music (M (SD))*** | 4.51 (1.97) | 4.48 (2.04) | 4.03 (2.35) | |
| Adult Content (M (SD))*** | 0.50 (1.15) | 0.33 (0.94) | 0.30 (0.94) | |
| Gambling (M (SD))*** | 0.48 (1.20) | 0.29 (0.87) | 0.32 (1.04) | |
| News (M (SD))** | 2.57 (2.21) | 2.30 (2.04) | 2.16 (2.16) | |
| Educational Web Search (M (SD))** | 4.06 (1.81) | 3.84 (1.78) | 3.64 (2.26) | |
| Navigation (M (SD))* | 2.42 (1.92) | 2.37 (1.95) | 2.12 (2.00) | |
| Short Form YouTube (n (%))** | 443 (53.3%) | 315 (44.1%) | 162 (49.4%) | |
| TikTok (n (%))* | 145 (17.4%) | 165 (23.1%) | 68 (20.7%) | |
| Mostly Food (n (%))* | 130 (15.6%) | 80 (11.2%) | 47 (14.3%) | |
| Perceived Digital Competence & Risk | Gaming Side Effects (n (%))** | 353 (42.5%) | 313 (43.8%) | 108 (32.9%) |
| Issue Engagement (M (SD))* | 2.80 (0.85) | 2.70 (0.85) | 2.81 (0.81) | |
| Content Creation (M (SD))* | 2.49 (0.98) | 2.43 (0.98) | 2.62 (0.99) | |
| Privacy Awareness (M (SD))*** | 2.66 (0.88) | 2.57 (0.86) | 2.79 (0.86) | |
| Info for School/Work (M (SD))*** | 2.89 (0.87) | 2.67 (0.94) | 2.81 (0.92) | |
| Consequences & Dependence | Low Battery Nervousness (M (SD))** | 2.71 (0.83) | 2.85 (0.86) | 2.75 (0.85) |
| Teaches Use (n (%))** | 397 (47.8%) | 284 (39.8%) | 130 (39.6%) | |
| Parental Prevention | Teaches Pros/Cons (n (%))* | 514 (61.9%) | 422 (59.1%) | 176 (53.7%) |
| Recommends Apps (n (%))*** | 396 (47.7%) | 277 (38.8%) | 152 (46.3%) | |
| Family Support (M (SD))** | 3.29 (0.69) | 3.17 (0.75) | 3.26 (0.66) | |
| Social Support | Friend Support (M (SD))* | 3.13 (0.67) | 3.07 (0.69) | 3.17 (0.68) |
| Fairness Perception (M (SD))*** | 2.93 (0.71) | 2.81 (0.75) | 3.03 (0.79) | |
| Digital Detox (n (%))** | 210 (25.3%) | 153 (21.4%) | 55 (16.8%) | |
| Self-Regulation | Designated Placement (n (%))* | 286 (34.4%) | 200 (28.0%) | 105 (32.0%) |
| Work Mode (n (%))* | 414 (49.8%) | 316 (44.3%) | 136 (41.5%) |
Note. Values are means (SD) or counts (percentage). One-way ANOVA used for continuous; chi-square for categorical. Significance: *p < 0.05, **p < 0.01, ***p < 0.001.
Table 2.
Performance metrics across the four exemplar AI/ML models for smartphone overdependence
| Model Name/Construct | Shorthand | Algorithm | AUC | Mean Val Loss | Test Loss | Num Features |
|---|---|---|---|---|---|---|
| +Smartphone Use Cases | M4 | RF | 0.81 | 0.58 | 0.55 | 59 |
| Smartphone Consequences & Dependence | Smart CD | LightGBM | 0.89 | 0.50 | 0.42 | 7 |
| Perceived Digital Competence & Risk | Perceived DCR | XGB | 0.84 | 0.52 | 0.49 | 34 |
| Smartphone Use Cases | Use Case | XGB | 0.80 | 0.59 | 0.54 | 48 |
Note: We compare AUC (area under the receiver operating characteristic curve), mean validation loss, test loss, and number of features across models. Algorithms used are Random Forest (RF), Light Gradient-Boosting Machine (LightGBM), and Extreme Gradient Boosting (XGBoost).
Table 3.
AUCs stratified by urbanicity
| Model | National AUC | Place-Stratified AUC | ||
|---|---|---|---|---|
| Metropolitan City | Medium or Small City | Town or Rural District | ||
| M4 (+Smartphone Use Cases) | 0.81 | 0.87 | 0.75 | 0.80 |
| Smart CD Construct | 0.89 | 0.91 | 0.87 | 0.87 |
| Perceived DCR Construct | 0.84 | 0.85 | 0.83 | 0.83 |
| Use Case Construct | 0.80 | 0.88 | 0.70 | 0.79 |
Note: The place-stratified AUCs of the M4 (+Smartphone Use Cases) nested model, the Smartphone Consequences & Dependence (Smart CD) construct-based model, the Perceived Digital Competence & Risk (Perceived DCR) construct-based model, and the Smartphone Use Cases (Use Case) construct-based model are presented.
Disclaimer/Publisher’s Note: The statements, opinions and data contained in all publications are solely those of the individual author(s) and contributor(s) and not of MDPI and/or the editor(s). MDPI and/or the editor(s) disclaim responsibility for any injury to people or property resulting from any ideas, methods, instructions or products referred to in the content. |
© 2025 by the authors. Licensee MDPI, Basel, Switzerland. This article is an open access article distributed under the terms and conditions of the Creative Commons Attribution (CC BY) license (http://creativecommons.org/licenses/by/4.0/).
Copyright: This open access article is published under a Creative Commons CC BY 4.0 license, which permit the free download, distribution, and reuse, provided that the author and preprint are cited in any reuse.


