
Submitted:
30 July 2025
Posted:
31 July 2025
You are already at the latest version
Abstract
Although epidemiological studies have suggested associations between infections and Parkinson’s disease (PD), only few have explored the relationship between upper respiratory tract infections (URIs) and PD, apart from coronavirus disease 2019 (COVID-19). This study investigated whether a history of URI was associated with PD diagnosis in Korean individuals aged ≥40 years using data from the Korean National Health Insurance Service National Sample Cohort. A total of 5,844 patients with PD were identified and matched with 23,376 control participants at a 1:4 ratio based on age, sex, income, and geographical region. Multiple logistic regression models were used to estimate the association between URI history and PD, adjusting for smoking status, alcohol consumption, obesity, blood pressure, fasting blood glucose, total cholesterol, and comorbidity scores. Individuals with URI history within 1 year (≥1, ≥2, or ≥3 episodes) had significantly lower odds of PD diagnosis than matched controls (adjusted odds ratio [aOR]: 0.93, 95% confidence interval [CI]: 0.88–0.97, aOR: 0.91, 95% CI: 0.87–0.96 and aOR: 0.92, 95% CI: 0.87–0.98, respectively). No significant association was observed for URI history within 2 years. These findings suggest a potential inverse relationship between recent URI and PD development, warranting further investigation into underlying mechanisms.
Keywords:
infection
; neurodegenerative disease
; neuroinflammation
; Parkinson’s disease
; pathogenesis
; upper respiratory tract infection
1. Introduction
Parkinson’s disease (PD) is a slowly progressive neurodegenerative disorder caused by the loss of dopaminergic neurons in the midbrain and the accumulation of misfolded alpha-synuclein aggregates, known as Lewy bodies, in various brain regions. It typically presents with motor symptoms, such as resting tremor, rigidity, bradykinesia, and postural instability. Non-motor symptoms, arising from dysfunction across multiple neurotransmitter systems in both central and peripheral nervous systems [1], include psychiatric and autonomic disturbances, cognitive impairment, sleep disorders, olfactory dysfunction, and pain [2,3,4]. PD affects approximately 7.5 million people globally, with a prevalence that increases markedly with age [5]. Despite extensive research, the precise etiology and pathogenesis of neuronal degeneration in PD have not yet been fully elucidated.
Upper respiratory tract infections (URIs) are among the most common human illnesses that encompass a broad range of conditions affecting the nasal cavity, sinuses, pharynx, larynx, and large airways [6]. Most acute URIs are viral in origin, primarily due to rhinoviruses, though they may occasionally lead to bacterial complications or spread to adjacent organs [7]. The primary symptoms of URIs are usually mild and include nasal congestion, rhinorrhea, sneezing, sore throat, cough, malaise, fatigue, and low-grade fever. URIs occur globally and annually, with some progressing to more severe manifestations that require hospitalization [8]. Antiviral agents are currently approved only for select pathogens, such as influenza viruses, whereas antibiotic therapy is generally reserved for bacterial complications, such as acute otitis media and sinusitis.
The current understanding of PD pathogenesis implicates several overlapping mechanisms, including aberrant protein handling, oxidative stress, mitochondrial dysfunction, excitotoxicity, and programmed cell death (apoptosis) [9]. Increasing evidence also suggests that neuroinflammatory mechanisms are critically involved in the cascade leading to neuronal degeneration. In both human patients with PD and corresponding animal models, sustained inflammatory responses, T-cell infiltration, and glial cell activation have been consistently observed and are thought to contribute substantially in the degeneration of dopaminergic neurons [10,11].
In this context, both bacterial and viral infections have been identified as potential environmental risk factors for PD, potentially through their capacity to induce chronic microglial activation and inflammation [12]. A wide range of bacterial species, including Helicobacter pylori, Escherichia coli, Proteus mirabilis, Mycobacterium tuberculosis, Porphyromonas gingivalis, Clostridium difficile, and Chlamydia pneumoniae, which cause infections in the lungs, skin, and gastrointestinal tract, have been associated with the onset and, to a lesser extent, progression of PD [13,14,15,16]. Similarly, several viruses have been implicated in PD development, including influenza virus, coxsackievirus, Japanese encephalitis virus, West Nile Equine Encephalitic virus (WEEV), herpesviruses, hepatitis C virus (HCV), human immunodeficiency virus (HIV), and SARS-CoV-2 [17,18,19].
However, compared to better-studied pathogens, such as influenza, relatively few studies have investigated the association between PD and URIs caused by other viral or bacterial agents [20,21,22,23]. In this study, we examined whether individuals with a history of multiple URIs were at an increased risk for subsequent PD, as compared with the general population.
2. Methods
2.1. Ethics
This study was approved by the Ethics Committee of Hallym University (2019-10-023). The requirement for written informed consent was approved by the Institutional Review Board. All analyses were conducted in accordance with the relevant guidelines and regulations of the Ethics Committee of Hallym University.
2.2. Study Design and Population
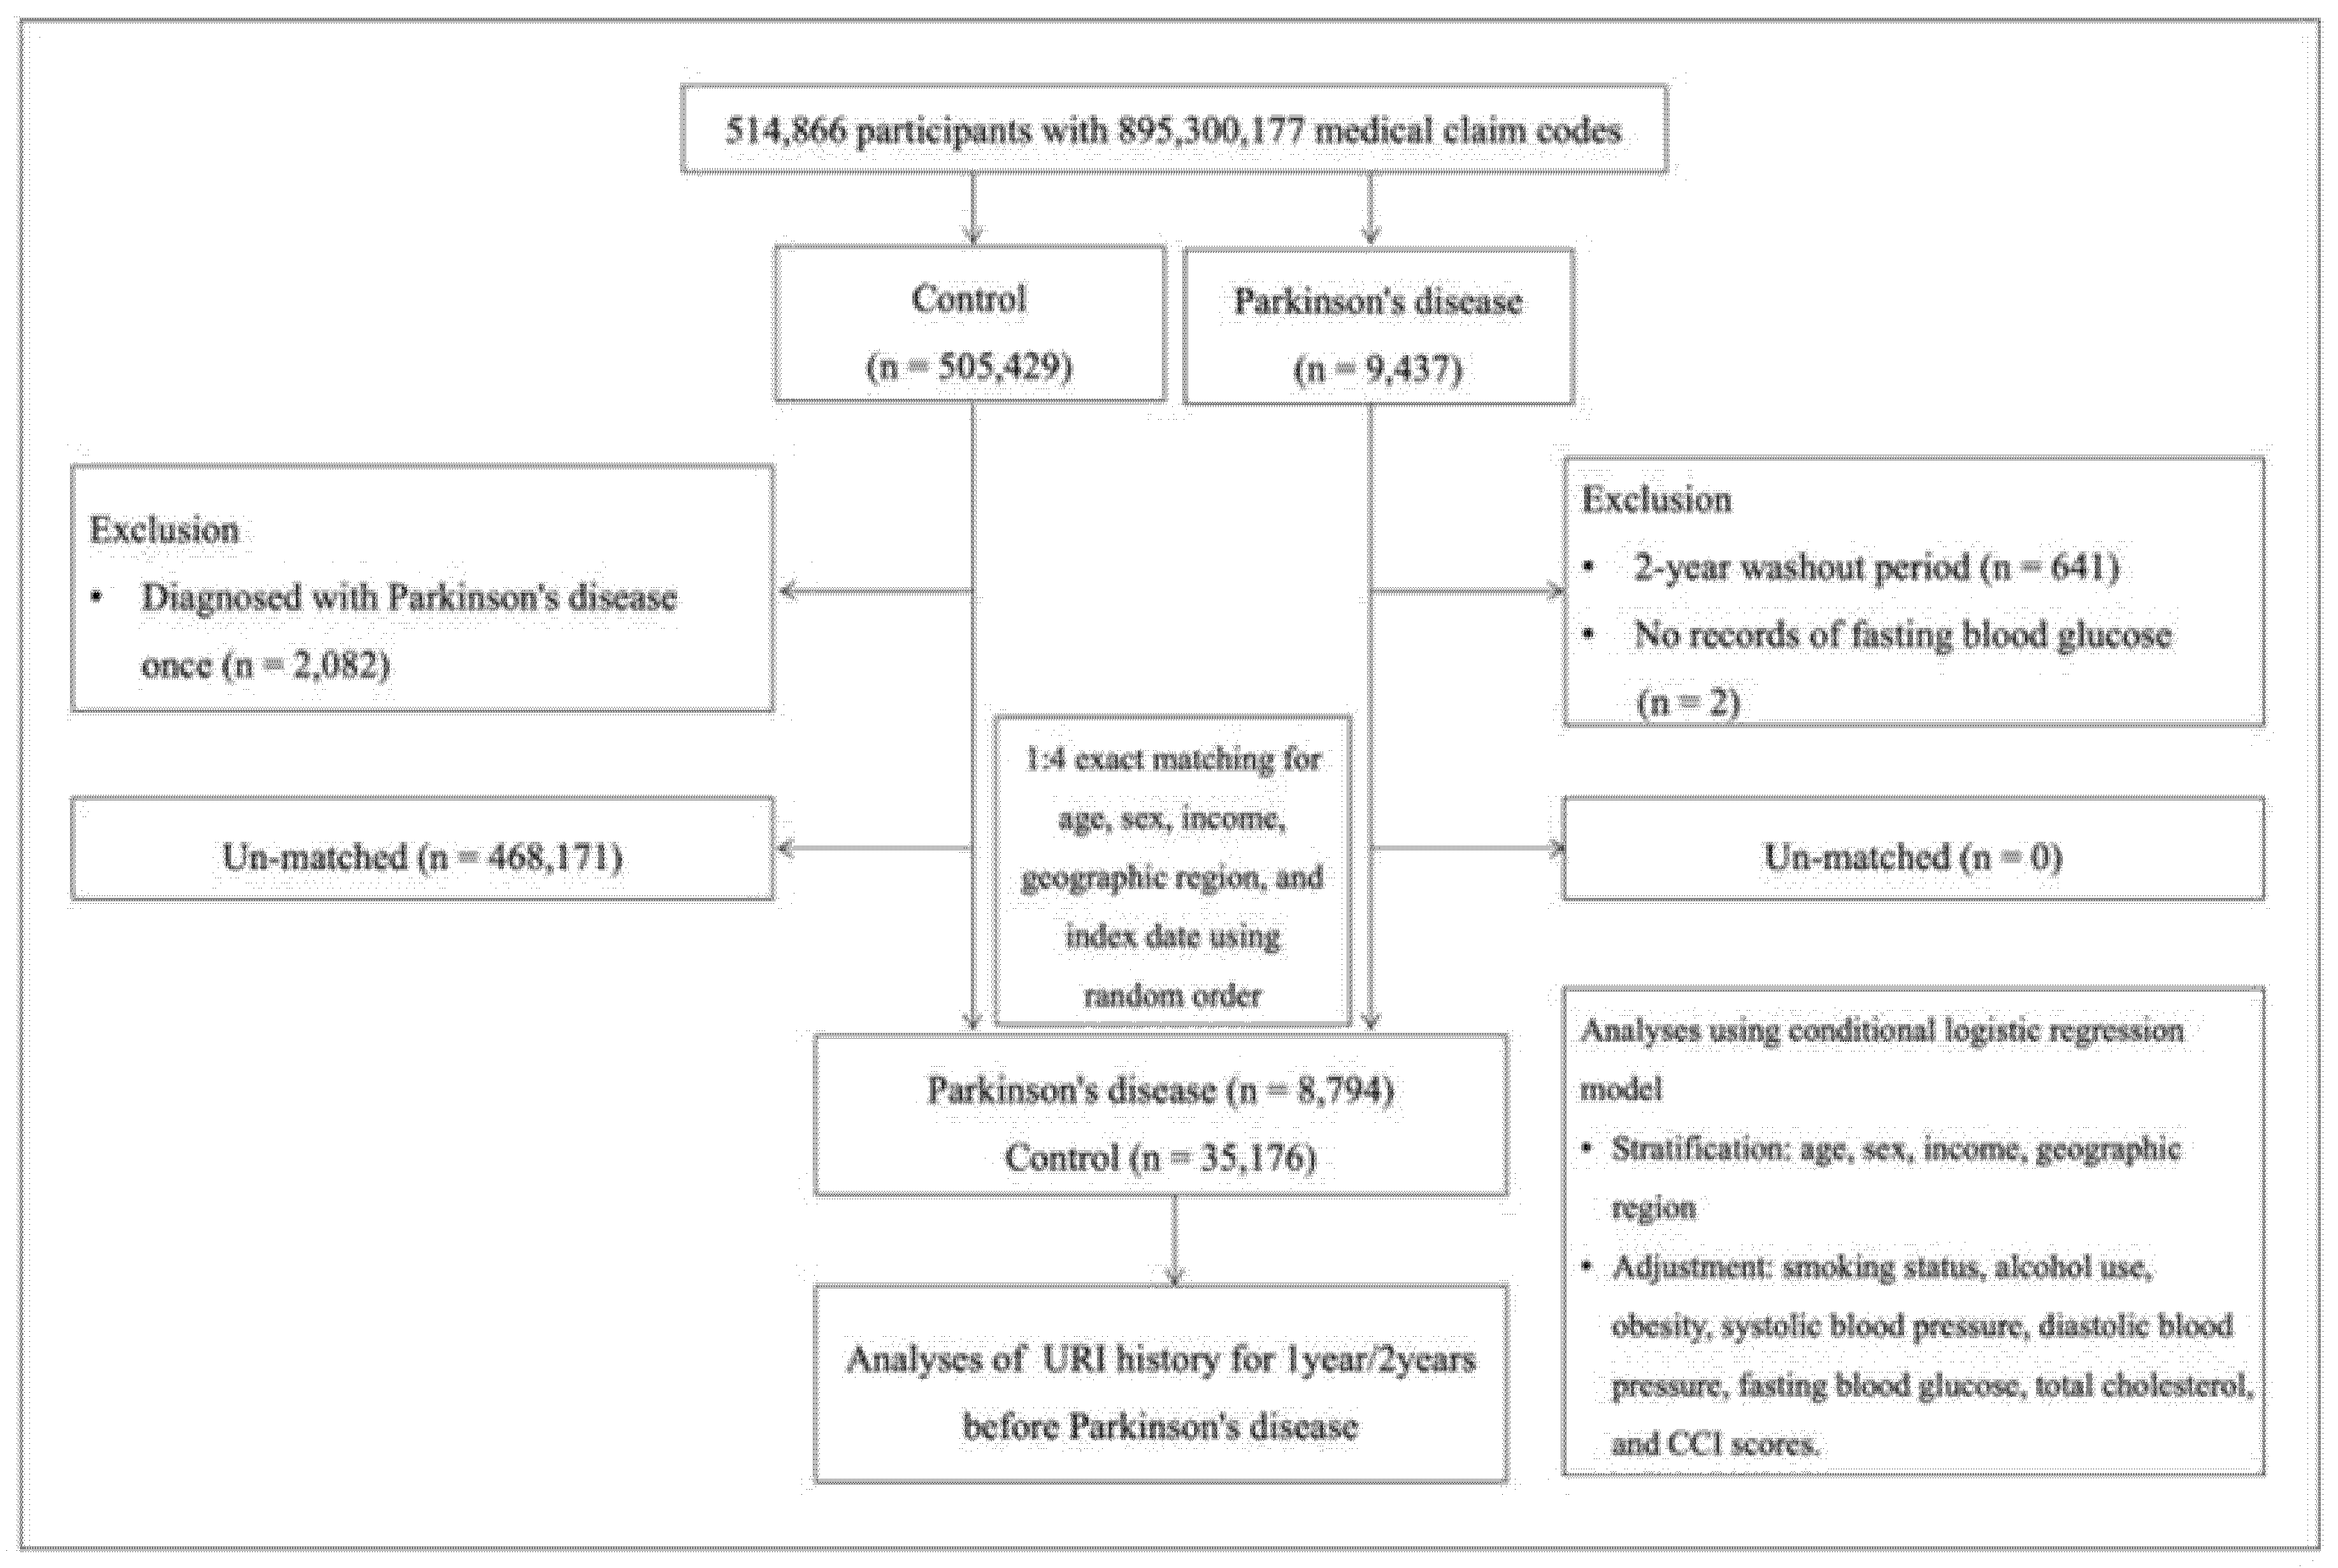
We conducted a retrospective cohort study using data from the Korean National Health Insurance Service-Health Screening Cohort, covering the period from January 1, 2002, to December 31, 2019. The study population included newly diagnosed patients with PD and matched controls. Among the 514,866 participants with 895,300,177 medical claim codes, individuals diagnosed with PD more than twice during the study period were classified into the PD group (n = 9,437); the remaining participants were assigned to the control group (n = 505,429).
To exclude potential pre-existing PD cases, participants diagnosed with PD in 2002–2003 (n = 641) and those without fasting blood glucose data (n = 2) were excluded from the PD group. In the control group, participants with a single PD diagnosis were excluded (n = 2,082).
To reduce selection bias and maximize the control sample, each the patient with PD was matched to four control participants based on age, sex, income, and geographical region. Controls were randomly sorted and selected in order. The index date for each patient with PD was defined as the date of first PD diagnosis, and the same index date was assigned to their matched controls. A total of 8,794 participants in the PD group and 35,176 participants in the control group were included in the final analysis (Fig. 1).
Figure 1.
Flowchart illustrating the participant selection process. Among the 514,866 participants, 8,794 participants with Parkinson’s disease were matched with 35,176 control participants based on age, sex, income, and geographic region.
Figure 1.
Flowchart illustrating the participant selection process. Among the 514,866 participants, 8,794 participants with Parkinson’s disease were matched with 35,176 control participants based on age, sex, income, and geographic region.
2.3. Exposure
URIs were defined using specific ICD-10 codes: J00 (acute nasopharyngitis), and all codes from J02 (acute pharyngitis) to J069 (acute upper respiratory tract infection) [24]. Individuals with at least one registered diagnosis of URI during the study period were considered to have a history of URI.
2.4. Outcome
PD was defined using ICD-10 code G20 (Parkinson’s disease). To improve diagnostic accuracy, only individuals with at least two separate clinic visits for PD were included.
2.5. Covariates
Potential confounding variables were selected based on previous literature and included demographic factors (age, sex, geographical region, and income) and comorbidities (smoking status, alcohol use, obesity, systolic (SBP) and diastolic blood pressure (DBP), fasting blood glucose, and total cholesterol). The Charlson Comorbidity Index (CCI), which is indicative of the multimorbidity burden using 17 comorbidities, was used as a continuous variable to quantify multimorbidity (0 [no comorbidities] to 29 [multiple comorbidities]).
Age was categorized into 10 groups in 5-year intervals starting from age 40. Income was stratified into five levels—from the lowest income as class 1 to the highest income as class 5. Geographical regions were classified as urban (e.g., Seoul, Busan, Daegu, Incheon, Gwangju, Daejeon, and Ulsan) or rural (e.g., Gyeonggi, Gangwon, Chungcheongbuk, Chungcheongnam, Jeollabuk, Jeollanam, Gyeongsangbuk, Gyeongsangnam, and Jeju). Smoking status was categorized as nonsmoker, a past smoker, or current smoker. Alcohol intake was recorded as <1 time/week or ≥1 time/week. Obesity was assessed using body mass index (BMI, kg/m2) and categorized using Asia-Pacific criteria from the Western Pacific Regional Office (WPRO) 2000: <18.5 (underweight), 18.5–22.9 (normal), 23–24.9 (overweight), 25–29.9 (obese I), and ≥30 (obese II). SBP (mmHg), DBP (mmHg), fasting blood glucose (mg/dL), and total cholesterol (mg/dL) were also measured.
2.6. Statistical Analyses
Standardized differences were used to compare baseline characteristics between the PD and control groups. Conditional logistic regression was used to estimate odds ratios (ORs) and 95% confidence intervals (CIs) for the association between URI and PD, adjusting for matched variables (age, sex, income, and geographical region).
Model 1 was adjusted for smoking status, alcohol use, obesity, and CCI scores. Model 2 was further adjusted for SBP, DBP, fasting blood glucose, and total cholesterol (Table 2). URI history was categorized as ≥1, ≥2, or ≥3 events within the previous year and ≥1 event within the previous 2 years. Subgroup analyses were conducted across all covariates (Table 2, Table 3, Table 4 and Table 5).
All statistical analyses were performed using SAS version 9.4 (SAS Institute Inc., Cary, NC, USA). A two-tailed P value <0.05 was considered statistically significant.
3. Results
The proportions of participants in the PD and control groups were well balanced across age, sex, income, and geographical region, as ensured by the matching process (all standardized differences = 0.00, Table 1). Compared to controls, participants with PD were more likely to be nonsmokers, consume less alcohol, and have higher DBP, fasting glucose levels, and CCI scores (Table 1).
The mean number of URIs within 1 year was 1.72 in the PD group and 1.67 in the control group. Within 2 years, the means were 3.5 and 3.35, respectively. These differences were statistically significant (P <0.05 for both comparisons, Table 1).
A significant inverse association was observed between URI history within 1 year before the index date and the subsequent diagnosis of PD. Specifically, participants with ≥1 URI had an adjusted OR of 0.93 (95% CI: 0.88–0.97, Table 2); those with ≥2 URIs had an OR of 0.91 (95% CI: 0.87–0.96, Table 3); and those with ≥3 URIs had an OR of 0.92 (95% CI: 0.87–0.98, Table 4). We also noted that participants who experienced ≥1, ≥2 or ≥3 URI histories were consistently associated with decreased PD occurrence even after various stratifications (Table 2, Table 3 and Table 4).

Table 2.
Crude and adjusted odds ratios for the association between ≥1 event of URI history within 1 year and PD.
Table 2.
Crude and adjusted odds ratios for the association between ≥1 event of URI history within 1 year and PD.
| Characteristics | No. of PD |
No. of Control |
Odds Ratios for PD (95% Confidence Interval) | ||||||
|---|---|---|---|---|---|---|---|---|---|
| (exposure/total, %) | (exposure/total, %) |
Crude† | P-value | Model 1†‡ | P-value | Model 2†§ | P-value | ||
| Total (n = 43,970) | |||||||||
| No URI | 4,706/8,794 (53.5%) | 18,170/35,176 (51.7%) | 1 | 1 | 1 | ||||
| ≥1 URI | 4,088/8,794 (46.5%) | 17,006/35,176 (48.4%) | 0.93 (0.89-0.97) |
0.002* |
0.92 (0.88-0.96) |
0.001* |
0.93 (0.88-0.97) |
0.001* |
|
| Age <65 years old (n = 8,380) | |||||||||
| No URI | 948/1,676 (56.6%) | 3,665/6,704 (54.7%) | 1 | 1 | 1 | ||||
| ≥1 URI | 728/1,676 (43.4%) | 3,039/6,704 (45.3%) | 0.93 (0.83-1.03) |
0.163 |
0.93 (0.88-0.98) |
0.005* |
0.90 (0.80-1.00) |
0.059 |
|
| Age ≥65 years old (n = 35,590) | |||||||||
| No URI | 3,758/7,118 (52.8%) | 14,505/28,472 (50.9%) | 1 | 1 | 1 | ||||
| ≥1 URI | 3,360/7,118 (47.2%) | 13,967/28,472 (49.1%) | 0.93 (0.88-0.98) |
0.005* |
0.94 (0.89-0.99) |
0.014* |
0.93 (0.88-0.98) |
0.009* |
|
| Men (n = 21,020) | |||||||||
| No URI | 2,308/4,204 (54.9%) | 9,215/16,816 (54.8%) | 1 | 1 | 1 | ||||
| ≥1 URI | 1,896/4,204 (45.1%) | 7,601/16,816 (45.2%) | 1.00 (0.93-1.07) |
0.906 |
1.00 (0.94-1.08) |
0.905 |
0.99 (0.92-1.06) |
0.722 |
|
| Women (n = 22,950) | |||||||||
| No URI | 2,398/4,590 (52.2%) | 8,955/18,360 (48.8%) | 1 | 1 | 1 | ||||
| ≥1 URI | 2,192/4,590 (47.8%) | 9,405/18,360 (51.2%) | 0.87 (0.82-0.93) |
<0.001* |
0.88 (0.82-0.94) |
<0.001* |
0.88 (0.82-0.94) |
<0.001* |
|
| Low income (n = 18,740) | |||||||||
| No URI | 2,044/3,748 (54.5%) | 7,757/14,992 (51.7%) | 1 | 1 | 1 | ||||
| ≥1 URI | 1,704/3,748 (45.5%) | 7,235/14,992 (48.3%) | 0.89 (0.83-0.96) |
0.002* |
0.90 (0.84-0.97) |
0.005* |
0.88 (0.82-0.95) |
0.001* |
|
| High income (n = 25,230) | |||||||||
| No URI | 2,662/5,046 (52.8%) | 10,413/20,184 (51.6%) | 1 | 1 | 1 | ||||
| ≥1 URI | 2,384/5,046 (47.3%) | 9,771/20,184 (48.4%) | 0.95 (0.90-1.02) |
0.139 |
0.96 (0.90-1.02) |
0.213 |
0.95 (0.90-1.02) |
0.148 |
|
| Urban residents (n = 16,630) | |||||||||
| No URI | 1,864/3,326 (56.0%) | 1,864/3,326 (56.0%) | 1 | 1 | 1 | ||||
| ≥1 URI | 1,462/3,326 (44.0%) | 1,462/3,326 (44.0%) | 0.88 (0.82-0.95) |
0.001* |
0.89 (0.82-0.96) |
0.002* |
0.88 (0.81-0.95) |
0.001* |
|
| Rural residents (n = 27,340) | |||||||||
| No URI | 2,842/5,468 (52.0%) | 11,132/21,872 (50.9%) | 1 | 1 | 1 | ||||
| ≥1 URI | 2,626/5,468 (48.0%) | 10,740/21,872 (49.1%) | 0.96 (0.90-1.02) |
0.154 |
0.97 (0.91-1.02) |
0.251 |
0.95 (0.90-1.01) |
0.122 |
|
| Underweight (n = 1,601) | |||||||||
| No URI | 179/318 (56.3%) |
720/1,283 (56.1%) | 1 | 1 | 1 | ||||
| ≥1 URI | 139/318 (43.7%) |
563/1,283 (43.9%) | 0.99 (0.78-1.27) |
0.956 |
1.02 (0.79-1.31) |
0.871 |
0.98 (0.76-1.26) |
0.876 |
|
| Normal weight (n = 15,619) | |||||||||
| No URI | 1,659/3,098 (53.6%) | 6,563/12,521 (52.4%) | 1 | 1 | 1 | ||||
| ≥1 URI | 1,439/3,098 (46.5%) | 5,958/12,521 (47.6%) | 0.96 (0.88-1.03) |
0.258 |
0.96 (0.89-1.04) |
0.357 |
0.96 (0.88-1.04) |
0.264 |
|
| Overweight (n = 11,597) | |||||||||
| No URI | 1,235/2,308 (53.5%) | 4,718/9,289 (50.8%) | 1 | 1 | 1 | ||||
| ≥1 URI | 1,073/2,308 (46.5%) | 4,571/9,289 (49.2%) | 0.90 (0.82-0.98) |
0.019* |
0.90 (0.82-0.99) |
0.025* |
0.91 (0.84-0.99) |
0.022* |
|
| Obese (n = 15,153) | |||||||||
| No URI | 1,633/3,070 (53.2%) | 6,169/12,083 (51.1%) | 1 | 1 | 1 | ||||
| ≥1 URI | 1,437/3,070 (46.8%) | 5,914/12,083 (48.9%) | 0.92 (0.85-0.99) |
0.034* |
0.92 (0.85-1.00) |
0.049* |
0.91 (0.84-0.99) |
0.022* |
|
| Nonsmokers (n = 32,653) | |||||||||
| No URI | 3,585/6,765 (53.0%) | 13,021/25,888 (50.3%) | 1 | 1 | 1 | ||||
| ≥1 URI | 3,180/6,765 (47.0%) | 12,867/25,888 (49.7%) | 0.90 (0.85-0.95) |
<0.001* |
0.91 (0.86-0.96) |
<0.001* |
0.91 (0.86-0.96) |
<0.001* |
|
| Past and current smokers (n = 11,317) | |||||||||
| No URI | 1,121/2,029 (55.3%) | 5,149/9,288 (55.4%) | 1 | 1 | 1 | ||||
| ≥1 URI | 908/2,029 (44.8%) | 4,139/9,288 (44.6%) | 1.01 (0.91-1.11) |
0.877 |
1.01 (0.92-1.12) |
0.784 |
0.99 (0.89-1.09) |
0.765 |
|
| Alcohol use <1 time a week (n = 29,538) | |||||||||
| No URI | 3,288/6,243 (52.7%) | 11,775/23,295 (50.6%) | 1 | 1 | 1 | ||||
| ≥1 URI | 2,955/6,243 (47.3%) | 11,520/23,295 (49.5%) | 0.92 (0.87-0.97) |
0.003* |
0.93 (0.88-0.98) |
0.011* |
0.92 (0.87-0.98) |
0.005* |
|
| Alcohol use ≥1 time a week (n = 14,432) | |||||||||
| No URI | 1,418/2,551 (55.6%) | 6,395/11,881 (53.8%) | 1 | 1 | 1 | ||||
| ≥1 URI | 1,133/2,551 (44.4%) | 5,486/11,881 (46.2%) | 0.93 (0.85-1.02) |
0.105 |
0.93 (0.85-1.02) |
0.105 |
0.93 (0.85-1.01) |
0.090 |
|
| SBP <140 mmHg and DBP <90 mmHg (n = 30,119) | |||||||||
| No URI | 2,937/5,669 (51.8%) | 12,343/24,450 (50.5%) | 1 | 1 | 1 | ||||
| ≥1 URI | 2,732/5,669 (48.2%) | 12,107/24,450 (49.5%) | 0.95 (0.90-1.00) |
0.072 |
0.95 (0.90-1.01) |
0.077 |
0.93 (0.88-0.99) |
0.024* |
|
| SBP ≥140 mmHg or DBP ≥90 mmHg (n = 13,851) | |||||||||
| No URI | 1,769/3,125 (56.6%) | 5,827/10,726 (54.3%) | 1 | 1 | 1 | ||||
| ≥1 URI | 1,356/3,125 (43.4%) | 4,899/10,726 (45.7%) | 0.91 (0.84-0.99) |
0.024* |
0.93 (0.86-1.01) |
0.096 |
0.93 (0.86-1.01) |
0.074 |
|
| Fasting blood glucose <100 mg/dL (n = 24,741) | |||||||||
| No URI | 2,409/4,613 (52.2%) | 10,164/20,128 (50.5%) | 1 | 1 | 1 | ||||
| ≥1 URI | 2,204/4,613 (47.8%) | 9,964/20,128 (49.5%) | 0.93 (0.88-0.99) |
0.035* |
0.94 (0.88-1.00) |
0.043* |
0.93 (0.87-0.99) |
0.021* |
|
| Fasting blood glucose ≥100 mg/dL (n = 19,229) | |||||||||
| No URI | 2,297/4,181 (54.9%) | 8,006/15,048 (53.2%) | 1 | 1 | 1 | ||||
| ≥1 URI | 1,884/4,181 (45.1%) | 7,042/15,048 (46.8%) | 0.93 (0.87-1.00) |
0.047* |
0.93 (0.87-1.00) |
0.056 |
0.92 (0.86-0.99) |
0.024* |
|
| Total cholesterol <200mg/dL (n = 25,002) | |||||||||
| No URI | 2,765/5,169 (53.5%) | 10,264/19,833 (51.8%) | 1 | 1 | 1 | ||||
| ≥1 URI | 2,404/5,169 (46.5%) | 9,569/19,833 (48.3%) | 0.93 (0.88-0.99) |
0.026* |
0.94 (0.89-1.01) |
0.072 |
0.93 (0.88-0.99) |
0.034* |
|
| Total cholesterol ≥200mg/dL (n = 18,968) | |||||||||
| No URI | 1,941/3,625 (53.5%) | 1,941/3,625 (53.5%) | 1 | 1 | 1 | ||||
| ≥1 URI | 1,684/3,625 (46.5%) | 1,684/3,625 (46.5%) | 0.92 (0.86-0.99) |
0.029* |
0.92 (0.86-0.99) |
0.033* |
0.91 (0.85-0.98) |
0.016* |
|
| CCI scores = 0 (n = 19,476) | |||||||||
| No URI | 1,404/2,649 (53.0%) | 8,765/16,827 (52.1%) | 1 | 1 | 1 | ||||
| ≥1 URI | 1,245/2,649 (47.0%) | 8,062/16,827 (47.9%) | 0.96 (0.89-1.05) |
0.383 |
0.97 (0.90-1.06) |
0.537 |
0.97 (0.89-1.05) |
0.402 |
|
| CCI score = 1 (n = 8,897) | |||||||||
| No URI | 1,090/2,030 (53.7%) | 3,479/6,867 (50.7%) | 1 | 1 | 1 | ||||
| ≥1 URI | 940/2,030 (46.3%) | 3,388/6,867 (49.3%) | 0.89 (0.80-0.98) |
0.016* |
0.89 (0.80-0.98) |
0.022* |
0.88 (0.80-0.98) |
0.015* |
|
| CCI score ≥2 (n = 15,597) | |||||||||
| No URI | 2,212/4,115 (53.8%) | 5,926/11,482 (51.6%) | 1 | 1 | 1 | ||||
| ≥1 URI | 1,903/4,115 (46.3%) | 5,556/11,482 (48.4%) | 0.92 (0.85-0.99) |
0.018* |
0.91 (0.85-0.98) |
0.009* |
0.90 (0.84-0.97) |
0.005* |
|
CCI, Charlson Comorbidity Index; DBP, Diastolic blood pressure; PD, Parkinson’s disease; SBP, Systolic blood pressure; URI, upper respiratory tract infection. *Conditional or unconditional logistic regression analysis, significance at P <0.05. †Stratified model for age, sex, income, and geographic region. ‡Model 1 was adjusted for smoking status, alcohol use, obesity, and CCI scores. §Model 2 was adjusted for model 1 plus total cholesterol, SBP, DBP, and fasting blood glucose.
Table 3.
Crude and adjusted odds ratios for the association between ≥2 events of URI history within 1 year and PD.
Table 3.
Crude and adjusted odds ratios for the association between ≥2 events of URI history within 1 year and PD.
| Characteristics | No. of PD |
No. of Control |
Odds Ratios for PD (95% Confidence Interval) | ||||||
|---|---|---|---|---|---|---|---|---|---|
| (exposure/total, %) | (exposure/total, %) | Crude† | P-value | Model 1†‡ | P-value | Model 2†§ | P-value | ||
| Total (n = 43,970) | |||||||||
| No URI | 6,168/8,794 (70.1%) | 24,047/35,176 (68.4%) | 1 | 1 | 1 | ||||
| ≥2 URIs | 2,626/8,794 (29.9%) | 11,129/35,176 (31.6%) | 0.92 (0.87-0.97) |
0.001* |
0.91 (0.87-0.96) |
0.001* |
0.91 (0.87-0.96) |
0.001* |
|
| Age <65 years old (n = 8,380) | |||||||||
| No URI | 1,237/1,676 (73.8%) | 4,858/6,704 (72.5%) | 1 | 1 | 1 | ||||
| ≥2 URIs | 439/1,676 (26.2%) | 1,846/6,704 (27.5%) | 0.93 (0.83-1.05) |
0.270 |
0.93 (0.82-1.05) |
0.263 |
0.90 (0.79-1.02) |
0.096 |
|
| Age ≥65 years old (n = 35,590) | |||||||||
| No URI | 4,931/7,118 (69.3%) | 19,189/28,472 (67.4%) | 1 | 1 | 1 | ||||
| ≥2 URIs | 2,187/7,118 (30.7%) | 9,283/28,472 (32.6%) | 0.92 (0.87-0.97) | 0.002* | 0.92 (0.87-0.98) | 0.005* | 0.92 (0.87-0.97) | 0.003* | |
| Men (n = 21,020) | |||||||||
| No URI | 3,011/4,204 (71.6%) | 11,980/16,816 (71.2%) | 1 | 1 | 1 | ||||
| ≥2 URIs | 1,193/4,204 (28.4%) | 4,836/16,816 (28.8%) | 0.98 (0.91-1.06) |
0.626 |
0.99 (0.92-1.07) |
0.770 |
0.97 (0.90-1.05) |
0.413 |
|
| Women (n = 22,950) | |||||||||
| No URI | 3,157/4,590 (68.8%) | 12,067/18,360 (65.7%) | 1 | 1 | 1 | ||||
| ≥2 URIs | 1,433/4,590 (31.2%) | 6,293/18,360 (34.3%) | 0.87 (0.81-0.93) |
<0.001* |
0.88 (0.82-0.94) |
<0.001* |
0.87 (0.81-0.94) |
<0.001* |
|
| Low income (n = 18,740) | |||||||||
| No URI | 2,653/3,748 (70.8%) | 10,245/14,992 (68.3%) | 1 | 1 | 1 | ||||
| ≥2 URIs | 1,095/3,748 (29.2%) | 4,747/14,992 (31.7%) | 0.89 (0.82-0.96) |
0.004* |
0.89 (0.83-0.97) |
0.006* |
0.87 (0.81-0.95) |
0.001* |
|
| High income (n = 25,230) | |||||||||
| No URI | 3,515/5,046 (69.7%) | 13,802/20,184 (68.4%) | 1 | 1 | 1 | ||||
| ≥2 URIs | 1,531/5,046 (30.3%) | 6,382/20,184 (31.6%) | 0.94 (0.88-1.01) |
0.080 |
0.95 (0.89-1.01) |
0.120 |
0.94 (0.88-1.01) |
0.087 |
|
| Urban residents (n = 16,630) | |||||||||
| No URI | 2,380/3,326 (71.6%) | 9,219/13,304 (69.3%) | 1 | 1 | 1 | ||||
| ≥2 URIs | 946/3,326 (28.4%) | 4,085/13,304 (30.7%) | 0.90 (0.82-0.98) |
0.011* |
0.90 (0.83-0.98) |
0.016* |
0.89 (0.82-0.97) |
0.008* |
|
| Rural residents (n = 27,340) | |||||||||
| No URI | 3,788/5,468 (69.3%) | 14,828/21,872 (67.8%) | 1 | 1 | 1 | ||||
| ≥2 URIs | 1,680/5,468 (30.7%) | 7,044/21,872 (32.2%) | 0.93 (0.88-1.00) |
0.036* |
0.94 (0.88-1.00) |
0.054 |
0.93 (0.87-0.99) |
0.022* |
|
| Underweight (n = 1,601) | |||||||||
| No URI | 224/318 (70.4%) |
915/1,283 (71.3%) | 1 | 1 | 1 | ||||
| ≥2 URIs | 94/318 (29.6%) |
368/1,283 (28.7%) | 1.04 (0.80-1.37) |
0.756 |
1.07 (0.82-1.41) |
0.623 |
1.04 (0.79 - 1.37) |
0.790 |
|
| Normal weight (n = 15,619) | |||||||||
| No URI | 2,193/3,098 (70.8%) | 8,702/12,521 (69.5%) | 1 | 1 | 1 | ||||
| ≥2 URIs | 905/3,098 (29.2%) | 3,819/12,521 (30.5%) | 0.94 (0.86-1.03) |
0.162 |
0.95 (0.87-1.03) |
0.219 |
0.94 (0.86 - 1.02) |
0.143 |
|
| Overweight (n = 11,597) | |||||||||
| No URI | 1,615/2,308 (70.0%) | 6,234/9,289 (67.1%) | 1 | 1 | 1 | ||||
| ≥2 URIs | 693/2,308 (30.0%) | 3,055/9,289 (32.9%) | 0.88 (0.79-0.97) |
0.009* |
0.88 (0.80-0.97) |
0.011* |
0.87 (0.79 - 0.96) |
0.006* |
|
| Obese (n = 15,153) | |||||||||
| No URI | 2,136/3,070 (69.6%) | 8,196/12,083 (67.8%) | 1 | 1 | 1 | ||||
| ≥2 URIs | 934/3,070 (30.4%) | 3,887/12,083 (32.2%) | 0.92 (0.85-1.00) |
0.064 |
0.92 (0.85-1.01) |
0.066 |
0.91 (0.84 - 0.99) |
0.036* |
|
| Nonsmokers (n = 32,653) | |||||||||
| No URI | 4,716/6,765 (69.7%) | 17,404/25,888 (67.2%) | 1 | 1 | 1 | ||||
| ≥2 URIs | 2,049/6,765 (30.3%) | 8,484/25,888 (32.8%) | 0.89 (0.84-0.94) |
<0.001* |
0.90 (0.85-0.96) |
0.001* |
0.90 (0.85-0.95) |
<0.001* |
|
| Past and current smokers (n = 11,317) | |||||||||
| No URI | 1,452/2,029 (71.6%) | 6,643/9,288 (71.5%) | 1 | 1 | 1 | ||||
| ≥2 URIs | 577/2,029 (28.4%) | 2,645/9,288 (28.5%) | 1.00 (0.90-1.11) |
0.971 |
1.00 (0.90-1.11) |
0.994 |
0.97 (0.87-1.08) |
0.567 |
|
| Alcohol use <1 time a week (n = 29,538) | |||||||||
| No URI | 4,326/6,243 (69.3%) | 15,618/23,295 (67.0%) | 1 | 1 | 1 | ||||
| ≥2 URIs | 1,917/6,243 (30.7%) | 7,677/23,295 (33.0%) | 0.90 (0.85-0.96) |
0.001* |
0.91 (0.86-0.97) |
0.002* |
0.90 (0.85-0.96) |
0.001* |
|
| Alcohol use ≥1 time a week (n = 14,432) | |||||||||
| No URI | 1,842/2,551 (72.2%) | 8,429/11,881 (71.0%) | 1 | 1 | 1 | ||||
| ≥2 URIs | 709/2,551 (27.8%) | 3,452/11,881 (29.1%) | 0.94 (0.85-1.03) |
0.202 |
0.94 (0.85-1.04) |
0.215 |
0.94 (0.85-1.03) |
0.202 |
|
| SBP <140 mmHg and DBP <90 mmHg (n = 30,119) | |||||||||
| No URI | 3,912/5,669 (69.0%) | 16,491/24,450 (67.5%) | 1 | 1 | 1 | ||||
| ≥2 URIs | 1,757/5,669 (31.0%) | 7,959/24,450 (32.6%) | 0.93 (0.87-0.99) |
0.024* |
0.93 (0.88-0.99) |
0.027* |
0.92 (0.86-0.98) |
0.007* |
|
| SBP ≥140 mmHg or DBP ≥90 mmHg (n = 13,851) | |||||||||
| No URI | 2,256/3,125 (72.2%) | 7,556/10,726 (70.5%) | 1 | 1 | 1 | ||||
| ≥2 URIs | 869/3,125 (27.8%) | 3,170/10,726 (29.6%) | 0.92 (0.84-1.00) |
0.059 |
0.93 (0.85-1.02) |
0.117 |
0.93 (0.85-1.01) |
0.092 |
|
| Fasting blood glucose <100 mg/dL (n = 24,741) | |||||||||
| No URI | 3,184/4,613 (69.0%) | 13,599/20,128 (67.6%) | 1 | 1 | 1 | ||||
| ≥2 URIs | 1,429/4,613 (31.0%) | 6,529/20,128 (32.4%) | 0.93 (0.87-1.00) |
0.056 |
0.94 (0.87-1.00) |
0.063 |
0.93 (0.86-0.99) |
0.034* |
|
| Fasting blood glucose ≥100 mg/dL (n = 19,229) | |||||||||
| No URI | 2,984/4,181 (71.4%) | 10,448/15,048 (69.4%) | 1 | 1 | 1 | ||||
| ≥2 URIs | 1,197/4,181 (28.6%) | 4,600/15,048 (30.6%) | 0.91 (0.84-0.98) |
0.016* |
0.91 (0.84-0.98) |
0.016* |
0.90 (0.83-0.97) |
0.005* |
|
| Total cholesterol <200mg/dL (n = 25,002) | |||||||||
| No URI | 3,614/5,169 (69.9%) | 13,573/19,833 (68.4%) | 1 | 1 | 1 | ||||
| ≥2 URIs | 1,555/5,169 (30.1%) | 6,260/19,833 (31.6%) | 0.93 (0.87-1.00) |
0.041* |
0.94 (0.88-1.01) |
0.092 |
0.93 (0.87-1.00) |
0.041* |
|
| Total cholesterol ≥200mg/dL (n = 18,968) | |||||||||
| No URI | 2,554/3,625 (70.5%) | 10,474/15,343 (68.3%) | 1 | 1 | 1 | ||||
| ≥2 URIs | 1,071/3,625 (29.5%) | 4,869/15,343 (31.7%) | 0.90 (0.83-0.98) |
0.011* |
0.90 (0.83-0.97) |
0.009* |
0.89 (0.82-0.96) |
0.004* |
|
| CCI scores = 0 (n = 19,476) | |||||||||
| No URI | 1,853/2,649 (70.0%) | 11,669/16,827 (69.4%) | 1 | 1 | 1 | ||||
| ≥2 URIs | 796/2,649 (30.1%) | 5,158/16,827 (30.7%) | 0.97 (0.89-1.06) |
0.532 |
0.99 (0.90-1.08) |
0.787 |
0.98 (0.9 - 1.07) |
0.664 |
|
| CCI score = 1 (n = 8,897) | |||||||||
| No URI | 1,440/2,030 (70.9%) | 4,590/6,867 (66.8%) | 1 | 1 | 1 | ||||
| ≥2 URIs | 590/2,030 (29.1%) | 2,277/6,867 (33.2%) | 0.83 (0.74-0.92) |
0.001* |
0.82 (0.74-0.92) |
0.001* |
0.82 (0.73 - 0.91) |
<0.001* |
|
| CCI score ≥2 (n = 15,597) | |||||||||
| No URI | 2,875/4,115 (69.9%) | 7,788/11,482 (67.8%) | 1 | 1 | 1 | ||||
| ≥2 URIs | 1,240/4,115 (30.1%) | 3,694/11,482 (32.2%) | 0.91 (0.84-0.98) |
0.016* |
0.90 (0.84-0.98) |
0.010* |
0.90 (0.83 - 0.97) |
0.006* |
|
CCI, Charlson Comorbidity Index; DBP, Diastolic blood pressure; PD, Parkinson’s disease; SBP, Systolic blood pressure; URI, upper respiratory tract infection. *Conditional or unconditional logistic regression analysis, significance at P <0.05. †Stratified model for age, sex, income, and geographic region. ‡Model 1 was adjusted for smoking status, alcohol use, obesity, and CCI scores. §Model 2 was adjusted for model 1 plus total cholesterol, SBP, DBP, and fasting blood glucose.
Table 4.
Crude and adjusted odds ratios for the association between ≥3 events of URI history within 1 year and PD.
Table 4.
Crude and adjusted odds ratios for the association between ≥3 events of URI history within 1 year and PD.
| Characteristics | No. of PD |
No. of Control |
Odds Ratios for PD (95% Confidence Interval) | ||||||
|---|---|---|---|---|---|---|---|---|---|
| (exposure/total, %) |
(exposure/total, %) | Crude† | P-value | Model 1†‡ | P-value | Model 2†§ | P-value | ||
| Total (n = 43,970) | |||||||||
| No URI | 7,005/8,794 (79.7%) | 27,600/35,176 (78.5%) | 1 | 1 | 1 | ||||
| ≥3 URIs | 1,789/8,794 (20.3%) | 7,576/35,176 (21.5%) | 0.93 (0.88-0.99) | 0.015* | 0.92 (0.87-0.98) | 0.006* | 0.92 (0.87-0.98) | 0.008* | |
| Age <65 years old (n = 8,380) | |||||||||
| No URI | 1,411/1,676 (84.2%) | 5,541/6,704 (82.7%) | 1 | 1 | 1 | ||||
| ≥3 URIs | 265/1,676 (15.8%) | 1,163/6,704 (17.4%) | 0.89 (0.77-1.04) |
0.135 |
0.90 (0.77-1.04) |
0.151 |
0.87 (0.75-1.01) |
0.074 |
|
| Age ≥65 years old (n = 35,590) | |||||||||
| No URI | 5,594/7,118 (78.6%) | 22,059/28,472 (77.5%) | 1 | 1 | 1 | ||||
| ≥3 URIs | 1,524/7,118 (21.4%) | 6,413/28,472 (22.5%) | 0.94 (0.88-1.00) |
0.044* |
0.94 (0.88-1.00) |
0.067 |
0.94 (0.88-1.00) |
0.041* |
|
| Men (n = 21,020) | |||||||||
| No URI | 3,399/4,204 (80.9%) | 13,544/16,816 (80.5%) | 1 | 1 | 1 | ||||
| ≥3 URIs | 805/4,204 (19.2%) | 3,272/16,816 (19.5%) | 0.98 (0.90-1.07) |
0.651 |
0.99 (0.91-1.08) |
0.853 |
0.98 (0.89-1.06) |
0.581 |
|
| Women (n = 22,950) | |||||||||
| No URI | 3,606/4,590 (78.6%) | 14,056/18,360 (76.6%) | 1 |
1 |
1 |
||||
| ≥3 URIs | 984/4,590 (21.4%) | 4,304/18,360 (23.4%) | 0.89 (0.82-0.96) |
0.004* |
0.89 (0.83-0.97) |
0.005* |
0.89 (0.82-0.96) |
0.003* |
|
| Low income (n = 18,740) | |||||||||
| No URI | 2,997/3,748 (80.0%) | 11,766/14,992 (78.5%) | 1 | 1 | 1 | ||||
| ≥3 URIs | 751/3,748 (20.0%) | 3,226/14,992 (21.5%) | 0.91 (0.84-1.00) |
0.047* |
0.92 (0.84-1.01) |
0.072 |
0.91 (0.83-0.99) |
0.032* |
|
| High income (n = 25,230) | |||||||||
| No URI | 4,008/5,046 (79.4%) | 15,834/20,184 (78.5%) | 1 |
1 |
1 |
||||
| ≥3 URIs | 1,038/5,046 (20.6%) | 4,350/20,184 (21.6%) | 0.94 (0.87-1.02) |
0.128 |
0.95 (0.88-1.02) |
0.168 |
0.94 (0.87-1.01) |
0.104 |
|
| Urban residents (n = 16,630) | |||||||||
| No URI | 2,677/3,326 (80.5%) | 10,464/13,304 (78.7%) | 1 |
1 |
1 |
||||
| ≥3 URIs | 649/3,326 (19.5%) | 2,840/13,304 (21.4%) | 0.89 (0.81-0.98) |
0.020* |
0.90 (0.82-0.99) |
0.031* |
0.89 (0.80-0.98) |
0.014* |
|
| Rural residents (n = 27,340) | |||||||||
| No URI | 4,328/5,468 (79.2%) | 17,136/21,872 (78.4%) | 1 |
1 |
1 |
||||
| ≥3 URIs | 1,140/5,468 (20.9%) | 4,736/21,872 (21.7%) | 0.95 (0.89-1.02) |
0.195 |
0.96 (0.89-1.03) |
0.252 |
0.95 (0.88-1.02) |
0.148 |
|
| Underweight (n = 1,601) | |||||||||
| No URI | 255/318 (80.2%) |
1,042/1,283 (81.2%) | 1 |
1 |
1 |
||||
| ≥3 URIs | 63/318 (19.8%) |
241/1,283 (18.8%) | 1.07 (0.78-1.46) |
0.676 |
1.09 (0.80-1.49) |
0.585 |
1.05 (0.77 - 1.44) |
0.769 |
|
| Normal weight (n = 15,619) | |||||||||
| No URI | 2,496/3,098 (80.6%) | 9,934/12,521 (79.3%) | 1 |
1 |
1 |
||||
| ≥3 URIs | 602/3,098 (19.4%) | 2,587/12,521 (20.7%) | 0.93 (0.84-1.02) |
0.129 |
0.94 (0.85-1.03) |
0.189 |
0.92 (0.84 - 1.02) |
0.122 |
|
| Overweight (n = 11,597) | |||||||||
| No URI | 1,833/2,308 (79.4%) | 7,155/9,289 (77.0%) | 1 |
1 |
1 |
||||
| ≥3 URIs | 475/2,308 (20.6%) | 2,134/9,289 (23.0%) | 0.87 (0.78-0.97) |
0.014* |
0.87 (0.78-0.97) |
0.015* |
0.86 (0.77 - 0.96) |
0.010* |
|
| Obese (n = 15,153) | |||||||||
| No URI | 2,421/3,070 (78.9%) | 9,469/12,083 (78.4%) | 1 |
1 |
1 |
||||
| ≥3 URIs | 649/3,070 (21.1%) | 2,614/12,083 (21.6%) | 0.97 (0.88-1.07) |
0.554 |
0.97 (0.88-1.07) |
0.550 |
0.96 (0.87 - 1.06) |
0.143 |
|
| Nonsmokers (n = 32,653) | |||||||||
| No URI | 5,355/6,765 (79.2%) | 20,129/25,888 (77.8%) | 1 |
1 |
1 |
||||
| ≥3 URIs | 1,410/6,765 (20.8%) | 5,759/25,888 (22.3%) | 0.92 (0.86-0.98) |
0.013* |
0.93 (0.87-0.99) |
0.032* |
0.92 (0.86-0.99) |
0.017* |
|
| Past and current smokers (n = 11,317) | |||||||||
| No URI | 1,650/2,029 (81.3%) | 7,471/9,288 (80.4%) | 1 |
1 |
1 |
||||
| ≥3 URIs | 379/2,029 (18.7%) | 1,817/9,288 (19.6%) | 0.94 (0.84-1.07) |
0.362 |
0.95 (0.84-1.07) |
0.397 |
0.92 (0.81-1.05) |
0.208 |
|
| Alcohol use <1 time a week (n = 29,538) | |||||||||
| No URI | 4,945/6,243 (79.2%) | 18,091/23,295 (77.7%) | 1 |
1 |
1 |
||||
| ≥3 URIs | 1,298/6,243 (20.8%) | 5,204/23,295 (22.3%) | 0.91 (0.85-0.98) |
0.009* |
0.92 (0.86-0.99) |
0.022* |
0.91 (0.85-0.98) |
0.008* |
|
| Alcohol use ≥1 time a week (n = 14,432) | |||||||||
| No URI | 2,060/2,551 (80.8%) | 9,509/11,881 (80.0%) | 1 |
1 |
1 |
||||
| ≥3 URIs | 491/2,551 (19.3%) | 2,372/11,881 (20.0%) | 0.96 (0.86-1.06) |
0.410 |
0.96 (0.86-1.07) |
0.419 |
0.95 (0.85-1.06) |
0.389 |
|
| SBP <140 mmHg and DBP <90 mmHg (n = 30,119) | |||||||||
| No URI | 4,471/5,669 (78.9%) | 19,009/24,450 (77.8%) | 1 |
1 |
1 |
||||
| ≥3 URIs | 1,198/5,669 (21.1%) | 5,441/24,450 (22.3%) | 0.94 (0.87-1.00) |
0.067 |
0.94 (0.87-1.00) |
0.065 |
0.92 (0.86-0.99) |
0.021* |
|
| SBP ≥140 mmHg or DBP ≥90 mmHg (n = 13,851) | |||||||||
| No URI | 2,534/3,125 (81.1%) | 8,591/10,726 (80.1%) | 1 |
1 |
1 |
||||
| ≥3 URIs | 591/3,125 (18.9%) | 2,135/10,726 (19.9%) | 0.94 (0.85-1.04) |
0.219 |
0.96 (0.87-1.06) |
0.426 |
0.95 (0.86-1.06) |
0.351 |
|
| Fasting blood glucose <100 mg/dL (n = 24,741) | |||||||||
| No URI | 3,655/4,613 (79.2%) | 15,699/20,128 (78.0%) | 1 |
1 |
1 |
||||
| ≥3 URIs | 958/4,613 (20.8%) | 4,429/20,128 (22.0%) | 0.93 (0.86-1.01) |
0.066 |
0.93 (0.86-1.01) |
0.083 |
0.92 (0.85-1.00) |
0.048* |
|
| Fasting blood glucose ≥100 mg/dL (n = 19,229) | |||||||||
| No URI | 3,350/4,181 (80.1%) | 11,901/15,048 (79.1%) | 1 |
1 |
1 |
||||
| ≥3 URIs | 831/4,181 (19.9%) | 3,147/15,048 (20.9%) | 0.94 (0.86-1.02) |
0.143 |
0.94 (0.86-1.02) |
0.152 |
0.92 (0.85-1.01) |
0.067 |
|
| Total cholesterol <200mg/dL (n = 25,002) | |||||||||
| No URI | 4,130/5,169 (79.9%) | 15,669/19,833 (79.0%) | 1 |
1 |
1 |
||||
| ≥3 URIs | 1,039/5,169 (20.1%) | 4,164/19,833 (21.0%) | 0.95 (0.88-1.02) |
0.158 |
0.96 (0.89-1.04) |
0.295 |
0.95 (0.88-1.02) |
0.158 |
|
| Total cholesterol ≥200mg/dL (n = 18,968) | |||||||||
| No URI | 2,875/3,625 (79.3%) | 11,931/15,343 (77.8%) | 1 |
1 |
1 |
||||
| ≥3 URIs | 750/3,625 (20.7%) | 3,412/15,343 (22.2%) | 0.91 (0.83-1.00) |
0.043* |
0.90 (0.83-0.99) |
0.028* |
0.90 (0.82-0.98) |
0.018* |
|
| CCI scores = 0 (n = 19,476) | |||||||||
| No URI | 2,104/2,649 (79.4%) | 13,397/16,827 (79.6%) | 1 |
1 |
1 |
||||
| ≥3 URIs | 2,104/2,649 (79.4%) | 13,397/16,827 (79.6%) | 1.01 (0.91-1.12) |
0.821 |
1.03 (0.93-1.14) |
0.524 |
1.03 (0.93 - 1.14) |
0.587 |
|
| CCI score = 1 (n = 8,897) | |||||||||
| No URI | 1,616/2,030 (79.6%) | 5,307/6,867 (77.3%) | 1 |
1 |
1 |
||||
| ≥3 URIs | 414/2,030 (20.4%) | 1,560/6,867 (22.7%) | 0.87 (0.77-0.98) |
0.027* |
0.88 (0.78-0.99) |
0.034* |
0.87 (0.77 - 0.99) |
0.029* |
|
| CCI score ≥2 (n = 15,597) | |||||||||
| No URI | 3,285/4,115 (79.8%) | 8,896/11,482 (77.5%) | 1 | 1 | 1 | ||||
| ≥3 URIs | 830/4,115 (20.2%) | 2,586/11,482 (22.5%) | 0.87 (0.80-0.95) |
0.002* |
0.86 (0.79-0.94) |
0.001* |
0.86 (0.78 - 0.94) |
0.001* |
|
CCI, Charlson Comorbidity Index; DBP, Diastolic blood pressure; PD, Parkinson’s disease; SBP, Systolic blood pressure; URI, upper respiratory tract infection. *Conditional or unconditional logistic regression analysis, significance at P <0.05. †Stratified model for age, sex, income, and geographic region. ‡Model 1 was adjusted for smoking status, alcohol use, obesity, and CCI scores. §Model 2 was adjusted for model 1 plus total cholesterol, SBP, DBP, and fasting blood glucose.
However, no significant association was observed in certain subgroups, including participants aged <65 years, males, individuals with high income, rural residents, those who were underweight or of normal weight, past and current smokers, those consuming alcohol ≥1 per week, those with high blood pressure, and individuals with a CCI score of 0. The remaining subgroups highlighted an inverse relationship between URI and PD development (Table 2, Table 3 and Table 4).
When URI history within 2 years before the index date was examined, the inverse association between URI and PD was no longer statistically significant (adjusted OR: 0.97, 95% CI: 0.92–1.01, Table 5). Subgroup analysis also revealed no significant associations, except among participants with a CCI core of 1 (Table 5).
Table 5.
Crude and adjusted odds ratios for the association between ≥1 event of URI history within 2 years and PD.
Table 5.
Crude and adjusted odds ratios for the association between ≥1 event of URI history within 2 years and PD.
| Characteristics | No. of PD |
No. of Control |
Odds Ratios for PD (95% Confidence Interval) | ||||||
|---|---|---|---|---|---|---|---|---|---|
| (exposure/total, %) |
(exposure/total, %) |
Crude† | P-value | Model 1†‡ | P-value | Model 2†§ | P-value | ||
| Total (n = 43,970) | |||||||||
| No URI | 3,149/8,794 (35.8%) | 12,374/35,176 (35.2%) | 1 | 1 | 1 | ||||
| ≥1 URI | 5,645/8,794 (64.2%) | 22,802/35,176 (64.8%) | 0.97 (0.93-1.02) |
0.267 |
0.96 (0.91-1.01) |
0.093 |
0.97 (0.92-1.01) |
0.162 |
|
| Age <65 years old (n = 8,380) | |||||||||
| No URI | 643/1,676 (38.4%) | 2,556/6,704 (38.1%) | 1 | 1 | 1 | ||||
| ≥1 URI | 1,033/1,676 (61.6%) | 4,148/6,704 (61.9%) | 0.99 (0.89-1.11) |
0.857 |
1.00 (0.89-1.11) |
0.945 |
0.96 (0.85-1.07) |
0.449 |
|
| Age ≥65 years old (n = 35,590) | |||||||||
| No URI | 2,506/7,118 (35.2%) | 9,818/28,472 (34.5%) | 1 | 1 | 1 | ||||
| ≥1 URI | 4,612/7,118 (64.8%) | 18,654/28,472 (65.5%) | 0.97 (0.92-1.02) |
0.250 |
0.98 (0.93-1.03) |
0.425 |
0.97 (0.92-1.02) |
0.256 |
|
| Men (n = 21,020) | |||||||||
| No URI | 1,608/4,204 (38.3%) | 6,475/16,816 (38.5%) | 1 | 1 | 1 | ||||
| ≥1 URI | 2,596/4,204 (61.8%) | 10,341/16,816 (61.5%) | 1.01 (0.94-1.08) |
0.761 |
1.02 (0.95-1.10) |
0.526 |
1.00 (0.93-1.07) |
0.986 |
|
| Women (n = 22,950) | |||||||||
| No URI | 1,541/4,590 (33.6%) | 5,899/18,360 (32.1%) | 1 | 1 | 1 | ||||
| ≥1 URI | 3,049/4,590 (66.4%) | 12,461/18,360 (67.9%) | 0.94 (0.87-1.00) |
0.062 |
0.94 (0.88-1.01) |
0.092 |
0.94 (0.87-1.00) |
0.061 |
|
| Low income (n = 18,740) | |||||||||
| No URI | 1,373/3,748 (36.6%) | 5,362/14,992 (35.8%) | 1 | 1 | 1 | ||||
| ≥1 URI | 2,375/3,748 (63.4%) | 9,630/14,992 (64.2%) | 0.96 (0.89-1.04) |
0.321 |
0.97 (0.90-1.05) |
0.477 |
0.95 (0.88-1.02) |
0.153 |
|
| High income (n = 25,230) | |||||||||
| No URI | 1,776/5,046 (35.2%) | 7,012/20,184 (34.7%) | 1 |
1 |
1 |
||||
| ≥1 URI | 3,270/5,046 (64.8%) | 13,172/20,184 (65.3%) | 0.98 (0.92-1.05) |
0.543 |
0.99 (0.93-1.06) |
0.734 |
0.98 (0.92-1.04) |
0.488 |
|
| Urban residents (n = 16,630) | |||||||||
| No URI | 1,264/3,326 (38.0%) | 4,897/13,304 (36.8%) | 1 |
1 |
1 |
||||
| ≥1 URI | 2,062/3,326 (62.0%) | 8,407/13,304 (63.2%) | 0.95 (0.88-1.03) |
0.202 |
0.95 (0.88-1.03) |
0.235 |
0.94 (0.87-1.02) |
0.133 |
|
| Rural residents (n = 27,340) | |||||||||
| No URI | 1,885/5,468 (34.5%) | 7,477/21,872 (34.2%) | 1 |
1 |
1 |
||||
| ≥1 URI | 3,583/5,468 (65.5%) | 14,395/21,872 (65.8%) | 0.99 (0.93-1.05) |
0.688 |
1.00 (0.94-1.06) |
0.998 |
0.98 (0.92-1.05) |
0.553 |
|
| Underweight (n = 1,601) | |||||||||
| No URI | 135/318 (42.5%) |
505/1,283 (39.4%) | 1 |
1 |
1 |
||||
| ≥1 URI | 183/318 (57.6%) |
778/1,283 (60.6%) | 0.88 (0.69-1.13) |
0.314 |
0.90 (0.70-1.16) |
0.437 |
0.88 (0.68-1.13) |
0.309 |
|
| Normal weight (n = 15,619) | |||||||||
| No URI | 1,083/3,098 (35.0%) | 4,525/12,521 (36.1%) | 1 |
1 |
1 |
||||
| ≥1 URI | 2,015/3,098 (65.0%) | 7,996/12,521 (63.9%) | 1.05 (0.97-1.14) |
0.220 |
1.06 (0.98-1.15) |
0.153 |
1.05 (0.96-1.14) |
0.103 |
|
| Overweight (n = 11,597) | |||||||||
| No URI | 823/2,308 (35.7%) | 3,160/9,289 (34.0%) | 1 |
1 |
1 |
||||
| ≥1 URI | 1,485/2,308 (64.3%) | 6,129/9,289 (66.0%) | 0.93 (0.85-1.02) |
0.138 |
0.93 (0.85-1.03) |
0.166 |
0.92 (0.84-1.02) |
0.103 |
|
| Obese (n = 15,153) | |||||||||
| No URI | 1,108/3,070 (36.1%) | 4,184/12,083 (34.6%) | 1 |
1 |
1 |
||||
| ≥1 URI | 1,962/3,070 (63.9%) | 7,899/12,083 (65.4%) | 0.94 (0.86-1.02) |
0.129 |
0.94 (0.87-1.03) |
0.178 |
0.93 (0.85-1.01) |
0.077 |
|
| Nonsmokers (n = 32,653) | |||||||||
| No URI | 2,366/6,765 (35.0%) | 8,689/25,888 (33.6%) | 1 |
1 |
1 |
||||
| URI ≥ 1 | 4,399/6,765 (65.0%) | 17,199/25,888 (66.4%) | 0.94 (0.89-0.99) |
0.029* |
0.95 (0.90-1.01) |
0.086 |
0.95 (0.89-1.00) |
0.054 |
|
| Past and current smokers (n = 11,317) | |||||||||
| No URI | 783/2,029 (38.6%) | 3,685/9,288 (39.7%) | 1 |
1 |
1 |
||||
| ≥1 URI | 1,246/2,029 (61.4%) | 5,603/9,288 (60.3%) | 1.05 (0.95-1.15) |
0.367 |
1.06 (0.96-1.17) |
0.285 |
1.02 (0.92-1.13) |
0.692 |
|
| Alcohol use <1 time a week (n = 29,538) | |||||||||
| No URI | 2,190/6,243 (35.1%) | 7,914/23,295 (34.0%) | 1 |
1 |
1 |
||||
| ≥1 URI | 4,053/6,243 (64.9%) | 15,381/23,295 (66.0%) | 0.95 (0.90-1.01) |
0.102 |
0.97 (0.91-1.03) |
0.255 |
0.95 (0.90-1.01) |
0.109 |
|
| Alcohol use ≥1 time a week (n = 14,432) | |||||||||
| No URI | 959/2,551 (37.6%) | 4,460/11,881 (37.5%) | 1 |
1 |
1 |
||||
| ≥1 URI | 1,592/2,551 (62.4%) | 7,421/11,881 (62.5%) | 0.95 (0.90-1.01) |
0.109 |
1.00 (0.92-1.10) |
0.969 |
0.99 (0.90-1.08) |
0.822 |
|
| SBP <140 mmHg and DBP <90 mmHg (n = 30,119) | |||||||||
| No URI | 1,902/5,669 (33.6%) | 8,295/24,450 (33.9%) | 1 |
1 |
1 |
||||
| ≥1 URI | 3,767/5,669 (66.5%) | 16,155/24,450 (66.1%) | 1.02 (0.96-1.08) |
0.591 |
1.02 (0.96-1.08) |
0.541 |
1.00 (0.94-1.06) |
0.989 |
|
| SBP ≥140 mmHg or DBP ≥90 mmHg (n = 13,851) | |||||||||
| No URI | 1,247/3,125 (39.9%) | 4,079/10,726 (38.0%) | 1 |
1 |
1 |
||||
| ≥1 URI | 1,878/3,125 (60.1%) | 6,647/10,726 (62.0%) | 0.92 (0.85-1.00) |
0.058 |
0.95 (0.87-1.03) |
0.186 |
0.93 (0.86-1.01) |
0.094 |
|
| Fasting blood glucose <100 mg/dL (n = 24,741) | |||||||||
| No URI | 1,587/4,613 (34.4%) | 6,898/20,128 (34.3%) | 1 |
1 |
1 |
||||
| ≥1 URI | 3,026/4,613 (65.6%) | 13,230/20,128 (65.7%) | 0.99 (0.93-1.06) |
0.865 |
1.00 (0.93-1.07) |
0.961 |
0.99 (0.92-1.06) |
0.677 |
|
| Fasting blood glucose ≥100 mg/dL (n = 19,229) | |||||||||
| No URI | 1,562/4,181 (37.4%) | 5,476/15,048 (36.4%) | 1 |
1 |
1 |
||||
| ≥1 URI | 2,619/4,181 (62.6%) | 9,572/15,048 (63.6%) | 0.96 (0.89-1.03) |
0.248 |
0.96 (0.90-1.04) |
0.309 |
0.94 (0.88-1.01) |
0.101 |
|
| Total cholesterol <200mg/dL (n = 25,002) | |||||||||
| No URI | 1,861/5,169 (36.0%) | 7,019/19,833 (35.4%) | 1 |
1 |
1 |
||||
| ≥1 URI | 3,308/5,169 (64.0%) | 12,814/19,833 (64.6%) | 0.97 (0.91-1.04) |
0.411 |
0.99 (0.93-1.06) |
0.761 |
0.97 (0.91-1.04) |
0.419 |
|
| Total cholesterol ≥200mg/dL (n = 18,968) | |||||||||
| No URI | 1,288/3,625 (35.5%) | 5,355/15,343 (34.9%) | 1 |
1 |
1 |
||||
| ≥1 URI | 2,337/3,625 (64.5%) | 9,988/15,343 (65.1%) | 0.97 (0.90-1.05) |
0.474 |
0.97 (0.90-1.05) |
0.443 |
0.95 (0.88-1.03) |
0.234 |
|
| CCI scores = 0 (n = 19,476) | |||||||||
| No URI | 1,288/3,625 (35.5%) | 5,355/15,343 (34.9%) | 1 |
1 |
1 |
||||
| ≥1 URI | 2,337/3,625 (64.5%) | 9,988/15,343 (65.1%) | 1.03 (0.94-1.12) |
0.566 |
1.04 (0.95-1.13) |
0.394 |
0.96 (0.94-0.99) |
0.559 |
|
| CCI score = 1 (n = 8,897) | |||||||||
| No URI | 735/2,030 (36.2%) | 2,326/6,867 (33.9%) | 1 |
1 |
1 |
||||
| ≥1 URI | 1,295/2,030 (63.8%) | 4,541/6,867 (66.1%) | 0.90 (0.81-1.00) |
0.052 |
0.91 (0.82-1.01) |
0.075 |
0.90 (0.81 – 1.00) |
0.045* |
|
| CCI score ≥ 2 (n = 15,597) | |||||||||
| No URI | 1,477/4,115 (35.9%) | 3,999/11,482 (34.8%) | 1 |
1 |
1 |
||||
| ≥1 URI | 2,638/4,115 (64.1%) | 7,483/11,482 (65.2%) | 0.95 (0.89-1.03) |
0.218 |
0.94 (0.87-1.02) |
0.124 |
0.93 (0.87-1.01) |
0.074 |
|
CCI, Charlson Comorbidity Index; DBP, Diastolic blood pressure; PD, Parkinson’s disease; SBP, Systolic blood pressure; URI, upper respiratory tract infection. *Conditional or unconditional logistic regression analysis, significance at P <0.05. †Stratified model for age, sex, income, and geographic region. ‡Model 1 was adjusted for smoking status, alcohol use, obesity, and CCI scores. §Model 2 was adjusted for model 1 plus total cholesterol, SBP, DBP, and fasting blood glucose.
4. Discussion
This study identified a modest inverse association between the occurrence of URI within 1 year and the subsequent diagnosis of PD. However, when the observation period was extended to 2 years, the association was no longer statistically significant. These findings were generally consistent across stratified analyses, suggesting that the observed relationship is relatively robust.
Historical evidence linking infections to PD dates back to the H1N1 influenza pandemic in 1918, which was associated with cases of encephalitis lethargica and post-encephalic parkinsonism [25]. Since then, both epidemiological and experimental studies have indicated that systemic inflammation caused by infections may play a role in PD etiology and progression [26]. Elevated levels of systemic inflammatory markers, such as interleukin-1b, interleukin-6, tumor necrosis factor-alpha, and C-reactive protein, have been reported in both patients with PD and animal models [26,27].
A cohort study evaluating antibody titers against common pathogens found higher seropositivity to cytomegalovirus (CMV), Epstein-Barr virus (EBV), herpesvirus, Borrelia burgdorferi, Chlamydophila pneumoniae, and Helicobacter pylori in patients with PD than in healthy controls [28]. A recent meta-analysis of cohort and case-control studies further confirmed that infections with H. pylori, C. pneumoniae, HCV, or Malassezia yeast were positively associated with the risk of PD [5].
Furthermore, infections with other pathogenic microorganisms, including hepatitis B virus, influenza virus, measles, varicella-zoster virus, pertussis, scarlet fever, rheumatic fever, and diphtheria have also been increasingly recognized as a possible risk factor for PD [22,29]. In contrast, certain infections may not increase PD risk and may even exert a protective effect. A population-based case-control study reported an inverse association between PD and childhood infections, such as chickenpox, mumps, and measles [22].
Whereas most prior studies have focused on specific pathogens, such as influenza, HCV, and H. pylori, only few have examined the broader category of URI in relation to PD risk [5,23,30,31,32,33,34,35,36,37,38,39,40,41]. Additionally, although many observational studies have explored the association between early- and mid-life infections and PD development, the short-term effects of recent infections has not been well characterized. Interest in the potential short- and long-term cognitive and neurological sequelae of coronavirus disease 2019 (COVID-19) has further emphasized the importance of studying the neuroinflammatory consequences of recent viral exposure.
In this nationwide nested case-control study using physician-coded diagnoses, we found statistically significant inverse association between a history of URIs and PD diagnosis within a 1-year period. Specifically, those with ≥1, ≥2, or ≥3 episodes of URI had 7% (95% CI: 0.88–0.97), 9% (95% CI: 0.87–0.96), and 8% (95% CI: 0.87–0.98) lower odds of developing PD, respectively. However, no significant association was found when URI exposure was assessed over a 2-year window.
These findings suggest that the protective effect may not be driven by specific pathogens but rather by broader immunological mechanisms, such as systemic inflammation or treatment responses. Although secondary bacterial infections and some viral infections may necessitate antimicrobial or antiviral treatment, management of URIs is generally supportive. In outpatient settings, clinicians typically prescribe analgesics and antipyretics to alleviate symptoms resulting from local and systemic inflammatory responses. Consequently, one possible explanation for the reduced diagnosis of PD among individuals with recent URIs may involve the protective role of anti-inflammatory medications commonly used to treat such infections.
Indeed, several animal studies have reported consistent findings and described multiple mechanisms through which non-steroidal anti-inflammatory drugs (NSAIDs)—commonly prescribed for pain, fever, and inflammation—may confer neuroprotection in PD. These mechanisms include reducing dopaminergic neuronal loss by downregulating gene-1 expression, which may be associated with the suppression of microglial inactivation. NSAIDs have also been shown to attenuate nuclear factor kappa B (NF-κB) activity, enhance reactive oxygen species (ROS) scavenging, decrease superoxide anion generation, and limit the depletion of dopamine metabolites, such as 3,4-dihydroxyphenylacetic acid and homovanillic acid, which may contribute to neuroprotection [42,43,44].
Despite accumulating evidence supporting the neuroprotective potential of NSAIDs [45,46,47,48,49], findings remain inconsistent. Several animal studies have shown that COX-2 inhibitors fail to exert neuroprotective effects or reduce neuronal cell death [50]. Similarly, epidemiological studies have yielded conflicting results, reporting both decreased [50] and increased risks of PD associated with NSAID use [51]. Future studies are warranted to evaluate the neuroinflammatory and neuroprotective roles of these agents in the pathogenesis of PD.
The major strength of this study is the use of data from the Korean National Health Insurance Service, which encompasses nearly the entire Korean population. This enabled a nationwide study design with large sample size and near-complete follow-up. Moreover, as a population-based study conducted within a single country, it is likely that diagnostic coding practices were consistently applied over time. The use of prospectively recorded diagnoses for both URI and PD also minimizes the risk of selection and measurement bias that may arise in observational studies relying on retrospective data.
This study also has limitations. First, reverse causation cannot be excluded. The prodromal phase of PD may begin 10–20 years before clinical diagnosis [52]; therefore, infections occurring a few years prior to diagnosis could reflect increased susceptibility to pathogens due to the early PD pathology rather than being a causal factor. As with any observational study, residual or unmeasured confounding variables could be potential sources of bias. Nevertheless, our study adjusted for key known risk factors for PD, including age, and smoking, and further accounted for additional factors, such as alcohol use, blood pressure, BMI, cholesterol, and fasting blood glucose, which were obtained during standardized health screenings.
Although the clinical significance of this finding may be limited due to the small effect sizes, our study provides evidence that adults with a recent history of multiple URIs within the prior year may have a slightly lower likelihood of receiving a PD diagnosis. Further studies are needed to investigate the pathological mechanisms linking infection and its treatment to PD development.
Author Contributions
HG Choi and JH Kim: study concept and design, data acquisition and interpretation, critical revision of the manuscript. JH Wee, JH Park, MJ Kwon, HS Kang, Hoang Nguyen, IB Chang and JH Song: drafting of the figures, critical revision of the manuscript. HT Lim: data interpretation, drafting of the manuscript and figures. All author approved the final version of the manuscript.
Data Availability Statement
The data used for this study are available from the Korean National Health Insurance Sharing Service (https://nhis.or.kr) subject to their requirements and fees. For data requests for this study, please contact the corresponding author (kimjihee.ns@gmail.com).
Acknowledgments
This study was supported in part by the National Research Foundation of Korea (NRF) grant funded by the Korea government (MSIT). (No. NRF-2022R1F1A1071120).
Conflicts of Interest
The authors declare no conflict of interest.
References
- Chaudhuri, K.R. and A.H. Schapira, Non-motor symptoms of Parkinson's disease: dopaminergic pathophysiology and treatment. The Lancet Neurology, 2009. 8(5): p. 464-474. [CrossRef]
- Federico, A., et al., Screening for mild cognitive impairment in Parkinson’s disease: comparison of the Italian versions of three neuropsychological tests. Parkinson’s disease, 2015. 2015(1): p. 681976. [CrossRef]
- Varalta, V., et al., Relationship between Cognitive Performance and Motor Dysfunction in Patients with Parkinson’s Disease: A Pilot Cross-Sectional Study. BioMed Research International, 2015. 2015(1): p. 365959. [CrossRef]
- Schrag, A., A. Sauerbier, and K.R. Chaudhuri, New clinical trials for nonmotor manifestations of Parkinson's disease. Movement Disorders, 2015. 30(11): p. 1490-1504. [CrossRef]
- Wang, H., et al., Bacterial, viral, and fungal infection-related risk of Parkinson's disease: Meta-analysis of cohort and case–control studies. Brain and behavior, 2020. 10(3): p. e01549. [CrossRef]
- Jain, N., R. Lodha, and S. Kabra, Upper respiratory tract infections. The Indian Journal of Pediatrics, 2001. 68: p. 1135-1138.
- Thomas, M. and P.A. Bomar, Upper respiratory tract infection. 2018.
- Desforges, M., et al., Human coronaviruses and other respiratory viruses: underestimated opportunistic pathogens of the central nervous system? viruses, 2019. 12(1): p. 14. [CrossRef]
- Hirsch, E.C. and S. Hunot, Neuroinflammation in Parkinson's disease: a target for neuroprotection? The Lancet Neurology, 2009. 8(4): p. 382-397. [CrossRef]
- Hirsch, E.C., S. Vyas, and S. Hunot, Neuroinflammation in Parkinson's disease. Parkinsonism & related disorders, 2012. 18: p. S210-S212.
- Lv, Y., et al., Phytic acid attenuates inflammatory responses and the levels of NF-κB and p-ERK in MPTP-induced Parkinson’s disease model of mice. Neuroscience letters, 2015. 597: p. 132-136. [CrossRef]
- Alam, Q., et al., Inflammatory process in Alzheimer’s and Parkinson's diseases: central role of cytokines. Current pharmaceutical design, 2016. 22(5): p. 541-548.
- Alby, K. and I. Nachamkin, Gastrointestinal infections. Microbiology Spectrum, 2016. 4(3): p. 10.1128/microbiolspec. dmih2-0005-2015. [CrossRef]
- Cookson, M.R., Mechanisms of mutant LRRK2 neurodegeneration. Leucine-Rich Repeat Kinase 2 (LRRK2), 2017: p. 227-239. [CrossRef]
- Deusenbery, C., Y. Wang, and A. Shukla, Recent innovations in bacterial infection detection and treatment. ACS Infectious Diseases, 2021. 7(4): p. 695-720. [CrossRef]
- Cannon, T. and S. Gruenheid, Microbes and Parkinson’s disease: from associations to mechanisms. Trends in Microbiology, 2022. 30(8): p. 749-760. [CrossRef]
- SCHULTZ, D.R., J.S. BARTHAL, and C. GARRETT, Western equine encephalitis with rapid onset of parkinsonism. Neurology, 1977. 27(11): p. 1095-1095. [CrossRef]
- Jang, H., et al., Viral parkinsonism. Biochimica et Biophysica Acta (BBA)-Molecular Basis of Disease, 2009. 1792(7): p. 714-721.
- Sulzer, D., et al., COVID-19 and possible links with Parkinson’s disease and parkinsonism: from bench to bedside. npj Parkinson's Disease, 2020. 6(1): p. 18. [CrossRef]
- Martyn, C. and C. Osmond, Parkinson's disease and the environment in early life. Journal of the neurological sciences, 1995. 132(2): p. 201-206. [CrossRef]
- Vlajinac, H., et al., Infections as a risk factor for Parkinson's disease: a case–control study. International Journal of Neuroscience, 2013. 123(5): p. 329-332. [CrossRef]
- Harris, M.A., et al., Association of Parkinson's disease with infections and occupational exposure to possible vectors. Movement disorders, 2012. 27(9): p. 1111-1117. [CrossRef]
- Cocoros, N.M., et al., Long-term risk of Parkinson disease following influenza and other infections. JAMA neurology, 2021. 78(12): p. 1461-1470. [CrossRef]
- Choi, H.G., et al., Tonsillectomy does not reduce upper respiratory infections: a national cohort study. PLoS One, 2016. 11(12): p. e0169264. [CrossRef]
- Von Economo, C., Encephalitis Lethargica, Us Sequelae and Treatment. Southern Medical Journal, 1931. 24(11): p. 1014.
- Ferrari, C.C. and R. Tarelli, Parkinson′ s disease and systemic inflammation. Parkinson’s disease, 2011. 2011(1): p. 436813. [CrossRef]
- Sawada, H., et al., Subclinical elevation of plasma C-reactive protein and illusions/hallucinations in subjects with Parkinson’s disease: case–control study. PLoS One, 2014. 9(1): p. e85886. [CrossRef]
- Bu, X.-L., et al., The association between infectious burden and Parkinson's disease: a case-control study. Parkinsonism & related disorders, 2015. 21(8): p. 877-881. [CrossRef]
- SASCO, A.J. and R.S. PAFFENBARGER JR, Measles infection and Parkinson's disease. American journal of epidemiology, 1985. 122(6): p. 1017-1031. [CrossRef]
- Levine, K.S., et al., Virus exposure and neurodegenerative disease risk across national biobanks. Neuron, 2023. 111(7): p. 1086-1093. e2. [CrossRef]
- Dardiotis, E., et al., H. pylori and Parkinson’s disease: Meta-analyses including clinical severity. Clinical neurology and neurosurgery, 2018. 175: p. 16-24. [CrossRef]
- Poskanzer, D.C. and R.S. Schwab, Cohort analysis of Parkinson's syndrome: evidence for a single etiology related to subclinical infection about 1920. Journal of chronic diseases, 1963. 16(9): p. 961-973. [CrossRef]
- Dourmashkin, R., What caused the 1918–30 epidemic of encephalitis lethargica? Journal of the Royal Society of Medicine, 1997. 90(9): p. 515-520.
- Bond, M., et al., A role for pathogen risk factors and autoimmunity in encephalitis lethargica? Progress in Neuro-Psychopharmacology and Biological Psychiatry, 2021. 109: p. 110276. [CrossRef]
- Estupinan, D., S. Nathoo, and M.S. Okun, The demise of Poskanzer and Schwab’s influenza theory on the pathogenesis of Parkinson’s disease. Parkinson’s Disease, 2013. 2013(1): p. 167843. [CrossRef]
- Smeyne, R.J., et al., Infection and risk of Parkinson’s disease. Journal of Parkinson's disease, 2021. 11(1): p. 31-43.
- Wu, W.Y., et al., Hepatitis C virus infection: a risk factor for P arkinson's disease. Journal of viral hepatitis, 2015. 22(10): p. 784-791.
- Abushouk, A.I., et al., Evidence for association between hepatitis C virus and Parkinson’s disease. Neurological Sciences, 2017. 38(11): p. 1913-1920. [CrossRef]
- McGee, D.J., X.-H. Lu, and E.A. Disbrow, Stomaching the possibility of a pathogenic role for Helicobacter pylori in Parkinson’s disease. Journal of Parkinson's disease, 2018. 8(3): p. 367-374. [CrossRef]
- Lotz, S.K., et al., Microbial infections are a risk factor for neurodegenerative diseases. Frontiers in Cellular Neuroscience, 2021. 15: p. 691136. [CrossRef]
- Limphaibool, N., et al., Infectious etiologies of parkinsonism: pathomechanisms and clinical implications. Frontiers in Neurology, 2019. 10: p. 652. [CrossRef]
- Maharaj, D., et al., Acetaminophen and aspirin inhibit superoxide anion generation and lipid peroxidation, and protect against 1-methyl-4-phenyl pyridinium-induced dopaminergic neurotoxicity in rats. Neurochemistry international, 2004. 44(5): p. 355-360. [CrossRef]
- Aubin, N., et al., Aspirin and salicylate protect against MPTP-induced dopamine depletion in mice. Journal of neurochemistry, 1998. 71(4): p. 1635-1642. [CrossRef]
- Sairam, K., et al., Non-steroidal anti-inflammatory drug sodium salicylate, but not diclofenac or celecoxib, protects against 1-methyl-4-phenyl pyridinium-induced dopaminergic neurotoxicity in rats. Brain Research, 2003. 966(2): p. 245-252. [CrossRef]
- Teismann, P. and B. Ferger, Inhibition of the cyclooxygenase isoenzymes COX-1 and COX-2 provide neuroprotection in the MPTP-mouse model of Parkinson's disease. Synapse, 2001. 39(2): p. 167-174.
- Teismann, P., et al., Cyclooxygenase-2 is instrumental in Parkinson's disease neurodegeneration. Proceedings of the National Academy of Sciences, 2003. 100(9): p. 5473-5478. [CrossRef]
- Sánchez-Pernaute, R., et al., Selective COX-2 inhibition prevents progressive dopamine neuron degeneration in a rat model of Parkinson's disease. Journal of neuroinflammation, 2004. 1: p. 1-11. [CrossRef]
- Wang, T., et al., MPP+-induced COX-2 activation and subsequent dopaminergic neurodegeneration. The FASEB journal, 2005. 19(9): p. 1134-1136. [CrossRef]
- Carrasco, E., D. Casper, and P. Werner, Dopaminergic neurotoxicity by 6-OHDA and MPP+: differential requirement for neuronal cyclooxygenase activity. Journal of neuroscience research, 2005. 81(1): p. 121-131. [CrossRef]
- Przybyłkowski, A., et al., Cyclooxygenases mRNA and protein expression in striata in the experimental mouse model of Parkinson's disease induced by 1-methyl-4-phenyl-1, 2, 3, 6-tetrahydropyridine administration to mouse. Brain research, 2004. 1019(1-2): p. 144-151. [CrossRef]
- Bornebroek, M., et al., Nonsteroidal anti-inflammatory drugs and the risk of Parkinson disease. Neuroepidemiology, 2007. 28(4): p. 193-196. [CrossRef]
- Bloem, B.R., M.S. Okun, and C. Klein, Parkinson's disease. The Lancet, 2021. 397(10291): p. 2284-2303. [CrossRef]
Table 1.
General characteristics of participants.
| Characteristics | Total Participants | |||
|---|---|---|---|---|
| PD | Control | Standardized Difference | ||
| Age (years old) (n, %) | 0.00 | |||
| 40-44 | 5 (0.06) | 20 (0.06) | ||
| 45-49 | 66 (0.75) | 264 (0.75) | ||
| 50-54 | 224 (2.55) | 896 (2.55) | ||
| 55-59 | 498 (5.66) | 1,992 (5.66) | ||
| 60-64 | 883 (10.04) | 3,532 (10.04) | ||
| 65-69 | 1,347 (15.32) | 5,388 (15.32) | ||
| 70-74 | 1,950 (22.17) | 7,800 (22.17) | ||
| 75-79 | 2,122 (24.13) | 8,488 (24.13) | ||
| 80-84 | 1,293 (14.70) | 5,172 (14.70) | ||
| 85+ | 406 (4.62) | 1,624 (4.62) | ||
| Sex (n, %) | 0.00 | |||
| Male | 4,204 (47.81) | 16,816 (47.81) | ||
| Female | 4,590 (52.19) | 18,360 (52.19) | ||
| Income (n, %) | 0.00 | |||
| 1 (lowest) | 1,624 (18.47) | 6,496 (18.47) | ||
| 2 | 952 (10.83) | 3,808 (10.83) | ||
| 3 | 1,172 (13.33) | 4,688 (13.33) | ||
| 4 | 1,691 (19.23) | 6,764 (19.23) | ||
| 5 (highest) | 3,355 (38.15) | 13,420 (38.15) | ||
| Geographic region (n, %) | 0.00 | |||
| Urban | 3,326 (37.82) | 13,304 (37.82) | ||
| Rural | 5,468 (62.18) | 21,872 (62.18) | ||
| Obesity† (n, %) | 0.02 | |||
| Underweight | 318 (3.62) | 1,283 (3.65) | ||
| Normal | 3,098 (35.23) | 12,521 (35.60) | ||
| Overweight | 2,308 (26.25) | 9,289 (26.41) | ||
| Obese I | 2,772 (31.52) | 10,988 (31.24) | ||
| Obese II | 298 (3.39) | 1,095 (3.11) | ||
| Smoking status (n, %) | 0.09 | |||
| Nonsmoker | 6,765 (76.93) | 25,888 (73.60) | ||
| Past smoker | 1,200 (13.65) | 5,142 (14.62) | ||
| Current smoker | 829 (9.43) | 4,146 (11.79) | ||
| Alcohol use (n, %) | 0.10 | |||
| <1 time a week | 6,243 (70.99) | 23,295 (66.22) | ||
| ≥1 time a week | 2,551 (29.01) | 11,881 (33.78) | ||
| Systolic blood pressure (n, %) | 0.00 | |||
| <120 mmHg | 2,122 (24.13) | 8,156 (23.19) | ||
| 120-139 mmHg | 3,967 (45.11) | 17,428 (49.55) | ||
| ≥140 mmHg | 2,705 (30.76) | 9,592 (27.27) | ||
| Diastolic blood pressure (n, %) | 0.11 | |||
| <80 mmHg | 3,651 (41.52) | 16,604 (47.20) | ||
| 80-89 mmHg | 3,090 (35.14) | 12,529 (35.62) | ||
| ≥90 mmHg | 2,053 (23.35) | 6,043 (17.18) | ||
| Fasting blood glucose (n, %) | 0.11 | |||
| <100 mg/dL | 4,613 (52.46) | 20,128 (57.22) | ||
| 100-125 mg/dL | 2,918 (33.18) | 11,078 (31.49) | ||
| ≥126 mg/dL | 1,263 (14.36) | 3,970 (11.29) | ||
| Total cholesterol (n, %) | 0.05 | |||
| <200 mg/dL | 5,169 (58.78) | 19,833 (56.38) | ||
| 200-239 mg/dL | 2,501 (28.44) | 10,815 (30.75) | ||
| ≥240 mg/dL | 1,124 (12.78) | 4,528 (12.87) | ||
| CCI score (n, %) | 0.29 | |||
| 0 | 2,649 (30.12) | 16,827 (47.84) | ||
| 1 | 2,030 (23.08) | 6,867 (19.52) | ||
| ≥2 | 4,115 (46.79) | 11,482 (32.64) | ||
| The number of URIs (Mean, Standard deviation) | ||||
| within 1 year | 1.72 (3.89) | 1.67 (3.28) | 0.01 | |
| within 2 years | 3.50 (6.75) | 3.35 (5.66) | 0.02 | |
CCI, Charlson comorbidity index; PD, Parkinson’s disease; URI, upper respiratory tract infection. †Obesity (BMI, body mass index, kg/m2) was categorized as <18.5 (underweight), ≥18.5 to <23 (normal), ≥23 to <25 (overweight), ≥25 to <30 (obese I), and ≥30 (obese II).
Disclaimer/Publisher’s Note: The statements, opinions and data contained in all publications are solely those of the individual author(s) and contributor(s) and not of MDPI and/or the editor(s). MDPI and/or the editor(s) disclaim responsibility for any injury to people or property resulting from any ideas, methods, instructions or products referred to in the content. |
© 2025 by the authors. Licensee MDPI, Basel, Switzerland. This article is an open access article distributed under the terms and conditions of the Creative Commons Attribution (CC BY) license (https://creativecommons.org/licenses/by/4.0/).
Copyright: This open access article is published under a Creative Commons CC BY 4.0 license, which permit the free download, distribution, and reuse, provided that the author and preprint are cited in any reuse.


