
Submitted:
30 July 2025
Posted:
31 July 2025
You are already at the latest version
Abstract
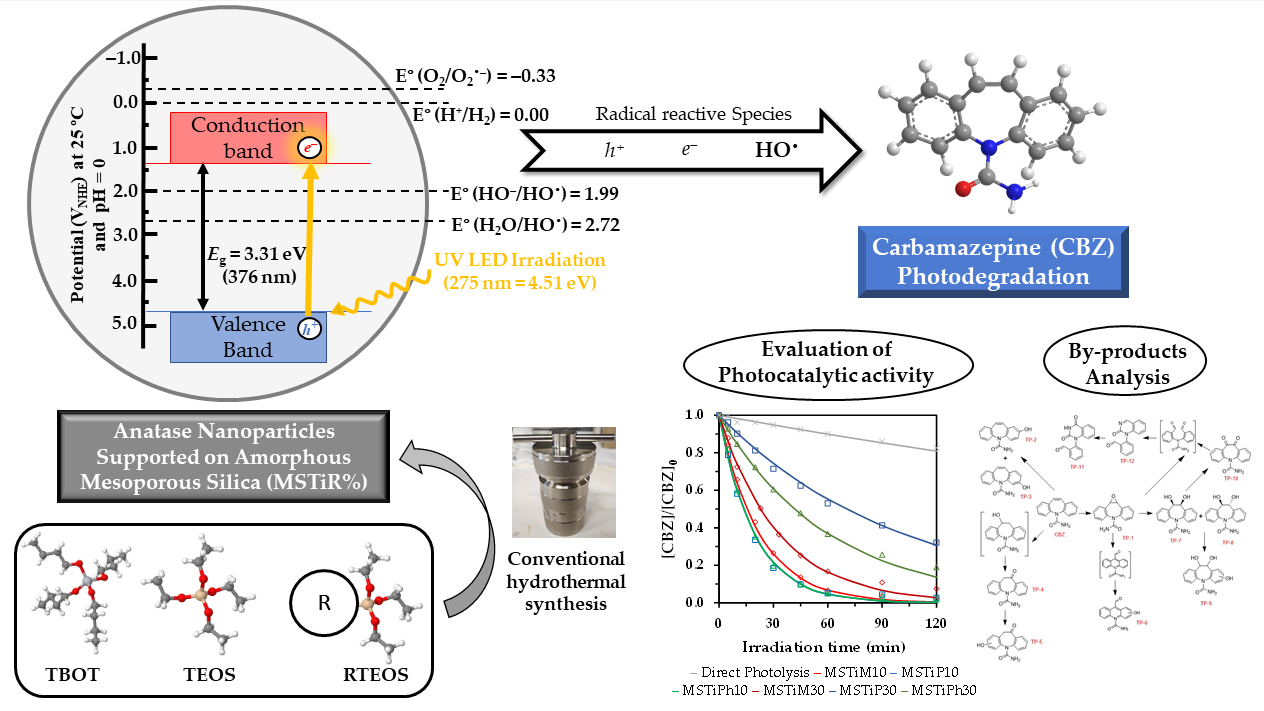
TiO2 is the most used material for the photocatalytic removal of organic pollutants in aqueous media. TiO2, specifically its anatase phase, is well-known for its great performance under UV-irradiation, high chemical stability, low-cost and non-toxicity. Nevertheless, TiO2 presents two main drawbacks: its limited absorption of the visible spectrum; and its relatively low specific surface area and pore volume. Regarding the latter, several works in the literature have addressed the issue by developing new synthesis approaches in which anatase is dispersed and supported on the surface of porous materials. In the present work, two series of materials have been prepared where anatase has been supported on mesoporous silica (MSTiR%) in situ through a hydrothermal synthesis approach, where, in addition to using tetraethoxysilane (TEOS) as silicon precursor, three organotriethoxysilanes [RTEOS, where R = methyl (M), propyl (P) or phenyl (Ph)] where used at a RTEOS:TEOS molar percentage of 10 and 30%. The materials where thoroughly characterized by several techniques to determine their morphological, textural, chemical, and UV-vis light absorption properties and then, the most promising materials were used as photocatalyst in the photodegradation of the emerging contaminant and antiepileptic carbamazepine under UV irradiation. The materials synthesised using 10% molar percentage of RTEOS (MSTiR10) where able to almost completely degraded (⁓95%), 1 mg L–1 of carbamazepine (CBZ) after 1 h of irradiation using a 275 nm LED and 0.5 g L–1 of catalyst dose. Therefore, this new synthesis approach has proven useful to develop photoactive TiO2 composites with enhanced textural properties.
Keywords:
TiO2/SiO2 materials
; Hydrothermal synthesis
; Triethoxysilanes
; Photocatalysis
; UV irradiation
; Carbamazepine Removal
; By-products Determination
1. Introduction
Nowadays, the overconsumption of pharmaceutical drugs, personal care products, herbicides, and other compounds in modern society has led to the presence of persistent toxic emerging contaminants (ECs) in residual wastewaters worldwide, supposing an environmental issue and a matter of public health. Due to the high chemical diversity of these water pollutants and their low concentrations, conventional procedures in wastewater treatment plants (WWTPs) have been proven inefficient, with trace-level concentration of more than fifty ECs detected in WWTPs effluents worldwide over the past few decades [1]. For instance, Carbamazepine (CBZ) is a psychiatric drug widely used for the treatment of epilepsy and bipolar disorder, being the second most frequently detected pharmaceutical compound in European and African wastewater, with discrete concentrations detected as high as 559 ng L–1 [2]. In addition to its high consumption, once ingested only 72% of the drug is metabolized, while the rest is excreted, ending up in wastewaters [3]. Hence, CBZ has been added to the European’s Commission “Proposal for a Directive amending the Water Framework Directive, the Groundwater Directive and the Environmental Quality Standards Directive” [4].
Advanced oxidation processes (AOPs) comprise a wide range of technologies, such as ozonation; electrochemical oxidation; Fenton oxidation; and photo- and/or sonocatalysis, which have gained significant attention due to their promising achievements in the efficient and environmentally friendly removal of biodegradable substances. AOPs involve the in-situ generation of highly reactive oxidative radical species (ROS) that have one unpaired electron, such as hydroxyl (HO•), superoxide (O2•–), hydroperoxyl (HOO•) or alkoxy (RO•) radicals, which have a strong tendency to interact non-selectively with other compounds like ECs, subtracting one of their electrons to obtain an even number, while the latter decomposed into smaller and harmless molecules or even mineralized into CO2 and water [5]. Among the AOPs, photocatalysis has arisen a growing interest in recent years due to the possibility of using green and sustainable irradiation sources, such as LEDs or solar light, to induce the formation of electron (e–) and hole (h+) pairs in the conduction and valence band of metal oxide semiconductors, respectively. The photoinduced pairs can then react directly with the ECs or promote the generation of HO• and O2•– radicals from the oxidation and reduction of water and dissolved O2, respectively, avoiding the need to use O2, H2O2 or other oxidants to generate ROS. Nevertheless, some photocatalysts present a series of inconveniences that severely affect their photodegradation performance: lack of absorption of visible light; fast e–/h+ recombination rates; small specific surface areas; and particle aggregation [6].
Titanium dioxide (TiO2) is arguably the most widely used optical semiconductor as photocatalyst for water remediation applications, due to its low cost and easy preparation; non-toxicity; chemical stability and high oxidation power [7]. However, TiO2 suffers from the series of aforementioned drawbacks, thus, major efforts have been made to develop modified TiO2 or prepare composites that can overcome such problems to obtain high photonic efficiencies [8]. Contrary to what was previously believed, insulator materials can act as robust supports by dispersing semiconductors on their surface and enhancing their photoactivity due to their chemical durability and adsorption sizes linked to their larger surface area. Moreover, insulators can act as a barrier by preventing the recombination of charge carriers (e– and h+) and photocorrosion [9]. Among the usual insulators employed for the preparation of semiconductor-insulators heterojunctions, amorphous siliceous materials (SiO2) stand out as a support for the dispersion of TiO2 nanoparticles. In addition, to their high porosity which favors the interaction between the subtracts and the active centers and preventing particles aggregation, their surface silanol groups can condense with titanium precursors, anchoring TiO2 particles on the surface through Si–O–Ti bonds, which confers high stability to the TiO2/SiO2 hybrids [10]. Furthermore, it has been reported that the light-scattering properties of SiO2 can enhance the exposure of the supported TiO2 particles to the UV radiation, improving the performance of TiO2/SiO2 hybrids compared to bare TiO2 [11].
The main objective of this work is to develop new TiO2/SiO2 hybrid materials with improved textural properties and photocatalytic activity. Hence, in the present work, three series of new anatase materials supported on amorphous mesoporous SiO2 (MSTiR%) were prepared through a hydrothermal synthesis approach using tetraethoxysilane (TEOS) and organotriethoxysilanes (RTEOS; R = methyl, M; propyl, P; and Phenyl, Ph) as silicon precursors at a molar percentage of 10% or 30% RTEOS/(TEOS + RTEOS), while titanium butoxide (TBOT) was used as the titanium precursor, keeping the Si/Ti precursors ratio of 96.86. This procedure makes also use of structure-directing agents (SDA) such as polyvinylpyrrolidone (PVP), which interact with the hydrolyzed TBOT precursors decreasing their condensation rate and favoring the co-polymerization with the hydrolyzed silicon precursors, and tetrapropyl ammonium bromide (TPABr). Unlike a previous work in which crystalline titanosilicalites were obtained using the same synthesis conditions and tetrapropyl ammonium hydroxide (TPAOH) as the SDA [12], TPABr induced the formation of TiO2 anatase particles of 8-10 nm anchored onto the surface of SiO2. RTEOS precursors also act as a tertiary SDA because, compared to TEOS, their non-hydrolysable organic moieties block a site susceptible to hydrolyze and exhort a steric effect that plays a key role in the anatase particle formation and the porosity of the resulting materials. The materials were fully characterized using a plethora of techniques such as x-ray diffraction (XRD); N2 adsorption; EDX-SEM (Energy-Dispersive X-ray) Spectroscopy and XPS (X-ray photoelectron spectroscopy) and UV-vis diffuse reflectance spectroscopy. The materials photoactivity was tested in the photodegradation of 1 mg L–1 of the anticonvulsant carbamazepine (CBZ) under UVC irradiation (LED system of λ = 275 nm). The influence of pH and catalyst dose was studied obtaining the best performance (98.58% degradation) when 1 g L–1 of MSTiP10 was used at non-controlled pH (pH = 6.0). The transformation products of CBZ were analyzed using LC-QTOF and a photodegradation pathway was proposed based on the results and reviewed literature. Thus, this study has proven that the use of RTEOS precursors can be effectively used to obtain TiO2/SiO2 hybrids with tailored textural properties and distribution of titanium photoactive species within the amorphous SiO2 matrices.
2. Materials and Methods
2.1. Reactives
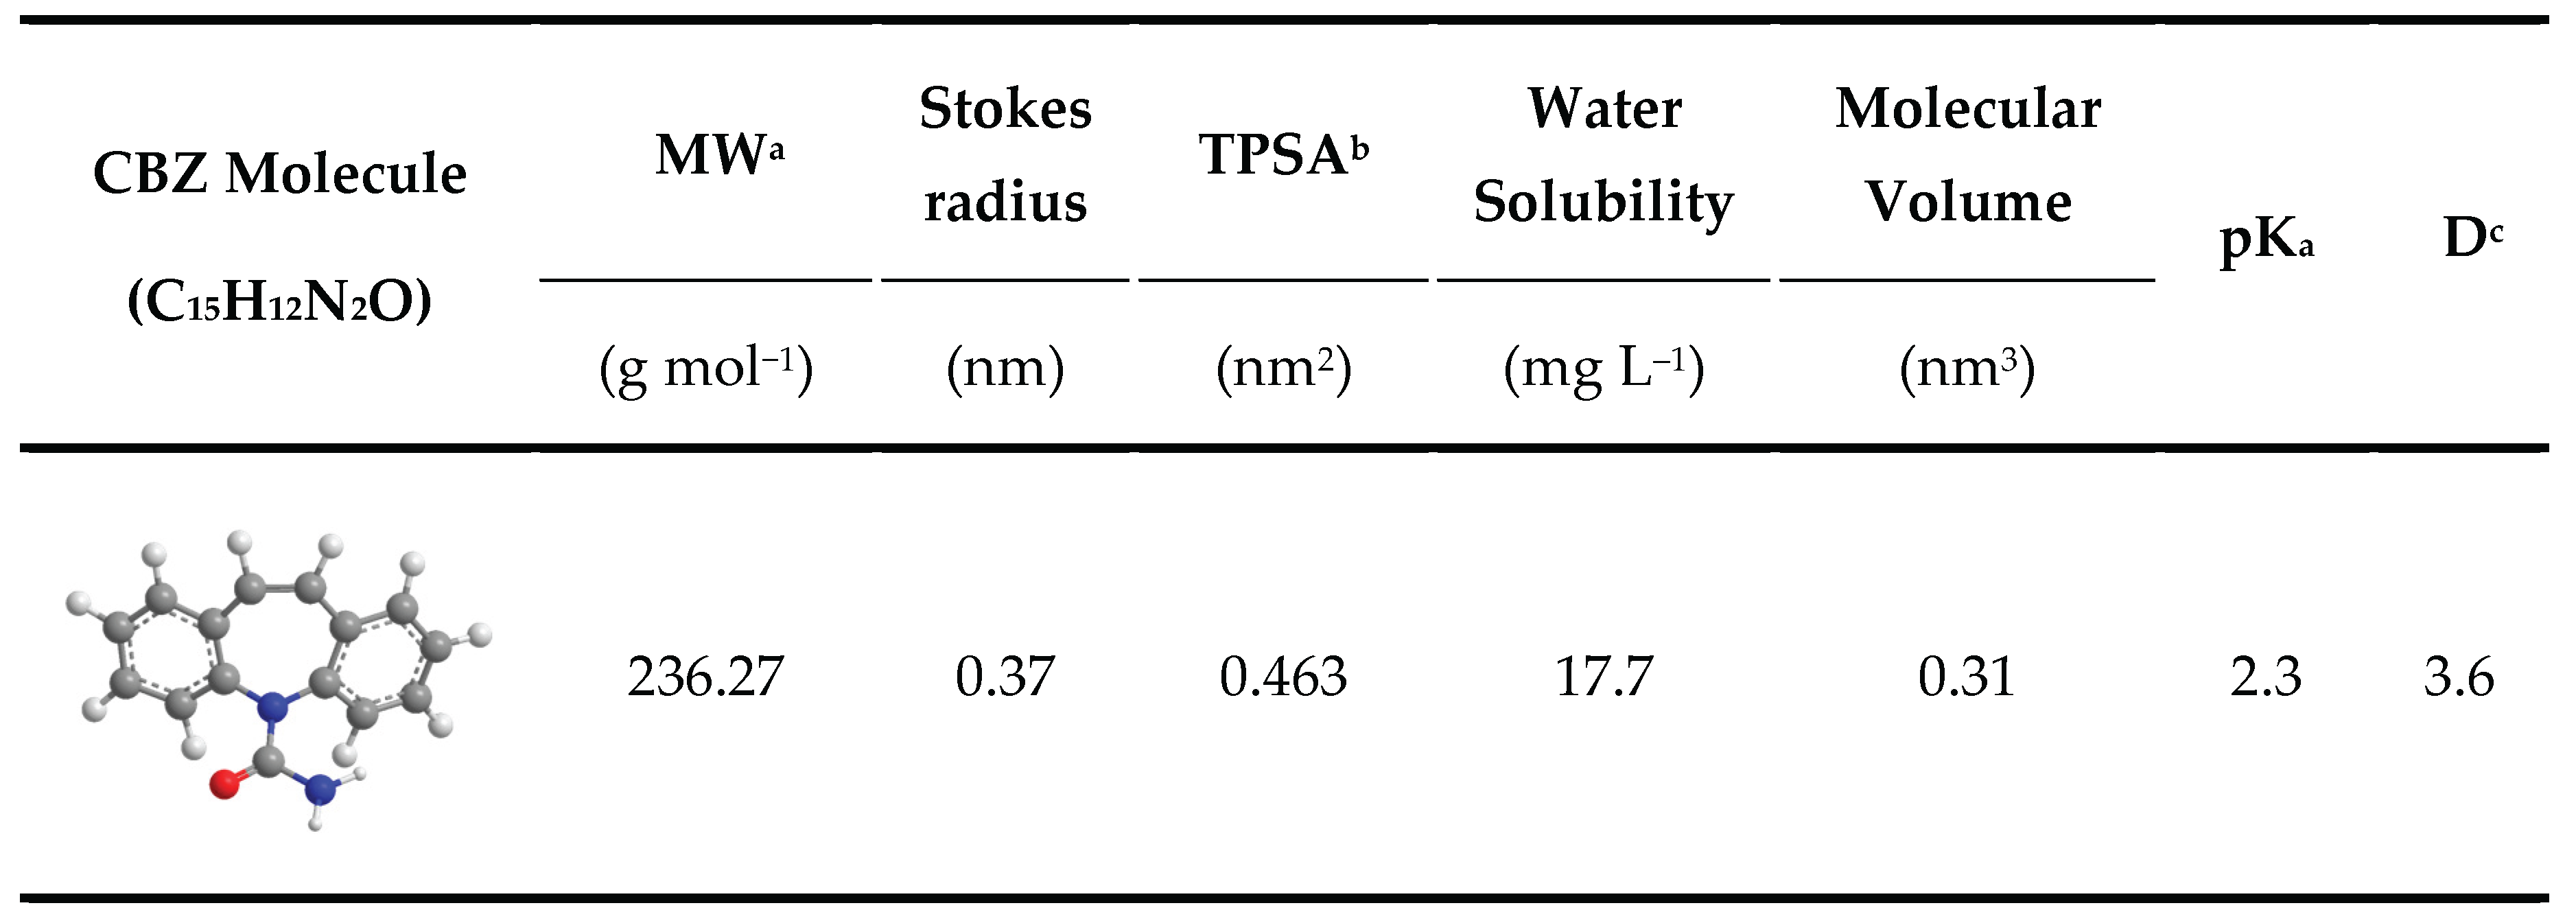
TEOS (Tetraethoxysilane, assay ≥ 99 %) and TBOT (Titanium butoxide, assay 97%) were the respective silicon and titanium precursors used in this study. The used hybrid silicon precursors (RTEOS) were MTEOS (triethoxymethylsilane, assay 99%), PTEOS ((n-propyl)triethoxysilane, assay 97%) and PhTEOS (phenyltriethoxysilane, assay 98%). The organic substances using as surfactants in the synthesis were TPABr (tetrapropylammonium bromide, assay 98%) and PVP (poly(vinylpolipirrolidone) ~110 µm particle size). Carbamazepine (5H-Dibenz[b,f]azepine-5-carboxamide, CBZ, assay 98%) was selected to assess the photocatalytic activity of the materials. All reactants were purchased from Sigma-Aldrich (St. Louis, MO, USA). CBZ is a polar molecule with a high electrophilicity value. The molecule remains neutral at the 3 ≤ pH ≤ 11 range [13], although it can form molecular aggregates, mainly dimers, through hydrogen-bonding or aromatic interactions [14,15]. Table 1 contains the more relevant chemical and physical properties of carbamazepine.

2.2. Synthesis of the Anatase Supported on Mesoporous Silica (MSTiR%)
This synthesis method was employed in a previous work to prepare modified titanosilicalites [12]. Nevertheless, for this work TPABr was used instead of TPAOH (tetrapropylammonium hydroxide) to obtain different materials.
Briefly, a mixture of TEOS and a RTEOS (33.9 mmol of silicon precursors where the molar percentage of RTEOS/(TEOS+RTEOS) is equal to 10% or 30%) was added to 0.115 mL of TBOT (0.35 mmol). Then, this mixture was added dropwise to a 12.7 mL aqueous solution containing TPABr (0.62 mol L–1) and PVP (0.1 g). The resulting mixture was stirred at 52 °C for 30 min on a thermostatic magnetic plate. After homogenization of the mixture, the temperature was increased to 80 °C to remove the alcohols generated during the hydrolysis of the precursors and water was continuously added over 30 min to kept the volume constant. Afterwards, the mixture was poured into a 30 mL Teflon autoclave with a stain-less steel jacket (Huanyu high-tech CO., LTD, Wenzhou, Zhejiang, China) which was maintained at 145 °C for 24 h. After the hydrothermal process was completed, the white gelatinous solid was dispersed in water and centrifuged using a Sorvall ST 8 centrifuge, Thermo Fisher Scientific, Waltham, Massachusetts, USA) at 5000 rpm for 15 min, afterwards it was dried at 60 °C overnight. Finally, the samples were calcinated at 550 °C for 8 h (12PR/300 Hobersal Furnace, Barcelona, Spain), obtaining white solids.
2.3. Characterization Techniques
This section gathers a brief description of the techniques and equipment employed for the characterization of the materials. For detailed measurements and calculation methods see section S1 of the Supplementary material.
X-ray diffraction patterns were obtained at room temperature, using a PANalyticalEmpyrean XRD instrument (Empyrean, Almelo, The Netherlands) with copper rotating anode and graphite monochromator (at 45 kV and 40 mA) to select the CuKα1/2 wavelength of the incident beam at 0.154 nm. Infrared spectra were obtained using a FTIR spectrometer (Jasco mod. 4700, Japan). Ultraviolet-Visible diffuse reflectance spectra (UV-vis DRS) were acquired in the measurement range of 200–2000 nm at 25 °C. The samples reflectance (R) were recorded in a UV-visible-NIR Varian spectrometer (model CARY-5E) equipped with a spherical diffuse reflectance accessory, where BaSO4 was used as the reflectance standard due to its 100% reflectance in the visible region. The surface atomic composition and the valence band maximum edge potential (EVBM) of the materials were determined by X-ray photoelectron spectroscopy (XPS). The spectra were recorded with a constant pass energy value of 29.35 eV, 0.125 eV step–1 and a beam diameter of 200 µm using a physical electronic spectrometer (PHI Versa Probe II, Physical Electronics, Minneapolis, MN, USA) with monochromatic X-ray Al Kα radiation (15 kV, 1486.6 eV), a hemispherical multichannel detector, and a dual beam charge neutralizer for analyzing the core-level signals of the elements of interest which were C1s, O1s, O2s, Si2s, Si2p and Ti2p. The position and areas of the peaks were determined using the C1s adventitious carbon peak at 284.6 eV as an internal standard. N2 adsorption isotherms (−196 °C) were determined with a volumetric adsorption system (ASAP2020, Micromeritics, Norcross, GA, USA), weighing approximately 150 mg of sample into a straight-walled Pyrex glass tube followed by degassing at 200 °C for ≤ 2 h with a residual vacuum of < 0.66 Pa. Analysis time ranged from 14 to 55 h. The sample tube was covered with an isothermal jacket and immersed in a Dewar with liquid nitrogen (−196 °C). Scanning electron microscopy (SEM) micrographs with a magnification of ×150 and ×1000 were obtained at 3, 5 and 150 kV using an EVO 15-SMART EDX SEM-EDX system from Zeiss (Oberkochen, Germany). The system was equipped with a 5-kV energy-dispersive X-ray (EDX) detector, and gold-palladium metallization’s were performed using an automatic sputter coater (model SC7620, from Aname, Madrid, Spain) to reduce any charge effect, as XG matrices are non-conducting.
2.3. Photodegradation Experiments
The photodegradation experiments of CBZ were conducted in ultrapure water (18.2 MΩ cm), with 100 mL of contaminant solution (1 mg L–1) in a 120 mL cylindrical glass reactor under magnetic stirring (2,500 rpm). The experiments were performed using catalyst doses of 0.25; 0.5; 0.75 and 1g L–1, and under 2 h of irradiation using a system of 275 nm LEDs equipped with cooling fans. During the experiments, aliquots of 1 mL were collected with a 5 mL syringe using a 0.45 µm Nylon filter and poured into HPLC inserts. The CBZ concentration of the aliquots was determined by Ultra-High-Pressure Liquid Chromatography (HPLC) using a Shimadzu series 20 apparatus with an SPD-M20A diode array detector, equipped with a Hypersil GOLD C18 (250 mm × 4.6 mm) column. An isocratic method with a mobile phase of 40/60 v/v acetonitrile/ultrapure water (with 1% formic acid) at a flow rate of 1 mL min–1 was used. The excitation wavelength for CBZ was 286 nm. The CBZ degradation by-products analysis were performed using an ultra-pressure liquid chromatograph UPLC (Waters, Acquity H-Class model, USA) with a C18 column (2.1 × 100 nm, 1.7 μm) coupled with a quadrupole time-of-flight mass spectrometer (Waters, Xevo TQ-S model, USA) equipped with a positive electrospray ionization system (UPLC/Q-TOF-MS-ES+).
3. Results and Discussion
3.1. Characterization Analysis of the MSTiR% Materials
3.1.1. X-Ray Diffraction (XRD)
Figure 1 depicts the diffraction patterns of the materials recorded in the 10° < 2θ < 60° range. Table S1 contains the identified diffraction maxima with their corresponding intensity, Full Width at Half Maximum (FWHM) and integrated areas.
Figure 1.
Diffraction patterns of the (a) MSTiR10 and (b) MSTiR30 materials.
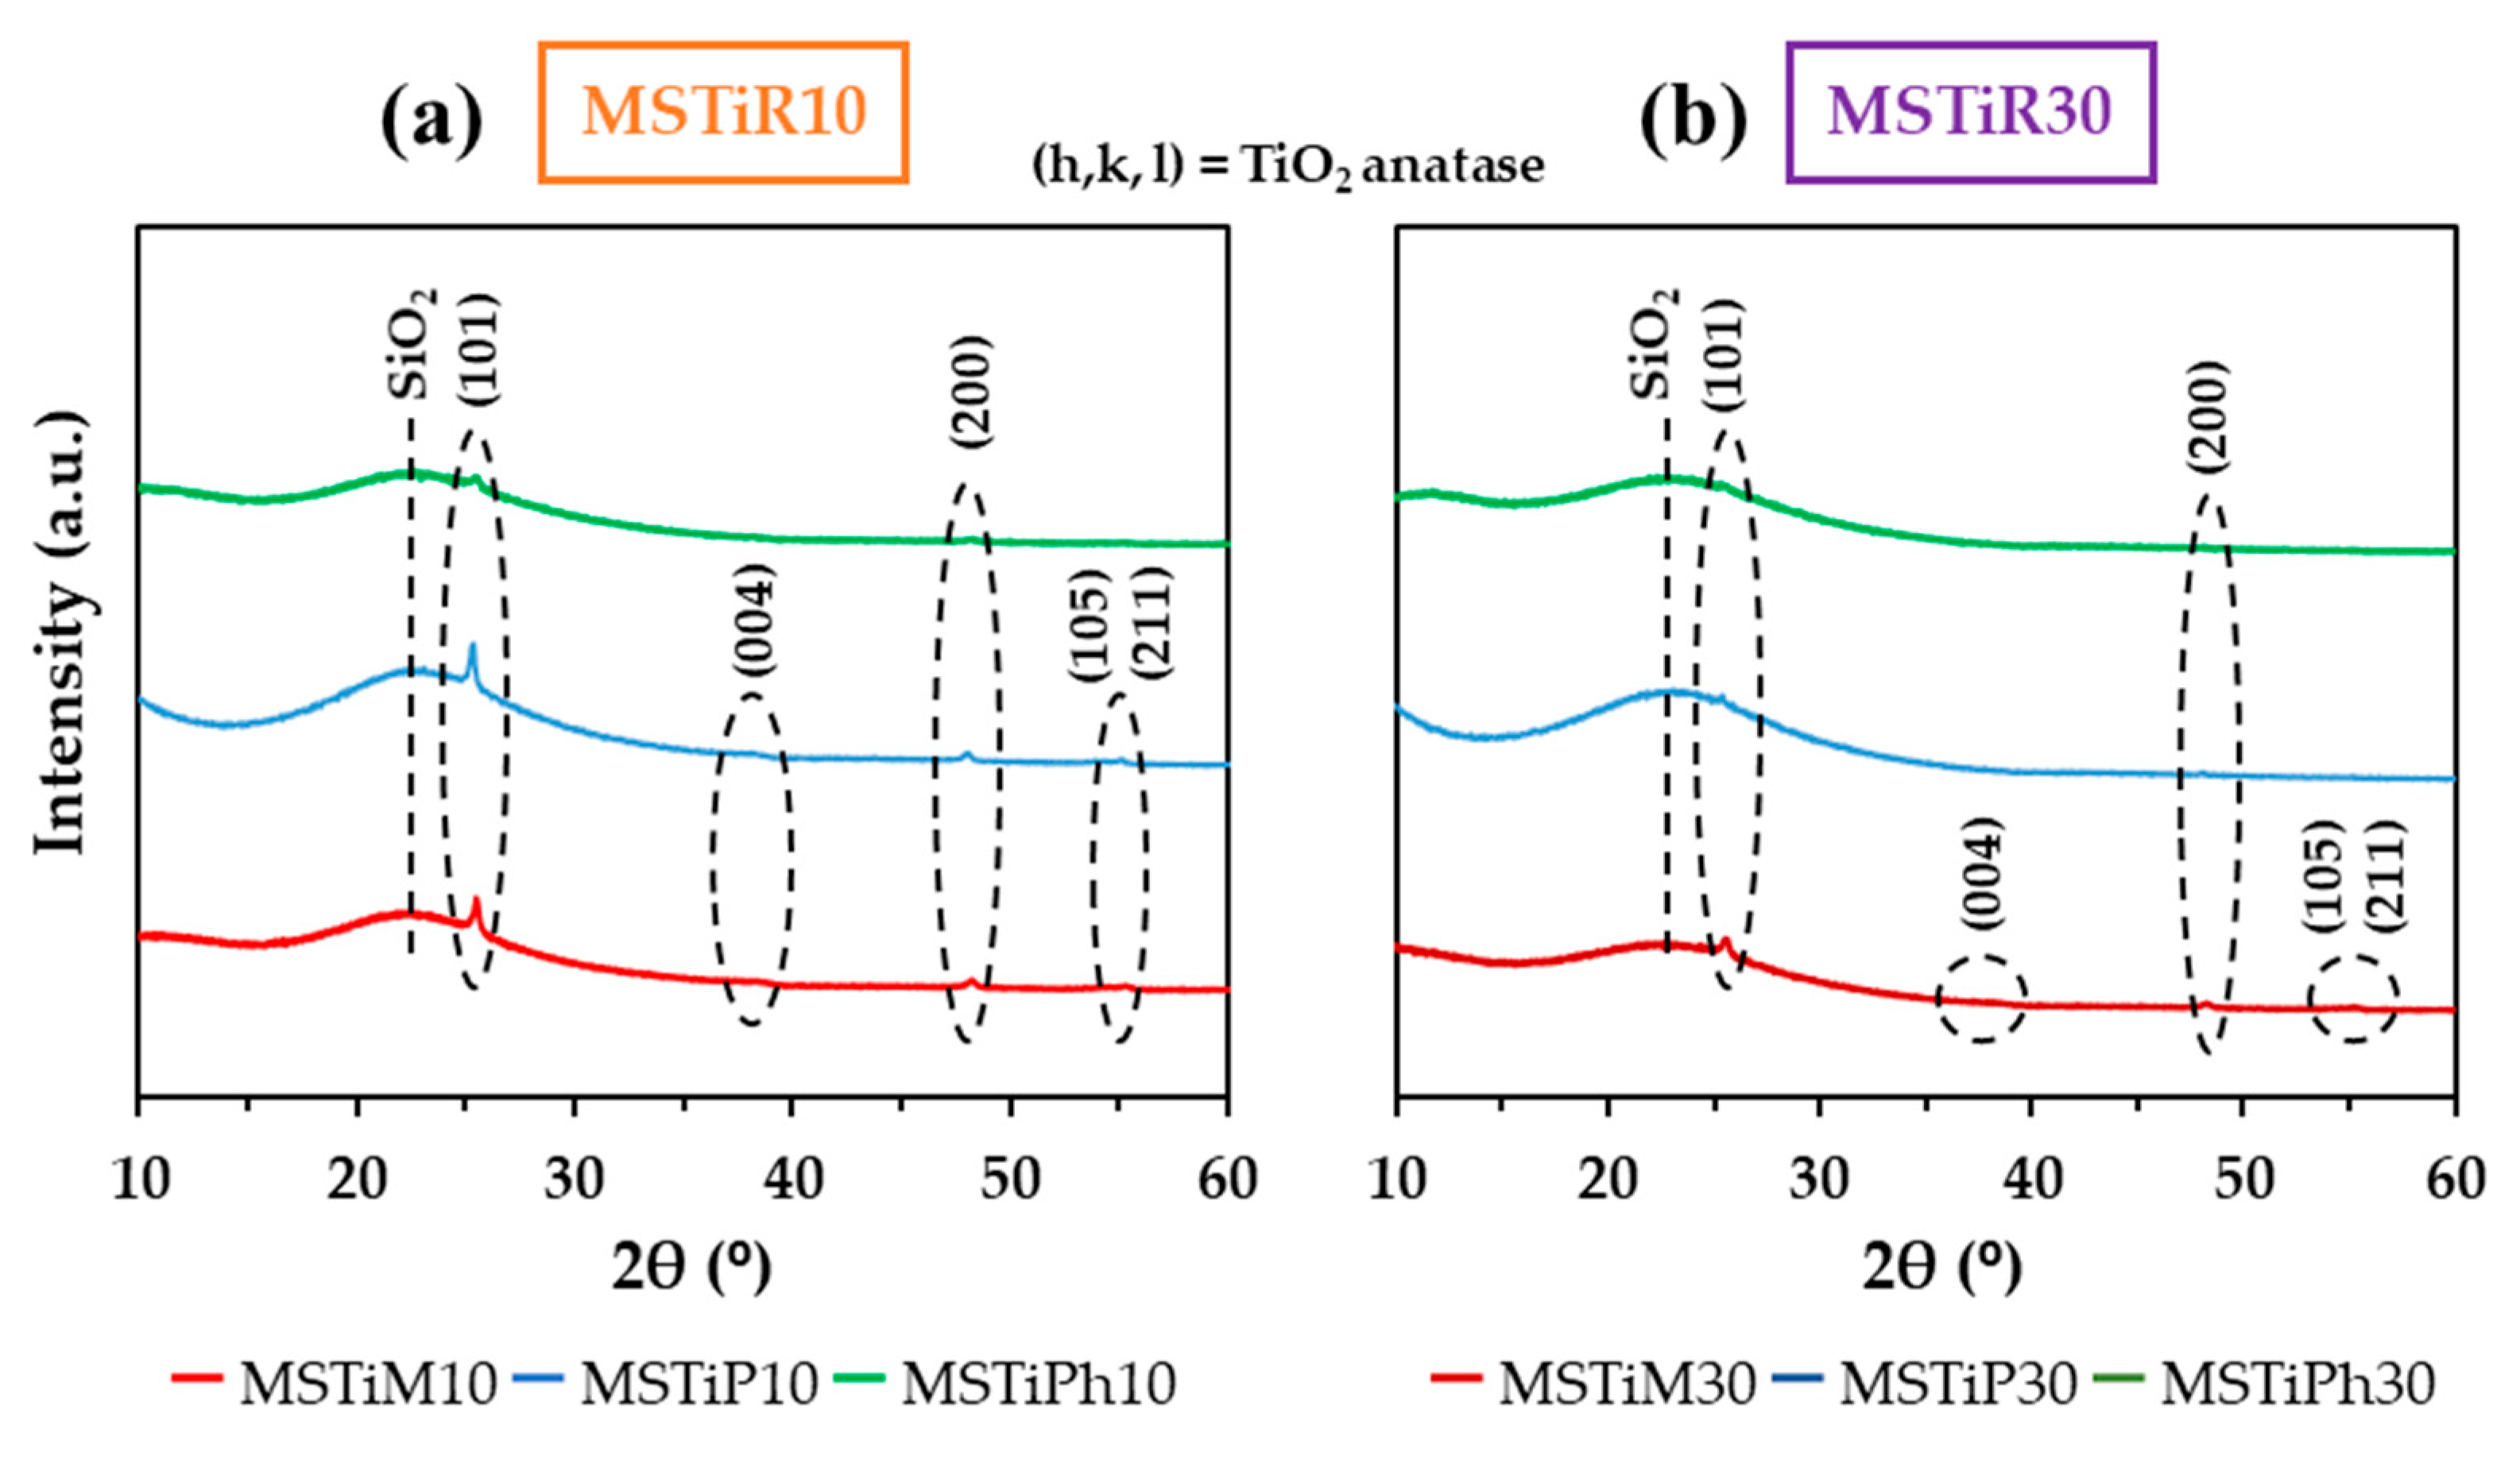
No diffraction maxima belonging to the orthorhombic MFI lattice planes of the titanosilicalites (7.8°, 8.9°, 23.1°, 24°, and 24.5°) were detected [19,20]. However, a broad band (maximum intensity at 2θ ~ 22°) belonging to amorphous silica is recorded in all materials diffraction patterns. This confirms that TPABr could not replace the role of TPAOH in directing the formation of the MFI structure during the hydrothermal synthesis. Hence, in the absence of an MFI lattice, Ti+4 is not forced to occupy tetrahedral positions, resulting in the formation of TiO2 particles. This is confirmed by the diffraction patterns of MSTiM10, MSTiP10 and MSTiM30, whose five maxima correspond to the (101), (004), (200), (105) and (211) lattice planes of anatase, according to The International centre for Diffraction Data ((ICDD, JCPDS, file code 21−1272). Nevertheless, no maxima associated with the (004) and (105) planes of anatase were identified in the diffraction patterns of MSTiPh10; MSTiP30 and MSTiPh30, denoting that the PhTEOS precursor and a high proportion of the PTEOS precursor hinder the formation of crystalline TiO2 particles. The presence of rutile is discarded since no maxima at 2θ ~ 27.65 and 36.02° were identified in any pattern of the materials [21]. Table 2 depicts the 2θ of each detected diffraction maximum of anatase and the determined structural parameters of each MSTiR% material: the inter-planar distances (d(h, k, l)) calculated from Bragg equation (Eq. S1); the crystallite size (D(h, k, l)) calculated from the Scherrer equation (Eq. S2); and the degree of crystallinity (calculated from Eq. S3).
Table 2.
Identified anatase diffraction maxima and determined structural parameters of the MSTiR% materials.
Table 2.
Identified anatase diffraction maxima and determined structural parameters of the MSTiR% materials.
| MSTiR% | (h, k, l) | 2θ | d(h, k, l)a | D(101)b | Degree of Crystallinityc | |
| (°) | (nm) | (nm) | (%) | |||
| MSTiM10 | (101) | 25.48 | 0.350 | 8.39 | 13.19 | |
| (004) | 38.45 | 0.234 | ||||
| (200) | 48.23 | 0.189 | ||||
| (105) | 54.46 | 0.168 | ||||
| (211) | 55.27 | 0.166 | ||||
| MSTiP10 | (101) | 25.37 | 0.351 | 9.06 | 11.39 | |
| (004) | 38.15 | 0.236 | ||||
| (200) | 48.05 | 0.189 | ||||
| (105) | 54.39 | 0.169 | ||||
| (211) | 55.08 | 0.167 | ||||
| MSTiPh10 | (101) | 25.47 | 0.350 | 8.95 | 9.15 | |
| (200) | 48.28 | 0.189 | ||||
| MSTiM30 | (101) | 25.53 | 0.349 | 8.77 | 11.08 | |
| (004) | 38.15 | 0.236 | ||||
| (200) | 48.24 | 0.189 | ||||
| (105) | 54.52 | 0.168 | ||||
| (211) | 55.18 | 0.166 | ||||
| MSTiP30 | (101) | 25.39 | 0.351 | 9.06 | 8.14 | |
| (200) | 48.05 | 0.189 | ||||
| MSTiPh30 | (101) | 25.34 | 0.351 | 10.67 | 6.90 | |
| (200) | 48.13 | 0.189 |
a-Interplanar space calculated using the Bragg equation; b-Crystallite Size calculated from Debye-Scherrer equation; c-Degree of Crystallinity.
Table 2 shows that with 10% of MTEOS the anatase crystallite size is 8.39 nm, while organic precursors with bulkier organic moieties (propyl and phenyl in PTEOS and PhTEOS; respectively) yield larger crystallite sizes (~9 nm). In addition, as the percentage of RTEOS increases from 10 to 30%, the crystalline size increases and the degree of crystallinity decreases. Therefore, it can be confirmed that the organic precursors hinder the formation of the anatase particles, and the more voluminous their organic moiety, the lower the crystallinity of the sample.
3.1.2. Fourier-Transformed Infrared Spectroscopy (FT-IR)
Figure S1 shows the infrared spectra of the MSTiR% samples in the 4000–2750 and 1600–400 cm–1 spectral range. The characteristic bands of amorphous silica are present in all samples: (i) 455 cm–1, O–Si–O rocking (ρ O–Si–O); (ii) 800 cm–1, Si–O–Si symmetric stretching (νs Si–O–Si); (iii) 955 cm–1, Si–O symmetric stretching of the surface silanols groups (νs Si–OH); (iv) 1090 cm–1, asymmetric stretching vibration of Si–O–Si (νas Si–O–Si); (v) 3450 cm–1, stretching of surface silanols (ν Si–OH); and (vi) 3660 cm–1, stretching of surface silanols interacting through hydrogen bonds (ν Si–OH–H) [22]. The lack of bands belonging to the MFI Zeolite (1230 y 550 cm–1) is consistent with the XRD patterns of the materials, in addition, the νas Si–O–Si band is located at 1090 rather than 1110 cm–1 as is usually observed in titanosilicalites. No C–H stretching bands were observed in the 3000–2850 cm–1 spectral range, indicating the removal of the organic moieties from the hybrid precursors during the calcination at 550 °C. Nevertheless, the methyl group of the MTEOS precursors is still present in the calcinated MSTiM10 and MSTiM30 materials, whose spectra shows the band associated to the C–H wagging vibration mode (ω C–H) highlighted at 1278 cm–1 in Figure S1. Lastly, comparing the spectra of the MSTiR% materials with the spectra of hybrid xerogels prepared in previous works using the same precursors and molar percentages [22,23], MSTiR% materials present lower intensity in their Si–O (955 cm–1) and ν Si–OH–H (3660 cm–1) bands, indicating that these materials are less hydrophile than their analogues xerogels. This is a priori unexpected, considering the fact that the MSTiR% materials have been synthesised in basic medium (due to the presence of TPABr), nevertheless, this is a consequence of the high calcination temperature that induce the condensation of a considerable portion of the superficial Si–OH groups [24].
3.1.3. UV-Vis Diffuse Reflectance (DR) and X-Ray Photoelectron Spectroscopy (XPS)
Figure 2 shows the UV–Vis DR spectra of the MSTiR% materials in the de 200–500 nm spectral range.
Figure 2.
UV-vis DR spectra of (a) MSTiR10 and (b) MSTiR30 materials in the 200–500 nm spectral range with their calculated indirect bandgap energy (Eg).
Figure 2.
UV-vis DR spectra of (a) MSTiR10 and (b) MSTiR30 materials in the 200–500 nm spectral range with their calculated indirect bandgap energy (Eg).
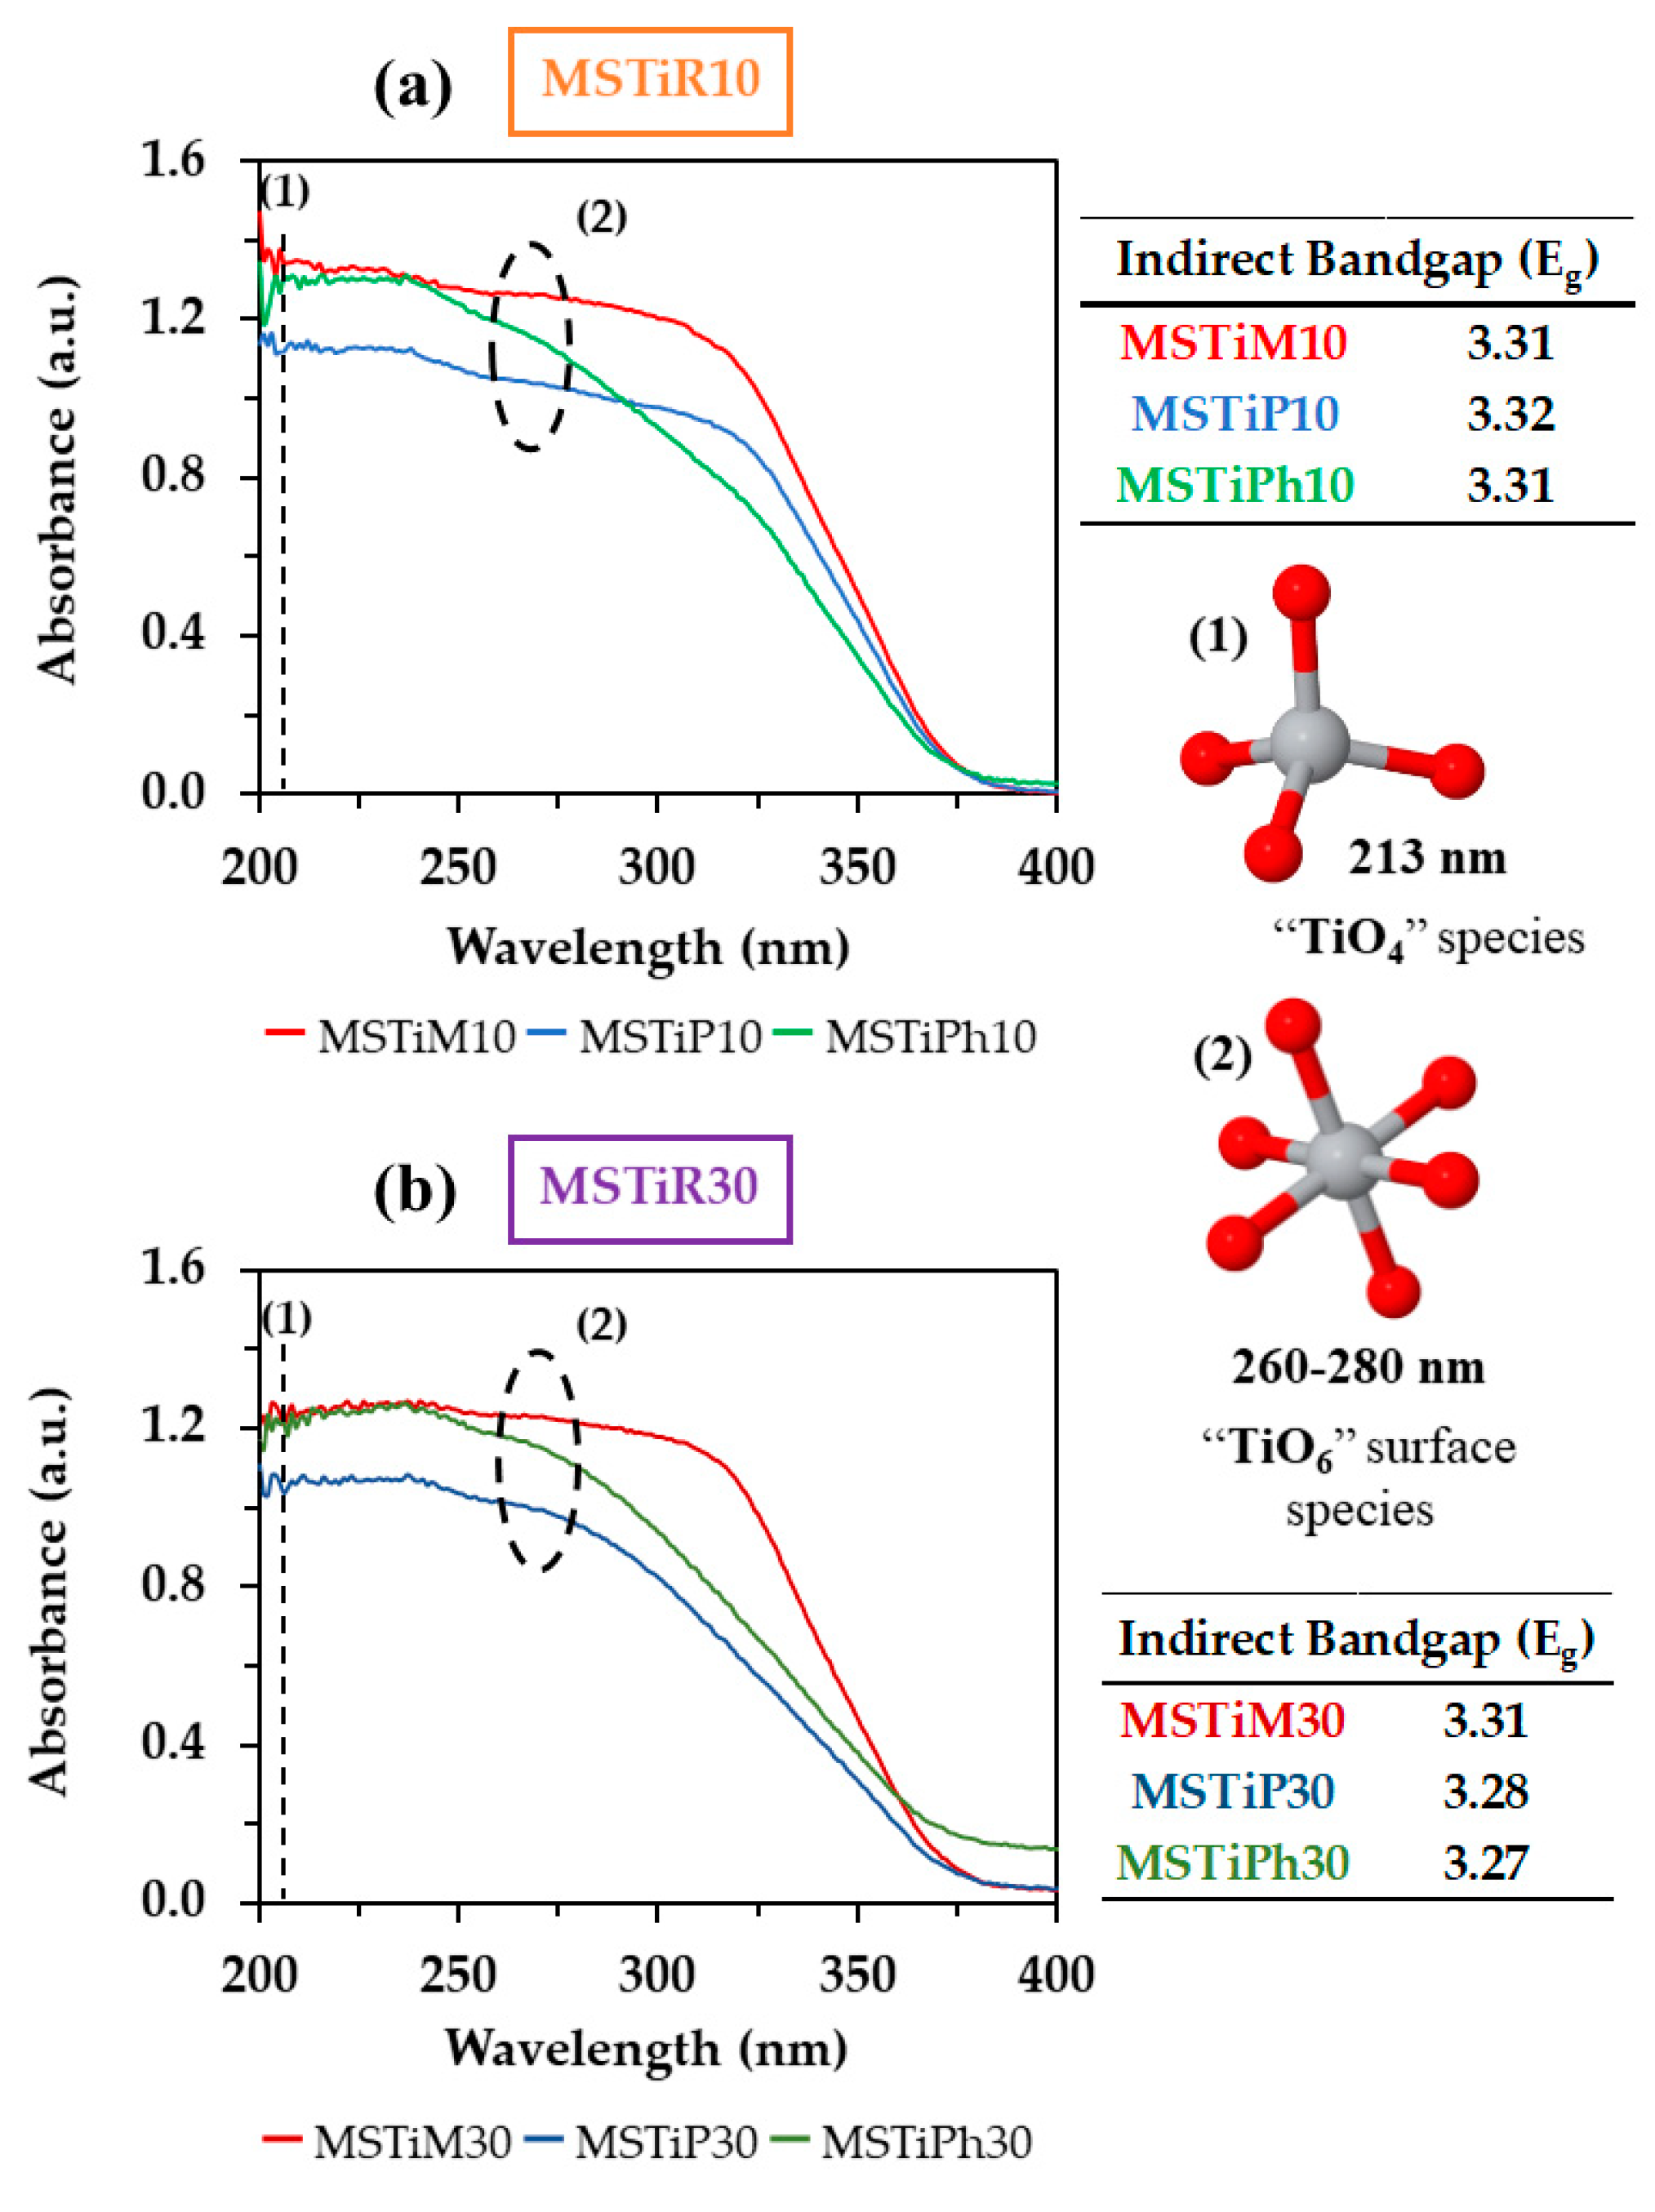
The UV-vis DR spectra of the samples indicate that the only photoactive species of the materials are the hexa-coordinated TiO2 species (TiO6), since no absorption peak of tetra–coordinated species (TiO4, typical of titanosilicalites) was observed in any spectra at ~210 nm (O–2 – Ti+4, charge-transfer). The absorption of the TiO6 species starts at 260 nm and decays until 380 nm is reached, anatase particles absorb in the 260–280 nm range while surface TiO6 mainly absorbs at 330 nm [25]. Therefore, since the absorbance of the MSTiPh% materials decays at a lower wavelength and have the lowest degree of crystallinity, it can be stated that the materials synthesised using the PhTEOS precursor contain fewer photoactive centers than those synthesised using MTEOS or PTEOS.
The spectra in Figure 2 also provide useful information regarding the electronic structure of the materials. For instance, the optical bandgap of the materials (Eg) was obtained applying the Tauc-plot method (Eq. S4-6) considering that the materials are indirect semiconductors (Figure S2). The calculated Eg values are all below 4 eV, indicating that they are indeed semiconductors that can act as photocatalyst. However, no appreciable difference was detected between the MSTiR% materials since all yielded Eg ~ 3.30 eV, a value close to that reported for anatase particles of 5–10 nm (Eg = 3.20 eV) [26].
The XPS spectra of the MSTiR% materials were acquired and the peaks belonging to the adventitious carbon (C1s), oxygen (O2s and O1s) and silicon (Si2p and Si2s) were identified, although the peak belonging to Ti2p was only identified in the MSTiPh10 spectrum (Figure S3). Nevertheless, Table 3 depicts the atomic composition of the materials surface estimated by this technique.
Table 3.
Atomic composition of the surface of the MSTiR% materials determined by XPS.
| MSTiR% | C1s | O1s | Si2p | Ti2p | ||||
| Atomic (%) | ||||||||
| MSTiM10 | 6.01 | 65.54 | 28.27 | 0.18 | ||||
| MSTiP10 | 6.82 | 65.24 | 27.71 | 0.23 | ||||
| MSTiPh10 | 6.04 | 66.17 | 27.48 | 0.31 | ||||
| MSTiM30 | 9.09 | 63.32 | 27.45 | 0.14 | ||||
| MSTiP30 | 7.17 | 65.20 | 27.53 | 0.10 | ||||
| MSTiPh30 | 7.16 | 65.17 | 27.49 | 0.18 | ||||
The relation between the atomic percentages of silicon and oxygen (O/Si = 2.3–2.4) in Table 3 is consistent with silicon dioxide materials, and it is confirmed that titanium is present on the materials surface in a low percentage, having the MSTiPh10 material the highest amount (0.31 % atomic proportion) among the MSTiR% materials. The lower amount of Ti in the MSTiR30 (0.1–0.18%) compared to its analogues MSTiR10 materials (0.18–0.31%) is also noteworthy, and indicates that a higher proportion of RTEOS precursor inhibits the incorporation of titanium, thus decreasing the number of reactive centers and the consequent photocatalytic activity of the materials. The amount of carbon depicted in Table 3 for each sample correspond to adventitious carbon.
The valence band maximum edge potential (EVBM) of the MSTiR% materials was determined form the low binding energy region of the XPS spectra (Figure 3.a) by applying a linear adjustment. For instance, Figure 3.b depicts the adjustment fit to determine the EVBM of MSTiM10 from its XPS spectrum (the linear adjustment of the other five MSTiR% materials can be found on Figure S4).
Figure 3.
(a) XPS low binding energy spectra of the MSTiR% materials; and (b) linear adjustment of the MSTiM10 spectrum to determine its valence band maximum edge potential (EVBM).
Figure 3.
(a) XPS low binding energy spectra of the MSTiR% materials; and (b) linear adjustment of the MSTiM10 spectrum to determine its valence band maximum edge potential (EVBM).

The EVBM values determined refer to the Fermi level (VFermi), thus Eq. S7–9 were used to obtain the potentials vs the vacuum level (VVacuum), and then, Eq. S10 was applied to determine the conduction band minimum edge potential (ECBM) considering the Eg estimated from the Tauc-plot method applied to the UV-Vis DR spectra. Table 4 shows the EVBM and ECBM potentials of the MSTiR% materials determined in VVacuum and VNHE values.
Table 4.
Tauc-plot bandgap energy (Eg), valence band maximum and conduction band minimum edges potential (EVBM and ECBM, respectively) of the MSTiR% materials respect to the vacuum level (VVacuum) and the normal hydrogen electrode at 25 °C and pH = 0 (VNHE).
Table 4.
Tauc-plot bandgap energy (Eg), valence band maximum and conduction band minimum edges potential (EVBM and ECBM, respectively) of the MSTiR% materials respect to the vacuum level (VVacuum) and the normal hydrogen electrode at 25 °C and pH = 0 (VNHE).
| MSTiR% |
Bandgap Energy (Eg) |
Valence Band maximum Edge Potential (EVBM) | Conduction Band Minimum Edge Potential (ECBM) | |||
| (eV) | (VVacuum) | (VNHE) | (VVacuum) | (VNHE) | ||
| MSTiM10 | 3.31 | –9.09 | 4.65 | –5.78 | 1.34 | |
| MSTiP10 | 3.32 | –8.88 | 4.44 | –5.56 | 1.12 | |
| MSTiPh10 | 3.31 | –9.05 | 4.61 | –5.74 | 1.30 | |
| MSTiM30 | 3.31 | –9.05 | 4.61 | –5.74 | 1.30 | |
| MSTiP30 | 3.28 | –9.28 | 4.84 | –6.00 | 1.56 | |
| MSTiPh30 | 3.27 | –9.32 | 4.88 | –6.05 | 1.61 | |
The EVBM and ECBM values of the MSTiR% materials differ an average of 1.86 and 1.76 eV, respectively, to that of pure anatase (–7.25 and –4.05 VVacuum or 2.81 and –0.39 VNHE, respectively) [27]. This is a consequence of the shift of the band positions, since, as observed on their XRD patterns (Figure 1), these materials contain a small proportion of crystalline anatase supported on amorphous SiO2, which is an insulator with a wide bandgap of ~9 eV. In fact, it has been reported that the dipole interface can cause a 0.5, 1.1 or 1.6 eV relative alignment of the band shift in Si/SiO2, SiC/SiO2 and GaN/SiO2 materials, respectively [28]. MSTiM10 and MSTiM30 presented similar EVBM and ECBM values, consistently with them having the same bandgap value, with MTEOS being the organosilane which less reduced the crystallinity of anatase when the RTEOS/TEOS molar percentage increased to 30% (Table 2). Conversely, the lower crystallinity of MSTiP30 and MSTiPh30, provokes a wider displacement of the valence of conduction bands compared to their MSTiR10 analogues. To ease the visual comparison, Figure 4 depicts a scheme of the band positions of MSTiM10 (as an example of the MSTiR10 materials), pure anatase, and the required redox potentials to generate HO• and O2•– radicals, which are the main species degrading organic pollutants during photocatalytic processes.
Figure 4.
Bandgaps and valence and conduction bands (blue and red, respectively) of the MSTiM10 material and pure anatase [27], and redox potentials for the generation of hydroxyl (HO•) and superoxide (O2•–) radicals [29].
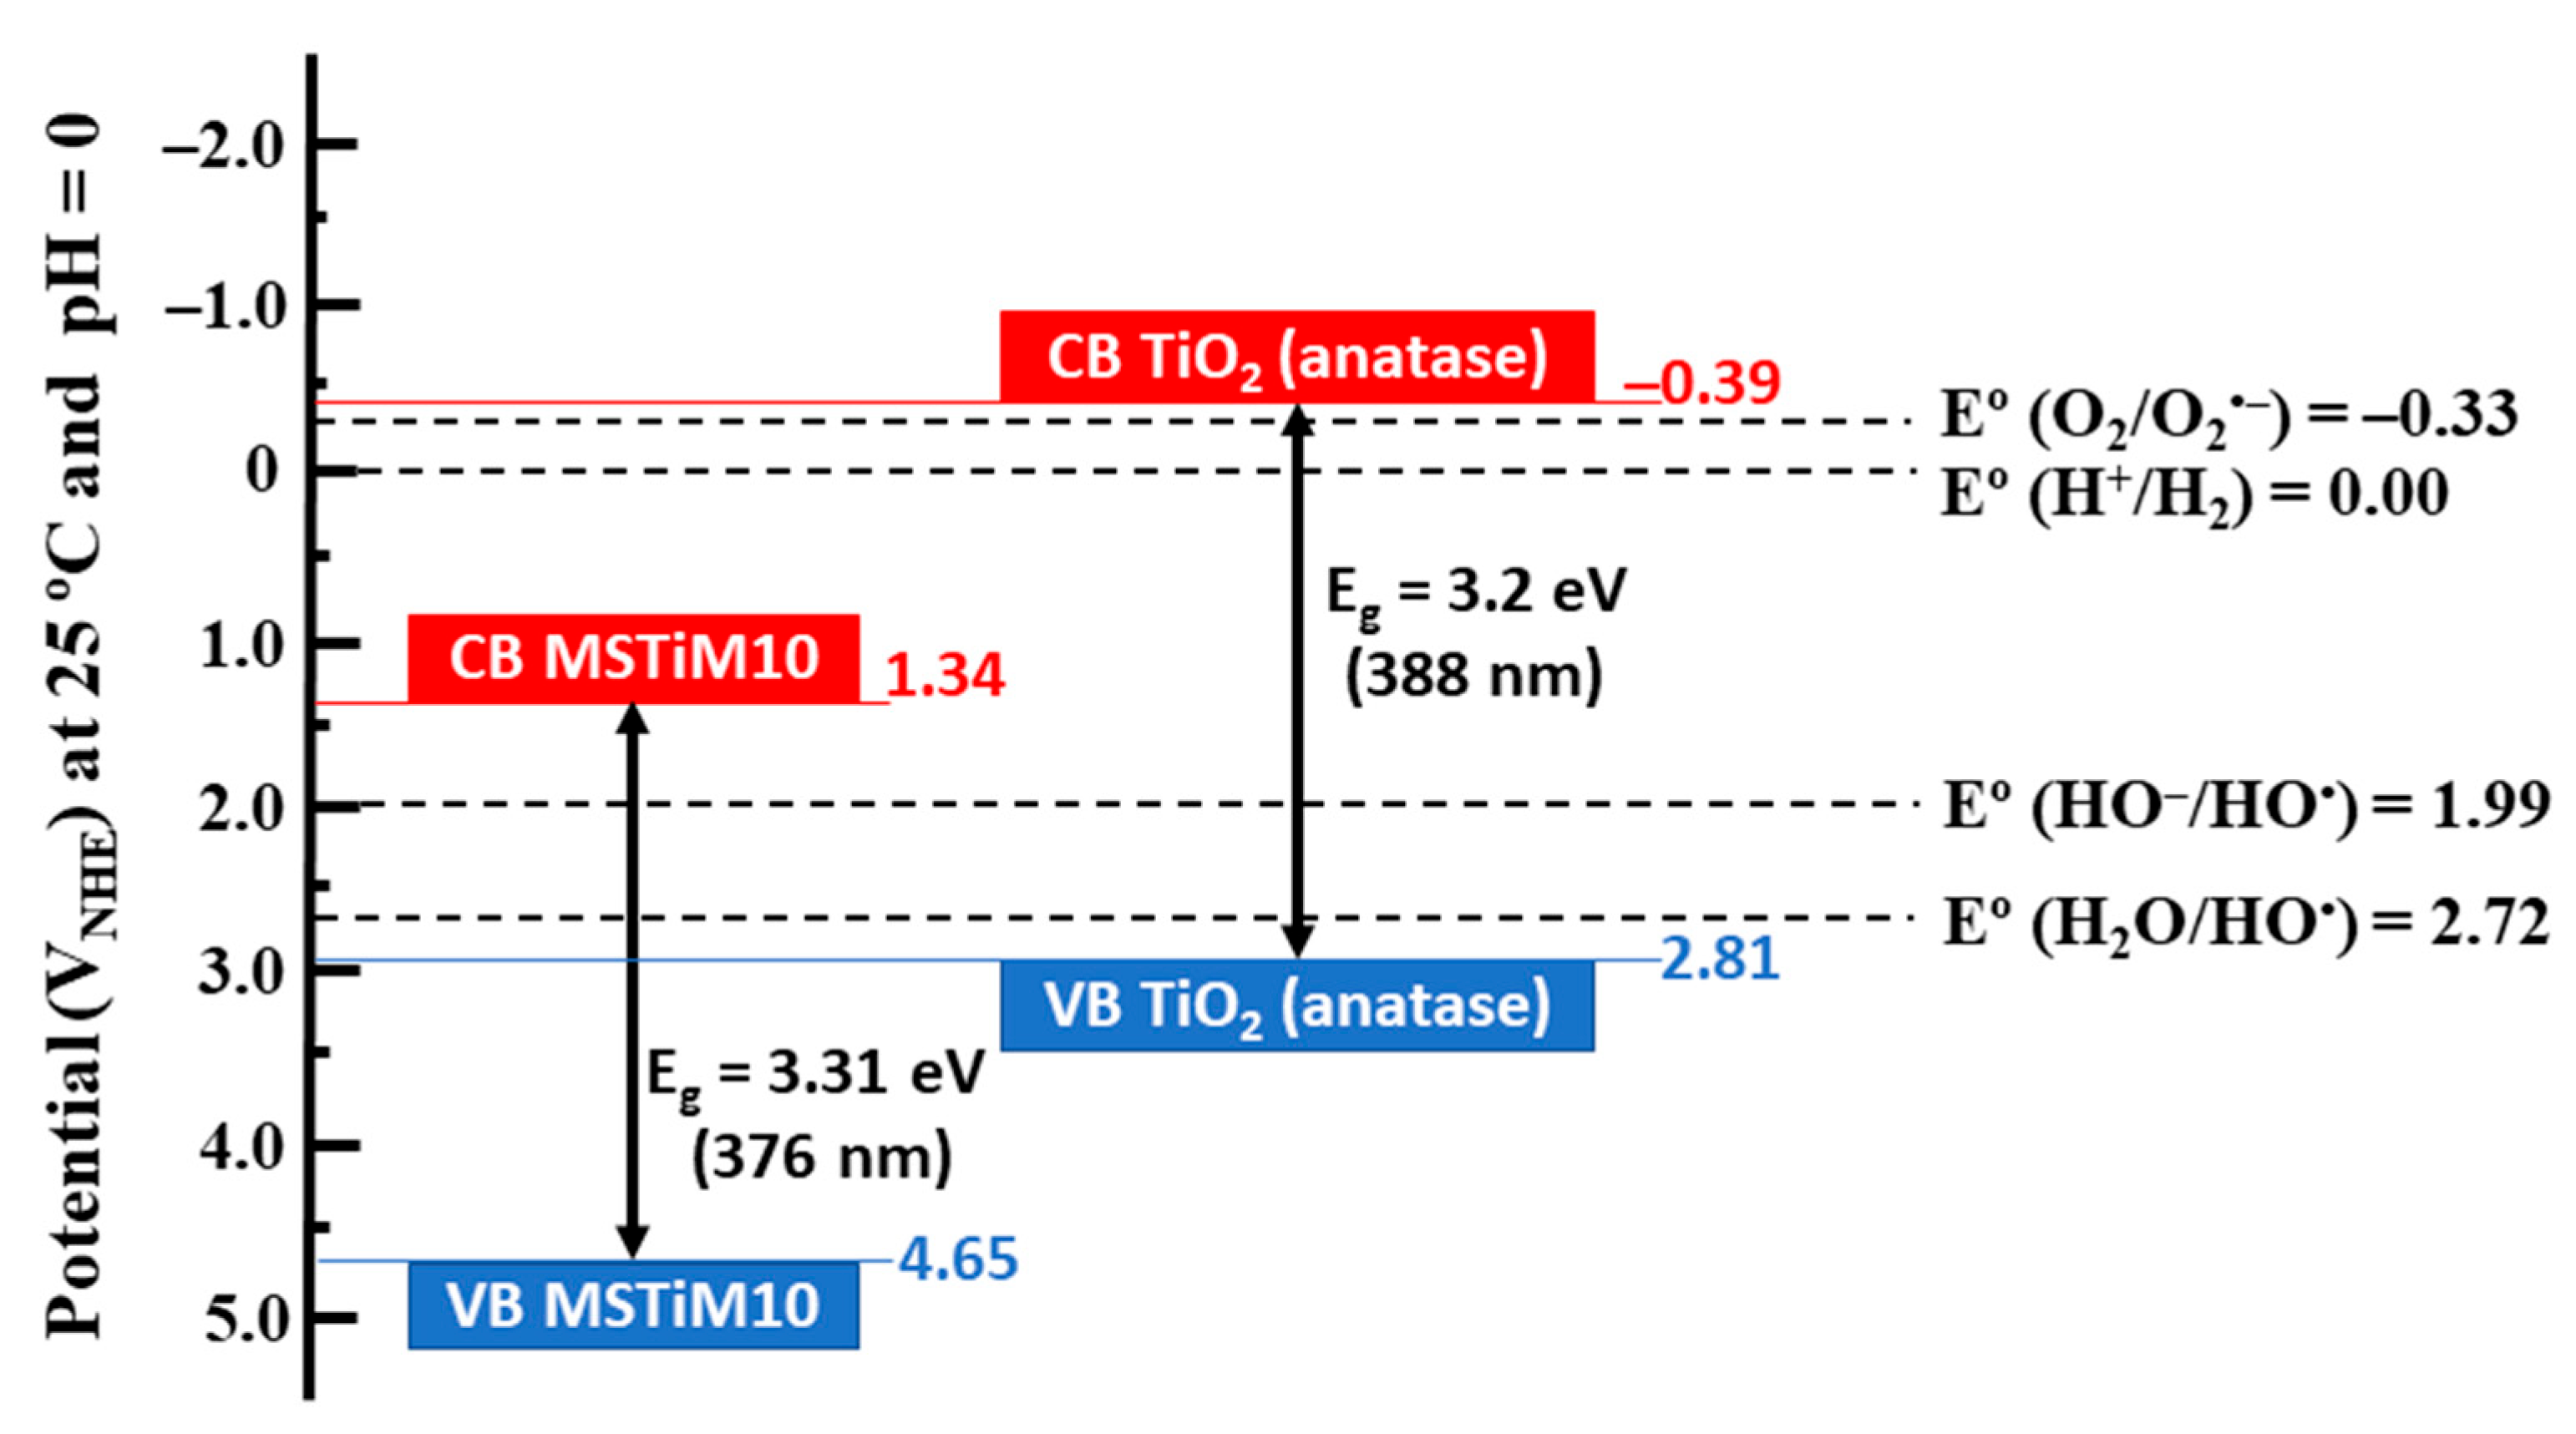
The diagram of Figure 4 indicates that since the values of EVBM of MSTiM10 and pure anatase are more positives than those of E° (H2O/HO•) and E° (HO–/HO•), both materials can generate HO• radicals when irradiated. Nevertheless, on contrary to pure anatase, the generation of O2•– radicals by MSTiR% materials is thermodynamically unfavorable, since their ECBM is more negative than E° (O2/O2•–). Therefore, compared to pure anatase the photoactivity of MSTiR% materials is more limited, and the main photogenerated reactive species are the OH• radicals.
3.1.4. N2 Isotherms (–196 °C)
Figure 5 depicts the N2 isotherms at −196 °C of the MSTiR% materials, all type IV(a) isotherms characteristic of mesoporous materials, as indicated by their wide-open knee at low partial pressures (p/p°), the hysteresis loop, and a plateau at high p/p°. The hysteresis loop located at the 0.6–0.85 p/p° range can be classified as type H2(b), associated with pore blocking occurring in pores with a large distribution of pore neck sizes, as is the case of mesoporous ordered silicas synthesised through the hydrothermal method [30].
Figure 5.
N2 isotherms at −196 °C of the (a) MSTiR10 and (b) MSTiR30 materials in normal (up) and semilogarithmic scales (down).
Figure 5.
N2 isotherms at −196 °C of the (a) MSTiR10 and (b) MSTiR30 materials in normal (up) and semilogarithmic scales (down).
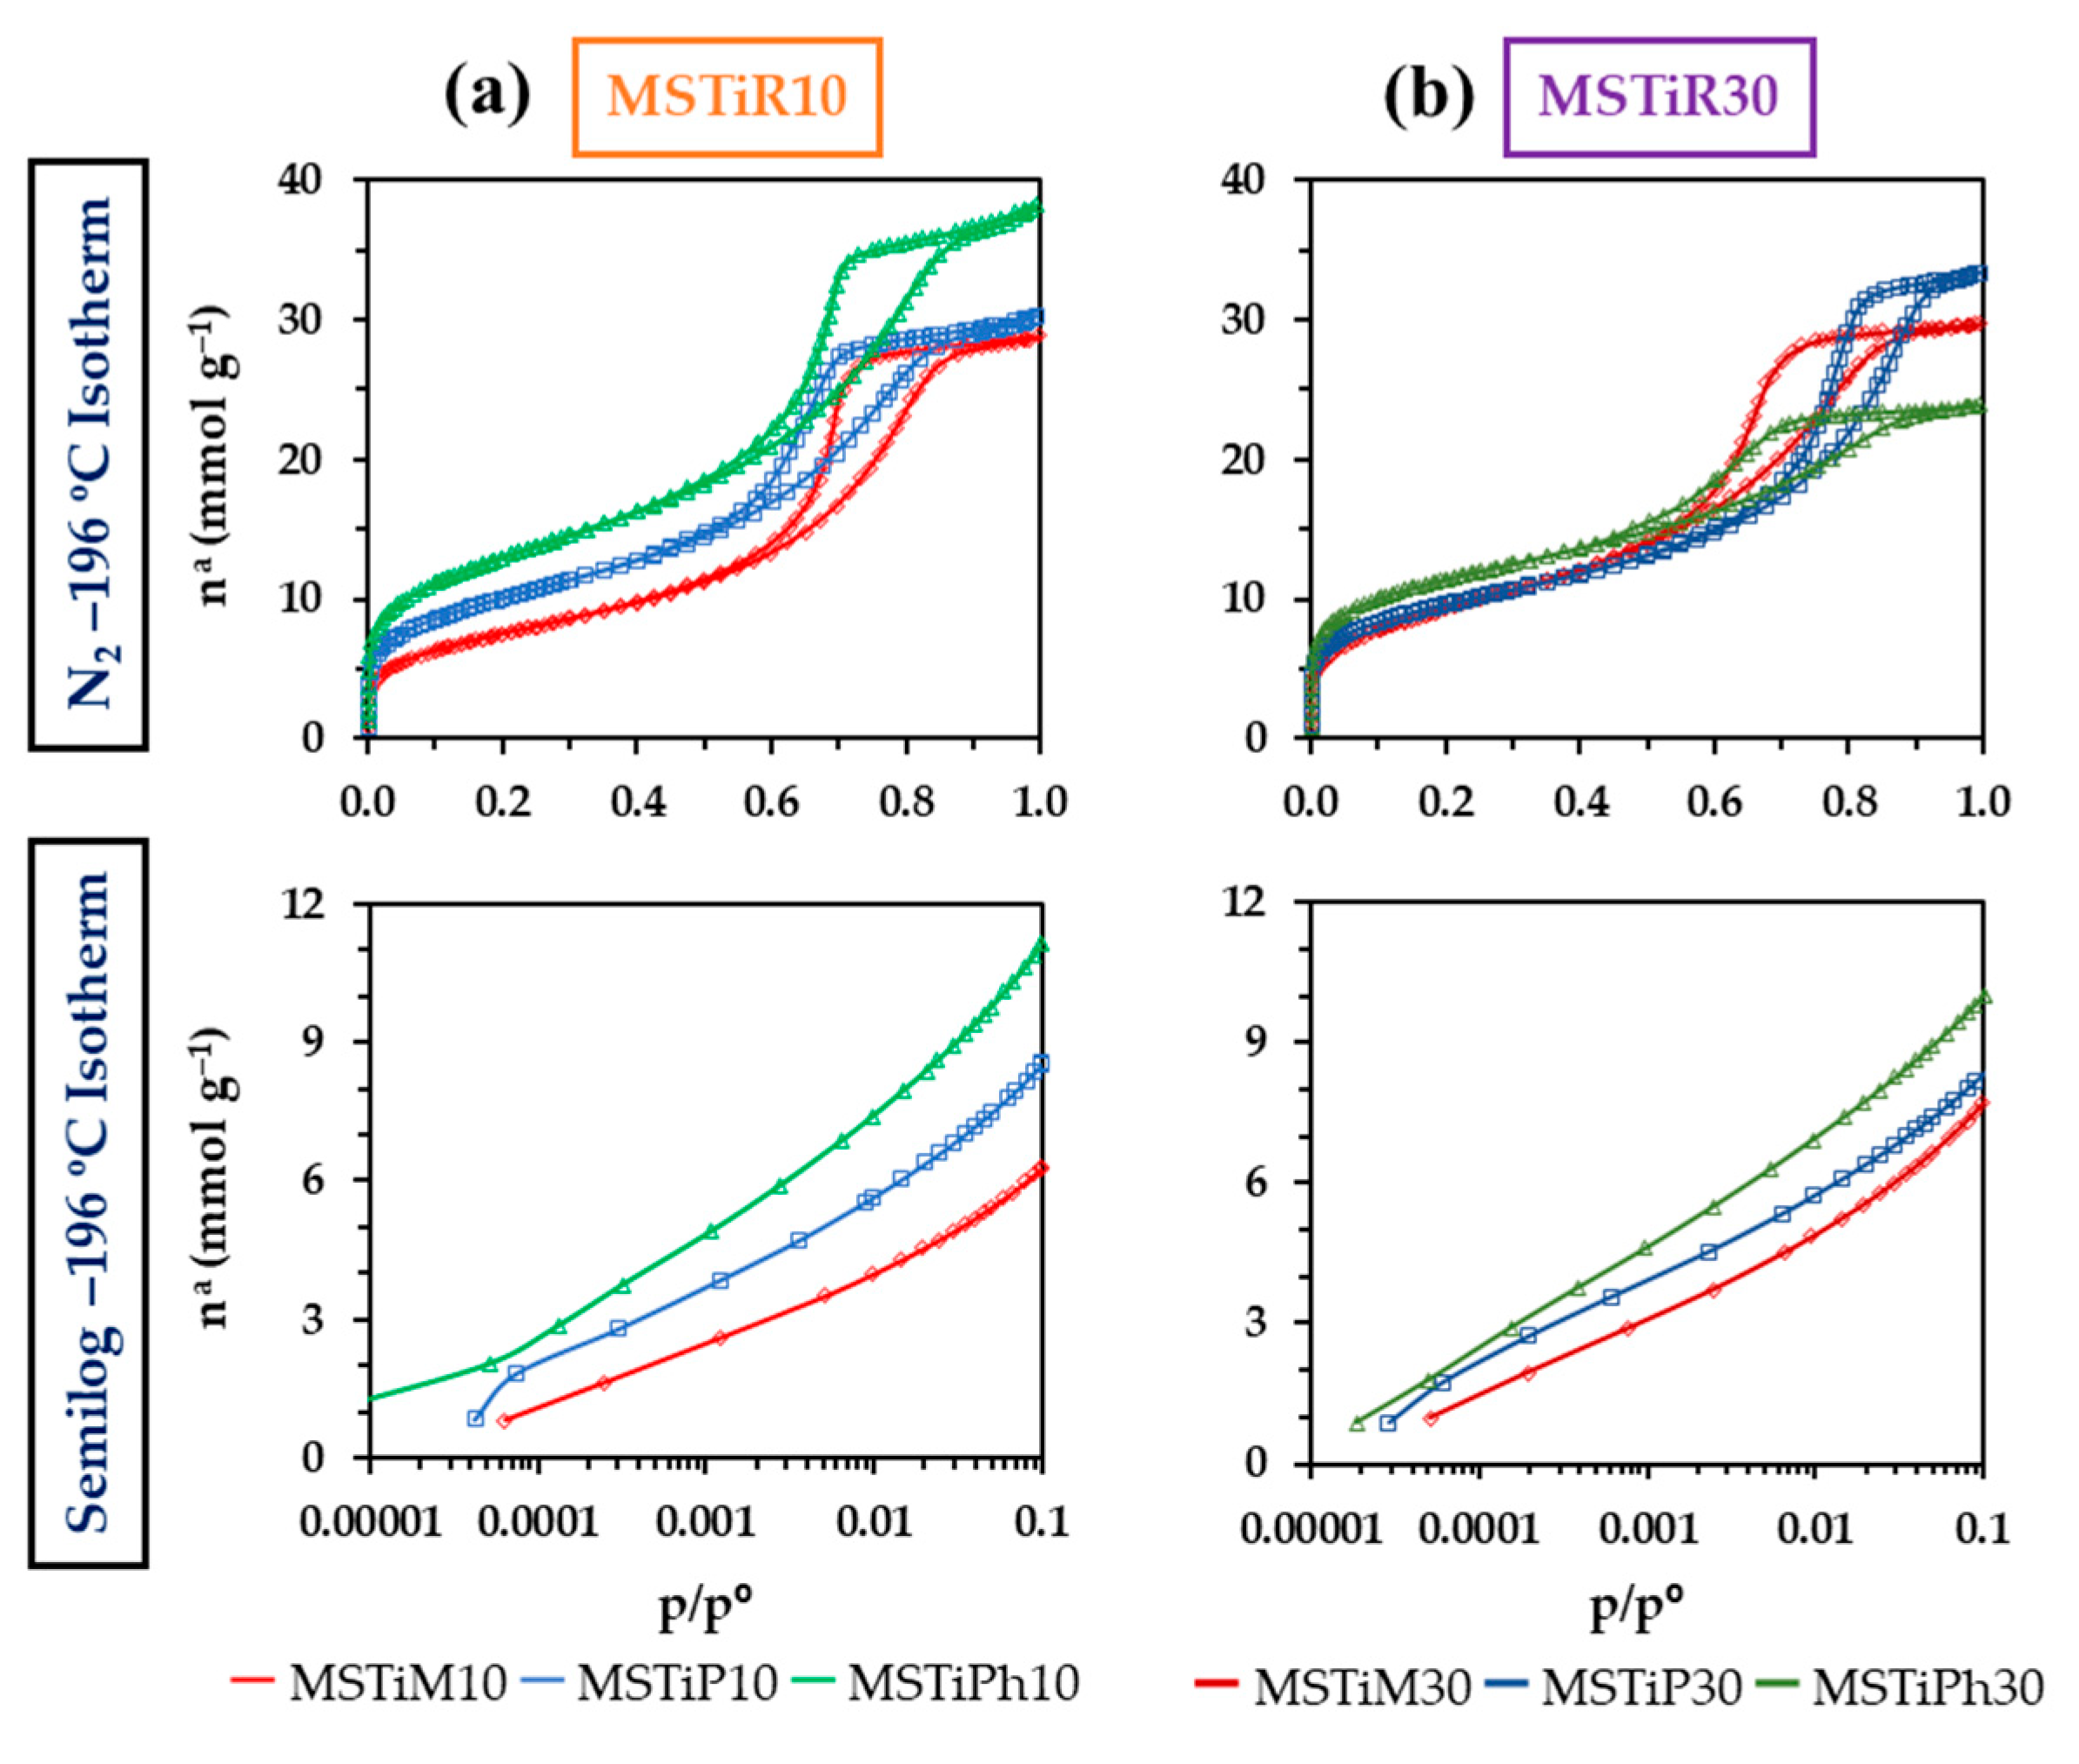
Figure 5 shows that the N2 adsorption capacity of the MSTiR10 materials can be ordered as MSTiPh10 > MSTiP10 and MSTiM10; however, this trend is not followed in the MSTiR30 materials where MSTiP30 adsorbed more N2 than MSTiPh30. Nevertheless, the isotherms in semilogarithmic scale of Figure 5 allow a clearer observation of the low partial pressures range (1×10⁻⁵ to 0.1), where it can be noted that for both MSTiR10 and MSTiR30 the MSTiPh% > MSTiP% > MSTiM% trend is followed. This indicate that the PhTEOS precursors induces the formation of a greater amount of micropores in the materials, while PTEOS promotes the formation of wider pores. The textural parameters obtained from the isotherm data and applying the BET. Dubinin-Raduskevich, and BJH models, are gathered in Table 5.
Table 5.
Textural parameters of the MSTiR% materials.
| Material | aBET | aDR | Vmicroa | Vmesob | Vmacroc | Vtotald | BJH APSe | Ecf | |||
| (m2 g–1) | (cm3 g–1) | (nm) | (KJ mol–1) | ||||||||
| MSTiM10 | 608 | 668 | 0.24 | 0.60 | 0.14 | 0.98 | 6.83 | 12.19 | |||
| MSTiP10 | 810 | 902 | 0.32 | 0.59 | 0.11 | 1.02 | 6.12 | 12.88 | |||
| MSTiPh10 | 1047 | 1191 | 0.42 | 0.67 | 0.20 | 1.28 | 6.31 | 12.57 | |||
| MSTiM30 | 753 | 837 | 0.30 | 0.60 | 0.12 | 1.02 | 6.02 | 11.83 | |||
| MSTiP30 | 774 | 879 | 0.31 | 0.47 | 0.35 | 1.13 | 7.91 | 13.28 | |||
| MSTiPh30 | 921 | 1062 | 0.38 | 0.34 | 0.10 | 0.82 | 5.26 | 13.35 | |||
a–Micropore volume obtained from Dubinin-Raduskevich; b–Mesopore volume obtained subtracting the micro and macropore volume to total pore volume; c–Macropore volume obtained from 0.8 ≥ p/pº ≤ 0.95; d–Total Pore volume obtained from isotherm at p/pº = 0.95; e–BJH Average Pore Size obtained from desorption branch; f–Characteristic energy from Dubinin-Raduskevich.
As indicated by Table 5, in the MSTiR10 materials the precursors with bulkier organic moieties have yielded higher Specific Surface Area (aBET), volume of micropores (Vmicro) and total volume of pores (VTotal). The same trend is observed in the MSTiR30 materials, but if compared to the MSTiR10 materials: (a) MSTiM10 and MSTiM30 have similar textural parameters, this can be explained by the low steric hindrance exerted by the methyl groups, which apparently had a lower impact in the polymerization process and the consequent formation of the porous polymeric network during the hydrothermal synthesis; (b) MSTiP30 presents a lower aBET than MSTiP10 due to its lower volume of mesopores (Vmeso), but its VTotal is higher because of a greater proportion of macropores (Vmacro), explaining its bigger average pore size calculated by BJH method (BJH APS); and (c) all the textural parameters of MSTiPh30 are lower than MSTiPh10. Figure 6 depicts the DFT calculated pore size distribution (PSD) of the MSTiR% materials.
Figure 6.
DFT Pore Size Distribution (PSD) of the (a) MSTiR10 and (b) MSTiR30 materials in N2 adsorption isotherms at −196 °C.
Figure 6.
DFT Pore Size Distribution (PSD) of the (a) MSTiR10 and (b) MSTiR30 materials in N2 adsorption isotherms at −196 °C.
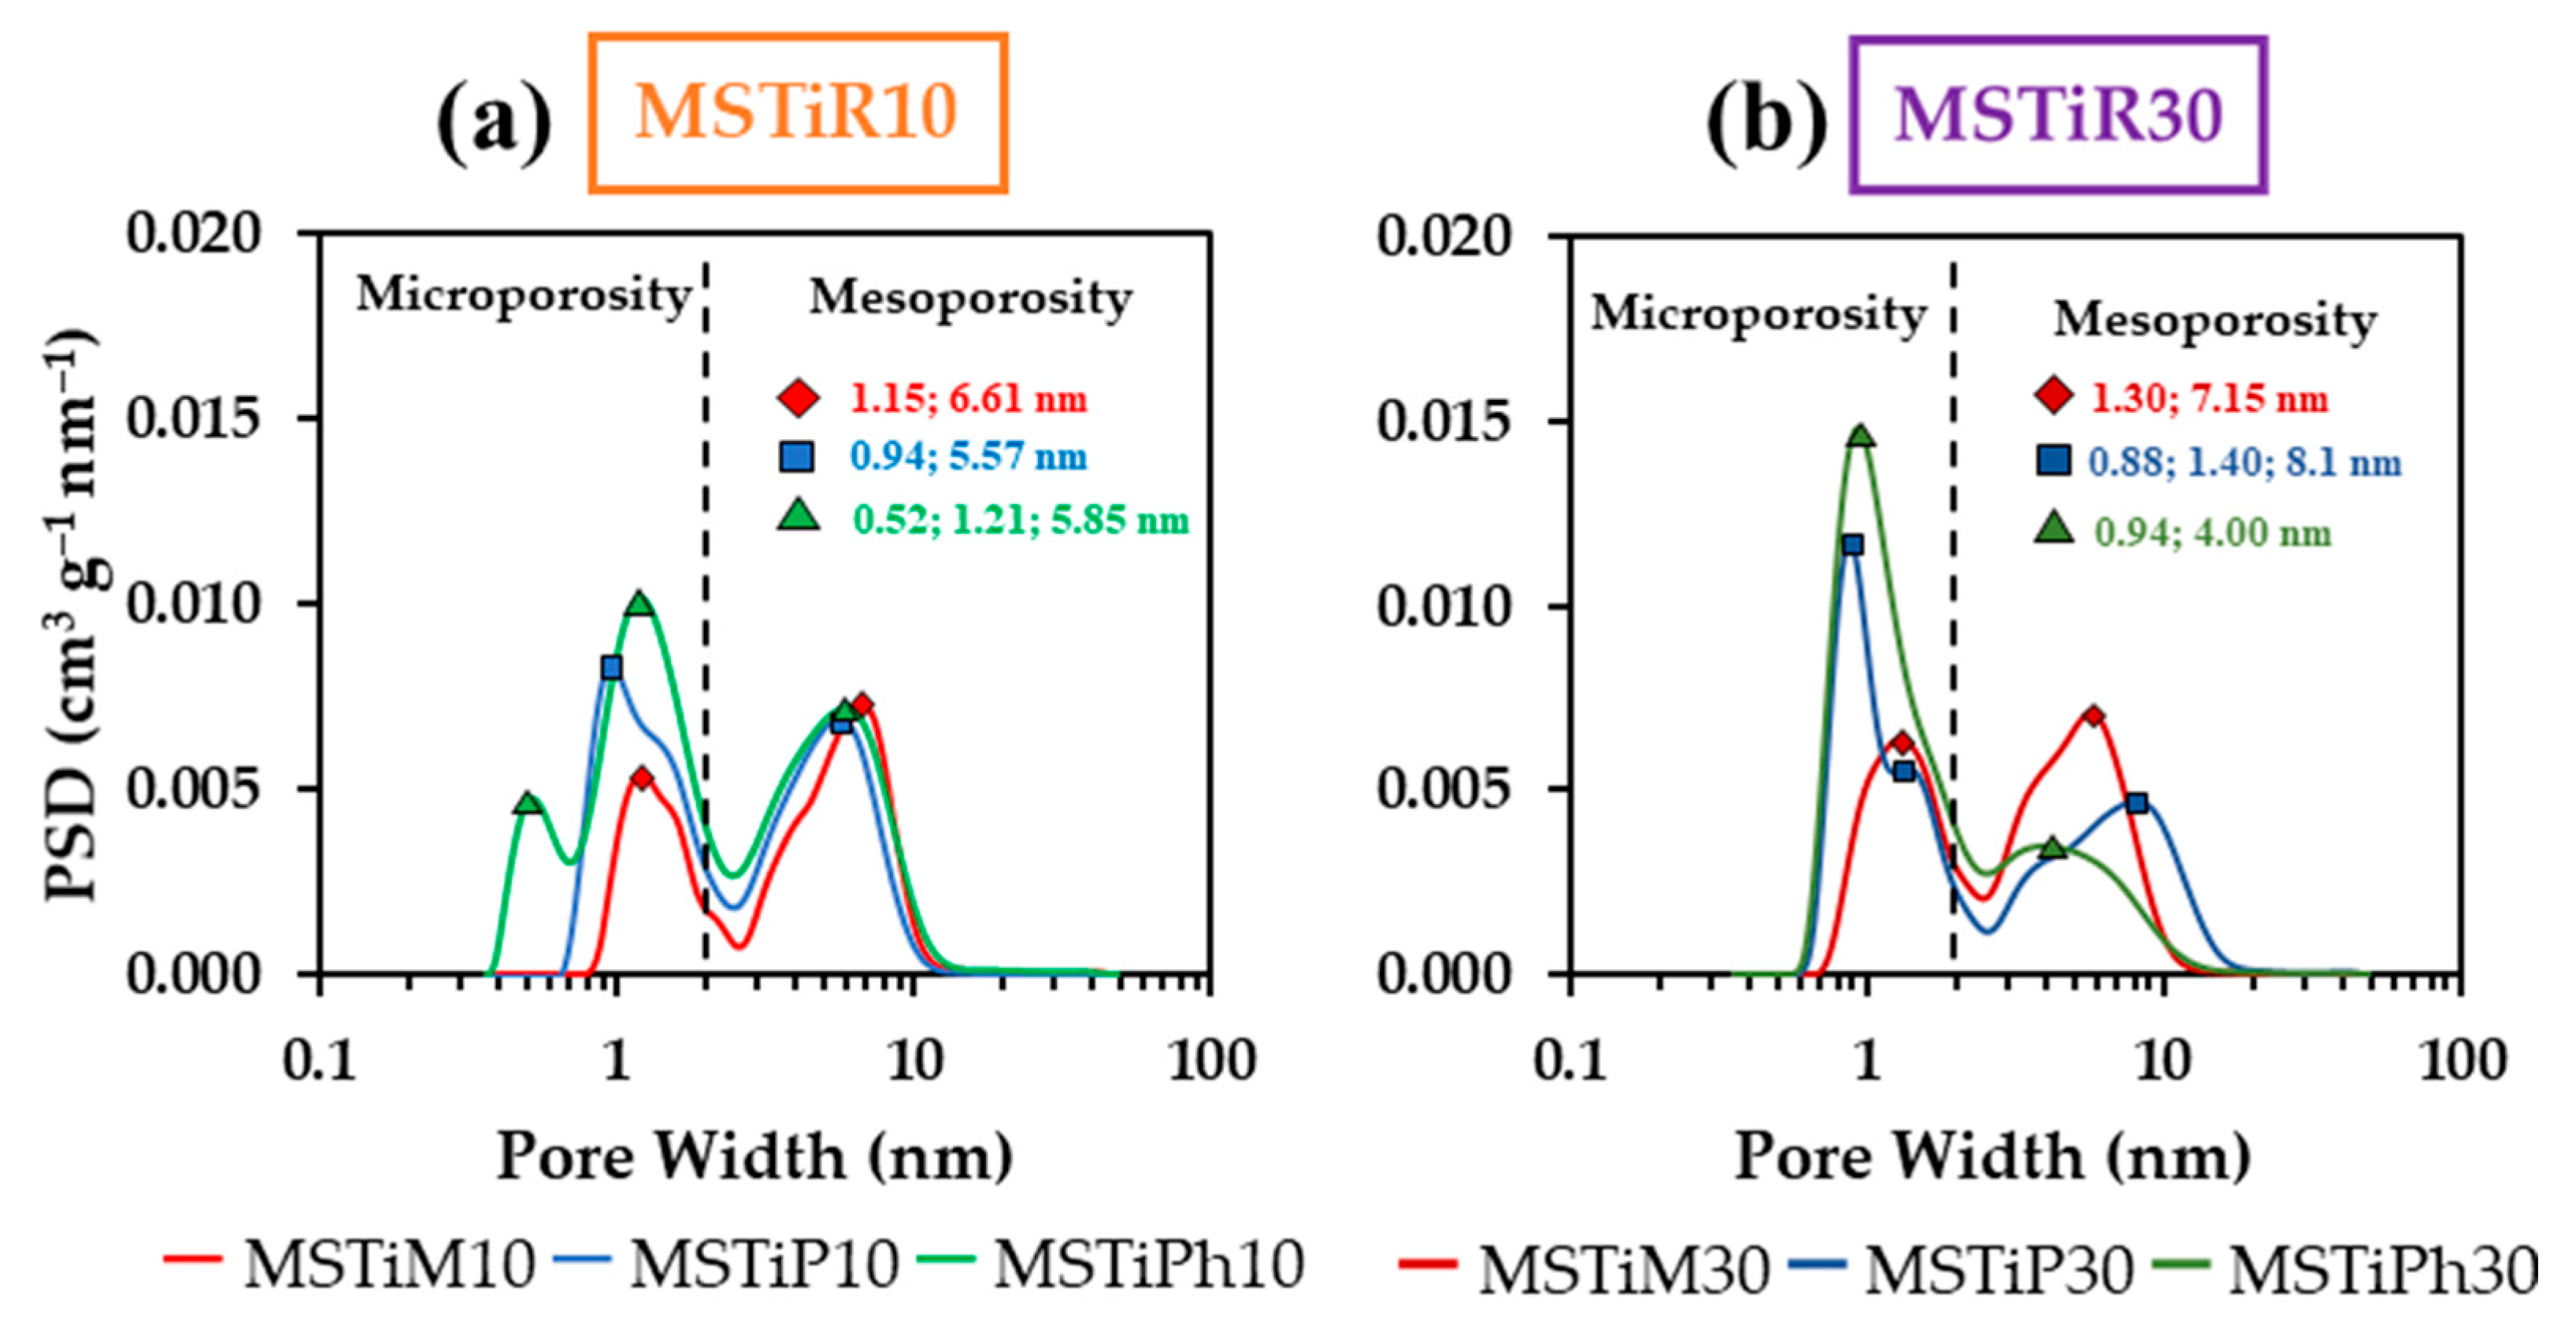
The PSDs in Figure 6 show the accumulated pore volume with respect to the pore width, where all samples present at least two maxima, one belonging to micropores at ~1 nm and another belonging to mesopores at 5–8 nm (MSTiPh10 and MSTiP30 present and additional maxima below 1 nm). When the molar percentage of RTEOS increased, the accumulated pore volume at ~1 nm increased while it decreased at 5–8 nm in the MSTiP% and MSTiPh% materials, confirming that the increment of RTEOS molar percentage results in more microporous materials. Nevertheless, it is worth to mention that in contrast to MSTiP% and MSTiPh% materials, the ones synthesised with MTEOS present a higher value of accumulated pore volume at 6–7 nm than at ~1 nm, remarking that these materials are the more mesoporous among the synthesised materials. Therefore, comparing the effect of the RTEOS precursors, it can be concluded that MTEOS favors the formation of mesopores, PTEOS induce the formation of macropores at higher molar percentages, and PhTEOS induces the formation of a higher proportion of micropores. Hence, contrary to the methyl groups of MTEOS, the steric effect of the propyl and phenyl groups of PTEOS and PhTEOS, respectively, hinders the formation of the porous polymeric network rendering less mesoporous materials. According to the observed in Table 2, the TiO2 crystallite Size (D(101)) is larger than the BJH’s average pore size (APS in Table 5) and the mesopore sizes observed in the PSD of the materials, demonstrating that the anatase particles could not have been formed within the pores of the materials and are instead supported on their surface. In fact, the analysis of the UV-vis spectra of the materials revealed that PTEOS is the precursor that most favor the formation of photoactive TiO2 nanoparticles, which can be related with PTEOS being the precursor that induces the formation of a higher proportion of macropores. Regarding the CBZ adsorption capacity of the materials, their por size distributions and BJH APS confirm that CBZ with its 0.37 Stokes radius would not present any steric restriction to access and diffuse through their wide–micropores and mesopores, thus its chemical affinity would be the key factor.
3.1.5. Field-Emission Scanning Electron Microscopy (FE-SEM)
Figure 7 shows the SEM micrographs taken from the MSTiR% materials using a × 1000 magnification (20 µm scale). Figure S5 shows the micrographs of the materials obtaining using a × 150 magnification (100 µm scale).
Figure 7.
SEM micrographs of the MSTiR% materials obtained using a x 1000 magnification.
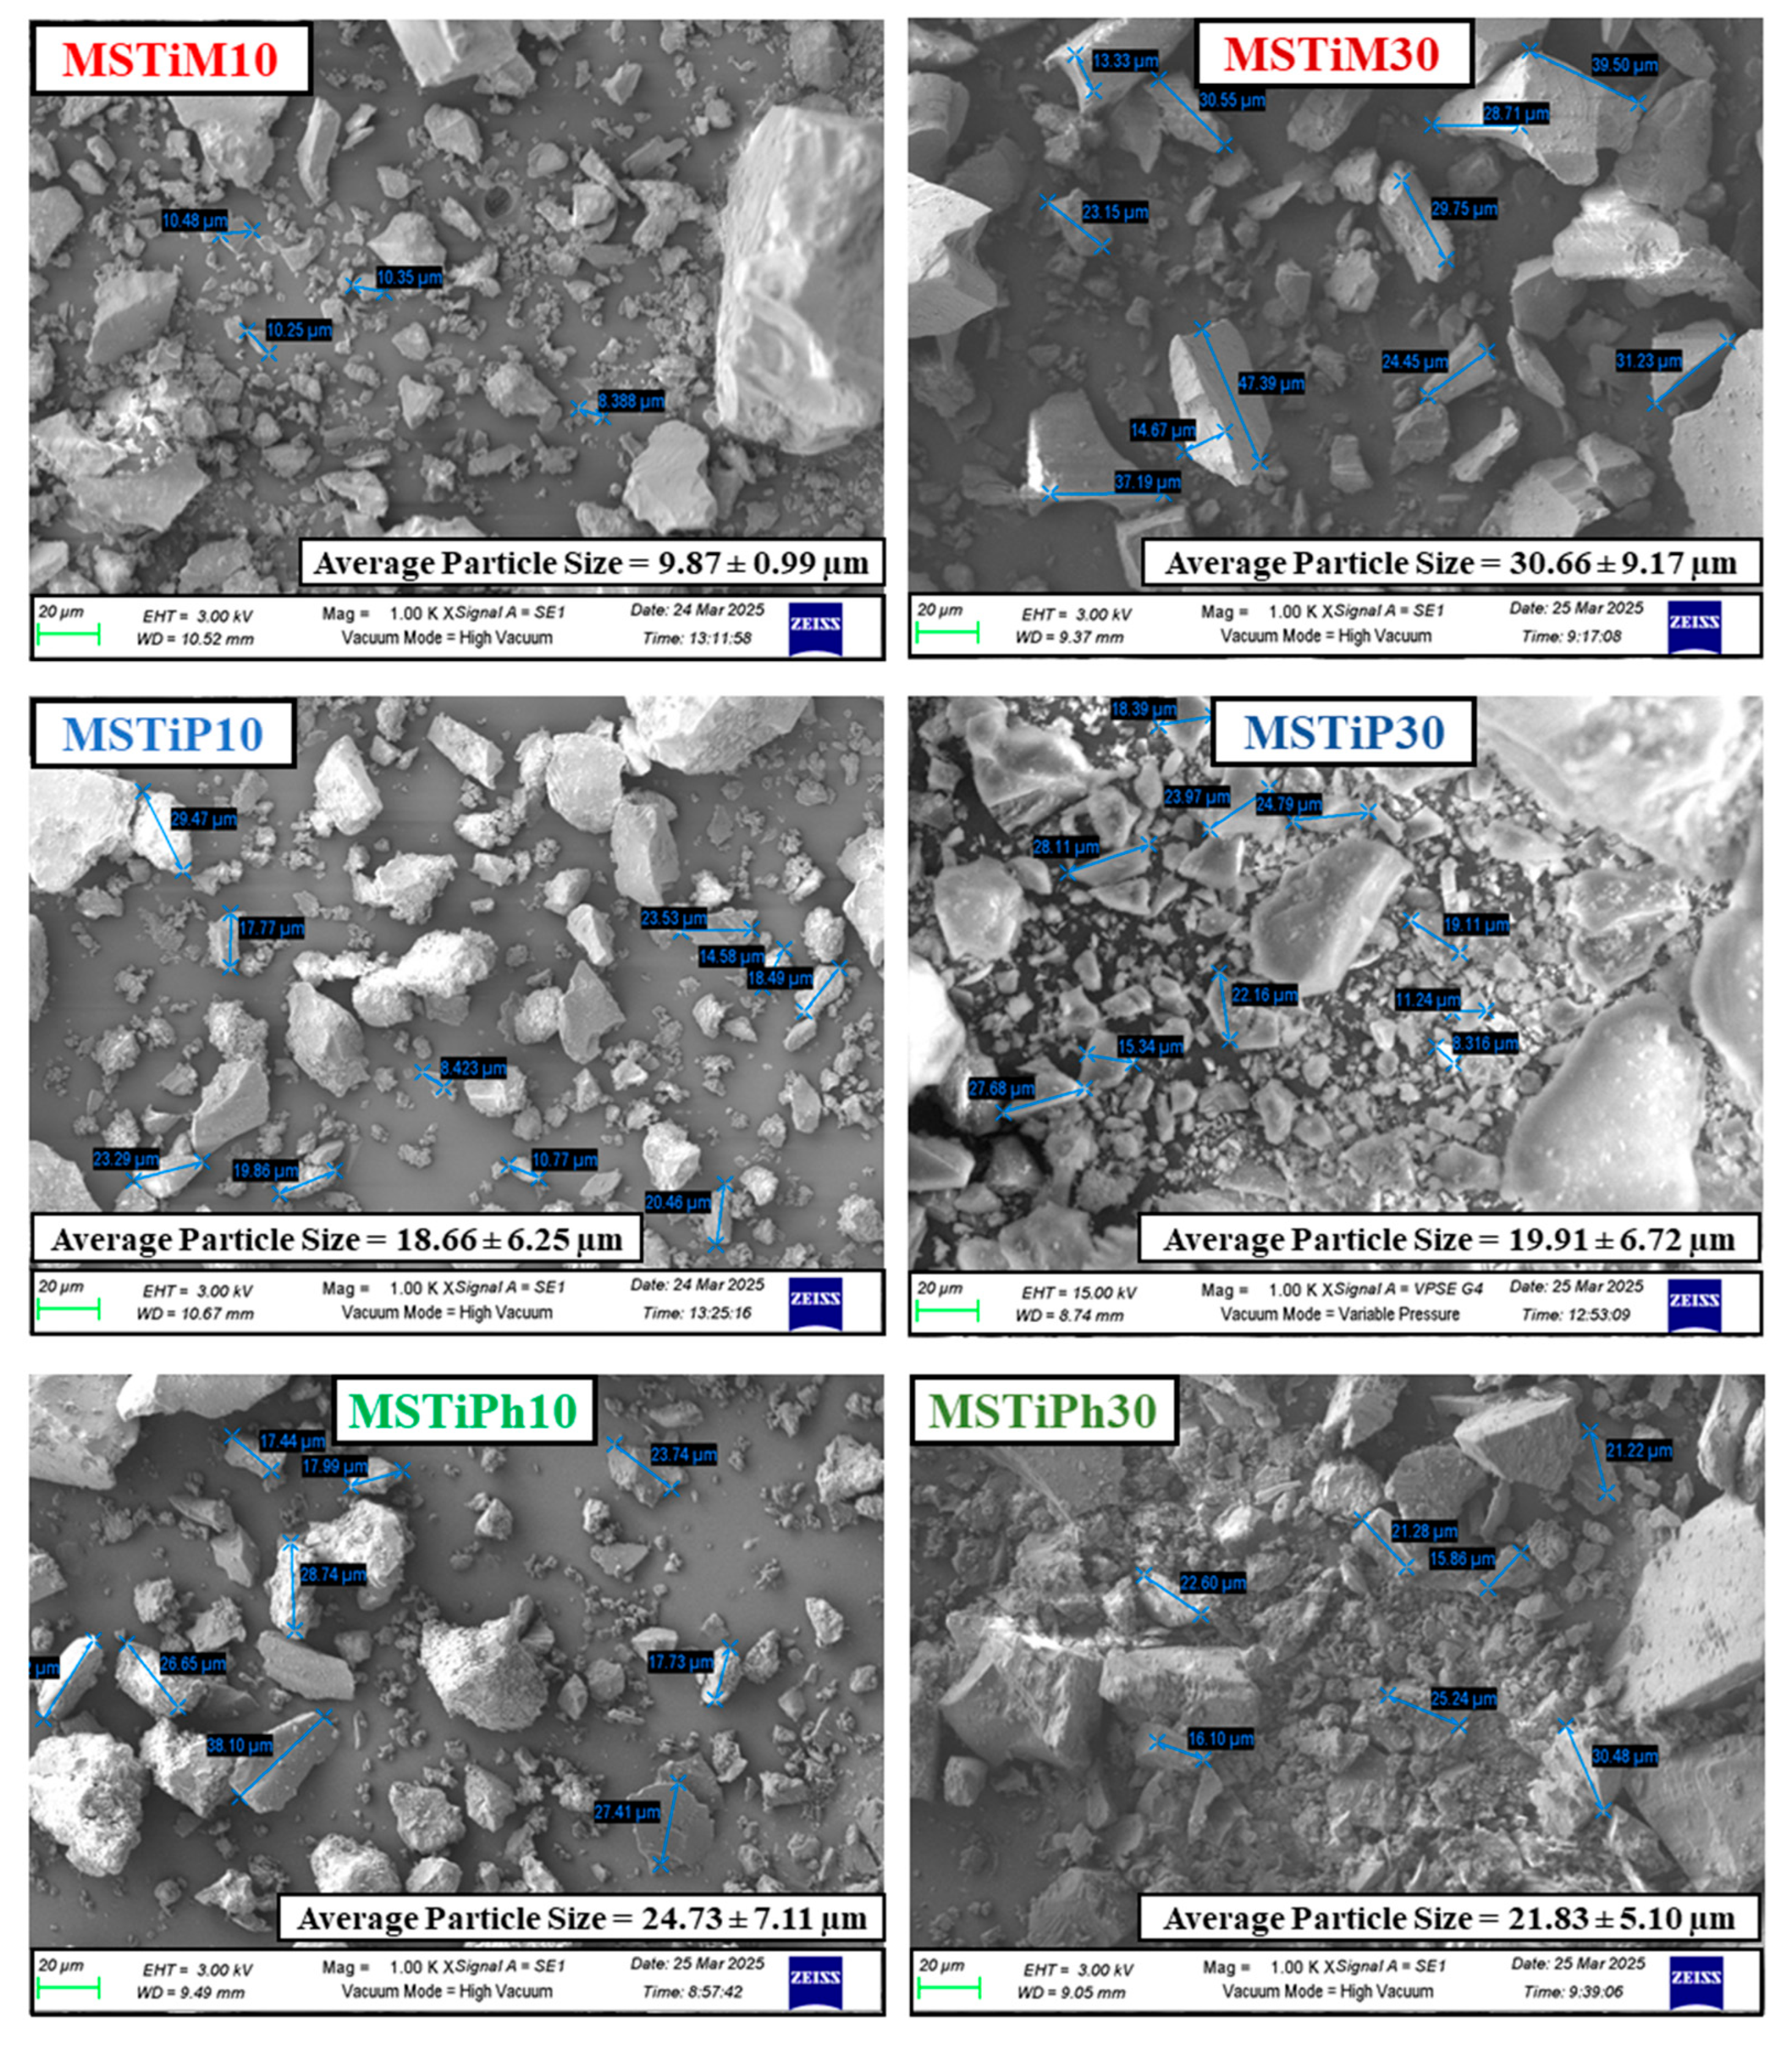
The micrographs of Figure 7 and Figure S5d that the MSTiR% materials are micromaterials since the particle size range in the figures is between 10 and 40 µm; and between 70 and 160 µm in Figure 7 and Figure S5, respectively. In addition, the particles do not present any predominant shape or characteristic, which demonstrates their amorphous nature. Table 6 shows the results of the X-ray energy dispersion mapping of the samples compositions, where the relative abundances of carbon, oxygen, silicon and titanium are estimated.
Table 6.
Average weight percentage and atomic abundance, estimated by EDX, of C, O, Si, and Ti in the bulk MSTiR% materials.
Table 6.
Average weight percentage and atomic abundance, estimated by EDX, of C, O, Si, and Ti in the bulk MSTiR% materials.
| MSTiR% | O | Si | Ti | ||||||
| Weight | Atomic | Weight | Atomic | Weight | Atomic | ||||
| (%) | (%) | (%) | |||||||
| MSTiM10 | 59.33 | 72.26 | 39.00 | 27.06 | 1.67 | 0.68 | |||
| MSTiP10 | 64.20 | 76.19 | 34.55 | 23.31 | 1.25 | 0.49 | |||
| MSTiPh10 | 61.52 | 74.01 | 37.02 | 25.40 | 1.47 | 0.59 | |||
| MSTiM30 | 62.73 | 74.91 | 36.33 | 24.72 | 0.94 | 0.37 | |||
| MSTiP30 | 60.01 | 72.64 | 39.25 | 27.07 | 0.73 | 0.29 | |||
| MSTiPh30 | 61.70 | 74.07 | 37.08 | 25.44 | 1.22 | 0.49 | |||
According to Table 6, the bulk MSTiR% materials contains a relative atomic abundance of titanium between 0.29 (MSTiP30) and 0.68 % (MSTiM10), which is a low proportion in agreement with the 96.86 silicon/titanium precursors molar relation used in the synthesis. As deduced from the UV-vis DR spectra of Figure 2, each of the MSTiR10 materials present a higher amount of titanium than its MSTiR30 counterpart, implying that the steric effect exerted by the organic moieties of the organosilanes may hinder their co-polymerization with TBOT and result in a lower proportion of anatase particles anchored to the silica surface. This is consistent with the fact that PTEOS produces materials with the lowest relative atomic abundance of titanium (0.49 and 0.29% for MSTiP10 and MSTiP30, respectively in Table 6) and the smallest average particle sizes (18.66 ± 6.25 and 19.91 ± 6.72 µm for MSTiP10 and MSTiP30, respectively in Figure 7), since the propyl moiety is more voluminous than the methyl or phenyl groups of MTEOS and PhTEOS, respectively. Furthermore, by comparing the relative atomic abundance of titanium in the surface of the materials (Table 3) with its bulk abundance (Table 6), it is evidenced that the MSTiR10 materials synthesised with PTEOS and PhTEOS have a significative higher proportion of surface titanium (0.23% vs 0.49% and 0.31% vs 0.59%, respectively) than the materials prepared with MTEOS (0.18% surface vs 0.68% bulk), which implies a higher proportion of photoactive amorphous hexa-coordinated species of titanium in their surface. Finally, is worth to mention that the relative titanium atomic abundance in MSTiPh10 (0.59%) is higher than of its analogue titanosilicalite (TSPh10, 0.33%) synthesised in a previous work using TPAOH as surfactant instead of TPABr [12], because the titanium in MSTiPh10 is entirely anchored on the mesoporous silica surface while in the titanosilicalite the inclusion of Ti+4 in the modernite framework inverted (MFI) network is hindered by the presence of the PhTEOS precursor.
3.2. Photocatalytic Degradation of CBZ in the Presence of MSTiR%
3.2.1. Evaluation of the Photocatalytic Activity of the MSTiR% Materials
The photoactivity of the MSRTiR% materials were tested in the photodegradation of 1 ppm aqueous solution of CBZ under irradiation using a 275 nm LEDs system during 2 h (Figure 8). Before irradiation, the materials were introduced in the CBZ solutions and stirred magnetically during 1 h in the dark to determine whether CBZ was removed by adsorption. No difference in pH was observed before and after the irradiation, remaining equal to that of the ultrapure water (pH = 6).
Figure 8.
(a) Degradation curves of 1 ppm of CBZ using a dose of 0.5 g L–1 of MSTiR% materials and irradiating 2 h with 275 nm LEDs, and (b) First-order kinetic adjustment of the degradation curves.
Figure 8.
(a) Degradation curves of 1 ppm of CBZ using a dose of 0.5 g L–1 of MSTiR% materials and irradiating 2 h with 275 nm LEDs, and (b) First-order kinetic adjustment of the degradation curves.
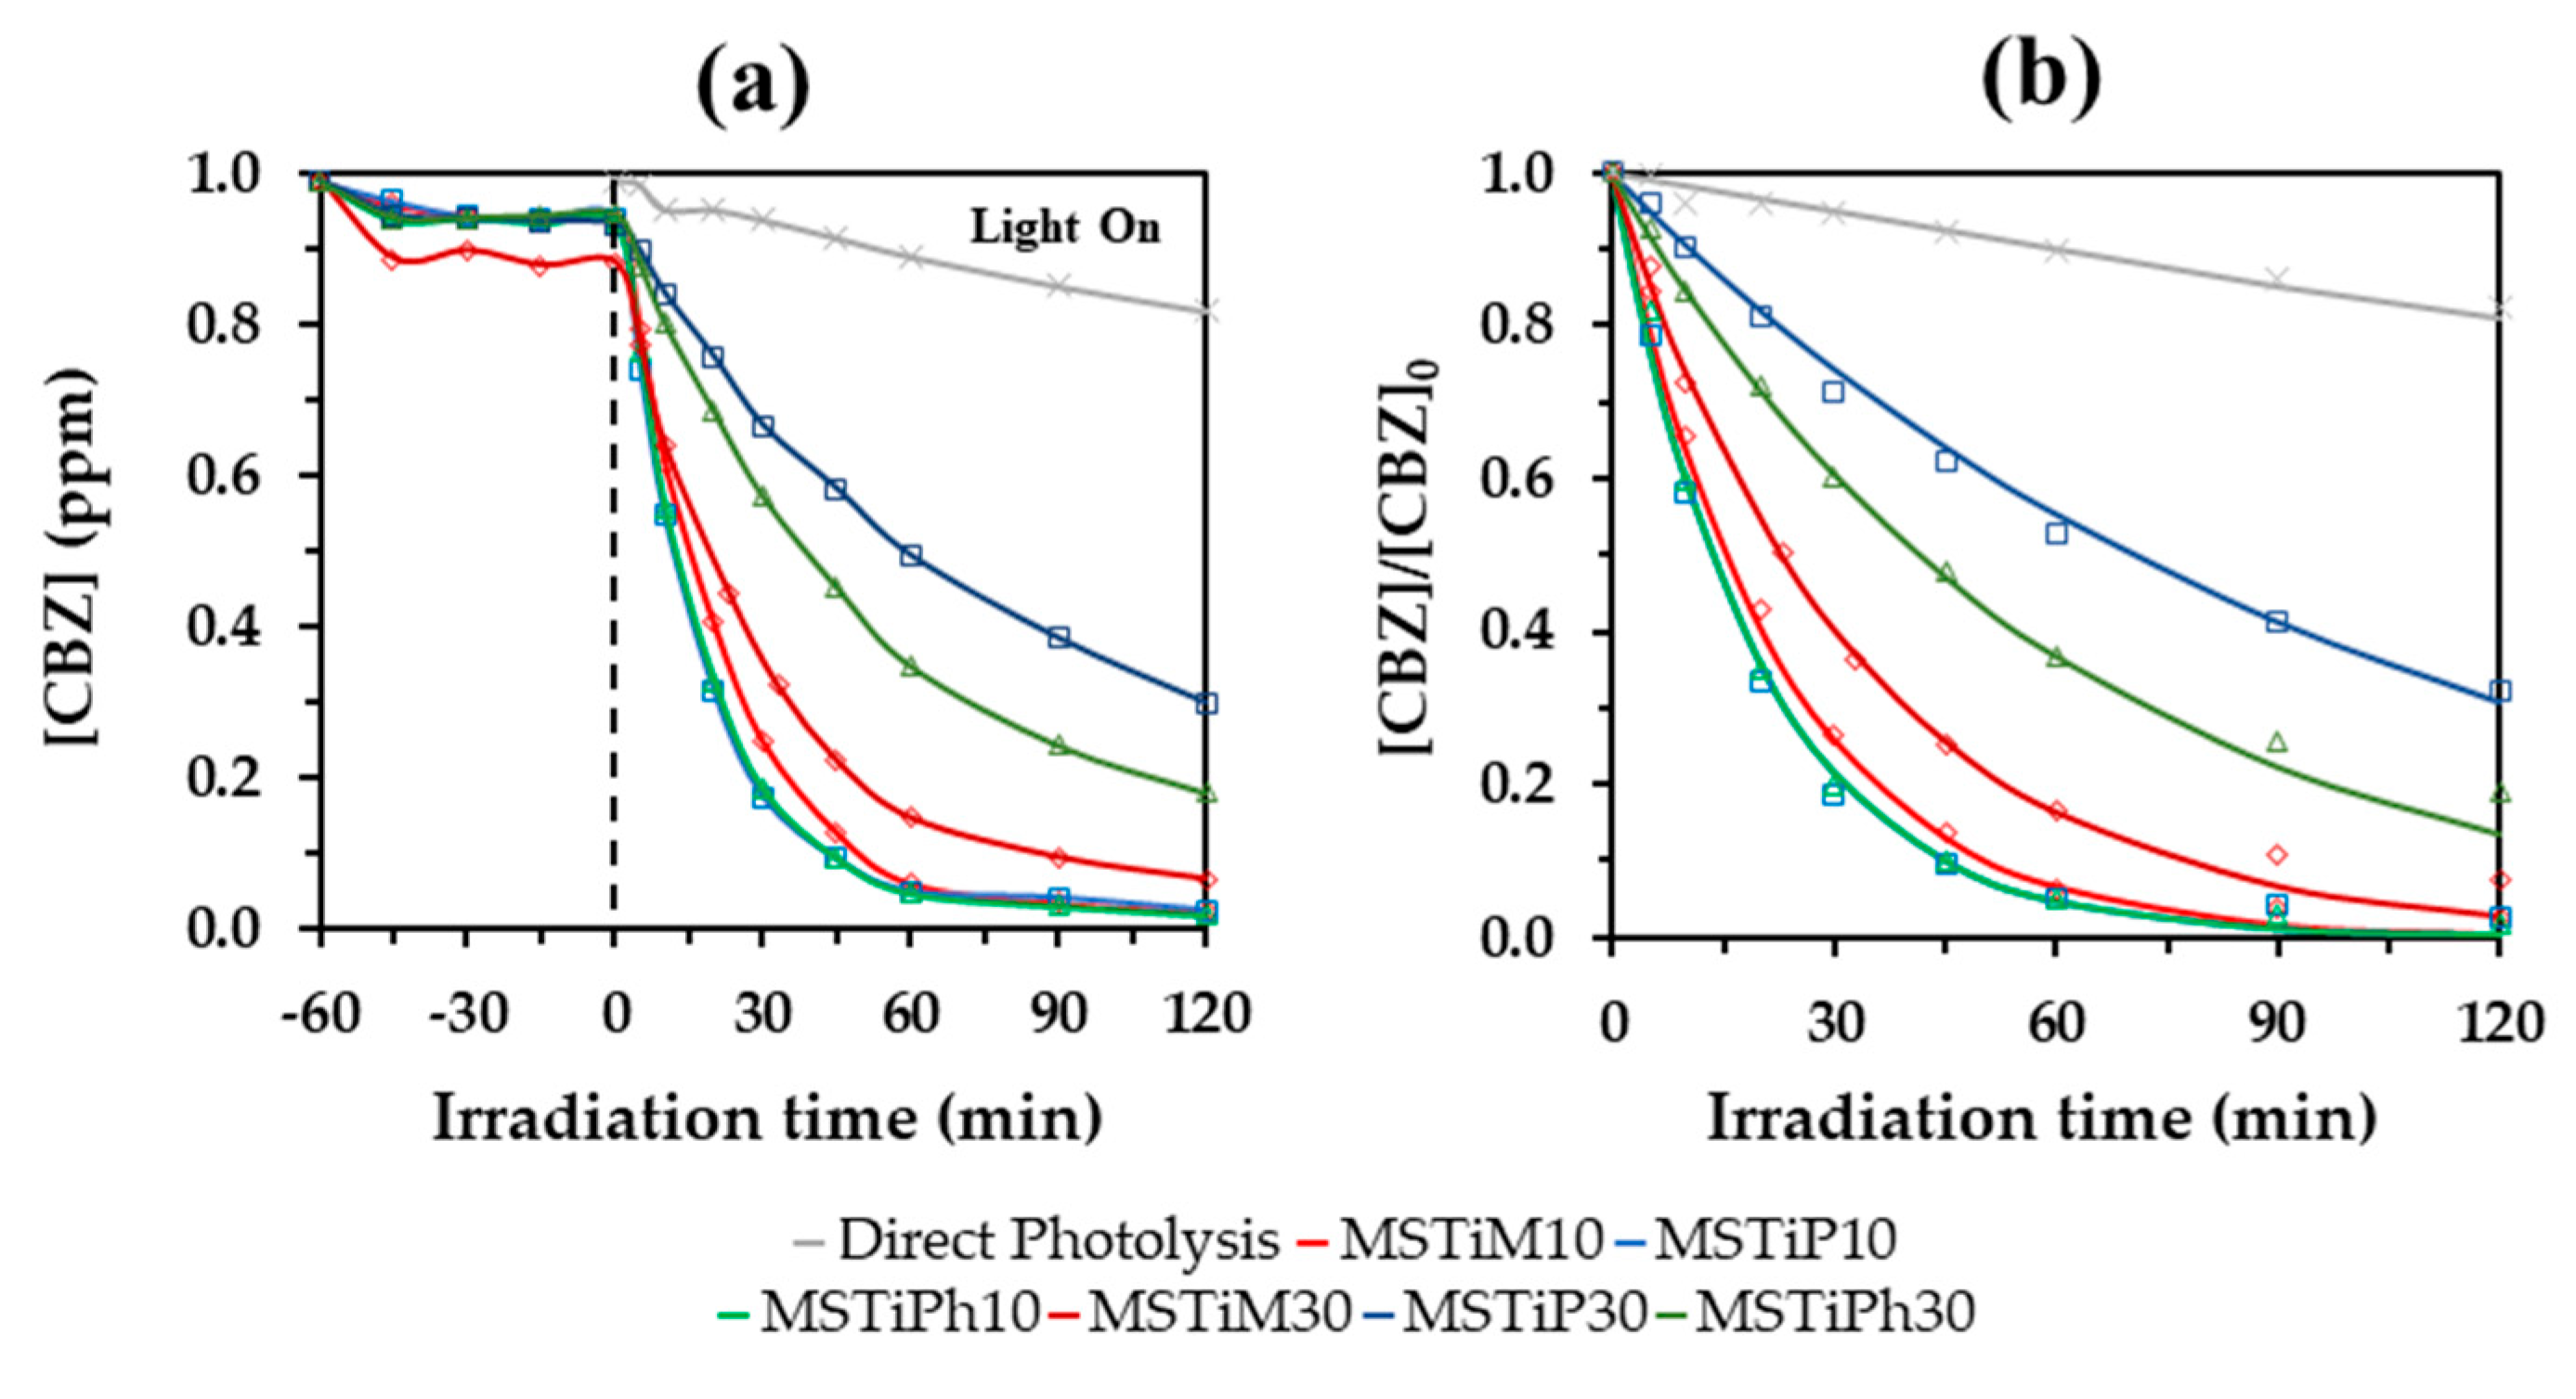
The degradation curves in Figure 8 show that although MSTiM30 adsorbed 11% of CBZ, the rest of the materials barely adsorbed a ~5%, thus it can be stated that adsorption is not significative in the removal of CBZ. According to Hunter et al. 2012, in a polar solvent like water, CBZ forms weak dimers by aromatic interactions, exposing the amide groups to towards the solvent or to interaction with polar functional groups on the material surface [15]. Therefore, the low CBZ adsorption rate of MSTiR% materials may be due to the low affinity between the molecule and the chemistry of the materials surface, since due to the calcination, lacks Si–OH groups that can interact or stablish hydrogen bonding with the amide group of CBZ.
Regarding the photodegradation, direct photolysis achieved a 13% of CBZ removal after 2 h of irradiation, indicating that this compound is quite persistent. MSTiR10 materials yielded almost identical removal rates (~92,5%), while the three MSTiR30 materials yielded lower rates: 81.41%; 76.51%; and 61.78% for MSTiM30; MSTiP30; and MSTiPh30, respectively. This was to be expected, since the characterization results indicated that MSTiR10 materials possess a higher amount of crystalline TiO2 nanoparticles and a higher volume of mesopores than their MSTiR30 counterparts.
3.2.2. Influence of the MSTiR% Dose
To determine which among the MSTiR10 materials yields the best photocatalytic performance, the effect of the catalysis dose was explored using 0.25; 0.5 and 0.75 g L–1. Figure 9 shows the First-order kinetic adjustment of the degradation curves obtained using different MSTiR10 catalyst doses, and Table 7 indicates the amount of CBZ removed, the calculated apparent First-order kinetic constant (Kapp) and Half-life (t1/2) for each MSTiR% material.
Figure 9.
First-order kinetic adjustment of the degradation curves of: (a) MSTiM10; (b) MSTiP10; and (c) MSTiPh10.
Figure 9.
First-order kinetic adjustment of the degradation curves of: (a) MSTiM10; (b) MSTiP10; and (c) MSTiPh10.
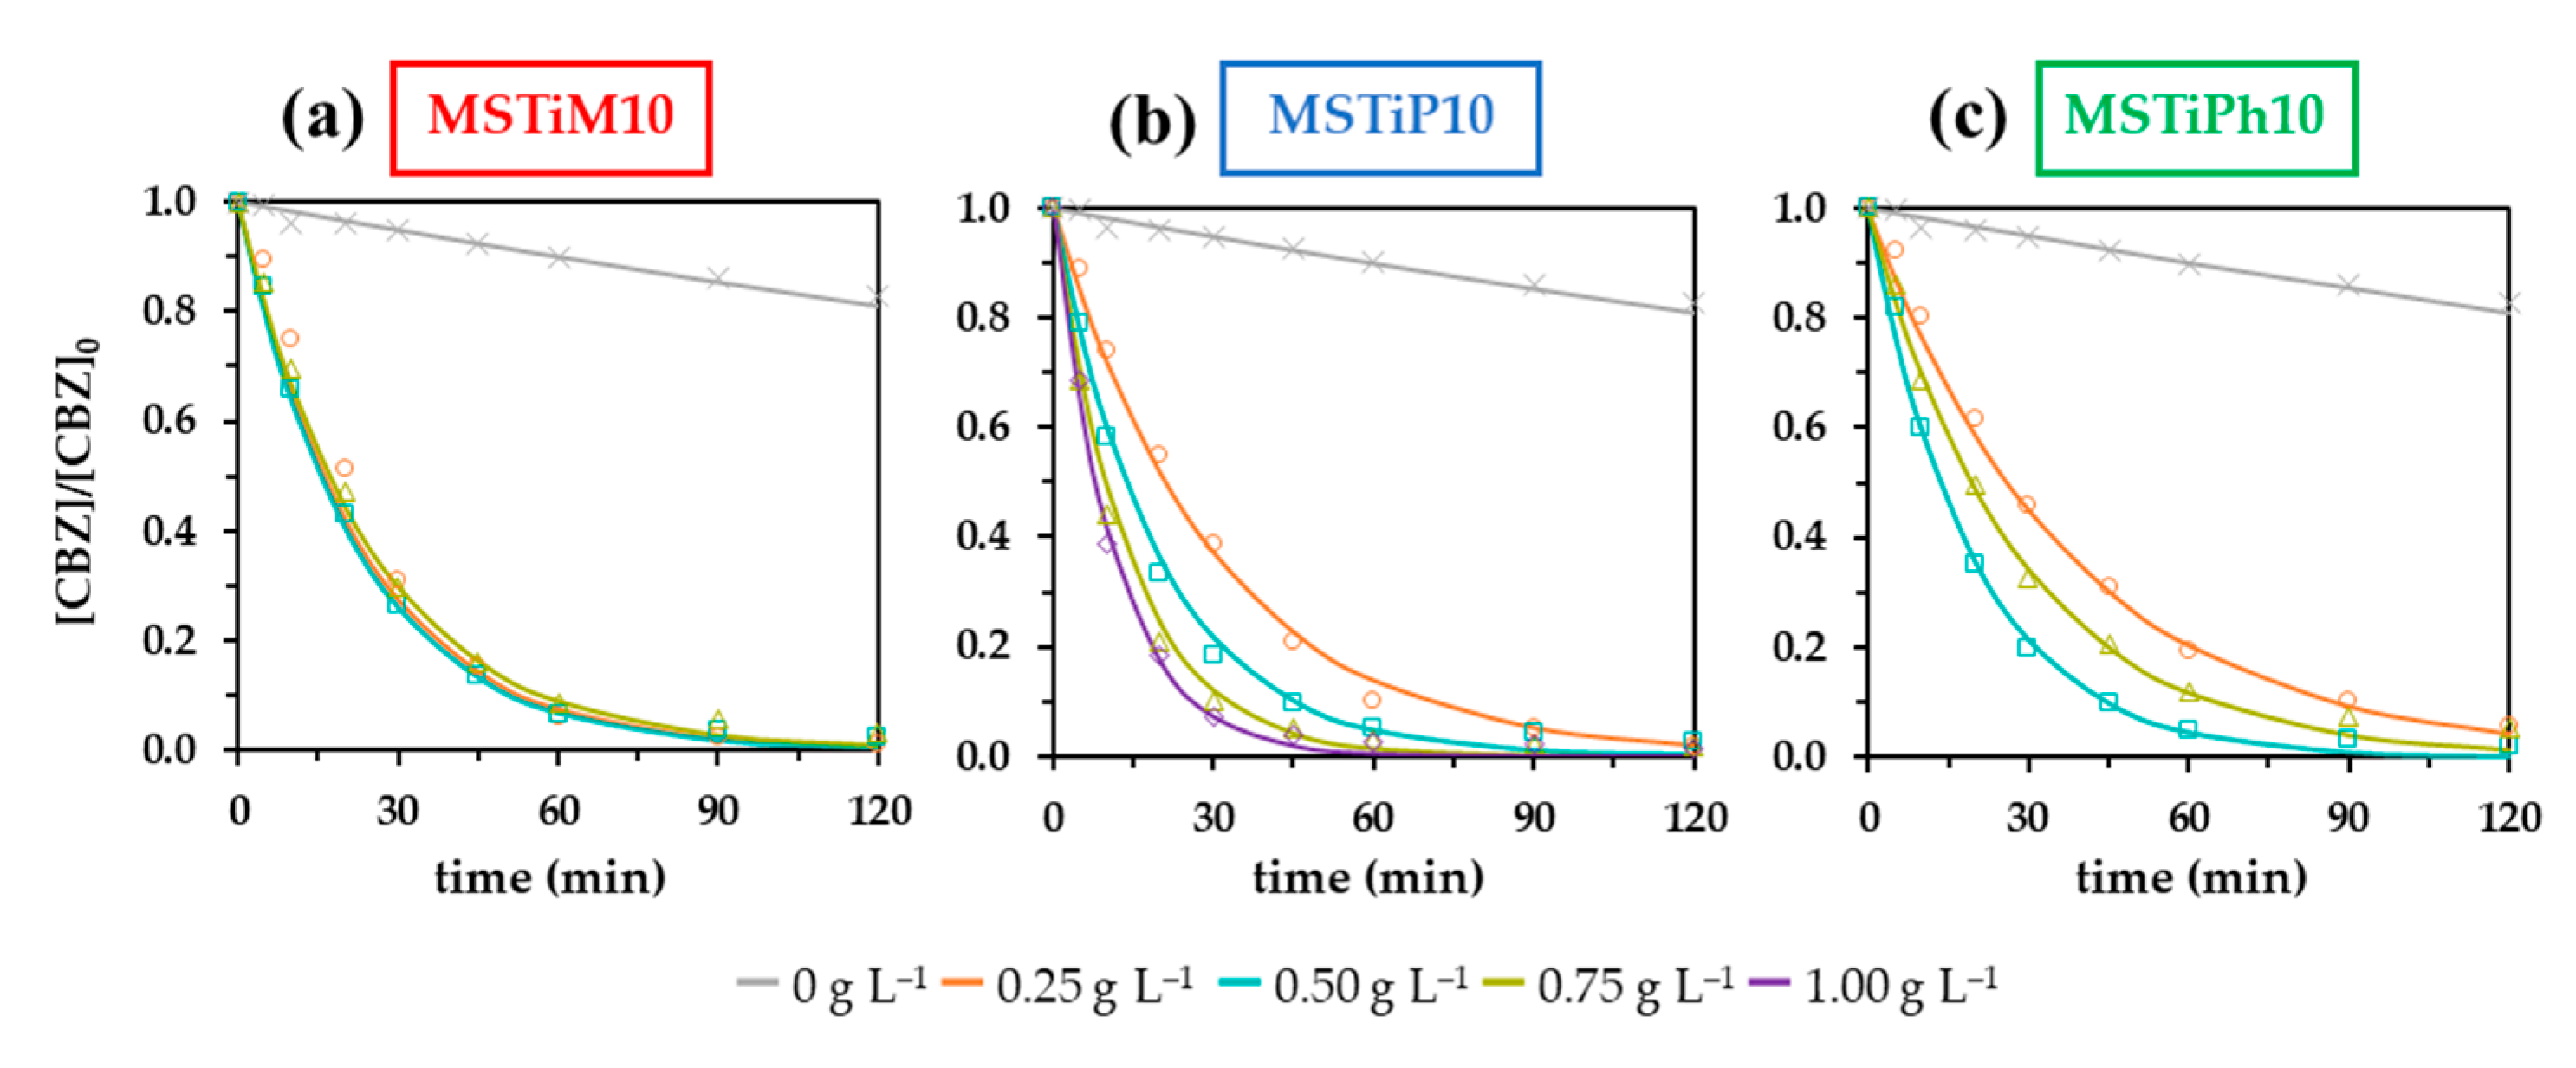
Table 7.
Removal of CBZ, First-order kinetic constant (Kapp), and half-life (t1/2) for each catalyst dose of the MSTiR% materials.
Table 7.
Removal of CBZ, First-order kinetic constant (Kapp), and half-life (t1/2) for each catalyst dose of the MSTiR% materials.
| MSTiR% | MSTiR% | CBZ Removal | First-Order Kinetic Adjustment | |||||
| Dose | Adsorbeda | Degradedb | Total | kappc | t1/2d | R2 | ||
| (g L–1) | (%) | (min–1) | (min) | |||||
| None | 0.00 | - | 17.36 | 17.36 | 0.0018 | 391.28 | 0.9958 | |
| MSTiM10 | 0.25 | 1.78 | 96.92 | 98.70 | 0.0430 | 16.12 | 0.9812 | |
| 0.50 | 5.00 | 92.58 | 97.58 | 0.0448 | 15.46 | 0.9984 | ||
| 0.75 | 6.47 | 90.19 | 96.66 | 0.0404 | 17.14 | 0.9985 | ||
| MSTiP10 | 0.25 | 0.00 | 97.92 | 97.92 | 0.0331 | 20.92 | 0.9912 | |
| 0.50 | 4.91 | 92.50 | 97.41 | 0.0512 | 13.54 | 0.9939 | ||
| 0.75 | 6.49 | 91.70 | 98.19 | 0.0707 | 9.80 | 0.9844 | ||
| 1.00 | 7.73 | 90.85 | 98.58 | 0.0877 | 7.90 | 0.9972 | ||
| MSTiPh10 | 0.25 | 1.78 | 92.63 | 94.41 | 0.0265 | 26.11 | 0.9948 | |
| 0.50 | 5.70 | 92.48 | 98.18 | 0.0511 | 13.57 | 0.9980 | ||
| 0.75 | 8.32 | 86.40 | 94.72 | 0.0356 | 19.48 | 0.9988 | ||
| MSTiM30 | 0.50 | 10.97 | 81.41 | 92.38 | 0.0302 | 22.95 | 0.9993 | |
| MSTiP30 | 0.50 | 5.85 | 61.78 | 67.63 | 0.0099 | 70.32 | 0.9947 | |
| MSTiPh30 | 0.50 | 4.24 | 76.51 | 80.75 | 0.0166 | 35.53 | 0.9997 | |
| a–Percentage of CBZ adsorbed after 60 min at dark; b–Percentage of CBZ degraded after 120 min of irradiation; c–Apparent First-order kinetic constant; d–Half-life calculated from kapp. | ||||||||
Figure 9 and Table 7 illustrates that the performance of the MSTiM10 material is practically independent of the catalyst dose, while when MSTiP10 was used the Kapp increased steadily with the dose even with 1 g L–1. On the other hand, the performance of the MSTiPh10 catalyst was more inconsistent, since the degradation rate increased with the catalyst dose from 0.25 to 0.5g L–1, but then decreased when a dose of 0.75 g L–1 was used, probably due to the dispersion of a significative percentage of the incident irradiation by the particles of the catalyst (screening effect). Hence, MSTiP10 despite having the lowest amount of titanium among the MSTiR10 materials (Table 6), yielded the best performance in the photodegradation of CBZ, seemingly due to its higher crystallinity and smaller particles size.
3.2.3. Influence of the Initial pH
The influence of the initial pH on the photodegradation of CBZ was also evaluated. Figure 10 depicts the first-order kinetic adjustment of the degradation curves obtained using 0.5 g L–1 of MSTiM10 and pH 3.2, 6 and 9.5.
Figure 10.
First-order kinetic adjustment of the degradation curves obtained using 0.5 g L–1 of MSTiM10 at pH 3.2, 6.0 and 9.5.
Figure 10.
First-order kinetic adjustment of the degradation curves obtained using 0.5 g L–1 of MSTiM10 at pH 3.2, 6.0 and 9.5.
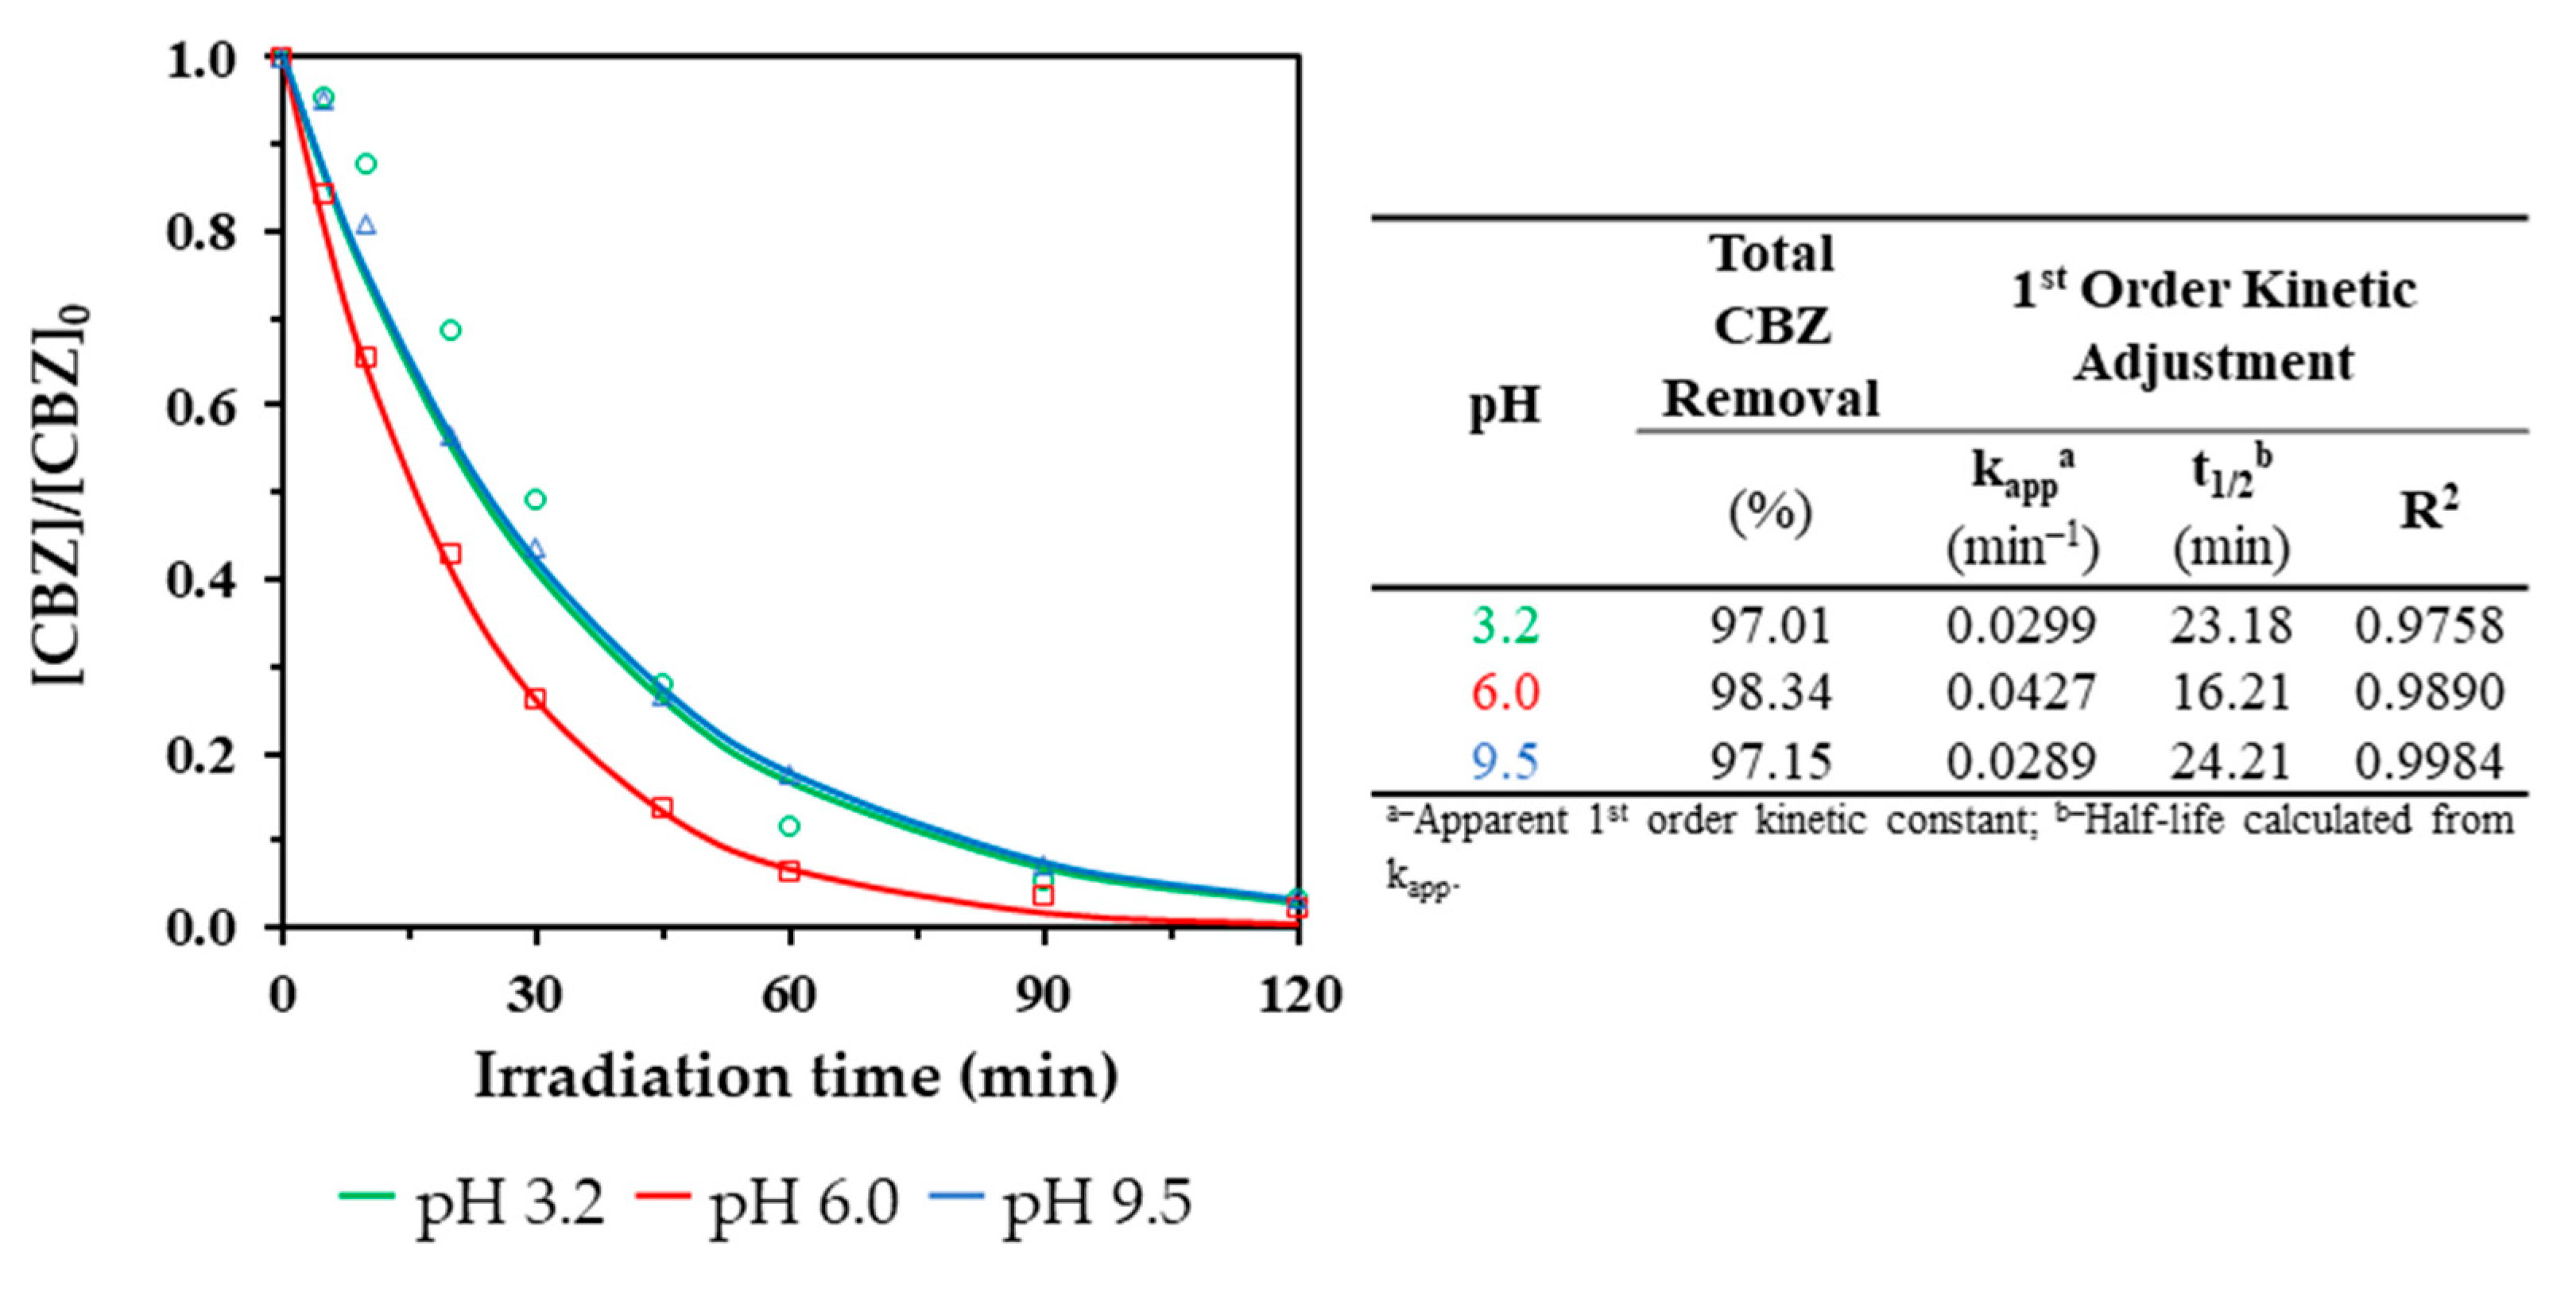
The table included in Figure 10 indicates that the photocatalytic degradation of CBZ in acid and basic pH yields lower performances compared to the non-controlled pH reaction (pH 6.0), being the Kapp calculated from the reaction at pH = 3.2 practically identical than the calculated from the reaction at pH = 9.5 (0.0299 and 0.0289 min–1, respectively). At basic pH the lower degradation rates may be explained by the hydroxyl anions reacting with hydroxyl radicals to produce an oxide radical anion (O•–) and a water molecule [31], which results in a lower amount of OH• available to degrade CBZ. The results obtained at acid pH may be explained by H2O2. The presence of this molecule in the medium is ephemeral since although is usually generated by the combination of two HO• [31], it is split into two HO• radicals by the incident UVC irradiation, maintaining the contribution of HO• radicals for the degradation of CBZ. Nevertheless, in an acidic medium H+ can react with the H2O2 yielding two water molecules and therefore reducing the amount of OH• that degrades CBZ.
3.2.4. Identification and Evolution of CBZ and Its Transformation Products (TPs)
The identification of the CBZ transformation products (TPS) was carried analyzing aliquots from the photodegradation experiments, collected at t = 0, 30, 60 and 90 min of the photoperiod, in a LC-QTOF equipment. The aliquots were subtracted from the photodegradation experiments of 1 mg L–1 of CBZ performed using 0.5 g L–1 of MSTiM10 and three different pH (3.2, 6.0 and 9.5). Table 8 lists the twelve tentatively identified TPs in the analysed water samples.
Table 8.
Tentative assignation of the transformation products of CBZ analyzed by LC-QTOF with their detected mass/charge (m/z) and retention times (tr).
Table 8.
Tentative assignation of the transformation products of CBZ analyzed by LC-QTOF with their detected mass/charge (m/z) and retention times (tr).
| Compound | Name | Molecular formula | m/z |
tr (min) |
| CBZ | Carbamazepine | C15H12N2O | 237.1021 | 4.47 |
| TP-1 | CBZ-10,11-epoxide | C15H12N2O2 | 253.0969 – 253.0972 | 3.58 – 4.08 |
| TP-2 | 2-hydroxy-CBZ | |||
| TP-3 | 3-hydroxy-CBZ | |||
| TP-4 | Oxcarbazepine | |||
| TP-5 | Hydroxylation of oxcarbazepine | C15H12N2O3 | 269.0922 – 269.0924 | 3.36 – 3.80 |
| TP-6 | Hydroxylated derivative of N-amino-carbonylacridine-9-carboxaldehyde | |||
| TP-7 | Derivatives 10,11-dihydrodiol-CBZ | C15H14N2O3 | 271.1077 – 271.1079 | 3.03 – 3.60 |
| TP-8 | ||||
| TP-9 | Trihydroxylated form of CBZ | C15H14N2O4 | 287.1027 | 3.66 |
| TP-10 | 11-keto oxcarbazepine | C15H10N2O3 | 267.0765 - 2670766 | 3.64 – 3.74 |
| TP-11 | Fragmentation of 1-(2-benzaldehyde)-(1H,3H)-quinazoline-2,4-dione | |||
| TP-12 | 1-(2-benzaldehyde)-4-hydro-(1H,3H)-quinazoline-2-one | C15H10N2O2 | 251.0821 | 2.29 |
The [M + H]+ peak at 4.47 min was identified as the CBZ compound (C15H12N2O) with a m/z of 237.1021. The identified TPs listed in Table 8 were studied based on their molecular formula. The detected CBZ TPs were tentatively identified and classified according to Martínez-Escudero et al. assignation, in which they employed LC-MS/MS to determine the fragment masses of each species and accurately identify the CBZ TPs generated during the degradation of 10 mg L−1 of CBZ using TiO2 as photocatalyst and UV LEDs as the irradiation source [32]. Peaks holding [M + H]+ with m/z between 269.0922 – 269.0924 for the calculated elemental composition C15H12N2O3 were found between 3.36 – 3.80 min. The suggested elemental formula might correspond to a hydroxylated derivative of N-amino-carbonylacridine-9-carboxaldehyde (TP-6), and to the hydroxylation of oxcarbazepine (TP-5). The peaks detected for the protonated molecular ions of m/z between 253.0969 – 253.0972 (with a retention time between 3.58 – 4.08 min) was compatible with the elemental composition C15H12N2O2. According to the aforementioned literature, this molecular formula may correspond to different TPs derived from the oxidized form of CBZ. These TPs correspond to CBZ-10,11-epoxide (TP-1), 2-hydroxy-CBZ (TP-2), 3-hydroxy-CBZ (TP-3), and oxcarbazepine (TP-4). Two protonated molecular ions of m/z 267.0765 and 267.0766 detected at 3.64 and 3.74 min were matching elemental composition of C15H10N2O3. Corresponding to this molecular formula we can tentatively identify 11-keto oxcarbazepine (TP-10) and the fragmentation of 1-(2-benzaldehyde)-(1H,3H)-quinazoline-2,4-dione (TP-11). The chromatogram also displayed two peaks at [M + H]+ with m/z between 271.1077 – 271.1079 detected at retention times of 3.03 and 3.60 min. The predicted accurate mass of the protonated species might correspond to the composition C15H14N2O3 suggesting a structure consistent with the addition of two hydroxyl groups to the CBZ molecule, which aligns with the tentative assignment of 10,11-dihydrodiol-CBZ (TP-7/TP-8). A peak detected at 3.66 min provided a protonated molecular ion with m/z 287.1027. Based on theoretical accurate mass measurements revealing a molecular formula of C15H14N2O4, the structure can be proposed as a trihydroxylated form of CBZ (TP-9). The protonated molecular ion of m/z 251.0821 observed at 2.29 min indicates an elemental composition of C15H10N2O2 which can be assigned to the compound 1-(2-benzaldehyde)-4-hydro-(1H,3H)-quinazoline-2-one (TP-12). Establishing a classification, the detected CBZ TPs can be classified as acridine derivatives (TP-6), oxidized CBZ derivatives (TP-1, TP-2, TP-3, TP-4, TP-5, TP-7, TP-8, TP-9, TP-10), and oxidized CBZ derivatives with structural rearrangement (TP-11, TP-12).
Based on the obtained results, Figure 11 shows a possible photolytic degradation pathway of CBZ that encompasses several steps.
Figure 11.
Proposed photocatalytic degradation pathway of CBZ in water using MSTiR% and 275 nm LEDS as photocatalyst and irradiation source, respectively.
Figure 11.
Proposed photocatalytic degradation pathway of CBZ in water using MSTiR% and 275 nm LEDS as photocatalyst and irradiation source, respectively.
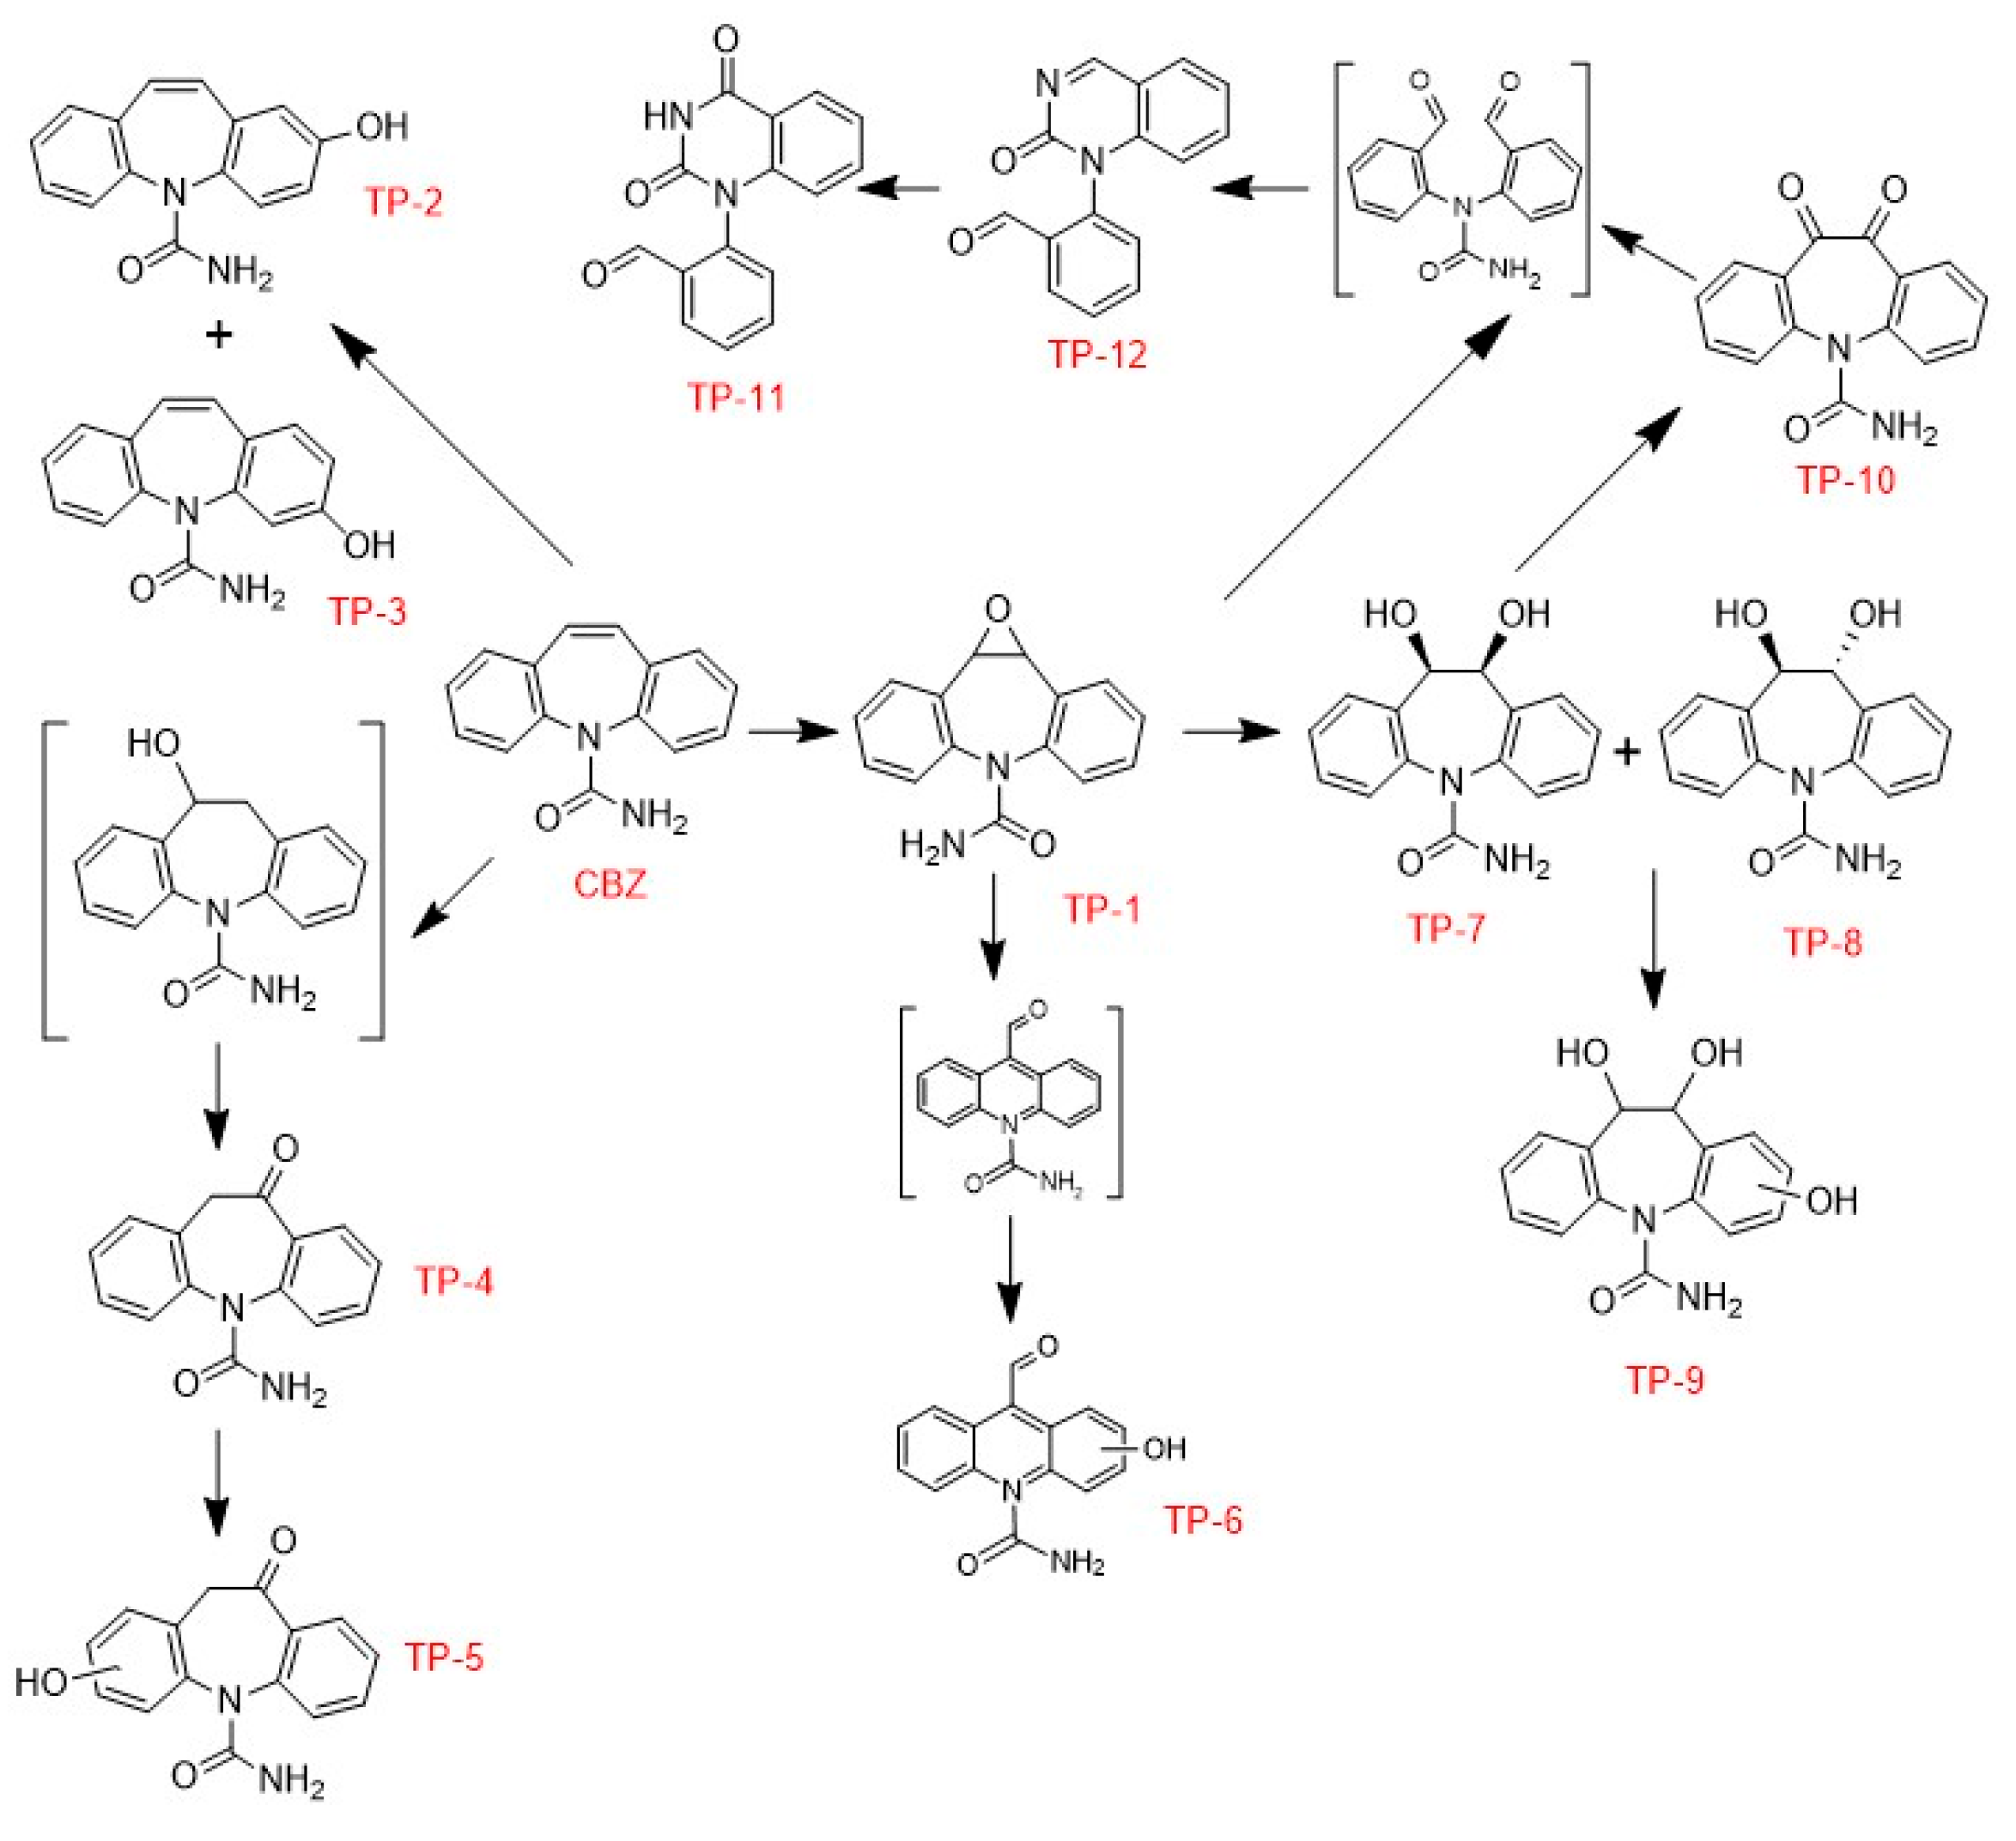
One of the processes that can take place is the hydroxylation of an aromatic ring of CBZ by HO• radicals, giving rise to the formation of hydroxylated derivatives, such as 2-hydroxy-CBZ (TP-2) and 3-hydroxy-CBZ (TP-3) [33]. On the other hand, the HO• radicals could also react with the alkene double bond within the central heterocyclic ring of CBZ, leading to the formation of hydroxylated products, specifically CBZ-10,11-epoxide (TP-1) and 10,11-dihydro-10-hydroxyl-CBZ [34]. However, in this work no peak was detected at [M + H]+ with m/z 255 corresponding to the compound 10,11-dihydro-10-hydroxyl-CBZ, with molecular formula C15H14N2O2. Martínez-Escudero et al. suggested that the formation of oxcarbazepine (TP-4) could be due to the oxidation of this undetected intermediate [32]. Oxcarbazepine (TP-4) was further hydroxylated to hydroxyl-ketone structures (TP-5) [35]. Compound CBZ-10,11-epoxide (TP-1) might experience further hydroxylation, resulting in an intermediate featuring two carbonyl functionalities, which is capable of generating the compound 1-(2-benzaldehyde)-4-hydro-(1H,3H)-quinazoline-2-one (TP-12) and the fragmentation of 1-(2-benzaldehyde)-(1H,3H)-quinazoline-2,4-dione (TP-11) [36]. Furthermore, CBZ-10,11-epoxide (TP-1) might also be subject to hydrolysis, yielding 10,11-dihydrodiol-CBZ (TP-7/TP-8), which could then undergo further hydroxylation to produce a trihydroxylated derivative of CBZ (TP-9) [37]. Dehydrogenation of 10,11-dihydrodiol- CBZ (TP-7/TP-8) might generate 11-keto oxcarbazepine (TP-10), which can suffer heterocyclic ring-opening that would also lead to intermediates and subsequent 1-(2-benzaldehyde)-4-hydro-(1H,3H)-quinazoline-2-one (TP-12) and the fragmentation of 1-(2-benzaldehyde)-(1H,3H)-quinazoline-2,4-dione (TP-11) [38]. Finally, the formation of the corresponding hydroxyl derivatives (TP-6) proceeds from an intermediate structure generated from the compound CBZ-10,11-epoxide (TP-1) [38].
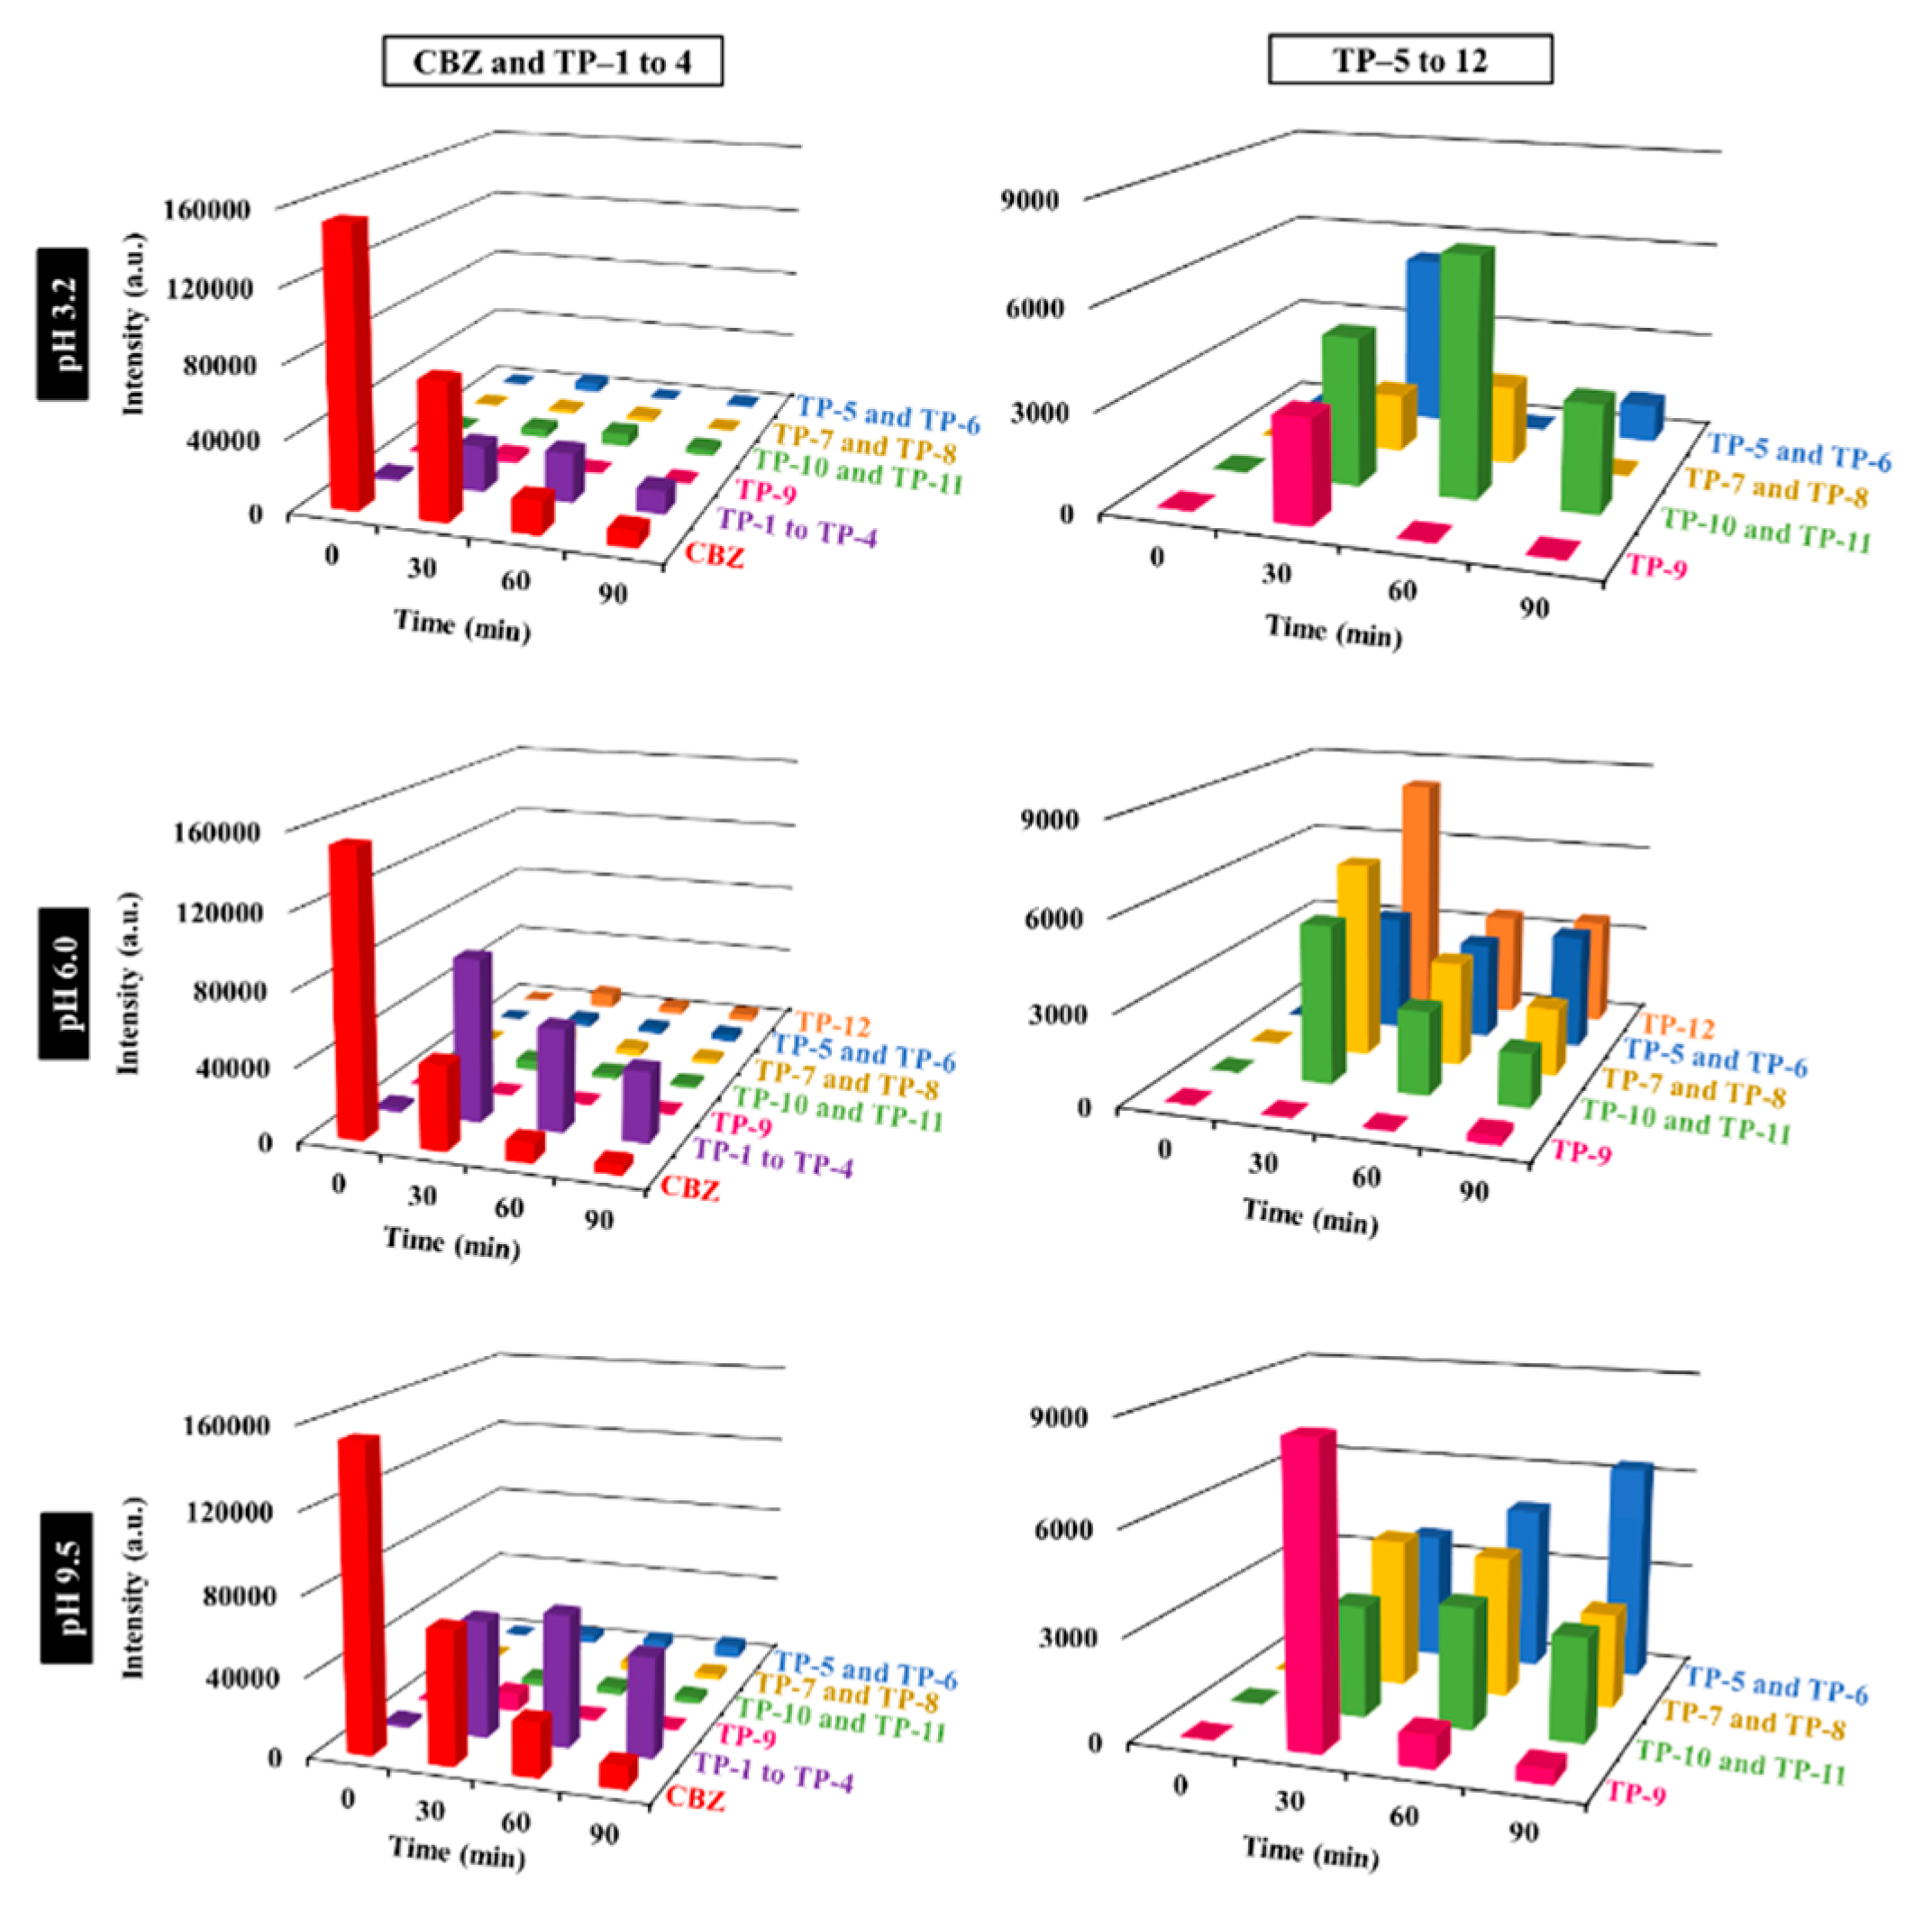
To elucidate the reaction mechanisms underlying the photolytic degradation of CBZ, the kinetic profiles of its principal transformation products were investigated during the course of the irradiation experiment. As evidenced in Figure 12, CBZ degradation was better at pH 6 than at acidic or basic pH, reaching almost 100% of total degradation at 90 min, as also confirmed by the results obtained from HPLC photodegradation kinetics (Figure 11). Degradation at pH 3.2 was slightly better than at pH 9.5. The first column of graphs in Figure 12 shows that TP-1, TP-2, TP-3 and TP-4 were the most abundant transformation products for the three pHs. Nevertheless, the absorption of these TPs differs depending of the pH, with pH 3.2 and 9.5 having the lowest and highest absorption, respectively, as expected by the higher concentration of HO– anions in the latter. The second column of Figure 12 depicts the absorption of the other transformation products, whose relative concentrations at the end of the photodegradation process (t = 90 min) are severely affected by the pH reaction media: (i) with an acidic media, a small proportion of TP-5, TP-6; TP-10 and TP-11 were detected; (ii) under non-controlled pH reaction, all the transformation products from TP-5 to TP-12 were detected with the exception of TP-9, and the absorption of TP-12 and that of the TPs with C15H12N2O3 formula (TP-5 and TP-6) doubled that of the TPs with C15H14N2O3 (TP-7 and TP-8) and C15H10N2O3 (TP-10 and TP-11) formulas; and (iii) under basic media, the absorption of the TPs of C15H12N2O3 (TP-5 and TP-6) was considerably higher to that of the rest transformation products.
Figure 12.
Relative abundance of the transformation products (TPs) with time originated during the photodegradation of 1 mg L–1 CBZ using the 0.5 g L–1 of MSTiM10 photocatalyst and a 275 nm LEDs irradiation source and three different pH = 3.2, 6.0 and 9.5.
Figure 12.
Relative abundance of the transformation products (TPs) with time originated during the photodegradation of 1 mg L–1 CBZ using the 0.5 g L–1 of MSTiM10 photocatalyst and a 275 nm LEDs irradiation source and three different pH = 3.2, 6.0 and 9.5.
3.2.5. Comparison with Other CBZ Photocatalysts
To evaluate the effectiveness of the MSTiPh10 catalyst, Table 9 illustrates the current state of art of CBZ photodegradation using different catalysts, detailing the applied experimental conditions and their degradation
Table 9.
Performance of catalyst on the photodegradation of CBZ.
| Catalyst | Experimental conditions | Irradiation Source | Performance | Ref. | ||||
| Bi4O5Br2 | 1 g L–1 of catalyst 10 mg L–1 of CBZ 50 mL reaction |
Visible light, 420 nm single-wavelength irradiation |
90% of CBZ was degraded after 120 min of irradiation (Kapp = 0.0196 min–1) |
Mao et al. 2021 [39] |
||||
| g-C3N4/TiO2 | 0.1–3 g L–1 of catalyst 1–40 mg L–1 of CBZ 1–20 mM PMS pH = 3–11 |
24 W UV light Philips PL-L lamp (λMax = 285 nm) |
~95% of 1 mg L–1 of CBZ was degraded after 60 min using 1 g L–1 of catalyst (Kapp = 0.0558 min–1) |
Meng et al. 2022 [40] |
||||
| Mesoporous Fe3O4 modified Al-doped ZnO (Al-ZnO/Fe) | 1 g L–1 of catalyst Hospital wastewater spiked with 1 mg L–1 of CBZ |
15 W UV-A lamps. Light Intensity: 32 W m–2 | 5:1 Al-ZnO/Fe achieved a 99% removal of CBZ after 60 min of irradiation with a rate of 0.076 min−1 | Majumder et al. 2022 [41] | ||||
| Cu/TiO2/Ti3C2 composite (0.5 wt% Cu) |
2 g L–1 of catalyst 14 mg L–1 of CBZ 25 cm3 glass reactor |
Simulated Solar Light irradiation, 300 W Xenon Lamp | Complete CBZ degradation was achieved after 60 min of irradiation, and in 20 min when 0.5 mM of Peroxymonosulfate were added | Grzegórska et al. 2023 [42] |
||||
| Pd-modified-TiO2 and Ce-modified ZnO |
1 g L–1 of catalyst 15 mg L–1 of CBZ 80 mL reaction |
Visible light. (λMax = 575 nm) |
80%, 53%, 20% and 9% of CBZ was removed by ZnO, Ce-modified-ZnO, TiO2 and Pd-modified-TiO2, respectively, after 3 h of irradiation. Ce-modified-ZnO released less Zn+2 than ZnO. | Rossi et al. 2023 [43] |
||||
| Cu2O; WO3; and Cu2O/WO3 | 0.4 g L–1 of catalyst 20 mg L–1 of CBZ 100 mL reaction |
Visible light, 50 W LED bulb | After Cu2O, WO3 and Cu2O/WO3 removed 41.14 %; 30.36 %; and 94% of CBZ in 60 min with Kapp = 0.0199; 0.0138; and 0.0572 min–1, respectively. | Mandyal et al. 2024 [44] |
||||
| TiO2 and Y–TiO2 (0.25–1 wt%) hydrothermally and micro-wave assisted synthesised |
1 g L–1 of catalyst 20 mg L–1 of CBZ |
UV-LED (λ = 395 nm) |
60% and 70% of CBZ removal was achieved after 2 h photodegradation using conventional and microwave-assisted synthesised TiO2, respectively. 91% (Kapp = 0.0108 min–1) and 96% (Kapp = 0.0135 min–1) removal rate were achieved using conventional and micro-assisted synthesised 1 wt% Y-TiO2, respectively. | Kubiak et al. 2024 [45] |
||||
| Ag2O/TiO2 heterostructure |
0.5 g L–1 of catalyst 1 mg L–1 of CBZ and Atenolol (ATL) 500 mL of tap water and of filtered Secondary effluent collected from a water waste treatment plant |
Natural sunlight, Intensity = 765 W m−2 | Tap water = catalyst completely degraded ATL in 1 h and CBZ in 3 h of irradiation (Kapp = 0.073 and 0.0240 min–1, respectively) Filtered Secondary effluent = After 3 h of irradiation 100% and ~85% of ATL and CBZ were removed, respectively (Kapp = 0.0305 and 0.0118 min–1, respectively) |
Durán-Alvárez et al. 2024 [46] |
||||
| TiO2/BiPO4 (80/20) composite |
0.5 g L–1 of catalyst 100 mg L–1 of CBZ |
300 W UV-visible light Xenon lamp with two filters | 88% of the CBZ was degraded after 6 h of irradiation (Kapp = 0.0547 min–1) |
Mohammed-Amine et al. 2025 [47] |
||||
| Potassium and oxygen co-doped g-C3N4 (OCN-3) |
0.4 g L–1 of catalyst 0.1–10 mg L–1 of CBZ |
300 W UV light mercury lamp. Intensity = 15 mW cm–2 | ~100% of 1 mg L–1 of CBZ was degraded after 30 min of irradiation. OCN-3 also completely degraded 5 mg L–1 with a Kapp of 0.1753 min–1 | Wang et al. [48] | ||||
| MSTiP10 | 1 g L–1 of catalyst 1 mg L–1 of CBZ 100 mL reaction |
UV-LEDs (λ = 275 nm) |
MSTiP10 removed 98.58% of CBZ after 2 h of irradiation (Kapp = 0.0877 min–1) |
This Work | ||||
Table 9 indicates that the majority of the works used a higher concentration of CBZ compared to this work. Nevertheless, as reported by Fernández et al., the concentration of CBZ in WWTP effluents from the northem Spain are 30–400 ng L–1, which are levels similar to other studies of effluents worldwide [49]. Therefore, high concentrations are not necessary to assess the CBZ photodegradation performance of a catalyst, and the criteria followed to selected 0.25–1 mg L–1 as the CBZ concentration in this works is the obtention of reliable kinetics parameters through HPLC. Another topic to highlight is that only three of the references listed in the table used irradiation sources aligned with the principles of green chemistry, such as natural light or LEDs, as is the case of this work. Compared to references listed in Table 9, MSiPh10 yielded a 97.57% removal yield of 1 g L–1 of CBZ after 1 h of irradiation, which is a very similar result to the reported by Meng et al., who for the same concentration and irradiation time achieved a ~95% removal rate using also 1 g L–1 of catalyst (g-C3N4/TiO2 composite) and an irradiation source with a similar wavelength (285 nm) [40]. In addition, the kinetic rate in the photodegradation of 1 mg L–1 CBZ using 1 g L–1 of catalyst was higher for MSTiPh10 (0.0877 min–1) than the reported when a mesoporous Fe3O4 modified Al-doped ZnO was used (0.076 min−1) [41]. However, the potassium and oxygen co-doped g-C3N4 synthesised by Wang et al. yielded a superior efficiency than MSTiPh10, since it completely eliminated 1 g L–1 of CBZ using a lower amount of catalyst (0.4 g L–1) and only requiring 30 min of irradiation [48].
4. Conclusions
Three series of materials consisting of anatase supported on mesoporous silica matrices where prepared using different organotriethoxysilanes, RTEOS (where R = M, methyl; P, propyl; or Ph, phenyl) at 10 ad 30% molar content with respect to tetraethoxysilane (TEOS), and following a hydrothermal approach for titanosilicalites preparation in which tetrapropyl ammonium bromide (TPABr) was used as surfactant instead of tetrapropyl ammonium hydroxide (TPAOH). The materials where thoroughly characterized using a plethora of techniques. For instance, the XRD pattern and the FTIR spectra of the materials confirmed that the use of TPABr prevented the formation of the crystalline modernite-inverted framework (MFI) of titanosilicalites, promoting the formation of anatase particles that are supported in amorphous SiO2. In addition, the degree of crystallinity of the MSTiR30 materials was lower than their respective MSTiR10 analogues, indicating that an increase of the RTEOS molar percentage hinders the formation of ordered structures during the hydrothermal synthesis. Furthermore, MSTiM10, the material synthesised using 10% of the less voluminous organic precursors (MTEOS), presented the highest degree of crystallinity among all samples, as well as the higher UV-vis absorption in the 260–380 nm range, corresponding to TiO6 photoactive surface species. The textural characterization by N2 adsorption isotherm at −196 °C, proved that: (i) the more voluminous the RTEOS precursor, the higher aBET and the Vmeso the MSTiR% material will have; and (ii) while PhTEOS promotes micropores formation, PTEOS induces the formation of wider-mesopores. This is consistent with the relative abundance of titanium determined on the surface of the materials by XPS, and in the bulk by FE-SEM EDX, since it was found that both MSTiP10 and MSTiPh10 showing significantly higher surface titanium content than MTEOS-based materials. Regarding the photodegradation of CBZ (1 mg L–1), all materials were able to degrade a significative proportion of the contaminant after 2 h of irradiation using a LED system of λMax = 275 nm and a catalyst dose of 0.5 g L–1, with the three MSTiR10 materials achieving a ~92.5% removal rate. The influence of the catalyst dose and pH of the media were studied, finding that the performance of MSTiP10 increased with dose up to 1 g L–1 and that the use of acid and basic media (pH = 3.2 and 9.5, respectively) reported lower apparent first-order kinetic constants (Kapp) than in no-pH controlled reactions (pH = 6.0). Therefore, it was concluded that despite having the lower proportion of Ti content in the bulk, MSTiP10 wider porosity allows a better distribution of the anatase particles in the SiO2 surface, which favor its CBZ adsorption properties. Finally, Tauc-plot analyses of the UV–Vis reflectance diffuse spectra and the valence band XPS spectra, were performed to elucidate the electronic configuration of the MSTiR% materials. All materials have a bandgap of ~3.3 eV and a valence band minimum and conduction band minimum energy positions, suggesting that HO• radicals and presumably e–, since the generation of O2•– radicals is not favored, are the main species degrading the CBZ molecules. The transformation products of CBZ were analyzed using LC-QTOF, finding small amounts of molecules originated from the hydroxylation and oxidation of the pollutants. A photodegradation pathway was proposed based on the results and consulted literature. In summary, this study has served to prove how textural properties can have a critical impact on the performance of a photocatalytic photodegradation reaction that the sheer amount of photoactive Ti species, paving the way to future design of materials based on TiO2 nanoparticles supported on SiO2 with enhanced textural properties.
Supplementary Materials
The following supporting information can be downloaded at the website of this paper posted on Preprints.org. Table S1: Identified anatase diffraction maxima, recorded intensity (I), Full Width at Half maximum (FWHM) and integrated Area (A); Figure S1: FTIR spectra of (a) MSTiR10 and (b) MSTiR30 in the 4000–2750 and 1600–400 cm–1 spectral range; Figure S2: Tauc-plot analyses of the UV-vis reflectance diffuse spectra of the (a) MSTiR10 and (b) MSTiR30 materials; Figure S3: XPS spectra of the (a) MSTiR10 and (b) MSTiR30 and peaks assignation; Figure S4: Linear adjustment of the MSTiP10, MSTiPh10, MSTiR30 spectra to determine its valence band maximum edge potential (EVBM); Figure S5: SEM micrographs of the (a) MSTiR10 and (b) MSTiR30 materials obtained using a x 150 magnification.
Author Contributions
G. C.-Q.: investigation, formal analysis, writing–original draft, writing-review and editing. B. R.-R.: methodology, formal analysis. I. V.-G.: supervision, writing-review and editing.: M. P. F.-P. methodology, writing–original draft. M. A. A. writing-review and editing. M. V. L.-R. conceptualization, supervision, project administration, funding acquisition, writing-review and editing. J. J. G.: conceptualization, supervision, project administration, funding acquisition, writing-review and editing. All authors have read and agreed to the published version of the manuscript.
Funding
This work was funded by the Ministry of Science, Innovation and Universities of the Government of Spain MCIN/AEI/https://doi.org/10.13039/501100011033 [PID2022-142169OB-I00 and PID2020-113558RB-C42], and the Area of University, Research and Innovation of the Government of Andalusia [EMERGIA21_00396, 2021].
Data Availability Statement
The data presented in this study are available from the corresponding authors upon reasonable request.
Acknowledgments
The authors are grateful for the financial support of the Ministry of Science, Innovation and Universities of the Government of Spain (PID2022-142169OB-I00 and PID2020-113558RB-C42), and the Area of University, Research and Innovation of the Government of Andalusia (EMERGIA21_00396, 2021). The authors also acknowledge the use of the Unidad científico técnica de apoyo a la investigación (UCTAI) at the Public University of Navarre, and the technical and human support provided by Centro de Instrumentación Científico-Técnica (CICT) -Servicios Centrales de Apoyo a la Investigación (SCAI)- Universidad de Jaén (UJA, MICINN, Junta de Andalucía, FEDER) is also gratefully acknowledged.
Conflicts of Interest
The authors declare no conflict of interest.
References
- Jiang, T.; Wu, W.; Ma, M.; Hu, Y.; Li, R. Occurrence and Distribution of Emerging Contaminants in Wastewater Treatment Plants: A Globally Review over the Past Two Decades. Sci. Total Environ. 2024, 951, 175664. [Google Scholar] [CrossRef] [PubMed]
- Fekadu, S.; Alemayehu, E.; Dewil, R.; Van der Bruggen, B. Pharmaceuticals in Freshwater Aquatic Environments: A Comparison of the African and European Challenge. Sci. Total Environ. 2019, 654, 324–337. [Google Scholar] [CrossRef] [PubMed]
- Zhang, Y.; Geißen, S.-U.; Gal, C. Carbamazepine and Diclofenac: Removal in Wastewater Treatment Plants and Occurrence in Water Bodies. Chemosphere 2008, 73, 1151–1161. [Google Scholar] [CrossRef] [PubMed]
- Directorate-General for Environment of the European Commission, Proposal for a DIRECTIVE OF THE EUROPEAN PARLIAMENT AND OF THE COUNCIL: “Amending Directive 2000/60/EC Establishing a Framework for Community Action in the field of Water Policy, Directive 2006/118/EC on the Protection of Groundwater against pollution and Deterioration and Directive 2008/105/EC on Environmental Quality in the Field of Water Policy”; Brussels, 2022; https://environment.ec.europa.eu/publications/proposal-amending-water-directives_en.
- Saravanan, A.; Deivayanai, V. C.; Kumar, P.S.; Rangasamy, G.; Hemavathy, R. V.; Harshana, T.; Gayathri, N.; Alagumalai, K. A Detailed Review on Advanced Oxidation Process in Treatment of Wastewater: Mechanism, Challenges and Future Outlook. Chemosphere 2022, 308, 136524. [Google Scholar] [CrossRef]
- Liu, H.; Wang, C.; Wang, G. Photocatalytic Advanced Oxidation Processes for Water Treatment: Recent Advances and Perspective. Chem. Asian J. 2020, 15, 3239–3253. [Google Scholar] [CrossRef]
- Peiris, S.; de Silva, H. B.; Ranasinghe, K.N.; Bandara, S. V.; Perera, I. R. Recent Development and Future Prospects of TiO2 Photocatalysis. J. Chin. Chem. Soc. 2021, 68, 738–769. [Google Scholar] [CrossRef]
- Li, R.; Li, T.; Zhou, Q. Impact of Titanium Dioxide (TiO2) Modification on Its Application to Pollution Treatment—A Review. Catalysts 2020, 10, 804. [Google Scholar] [CrossRef]
- Li, K.; Zhang, S.; Tan, Q.; Wu, X.; Li, Y.; Li, Q.; Fan, J.; Lv, K. Insulator in Photocatalysis: Essential Roles and Activation Strategies. Chem. Eng. J. 2021, 426, 130772. [Google Scholar] [CrossRef]
- Xu, Y.; Zheng, W.; Liu, W. Enhanced Photocatalytic Activity of Supported TiO2: Dispersing Effect of SiO2. J. Photochem. Photobiol., A 1999, 122, 57–60. [Google Scholar] [CrossRef]
- Wang, J.; Sun, S.; Ding, H.; Chen, W.; Liang, Y. Preparation of a Composite Photocatalyst with Enhanced Photocatalytic Activity: Smaller TiO2 Carried on SiO2 Microsphere. Appl. Surf. Sci. 2019, 493, 146–156. [Google Scholar] [CrossRef]
- Cruz-Quesada, G.; Sampaio, M. J.; Espinal-Viguri, M.; López-Ramón, M. V.; Garrido, J. J.; Silva, C. G.; Faria, J. L. Design of Novel Photoactive Modified Titanium Silicalites and Their Application for Venlafaxine Degradation under Simulated Solar Irradiation. Sol. RRL 2024, 8, 2300593. [Google Scholar] [CrossRef]
- BIZI, M. Activated Carbon and the Principal Mineral Constituents of a Natural Soil in the Presence of Carbamazepine. Water 2019, 11, 2290. [Google Scholar] [CrossRef]
- Harris, R. K.; Ghi, P. Y.; Puschmann, H.; Apperley, D. C.; Griesser, U. J.; Hammond, R. B.; Ma, C.; Roberts, K. J.; Pearce, G. J.; Yates, J. R.; Pickard, J. Structural Studies of the Polymorphs of Carbamazepine, Its Dihydrate, and Two Solvates. Org. Process Res. Dev. 2005, 9, 902–910. [Google Scholar] [CrossRef]
- Hunter, C. A.; McCabe, J. F.; Spitaleri, A. Solvent Effects of the Structures of Prenucleation Aggregates of Carbamazepine. CrystEngComm 2012, 14, 7115–7117. [Google Scholar] [CrossRef]
- Chemspider database, CSID:2457. Available online: https://www.chemspider.com/Chemical-Structure.2457.html (accessed on 20 February 2025).
- Nghiem, L. D.; Schäfer, A. I.; Elimelech, M. Pharmaceutical Retention Mechanisms by Nanofiltration Membranes. Environ Sci Technol 2005, 39, 7698–7705. [Google Scholar] [CrossRef] [PubMed]
- National Center for Biotechnology Information (2025). PubChem Compound Summary for CID 2554, Carbamazepine. Available online: https://pubchem.ncbi.nlm.nih.gov/compound/Carbamazepine. (accessed on 20 February 2025).
- Shi, Y.; Chen, L.; li, J.; Hu, Q.; Ji, G.; Lu, Y.; Hu, X.; Zhu, B.; Huang, W. Co Supported on Interparticle Porosity Dominated Hierarchical Porous TS-1 as Highly Efficient Heterogeneous Catalyst for Epoxidation of Styrene. Chem. Phys. Lett. 2021, 762, 138116. [Google Scholar] [CrossRef]
- Shang, Q.; Chi, W.; Zhang, P.; Ling, Y.; Liu, X.; Cui, G.; Liu, W.; Shi, X.; Tang, B. Optimization of Bi2O3/TS-1 Preparation and Photocatalytic Reaction Conditions for Low Concentration Erythromycin Wastewater Treatment Based on Artificial Neural Network. Process Saf. Environ. Prot. 2022, 157, 297–305. [Google Scholar] [CrossRef]
- El-Desoky, M. M.; Morad, I.; Wasfy, M. H.; Mansour, A. F. Synthesis, Structural and Electrical Properties of PVA/TiO2 Nanocomposite Films with Different TiO2 Phases Prepared by Sol–Gel Technique. J. Mater. Sci.:Mater. Electron. 2020, 31, 17574–17584. [Google Scholar] [CrossRef]
- Cruz-Quesada, G.; Espinal-Viguri, M.; López-Ramón, M. V.; Garrido, J. J. Hybrid Xerogels: Study of the Sol-Gel Process and Local Structure by Vibrational Spectroscopy. Polymers 2021, 13, 2082. [Google Scholar] [CrossRef]
- Moriones, P.; Ríos, X.; Echeverría, J. C.; Garrido, J. J.; Pires, J.; Pinto, M. Hybrid Organic-Inorganic Phenyl Stationary Phases for the Gas Separation of Organic Binary Mixtures. Colloids Surf., A 2011, 389, 69–75. [Google Scholar] [CrossRef]
- Fois, E.; Gamba, A.; Tabacchi, G. Influence of Silanols Condensation on Surface Properties of Micelle-Templated Silicas: A Modelling Study. Microporous Mesoporous Mater. 2008, 116, 718–722. [Google Scholar] [CrossRef]
- Soekiman, C. N.; Miyake, K.; Hayashi, Y.; Zhu, Y.; Ota, M.; Al-Jabri, H.; Inoue, R.; Hirota, Y.; Uchida, Y.; Tanaka, S.; Kong, C. Y.; Nishiyama, N. Synthesis of Titanium Silicalite-1 (TS-1) Zeolite with High Content of Ti by a Dry Gel Conversion Method Using Amorphous TiO2–SiO2 Composite with Highly Dispersed Ti Species. Mater. Today Chem. 2020, 16, 100209. [Google Scholar] [CrossRef]
- Reddy, K. M.; Manorama, S. V; Reddy, A.R. Bandgap Studies on Anatase Titanium Dioxide Nanoparticles. Mater. Chem. Phys. 2002, 78, 239–245. [Google Scholar] [CrossRef]
- Fujisawa, J.- i.; Eda, T.; Hanaya, M. Comparative Study of Conduction-Band and Valence-Band Edges of TiO2, SrTiO3, and BaTiO3 by Ionization Potential Measurements. Chem. Phys. Lett. 2017, 685, 23–26. [Google Scholar] [CrossRef]
- Cook, T. E. Jr.; Fulton, C. C.; Mecouch, W. J.; Tracy, K. M.; Davis, R. F.; Hurt, E. H.; Lucovsky, G.; Nemanich, R. J. Measurement of the Band Offsets of SiO2 on Clean n- and p-Type GaN(0001). J. Appl. Phys. 2003, 93, 3995–4004. [Google Scholar] [CrossRef]
- Bai, L.; Huang, H.; Yu, S.; Zhang, D.; Huang, H.; Zhang, Y. Role of Transition Metal Oxides in G-C3N4-Based Heterojunctions for Photocatalysis and Supercapacitors. J. Energy Chem. 2022, 64, 214–235. [Google Scholar] [CrossRef]
- Thommes, M.; Kaneko, K.; Neimark, A. V.; Olivier, J. P.; Rodriguez-Reinoso, F.; Rouquerol, J.; Sing, K. S. W. Physisorption of Gases, with Special Reference to the Evaluation of Surface Area and Pore Size Distribution (IUPAC Technical Report). Pure Appl. Chem. 2015, 87, 1051–1069. [Google Scholar] [CrossRef]
- Buxton, G. V; Greenstock, C. L.; Helman, W. P.; Ross, A. B. Critical Review of Rate Constants for Reactions of Hydrated Electrons, Hydrogen Atoms and Hydroxyl Radicals (·OH/·O-) in Aqueous Solution. J Phys Chem Ref Data 1988, 17, 513–886. [Google Scholar] [CrossRef]
- Martínez-Escudero, C. M.; Garrido, I.; Contreras, F.; Hellín, P.; Flores, P.; León-Morán, L.O.; Arroyo-Manzanares, N.; Campillo, N.; Viñas, P.; Fenoll, J. Photocatalytic Oxidation of Carbamazepine in Water Using TiO2 with LED Lamps: Study of Intermediate Degradation Products by Liquid Chromatography Mass Spectrometry after Dispersive Liquid–Liquid Microextraction. J. Photochem. Photobiol., A 2024, 452, 115551. [Google Scholar] [CrossRef]
- Jelic, A.; Michael, I.; Achilleos, A.; Hapeshi, E.; Lambropoulou, D.; Perez, S.; Petrovic, M.; Fatta-Kassinos, D.; Barcelo, D. Transformation Products and Reaction Pathways of Carbamazepine during Photocatalytic and Sonophotocatalytic Treatment. J. Hazard. Mater. 2013, 263, 177–186. [Google Scholar] [CrossRef]
- Liu, N.; Lei, Z.-D.; Wang, T.; Wang, J.-J.; Zhang, X.-D.; Xu, G.; Tang, L. Radiolysis of Carbamazepine Aqueous Solution Using Electron Beam Irradiation Combining with Hydrogen Peroxide: Efficiency and Mechanism. Chem. Eng. J. 2016, 295, 484–493. [Google Scholar] [CrossRef]
- Brezina, E.; Prasse, C.; Meyer, J.; Mückter, H.; Ternes, T. A. Investigation and Risk Evaluation of the Occurrence of Carbamazepine, Oxcarbazepine, Their Human Metabolites and Transformation Products in the Urban Water Cycle. Environ. Pollut. 2017, 225, 261–269. [Google Scholar] [CrossRef] [PubMed]
- Mcdowell, D. C.; Huber, M. M.; Wagner, M.; von Gunten, U.; Ternes, T. A. Ozonation of Carbamazepine in Drinking Water: Identification and Kinetic Study of Major Oxidation Products. Environ. Sci. Technol. 2005, 39, 8014–8022. [Google Scholar] [CrossRef] [PubMed]
- Ahmed, M. M.; Chiron, S. Solar Photo-Fenton like Using Persulphate for Carbamazepine Removal from Domestic Wastewater. Water Res. 2014, 48, 229–236. [Google Scholar] [CrossRef]
- Zhu, Z.; Chen, Y.; Gu, Y.; Wu, F.; Lu, W.; Xu, T.; Chen, W. Catalytic Degradation of Recalcitrant Pollutants by Fenton-like Process Using Polyacrylonitrile-Supported Iron (II) Phthalocyanine Nanofibers: Intermediates and Pathway. Water Res 2016, 93, 296–305. [Google Scholar] [CrossRef]
- Mao, X.; Li, M.; Li, M. Fabrication of Bi4O5Br2 Photocatalyst for Carbamazepine Degradation under Visible-Light Irradiation. Water Sci. Technol. 2021, 84, 77–88. [Google Scholar] [CrossRef]
- Meng, Y.; Li, Z.; Tan, J.; Li, J.; Wu, J.; Zhang, T.; Wang, X. Oxygen-Doped Porous Graphitic Carbon Nitride in Photocatalytic Peroxymonosulfate Activation for Enhanced Carbamazepine Removal: Performance, Influence Factors and Mechanisms. Chem. Eng. J. 2022, 429, 130860. [Google Scholar] [CrossRef]
- Majumder, A.; Gupta, A. K.; Sillanpää, M. Insights into Kinetics of Photocatalytic Degradation of Neurotoxic Carbamazepine Using Magnetically Separable Mesoporous Fe3O4 Modified Al-Doped ZnO: Delineating the Degradation Pathway, Toxicity Analysis and Application in Real Hospital Wastewater. Colloids Surf., A 2022, 648, 129250. [Google Scholar] [CrossRef]
- Grzegórska, A.; Karczewski, J.; Zielińska-Jurek, A. Modelling and Optimisation of MXene-Derived TiO2/Ti3C2 Synthesis Parameters Using Response Surface Methodology Based on the Box–Behnken Factorial Design. Enhanced Carbamazepine Degradation by the Cu-Modified TiO2/Ti3C2 Photocatalyst. Process Saf. Environ. Prot. 2023, 179, 449–461. [Google Scholar] [CrossRef]
- Rossi, L.; Villabrille, P. I.; Marino, D. J.; Rosso, J. A.; Caregnato, P. Degradation of Carbamazepine in Surface Water: Performance of Pd-Modified TiO2 and Ce-Modified ZnO as Photocatalysts. Environ. Sci. Pollut. Res. Int. 2023, 30, 116078–116090. [Google Scholar] [CrossRef]
- Mandyal, P.; Sharma, R.; Sambyal, S.; Islam, N.; Priye, A.; Kumar, M.; Chauhan, V.; Shandilya, P. Cu2O/WO3: A Promising S-Scheme Heterojunction for Photocatalyzed Degradation of Carbamazepine and Reduction of Nitrobenzene. JWPE 2024, 59, 105008. [Google Scholar] [CrossRef]
- Kubiak, A.; Cegłowski, M. Unraveling the Impact of Microwave-Assisted Techniques in the Fabrication of Yttrium-Doped TiO2 Photocatalyst. Sci. Rep. 2024, 14, 262. [Google Scholar] [CrossRef]
- Durán-Álvarez, J. C.; Cortés-Lagunes, S.; Mahjoub, O.; Serrano-Lázaro, A.; Garduño-Jiménez, A.; Zanella, R. Tapping the Tunisian Sunlight’s Potential to Remove Pharmaceuticals in Tap Water and Secondary Effluents: A Comparison of Ag2O/TiO2 and BiOI Photocatalysts and Toxicological Insights. Sep. Purif. Technol. 2024, 335, 126221. [Google Scholar] [CrossRef]
- Mohammed-Amine, E.; Kaltoum, B.; El Mountassir, E. M.; Abdelaziz, A. T.; Stephanie, R.; Stephanie, L.; Anne, P.; Pascal, W.-W. C.; Alrashed, M. M.; Salah, R. Novel Sol-Gel Synthesis of TiO2/BiPO4 Composite for Enhanced Photocatalytic Degradation of Carbamazepine under UV and Visible Light: Kinetic, Identification of Photoproducts and Mechanistic Insights. JWPE 2025, 70, 107098. [Google Scholar] [CrossRef]
- Wang, H.; Yao, Y.; Xiang, Y.; Zhu, X. Performance and Mechanic Insights into Potassium-Oxygen Co-Doping Graphic Carbon Nitride for UV Photocatalytic Oxidation of Carbamazepine. Sep. Purif. Technol. 2025, 353, 128577. [Google Scholar] [CrossRef]
- Fernández, M.; Fernández, M.; Laca, A.; Laca, A.; Díaz, M. Seasonal Occurrence and Removal of Pharmaceutical Products in Municipal Wastewaters. J. Environ. Chem. Eng. 2014, 2, 495–502. [Google Scholar] [CrossRef]
Disclaimer/Publisher’s Note: The statements, opinions and data contained in all publications are solely those of the individual author(s) and contributor(s) and not of MDPI and/or the editor(s). MDPI and/or the editor(s) disclaim responsibility for any injury to people or property resulting from any ideas, methods, instructions or products referred to in the content. |
© 2025 by the authors. Licensee MDPI, Basel, Switzerland. This article is an open access article distributed under the terms and conditions of the Creative Commons Attribution (CC BY) license (https://creativecommons.org/licenses/by/4.0/).
Copyright: This open access article is published under a Creative Commons CC BY 4.0 license, which permit the free download, distribution, and reuse, provided that the author and preprint are cited in any reuse.


