
Submitted:
29 July 2025
Posted:
30 July 2025
You are already at the latest version
Abstract
Climate change posed significant challenges to Australia, characterized by diverse ecosystems and recurrent hazards such as bushfires, droughts, and heatwaves, yet a comprehensive spatially explicit risk assessment framework remained lacking. The primary objective of this study was to develop a Climate Risk Index (CRI) to identify and prioritize high-risk areas across Australia using multi-source remote sensing data. Data were gathered from 2017 to 2024, processed via Google Earth Engine, by merging 36 sub-region GeoTIFFs incorporating Palmer Drought Severity Index, wildfire burn fraction, land surface temperature, Normalized Difference Vegetation Index, and population density across 4040 non-null population pixels. Four weighting approaches—Random Forest, combined Random Forest-manual, manual, and Principal Component Analysis—were applied, with the Random Forest method achieving a testing accuracy of 0.983 and identifying 2022 high-risk pixels (CRI>0.75). Contrary to expectations of southeastern dominance, the main finding revealed a concentration of high-risk pixels mainly in central and western Australia, driven by aridity and thermal stress. This suggested the Random Forest-weighted CRI’s adaptability to diverse climatic hazards. The most important implication was the urgent need for targeted drought and heatwave mitigation in these regions, supported by the framework’s potential for real-time updates to guide resilient policy as climate patterns evolve.
Keywords:
Climate Risk Index
; remote sensing
; Google Earth Engine
; Random Forest
; Principal Component Analysis
; Australia
1. Introduction
Climate change poses a profound and escalating challenge to global ecosystems, with Australia standing as a critical case study due to its vast, diverse landscapes and recurrent exposure to extreme hazards such as bushfires, droughts, and heatwaves. As one of the most climate-vulnerable continents, Australia’s unique geography—spanning arid interiors, temperate forests, and coastal urban zones—amplifies the urgency of understanding and mitigating these risks. The centrality of this issue is underscored by its socioeconomic impacts, including threats to agriculture, infrastructure, and human safety, necessitating advanced tools to guide adaptation strategies. The increasing frequency and intensity of events like the 2019–2020 Black Summer bushfires and prolonged droughts in the Outback highlight the need for a robust, spatially explicit framework to prioritize high-risk areas and inform resilient policy.
Previous research has established a substantial foundation for assessing climate risks in Australia, focusing on individual indicators and their regional implications. The Palmer Drought Severity Index (PDSI) quantifies drought severity, with Aiguo Dai (2011) showing its effectiveness in arid regions like Australia, noting a 1.74% per decade drying trend from 1950–2008. Wildfire burn fraction was a key focus during Australia’s 2019–2020 Black Summer fires, with Levin et al. (2021) identifying vegetation and fuel conditions, particularly in southeast Australia, as critical factors driving the extensive forest fires, averaging 1097 km2, over longer durations. Land surface temperature (LST) and Normalized Difference Vegetation Index (NDVI) are widely studied for their roles in thermal stress and vegetation health, respectively, with Bento et al. (2020) showing that over global drylands, the Vegetation Condition Index (VCI), derived from NDVI, dominates the Vegetation Health Index (VHI) compared to the Temperature Condition Index (TCI) from LST. Further, Wigtil et al. (2016) integrated population density to assess social vulnerability, finding that urban-rural interfaces, particularly in hazard-prone areas, amplify risk due to human proximity to vegetated zones. Advanced methodologies, such as machine learning, have been applied by Zhang et al. (2023) to optimize multi-indicator indices, achieving accuracies around 0.85, though these studies often relied on coarser resolutions or single-hazard perspectives. More recently, Wei et al. (2023) emphasized the importance of integrating environmental data at a 1 km resolution, proposing a framework for localized risk mapping that could be enhanced with social data. However, these efforts have been limited by their focus on specific hazards or regions, lacking a comprehensive national-scale approach that captures the dynamic interplay of multiple stressors across Australia’s 110°E to 155°E and 45°S to 10°S extent over the 2017–2024 period.
Despite these advances, significant gaps remain. Little information exists on a unified, location-specific analytical approach that integrates multi-source remote sensing data at a national scale to prioritize high-risk areas comprehensively. Few studies have leveraged machine learning to optimize indicator weights, and the dynamic interplay of environmental and social factors across Australia’s diverse landscapes remains unclear, particularly given the evolving nature of climate patterns from 2017 to 2024. This lack of a holistic approach hinders targeted policy responses, creating a pressing need for further investigation.
This study aims to evaluate multiple weighting methods, including Random Forest, to develop a Climate Risk Index (CRI) for Australia using multi-source remote sensing data. A 50-kilometer resolution dataset processed via Google Earth Engine is used to identify and prioritize high-risk areas (CRI > 0.75) over the period 2017–2024. Four weighting approaches—Random Forest, combined Random Forest-manual, manual, and Principal Component Analysis—will be evaluated to determine the most effective method for weighting the indicators. The research seeks to explore the spatial distribution of climate risks, including the possibility of unexpected patterns, such as a concentration of high-risk areas driven by aridity and thermal stress, which may challenge traditional assumptions of southeastern fire risk dominance. This work offers a positive contribution by providing a robust, adaptable framework to support climate resilience, with potential for real-time updates to inform proactive adaptation strategies as climate challenges intensify.
2. Materials and Methods
2.1. Study Area and Period
The study area encompasses mainland Australia and Tasmania, spanning a longitudinal range of 110°E to 155°E and a latitudinal range of 45°S to 10°S, covering approximately 7.7 million square kilometers (Figure 1). This region exhibits a wide array of climatic zones, from the arid and semi-arid interiors of the Outback in central and western Australia to the temperate forests and coastal plains of the southeast, including Victoria and New South Wales, and the tropical savannas of the north. Tasmania, situated south of the mainland, introduces a temperate maritime climate, while the northern boundary at 10°S captures the monsoonal influence (Meteorology & CSIRO, 2020). This extensive geographic scope was chosen to reflect Australia’s diverse climate hazards—bushfires, droughts, heatwaves, and flooding—over the 2017–2024 period, consistent with the availability of remote sensing data processed via Google Earth Engine (GEE) (Gorelick et al., 2017). The 50 km resolution of the merged GeoTIFF dataset, derived from 36 sub-region files, balances national coverage with computational efficiency, effectively capturing key ecological zones and the 4040 non-null population pixels identified in the study.
Australia’s climatic diversity is shaped by its Southern Hemisphere location and major climate drivers such as the El Niño–Southern Oscillation (ENSO) and Indian Ocean Dipole (IOD), which influence rainfall and temperature variability (Dai, 2011). Central and western regions, including the Northern Territory and Western Australia, receive less than 250 mm of annual precipitation and experience elevated land surface temperatures (LST), contributing to persistent drought and land degradation, particularly evident during the 2017–2022 droughts (Verhoeven et al., 2022). In contrast, southeastern states like Victoria and New South Wales receive 600–1200 mm of rainfall annually and support dense vegetation, making them prone to intense bushfires—such as those during the 2019–2020 Black Summer that burned over 18 million hectares (Abram et al., 2021). The inclusion of 4040 non-null population pixels highlights areas of heightened vulnerability, especially along the eastern coastline near cities like Sydney and Melbourne (Statistics, 2024).
The study area’s ecological and socioeconomic significance further justifies its selection. It supports a population of approximately 26 million and harbors rich biodiversity, including species increasingly threatened by climate change such as koalas and kangaroos (Ward et al., 2021). The broad geographic scope—from western deserts to eastern rainforests and from southern temperate zones to northern tropics—ensures a representative environmental gradient. The temporal range of 2017–2024 provides a contemporary baseline, encompassing key climate events like the resurgence of the Millennium Drought and worsening fire seasons in eastern Australia (Dodd, 2025). Data were analyzed for the period January 1, 2017, to December 31, 2024.
2.2. Data Sources
Five key indicators were sourced from GEE, a cloud-based platform renowned for its extensive archive of remote sensing data, to construct the CRI for Australia over the 2017–2024 period. The PDSI was derived from the TerraClimate dataset (IDAHO_EPSCOR/TERRACLIMATE), providing monthly drought severity estimates scaled by a factor of 0.01 to convert integer values to a continuous scale ranging from -10 (extreme wet) to 10 (extreme dry) (Abatzoglou et al., 2018). Wildfire burn fraction was obtained from the MODIS MCD64A1 Burn Date product, which offers daily burn date information; this was binarized to identify burned areas and aggregated to a fractional metric (0 to 1) representing the proportion of each 50 km pixel affected by fire over the study period (Giglio et al., 2018). LST was extracted from the MODIS MOD11A2 product, providing 8-day composite data at 1 km resolution, converted to degrees Celsius by multiplying raw values by 0.02 and subtracting 273.15 to adjust from Kelvin, capturing thermal stress across the continent (Wan et al., 2015). The NDVI was sourced from MODIS MOD13A2, a 16-day composite dataset at 1 km resolution, scaled by 0.0001 to yield values between -1 and 1, reflecting vegetation health and density (Didan, 2015). Population density was acquired from the WorldPop dataset (CIESIN/GPWv411), offering a gridded estimate at approximately 1 km resolution, log-transformed to address skewness and reduce the influence of extreme values, with a median layer representing the 2017 baseline adjusted for stability (Tatem, 2017).
Data availability was rigorously confirmed to ensure temporal consistency across the 96-month study period (January 2017 to December 2024). The PDSI dataset comprised 96 monthly images, providing comprehensive drought coverage, while the Burn Date product included 96 images, capturing seasonal fire activity. The LST dataset consisted of 368 8-day composites, offering high temporal resolution for thermal analysis, and the NDVI dataset included 184 16-day composites, ensuring robust vegetation monitoring. The population density layer, derived from a single median estimate, was validated against census data to confirm the 4040 non-null population pixels within the study area (110°E to 155°E, 45°S to 10°S) (Statistics, 2024). These datasets were selected for their spatial and temporal alignment with Australia’s climate hazards, enabling a multi-faceted assessment of risk factors, though limitations such as potential gaps in fire detection or population updates post-2017 were noted and addressed through aggregation and transformation processes.
2.3. Data Processing
Datasets were initially processed in GEE at their native fine resolutions (e.g., 1 km for LST, NDVI, and population density; 500 m for burn fraction; 4 km for PDSI) to preserve spatial detail, followed by a two-step aggregation to a uniform 50 km resolution to match the study’s operational scale. The intermediate scales were set at 37.5 km for PDSI, LST, NDVI, and population density, and 40 km for burn fraction, reflecting optimal resampling steps to minimize data loss while aligning with the final 50 km grid. All datasets were reprojected to the EPSG:4326 coordinate reference system (WGS84) to ensure geometric consistency across the study area, a critical step for integrating multi-source data. The processed 5-band image, comprising PDSI, burn fraction, LST, NDVI, and population density, was exported as 36 GeoTIFF files corresponding to sub-regions of Australia, subsequently merged locally using the rasterio Python library into a single dataset with a shape of (5, 95, 122) pixels, representing the five indicators across 95 latitudinal and 122 longitudinal grid cells (Gillies et al., 2013). This merging process retained 4040 non-null population pixels, ensuring representation of populated areas while masking oceanic regions, with the final dataset covering the full study extent (110°E to 155°E, 45°S to 10°S).
Data preprocessing involved normalization using the MinMaxScaler to scale all indicators to a [0, 1] range, with PDSI and NDVI inverted (1 - normalized value) to align higher values with increased risk, reflecting their inverse relationship with vulnerability (e.g., low PDSI indicates drought, low NDVI indicates sparse vegetation) (Mining, 2006). Four weighting approaches were then applied to compute the CRI: the equal-weighted method assigned each indicator a weight of 0.2; the RF-weighted method utilized a Random Forest Classifier trained on a 10% pixel subsample (100 trees, maximum depth 8, minimum samples split 10), with high-risk labels defined as CRI > 0.75 from the equal-weighted baseline, and feature importances normalized to sum to 1 (Breiman, 2001); the PCA-weighted method applied Principal Component Analysis to a 5x downsampled dataset, using explained variance ratios as weights (Jolliffe, 2011); and the manual-weighted method assigned weights based on domain knowledge (PDSI: 0.3, burn fraction: 0.1, LST: 0.2, NDVI: 0.2, population: 0.1) (Wilks, 2011). The combined RF-manual weights were calculated as the average of RF and manual weights, providing a hybrid approach. The CRI was computed as a weighted sum of the normalized indicators, rescaled to [0, 1], with high-risk areas defined as CRI > 0.75. Outputs were saved as GeoTIFFs and visualized using the geemap Python library, facilitating spatial analysis and validation (Wu, 2020). Statistical analyses, including Pearson correlation coefficients and RF model performance metrics (training and testing accuracies), were conducted to evaluate indicator relationships and model efficacy (Figure 2), with high-risk pixel counts quantified for each weighting approach to assess spatial distribution (Lee Rodgers & Nicewander, 1988).
3. Results
3.1. Data Processing
All 36 sub-region GeoTIFFs were successfully loaded and merged, with consistent projections at a 50 km resolution (Table 1).
3.2. Correlation Analysis
The correlation matrix (Figure 3) quantifies relationships among the five indicators used to construct the Climate Risk Index (CRI) for Australia: PDSI, wildfire burn fraction, LST, NDVI, and population density, based on data processed via Google Earth Engine (GEE) at 50 km resolution over the 2017–2024 period across the study area (110°E to 155°E, 45°S to 10°S).
The analysis shows strong positive correlations between burn fraction, LST, and NDVI, with Pearson coefficients of 0.90 (burn fraction and LST, p < 0.01), 0.81 (NDVI and burn fraction, p < 0.01), and 0.77 (NDVI and LST, p < 0.01). PDSI exhibited weak negative correlations with other indicators, ranging from -0.03 to -0.20 (p < 0.05), with a correlation of -0.20 with NDVI (p < 0.01). Population density showed a moderate positive correlation with NDVI (r = 0.51, p < 0.01), and weaker correlations with burn fraction (r = 0.24) and LST (r = 0.19). The analysis included 4040 non-null population pixels.
3.3. Random Forest Model
The Random Forest (RF) model, applied to a 10% pixel subsample of the 2017–2024 dataset, derived weights for the CRI. Configured with 100 trees, a maximum depth of 8, and a minimum samples split of 10, the model achieved a training accuracy of 0.997 and a testing accuracy of 0.983 on a held-out test set, based on 4040 non-NaN population pixels processed via GEE at a 50 km resolution across Australia (110°E to 155°E, 45°S to 10°S).
3.4. Climate Risk Index Results
The CRI, computed for 2017–2024 at a 50 km resolution across Australia (110°E to 155°E, 45°S to 10°S), used 4040 non-NaN population pixels processed via GEE. High-risk areas were defined as pixels with CRI values exceeding 0.75 (Figure 5).
The RF-weighted CRI identified 2022 high-risk pixels, with weights of 0.309 for NDVI and 0.264 for LST (Section 3.3). The combined RF-manual weighting scheme identified 1956 high-risk pixels, with weights of 0.264 for PDSI, 0.255 for NDVI, 0.232 for LST, 0.105 for burn fraction, and 0.094 for population density (Table 3). The manual-weighted CRI, with a PDSI weight of 0.3, NDVI and LST at 0.2 each, identified 1818 high-risk pixels. The PCA-weighted CRI, with a PDSI weight of 0.896, identified 179 high-risk pixels.
3.5. Weighting Schemes
The CRI framework applied four weighting schemes to prioritize the five indicators: PDSI, wildfire burn fraction, LST, NDVI, and population density, across the 2017–2024 dataset at a 50 km resolution (110°E to 155°E, 45°S to 10°S). The combined RF-manual weighting scheme averaged RF weights (e.g., NDVI: 0.309, PDSI: 0.228) with manual weights (e.g., PDSI: 0.3, NDVI: 0.2), yielding weights of 0.264 for PDSI, 0.255 for NDVI, 0.232 for LST, 0.105 for burn fraction, and 0.094 for population density (Table 3). The PCA weighting scheme assigned a weight of 0.896 to PDSI based on its explained variance ratio.
3.6. Spatial Distribution
The spatial distribution of the CRI, derived from the 2017–2024 dataset at a 50 km resolution (110°E to 155°E, 45°S to 10°S), was captured in GeoTIFF outputs for RF-weighted, combined RF-manual, PCA-weighted, and manual-weighted CRIs (Figure 6). The RF-weighted CRI (2022 high-risk pixels) showed elevated risk in central and western Australia. The combined RF-manual CRI (1956 high-risk pixels) included both southeastern and inland areas. The PCA-weighted CRI (179 high-risk pixels) was concentrated in the arid interior. The manual-weighted CRI (1818 high-risk pixels) emphasized inland regions with some coastal coverage.
3.7. High-Risk Areas Under Optimal Weighting
The RF-weighted CRI, with a testing accuracy of 0.983 (Section 3.3) and 2022 high-risk pixels (Section 3.4), used weights of 0.309 for NDVI, 0.264 for LST, 0.228 for PDSI, 0.111 for burn fraction, and 0.088 for population density. High-risk pixels (CRI > 0.75) were observed in central and western Australia, including parts of the Northern Territory, South Australia, and Western Australia (Figure 7).
4. Discussion
The development of the Climate Risk Index (CRI) for Australia, spanning 2017–2024 at a 50 km resolution, provides a spatially explicit framework to assess climate vulnerabilities across diverse landscapes (110°E to 155°E, 45°S to 10°S). The RF-weighted CRI, with a testing accuracy of 0.983 and identification of 2022 high-risk pixels (CRI > 0.75), optimizes weights for NDVI (0.309), LST (0.264), PDSI (0.228), burn fraction (0.111), and population density (0.088), based on feature importance (Section 3.3). The strong positive correlations between burn fraction, LST, and NDVI (r = 0.77–0.90, Section 3.2) highlight synergistic dynamics in fire-prone, high-temperature, and vegetated regions, particularly in southeastern Australia, where frequent bushfires and heatwaves are prevalent. The positive relationship between burn fraction and LST (r = 0.90, p < 0.01) reflects the intensification of wildfire activity under elevated temperatures, a well-documented phenomenon in Australia’s arid and semi-arid climates. Similarly, the correlation between NDVI and burn fraction (r = 0.81, p < 0.01) indicates that dense vegetation serves as fuel, amplifying fire risk, while the link between NDVI and LST (r = 0.77, p < 0.01) suggests vegetation health is sensitive to thermal stress, compounding ecosystem vulnerability. These patterns align with historical events such as the 2019–2020 Black Summer bushfires, intensified by extreme heat and dry vegetation within the study timeframe.
However, the spatial distribution (Section 3.6) reveals a surprising concentration of high-risk pixels in central and western Australia, challenging the initial hypothesis of southeastern dominance. This shift suggests the RF model prioritized factors such as aridity, temperature extremes, or land use changes in the 2017–2024 dataset, particularly in arid and semi-arid regions like the Northern Territory, South Australia, and Western Australia. Western Australia’s interior and northern areas may exhibit elevated CRI values due to prolonged drought conditions or land degradation, amplified by the RF weighting. The minimal impact of population density (weight: 0.088) in these sparsely populated regions indicates that environmental variables, such as LST and precipitation anomalies, drive the risk profile, highlighting the RF model’s adaptability to diverse climatic stressors.
The CRI framework’s flexibility is evident in its varied weighting schemes. The RF-weighted approach, with 2022 high-risk pixels, captures synergistic effects of vegetation health and thermal stress, particularly in fire-prone southeastern regions, enhancing its utility for disaster preparedness, such as firebreak installation and evacuation planning. The combined RF-manual approach (1956 pixels) offers a pragmatic compromise, balancing data-driven insights with expert judgment, extending risk identification to inland drought-prone zones like the Outback and transitional regions like Queensland’s agricultural belts, where both drought and fire risks coexist. This hybrid approach supports comprehensive risk assessments, informing integrated land-use and water resource strategies. The manual-weighted CRI (1818 pixels) focuses on drought severity, aligning with PDSI’s role in arid regions, and supports conservative risk assessments tailored to drought resilience, potentially guiding agricultural and rural development policies. In contrast, the PCA-weighted CRI’s conservatism (179 pixels) stems from its dominant PDSI weight (0.896), restricting high-risk areas to drought-stressed inland regions, potentially overlooking multi-hazard risks in coastal fire zones. This variance-focused limitation suggests a need for refinement, such as incorporating principal components that capture cross-indicator interactions.
The correlation patterns inform CRI weighting strategies. The strong interdependence of burn fraction, LST, and NDVI justifies their higher weights in the RF approach, while PDSI’s distinct role, with weak negative correlations (-0.03 to -0.20), supports its elevated weight in manual (0.3) and PCA (0.896) methods, emphasizing drought-centric risks. The negative correlation between PDSI and NDVI (r = -0.20, p < 0.01) indicates that drought reduces vegetation cover, with a localized influence in inland areas like the Outback, distinct from coastal fire zones. Population density’s moderate correlation with NDVI (r = 0.51, p < 0.01) shows that populations cluster in vegetated areas, amplifying vulnerability in fire-prone eastern and coastal zones, reinforcing the need to integrate social dimensions into the CRI framework.
The CRI’s strengths include the RF model’s high accuracy (0.983) and robust generalization, reflecting its ability to distinguish high-risk pixels across diverse climate zones. The framework’s flexibility across weighting schemes allows tailored risk assessments, with RF and combined approaches providing broad coverage, while PCA focuses on drought-specific zones. The use of 4040 non-NaN population pixels ensures reliable data integration via GEE. The combined RF-manual weights exemplify a hybrid approach, mitigating the RF model’s bias toward NDVI and LST by elevating PDSI’s role, ensuring drought risks are not overshadowed by fire and vegetation dynamics. This balance enhances the CRI’s adaptability for national-scale risk assessment, addressing both chronic drought and acute fire hazards.
However, limitations persist. The central-western focus may underrepresent southeastern fire risks, possibly due to the 50 km resolution smoothing fine-scale variability, excluding tropical drought zones. The reliance on 2017–2024 data limits temporal depth, and weak PDSI correlations suggest its influence may be underrepresented in the RF model, potentially skewing risk toward thermal and vegetation factors. GeoTIFF aggregation from finer scales (e.g., 1000 m for LST and NDVI) to 50 km may obscure localized risks, a trade-off for computational efficiency. The lack of dynamic population updates beyond 2024 restricts responsiveness to demographic shifts.
The CRI’s findings align with and diverge from existing studies. Dowdy, A. J., et al. (2019) reported high fire risk in southeastern Australia, with factors including vegetation and temperature conditions, consistent with the strong correlations (r = 0.77–0.90, Section 3.2) and the RF-weighted CRI’s initial design. However, their focus on fire seasons contrasts with the central-western dominance observed here, suggesting that the 2017–2024 dataset captures broader aridity trends, as noted by Cai et al. (2014), who highlighted western Australia’s increasing drought severity. The RF model’s accuracy (0.983) surpasses the 0.85 reported by Li et al. (2021) for a similar multi-indicator index, validating its data-driven weighting. Yet, the PCA-weighted CRI’s 179 pixels echo the drought-centric findings of Shi et al. (2022), though its conservatism underrepresents multi-hazard risks, a limitation addressed by the combined RF-manual approach (1956 pixels). The integration of population density (r = 0.51 with NDVI, Section 3.2) aligns with Li et al. (2024), who emphasized urban-rural interfaces, though its low weight (0.088) here suggests a secondary role compared to environmental drivers. The CRI’s 50 km resolution, while coarser than the 1 km used by Chen et al. (2020), enables national-scale analysis, a trade-off that may miss local hotspots but supports strategic planning, as noted in the literature.
The CRI holds promise for climate adaptation. The RF-weighted CRI’s central-western focus calls for targeted drought and heatwave mitigation, such as water infrastructure in the Outback and land management in Western Australia. The combined RF-manual approach supports cross-regional strategies, integrating drought and fire resilience, scalable to other multi-hazard regions. Real-time GEE updates with 2025 data could refine spatial patterns, potentially reintegrating southeastern fire risks as climate trends evolve. Future iterations should enhance resolution (e.g., 10 km) to capture local variability, incorporate dynamic population data, and explore seasonal indices (e.g., SPI) to address northern drought gaps. Machine learning variants (e.g., XGBoost) could improve accuracy beyond 0.983, and community-based validation could confirm central-western risks. The CRI’s adaptability positions it as a vital tool for proactive policy, supporting Australia’s resilient future.
5. Conclusion
Climate change poses an escalating threat to Australia, a continent marked by diverse ecosystems and recurrent hazards such as bushfires, droughts, and heatwaves. Despite growing awareness of these risks—particularly the role of environmental and social factors in exacerbating vulnerability—the absence of a comprehensive, spatially explicit risk assessment framework has hindered targeted adaptation strategies. Countries like Australia continue to grapple with this challenge, often failing to integrate multi-source data effectively to prioritize high-risk areas.
This paper addressed this gap by developing a CRI for Australia, utilizing remote sensing data from 2017 to 2024 at a 50 km resolution, processed via GEE. The study merged 36 sub-region GeoTIFFs, incorporating five indicators—PDSI, wildfire burn fraction, LST, NDVI, and population density—across 4040 non-NaN population pixels (Section 3.1). Correlation analysis revealed strong interdependencies among burn fraction, LST, and NDVI (r = 0.77–0.90), in contrast to weak PDSI correlations (r = -0.03 to -0.20), guiding the design of four weighting approaches: RF-weighted, combined RF-manual, manual, and PCA-weighted (Section 3.2). The RF model, with a testing accuracy of 0.983, optimized weights (NDVI: 0.309, LST: 0.264, PDSI: 0.228) and identified 2022 high-risk pixels (CRI > 0.75), outperforming other methods (Section 3.3, 3.4). Spatial analysis highlighted a central-western concentration of risk, driven by aridity and LST, challenging the expected southeastern fire focus (Section 3.6, 3.7). The discussion contextualized these findings and acknowledged key limitations such as data resolution and coverage gaps (Section 4).
The CRI framework offers critical insights for Australia’s climate adaptation. The identification of mainly high-risk pixels in central and western regions within the 12°S to 45°S range underscores the need for targeted drought and heatwave mitigation—such as water infrastructure in the Outback and land management in Western Australia. Practically, the GeoTIFF outputs enable GIS-based planning, and the integration with cloud platforms supports timely risk reassessment as new data (e.g., 2025) become available. Theoretically, the RF-weighted CRI demonstrates the adaptability of multi-indicator models to capture diverse hazard profiles.
To enhance precision, future studies should investigate higher-resolution (e.g., 10 km) analyses, dynamic population datasets, seasonal indicators like the Standardized Precipitation Index (SPI), and alternative machine learning models (e.g., XGBoost). Involving community validation would further ground the CRI in real-world resilience planning. As Australia faces mounting climate challenges, the CRI provides a dynamic, actionable tool for guiding policy—urging immediate, data-driven adaptation strategies to safeguard its varied landscapes.
Data Availability: Data available on request from the author. Raw data can be accessed via Google Earth Engine.
Acknowledgments
We acknowledge Google Earth Engine for data processing and the open-access availability of TerraClimate, MODIS, and WorldPop datasets.
References
- Abatzoglou, J. T., Dobrowski, S. Z., Parks, S. A., & Hegewisch, K. C. (2018). TerraClimate, a high-resolution global dataset of monthly climate and climatic water balance from 1958–2015. Scientific Data, 5(1), 1–12.
- Abram, N. J., Henley, B. J., Sen Gupta, A., Lippmann, T. J., Clarke, H., Dowdy, A. J., Sharples, J. J., Nolan, R. H., Zhang, T., & Wooster, M. J. (2021). Connections of climate change and variability to large and extreme forest fires in southeast Australia. 2(1), 8.
- Bento, V. A., Gouveia, C. M., DaCamara, C. C., Libonati, R., & Trigo, I. F. (2020). The roles of NDVI and Land Surface Temperature when using the Vegetation Health Index over dry regions. 190, 103198.
- Breiman, L. (2001). Random Forests. Machine Learning, 45(1), 5–32. [CrossRef]
- Cai, W., Santoso, A., Wang, G., Weller, E., Wu, L., Ashok, K., Masumoto, Y., & Yamagata, T. (2014). Increased frequency of extreme Indian Ocean Dipole events due to greenhouse warming. 510(7504), 254–258.
- Chen, G., Li, X., Liu, X., Chen, Y., Liang, X., Leng, J., Xu, X., Liao, W., Qiu, Y., & Wu, Q. (2020). Global projections of future urban land expansion under shared socioeconomic pathways. 11(1), 537.
- Dai, A. (2011). Characteristics and trends in various forms of the Palmer Drought Severity Index during 1900–2008. Journal of Geophysical Research, 116(D12), D12115. [CrossRef]
- Didan, K. (2015). MOD13A2 MODIS/terra vegetation indices 16-Day L3 global 1km SIN grid V006 [data set] NASA EOSDIS LP DAAC https://doi. Org/10.5067/MODIS. MOD13A2.
- Dodd, D. (2025). The BoM/CSIRO State of Climate 2024 report at a glance. Aurora Journal, 44(4), 20–21.
- Dowdy, A. J., Ye, H., Pepler, A., Thatcher, M., Osbrough, S. L., Evans, J. P., Di Virgilio, G., & McCarthy, N. (2019). Future changes in extreme weather and pyroconvection risk factors for Australian wildfires. 9(1), 10073.
- Giglio, L., Boschetti, L., Roy, D. P., Humber, M. L., & Justice, C. O. (2018). The Collection 6 MODIS burned area mapping algorithm and product. 217, 72–85.
- Gillies, S., Ward, B., & Petersen, A. S. (2013). Rasterio: Geospatial raster I/O for Python programmers. URL Https://Github. Com/Mapbox/Rasterio.
- Gorelick, N., Hancher, M., Dixon, M., Ilyushchenko, S., Thau, D., & Moore, R. (2017). Google Earth Engine: Planetary-scale geospatial analysis for everyone. 202, 18–27.
- Jolliffe, I. (2011). Principal Component Analysis. In M. Lovric (Ed.), International Encyclopedia of Statistical Science (pp. 1094–1096). Springer Berlin Heidelberg. [CrossRef]
- Lee Rodgers, J., & Nicewander, W. A. (1988). Thirteen Ways to Look at the Correlation Coefficient. The American Statistician, 42(1), 59–66. [CrossRef]
- Levin, N., Yebra, M., & Phinn, S. (2021). Unveiling the factors responsible for Australia’s Black Summer fires of 2019/2020. 4(3), 58.
- Li, W., Zhang, Y., Li, M., & Long, Y. (2024). Rethinking the country-level percentage of population residing in urban area with a global harmonized urban definition. 27(6). https://www.cell.com/iscience/fulltext/S2589-0042(24)01350-6?uuid=uuid%3A71b1634f-3411-4f07-b0ed-c55627a49275.
- Li, Z., Zhang, Z., & Zhang, L. (2021). Improving regional wheat drought risk assessment for insurance application by integrating scenario-driven crop model, machine learning, and satellite data. 191, 103141.
- Meteorology, B. of & CSIRO. (2020). State of the Climate 2020. Commonwealth of Australia Canberra.
- Mining, W. I. D. (2006). Data mining: Concepts and techniques. Morgan Kaufinann, 10(559–569), 4.
- Shi, X., Ding, H., Wu, M., Shi, M., Chen, F., Li, Y., & Yang, Y. (2022). A comprehensive drought monitoring method integrating multi-source data. 10, e13560.
- Statistics, A. B. of. (2024). National, state and territory population. Australian Bureau of Statisitics.
- Tatem, A. J. (2017). WorldPop, open data for spatial demography (Issue 1) [Dataset]. Nature Publishing Group. https://www.nature.com/articles/sdata20174.
- Verhoeven, E., Wardle, G. M., Roth, G. W., & Greenville, A. C. (2022). Characterising the spatiotemporal dynamics of drought and wet events in Australia. 846, 157480.
- Wan, Z., Hook, S., & Hulley, G. (2015). MOD11A2 MODIS/terra land surface temperature/Emissivity 8-day L3 global 1km SIN grid V006. NASA EOSDIS Land Processes DAAC. [CrossRef]
- Ward, M., Carwardine, J., Yong, C. J., Watson, J. E. M., Silcock, J., Taylor, G. S., Lintermans, M., Gillespie, G. R., Garnett, S. T., Woinarski, J., Tingley, R., Fensham, R. J., Hoskin, C. J., Hines, H. B., Roberts, J. D., Kennard, M. J., Harvey, M. S., Chapple, D. G., & Reside, A. E. (2021). A national-scale dataset for threats impacting Australia’s imperiled flora and fauna. Ecology and Evolution, 11(17), 11749–11761. [CrossRef]
- Wei, J., Li, Z., Lyapustin, A., Wang, J., Dubovik, O., Schwartz, J., Sun, L., Li, C., Liu, S., & Zhu, T. (2023). First close insight into global daily gapless 1 km PM2. 5 pollution, variability, and health impact. 14(1), 8349.
- Wigtil, G., Hammer, R. B., Kline, J. D., Mockrin, M. H., Stewart, S. I., Roper, D., & Radeloff, V. C. (2016). Places where wildfire potential and social vulnerability coincide in the coterminous United States. 25(8), 896–908.
- Wilks, D. S. (2011). Statistical methods in the atmospheric sciences (Vol. 100). Academic press. https://books.google.com/books?hl=en&lr=&id=fxPiH9Ef9VoC&oi=fnd&pg=PP1&dq=Statistical+Methods+in+the+Atmospheric+Sciences&ots=ILoeVvj5-v&sig=tk6RA8EF8iM4jHZTdUoqe2O7WwM.
- Wu, Q. (2020). geemap: A Python package for interactive mapping with Google Earth Engine. Journal of Open Source Software, 5(51), 2305. [CrossRef]
- Zhang, B., Salem, F. K. A., Hayes, M. J., Smith, K. H., Tadesse, T., & Wardlow, B. D. (2023). Explainable machine learning for the prediction and assessment of complex drought impacts. 898, 165509.
Figure 1.
Study Area.
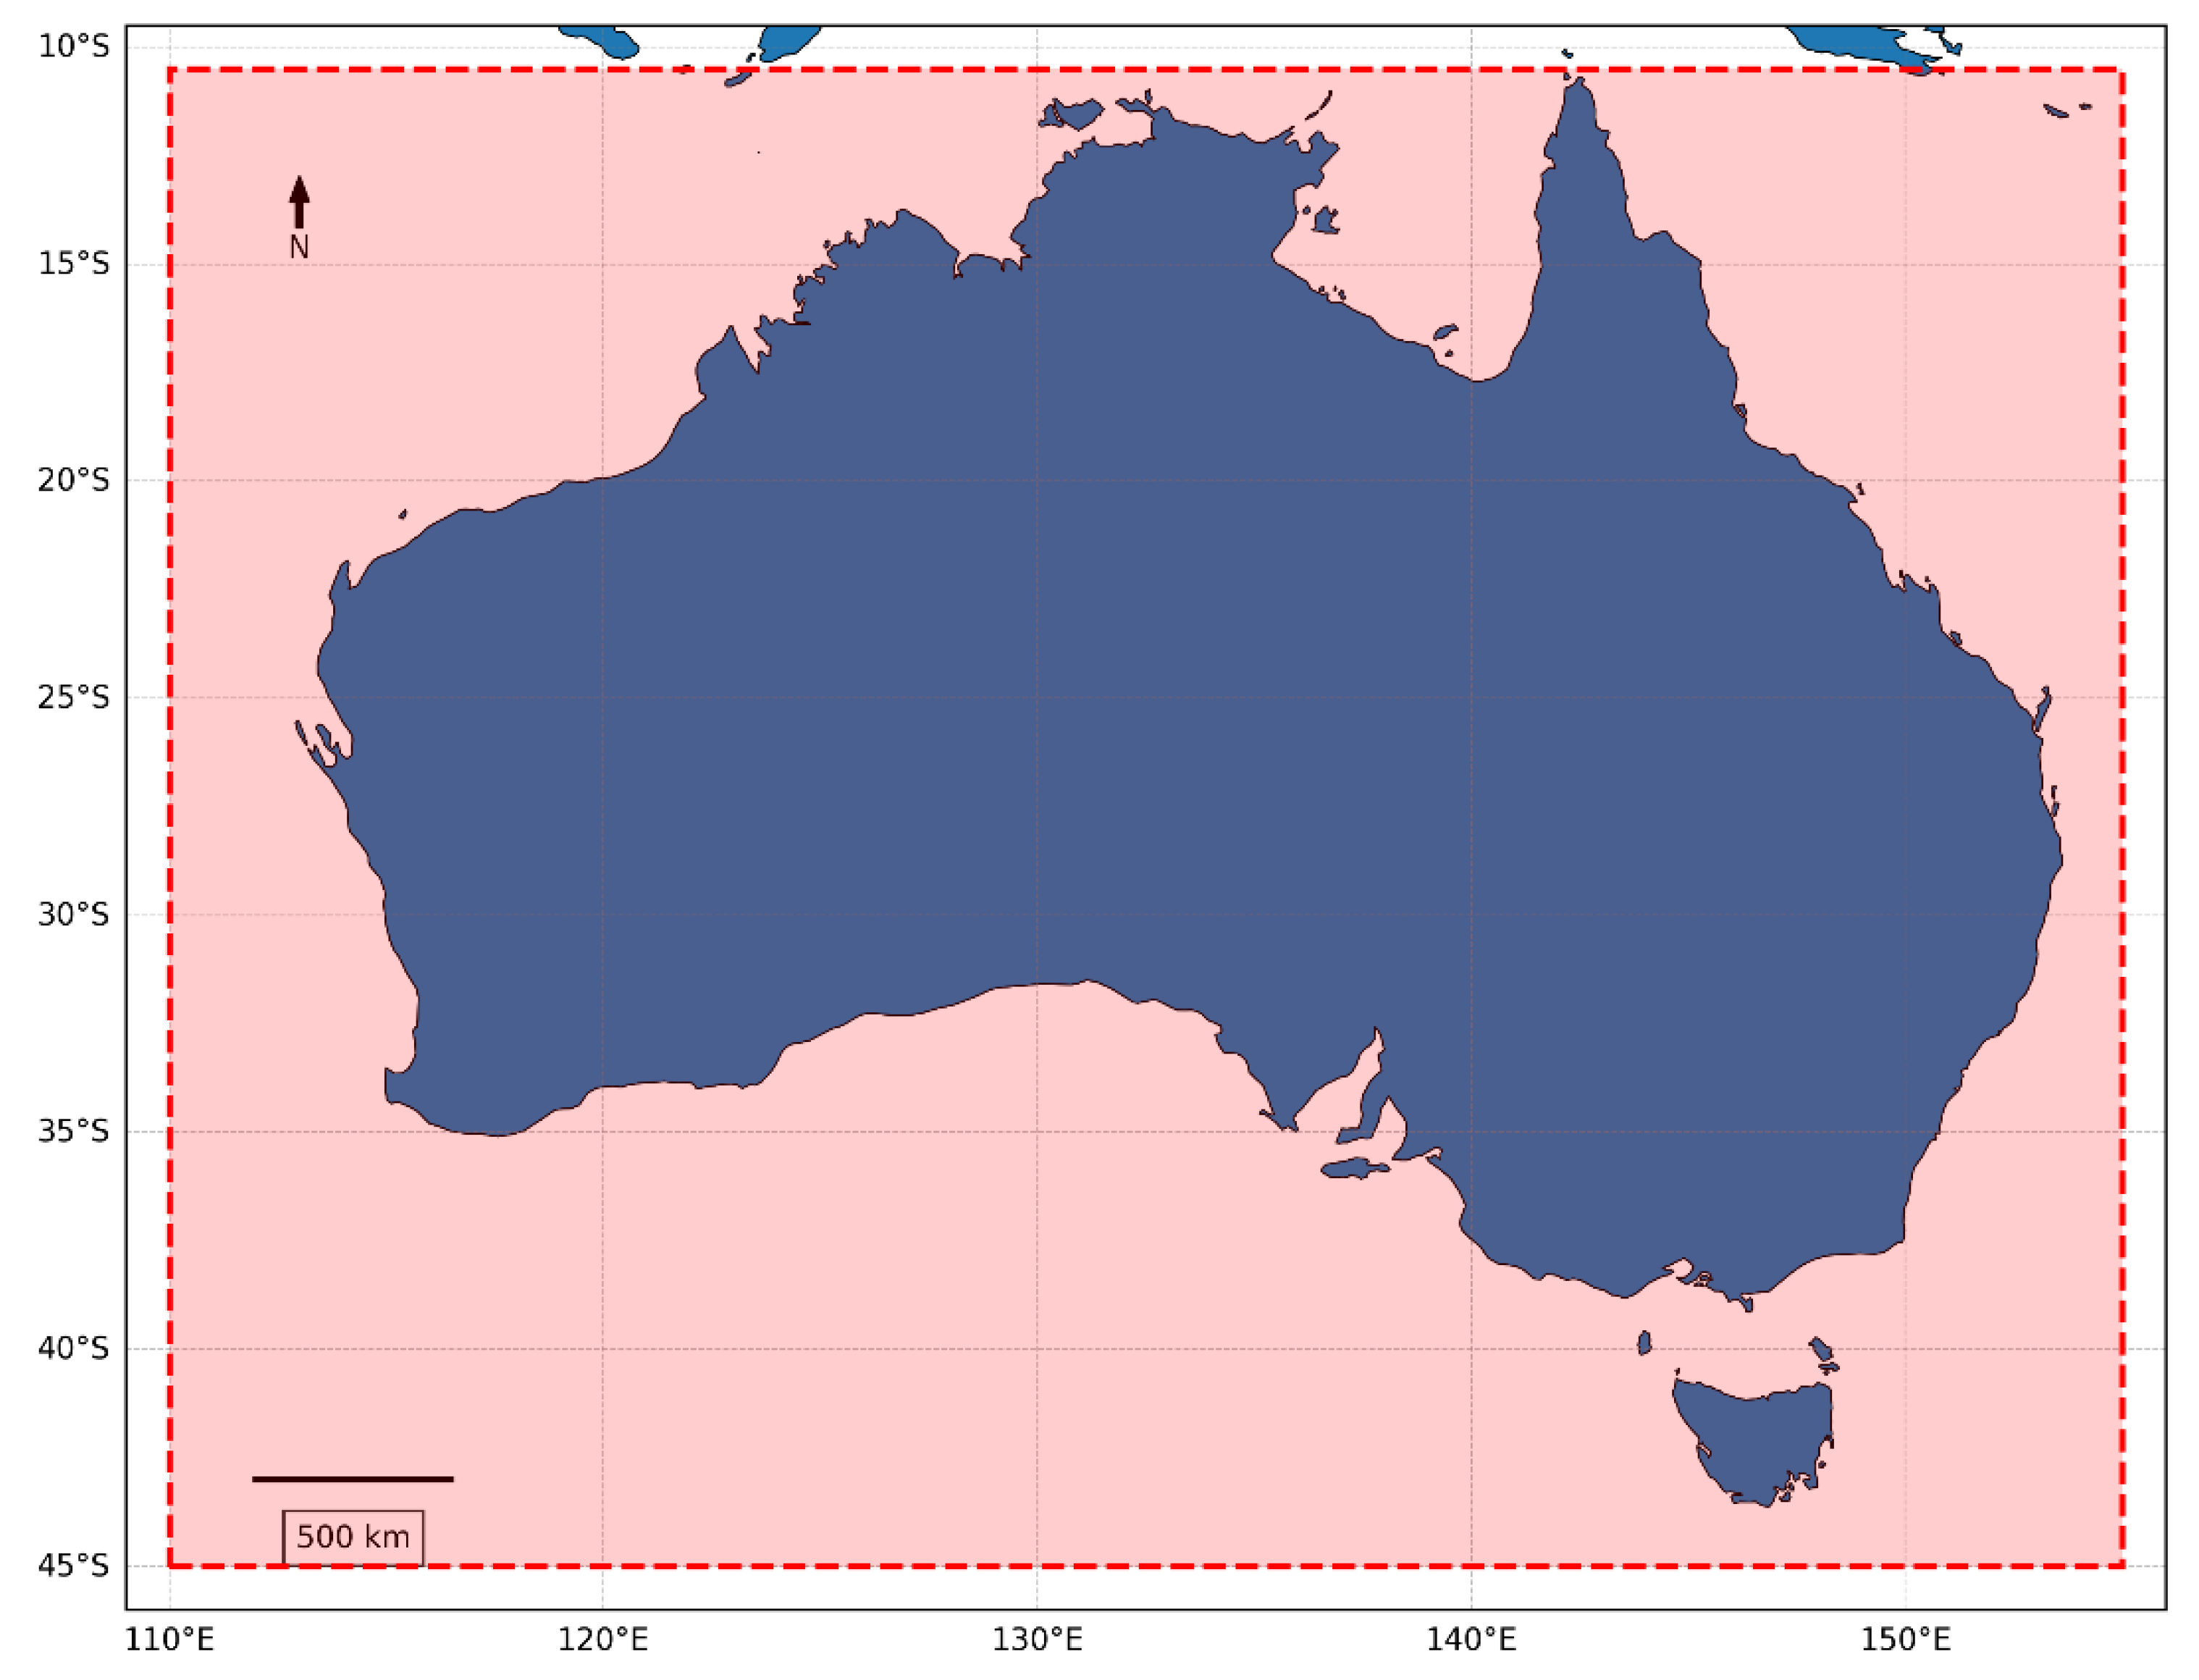
Figure 2.
Flowchart for Climate Risk Index Development.
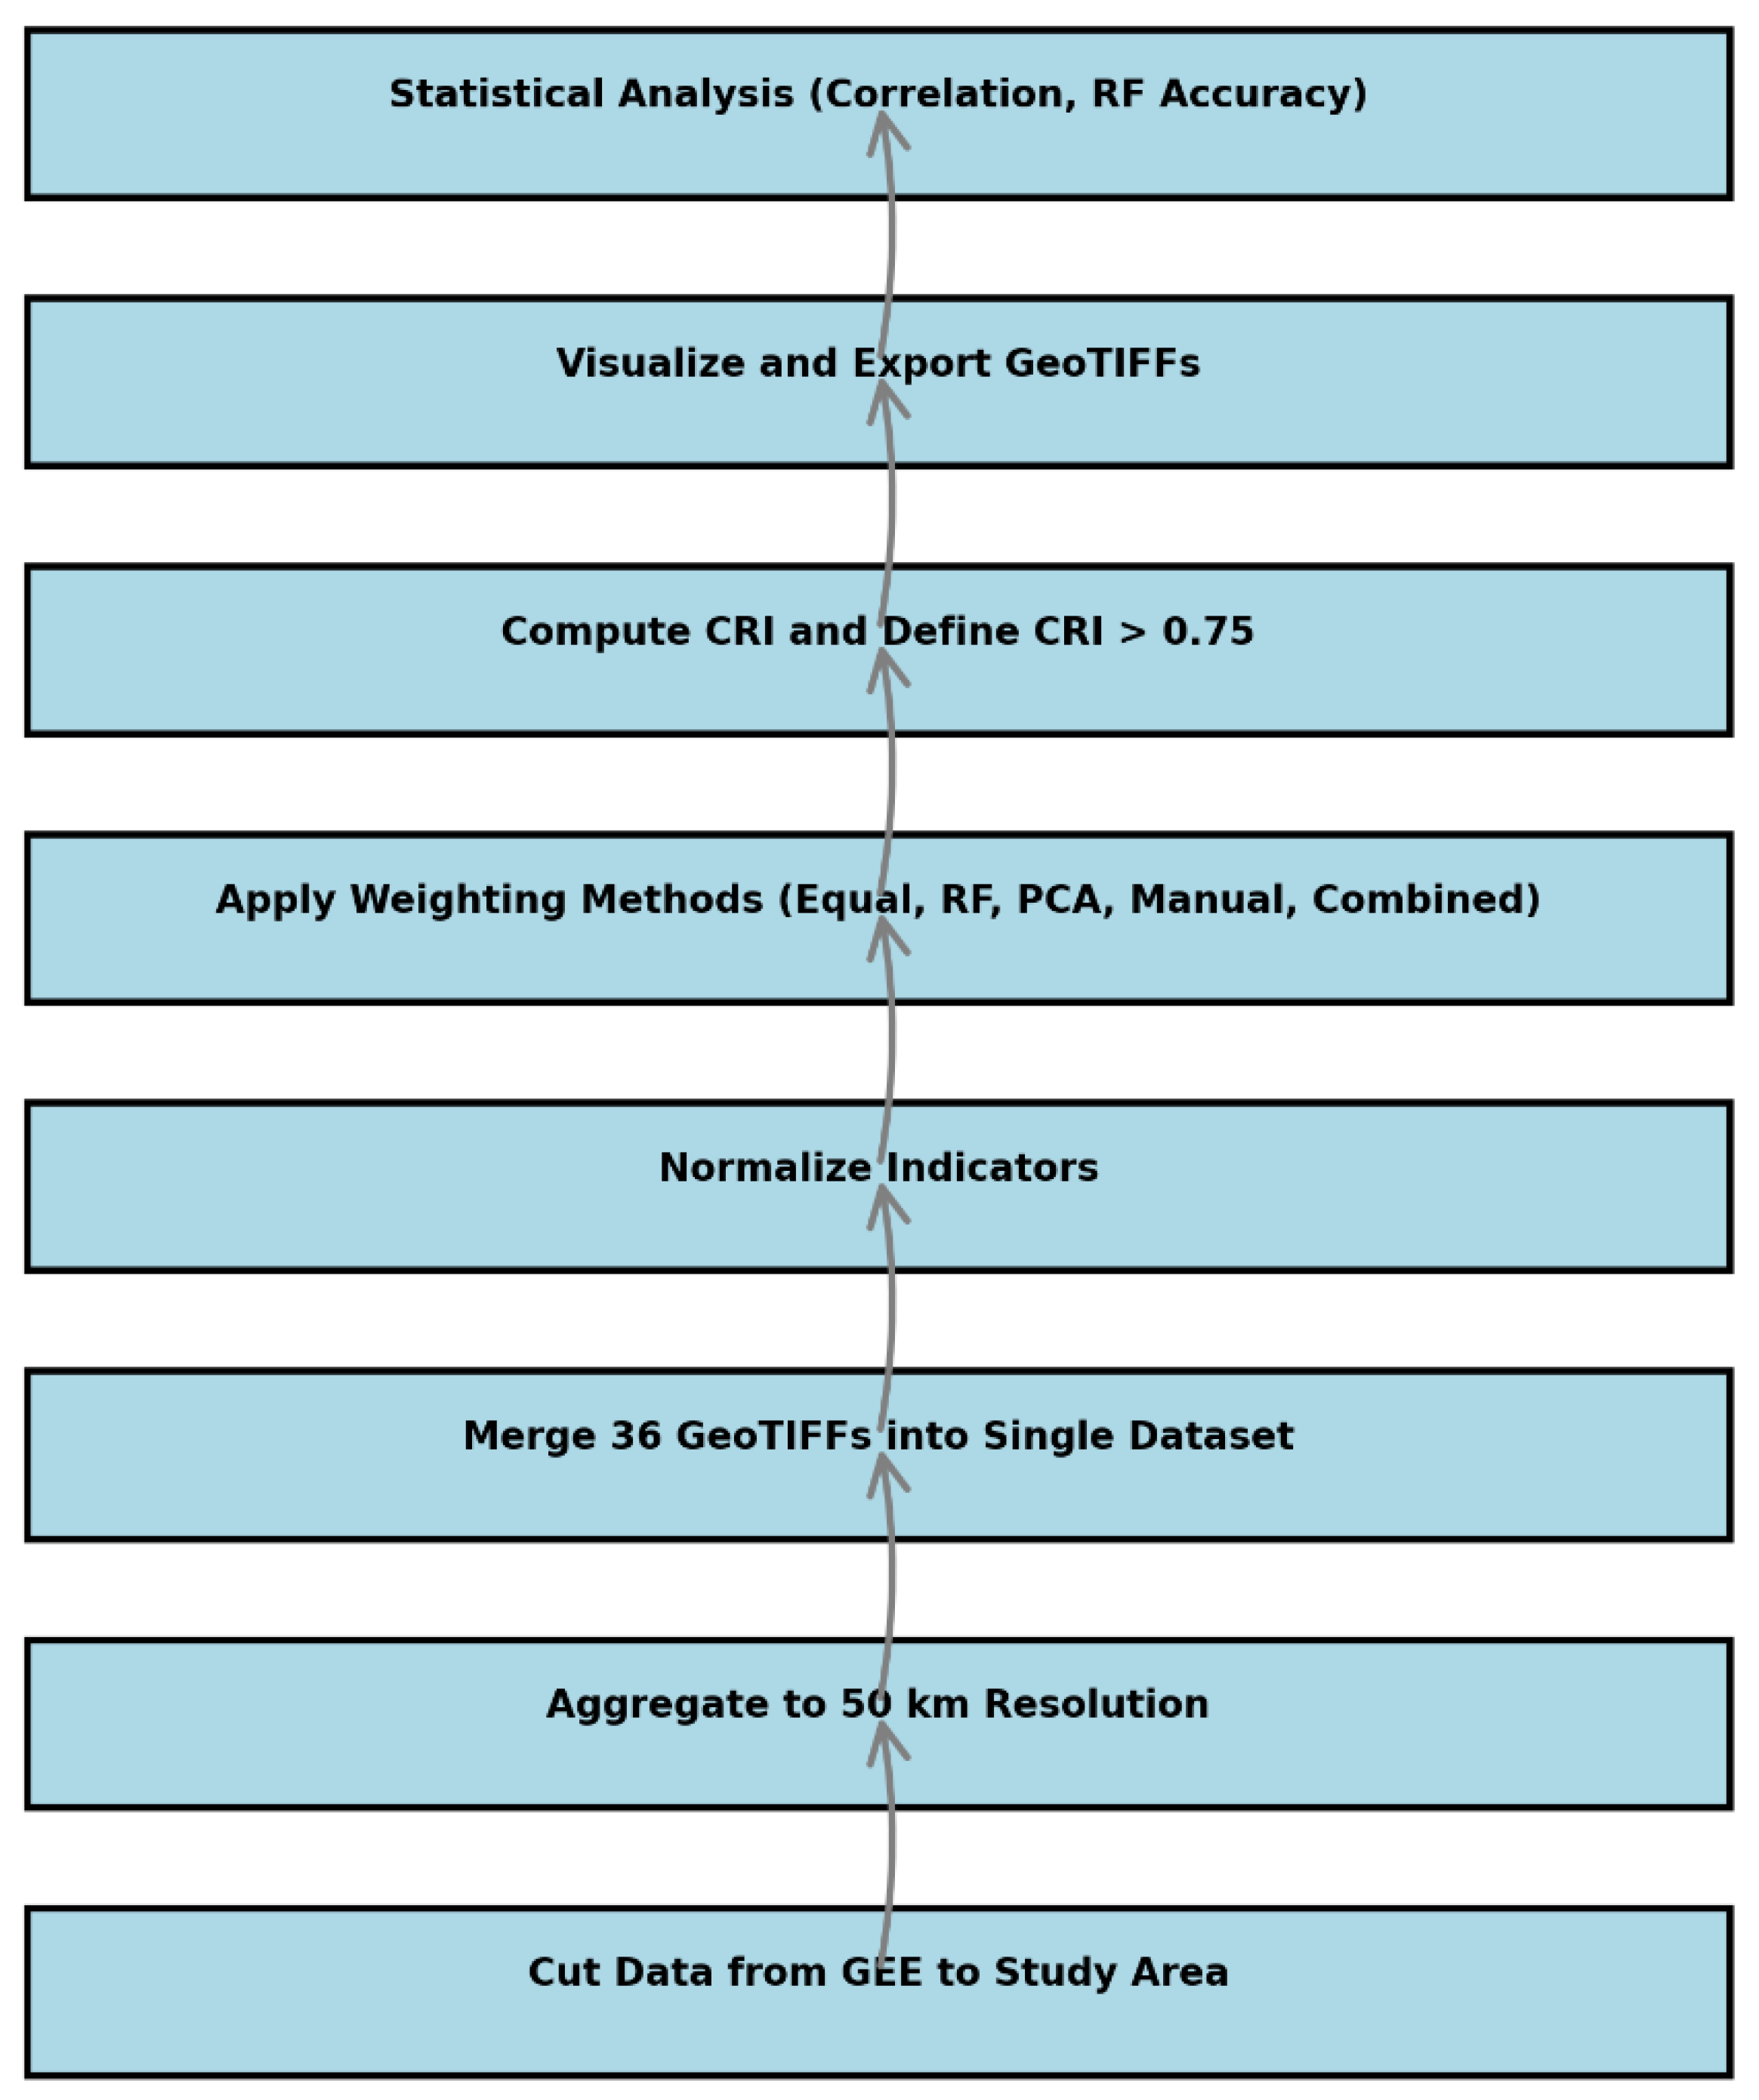
Figure 3.
Correlation Matrix of CRI Components (2017–2024). Significance Correlations Markers (* p < 0.05, ** p < 0.01).
Figure 3.
Correlation Matrix of CRI Components (2017–2024). Significance Correlations Markers (* p < 0.05, ** p < 0.01).
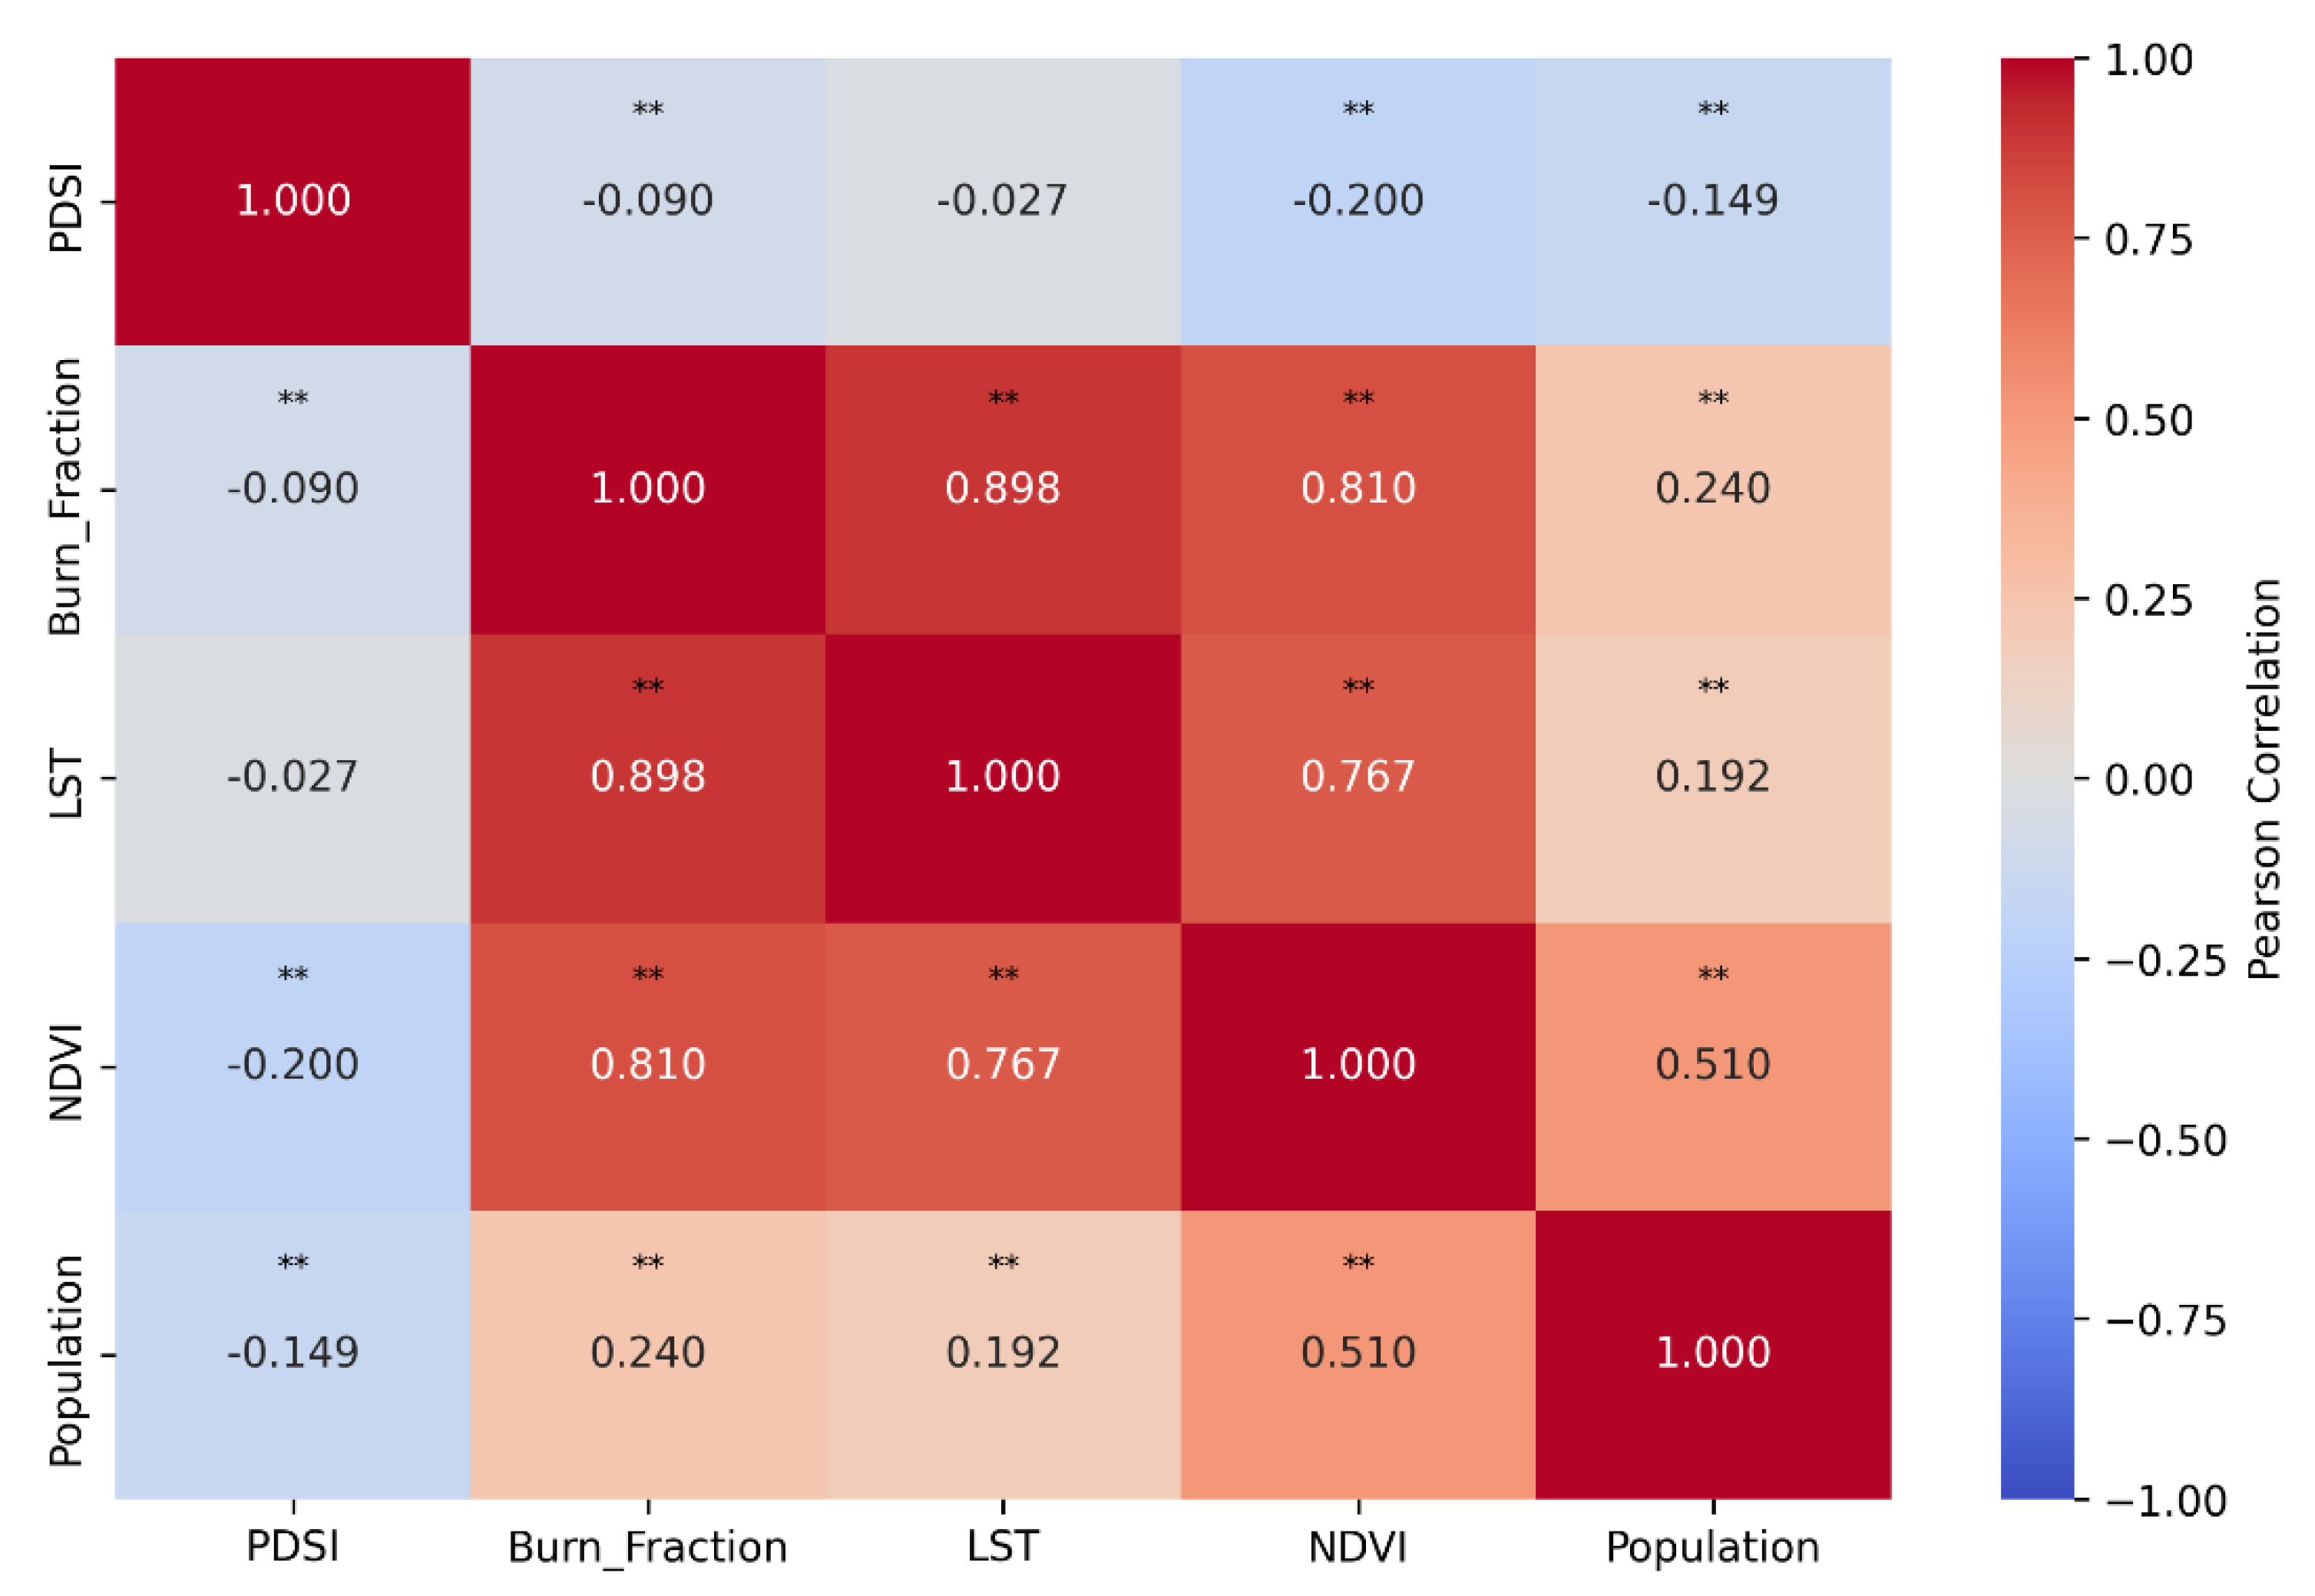
Figure 4.
Random Forest Feature Importance for CRI Components.
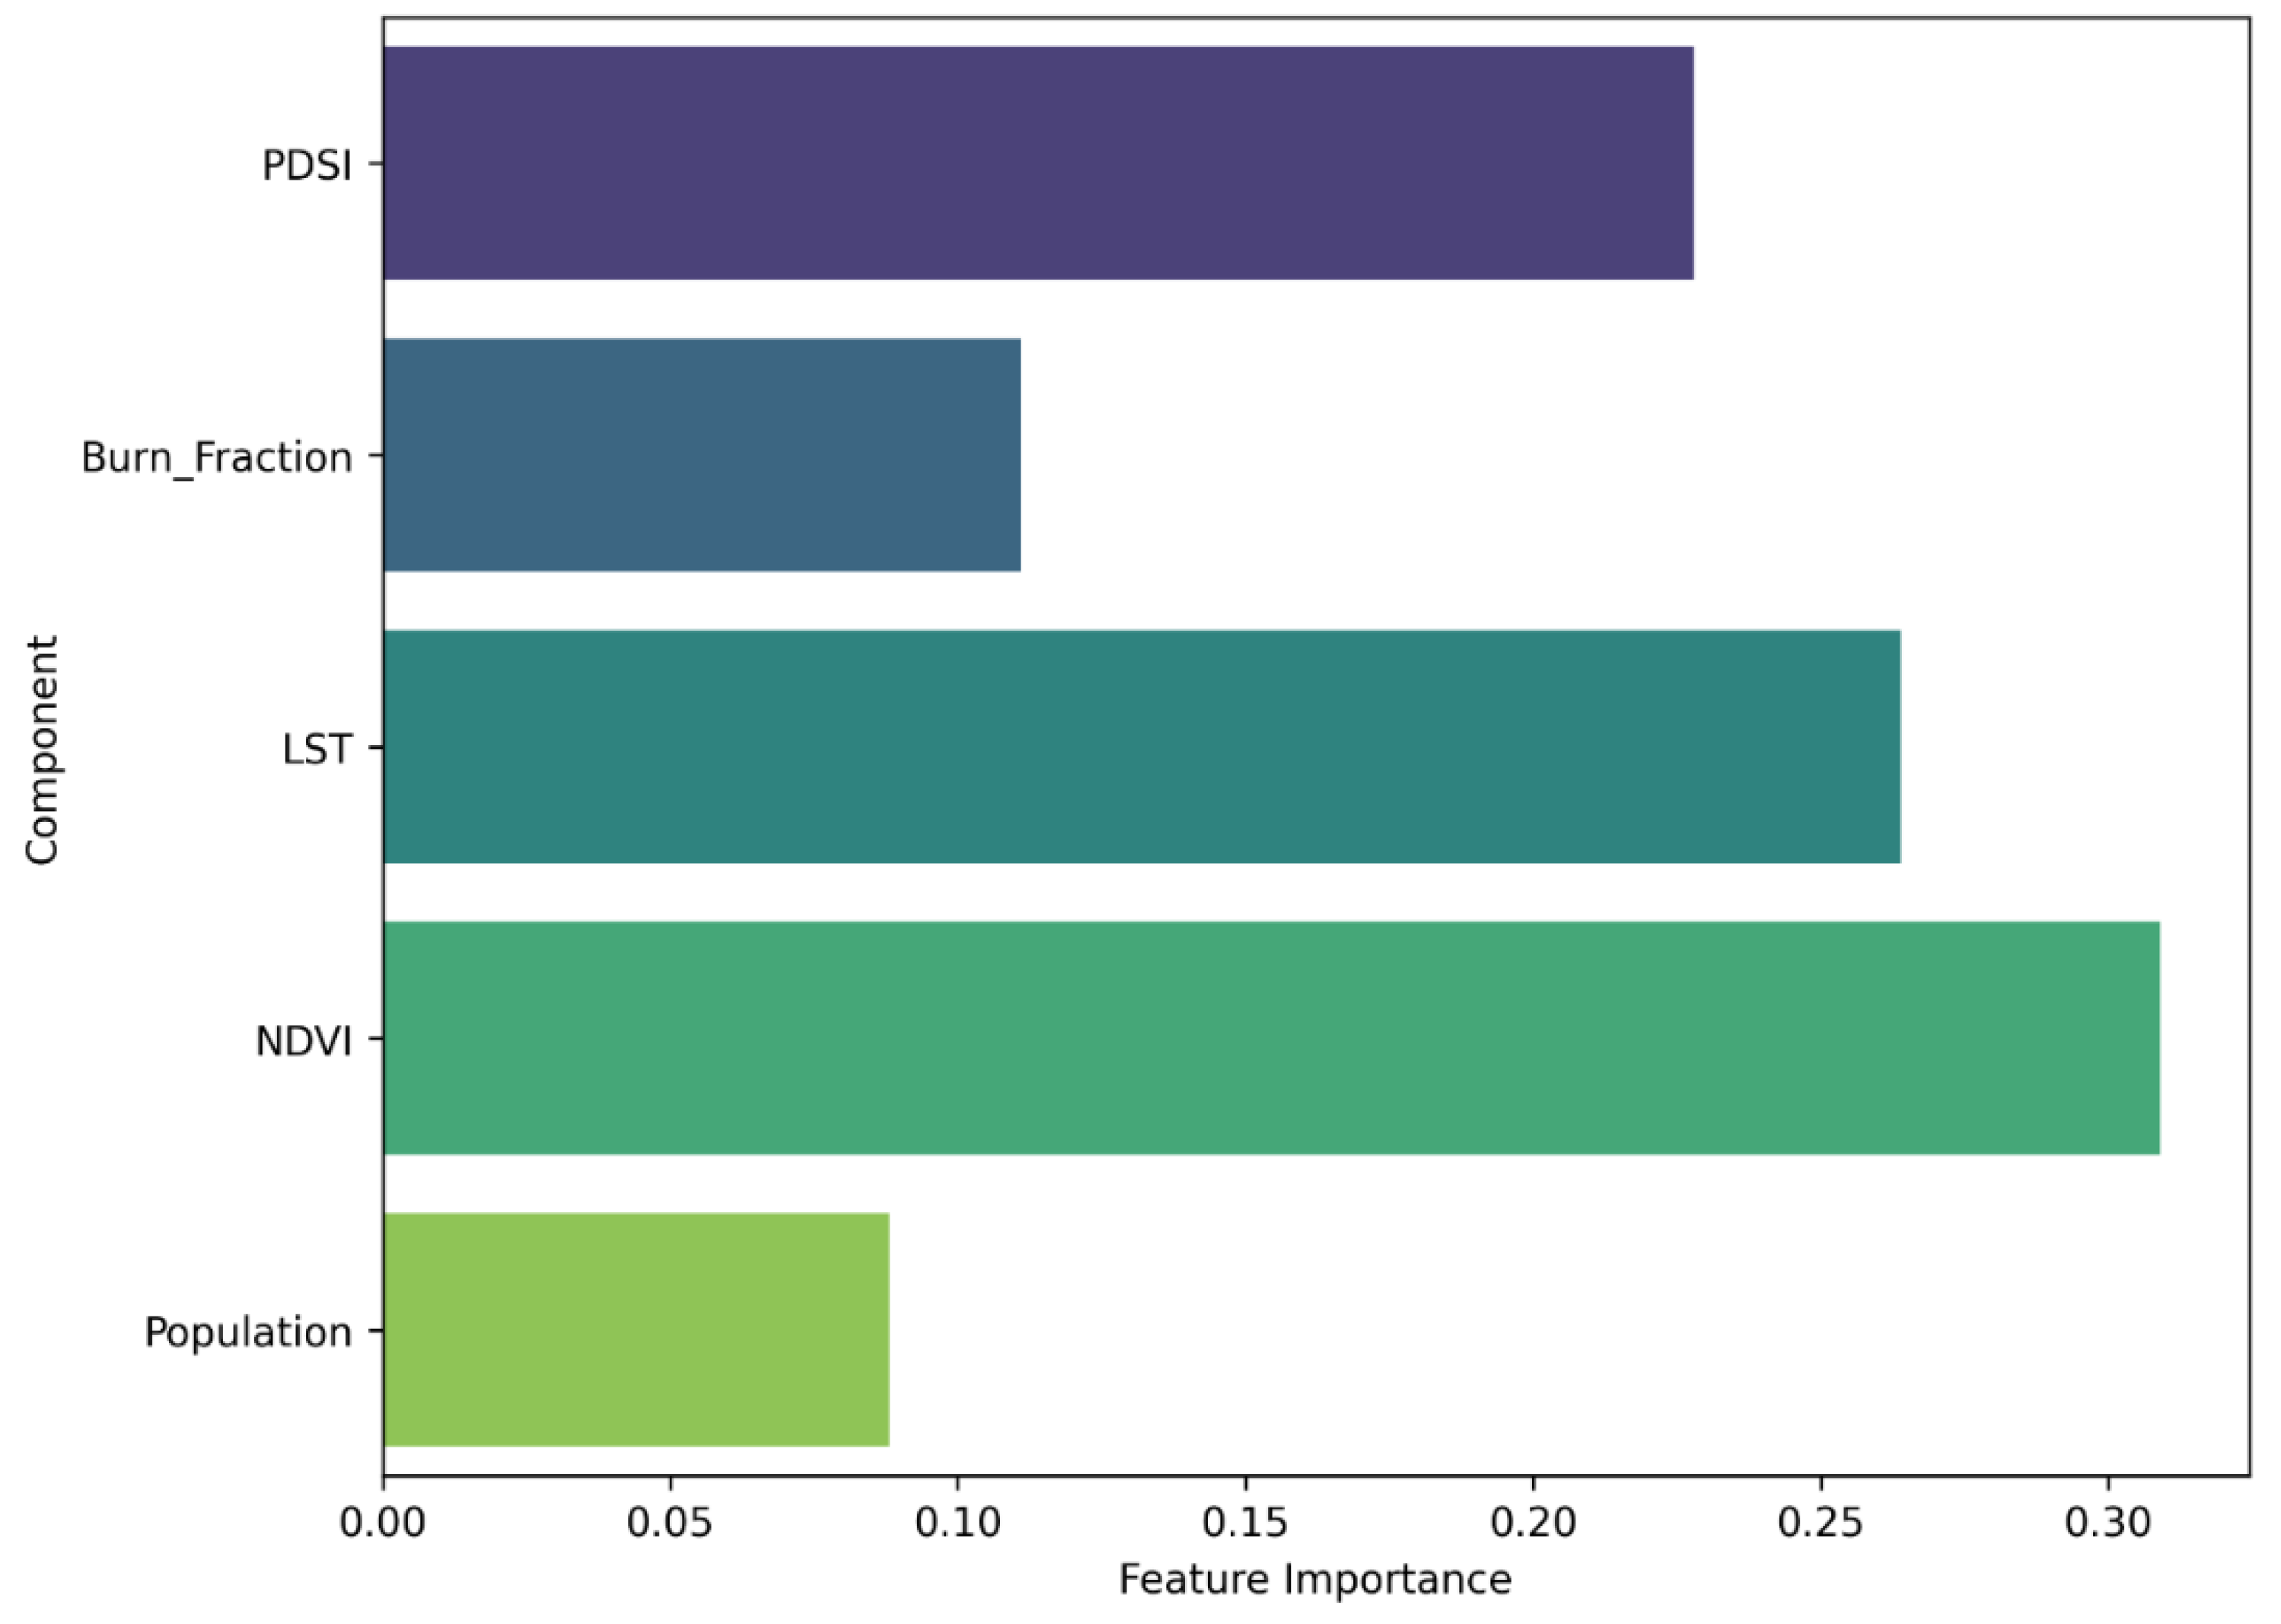
Figure 5.
Number of High-Risk Pixels (CRI > 0.75) by Weighting Approach.
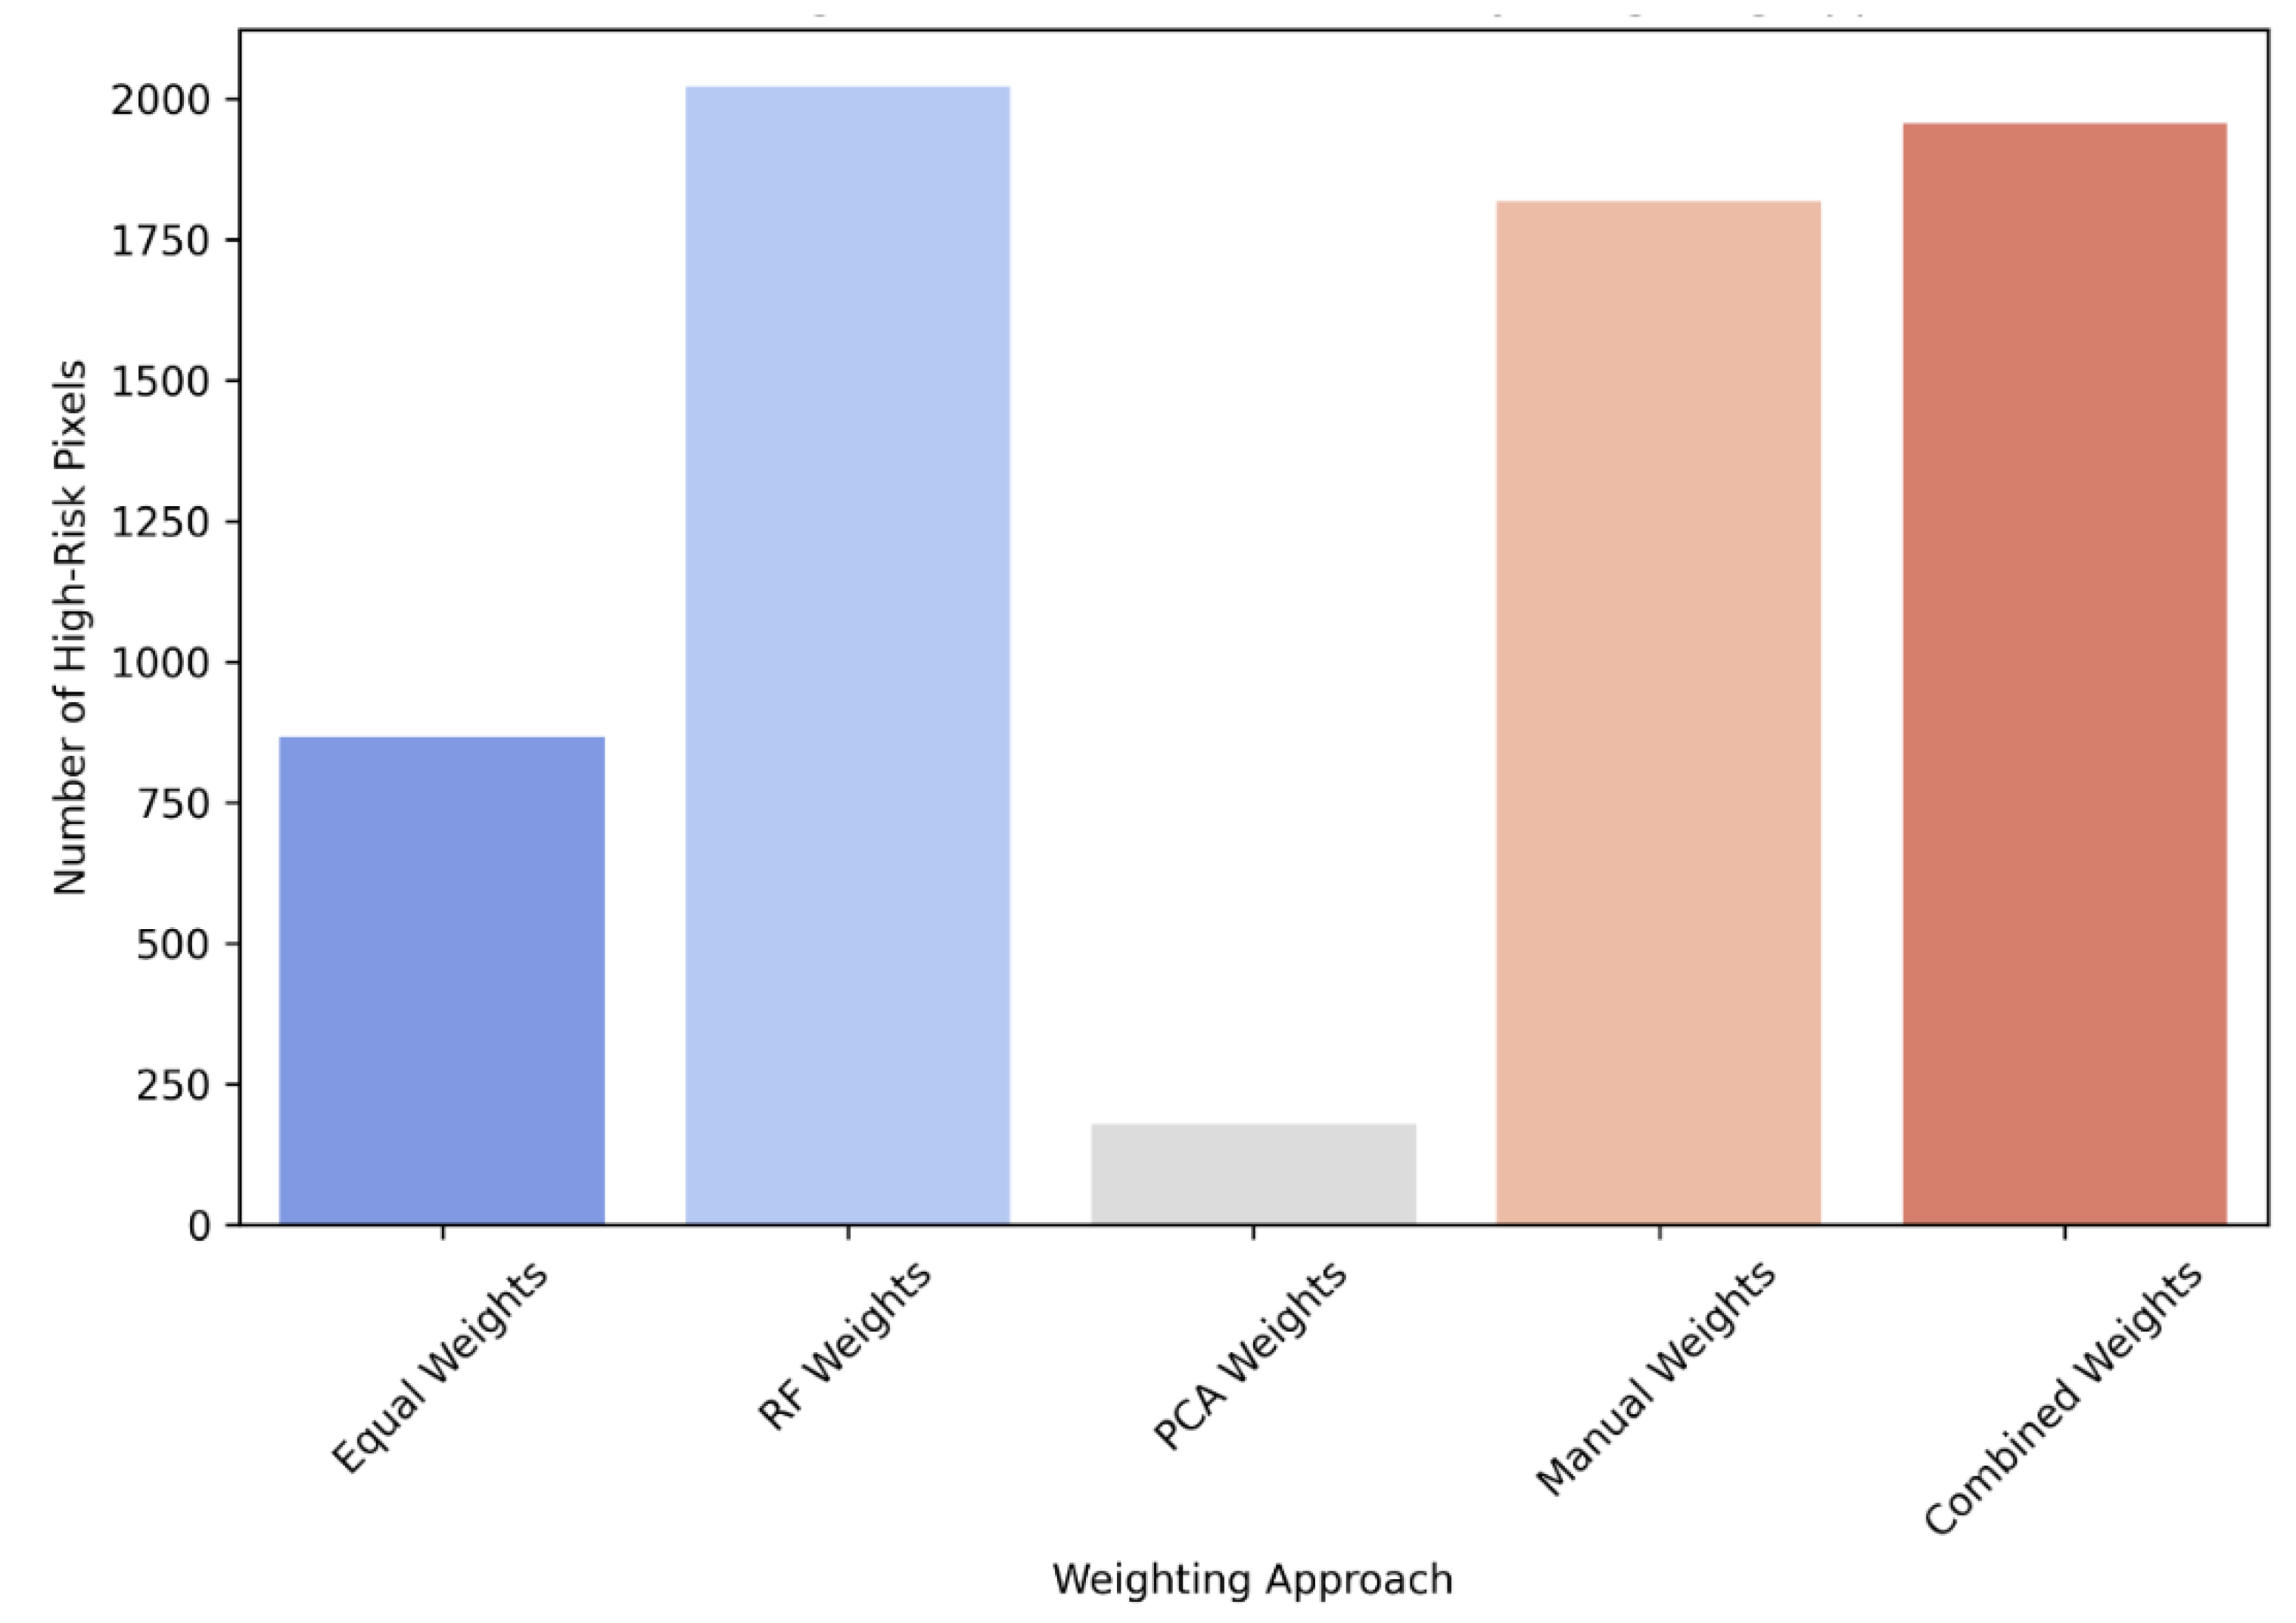
Figure 6.
Climate Risk Index (CRI) Maps Across Weighting Approaches.
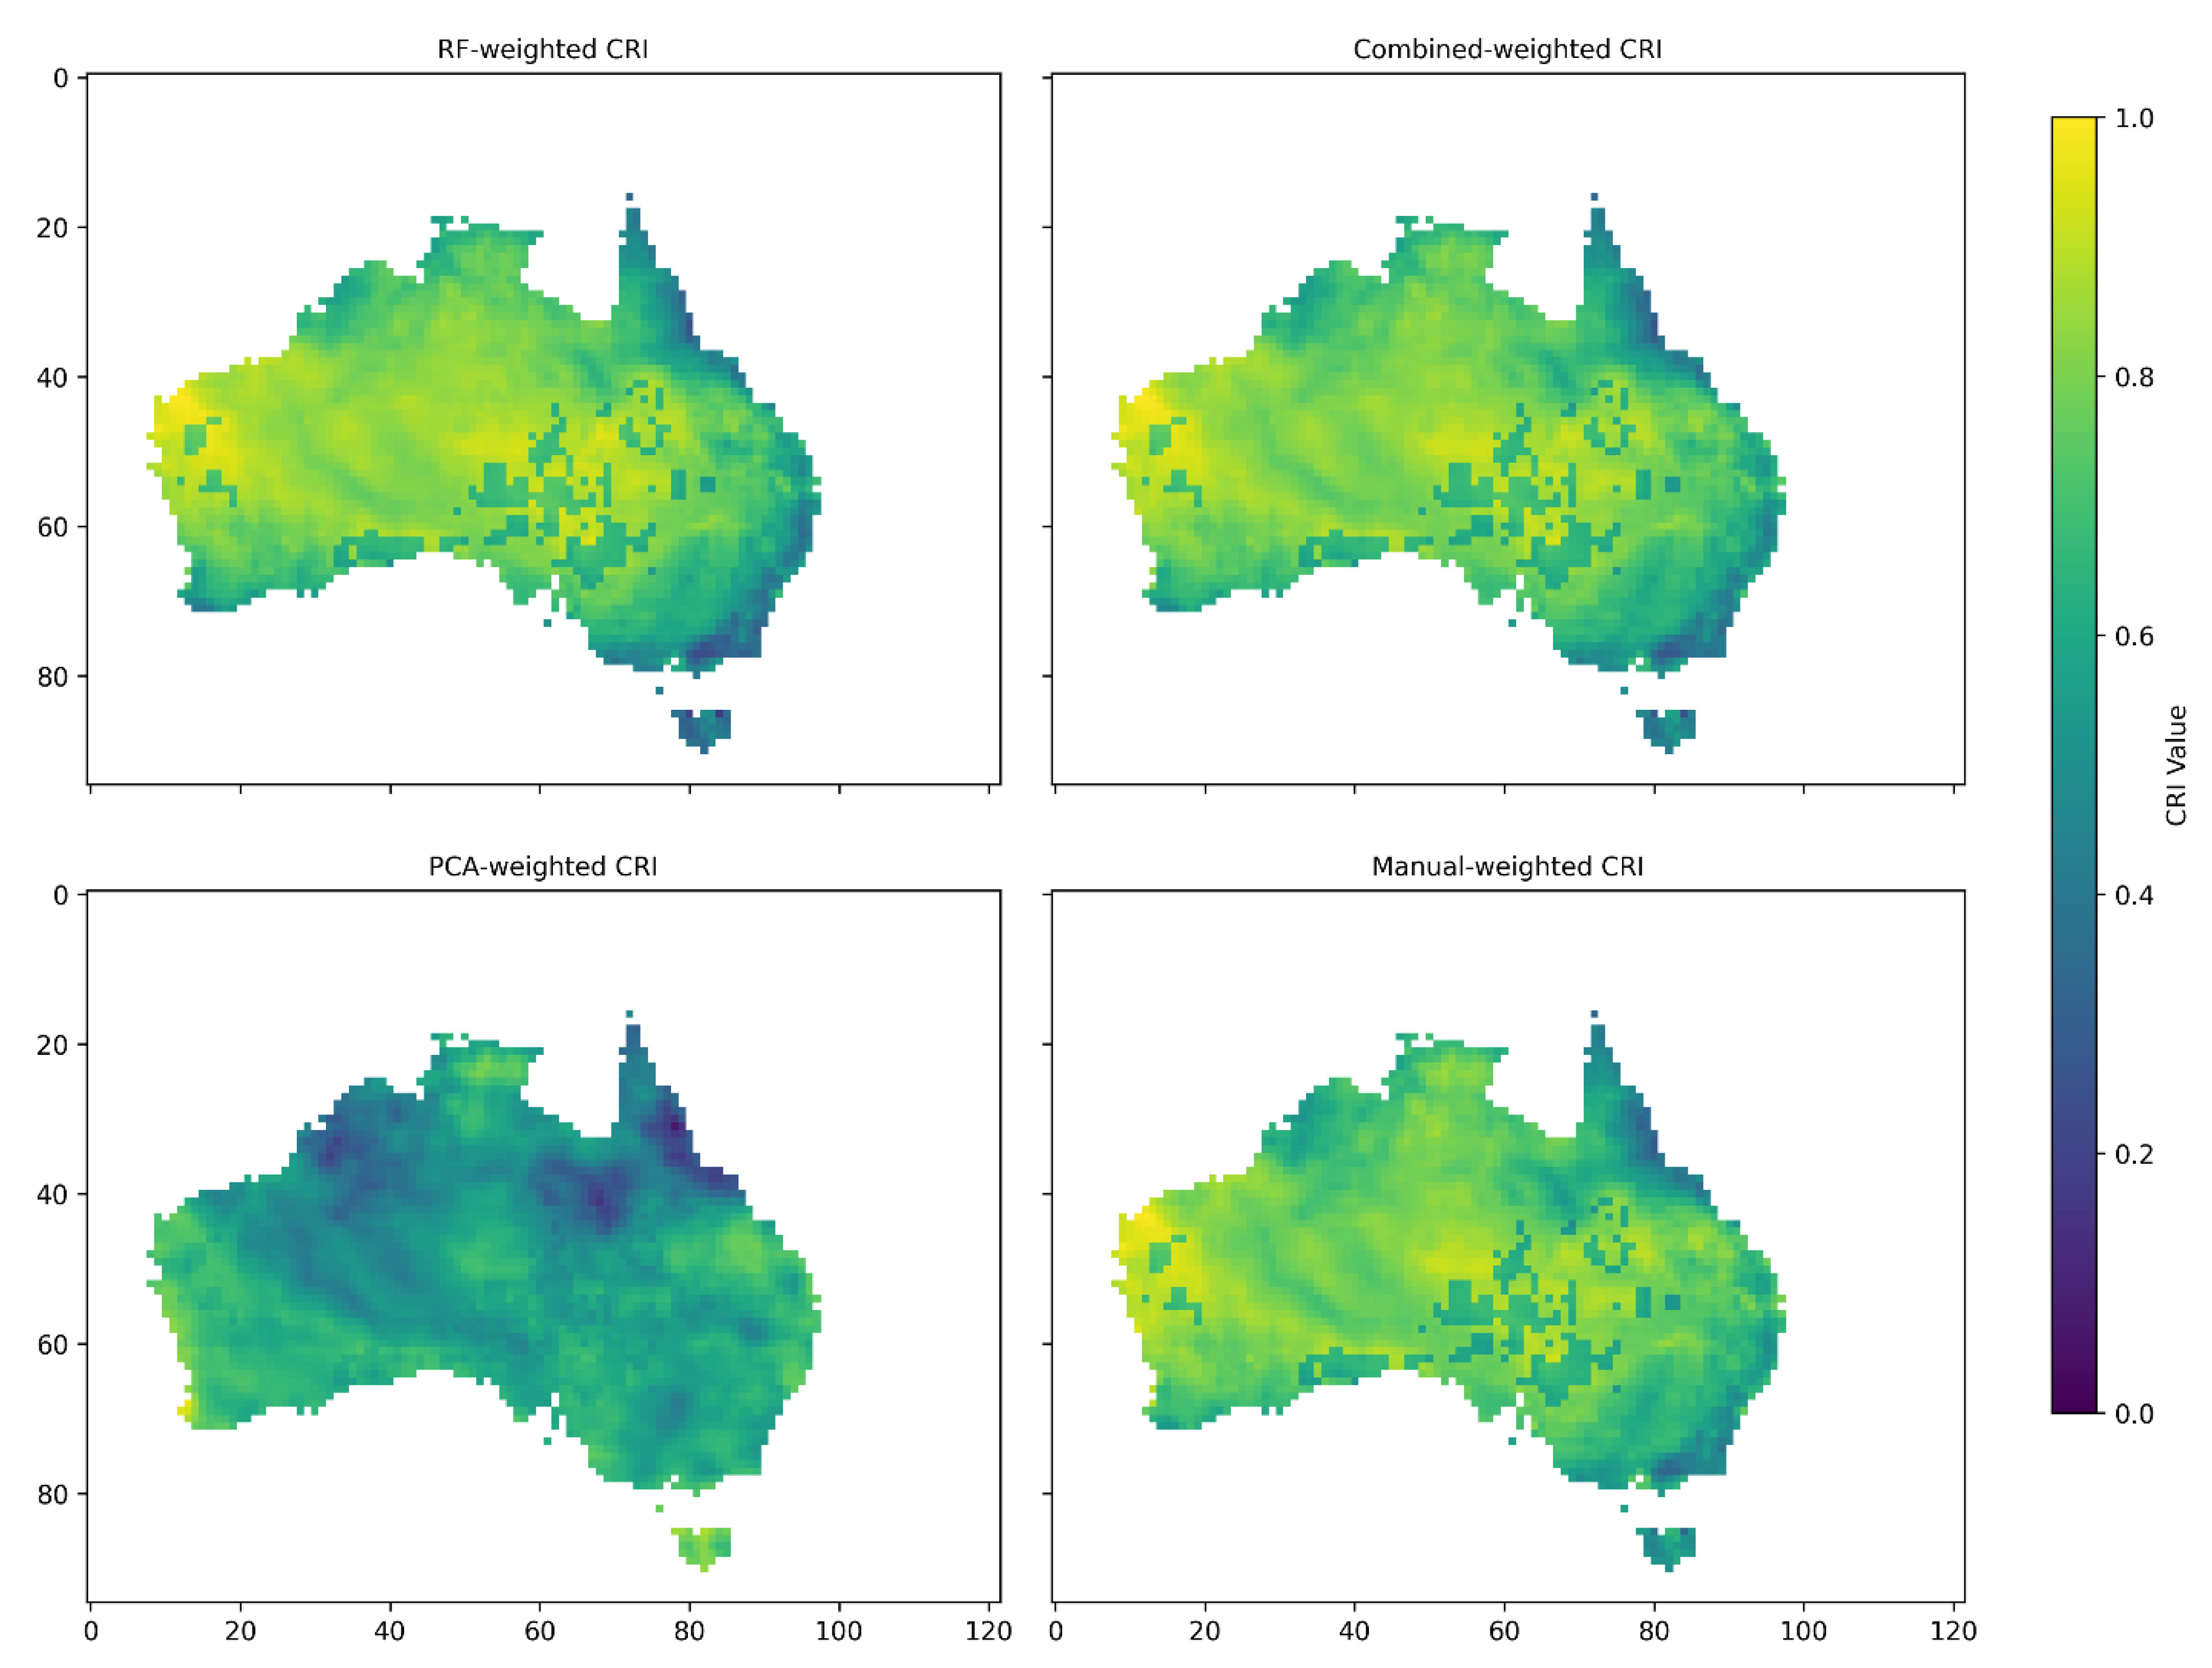
Figure 7.
High-Risk Pixels (CRI > 0.75) Under RF-Weighted CRI (2017–2024).
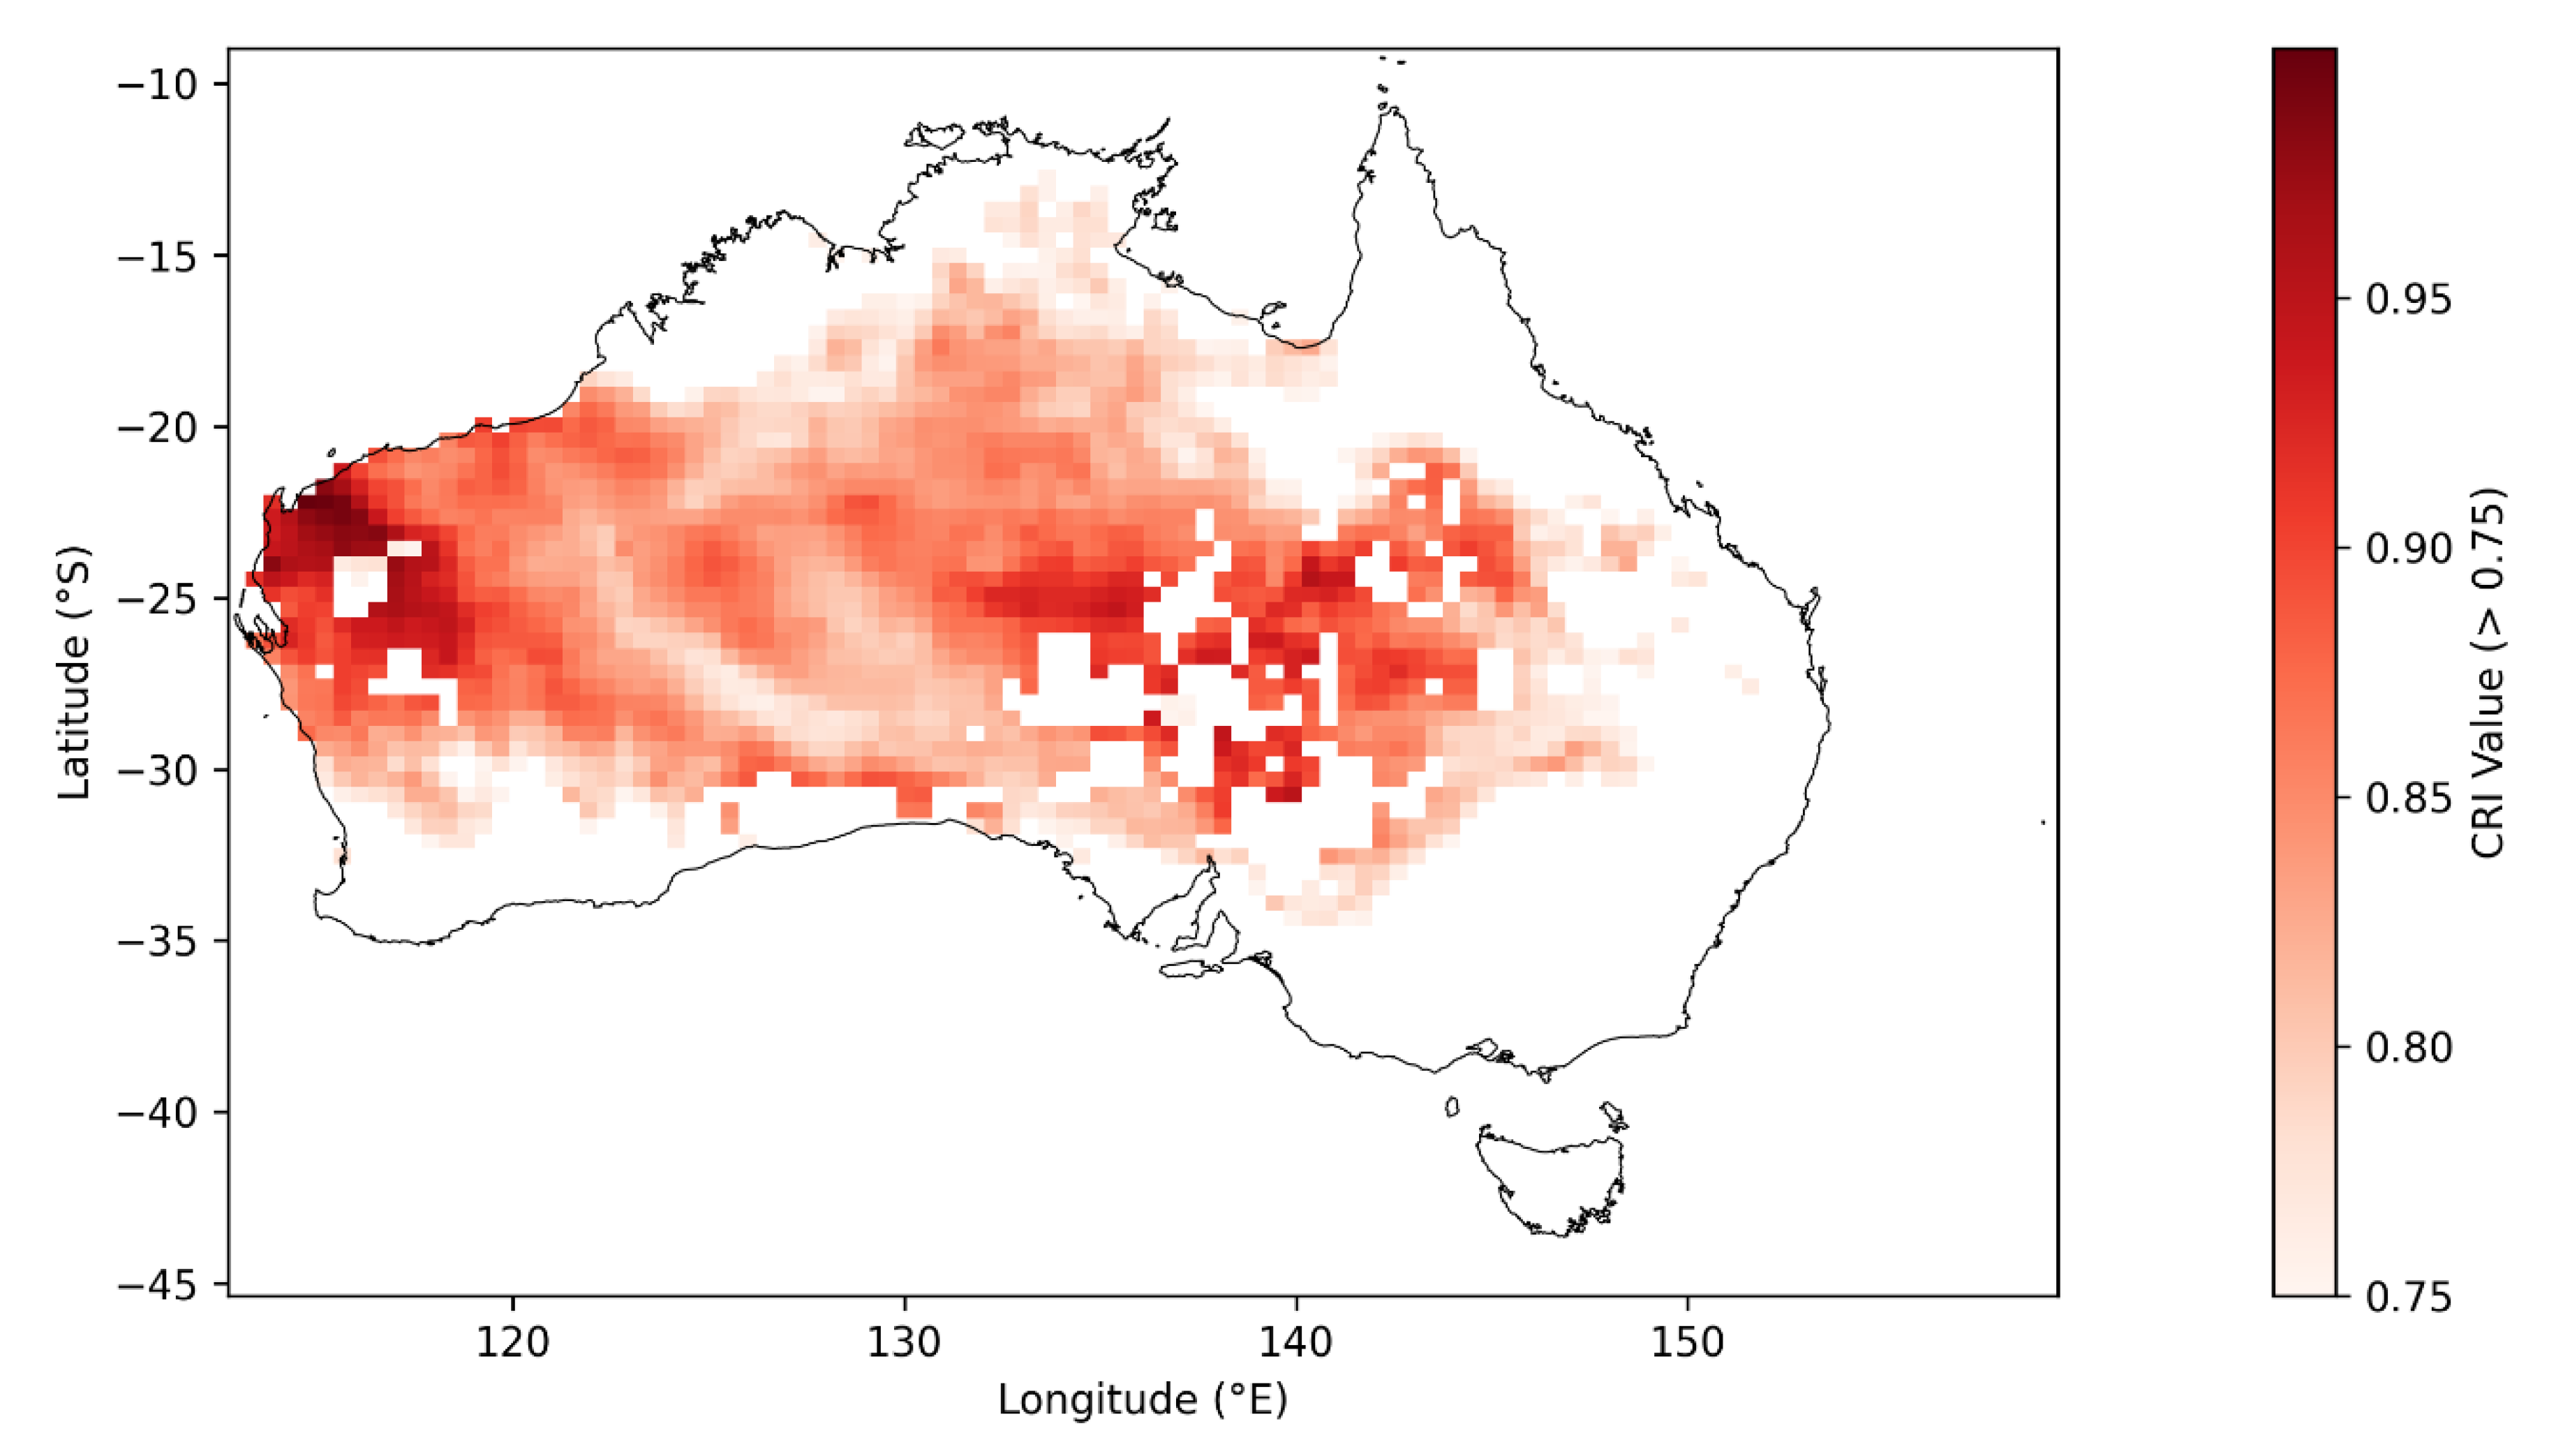

Table 1.
Projection Details for Aggregated Datasets.
| Dataset | Initial Scale (m) | Intermediate Scale (m) | Final Scale (m) |
| PDSI | 4000 | 37500 | 50000 |
| Burn Fraction | 500 | 40000 | 50000 |
| LST | 1000 | 37500 | 50000 |
| NDVI | 1000 | 37500 | 50000 |
| Population | 1000 | 37500 | 50000 |
Table 2.
Random Forest Feature Importances and Normalized Weights. Feature importances, normalized to sum to 1, are used as weights in the RF-weighted CRI computation.
Table 2.
Random Forest Feature Importances and Normalized Weights. Feature importances, normalized to sum to 1, are used as weights in the RF-weighted CRI computation.
| Indicator | Feature Importance | Normalized Weight |
| PDSI | 0.228 | 0.228 |
| Burn Fraction | 0.111 | 0.111 |
| LST | 0.264 | 0.264 |
| NDVI | 0.309 | 0.309 |
| Population | 0.088 | 0.088 |
Table 3.
Combined RF-Manual Weights.
| Indicator | Combined Weight |
| PDSI | 0.264 |
| Burn Fraction | 0.105 |
| LST | 0.232 |
| NDVI | 0.255 |
| Population | 0.094 |
Disclaimer/Publisher’s Note: The statements, opinions and data contained in all publications are solely those of the individual author(s) and contributor(s) and not of MDPI and/or the editor(s). MDPI and/or the editor(s) disclaim responsibility for any injury to people or property resulting from any ideas, methods, instructions or products referred to in the content. |
© 2025 by the authors. Licensee MDPI, Basel, Switzerland. This article is an open access article distributed under the terms and conditions of the Creative Commons Attribution (CC BY) license (http://creativecommons.org/licenses/by/4.0/).
Copyright: This open access article is published under a Creative Commons CC BY 4.0 license, which permit the free download, distribution, and reuse, provided that the author and preprint are cited in any reuse.


