
Submitted:
29 July 2025
Posted:
30 July 2025
You are already at the latest version
Abstract
Background/Objectives: Vision impairment due to retinal diseases represents a significant global health challenge, necessitating early and accurate detection. This study aimed to develop and validate a unified deep learning framework capable of classifying nine distinct retinal conditions from color fundus photographs. Methods: A publicly available dataset comprising 5,318 fundus photographs across nine diagnostic categories was utilized. Images underwent standardized preprocessing, normalization, and comprehensive data augmentation to mitigate class imbalance. Three advanced deep learning architectures ResNet-151, EfficientNetV2, and a YOLOv11-based classifier were implemented, leveraging transfer learning from ImageNet. Model performance was rigorously evaluated using accuracy, precision, recall, F1-score, and AUC metrics on an independent hold-out test set. Results: The YOLOv11-based classifier achieved the highest overall accuracy (90.2%), macro-averaged recall (90.5%), precision (90.7%), and F1-score (90.4%), significantly outperforming both EfficientNetV2 and ResNet-151 models. ROC analysis confirmed superior discriminative capability (AUC=0.93) for the YOLOv11-based model, with statistically significant improvements validated through DeLong and McNemar’s tests (p<0.01). Despite robust overall performance, specific misclassifications occurred between optically similar conditions, such as optic disc edema and glaucoma, highlighting ongoing diagnostic challenges. Conclusions: This study demonstrated that a unified YOLOv11-based deep learning framework can accurately perform multi-class retinal disease classification from fundus photographs. The proposed model offers significant potential as an AI-driven screening tool, effectively addressing the limitations of traditional single-disease diagnostic systems, and providing a critical step toward improved diagnostic workflows and patient outcomes in ophthalmology.
Keywords:
deep learning
; fundus photography
; multi-class classification
; computer-aided diagnosis
; YOLO
1. Introduction
Vision impairment and blindness represent significant global health challenges, affecting an estimated 2.2 billion people worldwide, with at least 1 billion of these cases being preventable or yet to be addressed [1]. A substantial portion of this burden is attributable to posterior segment diseases of the eye, which often progress silently until they reach advanced, irreversible stages. Among these, diabetic retinopathy and glaucoma are the leading causes of preventable blindness in working-age adults and the elderly, respectively [2,3]. Other vision-threatening conditions, such as retinal detachment, a critical ophthalmic emergency, and pathologic myopia, a condition of growing prevalence, further contribute to the global burden of sight loss [4,5]. The efficacy of interventions for these pathologies is critically dependent on early and accurate detection, making widespread screening programs an essential pillar of public health strategies to mitigate irreversible visual disability.
Color fundus photography is the primary modality for retinal screening and diagnosis. This non-invasive, cost-effective technique provides high-resolution digital images of the retina, optic nerve head, and retinal vasculature, enabling clinicians to identify and document a wide array of pathological features [6]. Its utility has been pivotal in the expansion of teleophthalmology programs, which aim to bridge the gap in specialist eye care for remote and underserved populations. However, the interpretation of fundus images is a manual, time-consuming process that relies heavily on the availability of highly trained ophthalmologists and graders. This dependency creates a significant bottleneck in large-scale screening efforts, and the inherent subjectivity in human interpretation can lead to inter-observer variability, potentially affecting diagnostic consistency [7].
To address these challenges, the field of medical imaging has witnessed a paradigm shift with the advent of artificial intelligence (AI), particularly deep learning. Convolutional Neural Networks (CNNs), a class of deep learning algorithms, have demonstrated remarkable performance in image recognition tasks, often matching or even exceeding human-level accuracy [8]. In ophthalmology, this has led to the development of highly successful automated systems for detecting specific diseases in fundus photographs. Landmark studies have validated deep learning models for screening diabetic retinopathy and diabetic macular edema with exceptionally high sensitivity and specificity [9,10]. Similar successes have been reported for glaucoma detection, age-related macular degeneration, and classification of retinopathy of prematurity, establishing artificial intelligence as a robust tool for single-disease screening paradigms [11,12].
However, despite these successes, the prevailing paradigm in ophthalmic artificial intelligence is the development of siloed, single-disease models. These systems, while powerful for targeted screening, are trained to answer narrow binary questions, such as the presence or absence of DR, and are blind to other pathologies. This does not reflect the complex reality of a clinical encounter, where a patient may present with one of several conditions or even coexisting diseases. A model trained only to detect glaucoma, for example, would fail to flag a swollen optic disc caused by life-threatening intracranial pressure, creating a false sense of security and a missed opportunity for urgent intervention [13]. The clinical need is not just for disease detection but also for differential diagnosis, a sophisticated process of distinguishing between conditions with similar signs. This task is made more complex by the high inter-class similarity and intra-class variability in retinal pathologies, posing a substantial technical challenge that binary classifiers are ill-equipped to handle [14].
Therefore, the central objective of this study was to move beyond the single-disease paradigm and develop a comprehensive diagnostic framework capable of automated multi-class classification for a wide spectrum of retinal conditions. Achieving this goal with high fidelity requires more than simply extending a binary model; it necessitates the use of innovative deep learning architectures and training strategies that can learn subtle discriminative features from complex image data [15]. The central hypothesis of this study is that by leveraging a state-of-the-art deep learning architecture enhanced with mechanisms to improve feature representation and handle the inherent challenges of multi-class imbalance, we can create a unified model that performs a holistic initial assessment of fundus photographs with a high degree of diagnostic accuracy. This study's framework is designed to simultaneously classify nine clinically crucial categories: Diabetic Retinopathy, Glaucoma, Pathologic Myopia, Retinal Detachment, Central Serous Chorioretinopathy, Retinitis Pigmentosa, Optic Disc Edema, Macular Scar, and Healthy fundi.
To address this critical gap, this study details the design, development, and rigorous validation of a novel deep learning framework for the automated classification of nine distinct retinal conditions from fundus photographs. By leveraging a state-of-the-art CNN architecture and evaluating it on a large, independent dataset, we demonstrated that a single, unified model can achieve high diagnostic accuracy in differentiating a wide spectrum of pathologies, ranging from common diseases to critical emergencies. This study represents a significant step towards a comprehensive, artificial intelligence-driven screening tool capable of enhancing diagnostic workflows and improving patient care in diverse clinical settings.
2. Materials and Methods
2.1. Study Dataset
This study utilized a publicly available dataset of retinal fundus images, the "Eye Disease Image Dataset," sourced from Mendeley Data [16]. The use of a public anonymized dataset ensured transparency and allowed for the reproducibility of our results. The dataset comprised 5,318 original color fundus photographs collected and classified with the [e assistance of domain experts from Anwara Hamida Eye Hospital and B.N.S.B. Zahurul Haque Eye Hospital in Faridpur, Bangladesh. For our multi-class classification framework, we used images corresponding to eight distinct retinal pathologies and a normal (healthy) class, creating nine diagnostic categories. The specific distribution of images across the nine classes used in our study is detailed in Table 1. Figure 1 shows representative examples of the nine classes in the dataset.
2.2. Ethical Statement
This study was conducted in accordance with the tenets of the Declaration of Helsinki. This study exclusively utilized the "Eye Disease Image Dataset" [16], a publicly available and fully anonymized dataset. As all patient-identifying information was removed by the original data curators prior to public release, this secondary analysis did not require separate institutional review board or ethics committee approval.
2.3. Data Preprocessing and Augmentation
A systematic and rigorous data preparation pipeline was implemented to ensure model robustness, optimize the learning efficiency, and mitigate the risk of overfitting. The pipeline comprised three primary stages: image preprocessing, dataset partitioning, and data augmentation.
First, all images in the dataset were subjected to a standardized preprocessing protocol. Regardless of their original dimensions, all images were resized to a uniform resolution of 224 × 224 pixels. This standardization is a crucial prerequisite for modern deep learning architectures, ensuring dimensional consistency in the input layer of the network. After resizing, the pixel values of each image were normalized. The integer pixel values, originally in the range of [0, 255], were scaled to a floating-point range of [0, 1] by dividing each pixel value by 255, as follows: This normalization step is vital for stabilizing the training process because it prevents the gradients from becoming excessively large or small, thereby accelerating model convergence and improving overall performance.
Subsequently, the entire curated dataset of 5,318 images (Table 1) was partitioned into three independent subsets: a training set, a validation set, and a test set. This partitioning is fundamental for developing a generalizable model and providing an unbiased evaluation of its performance. The dataset was split using a stratified sampling approach to maintain the same class distribution across all three subsets, which is particularly important for imbalanced datasets. 70% of the images (3,723 images) were allocated to the training set, which was used for the primary task of learning the model parameters. 15 % (800 images) were allocated to the validation set, which was used during training to tune the hyperparameters and monitor overfitting. The final 15% (795 images) were reserved as the hold-out test set, which the model did not see at any point during training or validation phase. This pristine test set was used exclusively for the final unbiased performance evaluation of the fully trained model.
To enhance the model's ability to generalize to new, unseen data and, critically, to address the inherent class imbalance within the dataset, a comprehensive offline data augmentation strategy was implemented. The original 3,723 images in the training set were used as the basis for generating new synthetic instances. We strategically applied a suite of augmentation techniques, particularly to the under-represented (minority) classes, in order to increase their sample counts and create a more balanced class distribution for training.
The augmentation techniques included the following:
- Random Rotations: Images were randomly rotated within a range of ±15 degrees.
- Horizontal Flipping: Images were randomly flipped horizontally.
- Random Zoom: A random zoom of up to 20% was applied to the images.
- Brightness and Contrast Adjustments: Brightness and contrast were randomly altered by up to 20%.
- Shift Augmentation: Images were randomly shifted both horizontally and vertically by up to 10% of their dimensions.
A visual demonstration of these augmentation techniques applied to a sample fundus image is shown in Figure 2.
Through this targeted augmentation process, the training set was expanded from its original 3,723 images to a final and more balanced training corpus of 26,061 images. This strategic expansion not only provided the model with a much larger and more diverse set of data but also helped mitigate potential biases towards the majority classes, encouraging the model to learn the features of less frequent pathologies more effectively. This approach is instrumental in preventing overfitting and is a key contributor to the high performance and generalizability of the final model. The final class-wise distribution of images across the original, unaugmented training, validation, and test sets is provided in Table 2 for full transparency.
2.4. Deep Learning Model Architecture
To comprehensively address the multi-class classification task, we adopted a multi-faceted approach by employing three distinct and powerful deep learning architectures: ResNet-151, EfficientNetV2, and a classifier based on the YOLOv11 backbone. This strategy allowed us to explore different architectural philosophies and identify the most effective feature representation for retinal pathologies. A cornerstone of our methodology was the use of transfer learning. For each architecture, we initialized the model with weights pre-trained on an extensive ImageNet dataset [17]. This approach enables the model to leverage a rich hierarchy of general visual features (e.g., edges, textures, and shapes) learned from over a million images, which significantly accelerates convergence and enhances performance, particularly when working with specialized medical datasets.
Our first model, ResNet-151, is a variant of the highly influential Deep Residual Network family [18]. The fundamental innovation of ResNet is the introduction of "residual" or "skip" connections between layers. These connections create an alternative path for the gradient to flow directly through the network, effectively mitigating the vanishing gradient problem that plagues deep networks. This architectural design allows for the successful training of networks with remarkable depth, in this case, 151 layers, enabling the model to learn incredibly complex and hierarchical features from the input images. The proven robustness and extensive successful applications of ResNet in numerous medical imaging tasks make it a strong candidate for our study.
The second architecture employed was EfficientNetV2, a state-of-the-art model renowned for its exceptional balance between high accuracy and computational efficiency [19]. Unlike previous approaches that scaled network dimensions (depth, width, or resolution) independently, the EfficientNet family introduced a novel "compound scaling" method. This method uses a fixed set of scaling coefficients to uniformly scale all three dimensions in a principled manner, resulting in superior performance for a given computational cost. EfficientNetV2 further improves upon this by incorporating architectural optimizations, such as Fused-MBConv blocks and a progressive training strategy, which not only enhances parameter efficiency but also accelerates the training process significantly.
As a third approach, we utilized the powerful convolutional backbone of the YOLOv11 model as a dedicated feature extractor for the classification task. The YOLO (You Only Look Once) family is primarily celebrated for its real-time object detection capabilities [20], and its underlying backbone architectures are engineered to be extraordinarily efficient at extracting rich, salient features from an image in a single pass. By repurposing this backbone, we aimed to leverage its highly optimized feature extraction power for the nuanced task of differentiating between fine-grained pathological features in fundus images.
For each of these three selected backbones, the final classification layer originally designed for the 1000-class ImageNet challenge was removed. It was replaced with a custom-designed classification head tailored to our specific 9-class problem. This new head consists of a Global Average Pooling (GAP) layer, which reduces the spatial dimensions of the feature maps, followed by a fully connected (dense) layer and a final softmax activation layer. The Softmax layer outputs a probability distribution across the nine diagnostic classes. A schematic representation of this general architectural adaptation is shown in Figure 3.
2.5. Model Training and Implementation
All experiments, from model development to final evaluation, were conducted in a high-performance computational environment designed to ensure efficiency and reproducibility. The experimental workstation was equipped with an Intel Core i9-14900K central processing unit (CPU), 64 GB of high-speed DDR5 system memory, and accelerated by a single NVIDIA GeForce RTX 4090 graphics processing unit (GPU). The GPU, featuring 24 GB of GDDR6X VRAM, provided the necessary computational power to handle the large-scale architectures and batch sizes required for deep learning tasks. The entire software framework was implemented using the Python programming language (version 3.11) on a Linux-based operating system (Ubuntu 24.04). The deep learning models were built, trained, and validated using the PyTorch deep learning library (version 2.5.1), with GPU acceleration managed by NVIDIA CUDA Toolkit (version 12.6).
The training protocol was meticulously designed to optimize the model performance. For parameter optimization, we employed AdamW optimizer [21], a robust variant of the Adam optimizer that often yields better generalization. A categorical Cross-Entropy Loss function was utilized as the primary training objective, measuring the discrepancy between the model's predicted probability distribution and the ground-truth labels. The initial learning rate was set to 1x10⁻⁴. To facilitate stable and efficient convergence, this was coupled with a ReduceLROnPlateau learning rate scheduler. This scheduler monitored the validation loss and automatically reduced the learning rate by a factor of 10 if no improvement was observed for 5 consecutive epochs. The training was performed using a batch size of 32, which was determined based on the available GPU memory. An early stopping mechanism was implemented to prevent overfitting and select the best-performing model. The models were trained for a maximum of 100 epochs; however, the training was halted if the validation loss did not improve for 15 consecutive epochs. Ultimately, the model weights from the epoch that achieved the lowest validation loss were saved and carried forward for the final comprehensive evaluation of the unseen test set.
2.6. Performance Evaluation and Statistical Analysis
The diagnostic performance of our final trained models was rigorously evaluated on an independent hold-out test set, which comprised 15% of the total dataset. This test set was strictly segregated and remained entirely unseen by the models during any part of the training or hyperparameter-tuning processes. This ensures an unbiased and realistic assessment of the model's ability to generalize to new, unseen data.
To provide a comprehensive evaluation, a set of standard statistical metrics was computed. The four primary metrics used, namely, Accuracy, Precision, Recall, and F1-Score, are defined by the formulas presented in Table 3. These metrics were derived from the four cardinal outcomes of the confusion matrix: true positives (TP), true negatives (TN), false positives (FP), and false negatives (FN). Given the multi-class nature of our problem, these metrics were calculated on a per-class basis and aggregated using a macro-average. The macro-average computes the metric independently for each class and then takes the average, treating all classes as equally important, which provides a robust evaluation, particularly in the presence of class imbalance.
Furthermore, to assess the discriminative capability of the model for each class against all others, we computed the Area Under the Receiver Operating Characteristic Curve (AUC). The AUC scores were calculated using a one-vs-rest strategy for each of the nine categories, providing a granular view of the model's ability to distinguish a specific pathology from all other conditions.
Finally, to qualitatively analyze the classification behavior of the model and identify any systematic confusion between specific classes, a 9×9 confusion matrix was generated. This matrix visualizes the relationship between the true labels and the model predictions, offering crucial insights into which pathologies might be challenging for the model to differentiate. All performance metrics and visualizations were computed and generated using the scikit-learn (version 1.7.0), Matplotlib (version 3.10.3), and Seaborn (version 0.13.2) libraries.
3. Results
The diagnostic performance of the three trained deep learning models (EfficientNetV2, ResNet-151, and YOLOv11-based classifier) was rigorously evaluated using an independent test set. The classification results for each model are presented as normalized confusion matrices, where the diagonal elements represent the recall of each class. As specified in the methodology, the overall accuracy scores were calculated for the 9-class problem (8 diseases + Healthy).
Performance of the EfficientNetV2 Model
The EfficientNetV2 model achieved an overall accuracy of 88%. The confusion matrix in Figure 4 shows that the model performed well for common pathologies, achieving a recall of 0.90 for Diabetic Retinopathy and 0.88 for Glaucoma. However, the model exhibited several significant confounding pathways. The most striking error was the misclassification of 12% of 'Macular Scar' cases as 'Central Serous Chorioretinopathy',’’ indicating difficulty in differentiating between these two macular conditions. Another notable error was the confusion of 10% of 'Retinitis Pigmentosa' cases with 'Retinal Detachment'. The model's lowest recall values were for Optic Disc Edema (0.81) and the 'Healthy' class (0.82), suggesting challenges in these specific classifications.
The ResNet-151 model yielded an overall accuracy of 86%. As detailed in Figure 5, despite having the lowest overall accuracy, this architecture provided surprisingly robust recall for several individual classes, including Diabetic Retinopathy (0.91), Glaucoma (0.89), and Central Serous Chorioretinopathy (0.88). The primary weakness of the model stemmed from a few key misclassifications. A significant portion of 'Healthy' images (9%) were incorrectly classified as 'Retinal Detachment.’ Furthermore, consistent with other models, it struggled to differentiate optic disc pathologies, misclassifying 7% of 'Optic Disc Edema' cases as '’ Glaucoma.’ The lowest recall was observed for 'Retinitis Pigmentosa' at 0.80.
The YOLOv11-based classifier demonstrated clear superiority over the other models, achieving the highest overall accuracy of 90%. The confusion matrix shown in Figure 6 highlights its enhanced discriminative power. The model delivered exceptional recall rates of 0.95 for Diabetic Retinopathy, 0.94 for Central Serous Chorioretinopathy, and 0.94 for Glaucoma. Even with its high performance, the model was not immune to clinically relevant errors; the confusion between 'Optic Disc Edema' and 'Glaucoma' persisted at a rate of 7%. A notable new confusion point was the misclassification of 6% of 'Macular Scar' cases as 'Central Serous Chorioretinopathy'. These results establish the YOLOv11-based framework as the most effective for this multi-class challenge, although they also pinpoint specific areas for future improvement.
A detailed quantitative analysis was performed to compare the diagnostic capabilities of the three proposed models. The overall accuracy, macro-averaged recall, precision, and F1-score were calculated to provide a comprehensive view of each model's performance on the 9-class test set. The results are summarized in Table 4.
The data clearly indicate that the YOLOv11-based classifier achieved superior performance across all evaluated metrics, yielding the highest overall accuracy of 90.2%, macro recall of 90.5%, macro precision of 90.7%, and macro F1-score of 90.4%. The EfficientNetV2 model also demonstrated a robust and balanced performance, securing the second highest position with an accuracy of 88.0% and a corresponding F1-score of 85.7%. Interestingly, although the ResNet-151 model achieved a comparable accuracy of 86.3%, its macro F1-score was substantially lower at 75.8%. This discrepancy suggests that although its overall performance was adequate, the ResNet-151 model likely struggled significantly with one or more minority classes, which were more heavily penalized by the macro F1-score calculation. These quantitative results confirmed the findings from the confusion matrices, establishing the YOLOv11-based framework as the most accurate and reliable for this multi-class classification challenge.
To further visualize and compare the overall diagnostic discrimination ability of the models, ROC curves were generated for each classifier in the test set, and the results are presented in Figure 7. The visual evidence from the ROC analysis corroborates the quantitative findings in Table 4, confirming the superior performance of the YOLOv11-based classifier. This model achieved the highest AUC of 0.93, while the EfficientNetV2 and ResNet-151 models followed with strong AUC scores of 0.91 and 0.88, respectively. Pairwise statistical tests were conducted to formally validate whether these performance differences were statistically significant. The DeLong test confirmed that the AUC of the YOLOv11 model was significantly higher than that of both ResNet-151 (p < 0.001) and EfficientNetV2 (p < 0.01). Furthermore, this statistical superiority was reflected in the overall accuracy, as confirmed by McNemar's test. This comprehensive analysis, which combines visual ROC evidence and formal significance testing, provides robust validation for the enhanced efficacy of the YOLOv11-based framework for this multi-class classification task.
Finally, to assess the real-world generalization capability of our best-performing model, the YOLOv11-based classifier was subjected to a final evaluation on a completely unseen hold-out test set. On this dataset, the model achieved a final overall accuracy of 87%, confirming its robust, albeit slightly moderated performance when applied to new data.
The confusion matrix for the test set evaluation is shown in Figure 8. The model retained its high efficacy for several key pathologies, most notably for Diabetic Retinopathy (recall of 0.92) and Glaucoma (recall of 0.90). However, the test evaluation highlighted specific diagnostic challenges. The most significant source of error was the confusion between macular pathologies, with 12% of the 'Macular Scar' cases being misclassified as 'Central Serous Chorioretinopathy.’ Furthermore, the model's performance on the 'Healthy' class was lower in the test set, with a recall of 81%, showing a tendency to misclassify normal cases primarily as Optic Disc Edema (8%) or Macular Scar (5%). This final evaluation confirms the YOLOv11-based classifier as a potent diagnostic tool and provides a realistic assessment of its specific limitations, which is critical for understanding its potential clinical application
To provide qualitative insight into the diagnostic behavior of the final model, a selection of classification examples from the hold-out test set was reviewed. The model consistently demonstrated correct classification for cases with hallmark features, such as advanced Diabetic Retinopathy and typical healthy fundi. However, the qualitative analysis also highlighted the specific error patterns identified in the confusion matrix. Misclassifications primarily occurred in cases with overlapping morphological features, such as confusion between pathologic myopia and macular scars or between different forms of optic nerve abnormalities. Figure 9 presents representative examples of both correct and incorrect classifications made by the YOLOv11-based model, illustrating its performance characteristics visually.
4. Discussion
In this study, we developed and validated a deep learning framework for the automated multi-class classification of nine distinct retinal pathologies from color fundus photographs. Through a comparative analysis of three different CNN architectures, ResNet-151, EfficientNetV2, and a YOLOv11-based classifier, our findings demonstrate the clear superiority of the YOLOv11-based classifier, which achieved an overall accuracy of 90.2% and an Area Under the Curve (AUC) of 0.93. This result confirms our central hypothesis that a unified, state-of-the-art deep learning model can perform a holistic initial assessment of fundus images with high accuracy. This approach contributes to the growing effort to move beyond the limitations of the prevailing single-disease paradigms, which traditionally focus on detecting isolated conditions, such as diabetic retinopathy or glaucoma. Therefore, our work is aligned with recent studies that seek to develop more comprehensive and clinically versatile systems capable of identifying multiple co-existing pathologies. Thus, this framework constitutes a significant advancement towards a comprehensive, artificial intelligence-driven screening tool capable of enhancing diagnostic workflows and improving patient outcomes in diverse clinical settings.
A key finding of this study was the robust performance of the YOLOv11-based classifier, which demonstrated high efficacy not only in its overall metrics but also in the identification of specific high-prevalence pathologies. The model achieved exceptional recall rates for Diabetic Retinopathy (0.95), Glaucoma (0.94), and Central Serous Chorioretinopathy (0.94). This level of performance, highlighted by a macro F1-score of 90.4%, is highly competitive with other state-of-the-art multi-label frameworks and surpasses several benchmarks on similar datasets, including the 89.13% F1-score reported by Al-Fahdawi et al. [1], 88.16% by Yang and Yi [24], and 85% by Islam et al. [25]. While some advanced models, such as the metadata-fused system by Deng and Ding [26], have achieved higher F1-scores (94.11%), our framework's strong performance is notable because it relies solely on image data, enhancing its potential for broader clinical applicability. Notably, this high performance was achieved using a repurposed YOLOv11 backbone, an architecture primarily designed for real-time object detection. This suggests that its feature extraction capabilities are particularly adept at identifying subtle, localized features of retinal pathologies. This finding is significant because most studies focus on conventional architectures, such as ResNet or InceptionV3, or explore Vision Transformers for binary tasks, making our results a novel contribution to the exploration of optimal architectures for this complex task.
Despite its high overall accuracy, an analysis of the model's misclassifications revealed specific diagnostic challenges that align with the known difficulties in clinical ophthalmology. The most persistent confusion was observed between pathologies of the optic nerve head, where our model misclassified 7% of the Optic Disc Edema cases as glaucoma. This specific error underscores a significant clinical challenge, as differentiating between glaucomatous optic neuropathy (GON) and non-glaucomatous optic neuropathies (NGONs) can be exceptionally difficult owing to overlapping features such as optic disc cupping. The complexity of this distinction is so pronounced that dedicated deep learning frameworks have been developed specifically to address it, as demonstrated by Vali et al. [22]. Similarly, our model exhibited confusion between certain macular pathologies, such as Macular Scar and Central Serous Chorioretinopathy. This type of error is often rooted in the morphological similarities between different conditions, which is a challenge noted in automated analyses across a range of retinal diseases. These findings highlight that as artificial intelligence systems advance from binary classification to complex differential diagnosis, the primary hurdle is resolving the ambiguity caused by high inter-class similarity and intra-class variability.
The high diagnostic accuracy achieved in this study is attributable not only to the choice of an advanced network architecture but also to the implementation of a systematic data preprocessing and augmentation pipeline. A primary challenge in developing robust medical artificial intelligence models is the often limited size and inherent class imbalance of the available datasets. Our strategy directly addressed this by employing a comprehensive suite of data augmentation techniques that expanded the training corpus from 3,723 to 26,061 images. This process, particularly the targeted augmentation of minority classes, was instrumental in mitigating potential biases and preventing the overfitting. The importance of such rigorous data preparation is increasingly being recognized in the field. General reviews of deep learning in medical imaging have highlighted data augmentation as a cornerstone technique for improving model generalization. More specifically, studies by Al-Fahdawi et al. and Xiao et al. [23] have empirically demonstrated that dedicated preprocessing modules lead to substantial improvements in diagnostic performance, with the latter reporting increases in AUC of up to 14.4%. This underscores the principle that for deep learning models to succeed in real-world clinical applications, the sophistication of the data preparation strategy is as crucial as the novelty of the network architecture.
Although the results of this study are promising, several limitations must be acknowledged. The primary limitation of this study is that the framework was developed and validated using a single public dataset sourced from a specific geographic region. Although we implemented a rigorous training and hold-out testing protocol, the model's performance has not yet been evaluated on external datasets from different ethnic populations or images acquired using different fundus cameras. The potential for performance degradation when a model is applied to unseen data from varied sources is a well-documented challenge in medical artificial intelligence, emphasizing the critical need for external validation to ensure generalizability. Therefore, future work will proceed along several key pathways. First, the immediate next step is to validate the YOLOv11-based model on diverse, multicenter, multiethnic datasets to provide a true measure of its robustness. Second, building on the error analysis presented earlier, future architectural refinements will focus on improving the model’s ability to discriminate between challenging pairs, such as Glaucoma and Optic Disc Edema. This could involve incorporating specialized attention mechanisms or exploring data fusion techniques inspired by Al-Fahdawi et al. [1]. Finally, looking toward clinical translation, prospective studies are required to assess how a comprehensive screening tool like this one would integrate into real-world diagnostic workflows. Nevertheless, the current study provides a robust and validated foundation for developing a clinically deployable, comprehensive retinal screening tool.
5. Conclusions
In conclusion, this study successfully developed and validated a unified deep learning framework capable of classifying nine distinct retinal conditions from a single fundus photograph. Our comparative analysis identified a YOLOv11-based classifier as the most effective architecture, achieving a high overall accuracy of 90.2% and an AUC of 0.93. This study demonstrates that a single, holistic model can effectively differentiate a wide spectrum of common and emerging pathologies, representing a significant step beyond the limitations of single-disease screening systems. While further validation on diverse multi-ethnic datasets is a necessary next step, the proposed framework holds considerable promise as a comprehensive artificial intelligence-driven tool to augment clinical decision-making, enhance diagnostic efficiency, and ultimately improve patient care in ophthalmology.
Author Contributions
Uğur Şevik (First Author) advanced the conceptual development of the study, critically reviewed the manuscript, and contributed to the interpretation of the findings. Onur Mutlu (Second Author) identified the initial idea and dataset, implemented the artificial intelligence algorithms and coding processes, conducted the experimental studies, and prepared the first draft of the manuscript. Onur Mutlu also took the lead in organizing and finalizing the manuscript based on feedback. Both authors read and approved the final version of the manuscript.
Funding
No funding was received to assist with the preparation of this manuscript.
Conflicts of Interest
The authors declare no conflicts of interest. The funders had no role in the design of the study; in the collection, analyses, or interpretation of data; in the writing of the manuscript, or in the decision to publish the results.
References
- Al-Fahdawi, S.; Al-Waisy, A. S.; Zeebaree, D. Q.; et al. Fundus-DeepNet: Multi-label deep learning classification system for enhanced detection of multiple ocular diseases through data fusion of fundus images. Inf. Fusion. 2023. [CrossRef]
- Goh, J. H. L.; Ang, E.; Srinivasan, S.; et al. Comparative analysis of vision transformers and conventional convolutional neural networks in detecting referable diabetic retinopathy. Am. Acad. Ophthalmol. 2023. [CrossRef]
- Teo, Z. L.; Tham, Y. C.; Yu, M.; et al. Global prevalence of diabetic retinopathy and projection of trends from 2020 to 2040: a systematic review and meta-analysis. Lancet Diabetes Endocrinol. 2021. [CrossRef]
- Mitry, D.; Charteris, D. G.; Fleck, B. W.; Campbell, H.; Singh, J. The epidemiology of rhegmatogenous retinal detachment: geographical variation and clinical associations. Br. J. Ophthalmol. 2010. [CrossRef]
- Holden, B. A.; Fricke, T. R.; Wilson, D. A.; et al. Global prevalence of myopia and high myopia and temporal trends from 2000 through 2050. Ophthalmology. 2016. [CrossRef] [PubMed]
- Ting, D. S. W.; Cheung, C. Y. L.; Lim, G. Development and validation of a deep learning system for diabetic retinopathy and related eye diseases using retinal images from multiethnic populations with diabetes. JAMA. 2017. [CrossRef] [PubMed]
- Abràmoff, M. D.; Folk, J. C.; Han, D. P.; et al. Automated analysis of retinal images for detection of referable diabetic retinopathy. JAMA Ophthalmol. 2013. [CrossRef] [PubMed]
- LeCun, Y.; Bengio, Y.; Hinton, G. Deep learning. Nature. 2015. [CrossRef] [PubMed]
- Gulshan, V.; Peng, L.; Coram, M.; et al. Development and validation of a deep learning algorithm for detection of diabetic retinopathy in retinal fundus photographs. JAMA. 2016. [CrossRef]
- Ting, D. S. W.; Pasquale, L. R.; Peng, L.; et al. Artificial intelligence and deep learning in ophthalmology. Br. J. Ophthalmol. 2019. [CrossRef]
- Li, Z.; He, Y.; Keel, S.; et al. Efficacy of a deep learning system for detecting glaucomatous optic neuropathy based on colour fundus photographs. Nat. Biomed. Eng. 2018. [CrossRef]
- Brown, J. M.; Campbell, J. P.; Beers, A.; et al. Automated diagnosis of plus disease in retinopathy of prematurity. JAMA Ophthalmol. 2018. [CrossRef]
- Burlina, P.; Joshi, N.; Pekala, M.; et al. Automated grading of age-related macular degeneration from color fundus images. Invest. Ophthalmol. Vis. Sci. 2017. [CrossRef]
- Hemal, M. M.; Saha, S. Explainable deep learning-based meta-classifier approach for multi-label classification of retinal diseases. Array. 2025. [CrossRef]
- Shen, D.; Wu, G.; Suk, H. I. Deep learning in medical image analysis. Annu. Rev. Biomed. Eng. 2017. [CrossRef]
- Rashid, M. R.; Sharmin, S.; Khatun, T.; Hasan, M. Z.; Uddin, M. S. Eye Disease Image Dataset. Mendeley Data. 2024. [CrossRef]
- Deng, J.; Dong, W.; Socher, R.; Li, L. J.; Li, K.; Fei-Fei, L. ImageNet: A large-scale hierarchical image database. In: Proc. IEEE Conf. Comput. Vis. Pattern Recognit. 2009. [CrossRef]
- He, K.; Zhang, X.; Ren, S.; Sun, J. Deep residual learning for image recognition. In: Proc. IEEE Conf. Comput. Vis. Pattern Recognit. 2016. [CrossRef]
- Tan, M.; Le, Q. EfficientNetV2: Smaller models and faster training. Proc. Int. Conf. Mach. Learn. (ICML). 2021. [CrossRef]
- Redmon, J.; Divvala, S.; Girshick, R.; Farhadi, A. You only look once: Unified, real-time object detection. Proc. IEEE Conf. Comput. Vis. Pattern Recognit. (CVPR). 2016. [CrossRef]
- Loshchilov, I.; Hutter, F. Decoupled weight decay regularization. Int. Conf. Learn. Represent. (ICLR). 2017.
- Vali, M.; Mohammadi, M.; Zarei, N.; Samadi, M.; Atapour-Abarghouei, A.; et al. Differentiating glaucomatous optic neuropathy from non-glaucomatous optic neuropathies using deep learning algorithms. Am. J. Ophthalmol. 2023. [CrossRef]
- Xiao, H.; Ju, L.; Lu, Z.; Zhang, S.; et al. Development and evaluation of a deep learning system for screening real-world multiple abnormal findings based on ultra-widefield fundus images. Front. Med. 2025. [CrossRef] [PubMed]
- Yang, X. L.; Yi, S. L. Multi-classification of fundus diseases based on DSRA-CNN. Biomed. Signal Process. Control. 2022. [CrossRef]
- Islam, M. T.; Imran, S. A.; Arefeen, A.; et al. Source and camera independent ophthalmic disease recognition from fundus image using neural network. Proc. IEEE Int. Conf. Signal Process. Inf. Commun. Syst. (SPICSCON). 2019. [CrossRef]
- Deng, X.; Ding, F. Classification of fundus diseases based on meta-data and EB-IRV2 network. Proc. SPIE 12342, Int. Conf. Digit. Image Process. (ICDIP). 2022. [CrossRef]
Figure 1.
Exemplar color fundus photographs of each of the nine diagnostic classes evaluated in this study. The panels display: (A) Central Serous Chorioretinopathy; (B) Diabetic Retinopathy; (C) Optic Disc Edema; (D) Glaucoma; (E) Healthy; (F) Macular Scar; (G) Pathologic Myopia; (H) Retinal Detachment; and (I) Retinitis Pigmentosa.
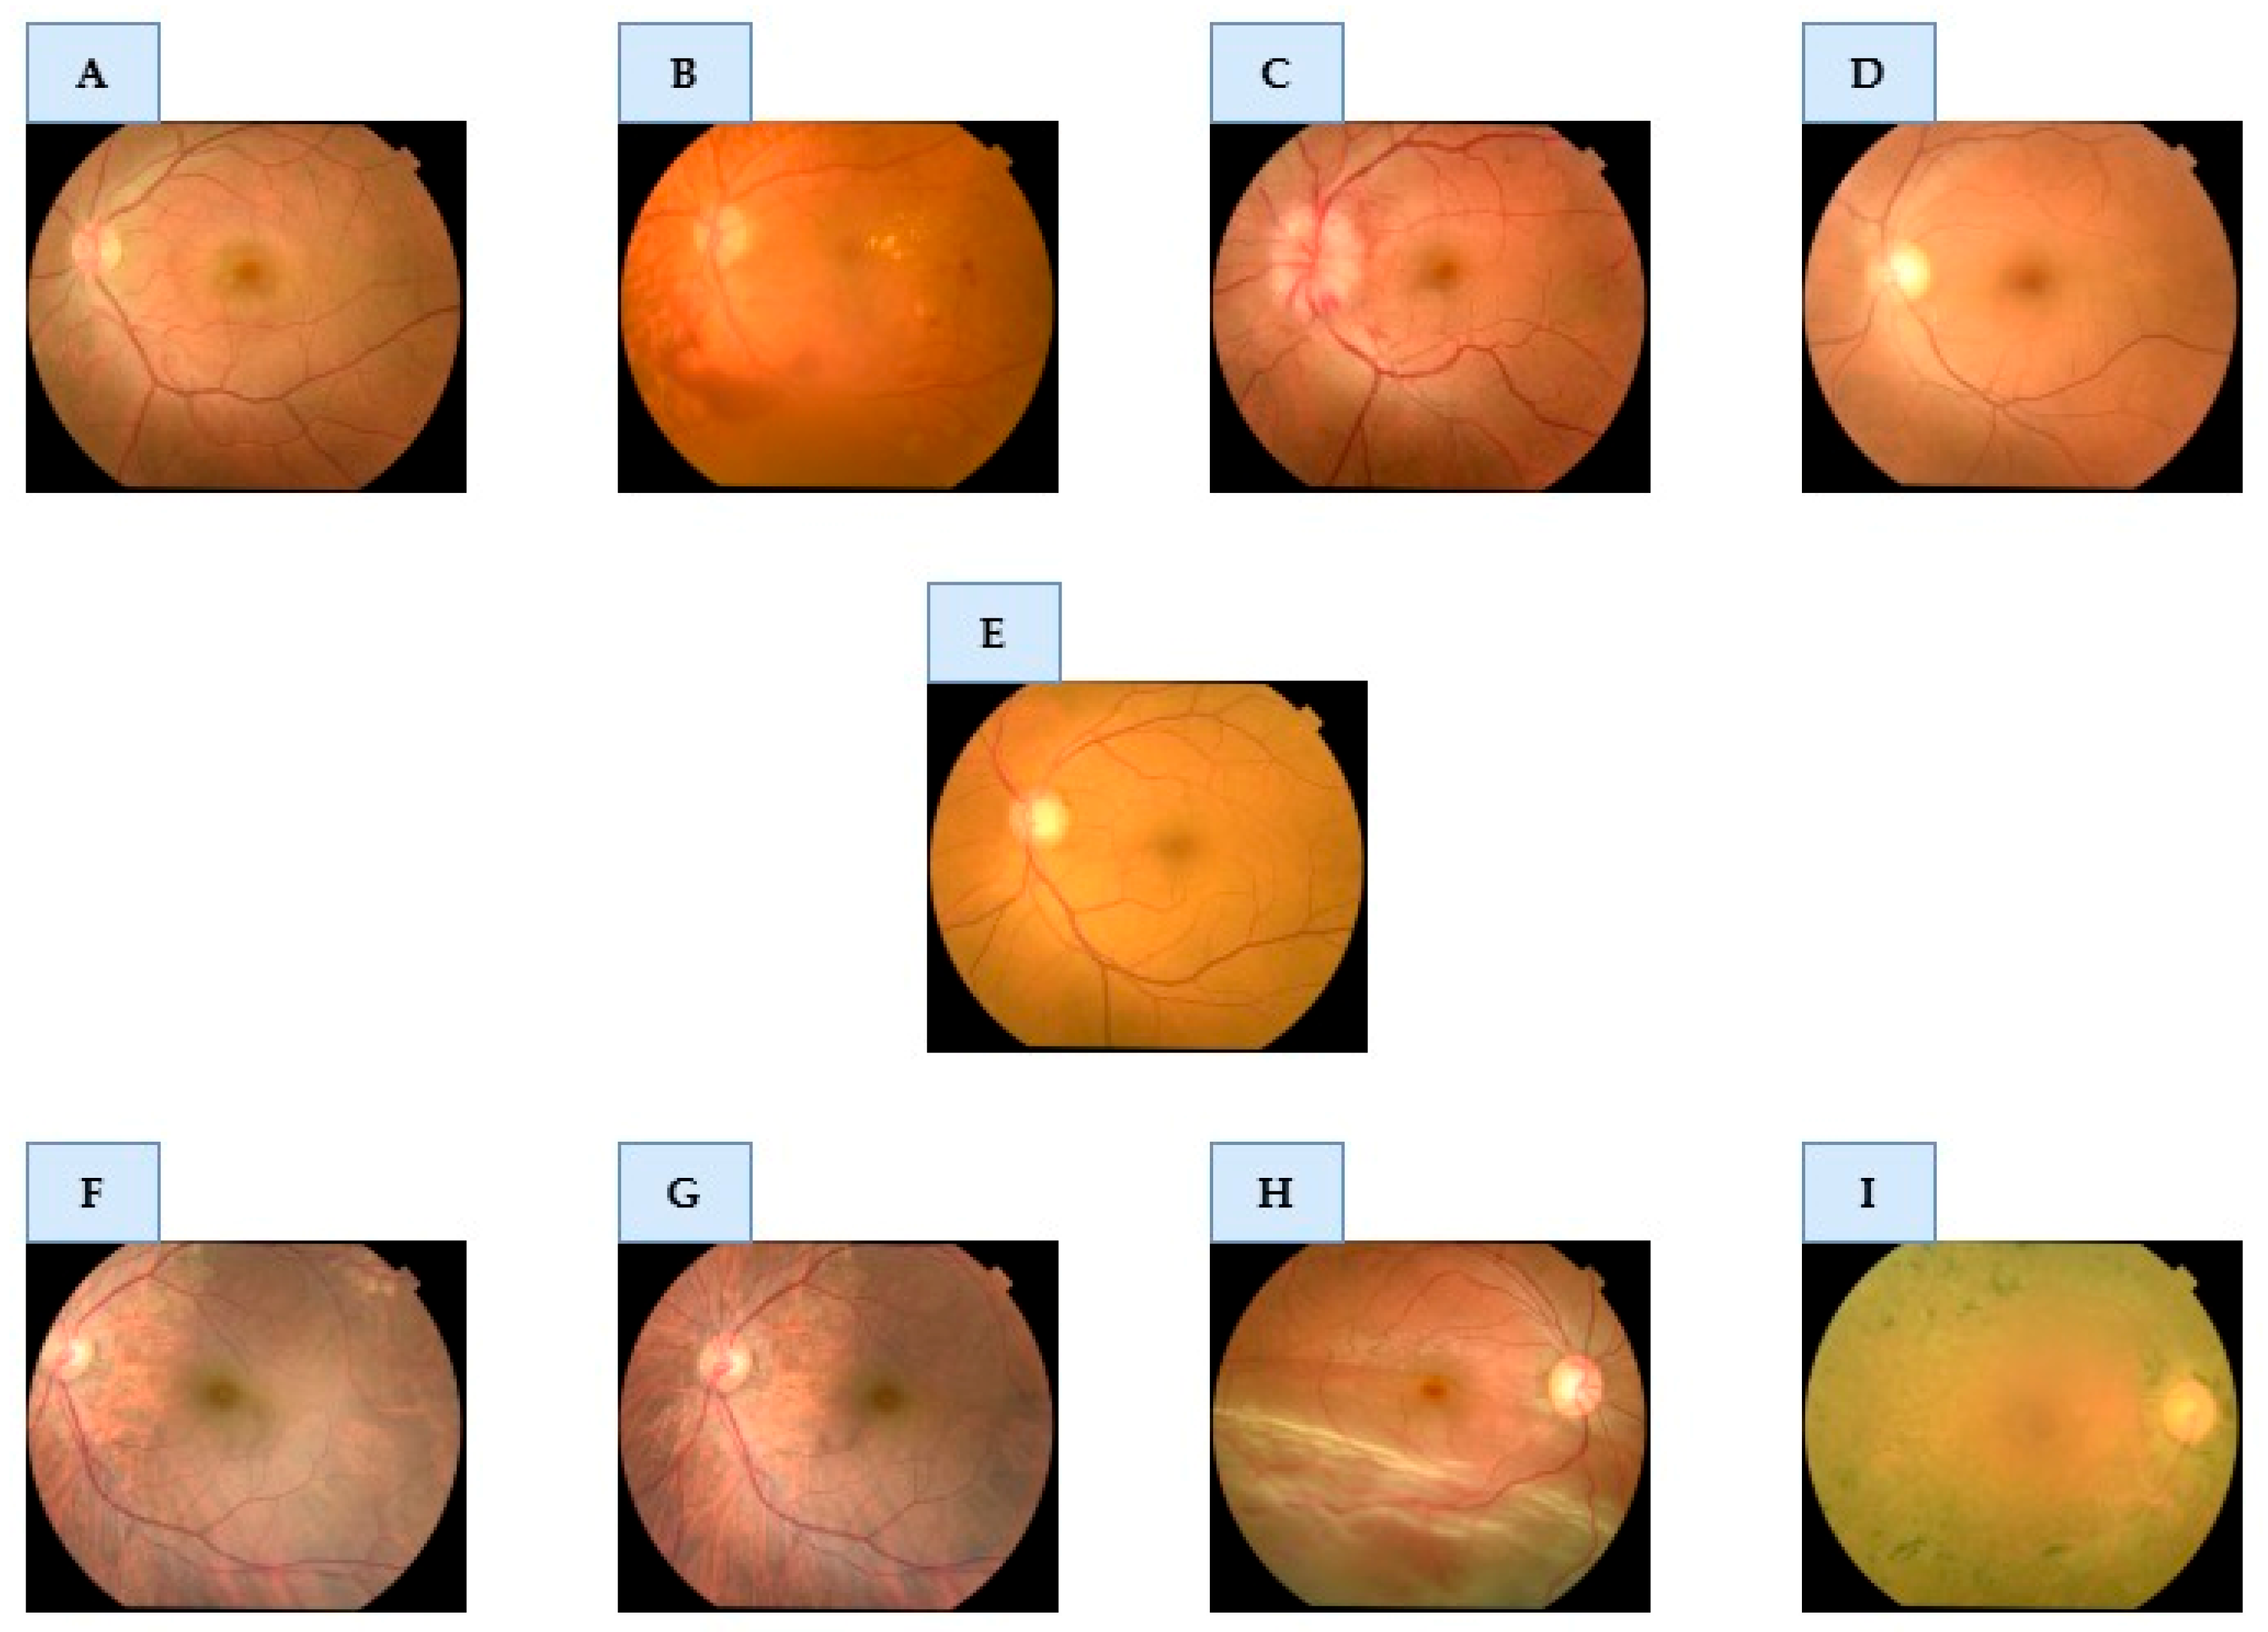
Figure 2.
Visual examples of the data-augmentation techniques applied to a sample fundus image. Starting from the original image (top row), a series of transformations were applied to generate synthetic training data, including rotation, horizontal flipping, zooming, brightness and contrast adjustment, and spatial shifting.

Figure 3.
Architecture of the proposed deep learning model. A pre-trained CNN backbone extracts features that are passed to a custom classifier head for 9-class classification using a softmax output layer.
Figure 3.
Architecture of the proposed deep learning model. A pre-trained CNN backbone extracts features that are passed to a custom classifier head for 9-class classification using a softmax output layer.
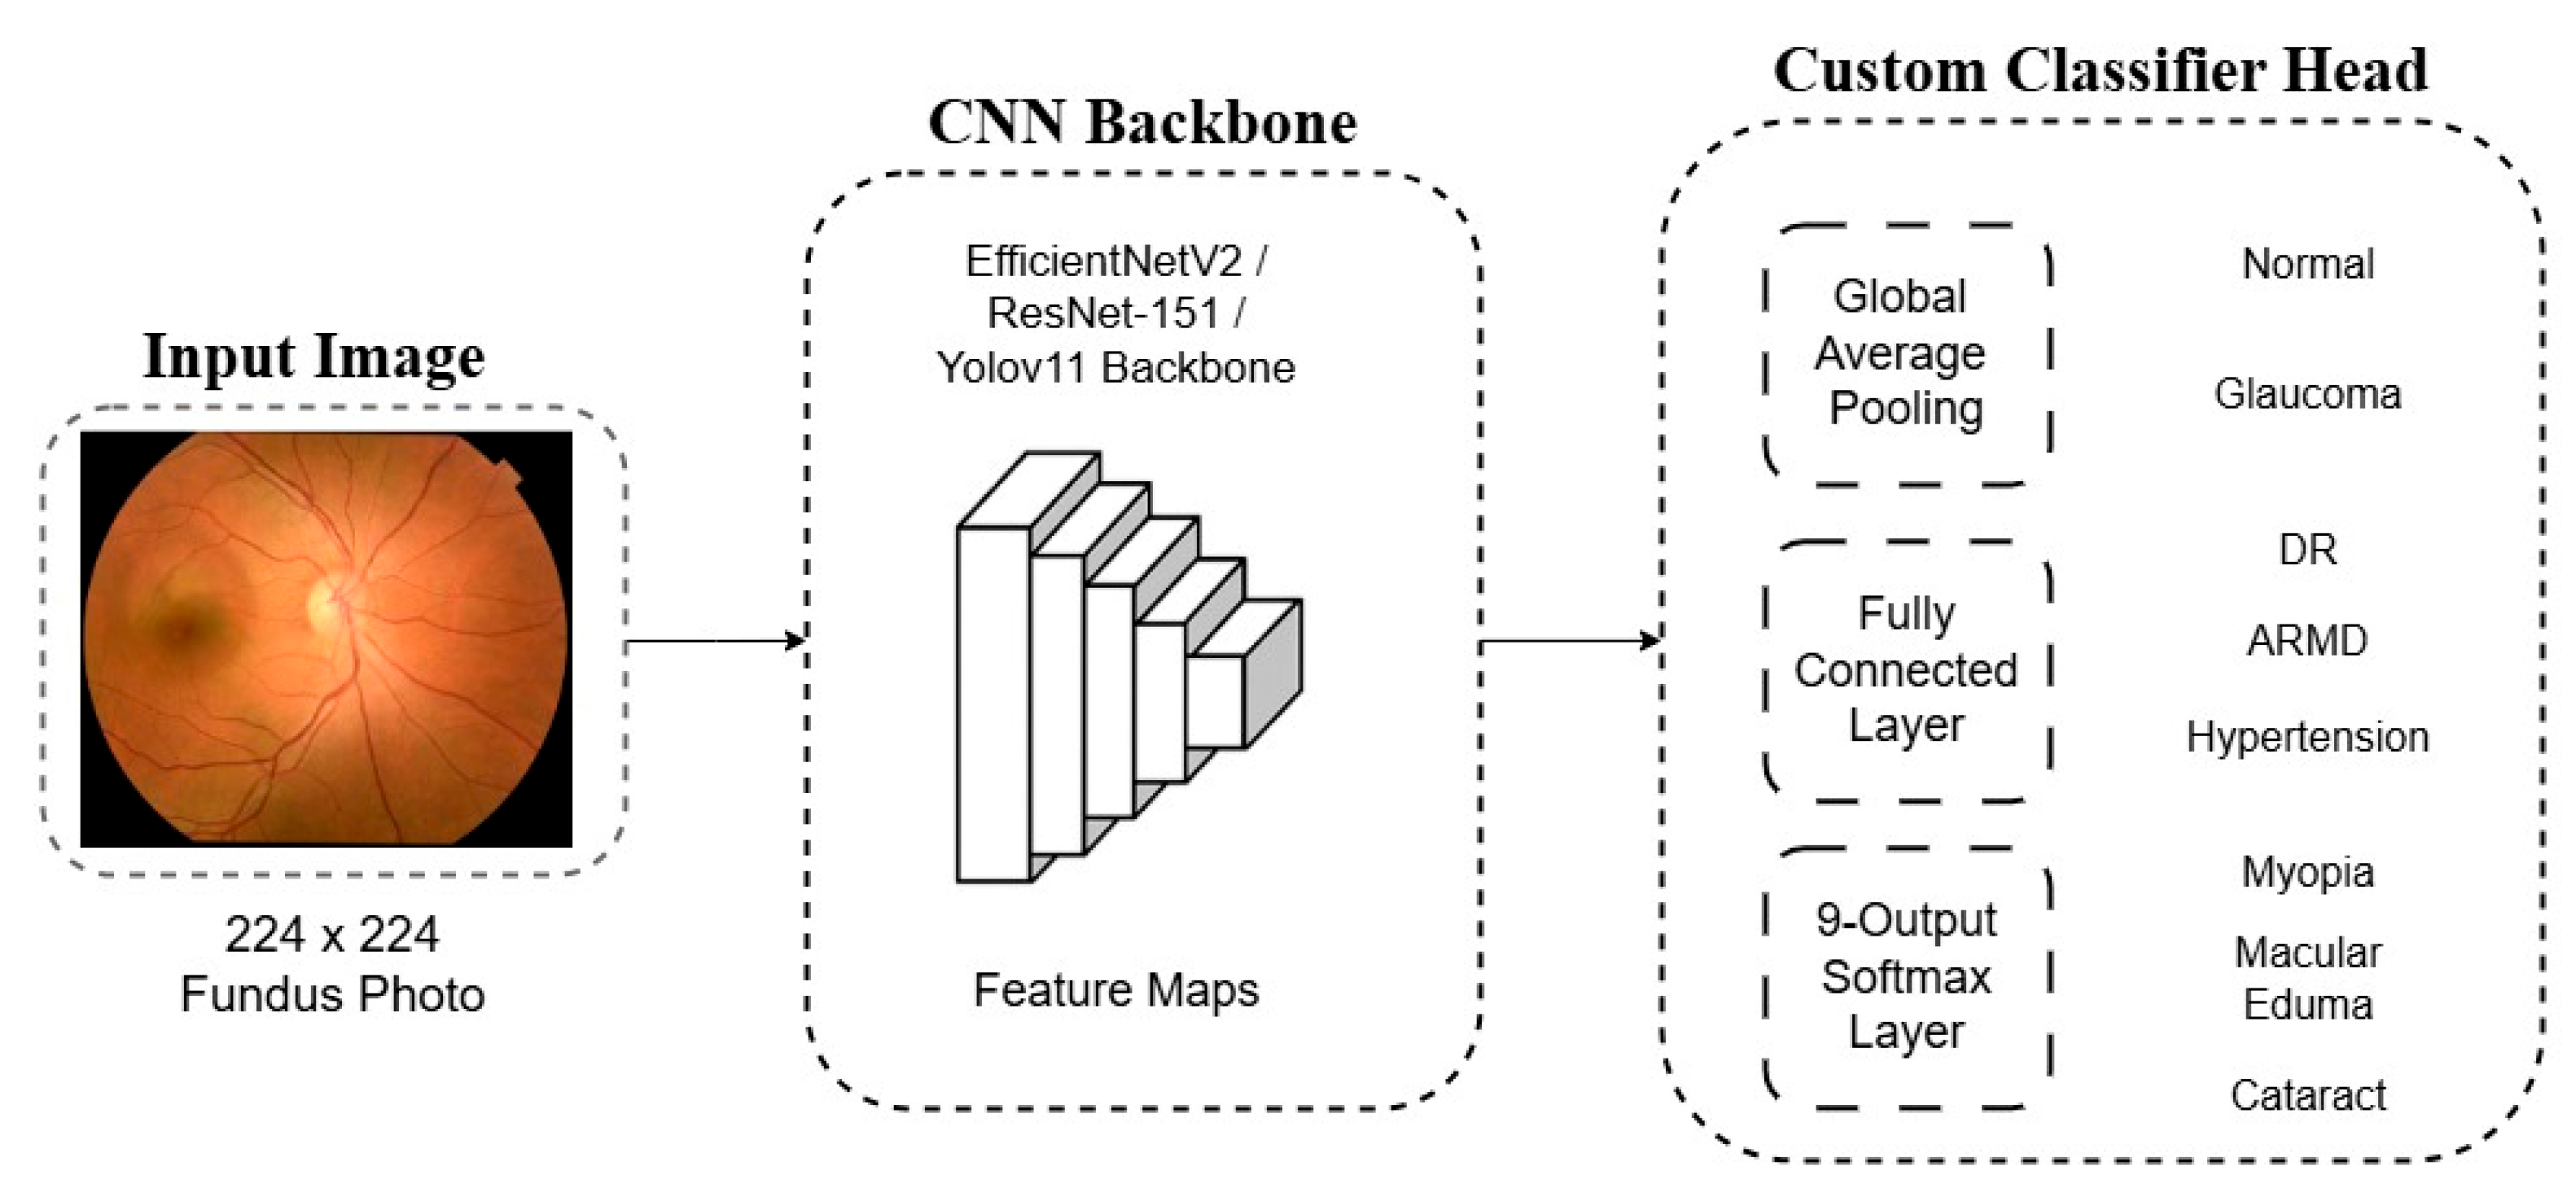
Figure 4.
Normalized confusion matrix for the EfficientNetV2 model in the independent test set.
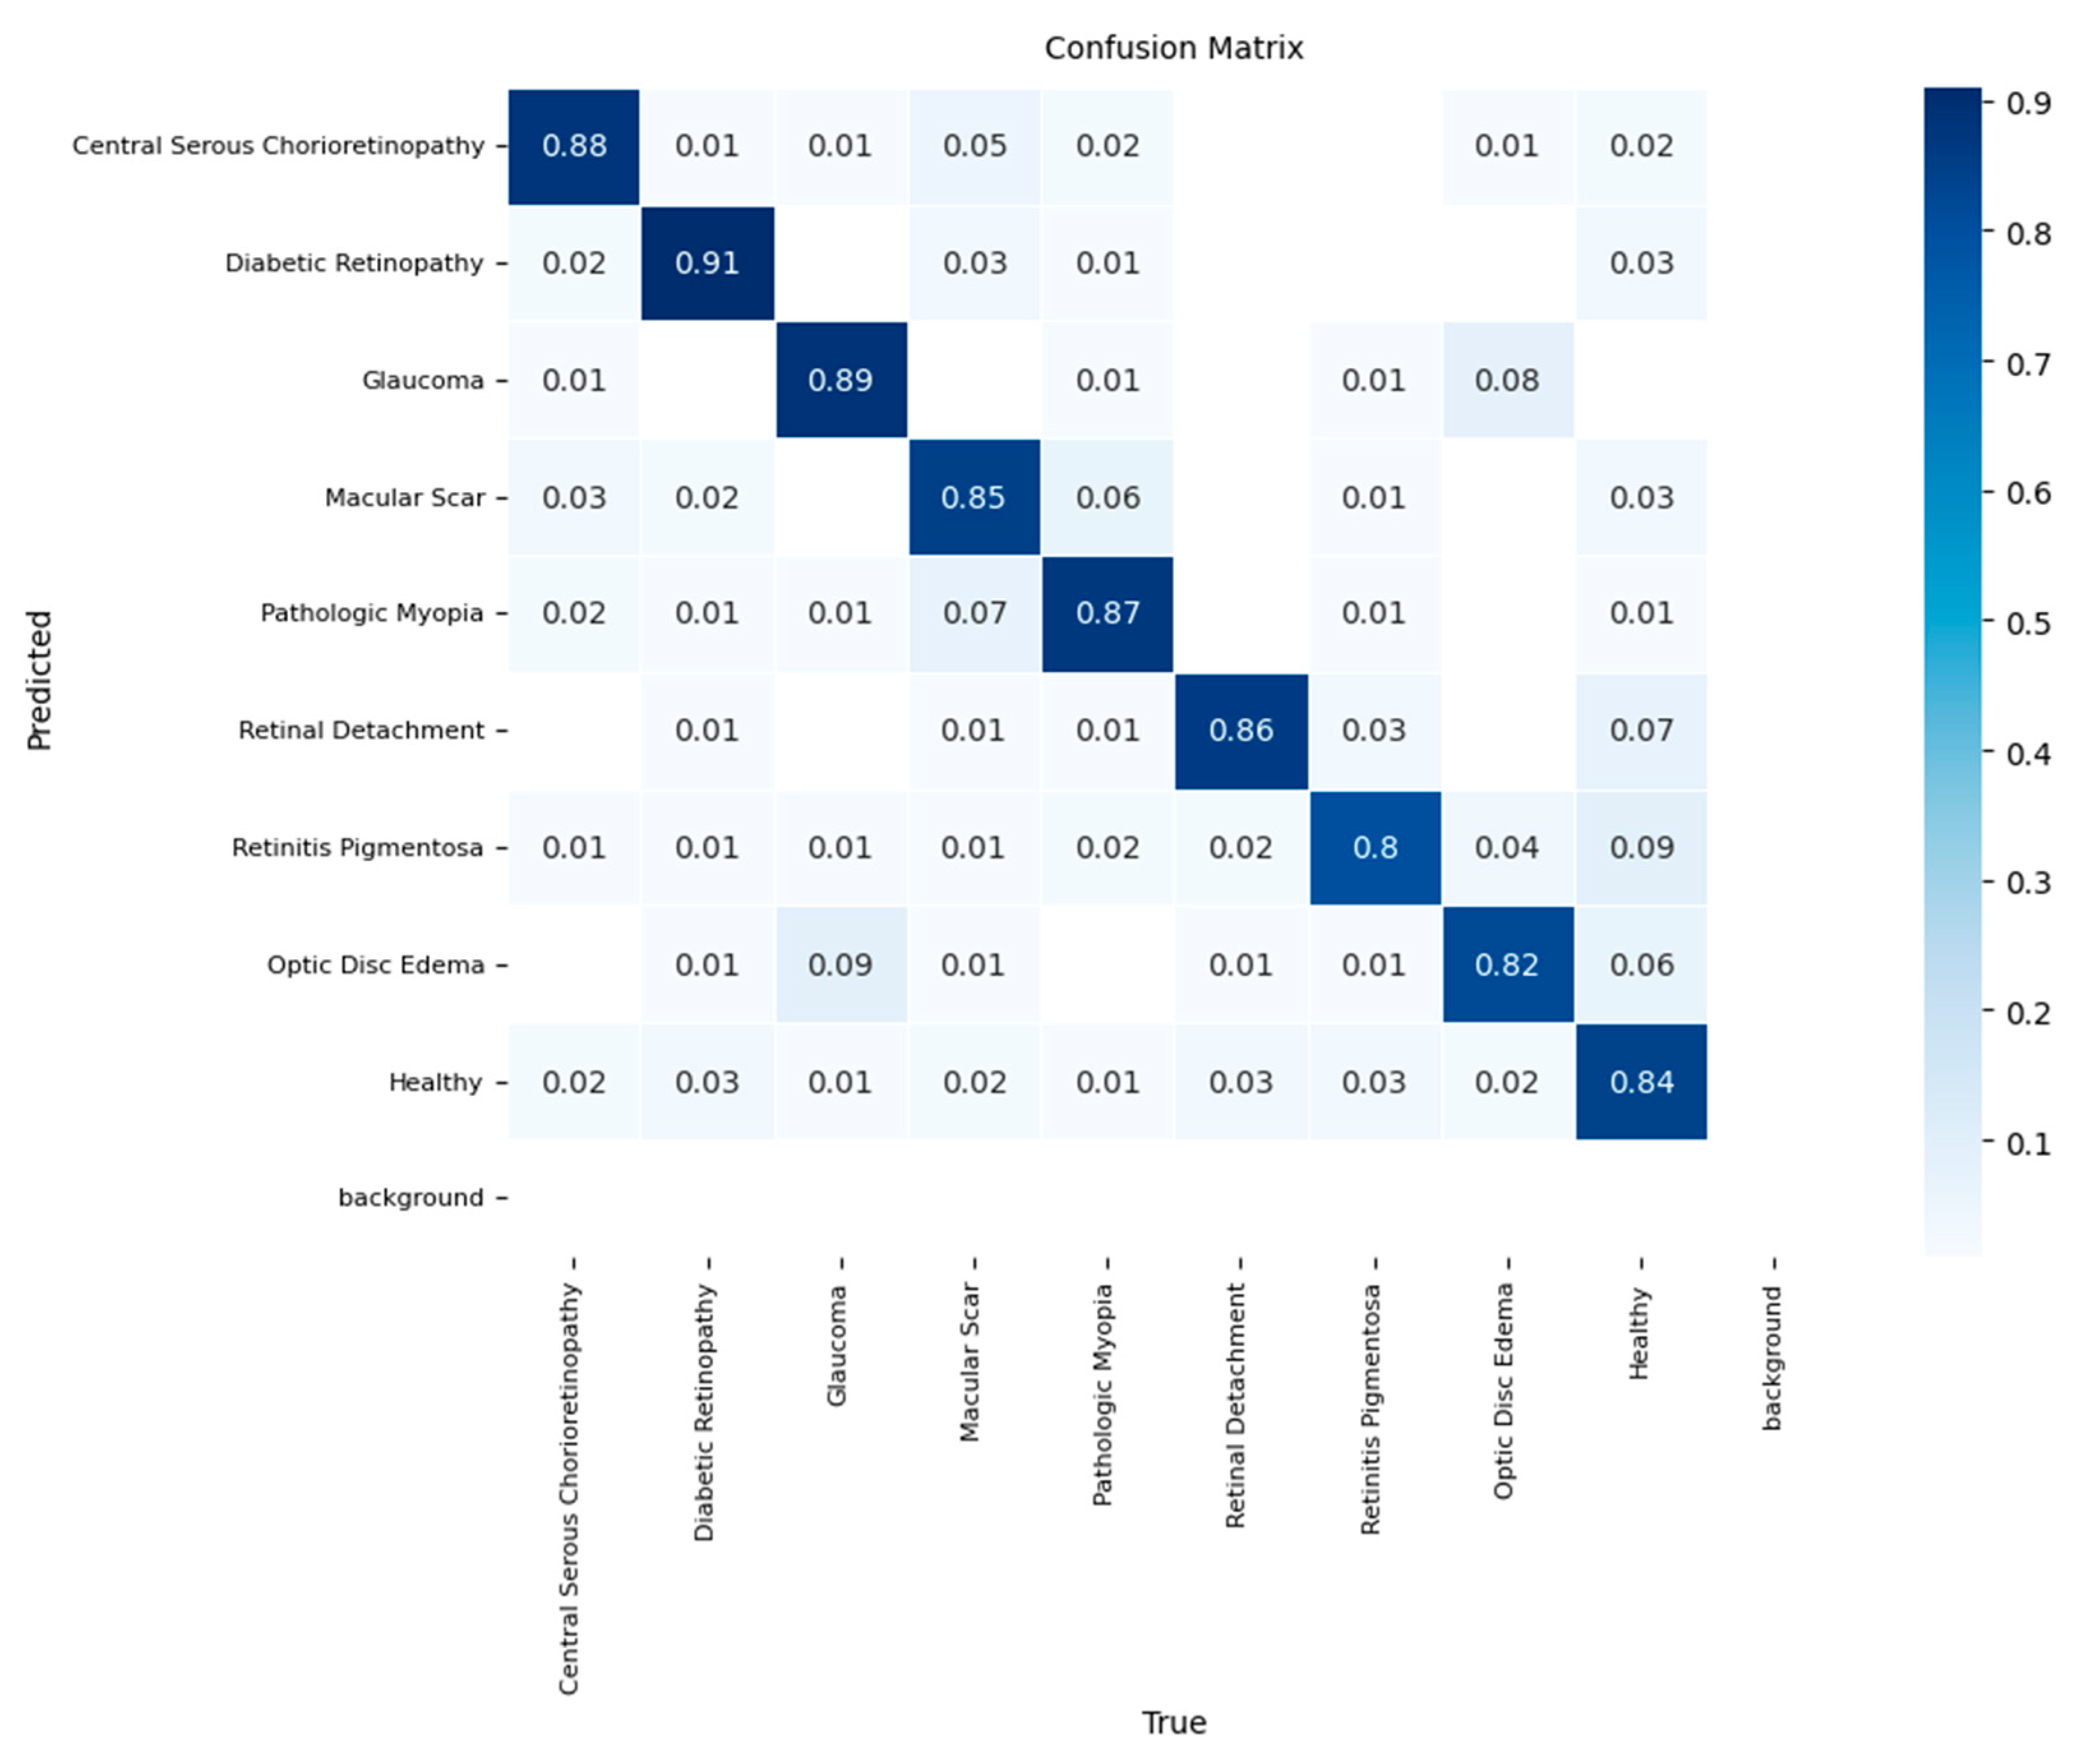
Figure 5.
Normalized confusion matrix for the ResNet-151 model on the independent test set.
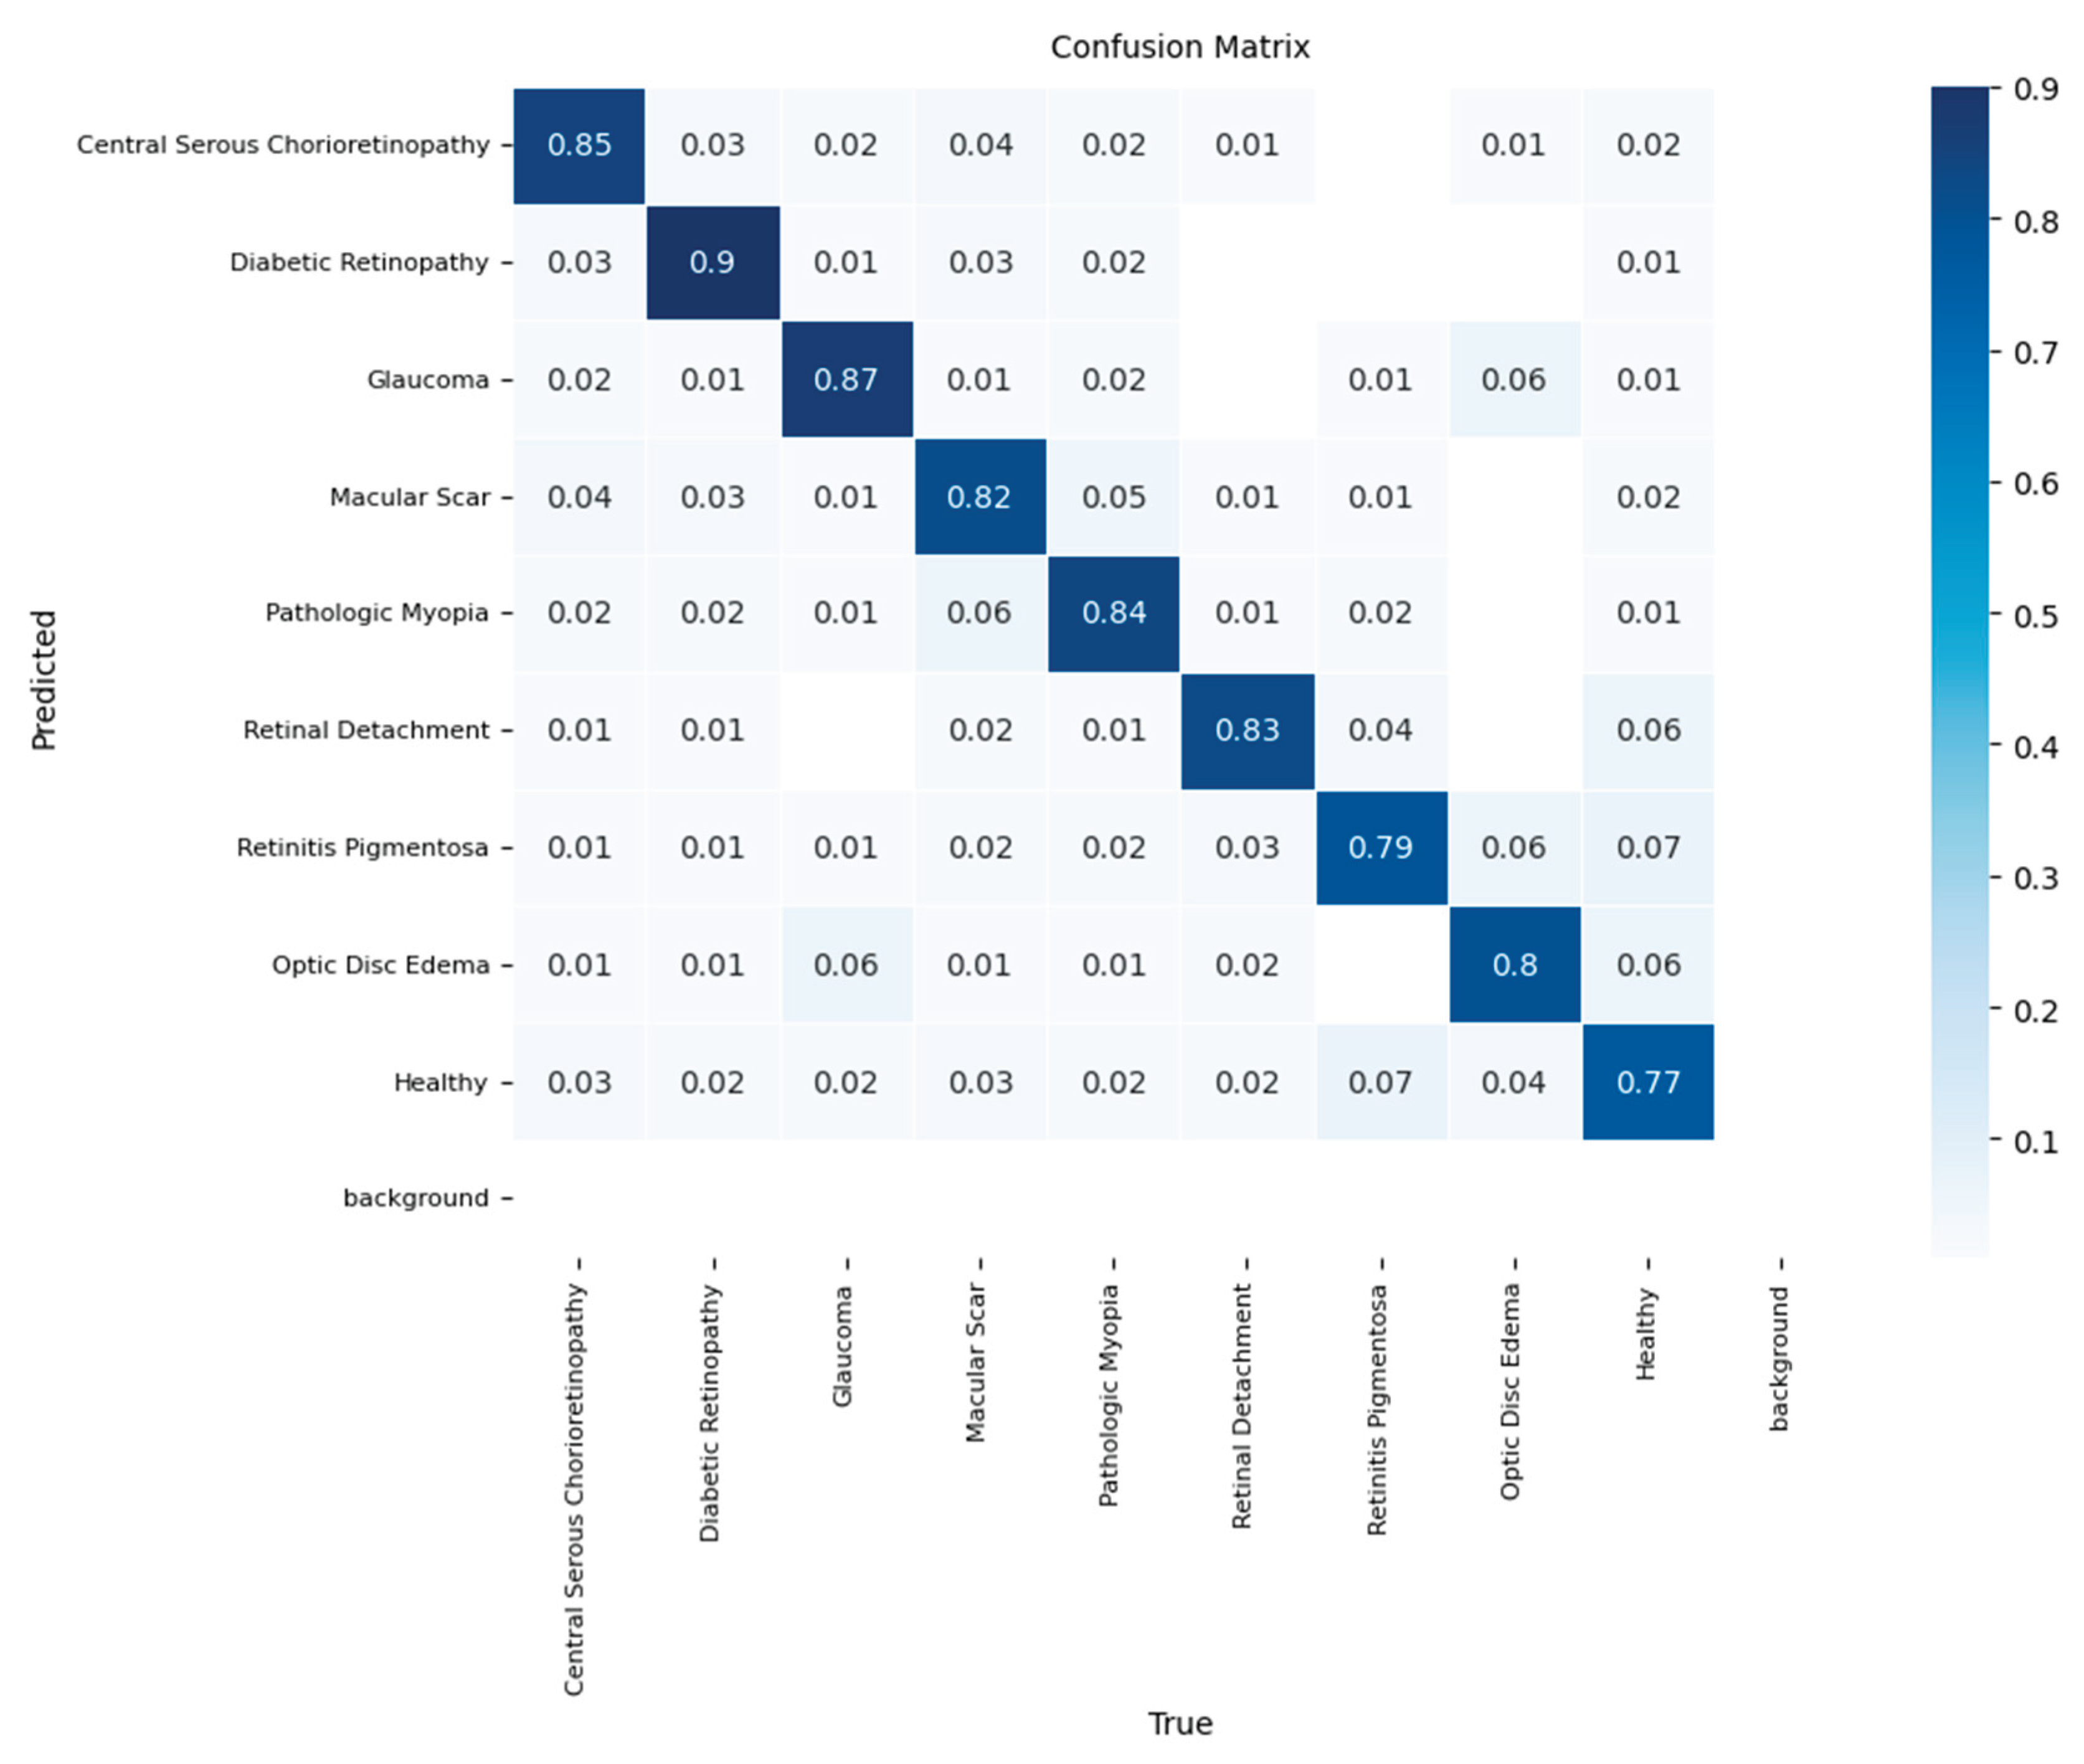
Figure 6.
Normalized confusion matrix for the YOLOv11-based classifier in the independent test set.
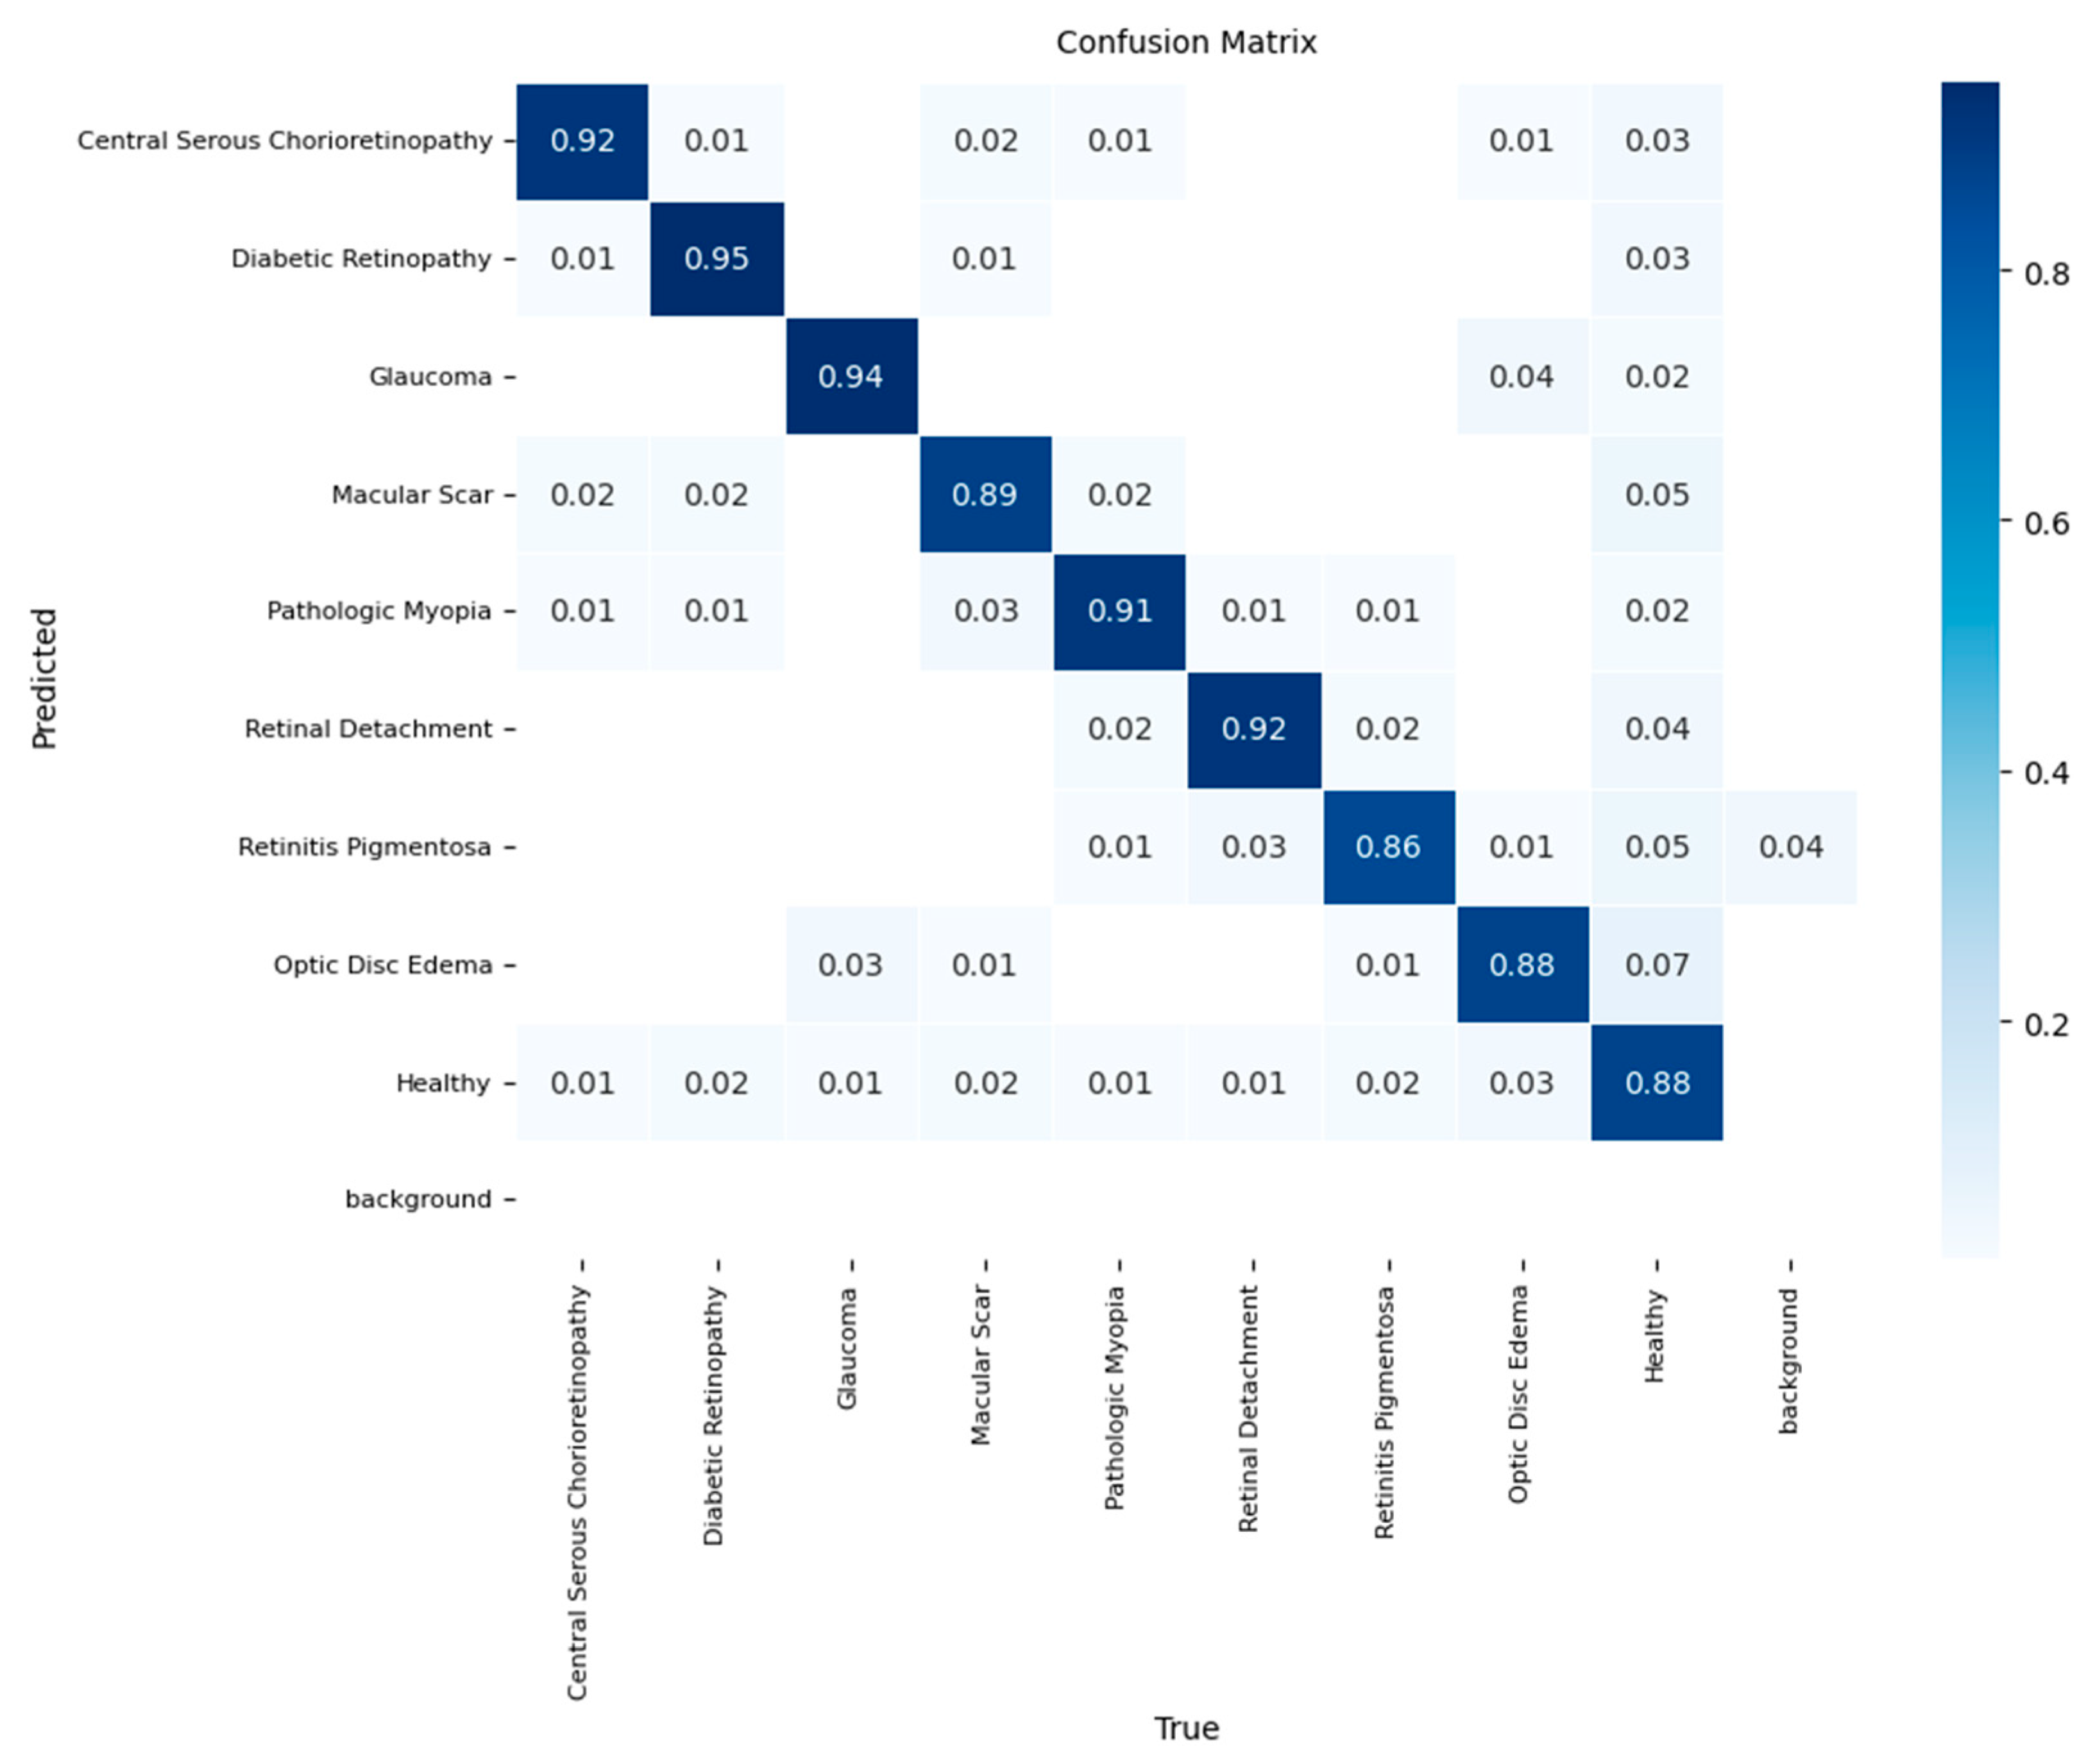
Figure 7.
Comparison of the ROC curves for the three models. The AUC for each model is shown. The dashed line represents the random classifier (AUC = 0.50).
Figure 7.
Comparison of the ROC curves for the three models. The AUC for each model is shown. The dashed line represents the random classifier (AUC = 0.50).
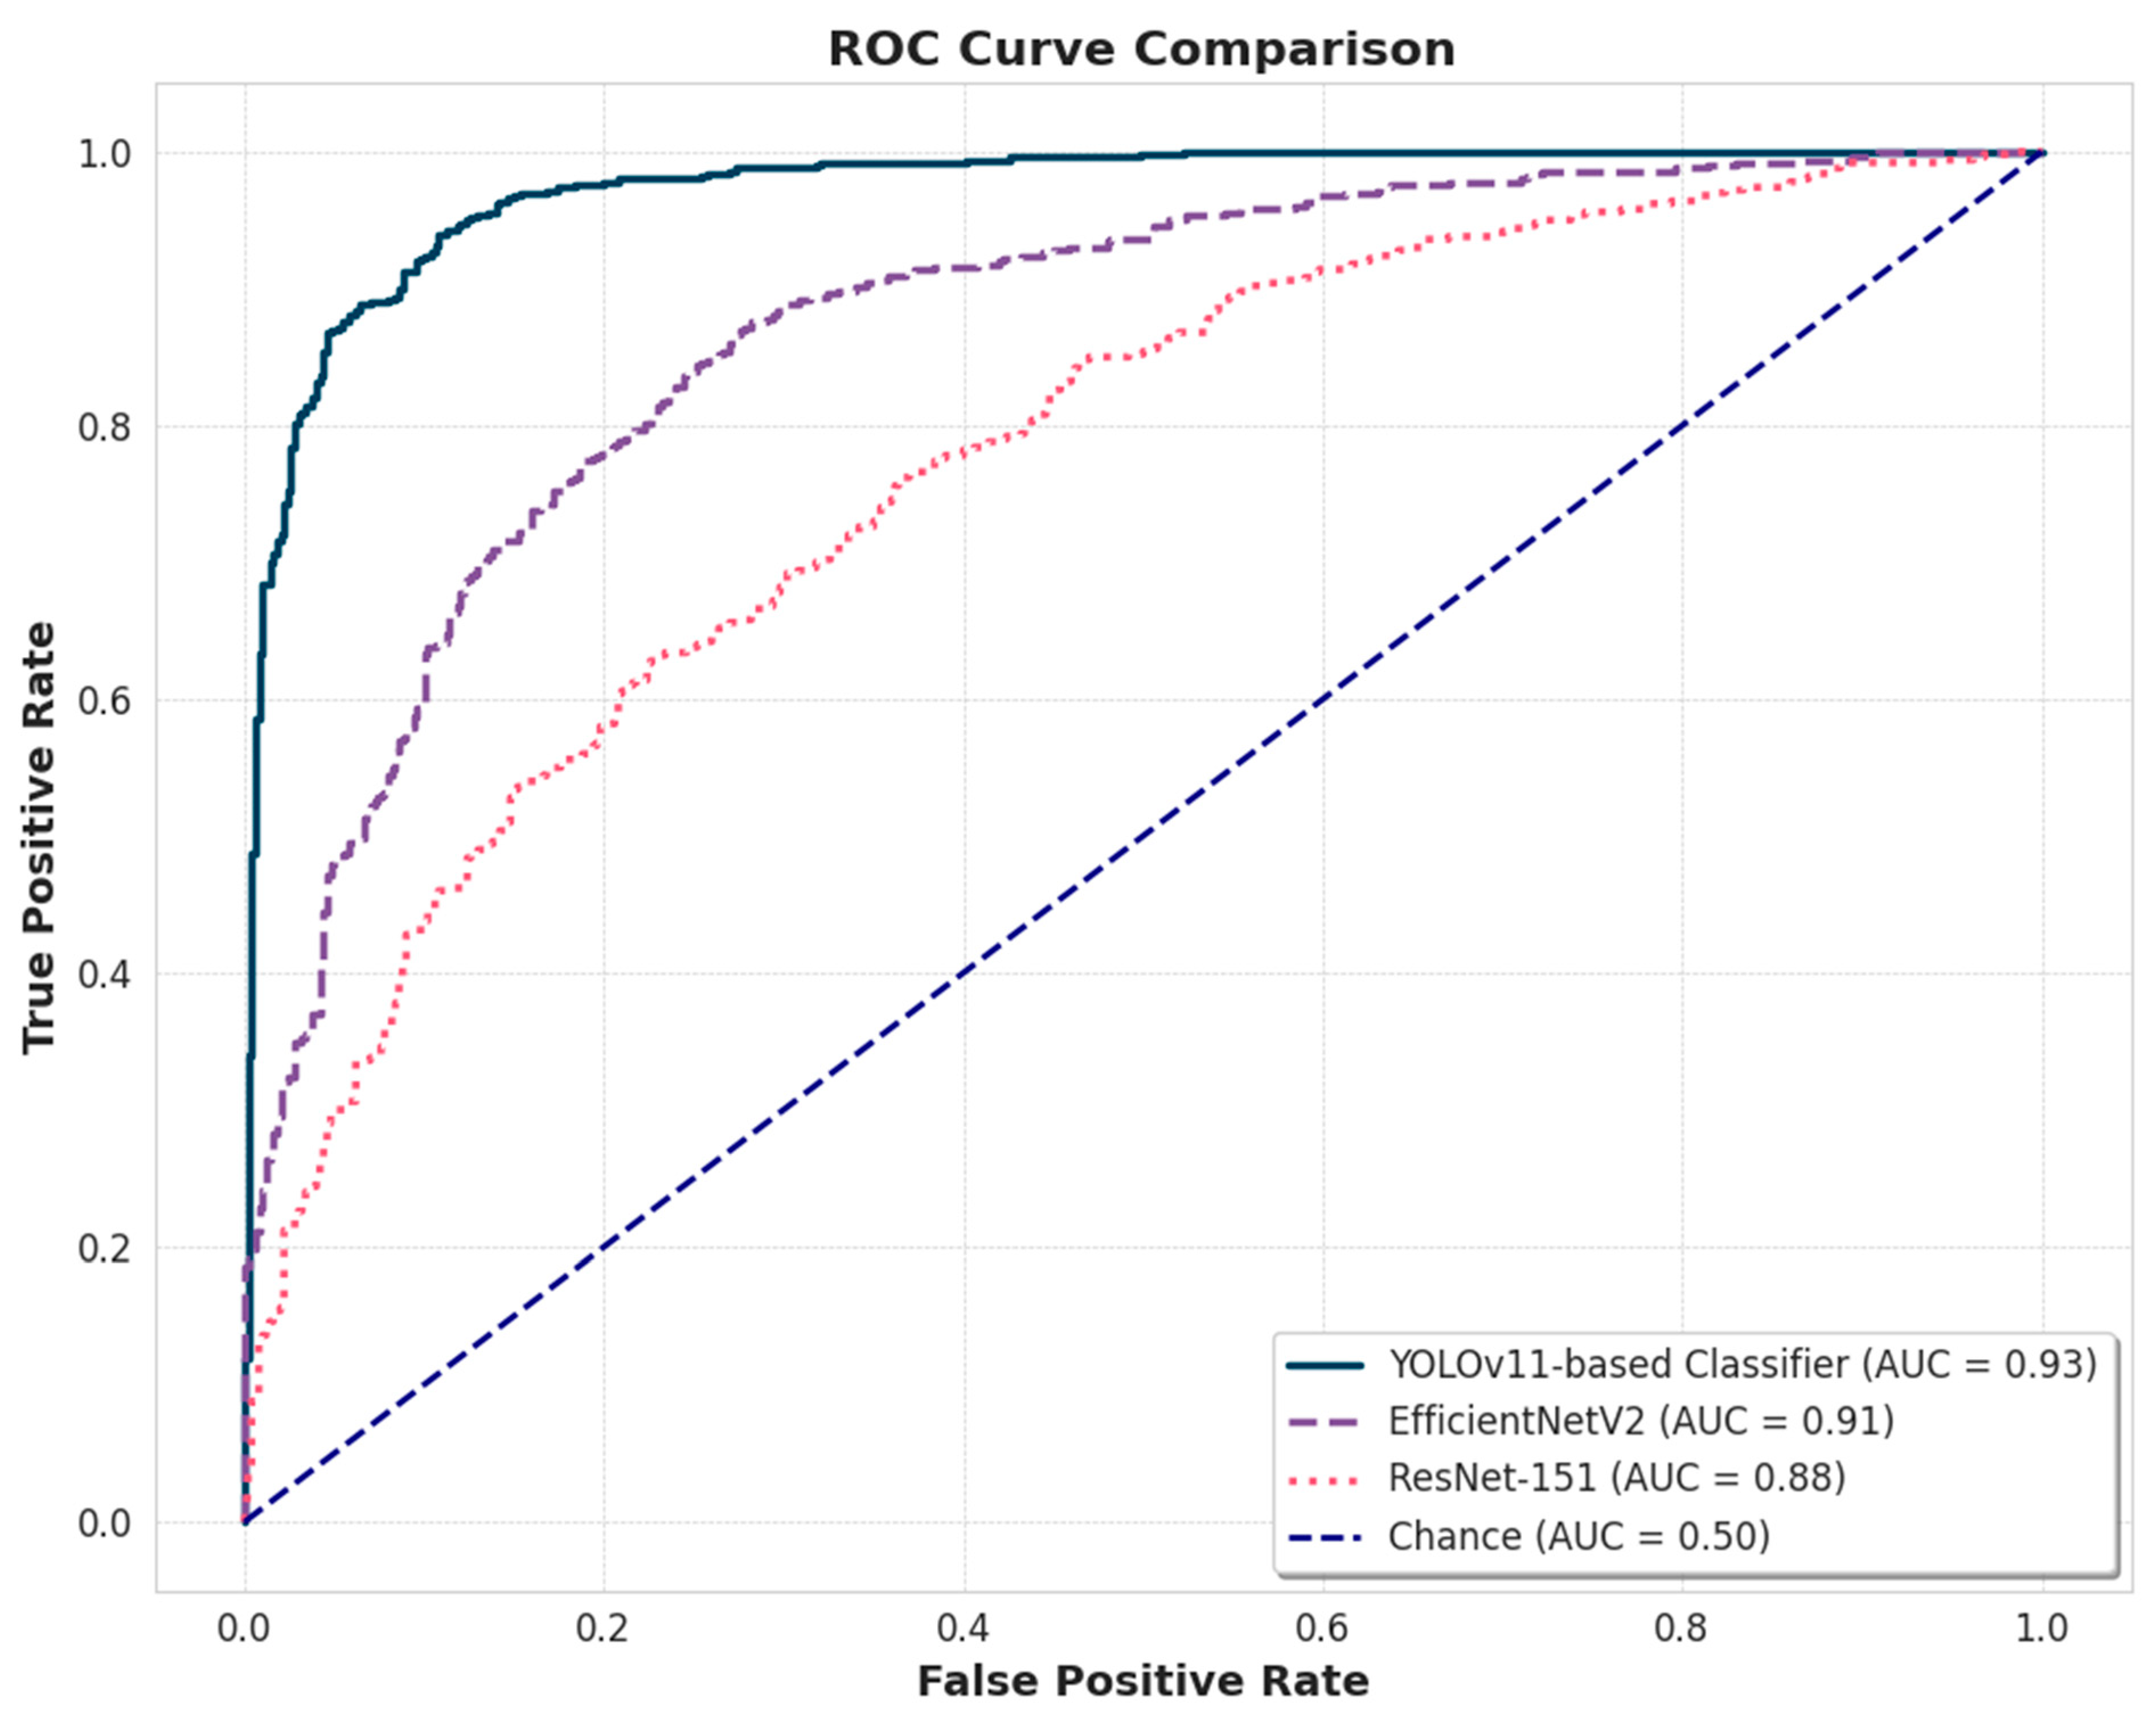
Figure 8.
Normalized confusion matrix of the final YOLOv11-based classifier on the independent test set, demonstrating an overall accuracy of 87%.
Figure 8.
Normalized confusion matrix of the final YOLOv11-based classifier on the independent test set, demonstrating an overall accuracy of 87%.
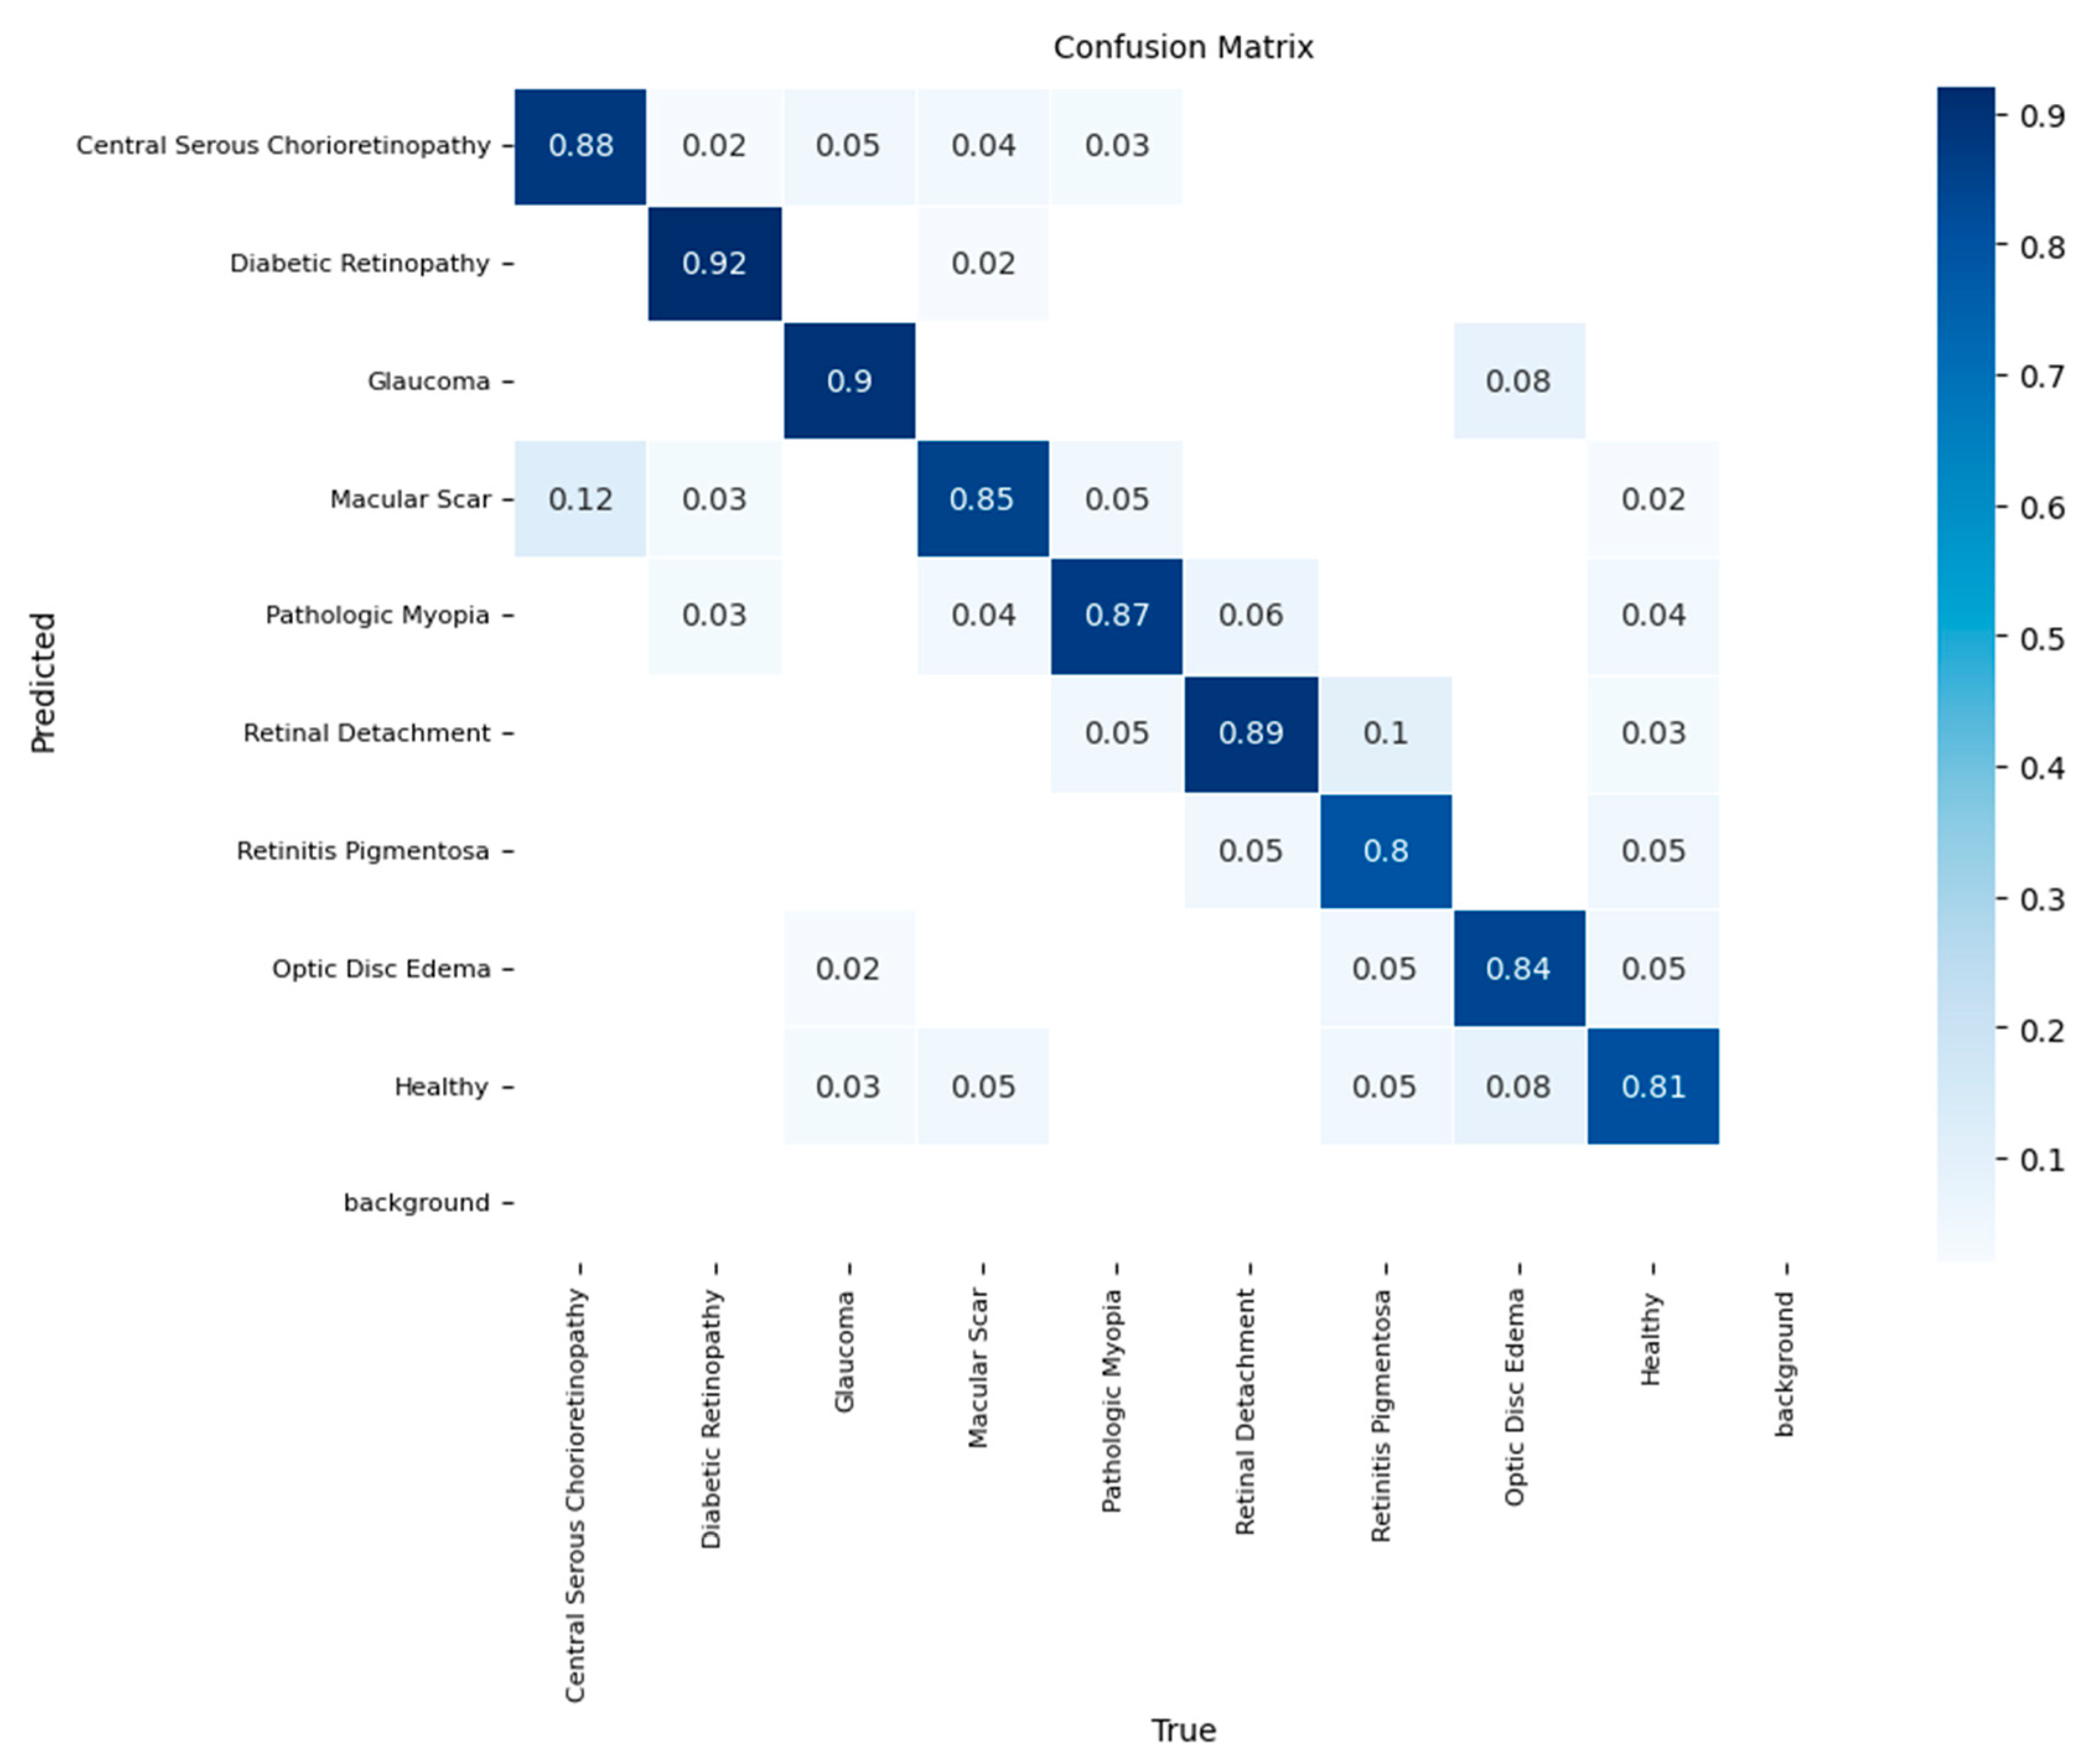
Figure 9.
Representative examples of correct and incorrect classifications by the final YOLOv11-based model on the hold-out test set. The top row displays examples of misclassifications in which the true label differs from the model's predicted label. The bottom row shows examples of successful and correct classifications.
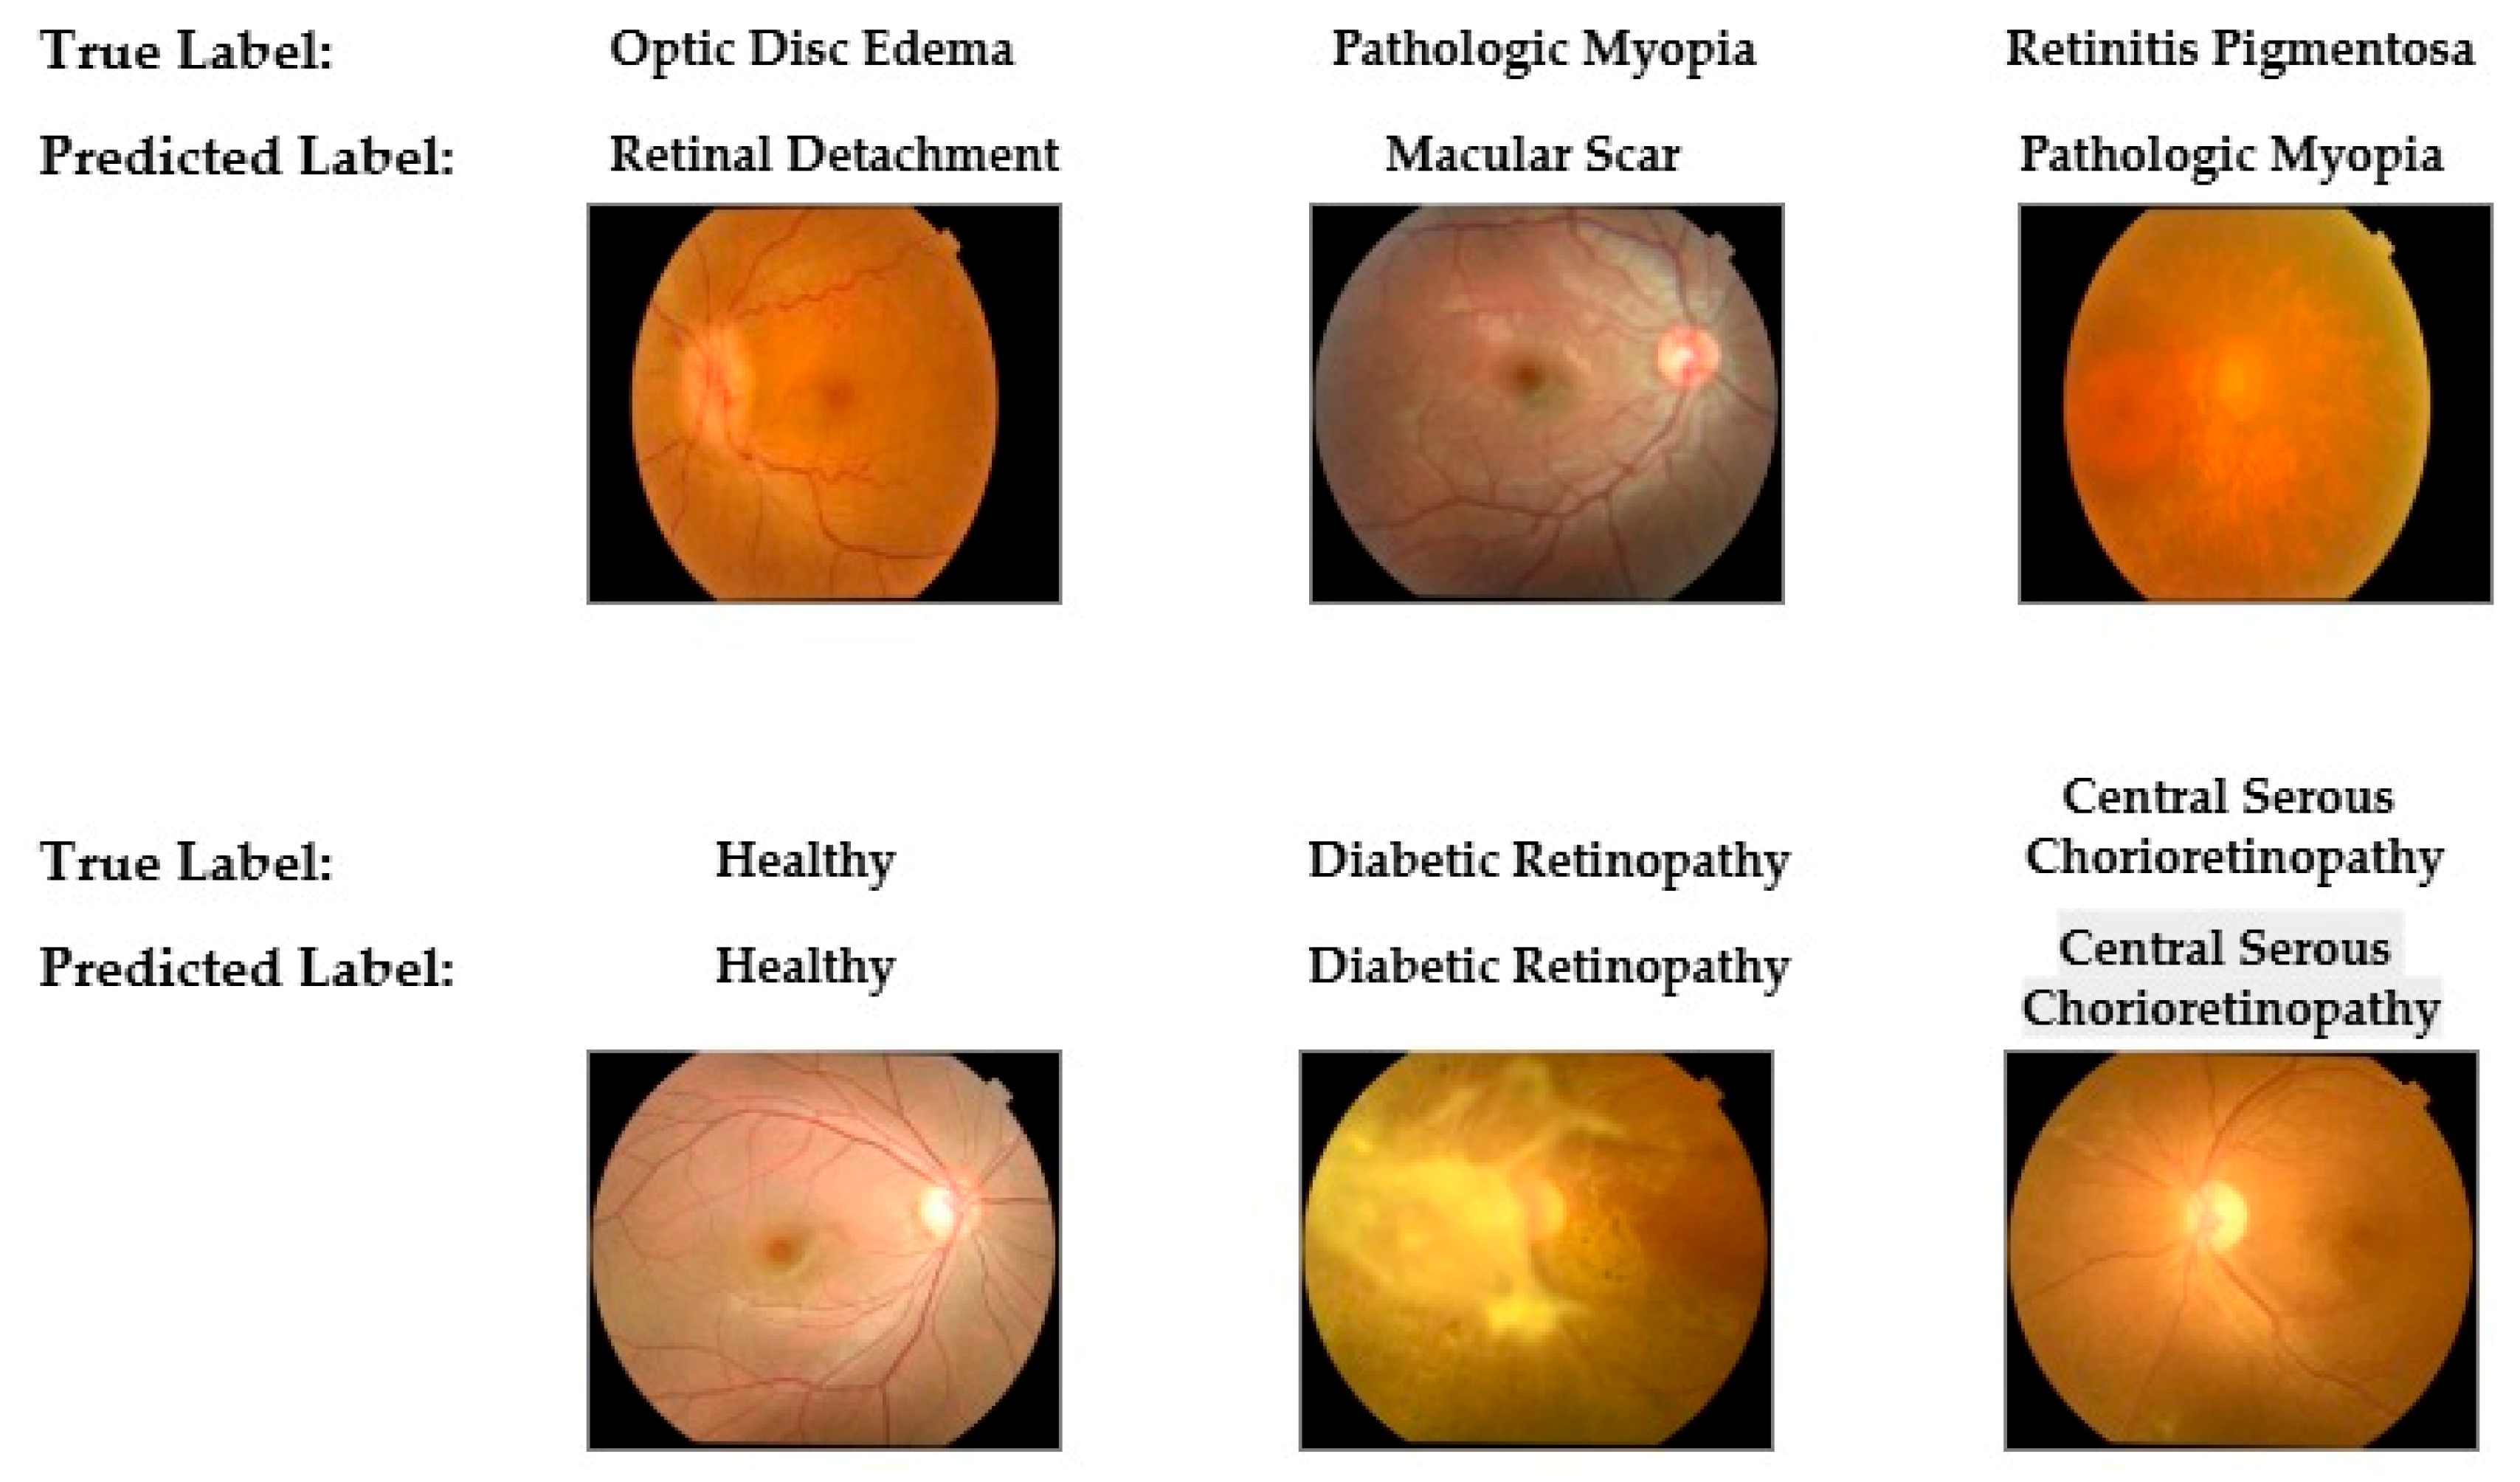

Table 1.
Distribution of images across nine diagnostic classes.
| Class No | Class Name | Number of Images |
| 0 | Central Serous Chorioretinopathy | 101 |
| 1 | Diabetic Retinopathy | 1,509 |
| 2 | Glaucoma | 1,349 |
| 3 | Macular Scar | 444 |
| 4 | Pathologic Myopia | 500 |
| 5 | Retinal Detachment | 125 |
| 6 | Retinitis Pigmentosa | 139 |
| 7 | Optic Disc Edema | 127 |
| 8 | Healthy | 1,024 |
Table 2.
Final Dataset Composition for Model Training and Evaluation.
| Class No | Class Name | Training Set | Validation Set | Test Set |
| 0 | Central Serous Chorioretinopathy | 497 | 15 | 15 |
| 1 | Diabetic Retinopathy | 7,392 | 227 | 226 |
| 2 | Glaucoma | 6,608 | 203 | 202 |
| 3 | Macular Scar | 2,177 | 67 | 66 |
| 4 | Pathologic Myopia | 2,450 | 75 | 75 |
| 5 | Retinal Detachment | 616 | 19 | 18 |
| 6 | Retinitis Pigmentosa | 679 | 21 | 21 |
| 7 | Optic Disc Edema | 623 | 19 | 19 |
| 8 | Healthy | 5,019 | 154 | 153 |
Table 3.
Definitions and formulas of the primary performance evaluation metrics.
| Metric | Formula | Description |
| Accuracy | The proportion of all correct predictions among the total number of cases. | |
| Precision | The proportion of correct positive predictions among all positive predictions. | |
| Recall | The proportion of actual positives that were correctly identified. | |
| F1-Score | The harmonic mean of Precision and Recall, providing a single score that balances both. |
Table 4.
Comparative performance evaluation of the EfficientNetV2, ResNet-151, and YOLOv11-based models on the independent test set. The metrics included overall accuracy and macro-averaged recall, precision, and F1-score for the 9-class diagnostic task.
Table 4.
Comparative performance evaluation of the EfficientNetV2, ResNet-151, and YOLOv11-based models on the independent test set. The metrics included overall accuracy and macro-averaged recall, precision, and F1-score for the 9-class diagnostic task.
| Accuracy | Recall | Precision | F1-Score | |
| EfficientNetV2 | 0.880 | 0.859 | 0.858 | 0.857 |
| ResNet-151 | 0.863 | 0.865 | 0.865 | 0.758 |
| YOLOv11-based Classifier | 0.902 | 0.905 | 0.907 | 0.904 |
Disclaimer/Publisher’s Note: The statements, opinions and data contained in all publications are solely those of the individual author(s) and contributor(s) and not of MDPI and/or the editor(s). MDPI and/or the editor(s) disclaim responsibility for any injury to people or property resulting from any ideas, methods, instructions or products referred to in the content. |
© 2025 by the authors. Licensee MDPI, Basel, Switzerland. This article is an open access article distributed under the terms and conditions of the Creative Commons Attribution (CC BY) license (http://creativecommons.org/licenses/by/4.0/).
Copyright: This open access article is published under a Creative Commons CC BY 4.0 license, which permit the free download, distribution, and reuse, provided that the author and preprint are cited in any reuse.


