
Submitted:
28 July 2025
Posted:
30 July 2025
You are already at the latest version
Abstract
History tries to make sense of disparate data trying to create a discourse of a sequence of events with crisp cause-effect relationships. This is specially difficult for the change of historical ages that signal an epochal shift in a specific part of the world that concerns all aspects of life, from economy to politics and religion. In this research it is fruitful to look at data and follow a well established methodology to claim when something happened and how. This is what we are doing in this paper, where we use historical coin hoard data, a proxy for economic activity and commerce, to establish when the shift from Antiquity to the Middle Ages occurred in a peripheral part of the Roman Empire, the Iberian Peninsula. We will apply different changepoint analysis methods to a time series created from that data to establish when the economic collapse that produced that change occurred, and work back from that result to actual historical events to find its proximal causes. This paper not only tries to settle that boundary, but also proposes a methodology for applying it to other sequence of historical events.
Keywords:
cliometrics
; economic history
; historiography
; changepoint analysis
; fall of the Roman Empire
; Iberian Peninsula
; late antiquity
; early middle ages
1. Introduction
When did the world, as the ancient people knew it, come to an end? This is a question that, even today, does not have a definitive answer by historians, as exemplified by recent papers like [32]. The question is interesting not only for history books, but also for understanding the dynamics of abrupt historical change. However, strictly from the point of view of historiography, a clear border between Antiquity (the first period for which records exist) and the Middle Ages (which finished in the 15th century yielding to the so-called Modern Age) needs to be established. And that boundary is generally ascribed to the fall of the Western Roman Empire. Thus, one question, when did Antiquity change into the Middle Ages, begs another, when did the Western Roman Empire fall?
Historiography have several answers to this question, although most history books will follow [9] in saying that the day and hour the last Roman Emperor was substituted by a "Barbarian" king, the Antiquity ended and the Middle Ages started. That approach takes an essentialist view of history that creates its story and sequence exclusively from written sources, affirming as historical fact whatever is the consensus among several surviving, more or less contemporary, accounts.
A different view was proposed in the 20th century by Henri Pirenne [26] who posited that humanity followed more or less in the same way its daily life until around the 6th century, when the expansion of the Islam disrupted societies and economies in the Southern Mediterranean and ended centuries of trading practices, including trade itself. Pirenne had a different view of history with an approach that can be called tout court, that is, taking into account all sources of information, including material culture, as well as meteorological and geographical data.
This last approach connects well with the cliometrics [10] approach to economic history, which went in parallel with the Annales school of historiography [8] looking for a more systematic and, if possible, statistically sound, approach to the establishment of historical fact and cause-effect relationships.
However, despite this way of writing history having more or less originally for the study of epochal changes, from Antiquity to the Middle Ages, there are relatively few articles that use this tout court approach specifically to the fall of the (Western) Roman empire; specifically, although there are articles that use sources such as lead pollution to explain some of the crisis that eventually led to the fall, there are no papers that use statistical analysis to find a specific date when that change of regime took place.
In a previous report [21] we found a changepoint for the whole dataset of coin hoards, which we called the Danubian hypothesis: a change of trading regime bringing about abrupt changes all across the empire, essentially caused by the loss of the Danube river and accompanying Roman roads as a viable route due to the settling of non-Roman nations (called foederati) which no longer had the capability, or will, of maintaining those ways in working order. That caused a collapse in inter-Roman empires’ commerce, and eventually a change from Antiquity to the Middle Ages, acknowledged by most historiographers a few decades later. To be sure, the battle of Adrianople, which dilapidated several Roman legions and killed the emperor Vales, has been acknowledged for a long time as one factor defining the shift from Antiquity to Middle Ages [4], although that view has received some criticism lately [33]. We proved in [21] that the disruption in the trade patterns, as reflected in the complex network before and after the changepoint, spanned the whole region covered by the dataset. However, the same analysis revealed a link between Great Britain and Spain which vanished and was at least as important as the link between Italy and Bulgaria/Turkey through the Danube that also disappeared after the changepoint. The analysis is not able to reveal, however, if this was another cause or rather an effect of the change in regime.
This is why, in this paper, we will focus on the Iberian Peninsula, by itself and also as a representative of the periphery of the empire and how it was affected by the larger issues, or conversely, how it created challenges that eventually extended to the rest of the empire. There are several reasons for this: first, the quality and quantity of the hoards found here and the precision with which mints can be ascertained from these findings; second, as a peripheral part of the empire, it might have experimented disruption before or after the main changepoint, and to find out which one is the case would contribute to the understanding of the change from Antiquity to the Middle Ages. Finally, there is a very extensive historiographical literature on the Iberian Peninsula (for instance, [17]), which might find easier to connect epochal changes to trends or specific events.
Thus, there are two interrelated research questions that we will work with in this paper:
- Research question 1 Is there a changepoint in the Iberian Peninsula trade links? Is it connected to the Danubian hypothesis?
- Research question 2 If that is the case, can we find a local cause for this changepoint that is concomitant or caused by the Danubian hypothesis?
One of the issues with a statistical approach to the study of history is the nonexistence of a methodology that goes back from the statistically established facts to the historical facts they are supposed to prove. In this paper we adapt the methodology we used in [21] to the subset of data referring to the Iberian Peninsula. The methodology consists of the following steps
- Validate the dataset by recurring to internal checks or checks against other existing dataset for the same era.
- Use changepoint detection methods to find a changepoint in the time series, validating it by using different changepoint detection methods.
- Use separate and joint changepoint detection methods for different time series referred to the same events to establish sequence of these changepoints.
- Analyze data before and after the changepoint to establish the factors that contributed to it. Use again statistical analysis for doing it, from complex network analysis to other kind of methods.
- Go back from this statistical analysis to the historical events that have caused them, trying to establish historical facts.
The rest of the paper is organized as follows: next we will present the current state of the art in the application of change point detection methods in history, as well as any other analysis that try to research the boundary between Antiquity and the Middle Ages. We will describe and show an overview of the dataset in Section 3. The data will be analyzed, trying to respond to the research questions in Section 4. Finally, we will discuss these results and present our conclusions in Section 5.
2. State of the Art
This paper was kicked off by the publication of a preprint by [2] which set out to analyze changes in economic regime in the Mediterranean as reflected in coin hoards found during a millennium. This change in economic regime was predicted by [27], claiming that the real Middle Ages did not start until the onset of the Islamic invasion of the Middle East and North Africa disrupted the trade routes, breaking it into smaller, regional ones, which had to fend for themselves.
The main point of this school of thought is that what traditional historiography has considered break points, in this case the fall of the Roman Empire, need to be reconsidered in the light of all kind of data available to us, including the one we are using in this paper, coin hoards as a proxy for trade, and only reach a conclusion after this data has been analyzed and tested statistically. For instance, [19] look at lead pollution and levels of lead in blood, leading to cognitive decline which explains that fall; lead has been studied for some time as a disruptive factor in the Roman Empire, for instance in [19], which use a different data source. However, this paper focused on economic growth and how it changed along the centuries, focusing on the changes between the years 600 and 800. It certainly did not set out to analyze if there was a precise breakpoint, and what the reasons for it could be.
We are going to focus in this paper on the Iberian Peninsula. As a peripheral part of the Roman empire any disruption might have affected it, but in a different way or in a different time frame. This is why we are especially interested in works that focus on this area, like [24] and [7].
The main take away from this paper is that we can use existing datasets that have a basis in trade, like coin hoards, to find evidence of disruption in economic patterns, since trade is at the same time one of the main drivers, as well as indicators, of economic activity. And the era under study was not short on epochal events that could have caused such disruptions. Of course, the final fall of the Western Roman Empire should have some kind of impact [17], since the Roman central administration definitely vanishes by mid 5th century. However, modern historiographical analysis, following Pirenne, tells us to look further than that into other kinds of factors. Two of the most important factors that impacted the whole Roman empire were the Antonine and Cyprian plagues, which happened in the 2nd and 3rd centuries [19] and had lasting effects spanning at least five centuries.
Focusing on the Iberian Peninsula, the Visigoth invasion did produce some discontinuity, but trade continued diminishing during the 5th and 6th centuries, although most changes were relatively slow [7].
These multitude of factors can produce abrupt changes in time series, but you need to apply rigorous statistical methods to be able to find the precise change point and then work back and try to explain the change in historical trends through the other data, historiographical, environmental and archaeological, that is available. This approach is called, in general, change point analysis, and it has been repeatedly applied to historical data including battle deaths [6], use of force by US presidents [12], analysis of the actual life terms served by Venetian doges [20] and how shifts in marriage patterns explain the different shift points in the Republic of Venice [22]; the technique was initially created for climate variations [1] but since then, different algorithms, including Bayesian ones, have been applied to the analysis of historical time series [30].
A recent report [21] analyzed the whole dataset of coin hoards and found a change point in the early 5th century. An additional social network analysis discovered that the center of the network, previously based in the Danubian area, had collapsed after the changepoint, hypothesizing that the loss of the Danube and adjoining Roman-maintained and -guarded roads after the defeat of Adrianople and the inclusion of foederati homelands South of the river provoked a general disruption of trade patterns, and thus, by definition, the actual Fall of the Roman Empire and the beginning of the Middle Ages.
By focusing on the analysis of the trade patterns that coin hoards reveal, and using change point detection methods and focusing on a specific area, we should be able to find more precisely what group of trends produced those changes and if there were some specific events that produced those trends or their change. The variation in the dates of the changepoint might also reveal cause-effect chains in one direction of the other or locate with higher precision chain of events that led to change of a global scale.
How we processed the dataset used and the methodology applied to it in this paper will be explained next.
3. Materials and Methods
We have used the FLAME (Framing the Late Antique and early Medieval Economy ) database as the main base for this paper, in its September 2024 version, which is available from https://coinage.princeton.edu/flame-database-last-version. This project has published a series of datasets that contain information on coin hoards found all over the world, and spans from the 4th to the 8th century. This dataset formed the basis for [2], although it was enhanced with more data that has not been published so far.
We will focus on the Iberian Peninsula and the two countries with hoards and mints, Spain and Portugal1. We simply included in our datasets hoards or mints that had been geolocated to these two countries.
We might wonder about the validity of this dataset as an, if not complete, at least unbiased representative of the activity we want to study. Any archaeological dataset is a sample of all possible data, and will probably have some biases, as revealed by [29]. Certainly, those countries that are more urbanized will have found more coin hoards than those that are sparsely populated. In that paper, Spain has 36% of sites with a numismatic rating of "Good" or better, over 461 hoards that have been found; it is among the 4 countries that have been described in the paper as good data quality ([29], caption to Table 1); in the conclusion, it affirms that
- in Portugal and Spain urban hoards more often have a high data quality.
So, this gives the subset of the original dataset we are using enough validity to be able to draw some conclusions from its statistical analysis. In what follows, we will describe which specific files we have used from that dataset, and the processing they have undergone (Subsection 3.1), show an general overview of coin hoard data and its distribution in Subsection 3.2 and finally indicate how the dataset is validated in Subsection 3.3.
3.1. Dataset Processing
The FLAME datasets include many different files. We have used three of them
- Coin groups, which contains individual information on the group of coins found in every hoard and the mint where they were minted; it includes also information on the range of time those coins were minted cross referenced to the two files below.
- Hoards, which contains information on the hoard itself, including the date it was found, the number of coins, and the place where it was found.
- Mints, that contains location information on said establishments.
We have made a series of processing steps to use them
- We have geolocated the mints to a specific current country, using the GeoApify service.
- We have processed hoards and mints to keep only those that are placed in the two countries in the Iberian Peninsula, Spain and Portugal.
-
We were interested in the trade links and its number, that is, the number of coin groups from one country found in another country, so we processed all files above to obtain that information. We generated two files with this procedure:
- −
- Iberian-only trade links, which contain only the trade links where the mint and the coin finding (hoard) are in the Iberian Peninsula.
- −
- All trade links of hoards found in the Iberian Peninsula or that contain coins minted in it.
- We processed the resulting files per decade starting in 0, so that the granularity of the resulting time series of trade links is 10 years. The main reason for doing so was the fact that many years had zero links, so grouping them by decade seemed a good way to smooth differences that could have happened fron a single year to the next.
- We filled with 0s all those decades with no links.
- Finally, we shortened the time series so that they start and end in the same year.
As a result, we have two synchronous datasets with 46 decades that start in the decade 310 and end in the decade 760
- Time series of trade links per decade within the Iberian Peninsula.
- Time series of trade links per decade between the Iberian Peninsula and elsewhere.
These processed datasets are available in R data format in the repository for this paper, https://github.com/JJ/medieval-trade.
3.2. Overview of Coin Hoard Data
The connectivity of the dataset is represented in Figure 2; where, as shown above, the vertices are current-day regions, and edges have a weight equivalent to the overall number of links.2
The top edges of that network are shown in Table 1. At the top is the connection between Spain and the United Kingdom that was already pointed out in the introduction. Obviously, connections between the two parts of the Iberian Peninsula and Italy are important, as well as the connection between Spain and Turkey, where Constantinople, the capital of the Eastern Roman Empire, was placed. Connection between the two countries in the region, Spain and Portugal, are not as important as the connections between Spain and France. Connections further away than France, to Germany, and to the Palestinian Territory, are also at the top. This indicates a trade network that was maritime in a big part and which extended through the Mediterranean to the middle east; also that internal commerce, although important, was not the main source of imports or exports for any of the countries, which had better relationship with the capital of the empire (represented here by Italy and Turkey) than with each other.
The importance of trade with the United Kingdom might be, to a certain point, the evidence of a certain bias in the dataset, since the abundance of hoards in the UK is higher than in other places due to its population density and other sources of bias; this is mentioned explicitly by [16], which mentions a series of legislative measures that have made coin hoards found there more likely to end up in the database. On the other hand, it has been clearly established by scholars that Spain and the UK shared material culture [7] and that the trade in raw materials, luxury items, as well as transshipment through Spain of goods produced elsewhere, mainly in Africa, was intense [31] and long-lasting.
At any rate, we would need to discuss the validity of the dataset, which we will do in the next subsection.
3.3. Dataset Validation
There are many inherent biases in any archaeological dataset, something we have already acknowledged in subsection 3.2. The biases, as indicated in [16], mainly concern regional representation and their relative importance; the authors assert that
... FLAME is not a representative sample of the ancient monetary circulation.
The FLAME database stands at the rear end of a funnel that receives all coins but drops those that did not survive, were not excavated or were excavated but not studied, or those that were studied but not published. The bias that every one of those filters introduce is unknown. However, the authors also affirm that those known unknowns, as well as the unknown unknowns, do not render the dataset totally useless, and in fact it has been used repeatedly, more notably in [2], where it is only part of the database, and in [21], where it is the main source of data.
Besides, regional distribution is not the main focus of this paper, as we are mainly concerned with the detection of change point in a time series; in this sense, temporal biases would greatly affect results, in the sense that if a change in the number of links is indicative simply of absence of evidence for that particular period and not absence of links, the result would be compromised. [16] mentions that the early medieval period has only very recently been a source of interest, and that in many cases sites linked to that period will not be excavated and even, in some cases, bulldozed. As a matter of fact, there is a notable absence of links in some specific decades, as shown in Figure 1. On the other hand, we should take into account that while there is bias in choosing the places to excavate, the year where coins where minted or used is an output which cannot be filtered beforehand. This means that unless some specific region was the only source of coins or hoards for a specific period, or coins from some period were simply dropped or results not published, we should expect an (unquantified) smaller bias in the time series of links we are using in this paper.
An additional source of validation for this dataset is using a different, independently gathered, time series related to economic activity. [18] in their paper that follows up a previous one [19], the authors establish a connection between the economic activity (and other events that are bound to impact it, like war and plagues) and lead pollution measured in ice cores; since lead is released into the atmosphere as a result of mining and minting activities, there could be a correlation between hoard and lead data. By using the dataset they have released, we have analyzed cross-correlation between the two time series shown in Figure 3. The two time series are significantly correlated in the interval for -30, -60 and -70 years of lag, as shown by ACF values surpassing the dashed blue line, that is, a change in lead pollution would lead to changes in links 3, 6 or 7 decades later (equivalent to one or two generations).3 This would be an additional validation for the time series, which, despite the bias in the original data, would be representative enough of this economic activity to support the validity of our responses to the research questions.
Additionally, we will try to connect our results to other sources of information, be it written or from material culture, so that they can be validated in an independent way. At any rate, any data used in this paper will be published with a free license from the repository at https://github.com/JJ/medieval-trade, so that it can be validated independently.
4. Results
After we have established the validity of the dataset, we will go ahead and try and answer the first research question, namely the existence of a changepoint in this subset of the data analyzed in [21]. As we did in that case, we have used the cpt.meanvar function of the changepoint package [13], which includes several functions for this kind of thing. The function chosen, cpt.meanvar, looks for a point of maximum change in the mean and the variance; since variability in the time series is extreme, this option looked like the most reasonable for this kind of study. Default values have been used for all the other function parameters except for the method, which has been set to AMOC ("at most one change") to ensure that we get a single changepoint 4; if we want this kind of quantitative methods introduced into Digital Humanities and specifically into the study of history, the simplest possible method is the best way to make adoption easier. The result, with averages before and after the changepoint, is shown in Figure 4.
As it can be observed, there is a statistically significant changepoint in the year 420. This is roughly 20 years after the year found in [21], but still half a century short of the Fall of the Roman Empire with the ousting of the last emperor by Odoacre [32]. We will validate this approach using other methods, to find a bracket of possible changepoints; this way we can have a better idea of the time period when the change happened. We have used two non-parametric tests, Lanzante’s [14] and Pettit’s [25] as well as Buishand’s range test, which applies to normal variables [3].
The results of the different changepoint methods are shown in Table 2. They are at both sides of the changepoint detected by the first method, thus giving an interval of possible changepoint years between 400 and 460. Please observe that all changepoints are statistically significant, the difference in output being the different methods used to detect them; however, Buishand’s methods are for normal variables, a fact that is not guaranteed in this case; although statistically significant, we should probably lend more credibility to the non-parametric methods, which, besides, are consistent with each other. We would then have a range of dates between 420 and 460.
Before looking for a possible cause, we should try and place the internal Iberian traffic changepoint, this being an important component of all the trade links; any variation withing the range we have would point out to important internal causes for the change of regime, that would contribute (or detract) from any external cause.
The changepoint plot with averages before and after it is shown in Figure 5. The changepoint is in the year 380, an earlier date than previously detected, but still in the same range. The interesting thing is that intra-Iberian trade was disrupted very soon after the Battle of Adrianople [4], which might indicate some signs of the decay in the periphery of the empire (the Iberian Peninsula was literally finis terrae).
In this case, there are specific methods for finding changepoints in time series with multiple columns, like this one. In order to apply the procedure, we first subtract the number of internal links from the number of total links to have two different synchronous sequences, with trade links inside and outside the Iberian Peninsula. On this two-column array, we apply the e.divisive function from the ecp package in R [23] which implements a hierarchical divisive estimation procedure, finding changepoints and applying again the same procedure to the resulting fragments. The result is shown in Figure 6, with the vertical dashed line indicating the changepoint found5, which shows a vertical dashed line for the changepoint found at 410.

Table 3.
Changepoints found in the Iberian trade links time series.
| Method | Changepoint year |
|---|---|
| All links, cpt.meanvar | 420 |
| All links, Lanzante/Pettitt | 460 |
| Internal links, cpt.meanvar | 380 |
| Multi-sequence, e.divisive | 410 |
This would allow us to answer, at least partially, RQ1: yes, there is a statistically significant regime change reflected in the time series of external, internal and aggregated trade links extracted from connections between hoards and mints. Different methods will give us different change points with the same statistical significance, but they all fall within the same 80 year period that starts in 380. This period starts soon after the Danubian hypothesis, as a matter of fact so we might give a tentative positive answer to the second part of the research question. But we will need to dig deeper into the data to give a more definitive answer.
In order to do that, we will look at specific trade links, and how they evolved with time.
In Figure 7 we show the evolution in time of the top links (as indicated in Table 1); these, unless noted otherwise, are connections with Spain. We see a crash in the number of links across the board, but we note that the links with the United Kingdom (highlighted also with points at every value) started to decline several decades before the changepoints indicated above. Several different links took its place, notably Italy, Turkey (which hosted both capitals of the empire), but also France, the Netherlands, and most notably, connections within the current territory of Spain (also marked with points), which reach its peak here. Eventually, these also fall to a minimum level right around the time of the found changepoint.
None of these point directly to a direct impact of the Danubian hypothesis. The peak in links right before the changepoint in "border" territories such as France and the Netherlands might be due to two different reasons: in times of trouble, when different groups such as the Vandals or the Alans were pressuring from the Rhine [11], people resorted to burying their treasures; but the second reason is that since there were troops fighting in those areas which needed to be supplied, the trade with them increased over other, relatively more peaceful, times.
However, what is clear is that the changepoint is a downstream event caused by the collapse in trade with the United Kingdom. What happened there in the 380s was the first removal of Roman troops due to the invasion of Gaul by the usurper Magnus Maximus [28].
In that sense, although both events occurred in a sequence, there is no evidence of a direct relationship between them, that is, the defeat and consequent settlement of different peoples South of the Danube did not provoke the intervention of troops in Britain and subsequent collapse of the economy; we might establish some indirect cause-effect relationship, however: the loss of the via militaris and the Danube [15], and the troops lost at the battle of Adrianople, impeded any help of troops from those provinces (which included also Goths) to the Western emperor attacked by the usurper; in that sense, they are both part of a larger pattern of resettlement of different human groups displaced by climate change and other human groups, crossing the natural borders of the empire, which made the extensive logistic and trade routes maintained by the empire go into disrepair, as well as provoke a collapse of economic demand of goods traded across a long distance.
This will make the response of the second part of research question one partially negative: the change in economic regime revealed by coin hoards in the Iberian Peninsula had as main factor the loss of the territories in current United Kingdom as a trading partner; this had only a very indirect relationship with the Danubian hypothesis, with a common, and further removed, cause for both a more likely hypothesis. This common cause would explain the very approximate synchronicity of changes of regime in the Iberian Peninsula and the Empire as a whole.
As is notable, the economy mostly collapsed, but that also meant that different trade links started to have more importance; we reproduce in Figure 8 the same sequence indicating percentages of links, again with the "Other" category taking all links not in the top ten; what we see is that from the approximately the year 410 most links occur with these other countries, except for brief periods where France and the Eastern Roman empire have the most importance. By the end of the 5th and during the 6th century, there are very few interchanges, but whatever trade is taking place is merely internal; we can refer again back to Figure 7 where we see a that in those dates internal date is essentially the only one taking place; during all those years, links with Eastern Roman Empire (Turkey) are constant and in most case more important than those with the Western Empire. As a matter of fact, the indicated period matches the occupation by the Byzantine empire of parts of Southern Spain [31]. The (weak) economic revival during those years would be a worthy field of study.
Although partially answered already, we can turn our attention to the second research question, relative to the local causes for the change of regime revealed by the different statistical methods. And looking at Figure 7 and Figure 8 we can see that the economy of the Iberian Peninsula was heavily dependent to the point of being almost one and the same with the Roman settlers and armies in the current United Kingdom territory. When they left, they took the Iberian Peninsula economy with it; initially almost literally, since commerce continued with other areas where these armies were battling others, France and the Netherlands; eventually, not even these new sources of income, or the brief period of intense trade connections with the Eastern Empire, were able to overcome the fall of demand; those were, anyway, long-distance trade links that, without intermediate stages (like the Italian peninsula or Sicily) could not substitute for trading partners situated at a shorter distance. Internal demand was never intense enough, and also related to trade with the current UK territory, to pick up the slack, leading eventually to the collapse we mention in the paper title.
5. Discussion and Conclusions
In this paper we have followed a methodology for linking statistical results to historically established facts, by analyzing historical data looking for changepoints and delving into data before and after the changepoint looking for possible immediate causes of those epochal changes.
We were looking to establish the dates and causes of the collapse of the Western Roman Empire in the Iberian Peninsula, a peripheral part of said empire, by looking at data from the FLAME coin hoard database. We validated the dataset of trade links obtained from that database used via correlations to the lead pollution time series, giving us a solid foundation for performing this analysis. We found statistically significant changepoints for different time series obtained from that data in a range of years that preceded the actual fall of the Roman Empire, but always after the Battle of Adrianople, an event whose significance was found in our previous report [21].
With this analysis we have answered our research questions: there are indeed changepoints also in this subset of the global trade links dataset used before; however, although the dates of said changepoints are similar, an analysis of the trade links in the Iberian Peninsula point to causes that do not have a cause-effect relationship with those causing the collapse of the Western empire at large: mainly, the dependence of a mainly commercial economy with the supply of the Roman elite and troops in the British Isles, with the first indications of problems after the bulk of the troops abandoned them during the last quarter of the 4th century, and the total collapse of the economy after the isles were left to their own devices, which resulted in a collapse of material culture in England and a collapse of the economy in the Iberian Peninsula. This also coincided with the first sack of Rome by the Visigoths [5]. At any rate, we have established that the causes for the economic collapse in the Iberian Peninsula are mainly local and related to its economic dependence mainly the British Isles, and lack of a sufficient internal demand to keep it going even after external demands falls essentially to zero.
The results of these two events, collapse of trade in the Mediterranean at large caused by the demise of the Danube as a viable route, as well as collapse of the Atlantic trade due to the fall of the British Isles as an economic node, point, interestingly enough, to network events that highlight its importance in the visualization of system-wide collapses. The former was mainly due to the elimination of an edge, which disconnected two important clusters of nodes; however, the latter can be visualized as the elimination of a node, with the consequent elimination of all edges connecting to it. Network science that looks at static networks can affirm that, for a small-world network (which it mainly was), those events will only result in small changes in communities and overall closeness. However, from an economic point of view, the decrease in demand and increment of shipping costs will propagate through the network, causing the subsequent elimination of more edges and nodes and the effective conversion of the network in single nodes or small networks with little power or possibility of reconstructing the network back again, at least in the short- or mid-term.
Looking again at Figure 1, and the small surge in trade by the beginning of the 8th century, we can interpret Pirenne’s hypothesis as a second changepoint that possibly eliminated the routes that were already remaining, maritime routes that needed less maintenance than land routes and that could be supported by trading and military navies, and harbors, produced and maintained locally. However, it is relatively clear from the coin hoard data that the actual trade taking place by the beginning of the Islamic expansion was orders of magnitude lower than that existing a few decades before the early 5th century changepoint revealed in this paper (and [21]). That changepoint, by itself, might be sufficiently significant to indicate a minor change of regime, but probably not the social, politic, religious and economic chasm that opened itself between Antiquity and the Middle Ages, a chasm that we have proved occurred in the first quarter of the 5th century.
We could discuss if these results contradict current historiography. We can argue that they, in fact, do not. The relationship between the battle of Adrianople and the fall of the empire is sufficiently accepted by historiographers, as well as the common material culture across the Atlantic coast during the late empire. However, what we present in this paper is first a methodology to use datasets to establish precise dates for changes of regime in historic time series, and then apply further analysis to the data from which the time series has been created, before and after the changepoint, to establish rigorous cause-effect relationships. This methodology was initiated in [20] and extended and systematized in [22]. In this paper we present it explicitly, and apply it in a more significant historical change, the shift from Antiquity to Middle Ages.
By applying this methodology to the FLAME database, it would be interesting to research causes and effects in other parts of the empire. Italy would be specially interesting, but also the United Kingdom itself, as well as all North Africa, although in this case there is probably less data and we would have to wait for a more complete database. Finally, using leas pollution databases not only for validation, but as part of the changepoint analysis, as well as other climatological or food production data would allow a more tout court research of the initial causes of this collapse, and how each of them affected this collapse in different and unique ways.
Funding
This work is supported by the Ministerio español de Economía y Competitividad (Spanish Ministry of Competitivity and Economy) under project PID2023-147409NB-C21.
Data Availability Statement
The data for this paper is available at the GitHub repository https://github.com/JJ/medieval-trade under a free license. The source for this paper includes the R scripts used for processing data and producing the results presented here; this code is free software too.
Acknowledgments
I am grateful to my professors of History of Antiquity and Middle Ages at the degree of Art History at the University of Granada, who by mentioning Henry Pirenne in class, led me down a rabbit hole that eventually produced this paper.
Conflicts of Interest
The author declares no conflicts of interest.
References
- Beaulieu, Claudie, Jie Chen, and Jorge L Sarmiento. 2012. Change-point analysis as a tool to detect abrupt climate variations. Philosophical Transactions of the Royal Society A: Mathematical, Physical and Engineering Sciences 370(1962), 1228–1249. [CrossRef]
- Boehm, Johannes and Thomas Chaney. 2024. Trade and the end of antiquity. Technical report, London School of Economics and Political Science, LSE Library.
- Buishand, T Adri. 1982. Some methods for testing the homogeneity of rainfall records. Journal of hydrology 58(1-2), 11–27. [CrossRef]
- Burns, Thomas S. 1973. The battle of Adrianople: a reconsideration. Historia: Zeitschrift für Alte Geschichte (H. 2), 336–345.
- Collins, Roger. 1991. The battle of Adrianople and the sack of Rome, pp. 45–57. London: Macmillan Education UK. [CrossRef]
- Fagan, Brennen T., Marina I. Knight, Niall J. MacKay, and A. Jamie Wood. 2020, 06. Change Point Analysis of Historical Battle Deaths. Journal of the Royal Statistical Society Series A: Statistics in Society 183(3), 909–933. [CrossRef]
- Fernández, Damián. 2017. Aristocrats and statehood in Western Iberia, 300-600 CE. University of Pennsylvania Press.
- Forster, Robert. 1978. Achievements of the annales school. The Journal of Economic History 38(1), 58–76.
- Gibbon, Edward. 2015. The Decline and Fall of the Roman Empire. Delmarva Publications, Inc. [CrossRef]
- Haupert, Michael. 2017. The impact of cliometrics on economics and history. Revue d’économie politique 127(6), 1059–1082. [CrossRef]
- Heather, Peter. 2009. Why did the Barbarian cross the Rhine? Journal of Late Antiquity 2(1), 3–29.
- Hee Park, Jong. 2010. Structural change in US presidents’ use of force. American Journal of Political Science 54(3), 766–782.
- Killick, Rebecca and Idris A. Eckley. 2014. changepoint: An R package for changepoint analysis. Journal of Statistical Software 58(3), 1–19.
- Lanzante, John R. 1996. Resistant, robust and non-parametric techniques for the analysis of climate data: Theory and examples, including applications to historical radiosonde station data. International Journal of Climatology: A Journal of the Royal Meteorological Society 16(11), 1197–1226.
- Larnach, Matthew John. 2016. All roads lead to Constantinople: Exploring the Via Militaris in the medieval Balkans, 600-1204. Ph. D. thesis.
- Lee, Mordechai, Alan Stahl, Mark Pyzyk, and Curto P. Ilia. 2025. Systematic bias in humanities datasets: ancient and medieval coin finds in the FLAME project. Digital Humanities Quarterly 19(1). Copyright - © 2025. This work is published under http://creativecommons.org/licenses/by-nd/4.0/ (the “License”). Notwithstanding the ProQuest Terms and Conditions, you may use this content in accordance with the terms of the License; Última actualización - 2025-06-20; SubjectsTermNotLitGenreText - Europe; Eurasia.
- Martínez Jiménez, Javier, Isaac Sastre de Diego, and Carlos Tejerizo García. 2018. Late Antique and Early Medieval Iberia, Chapter The Iberian Peninsula between 300 and 850: an Archaeological Perspective. Amsterdam University Press.
- McConnell, Joseph R., Nathan J. Chellman, Andreas Plach, Sophia M. Wensman, Gill Plunkett, Andreas Stohl, Nicole-Kristine Smith, Bo Møllesøe Vinther, Dorthe Dahl-Jensen, Jørgen Peder Steffensen, Diedrich Fritzsche, Sandra O. Camara-Brugger, Brandon T. McDonald, and Andrew I. Wilson. 2025. Pan-European atmospheric lead pollution, enhanced blood lead levels, and cognitive decline from roman-era mining and smelting. Proceedings of the National Academy of Sciences 122(3), e2419630121. [CrossRef]
- McConnell, Joseph R., Andrew I. Wilson, Andreas Stohl, Monica M. Arienzo, Nathan J. Chellman, Sabine Eckhardt, Elisabeth M. Thompson, A. Mark Pollard, and Jørgen Peder Steffensen. 2018. Lead pollution recorded in Greenland ice indicates European emissions tracked plagues, wars, and imperial expansion during antiquity. Proceedings of the National Academy of Sciences 115(22), 5726–5731. [CrossRef]
- Merelo, Juan J. 2023. It’s a doge’s life: Examining term limits in venetian doges’ life tenure. Histories 3(1), 21–31. [CrossRef]
- Merelo Guervos, Juan Julián. 2025, 7. Finding changepoints in medieval european and middle eastern trade networks.
- Merelo-Guervós, Juan J. 2024. Detecting pivotal moments using changepoint analysis of noble marriages during the time of the republic of venice. Histories 4(2), 234–255. [CrossRef]
- Nicholas A. James and David S. Matteson. 2014. ecp: An R package for nonparametric multiple change point analysis of multivariate data. Journal of Statistical Software 62(7), 1–25.
- Oddo, Luigi, Silvio Traverso, and Koenraad Verboven. 2024. Economic dynamics of the early roman empire: Insights from lead pollution, coinage, weather, and war. Coinage, Weather, and War (July 20, 2024).
- Pettitt, Anthony N. 1979. A non-parametric approach to the change-point problem. Journal of the Royal Statistical Society: Series C (Applied Statistics) 28(2), 126–135.
- Pirenne, Henri. 2013. Mohammed and Charlemagne. Routledge. [CrossRef]
- Pirenne, Henri. 2015. Mohammed and Charlemagne. London: George Allen and Unwin Ltd.
- Pohl, Walter and Veronika Wieser. 2022. Emerging Powers in Eurasian Comparison, 200–1100: Shadows of Empire. Leiden, The Netherlands: Brill. [CrossRef]
- Rademacher, Philip. 2024. Data quality and bias in the coin hoards of the Roman Empire database: A logistic regression analysis. Theoretical Roman Archaeology Journal 7(1). [CrossRef]
- Western, Bruce and Meredith Kleykamp. 2017. A Bayesian change point model for historical time series analysis. Political Analysis 12(4), 354–374. [CrossRef]
- Wickham, Christopher. 2005. Framing the Early Middle Ages: Europe and the Mediterranean. Oxford University Press, USA.
- Wood, Ian N. 2022. Chapter 1 When Did the West Roman Empire Fall?, pp. 55 – 77. Leiden, The Netherlands: Brill. [CrossRef]
- Yılmazata, Mehmet. 2018. Notes on the res gestae and historiographical views towards the battle of Adrianople (378 AD). Journal of Ancient History and Archaeology 5(3), 24–34. [CrossRef]
| 1 | There are no hoards found in Andorra or in the UK colony of Gibraltar. |
| 2 | Please note that we are showing only connections from Spain and Portugal to other places, thus the network is centered in Spain with a secondary center in Portugal; it should be understood only for visualization and not for network analysis, since all connections between nodes that are not Spain and Portugal have been dropped. |
| 3 | By itself, this result would open an interesting avenue to explore, but will use it here only for the purpose of validating our dataset. |
| 4 | This was the default in one of the versions of the package we used but was changed when we upgraded; adding this (currently) non-default value helped reproducibility across package versions, if sacrificing a bit usability for non-technical users. |
| 5 | It finds anothe in the second decade of the sequence, which we have dismissed as not significative. |
Figure 1.
Time series of interior and exterior trade links for the Iberian Peninsula.
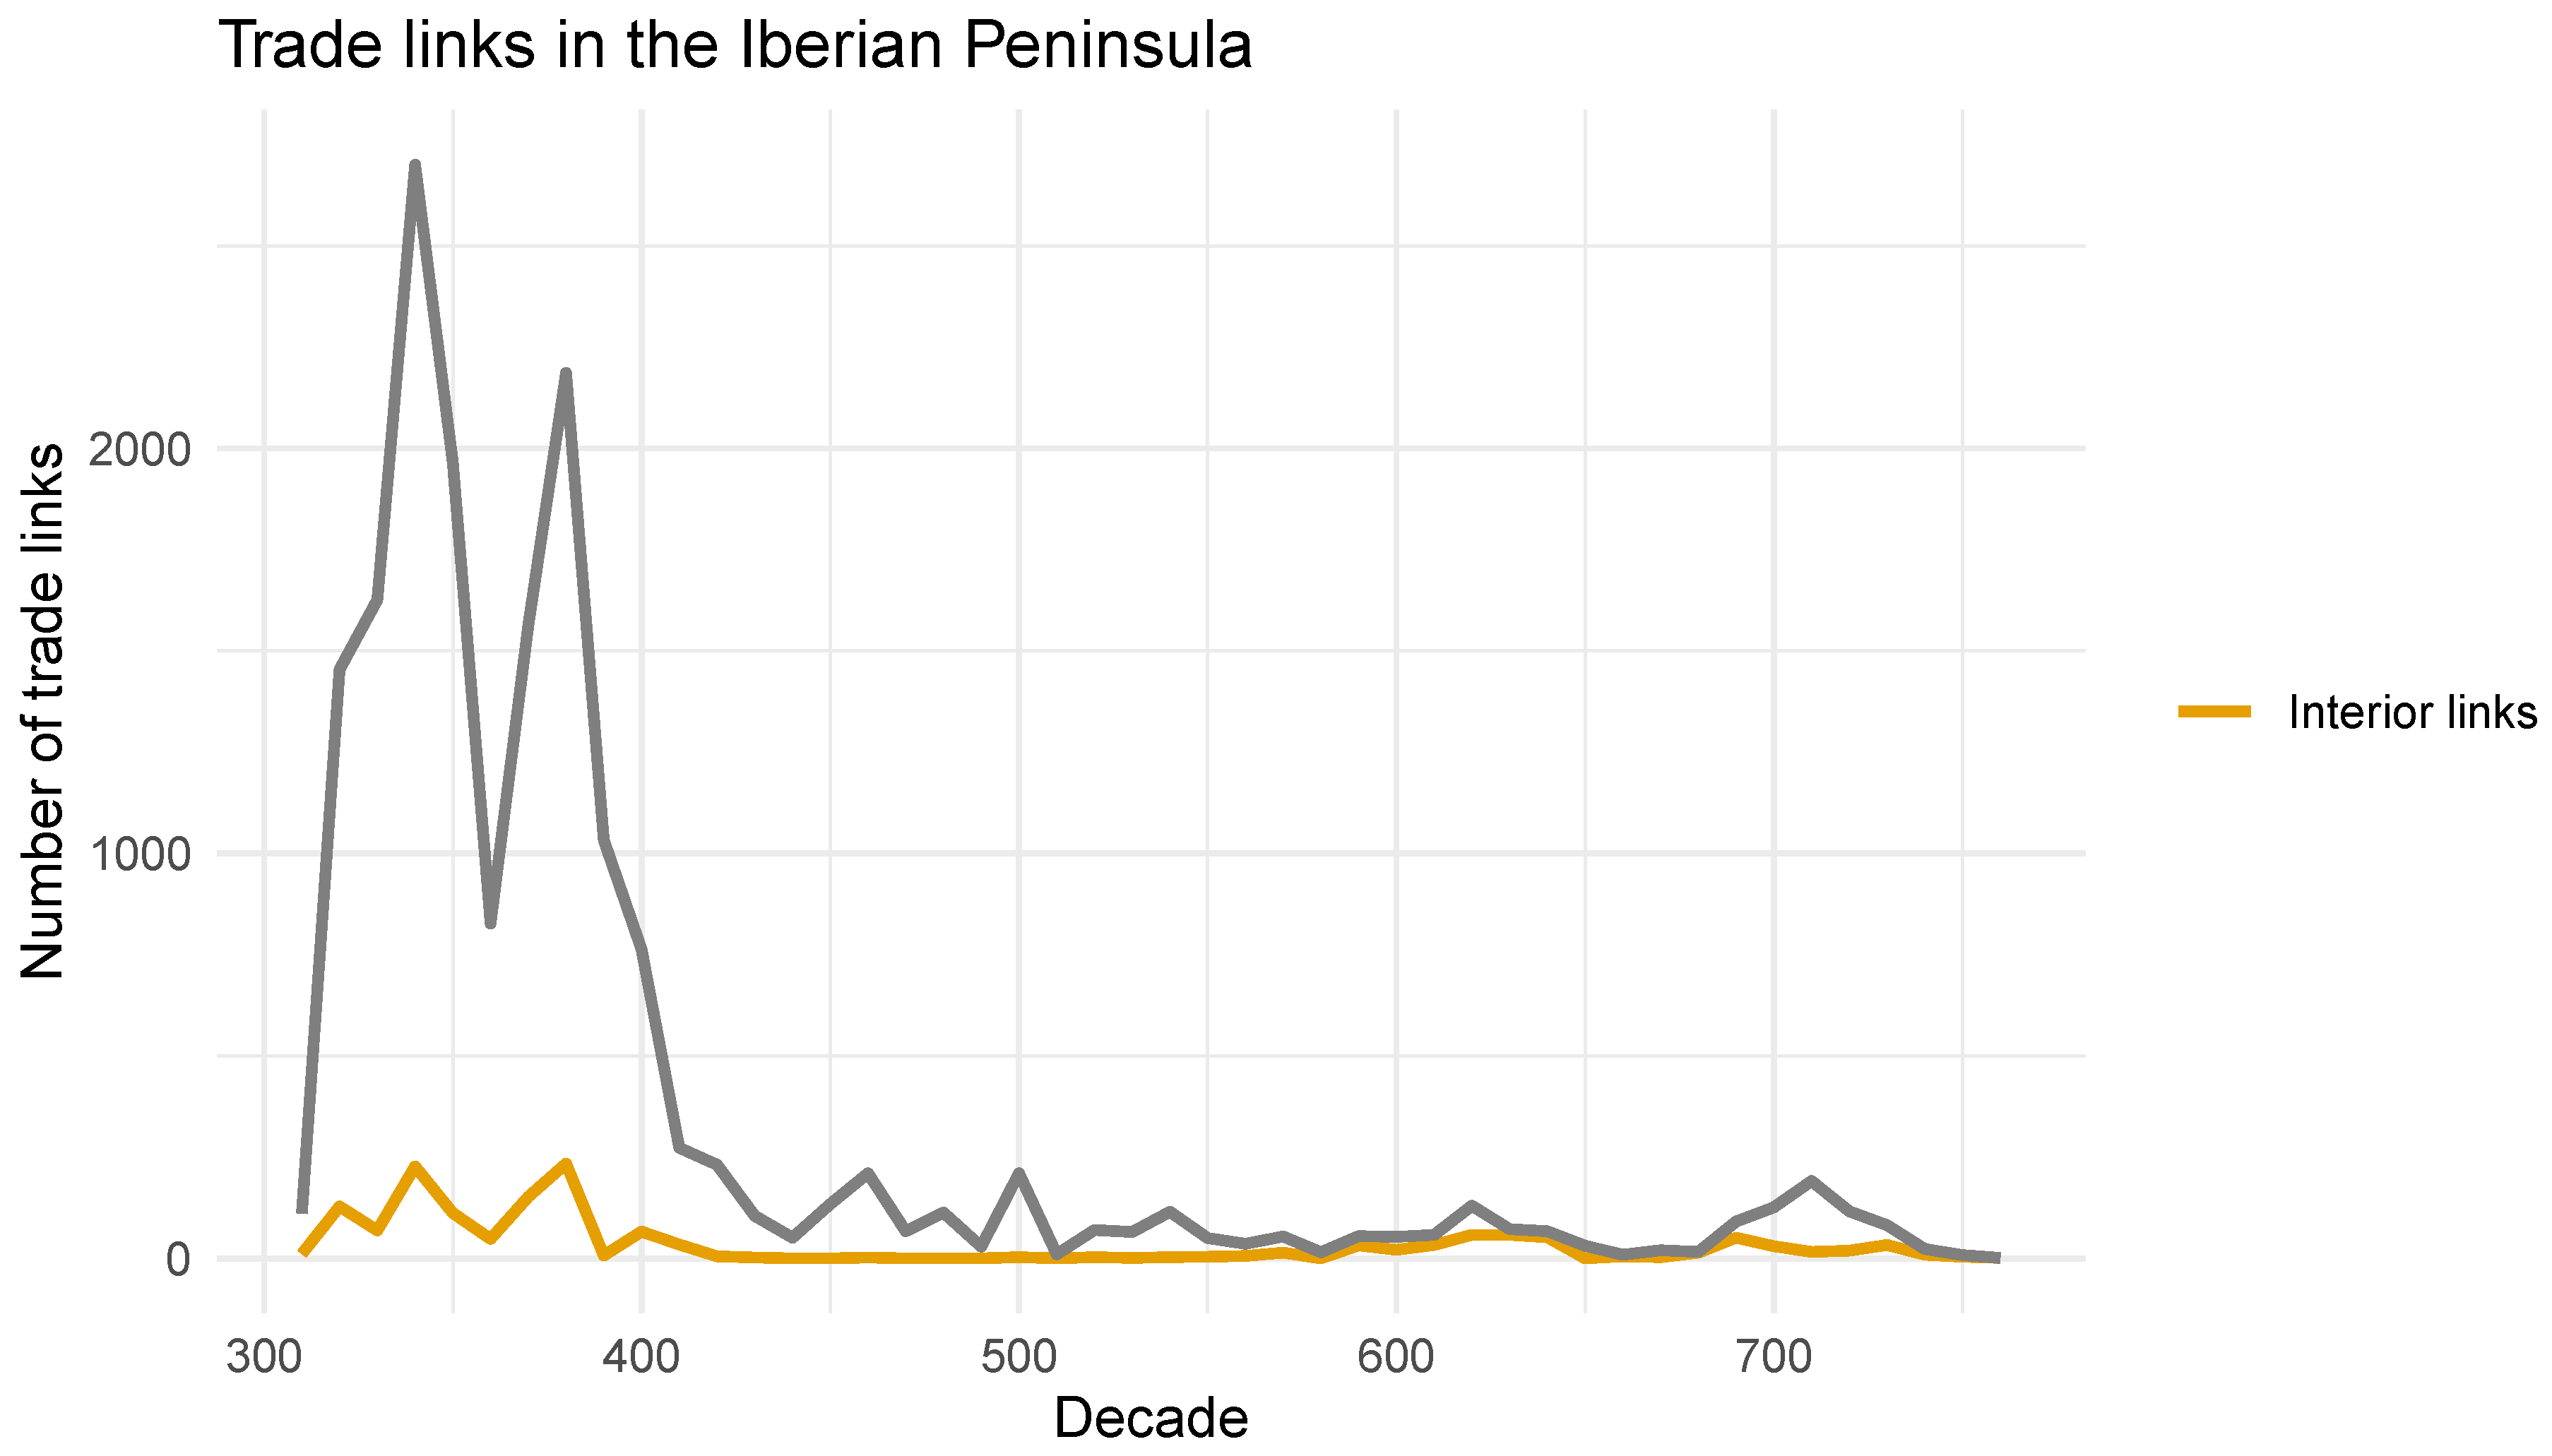
Figure 2.
Graph plot of the regional network using (current) regions as nodes. Edge size is proportional to weight, that is, number of links.
Figure 2.
Graph plot of the regional network using (current) regions as nodes. Edge size is proportional to weight, that is, number of links.
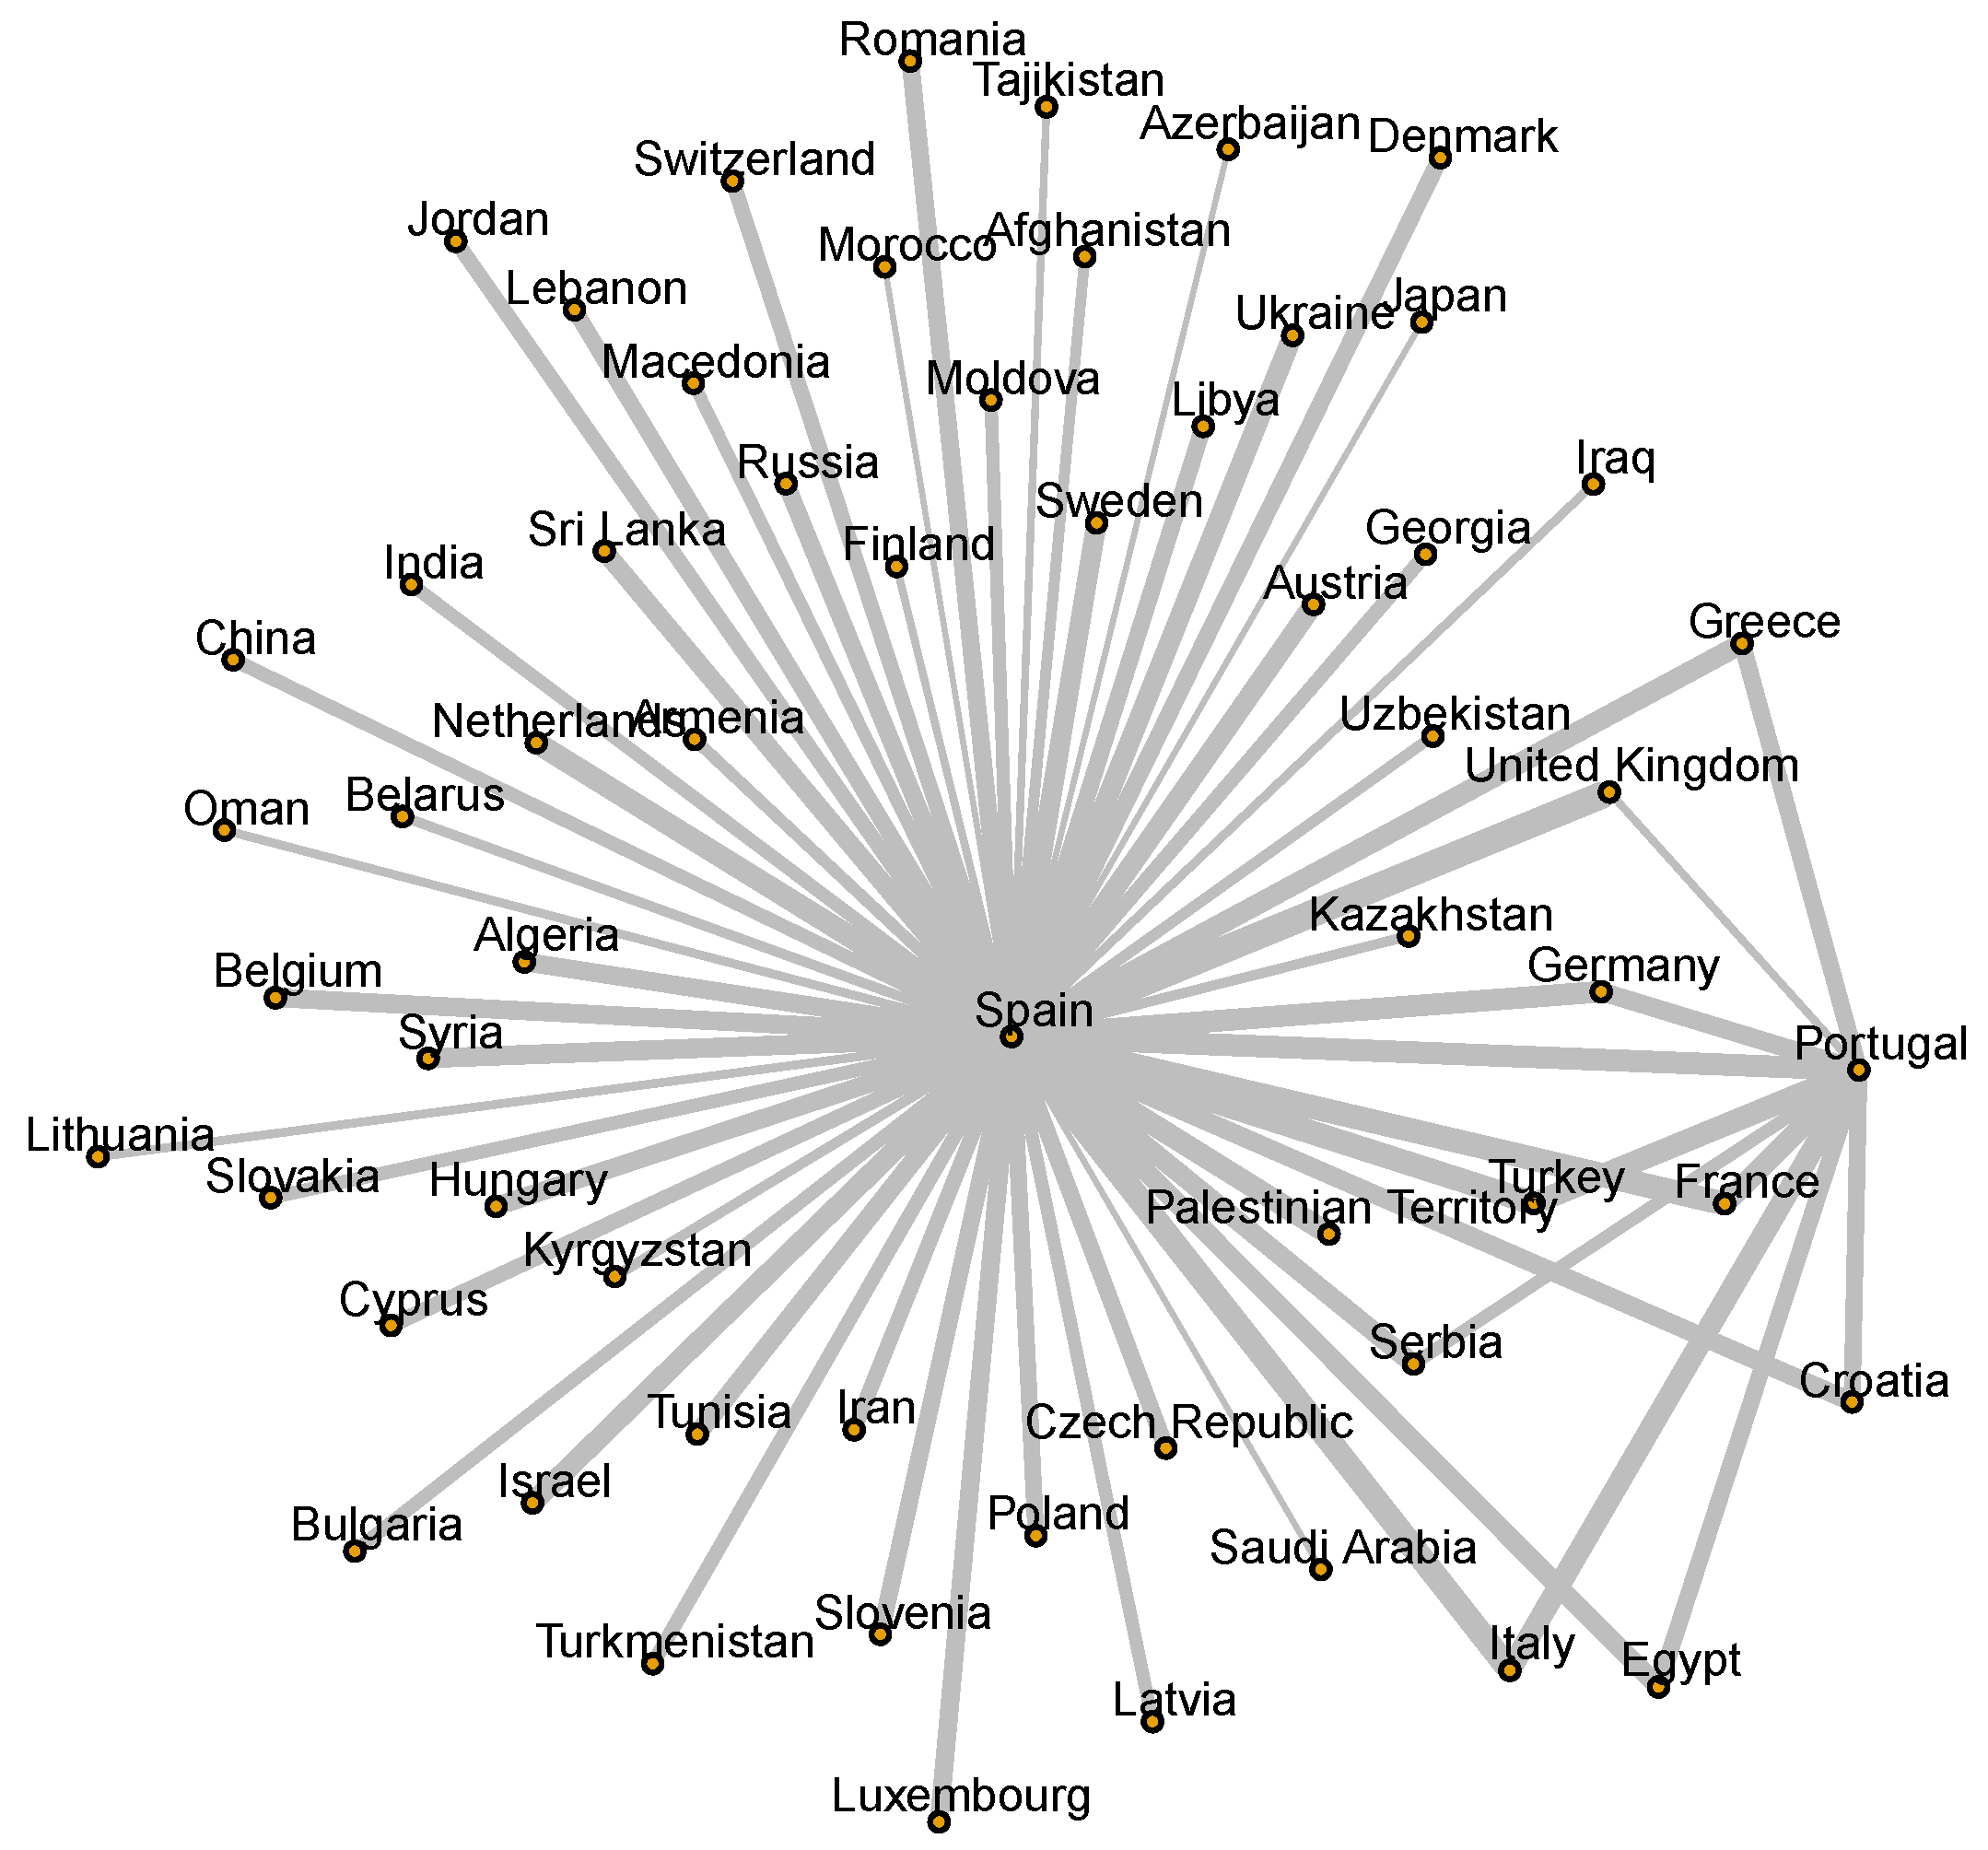
Figure 3.
Cross-correlation between per-decade trade links and lead pollution.
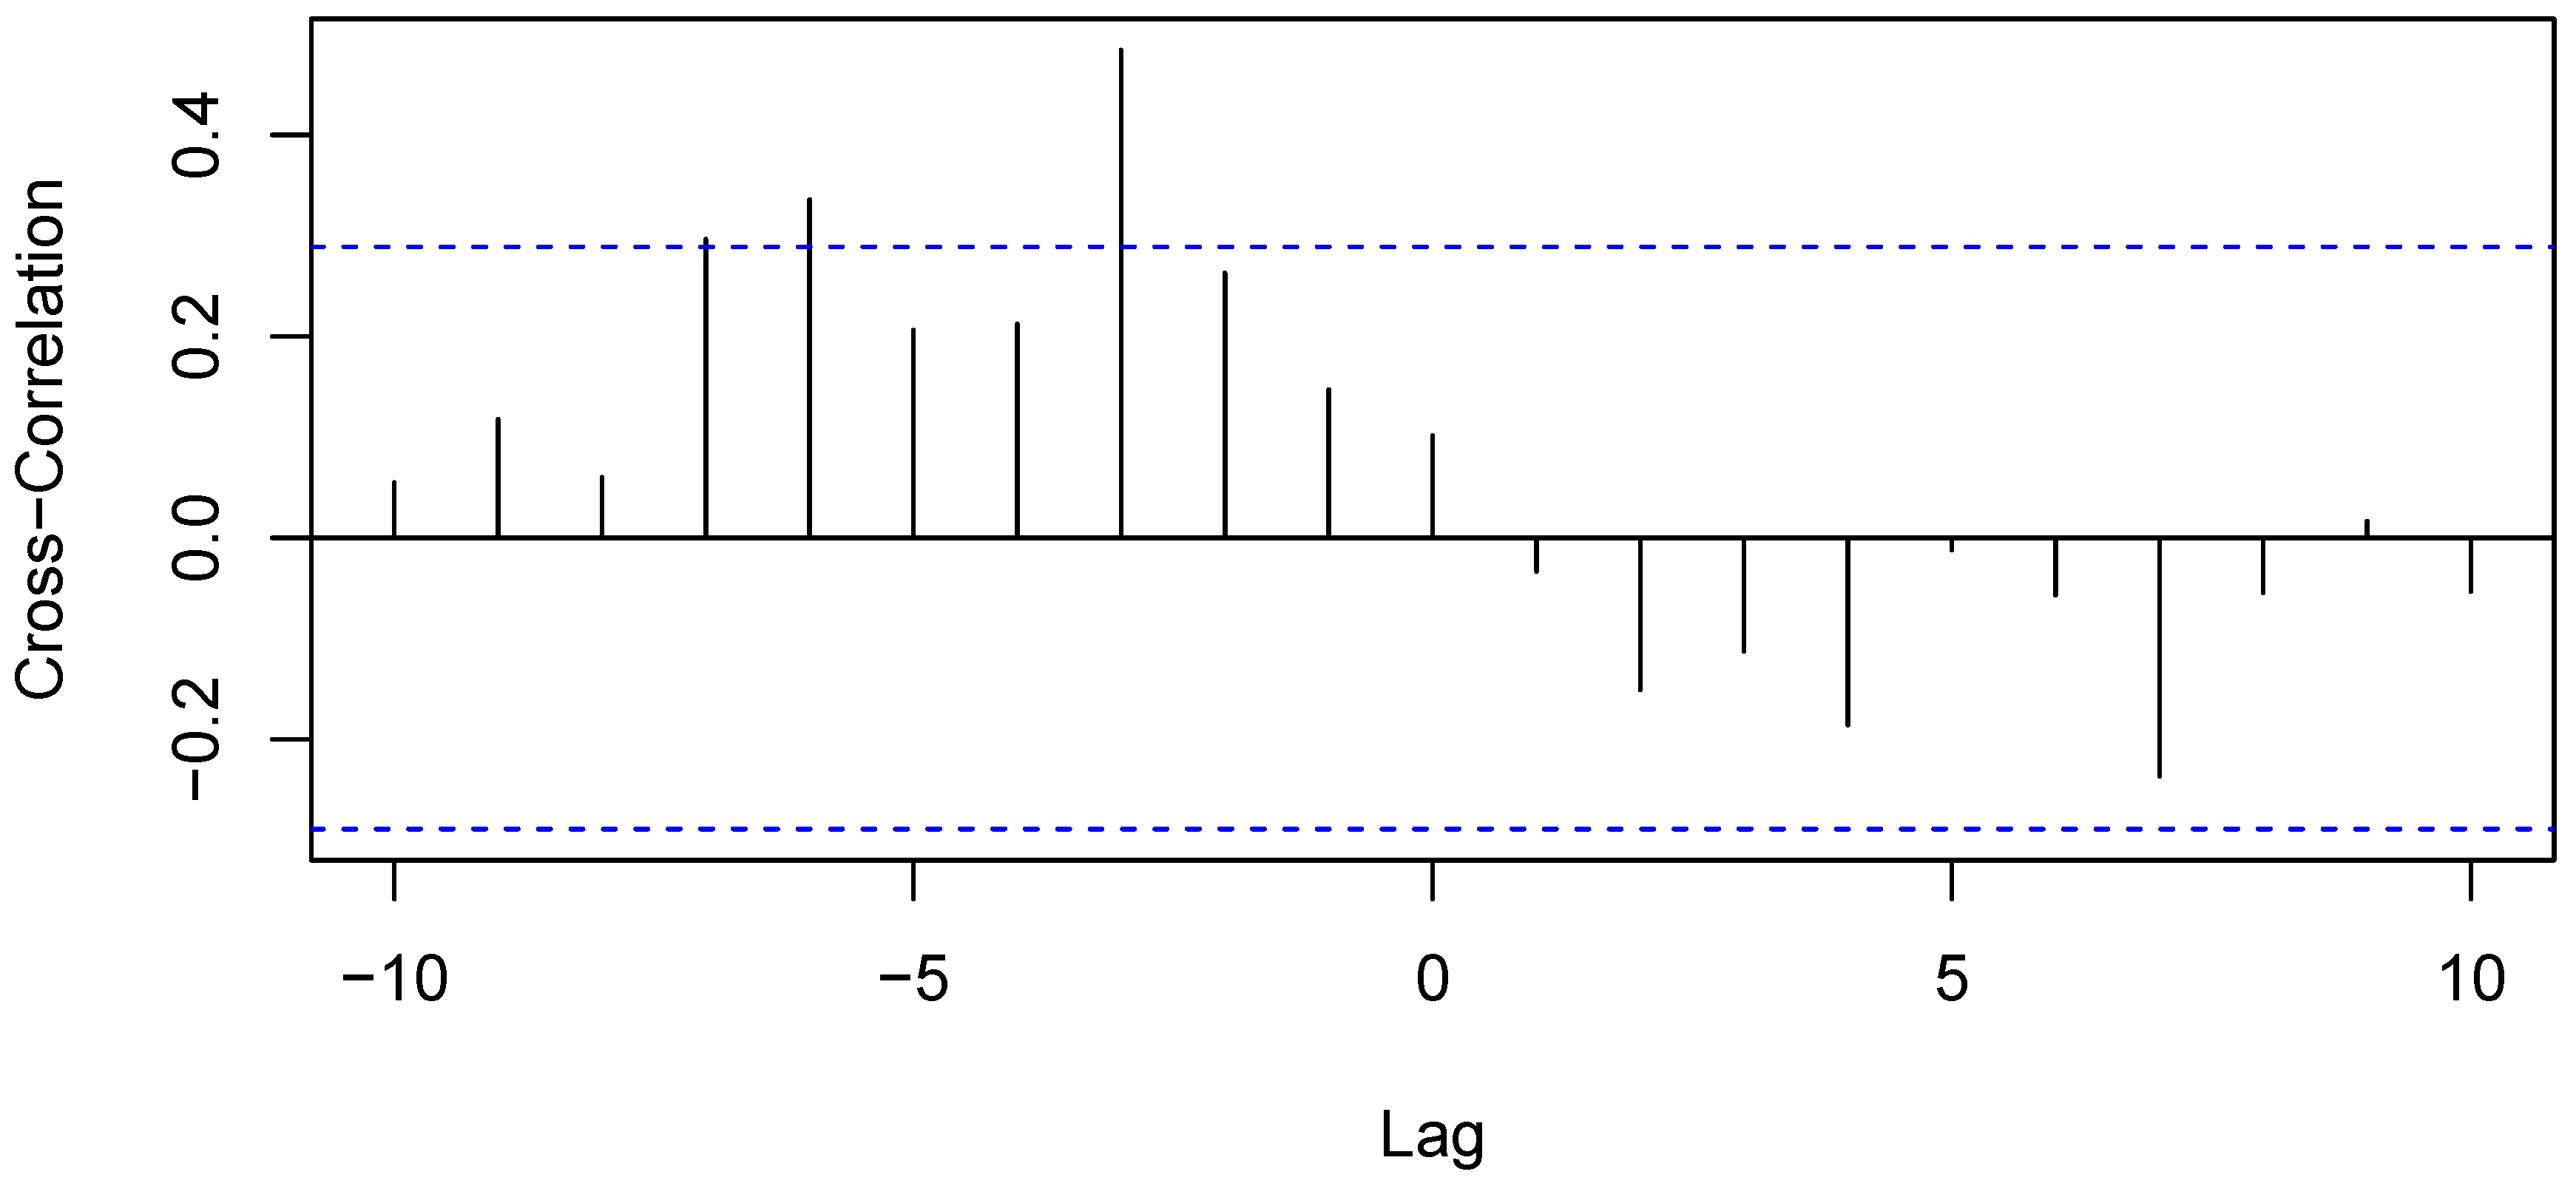
Figure 4.
Changepoint in the Iberian trade links time series, with mean before and after the changepoint in red.
Figure 4.
Changepoint in the Iberian trade links time series, with mean before and after the changepoint in red.
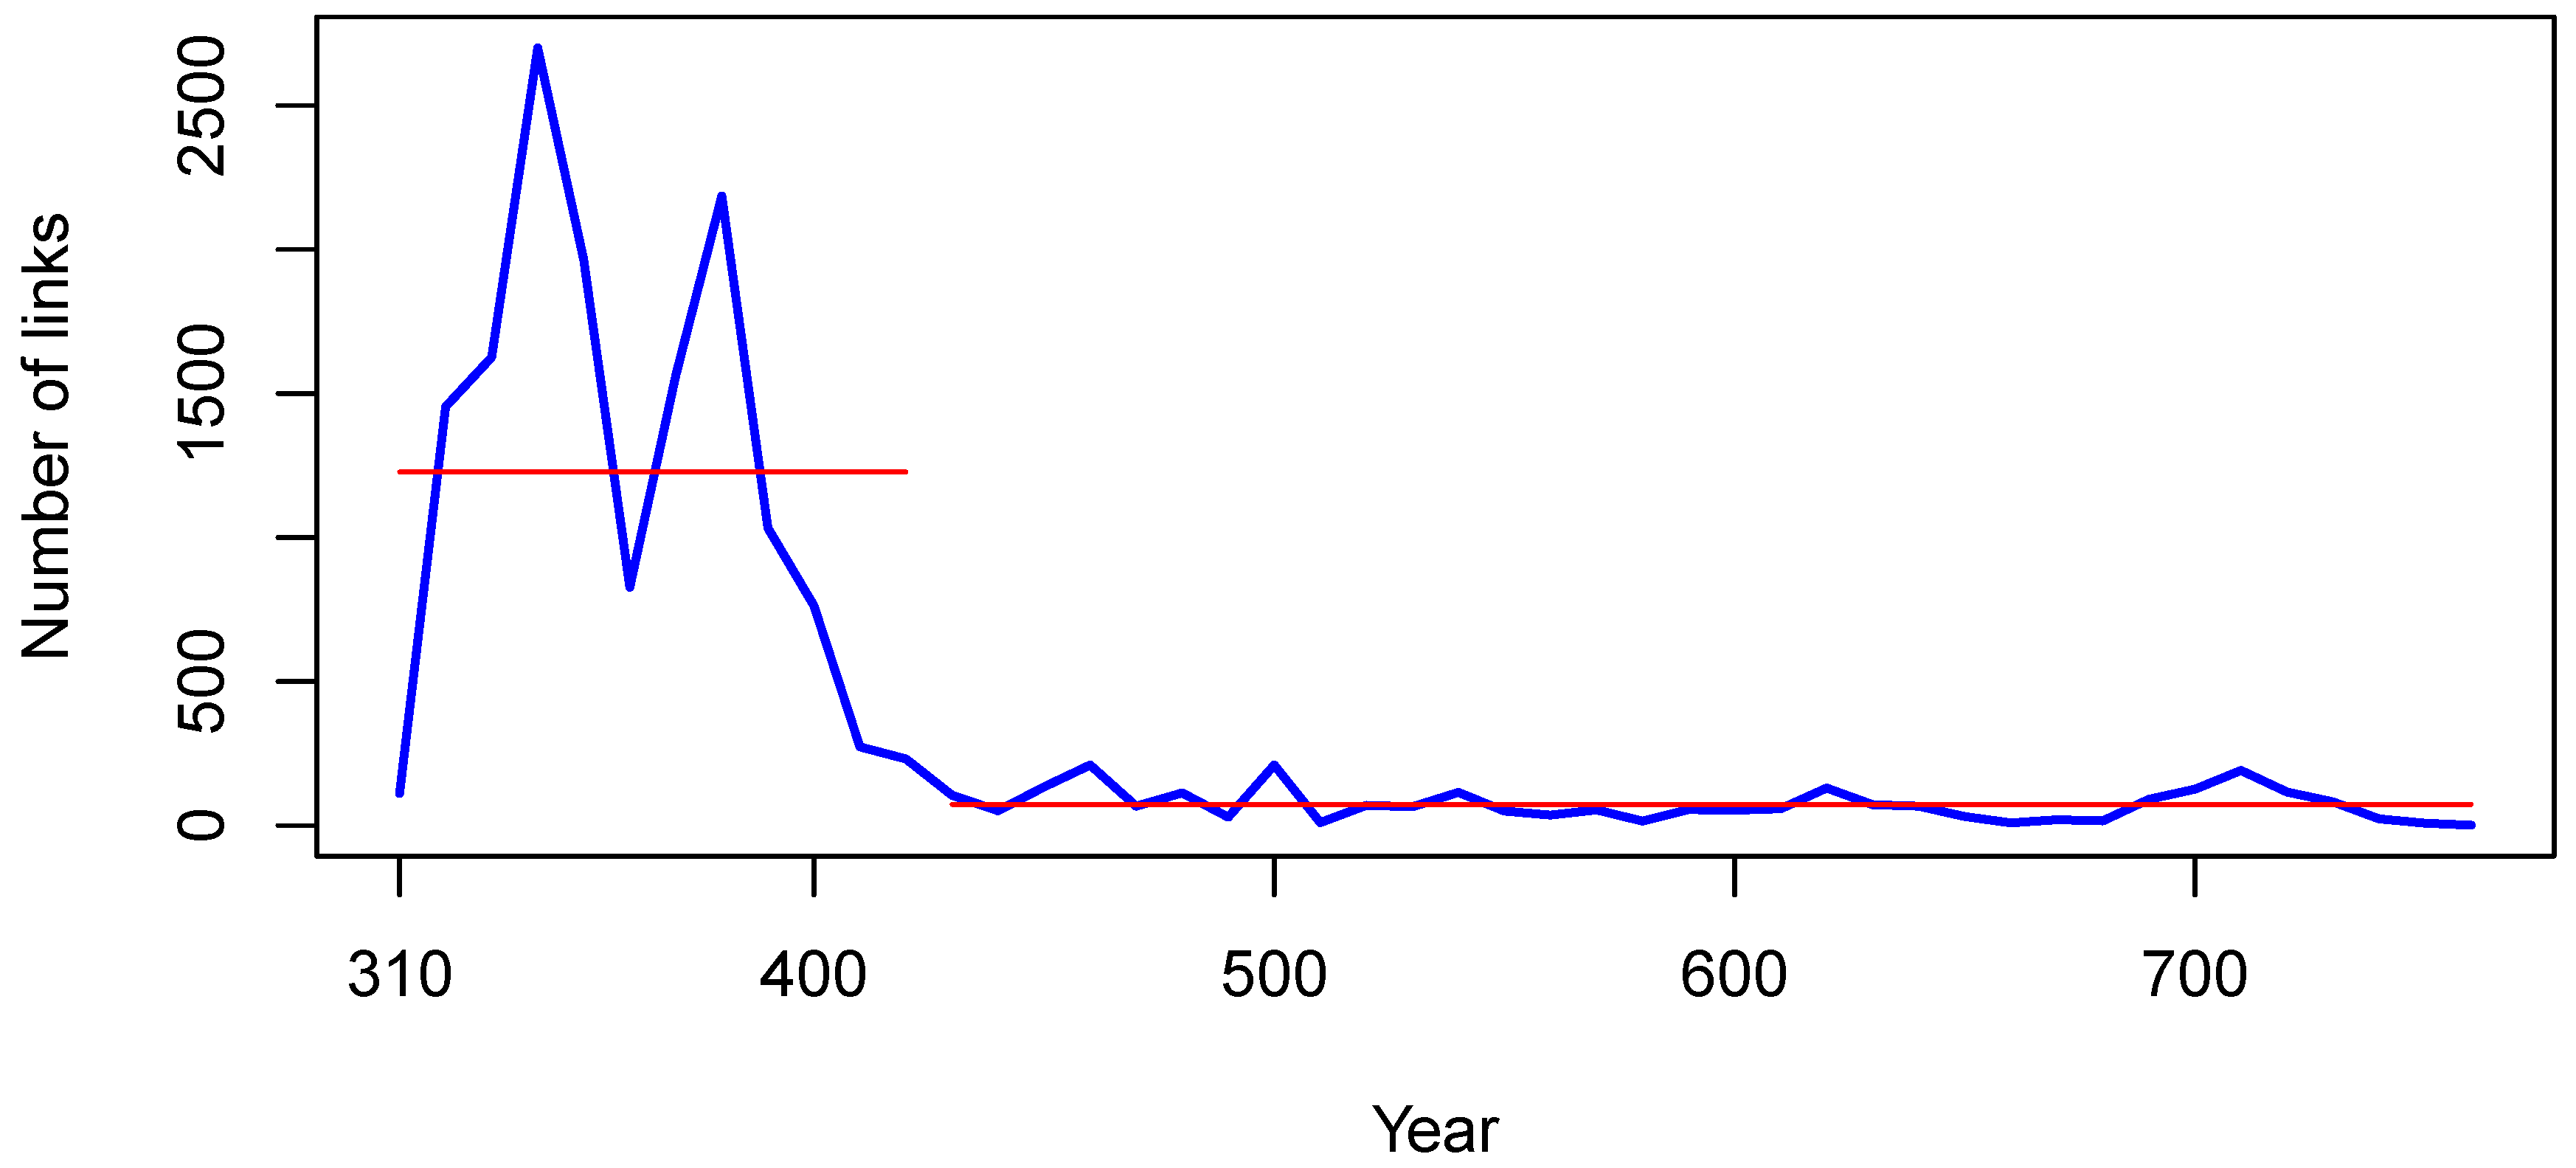
Figure 5.
Changepoint in the internal Iberian trade links time series, with mean before and after the changepoint in red.
Figure 5.
Changepoint in the internal Iberian trade links time series, with mean before and after the changepoint in red.
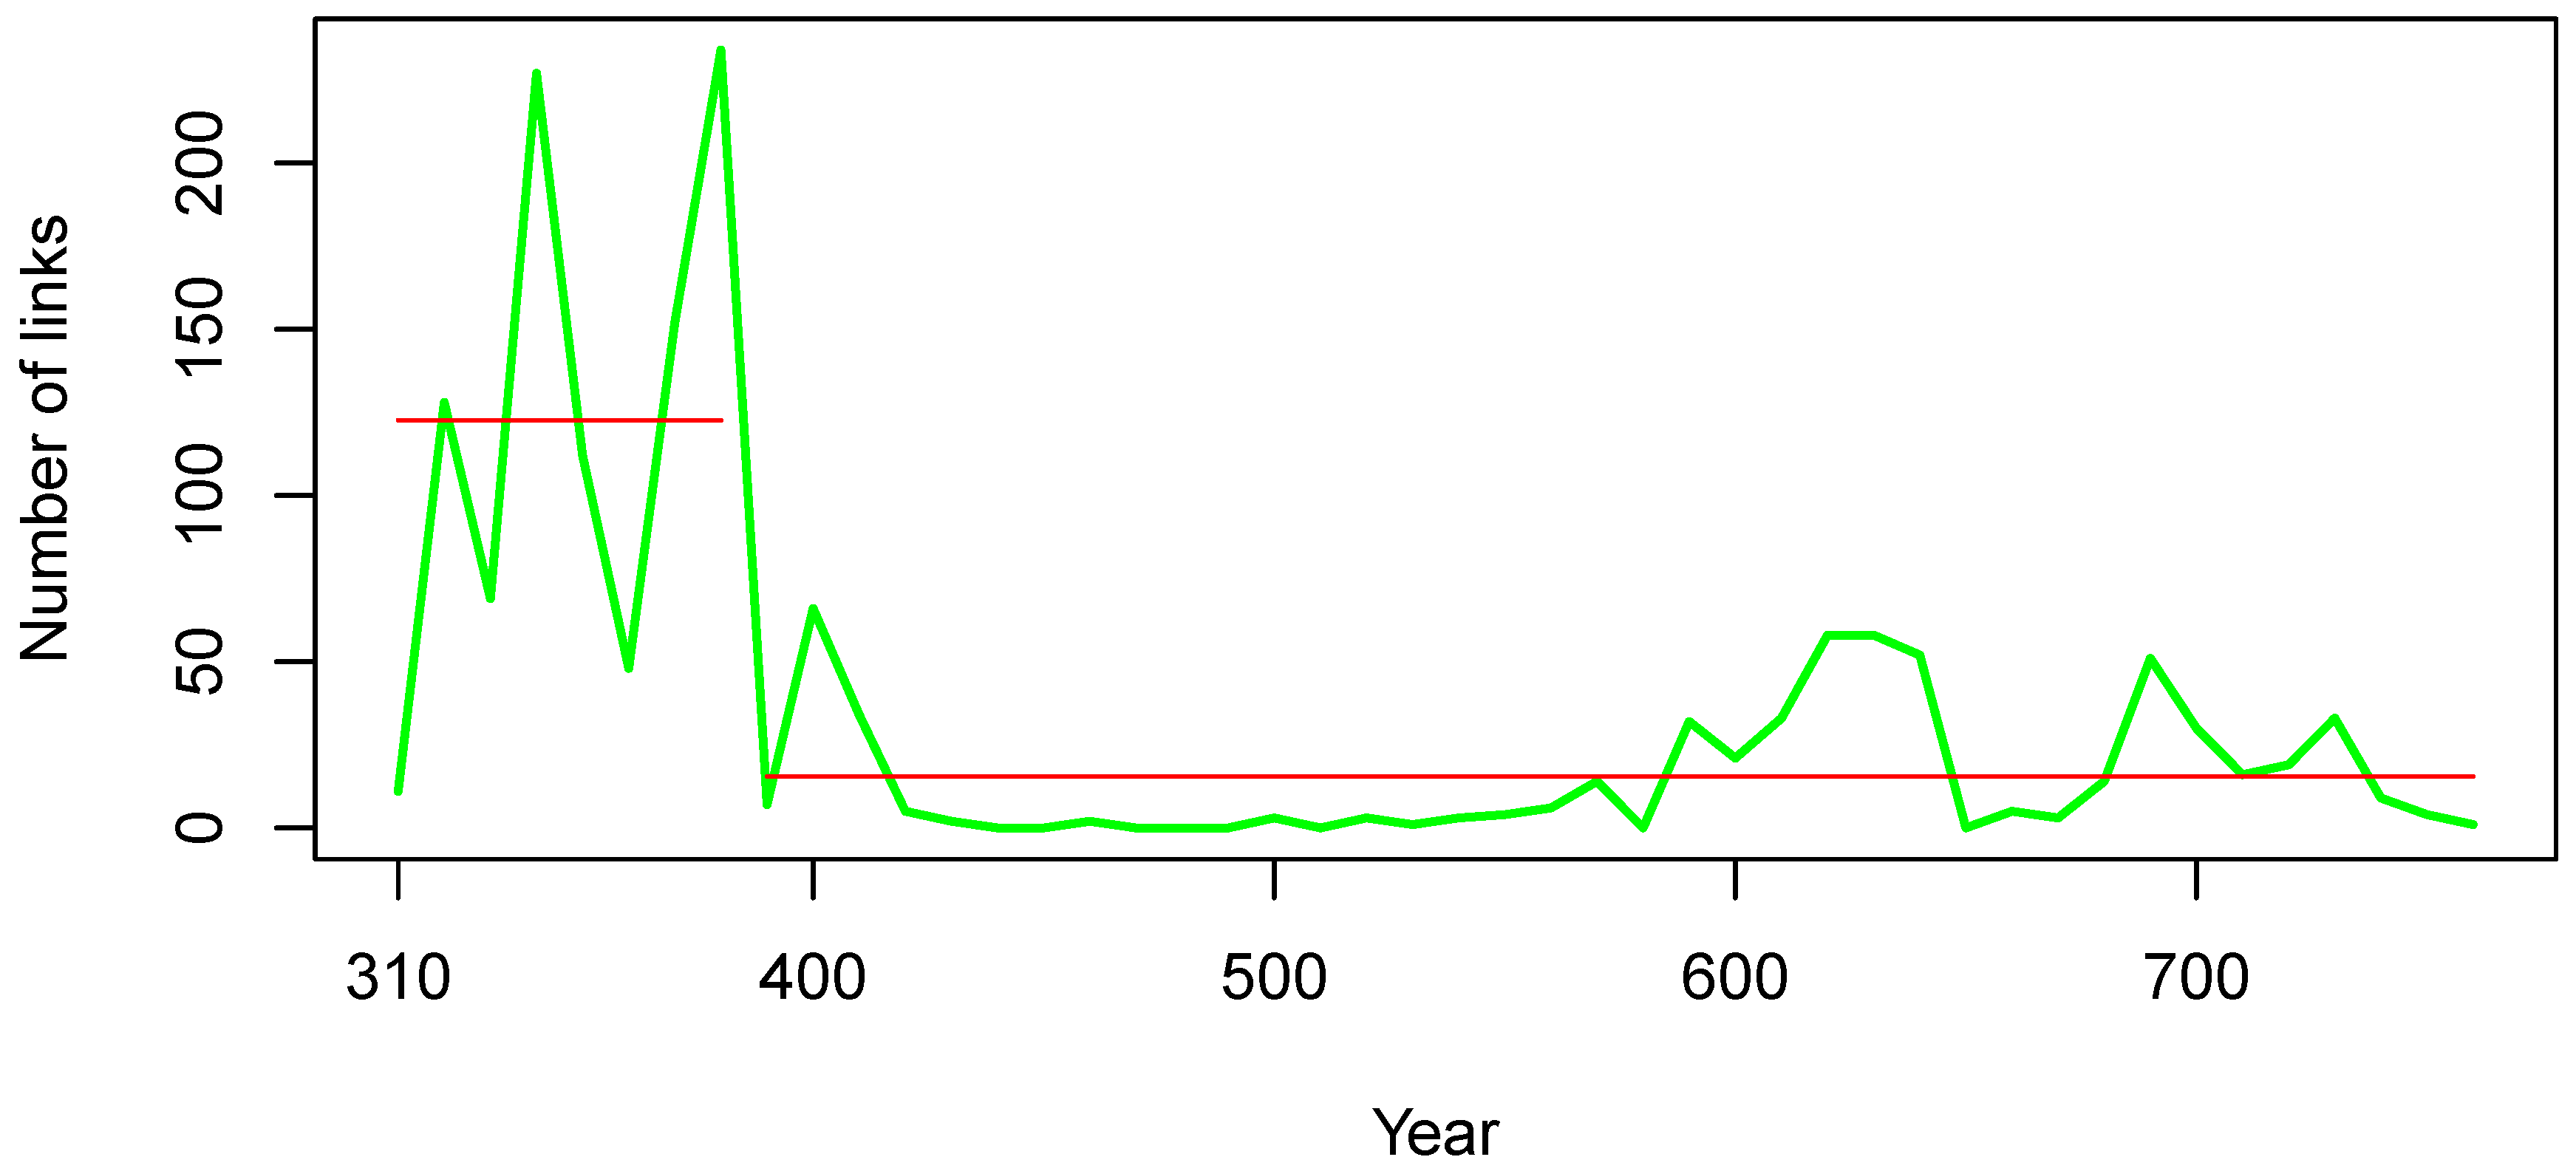
Figure 6.
Multi-changepoint detection using ecp.
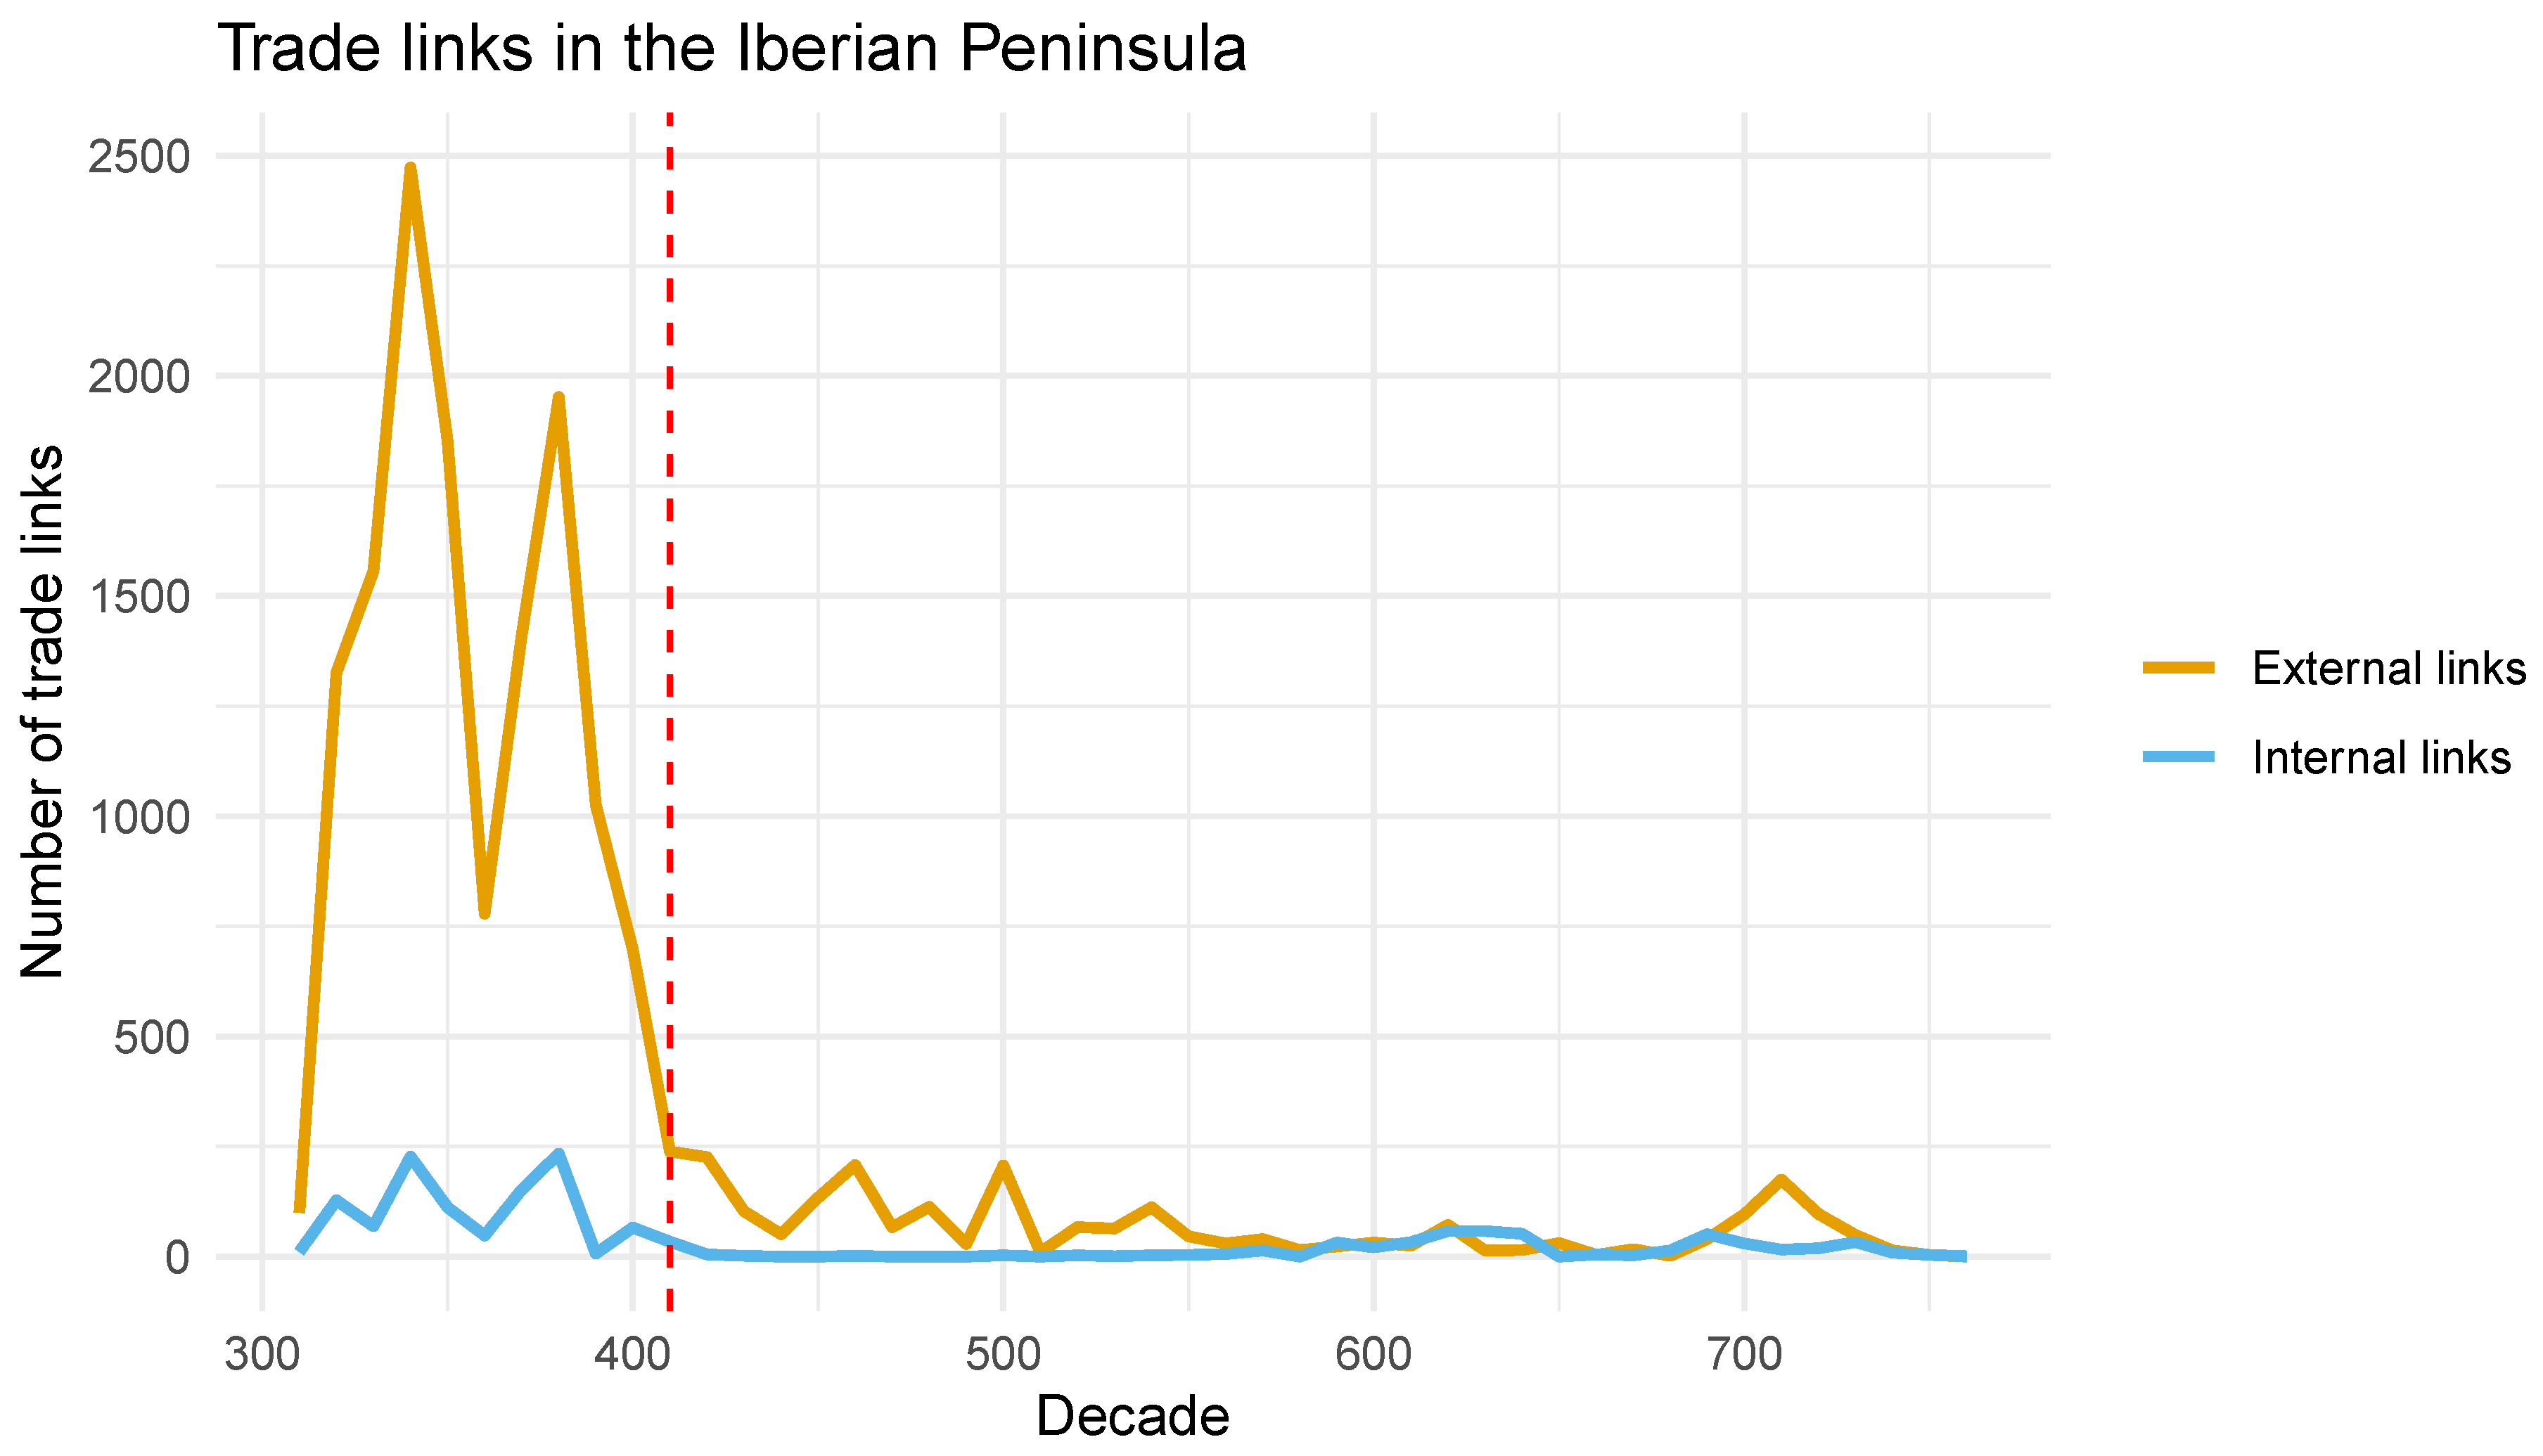
Figure 7.
Evolution through time of the number of links with the main trading partners of the Iberian Peninsula.
Figure 7.
Evolution through time of the number of links with the main trading partners of the Iberian Peninsula.
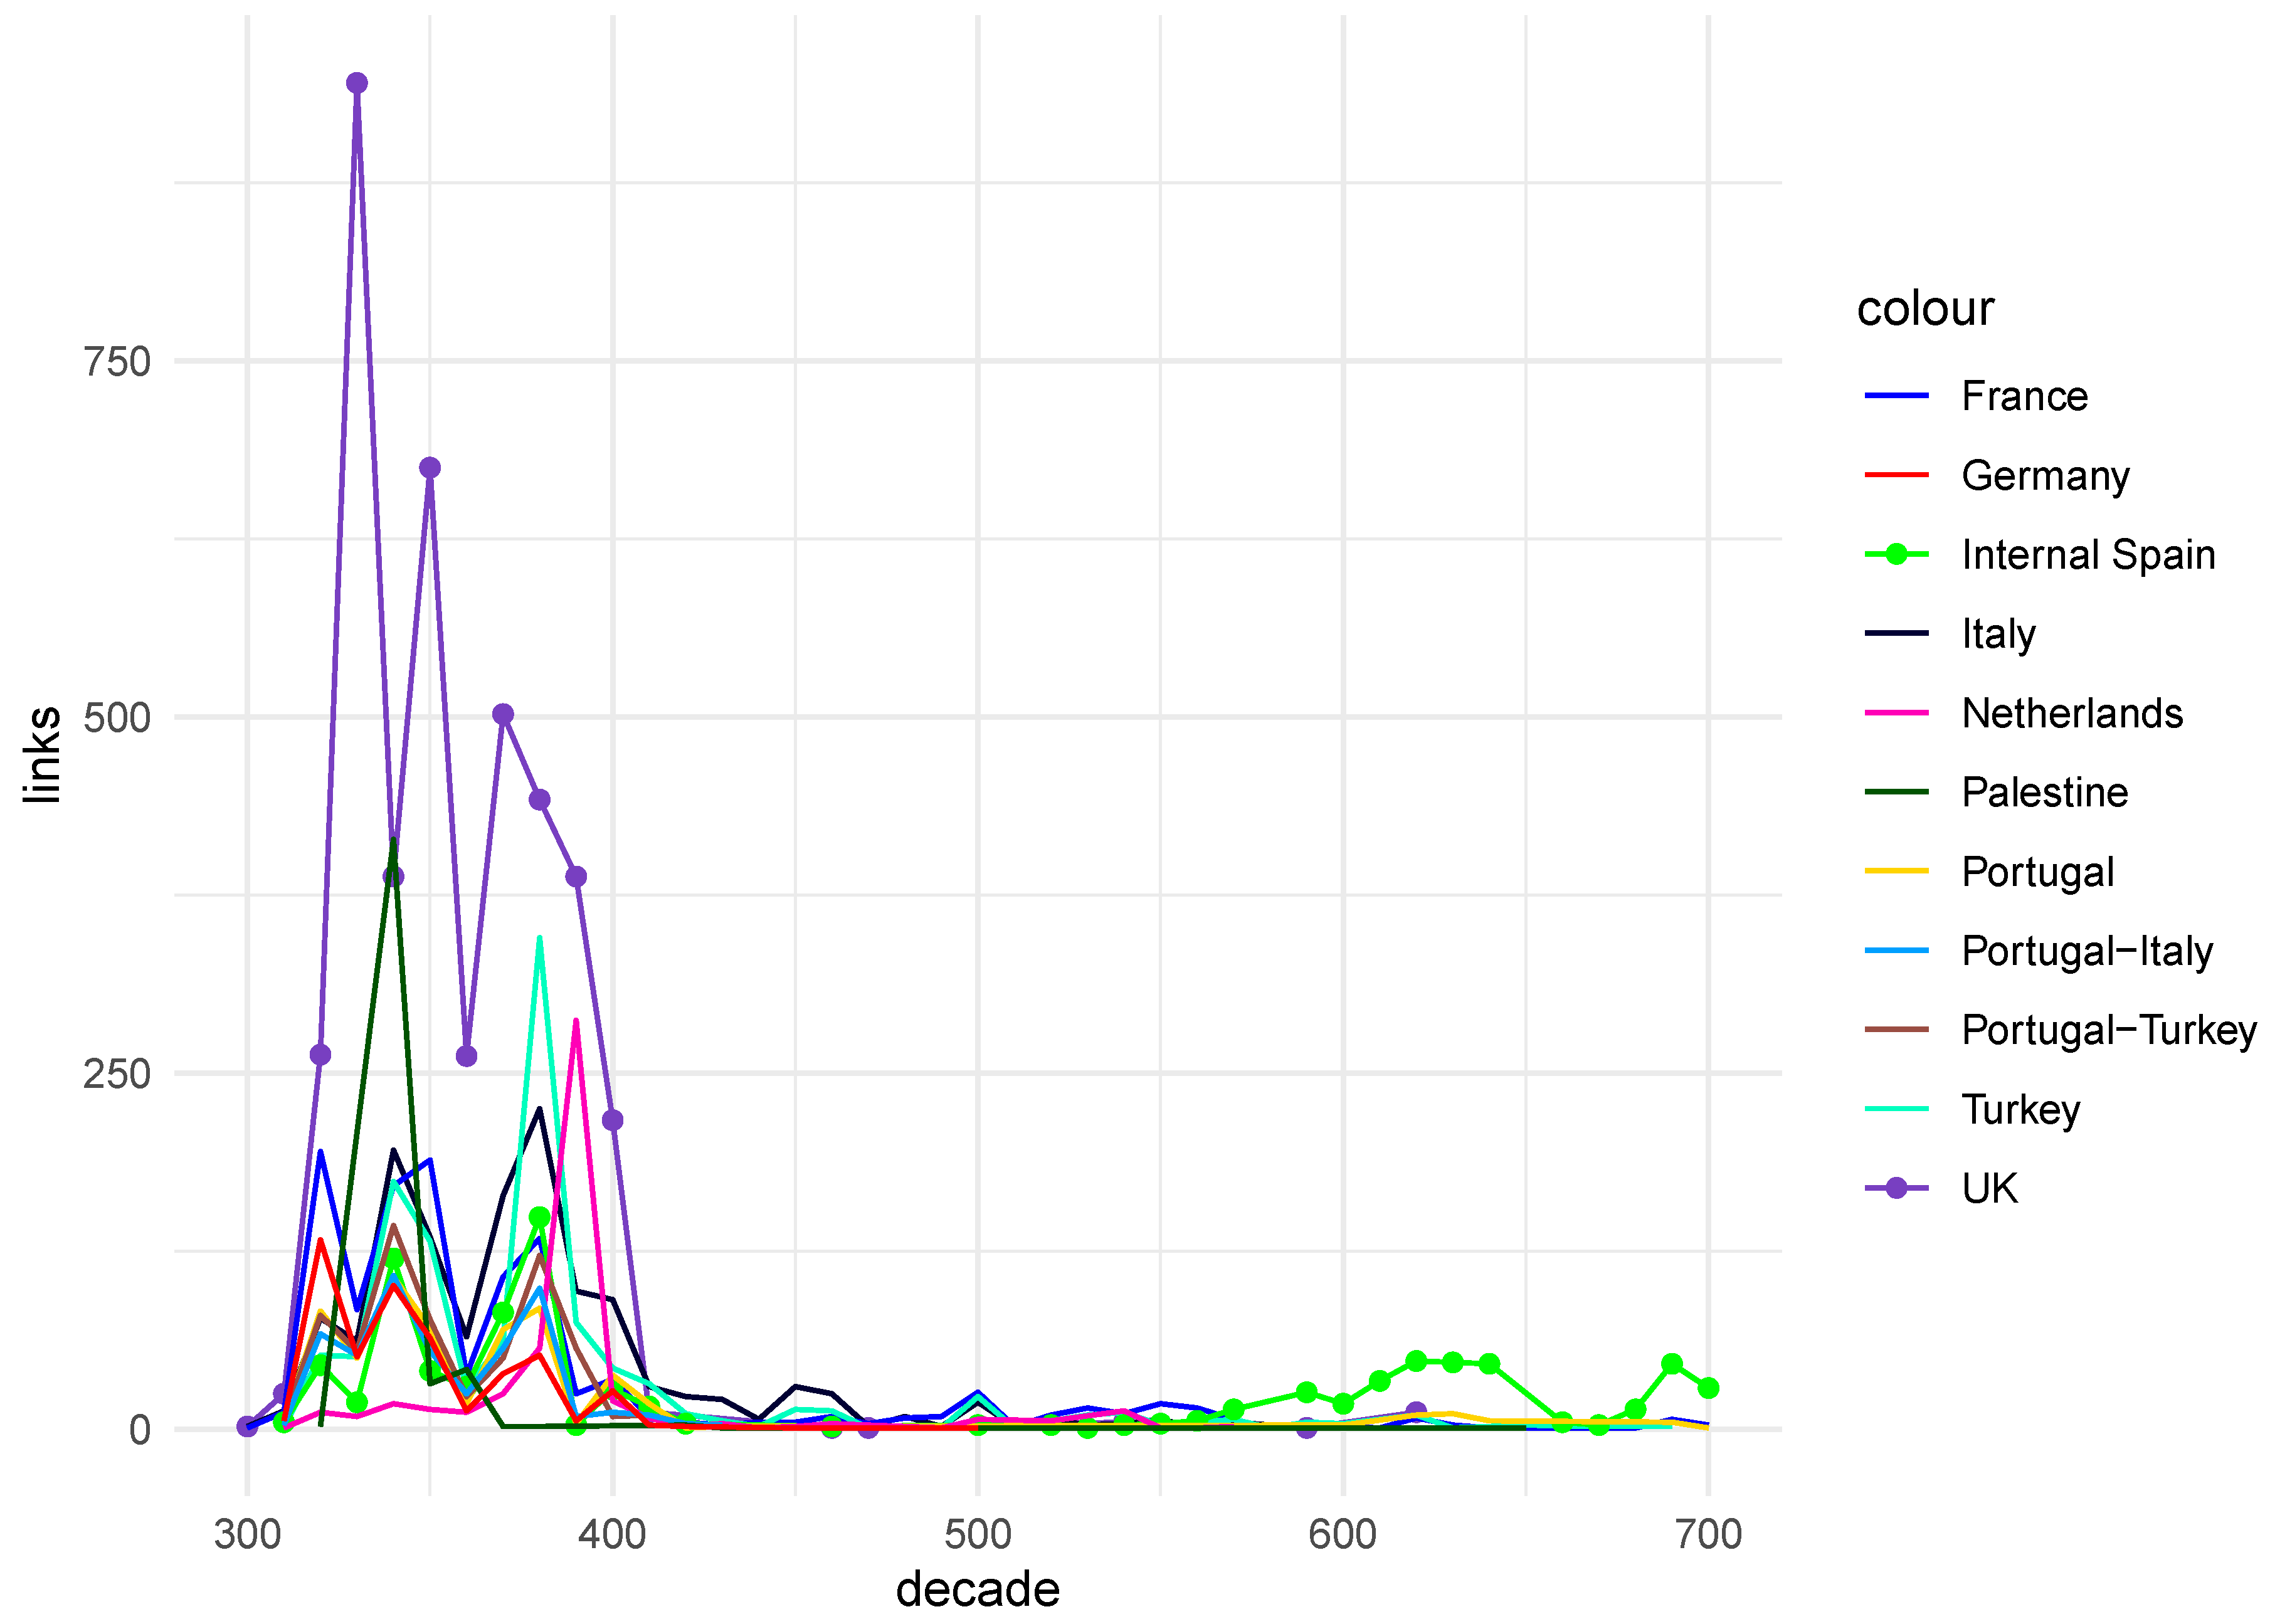
Figure 8.
Evolution through time of the number of links with the main trading partners of the Iberian Peninsula.
Figure 8.
Evolution through time of the number of links with the main trading partners of the Iberian Peninsula.
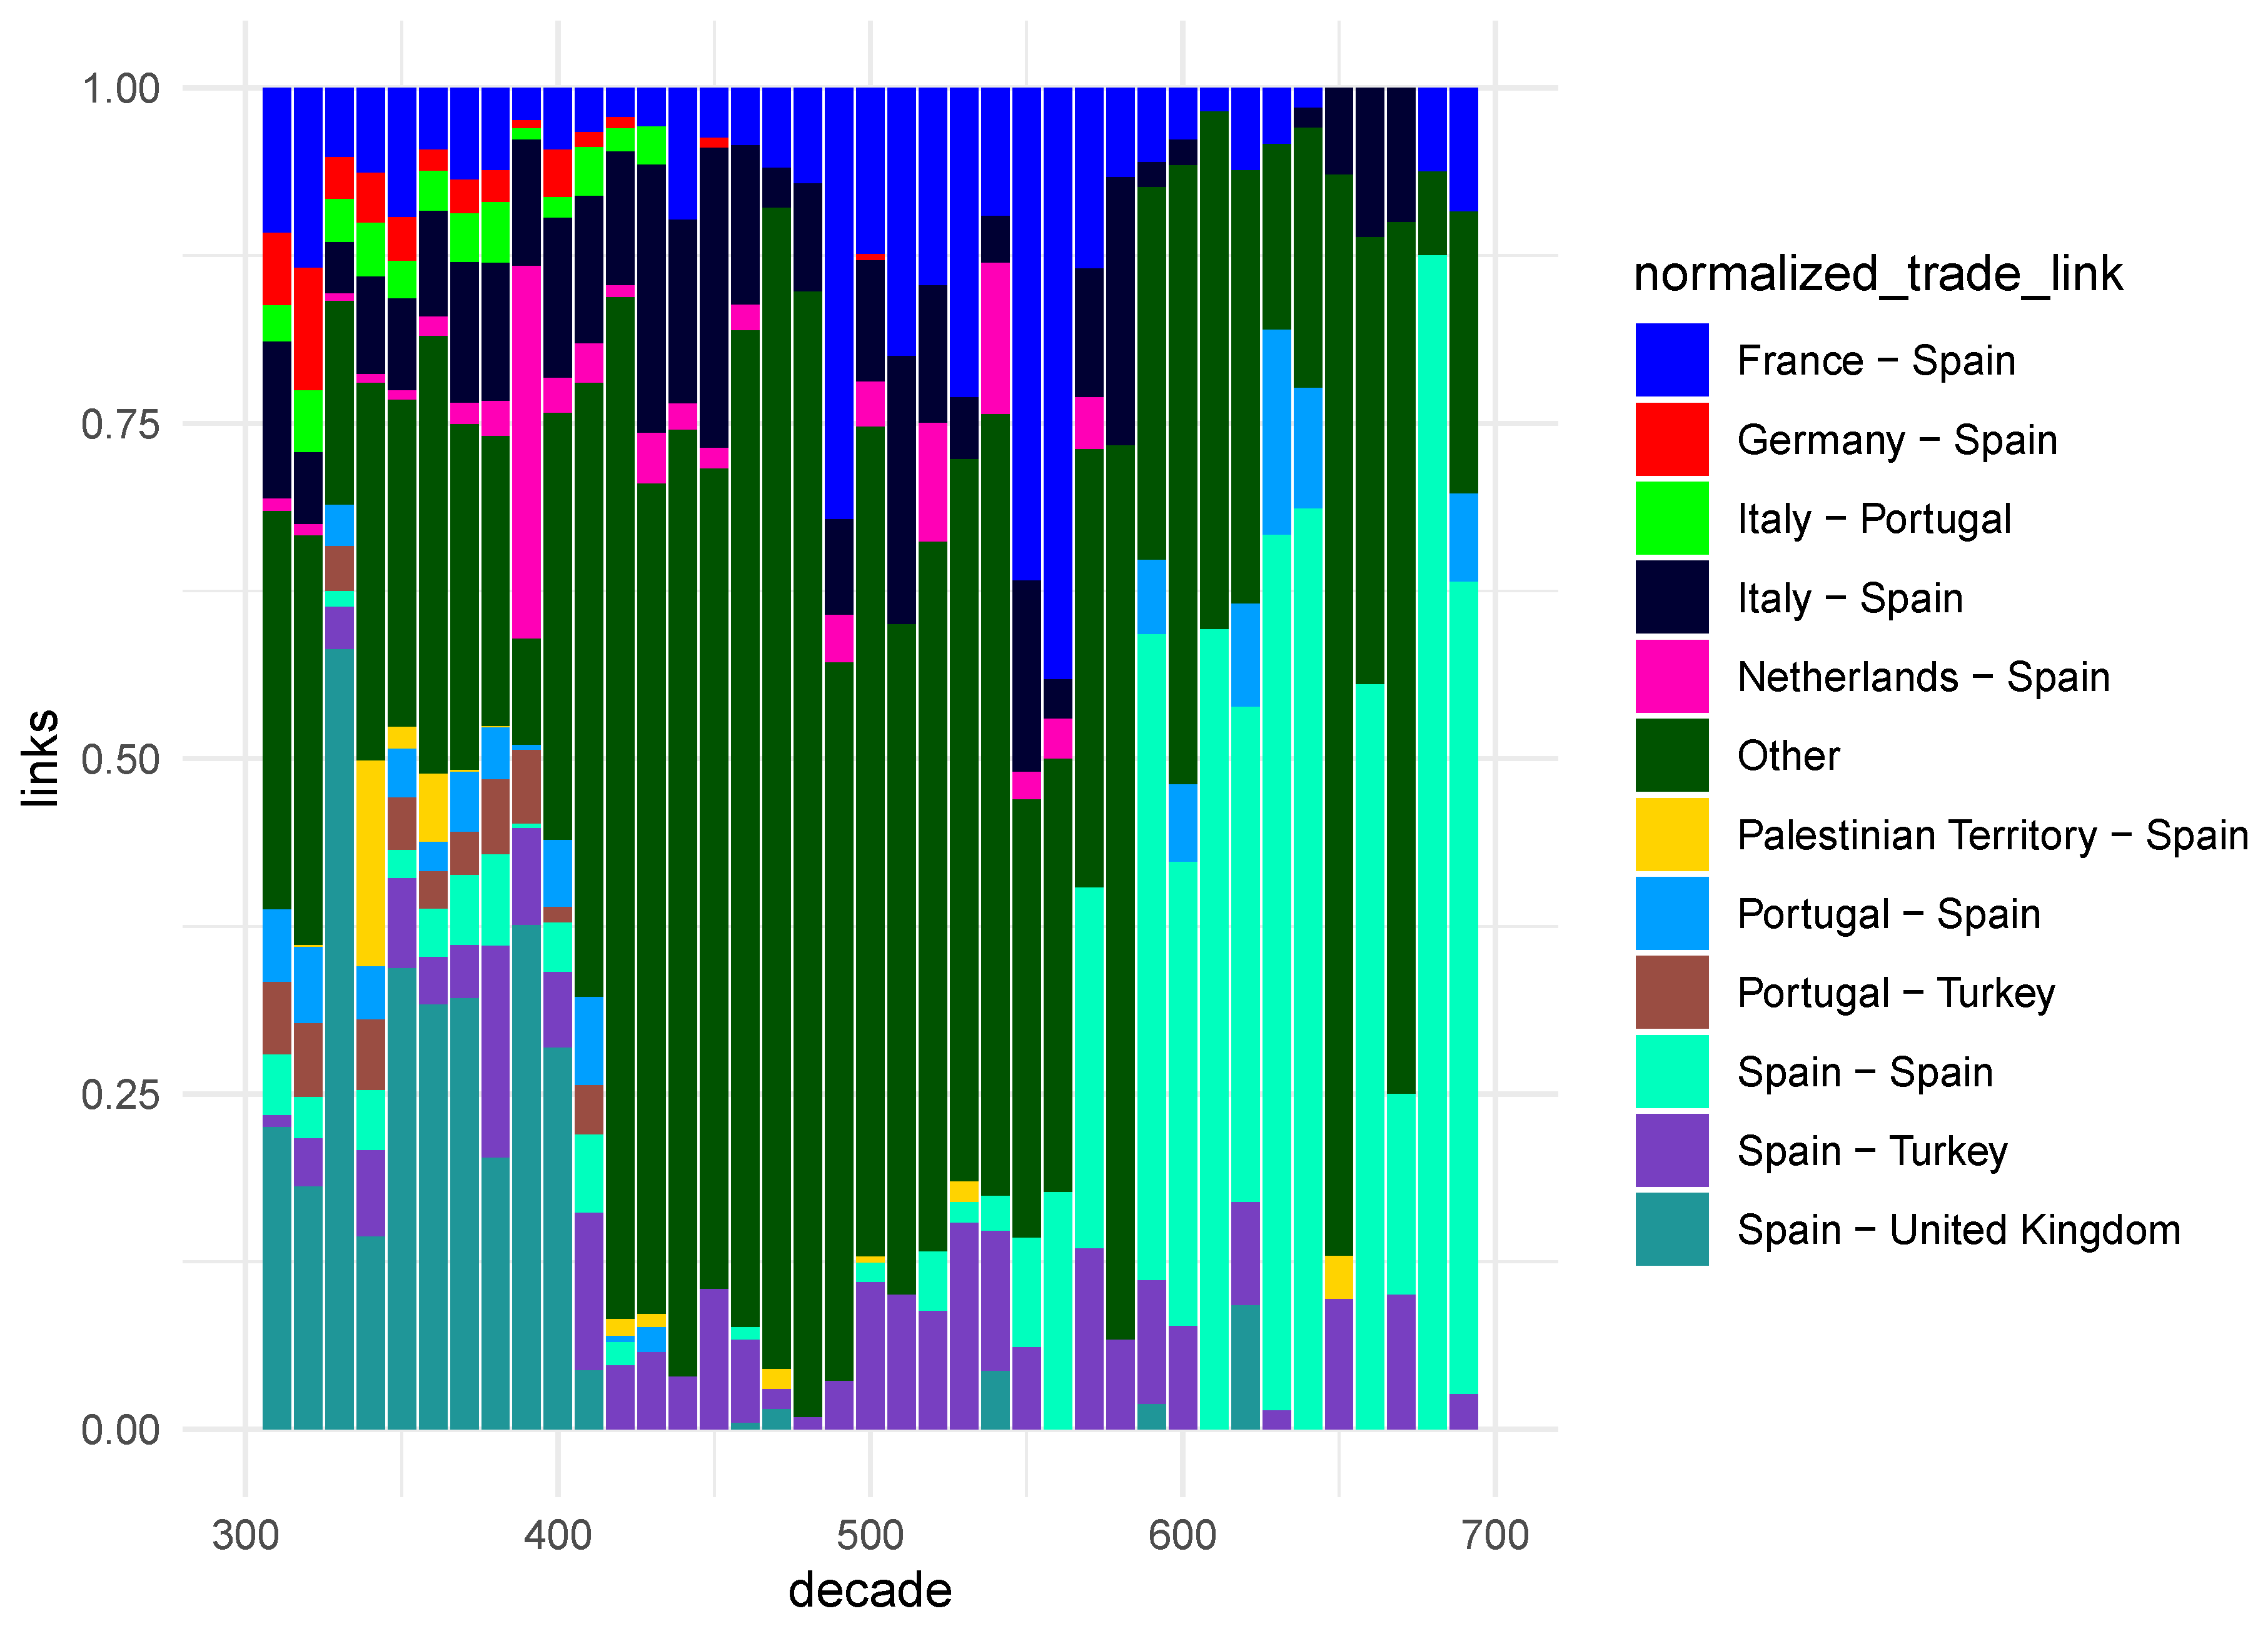
Table 1.
Top edge weights in the regional network.
| Origin | Destination | Weight |
|---|---|---|
| Spain | United Kingdom | 4144 |
| Italy | Spain | 1336 |
| Spain | France | 1185 |
| Spain | Turkey | 1148 |
| Turkey | Portugal | 632 |
| Spain | Portugal | 592 |
| Spain | Netherlands | 507 |
| Italy | Portugal | 504 |
| Spain | Palestinian Territory | 502 |
| Spain | Germany | 499 |
Table 2.
Changepoint detection statistics for the Iberian trade links time series.
| Method | p-value | Changepoint year |
|---|---|---|
| Lanzante | 0.0e+00 | 460 |
| Pettitt | 7.5e-05 | 460 |
| Bu | 0.0e+00 | 400 |
| Br | 0.0e+00 | 400 |
Disclaimer/Publisher’s Note: The statements, opinions and data contained in all publications are solely those of the individual author(s) and contributor(s) and not of MDPI and/or the editor(s). MDPI and/or the editor(s) disclaim responsibility for any injury to people or property resulting from any ideas, methods, instructions or products referred to in the content. |
© 2025 by the authors. Licensee MDPI, Basel, Switzerland. This article is an open access article distributed under the terms and conditions of the Creative Commons Attribution (CC BY) license (http://creativecommons.org/licenses/by/4.0/).
Copyright: This open access article is published under a Creative Commons CC BY 4.0 license, which permit the free download, distribution, and reuse, provided that the author and preprint are cited in any reuse.


