Submitted:
26 July 2025
Posted:
29 July 2025
You are already at the latest version
Abstract
The rapid growth of industries, urban areas, and the global population has led to significant environmental damage, particularly through waste accumulation. This research project addresses the urgent problem of waste pollution by employing advanced computer vision techniques, specifically focusing on identifying and categorizing various types of waste using the YOLOv8 deep learning framework. The main objective of the project is to develop an efficient waste categorization system capable of sorting complex mixtures of garbage, thereby enhancing recycling effectiveness and reducing reliance on human labor. A key aspect of this research is evaluating YOLOv8's mean average accuracy (mAP) across diverse datasets of waste items captured in their natural settings, while considering different environmental conditions. The study also compares YOLOv8 with its predecessors, highlighting its potential as a precise and effective alternative to traditional, labor-intensive waste management methods. The model development involved five steps, each focusing on refining the model and augmenting data at various levels. The resulting metrics—a mAP50 of 84.1\%, an overall precision of 93\%, and a recall of 68.7\%—demonstrate the model's strong performance after extensive iterations. The findings and insights from this research could significantly transform waste management practices, positively impacting the environment, public health, and the economy.
Keywords:
YOLOv8
; waste object detection
; computer vision
; heterogenous waste dataset
1. Introduction
Deep learning (DL) has been successful in different domains such as image [1,2,3,4,5,6,7], audio [8,9,10,11,12] and many others [13,14,15,16,17,18]. Among these DL for dealing enviroment has been explored rare [19,20]. A major reason for worry over environmental degradation is the rapid increase of industry, urbanization, and the world’s population. Environmental degradation has reached crisis proportions as a result of the world population’s frightening pace of expansion. India generates more than 62MT of solid trash per year, as reported by [21]. Only 43 MT of this trash is really collected; around 11.9 MT passes through treatment, and an astounding 31 MT ends up in landfills. on terms of public health, sustainability of environment, and general well-being, the buildup of garbage items upon urban streets creates substantial issues. Garbage accumulation in streets is growing concern due to the fast-paced global urbanization. Discarded packaging, furniture, and electronics not only detract from aesthetics yet exacerbate a host of environmental and social issues. There are serious environmental consequences to littering roadways with trash. Especially during times of severe rainfall, these items often make their way in drainage systems, leading to backups and floods. Micro-plastics, which are formed as plastic trash breaks down, are another threat to aquatic ecosystems and the water bodies in which they live. Discharge of toxic compounds from improperly discarded electronics onto streets may contaminate soil and groundwater, worsening environmental deterioration. Social and economic effects of trash on roadways are significant as well. Uncleanliness and an unattractive look hurt towns’ and areas’ reputations and discourage tourists. As a result, local companies and people’s ability to make living could be negatively impacted by decrease in revenue. Even though this is a major problem, there’s number of ways to combat trash contamination. These methods include, as pointed out by [22], elimination of certain waste products, promotion of recyclable material use, and support of product reuse. Improvements to network while transportation mechanism for waste from municipalities collection, as well as improved techniques of waste detection, classification, along with recycling as proposed by [23], are essential for reducing waste accumulation. Immediate results may be expected from putting suggested waste segregation system into action, as it will improve waste management by bringing production and recycling rates into harmony. Thanks to recent developments in computer vision, deep learning models are now a viable and very useful option. Deep learning allows computers to learn from their experiences, as pointed out by [24]. According to what [25] found, deep learning involves a number of degrees of abstraction as machine learning algorithms use several processing layers to understand representation of the input. Deep learning algorithms learn to identify patterns and spot new types of data by extrapolating from their inputs. By automating garbage identification and categorization tasks, deep neural networks may greatly improve recycling efficiency while cutting down on human labor. One effective way to sort complex garbage combinations is via a deep learning model, which may function as an effective initial waste categorization system. In the latter phases of waste management, object detection may also be used to find lost garbage. Although YOLO, DenseNet, ResNet, and SSD are popular deep learning models, they aren’t best choice for garbage categorization tasks. These models have relatively poor identification accuracy and speed due to numerous and confusing characteristics of garbage. In order to make YOLOv8, recently created deep learning model, a popular, inexpensive, accurate, as well as effective alternative to current manual waste management system, we will tune it in this work to attempt to solve aforementioned flaws. Latest version of YOLO series, YOLOv8, was built with object detection in mind.
1.1. Research Question
The above research problem motivates the following research question:
- What is the mean average precision (mAP) achieved by YOLOv8 on a diverse dataset of trash items photographed in their natural environment, taking into account factors such as various kinds of trash, various lighting conditions, different backdrops, obstacles, and different sizes
- Does YOLOv8 perform better than its predecessors?
1.2. Structure of Report
-
Section 1 - IntroductionA broad overview of the importance of trash segregation and how computer vision might enhance it is provided in the introduction.
-
Section 2 - Related WorkThis work is related to research topic and its suggested solution since it provides procedural overview of study which was necessary.
-
Section 3 - MethodologyTechnical Approach, a methodological strategy that breaks project into manageable, sequential steps.
-
Section 4 - Results & EvaluationAll the experimentation performed will be critically evaluated in this section
- Section 5 - Conclusion & Future Work Insights that have been gained by this research and possible recommendations that can help improve upon this research will go in this section.
2. Related Work
Among many applications of machine learning and computer vision algorithms like CNN is waste item identification, which seeks to recognize and classify various types of trash in photographs. Its precise sorting and naming of trash items allows for more effective recycling and disposal, two factors that contribute significantly to sustainable waste management and environmental protection. Garbage buildup in landfills may be mitigated in part because of this. trash object detection’s automatic identification and categorization skills provide significant benefits to firms that handle trash management and recycling. The rapid and accurate identification of various waste types, including plastics, paper, glass, and organic matter, facilitates the sorting and treatment of recyclable resources. Therefore, the environmental effect of garbage disposal may be greatly reduced when a higher proportion of trash is diverted away from landfills. It lets the CNN model adapt over time, which boosts its accuracy. As additional images of trash are processed and categorized, the system keeps working well and remains relevant regardless of changes in garbage compositions and materials. By consistently improving the waste item identification system, we can guarantee that it will remain relevant and beneficial in sustainable waste management practices.
2.1. Waste Object Detection Using different Techniques
Recently, the phrase "Smart City" is used often to promote improved prospects; yet, this description does not cover all bases of what it means to be smart city. With climate changing and landfills filling up, people are starting to realize necessity of waste management, which has previously received little attention. Move to smart city status is driven by attempts to maintain clean and orderly environment in face of rising urbanization, according to [26]. Research into smart bin system and eventual realization of "smart cities" are both made possible by technological innovations made possible by IoT, cloud computing, big data, etc. Modern smart bin systems and technology that make them possible were covered, along with pros and cons of each. Smart bin and Garbage Management System are building blocks of framework that was discussed in this study. This framework will be put into action in future and its efficacy will be evaluated using test beds and simulations. Thus, optimizations to machine learning algorithms were made to aid in this pursuit.
In a study by [27], CNNs revolutionized pattern recognition by automating feature learning, making them powerful for image tasks. Large labelled datasets and GPU acceleration further boosted CNN success. Our research compared deep learning and SVM for waste sorting. AlexNet achieved 83% accuracy, but SVM surpassed it with 94.8%. Implemented on a Raspberry Pi, the SVM sorted waste based on images only. Drawbacks included a small training set and limited GPU memory (2GB), necessitating image size reduction to 32x32. Future plans involve expanding the image dataset, addressing GPU limitations with a dedicated server featuring 2 Tesla GPUs (12GB each), maintaining a 256x256 resolution with a batch size of 100 images. The implemented model showed a low average execution time (0.1s) on a Raspberry Pi 3.
[28] advocate for CNNs’ efficacy in trash material classification, emphasizing the impact of hyperparameter tuning and dataset quality on accuracy. Continuously expanding datasets with new images is vital for substantial accuracy improvements. Trash classification, facilitated by machine learning and computer vision, encountered challenges due to diverse data. To enhance system accuracy, a large and continuously growing data source is imperative. They have suggested to extend the project to identify and classify multiple objects in a single image or video, aiding recycling facilities in processing streams of recycling. Additionally, multiple object detection and classification aim to enhance large-scale recycling material categorization. The expansion of the dataset, particularly in the trash class, and potential inclusion of more classes, is a priority before eventual release. By using a machine learning strategy that makes use of a Convolutional Neural Network (CNN), [29] were able to automate the sorting of waste items such as plastic, metal, paper, and glass with an accuracy of 84%. The model’s effectiveness can be enhanced by expanding the image dataset, allowing it to accurately classify a broader range of materials. The system’s application can extend to fast-food chain restaurants, such as McDonald’s and Subway, where it can categorize waste items like soda cans, plastic cups, tissue papers, and wrappers. To expedite waste segregation, multiple robotic arms can replace servo motors, while image segmentation and occlusion detection techniques can improve accuracy. Additionally, sensor integration in trash cans enables real-time monitoring of waste levels, enhancing overall system efficiency.
[30] proposed an automated waste segregator addressing improper recycling by segregating plastic bottles and tin cans at the source. However, its limitations were evident as it couldn’t handle a broader range of waste materials, necessitating advancements to incorporate biodegradable and non-biodegradable segregation. To refine the system, they considered object resonant frequencies and introduced a method of averaging the frequencies produced by the materials. Plastic bottles typically ranged from 600Hz to 1700Hz, while tin cans fell between 1700Hz and 3000Hz. Despite some frequency overlap, optimizing the cut-off frequency at 1700Hz improved system accuracy. The study showed enhanced accuracy, especially when a plastic bottle’s cap hit the platform first, highlighting improvements in material detection compared to the initial study.
[31] combined classification with Faster R-CNN as part of hybrid transfer learning strategy for trash can item identification tasks. In this study, we utilized the TrashNet dataset, which contains 400 annotated pictures for each of 6 waste types (glass, plastic, paper, garbage, metal, and cardboard), for testing, validation, and training purposes. They tried out different learning rates and measured the outcomes using F1-scores, recall, and accuracy. Cardboard category outperformed the others, with F1 score values of 0.98, 0.99 for recall, and 0.97 for accuracy. However, the hybrid training approach, requiring two learning rates, presented challenges, and was deemed harder to train. Their decision not to use GP-GANs was based on their potential to blur image features and diminish performance. Fine-tuning Faster R-CNN with a learning rate of 0.0002 yielded satisfactory object detection results. This study discussed the possibility of generating an ample dataset for training the model from scratch, and future experiments included testing the model on real images of trash piles to assess its performance in practical scenarios.
2.2. Object Detection Using YOLO
[32] introduced a waste segregation study utilizing the Tiny-YOLOv3 model, achieving 88% accuracy in waste detection and 100% accuracy in classification. However, the study’s limitation of only two classes raised concerns about potential accuracy fluctuations with an increased class count. Recognizing constraints in traditional models, researchers turned to hybrid models to address individual limitations. When it came to trash detection, Tiny YOLOv3 was 88% accurate, whereas when it came to sorting trash, it was flawless 100%. It is worth mentioning that system demonstrated flawless performance with non-biodegradable garbage, achieving 100% accuracy, recall, and F1 score. On contrary hand, biodegradable waste showed perfect precision, 76% recall, and 86% F1 score. The detection and classification tasks had a macro-averaged recall of 88%, an accuracy of 100%, and F1 score of 9%, respectively. Detection of biodegradable garbage in vast COCO dataset, which has 80 classes, presented some challenges, however. To tackle this, researchers proposed updating pre-trained algorithm with more photos of decaying produce to enhance its ability to recognize biodegradable trash. Enhancing prototype with an Internet of Things monitoring system and sensors as proximity sensor for efficient trash monitoring is on list of future additions. Other waste categories that will be included include ordinary domestic garbage and peels.
[33] noted that in order to forecast bounding boxes, YOLOv4 makes use of dimension clusters and anchor boxes. For purpose of determining dataset’s bounding boxes prior to training, model uses K-means to produce nine clusters. By combining 1*1 and 3*3 convolutional layers in sequential fashion, YOLOv4 improves accuracy. In YOLOv4, unlike earlier versions, backbone among every convolutional layer is Darknet-53, and CSP connections are added above it. Findings show that the model’s enhanced mAP is mostly due to this architectural change. Real-time efficiency of YOLOv4 remains high even after these improvements. While YOLOv4’s processing time is greater than certain earlier models, it’s mostly because of extra CSP connection. The core of YOLOv4 is made up of concatenated convolutional layers which extract characteristics from images, as pointed out by [34]. A large number of parameters are produced by model’s use of several convolutional layers with 512 and 1024 convolution filters. Storage use increases and detection performance decreases due to the big parameter count. Hence, YOLOv4 could be inefficient and lead to increased computing costs when used upon broad scale. Their model was easy to create and trained on whole images with little computing overhead. In contrast to methods that rely on classifiers, their model has been trained simultaneously using a loss function that connects directly to detection performance.
When it comes to sorting construction trash, [35] suggested an improved YOLOv5 model to tackle issues including tiny item recognition and inter-object occlusions. Bricks, wood, stones, plastics, and 3046 other building debris images form the basis of the model’s training dataset. By including fourth-scale feature fusion, a shallow detection layer, CBAM, and SimSPPF, YOLOv5 model is enhanced. Incorporating CBAM and SimSPPF in backbone layer enhances YOLOv5 model’s capability to handle mutual occlusions and capture characteristics of tiny objects. Both detection accuracy and resilience are enhanced as a consequence. Adding shallow detection layer to "Head" and 4th-scale feature fusion to "Neck" both help with tiny item identification and solving inter-occlusion problems. In terms of detection accuracy, proposed YOLOv5 model outperforms popular models such as Faster-RCNN, YOLOv3, YOLOv4, and YOLOv7, reaching mAP of up to 94.8%. Upgraded YOLOv5 model’s efficacy and practicability in intelligent construction waste sorting are supported by this validation. YOLOv5 model is a great choice for fast and precise construction waste sorting because of its enhanced characteristics, which boost its generalization capability and overall detection efficiency.
[36]Lin (2021) presented YOLO-Green, new real-time object identification model developed for garbage detection, to address the challenges that DNNs have while trying to effectively and reliably identify blurry waste items. Fire module from SqueezeNet was originally integrated into YOLOv4 to produce YOLO-Green, which aimed to initially minimize parameters and model size. YOLO-Green learned its ropes from a collection of real-life garbage photos labeled with seven distinct solid waste categories. Amazing results were produced by YOLO-Green with just 100 epochs of training, comprising mAP of 78.04%, an FPS rate of 2.72, and small model size of 117 MB. With a smaller model size, YOLO-Green achieved better accuracy and efficiency than other popular deep learning models, including original YOLOv4. Although the findings are promising, it should be mentioned that the dataset included pictures of rubbish objects shot against a white backdrop in order to give every picture equal opportunity to be classified correctly. However, this model may be utilized in comparable settings to train more advanced models.
Problem of feature pyramid output being unused in object recognition models for optical remote sensing images was addressed by [37]. They presented YOLO-HR method, which improves detecting impacts by recycling feature pyramid output effectively, by combining multi-head approach with Hybrid Attention Module (MAB). Quicker outcomes without sacrificing speed were the goals of this innovation. Using many detection heads and recycling feature pyramid output, YOLO-HR algorithm, which is a part of these YOLOv5 network improvements, showed better detection capabilities. Experiments showed that YOLO-HR maintained the previous detection speed despite allowing higher number of down-sampling multiples, leading to quicker detection results compared to competing methods. Researchers want to further investigate YOLO algorithm’s deployment and utilization of features in future work, expand these improvements to additional object identification methods, and investigate varied feature reuse methodologies.
Main issue started when garbage wasn’t segregated at source, which meant lot of it ended up in landfills instead of recycling centers. Although they achieved great accuracy in efficacy measures of their study area, there is paucity of dataset in their most recent studies. Images of trash on white or uniform backgrounds are included in the dataset that was previously utilized. That is what this study aims to solve by analyzing a dataset containing photos of trash items collected in their natural environment. They may have variety of lighting effects, be cluttered with various garbage things or non-waste objects, and impede different paths.
3. Methodology
The approach used in this research is CRISP-DM. Among many processes that make up CRISP-DM are following: gaining familiarity with business, data, preparation of data, modeling, evaluation, and deployment. Data collection, preprocessing, data division, data augmentation, modeling utilizing YOLOv8 architecture, and architectural assessment are six main steps that show these processes. Figure 1 shows these components in action.
3.1. Data Collection
The dataset used in this research has been sourced from Taco1 and [38] which has then been combined with additional images that have been web scraped manually and uploaded on Kaggle2. The dataset consists of 3975 images with 59 subclasses for different waste types which have been narrowed down to 8 classes, namely ’cigarette butts’, ’electronics’, ’food waste’, ’glass’, ’metal’, ’paper’, ’plastic’ and ’waste’. The images are in varying sizes where a major chunk of them is of 640 X 480 size. Initial annotation were there for segmentation which have then been used to create bounding boxes annotation.
3.2. PreProcessing and Data Split
The dataset was reduced to a final dataset of 970 images which were further divided into 849 training images and valid set consisted of 81 images and test set consisted of 40 images. The dataset has been split into training valid and test set by an approximate ratio of 80:15:5 for this research. As the dataset consisted of images of varying size they were all resized to a standard of 640 X 640 for uniformity.
3.3. Data Augmentation
Data augmentation was utilized once data was partitioned in training and testing sets.. Initially we made use of Roboflow3 to augment images by using blur, grayscale etc. This process focuses on enhancing the diversity of the training data, particularly to address class imbalances within the images. In order to ensure that picture class data is balanced, training data is going to undergo augmentation procedure. Rotation, flipping, shearing, and brightness are augmentation procedures that shall be used in this study. A simple rotation of picture by 90 degrees will exclude possibility of trash existing in any orientation. Metamorphosing a picture horizontally and vertically achieves flip effect. As an enhancement method, scaling allows us to arbitrarily choose smaller picture size from an assortment of possible dimensions. This helped our model in being robust against similar type of dataset.The effect of data augmentation can be seen in Figure 2
3.4. Splitting Dataset
This project uses 849 images in the training set. After augmentation of images has been completed, they are then processed for training and can be seen in Figure 3. The classes can be identified as ’Cigarette Butts = 0’, ’Electronics = 1’, ’Food Waste = 2’, ’Glass = 3’, ’Metal = 4’, ’Paper = 5’, ’Plastic = 6’, ’Waste = 7’
Figure 3.
Images after training has been completed.
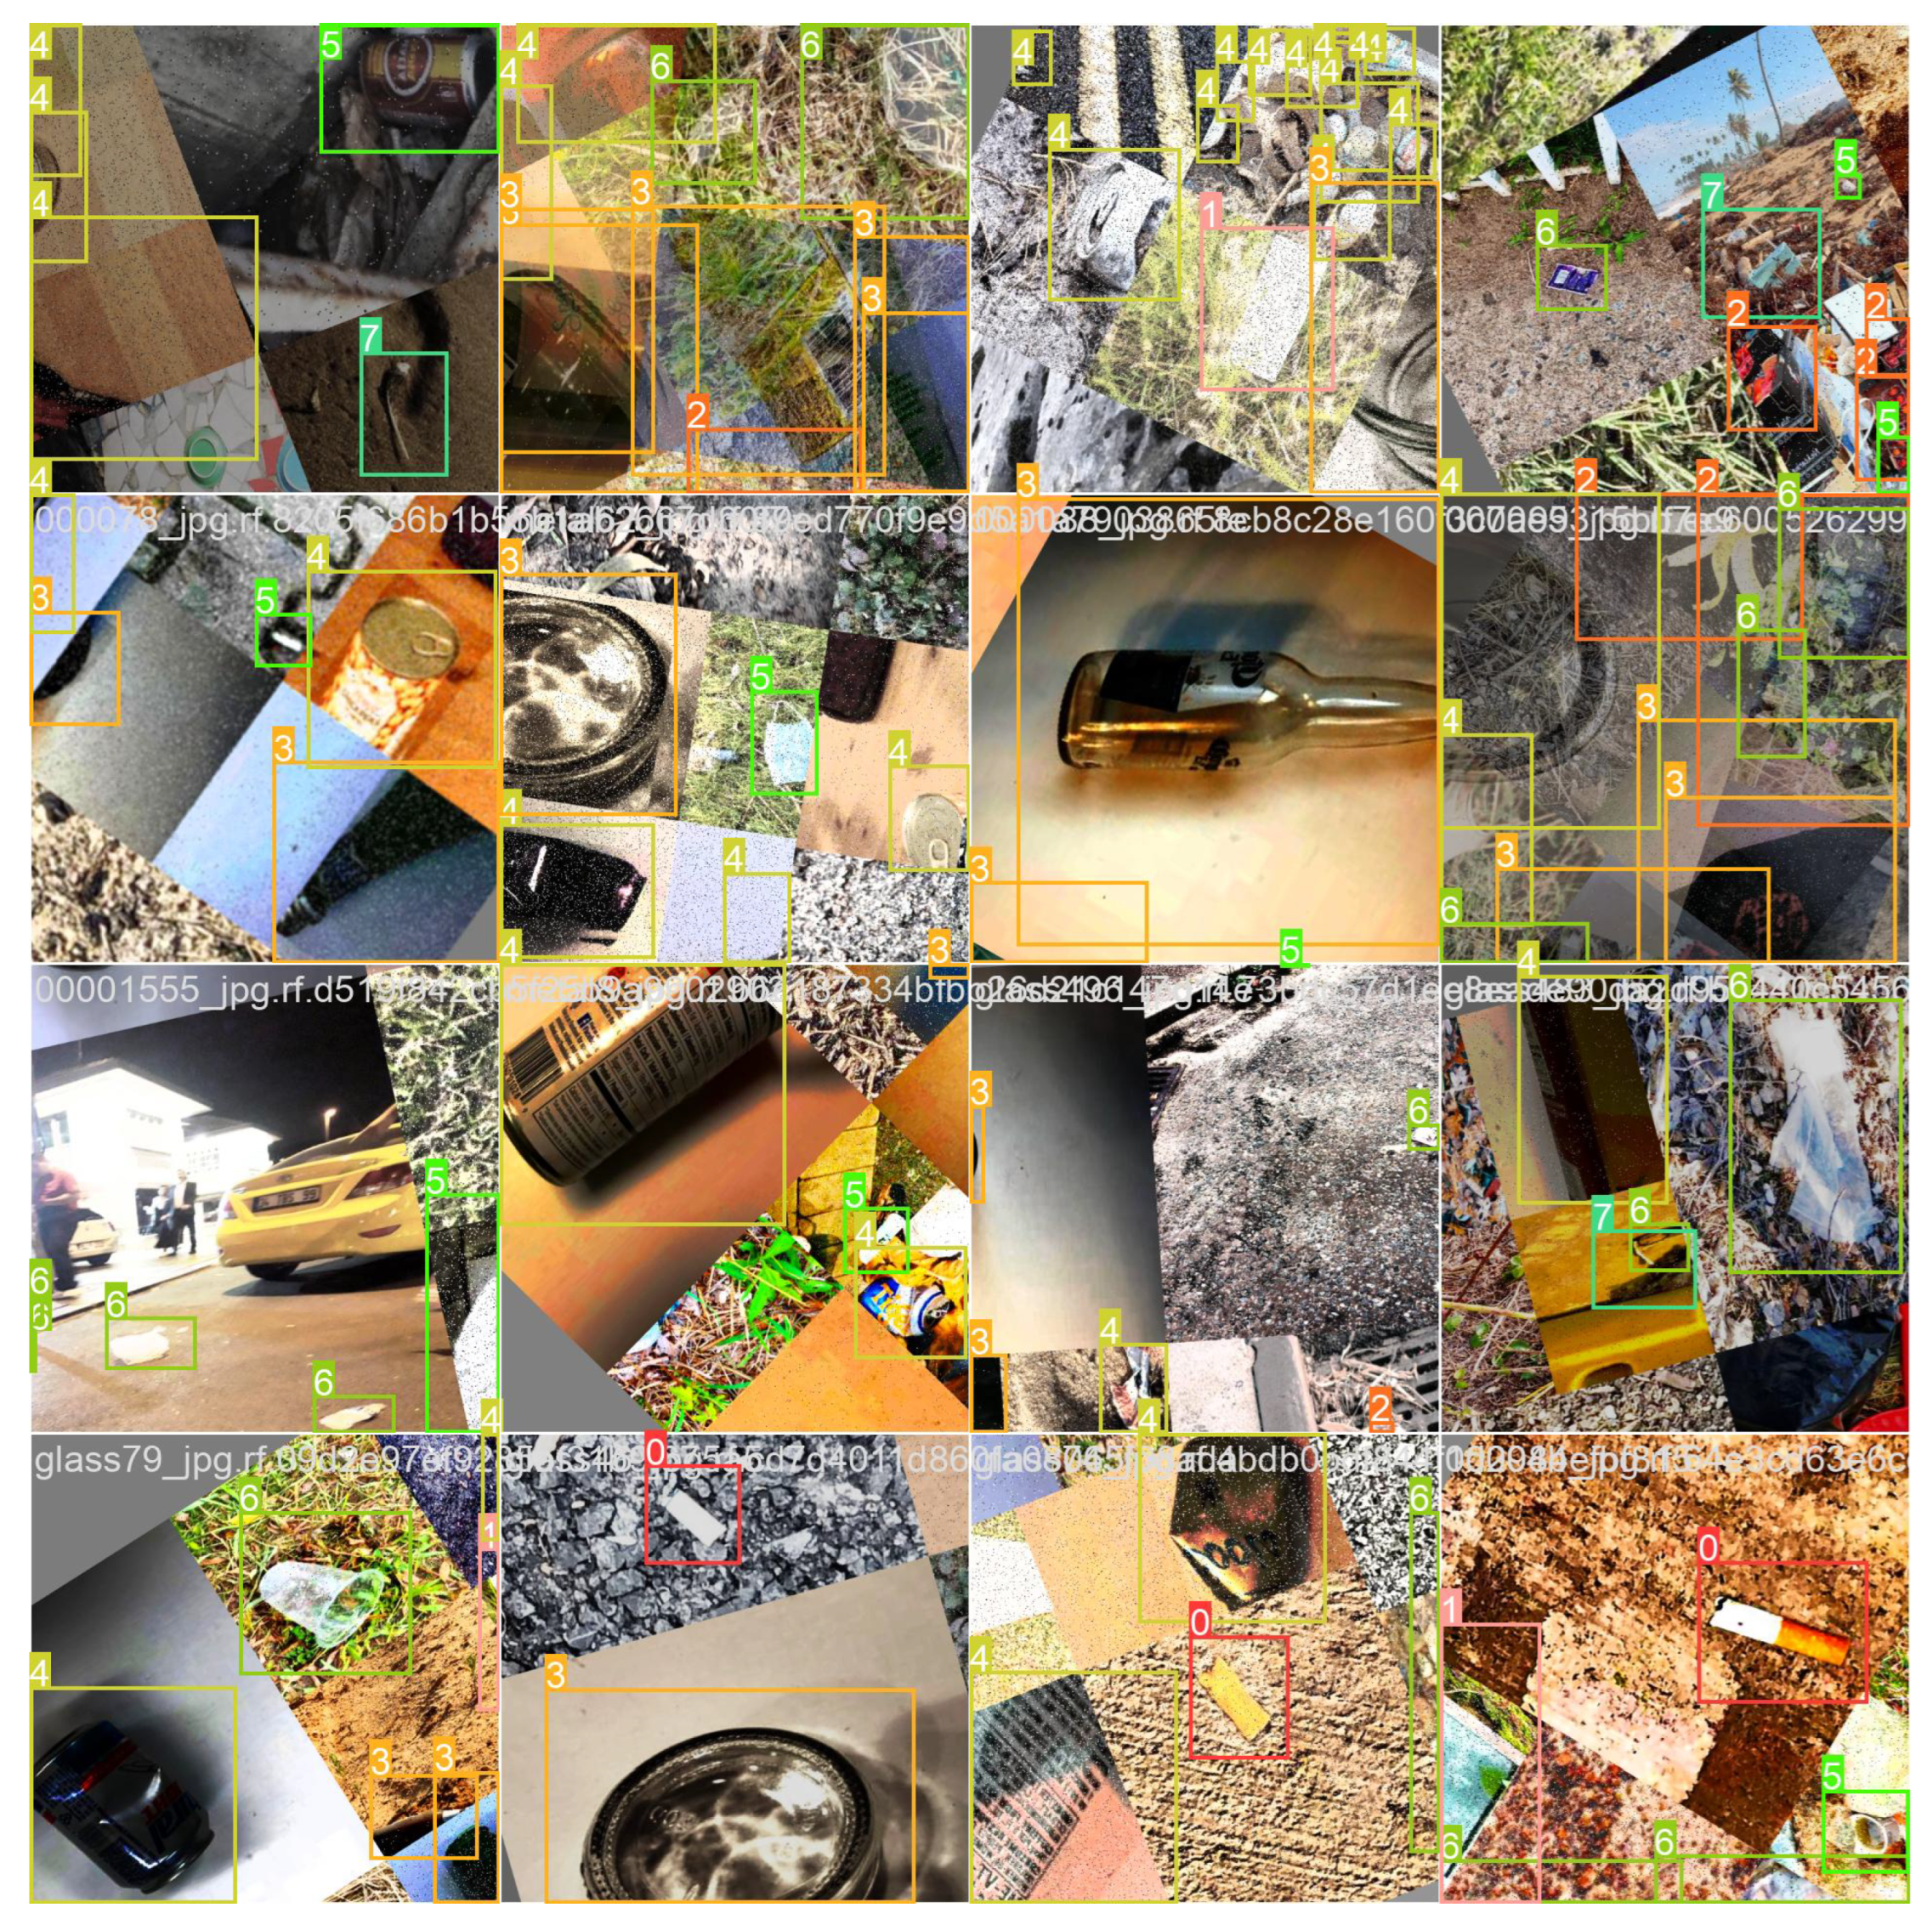
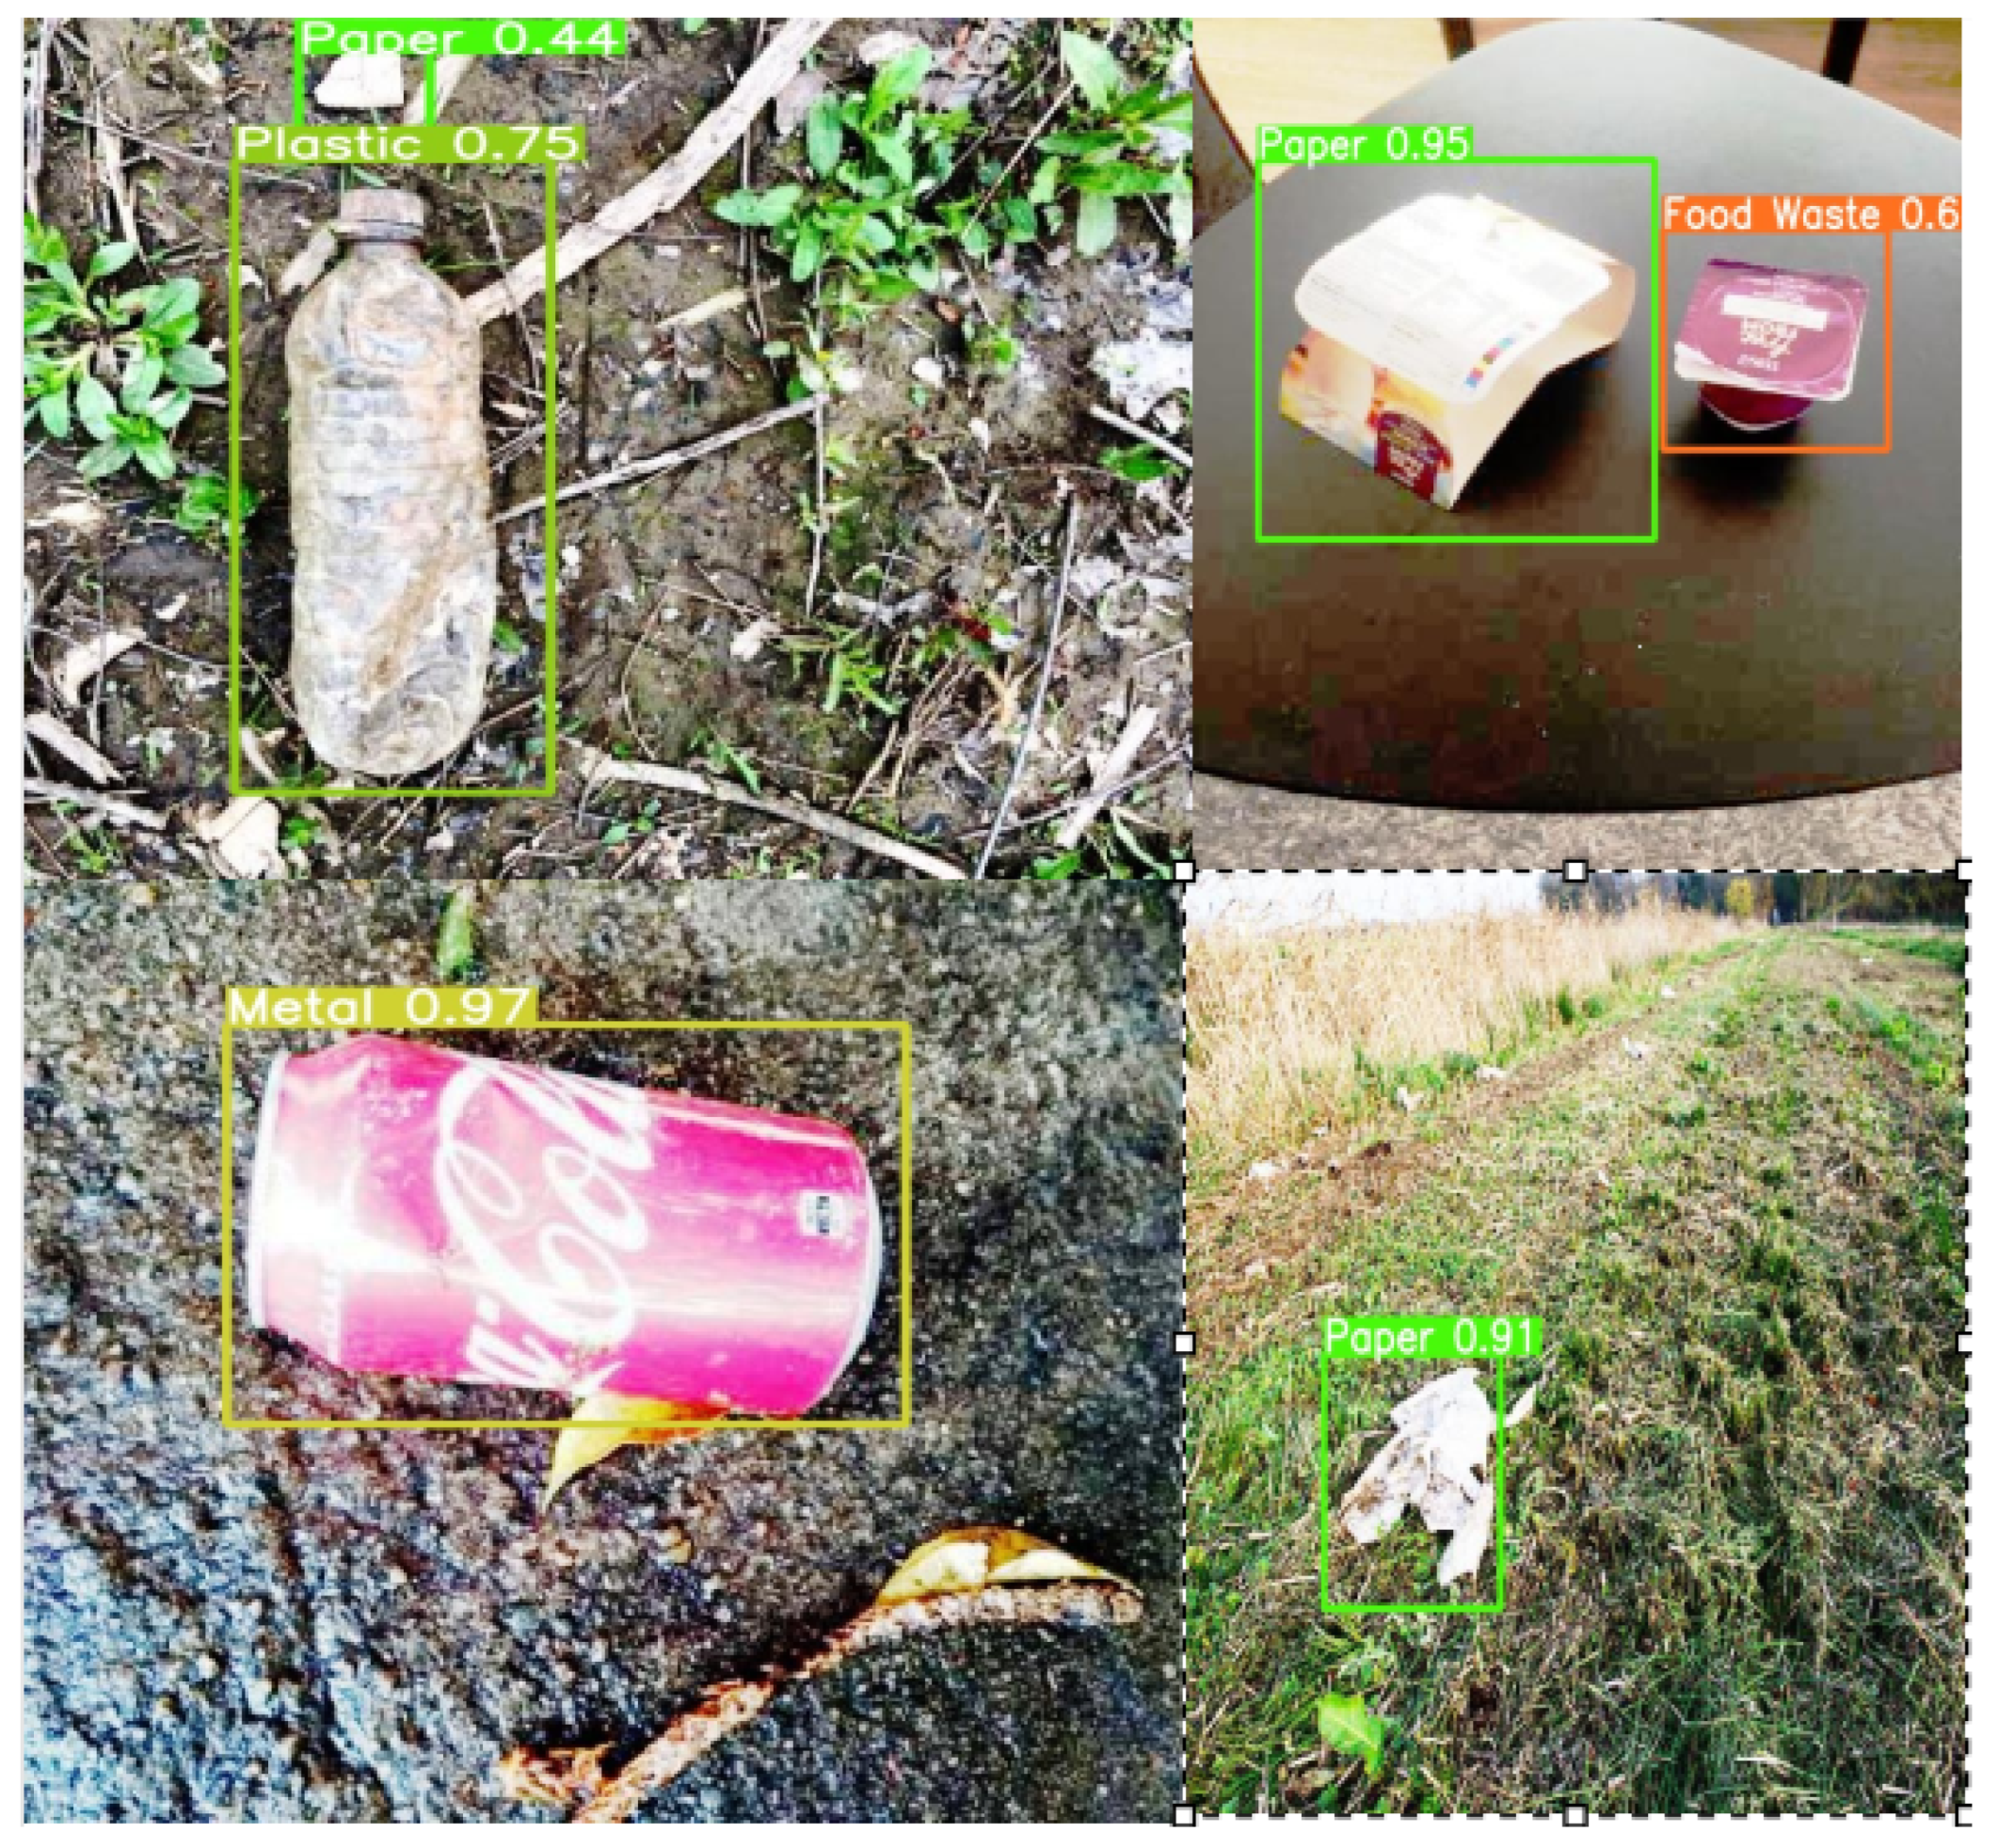
Figure 4.
Testing images after prediction.
3.5. Modelling
Training and testing are both part of segmentation step. The process of building model utilizing training data is known as training. Meanwhile, segmentation model’s efficacy is evaluated during testing using previously built architecture as shown in Figure 5 using testing data. To carry out detection, YOLOv8 architecture is used.
By removing limitations of previous YOLO versions, YOLOv8 signifies giant leap forward in object identification techniques. It constitutes most effective and exact object detection technologies now in utilize, and an eighth version in YOLO series. And because of its excellent scalability, YOLOv8 may be easily modified to work with a wide range of hardware configurations, from ultra-low power devices to powerful desktop PCs. Another major feature is its capacity for handling large datasets. Method is able to learn several object classes and accomplish accurate object recognition, even in complex images, by using hierarchical structure. The need of anchor boxes is also eliminated by YOLOv8’s anchor-free detection. Differentiating it from other object identification methods that depend mostly on bounding box regression, this feature increases its resilience and decreases probability of false positives. A lower model size improves computational overhead of YOLOv8 method, which in turn improves its efficiency and quickness. In addition, it improves the accuracy of object detection by using proprietary loss function which combines several losses when training the network.
3.6. Model Building
In this research, we have made use of Google Colab to run our project. After the data was split into 3 subsets of train, valid and test we have experimented with multiple iterations with few hypereparameters. The study included eight steps in the process of constructing the model. At first, dataset had been utilized to build baseline model, without any augmentation. With batch size of 16, baseline model was given 50 epochs to train at a learning rate of 0.001. In order to improve training quality, photos were resized to 640 × 640 pixels. After hearing that SGD optimizer outperformed the Adam optimizer, we followed their advice and applied it.
After this baseline model was created we then created additional models for 50 and 100 epochs with or without augmentation for Yolov8 and Yolov5 for comparison. Initially model building was done on a separate dataset with similar experimentation but there was no significant difference between all 8 iterations performed.The model made use of the following hyperparameters: batch size of 32, optimizer as Adam.
3.7. Architecture Evaluation
Our primary measure of choice for evaluating waste item identification model’s performance will be mAP, which is often employed in this context. mAP allows for an equitable evaluation of different models by providing a complete single score that combines recall and accuracy. mAP score is computed using (1), and efficacy levels of models are determined by comparing their mAP scores. We will also use Precision and Recall as a secondary metric to further analyse our results as shown in Equations (2) and (3).
4. Evaluation
This study utilized mAP as its model assessment measure. Majority of object detection algorithms evaluate themselves using mAP and IoU (Intersection over Union). mAP is a metric for evaluating a model’s object recognition and localization capabilities in a given picture. To get mAP, we first average precision for every category before we take mean. Put simply, mAP is calculated by averaging accuracy scores for all classes. Several hyperparameter adjustments were made throughout training process of the model used in this investigation. Over course of eight iterations, constructed model was assessed for its performance. Baseline model is first stage of model and was constructed using raw data alone, without any augmentation or sampling. After just one cycle, model achieved a mAP of 74.1%, an overall Precision of 79.8%, and recall of 64.8%. Remaining three iterations involved the use of 100 epochs without augmentation, 50 epochs with augmentation and 100 epochs with augmentation. The mAP of these can be seen in Table 1. Similarly these 4 experiments were also performed on Yolov5 model so a reasonable comparison can be performed for analysis, which can be observed in Table 2.
It can be observed that in terms of mAP, including mAP50 and mAP50-95, Yolov8 performs significantly better than its predecessor for all iterations. Also model 4 can be observed as the model with the highest mAP50 with respect to other models. This model has been built using 100 epochs with augmentations being employed. The results for model 4 can be referred to in Table 3.
4.1. Precision
The mAP (mean average precision) in YOLOv8 acts as a measure of how well it can accurately find and pinpoint objects. With a precision rate of 93%, it means that approximately 93% of the predicted bounding boxes are correct. This showcases the model’s ability to accurately identify positive instances in its predictions. This can be observed in the Figure 6 of Precision v/s Confidence curve.
Precision is a metric that measures the accuracy of positive predictions made by the model, while confidence represents the level of certainty assigned by the model to its predictions. When the model is very confident (confidence score of 0.861 or higher), all its positive predictions are correct. This indicates that the model is reliable when it expresses high confidence. However, care has to be taken when setting the confidence of a model as there is a need of trade-off between precision and recall else it might lead to missed detections.
4.2. Recall
A recall vs. confidence graph visually describes how well a model identifies positive instances at different confidence levels. Recall measures the proportion of correctly identified positive instances. As observed in Figure 7, the model achieves a recall of 0.92 at a confidence score of 0, implying that it was capable to identify a high proportion of positive instances even when not very confident. However, at a confidence score of 1, its recall drops to 0, suggesting it is overly cautious and missing some positive instances. This indicates the importance of the trade-off required between precision and recall.
The trade-off between precision and recall can be observed in Figure 8. In the beginning, the precision-recall curve decreases gradually as recall increases. This indicates that the model is making more false positives to capture more positive instances. After a certain point, precision decreases sharply while recall increases sharply. This means the model is becoming less strict in its predictions, leading to more false positives but also capturing almost all positive instances. The area under the curve, which represents the overall model performance, is high (mAP50 = 0.841). This suggests that the model effectively balances precision and recall, making it apt for detecting waste objects.
From the Figure 9 of Confusion Matrix, we can calculate the total accuracy of the model. It is calculated as (TP + TN) / (TP + TN + FP + FN). In this case, the accuracy is (1.00 + 1.00 + 0.36 + 0.20 + 0.04 + 0.31 + 0.04) / (1.00 + 1.00 + 0.08 + 0.05 + 0.12 + 0.12 + 0.89) = 0.84. This means that the model correctly predicts 84% of the cases. We can observe that there are some areas where the model can be improved by reducing the false negatives for ’Food Waste’ and ’Metal’ categories.
We can observe the previously stated accuracy in Figure 4, where it can be observed successful prediction of metal, plastic, food waste and paper categories.
The graph in Figure 10 depicts the progress of model 4 throughout its training process. It showcases several metrics, including bounding box loss, class loss, distance from camera loss, precision, recall, and mean average precision (mAP). These metrics indicate the model’s ability to accurately identify and locate waste objects in images. As the training progresses, the loss metrics gradually decrease, while the precision, recall, and mAP metrics steadily increase. This implies that the model improves its accuracy and consistency in detecting waste objects. The final mAPs of 0.841 of mAP50 and 0.557 of mAP50-95 represent the model’s effectiveness in detecting waste objects with both high precision and recall across a range of real-world scenarios in the wild.
5. Conclusions and Future Work
The research into identifying and locating heterogeneous waste objects in different environmental scenarios using YOLOv8 has produced reinforcing outcomes, demonstrating the effectiveness of the model. The project’s objective on utilizing advanced computer vision techniques to classify and detect waste aligns with the immediate requirement for efficient waste management solutions amidst rapid urbanization, industrialization and environmental degradation. The results highlight the potential of YOLOv8 as a feasible and effective alternative to manual waste management methods, offering opportunities to enhance waste recycling processes and reduce the impact on the environmental. The successful assessment of YOLOv8 on a diverse dataset of waste objects observed in their natural surroundings showcases its adaptability and robustness in real-world applications when compared to previous versions such as YOLOv5. The project’s usage of the CRISP-DM methodology has enabled a systematic and comprehensive approach, establishing the foundation for future advancements in waste management practices through innovative technological solutions.
Future investigations into the detection of heterogeneous waste utilizing the YOLOv8 framework can expand upon the present discoveries by exploring various avenues. To improve the strength and adaptability of the model, it’s crucial to integrate a broader and more varied dataset including waste objects in the wild. Moreover, conducting comprehensive experiments on the YOLOv8 architecture, incorporating advanced techniques such as attention mechanisms or ensemble learning, holds the potential to further enhance the accuracy and speed of waste detection. Analyzing the potential of implementing the YOLOv8 model in real-time waste management systems, in combination with IoT monitoring systems and sensors, has the ability to enhance waste monitoring and segregation. Additionally, it is imperative to evaluate the environmental and cost implications of utilizing YOLOv8 for waste detection in real-world scenarios. Collaborating with waste management organizations and stakeholders ensures alignment with practical challenges and requirements. The successful integration of automated waste detection and management systems requires addressing ethical and social considerations, including privacy and community acceptance. Overall, these future research directions aim to advance waste management practices, promoting more efficient, sustainable, and technology-driven solutions in environmental conservation and waste recycling.
Acknowledgments
I want to express my heartfelt thanks to Teerath Kumar Menghwar, who served as my supervisor and mentor during the Data Analytics course. I express my gratitude towards him and the remaining members of the NCI faculty for the invaluable knowledge and guidance bestowed upon me. I would also like to thank my parents and friends for all of the support and encouragement they have provided over the whole of my academic career.
References
- Kumar, T.; Mileo, A.; Bendechache, M. KeepOriginalAugment: Single Image-based Better Information-Preserving Data Augmentation Approach. In Proceedings of the 20th International Conference on Artificial Intelligence Applications and Innovations; 2024. [Google Scholar]
- Kumar, T.; Mileo, A.; Brennan, R.; Bendechache, M. RSMDA: Random Slices Mixing Data Augmentation. Applied Sciences 2023, 13, 1711. [Google Scholar] [CrossRef]
- Chandio, A.; Gui, G.; Kumar, T.; Ullah, I.; Ranjbarzadeh, R.; Roy, A.M.; Hussain, A.; Shen, Y. Precise single-stage detector. arXiv 2022. [Google Scholar] [CrossRef]
- Kumar, T.; Mileo, A.; Brennan, R.; Bendechache, M. Advanced Data Augmentation Approaches: A Comprehensive Survey and Future directions. arXiv, 2023; arXiv:2301.02830. [Google Scholar]
- Kumar, T.; Park, J.; Ali, M.S.; Uddin, A.S.; Ko, J.H.; Bae, S.H. Binary-classifiers-enabled filters for semi-supervised learning. IEEE Access 2021, 9, 167663–167673. [Google Scholar] [CrossRef]
- Roy, A.M.; Bhaduri, J.; Kumar, T.; Raj, K. A computer vision-based object localization model for endangered wildlife detection. Ecological Economics, Forthcoming 2022. [Google Scholar] [CrossRef]
- Kumar, T.; Brennan, R.; Mileo, A.; Bendechache, M. Image data augmentation approaches: A comprehensive survey and future directions. IEEE Access 2024. [Google Scholar] [CrossRef]
- Chandio, A.; Shen, Y.; Bendechache, M.; Inayat, I.; Kumar, T. AUDD: audio Urdu digits dataset for automatic audio Urdu digit recognition. Applied Sciences 2021, 11, 8842. [Google Scholar] [CrossRef]
- Turab, M.; Kumar, T.; Bendechache, M.; Saber, T. Investigating multi-feature selection and ensembling for audio classification. International Journal of Artificial Intelligence & Applications 2022. [Google Scholar]
- Raj, K.; Singh, A.; Mandal, A.; Kumar, T.; Roy, A.M. Understanding EEG signals for subject-wise definition of armoni activities. arXiv 2023. [Google Scholar] [CrossRef]
- Kumar, T.; Park, J.; Bae, S.H. Intra-Class Random Erasing (ICRE) augmentation for audio classification. In Proceedings of the Proceedings Of The Korean Society Of Broadcast Engineers Conference. The Korean Institute of Broadcast and Media Engineers; 2020; pp. 244–247. [Google Scholar]
- Park, J.; Kumar, T.; Bae, S.H. Search of an optimal sound augmentation policy for environmental sound classification with deep neural networks. In Proceedings of the Proceedings Of The Korean Society Of Broadcast Engineers Conference. The Korean Institute of Broadcast and Media Engineers; 2020; pp. 18–21. [Google Scholar]
- Singh, A.; Raj, K.; Meghwar, T.; Roy, A.M. Efficient Paddy Grain Quality Assessment Approach Utilizing Affordable Sensors. Artificial Intelligence 2024, 5, 686–703. [Google Scholar] [CrossRef]
- Khan, W.; Kumar, T.; Cheng, Z.; Raj, K.; Roy, A.; Luo, B. SQL and NoSQL Databases Software architectures performance analysis and assessments—A Systematic Literature review. arXiv 2022, arXiv:2209.06977. [Google Scholar] [CrossRef]
- Turab, M.; Kumar, T.; Bendechache, M.; Saber, T. Investigating multi-feature selection and ensembling for audio classification. arXiv 2022, arXiv:2206.07511. [Google Scholar] [CrossRef]
- Kumar, T.; Bhujbal, R.; Raj, K.; Roy, A.M. Navigating Complexity: A Tailored Question-Answering Approach for PDFs in Finance, Bio-Medicine, and Science 2024.
- Barua, M.; Kumar, T.; Raj, K.; Roy, A.M. Comparative Analysis of Deep Learning Models for Stock Price Prediction in the Indian Market 2024.
- Raj, K.; Mileo, A. Towards Understanding Graph Neural Networks: Functional-Semantic Activation Mapping. In Proceedings of the International Conference on Neural-Symbolic Learning and Reasoning. Springer; 2024; pp. 98–106. [Google Scholar]
- Zhu, L.; Husny, Z.J.B.M.; Samsudin, N.A.; Xu, H.; Han, C. Deep learning method for minimizing water pollution and air pollution in urban environment. Urban Climate 2023, 49, 101486. [Google Scholar] [CrossRef]
- Ayturan, Y.A.; Ayturan, Z.C.; Altun, H.O. Air pollution modelling with deep learning: a review. International Journal of Environmental Pollution and Environmental Modelling 2018, 1, 58–62. [Google Scholar]
- India-Today. India’s Trash Bomb: 80% of 1.5 Lakh Metric Tonne Daily Garbage Remains Exposed, Untreated. India Today, 2019.
- Liu, Z.; Adams, M.; Walker, T.R. Are exports of recyclables from developed to developing countries waste pollution transfer or part of the global circular economy? Resources, Conservation and Recycling 2018, 136, 22–23. [Google Scholar] [CrossRef]
- Beltrami, E.J.; Bodin, L.D. Networks and vehicle routing for municipal waste collection. Networks 1974, 4, 65–94. [Google Scholar] [CrossRef]
- Delalleau, O.; Bengio, Y. Shallow vs. deep sum-product networks. Advances in neural information processing systems 2011, 24. [Google Scholar]
- Najafabadi, M.M.; Villanustre, F.; Khoshgoftaar, T.M.; Seliya, N.; Wald, R.; Muharemagic, E. Deep learning applications and challenges in big data analytics. Journal of big data 2015, 2, 1–21. [Google Scholar] [CrossRef]
- Soni, G.; Kandasamy, S. Smart Garbage Bin Systems – A Comprehensive Survey. In Proceedings of the Smart Secure Systems – IoT and Analytics Perspective; Venkataramani, G.P., Sankaranarayanan, K., Mukherjee, S., Arputharaj, K., Sankara Narayanan, S., Eds.; Singapore, 2018; pp. 194–206. [Google Scholar]
- Sakr, G.E.; Mokbel, M.; Darwich, A.; Khneisser, M.N.; Hadi, A. Comparing deep learning and support vector machines for autonomous waste sorting. In Proceedings of the 2016 IEEE international multidisciplinary conference on engineering technology (IMCET). IEEE; 2016; pp. 207–212. [Google Scholar]
- Yang, M.; Thung, G. Classification of trash for recyclability status. CS229 project report 2016, 2016, 3. [Google Scholar]
- Hulyalkar, S.; Deshpande, R.; Makode, K.; Kajale, S. Implementation of smartbin using convolutional neural networks. Int. Res. J. Eng. Technol 2018, 5, 1–7. [Google Scholar]
- Sejera, M.; Ibarra, J.B.; Canare, A.S.; Escano, L.; Mapanoo, D.C.; Suaviso, J.P. Standalone frequency based automated trash bin and segregator of plastic bottles and tin cans. In Proceedings of the 2016 IEEE Region 10 Conference (TENCON). IEEE; 2016; pp. 2370–2372. [Google Scholar]
- Kulkarni, H.; Raman, N. Waste Object Detection and Classification; CS230 Report: Deep Learning, 2018.
- Macasaet, N.A.G.; Martinez, E.R.R.; Vergara, E.M. Automatic Segregation of Limited Wastes through Tiny YOLOv3 Algorithm. In Proceedings of the 2022 13th International Conference on Computing Communication and Networking Technologies (ICCCNT), Oct 2022; pp. 1–6. [Google Scholar] [CrossRef]
- Bochkovskiy, A.; Wang, C.Y.; Liao, H.Y.M. Yolov4: Optimal speed and accuracy of object detection. arXiv 2020. [Google Scholar] [CrossRef]
- Redmon, J.; Divvala, S.; Girshick, R.; Farhadi, A. You only look once: Unified, real-time object detection. In Proceedings of the Proceedings of the IEEE conference on computer vision and pattern recognition, 2016; pp. 779–788.
- Zhou, Q.; Liu, H.; Qiu, Y.; Zheng, W. Object Detection for Construction Waste Based on an Improved YOLOv5 Model. Sustainability 2023, 15. [Google Scholar] [CrossRef]
- Lin, W. YOLO-Green: A Real-Time Classification and Object Detection Model Optimized for Waste Management. In Proceedings of the 2021 IEEE International Conference on Big Data (Big Data); 2021; pp. 51–57. [Google Scholar] [CrossRef]
- Wan, D.; Lu, R.; Wang, S.; Shen, S.; Xu, T.; Lang, X. YOLO-HR: Improved YOLOv5 for Object Detection in High-Resolution Optical Remote Sensing Images. Remote Sensing 2023, 15. [Google Scholar] [CrossRef]
- Wang, T.; Cai, Y.; Liang, L.; Ye, D. A multi-level approach to waste object segmentation. Sensors 2020, 20, 3816. [Google Scholar] [CrossRef] [PubMed]
| 1 | |
| 2 | |
| 3 |
Figure 1.
Methodology Stages.
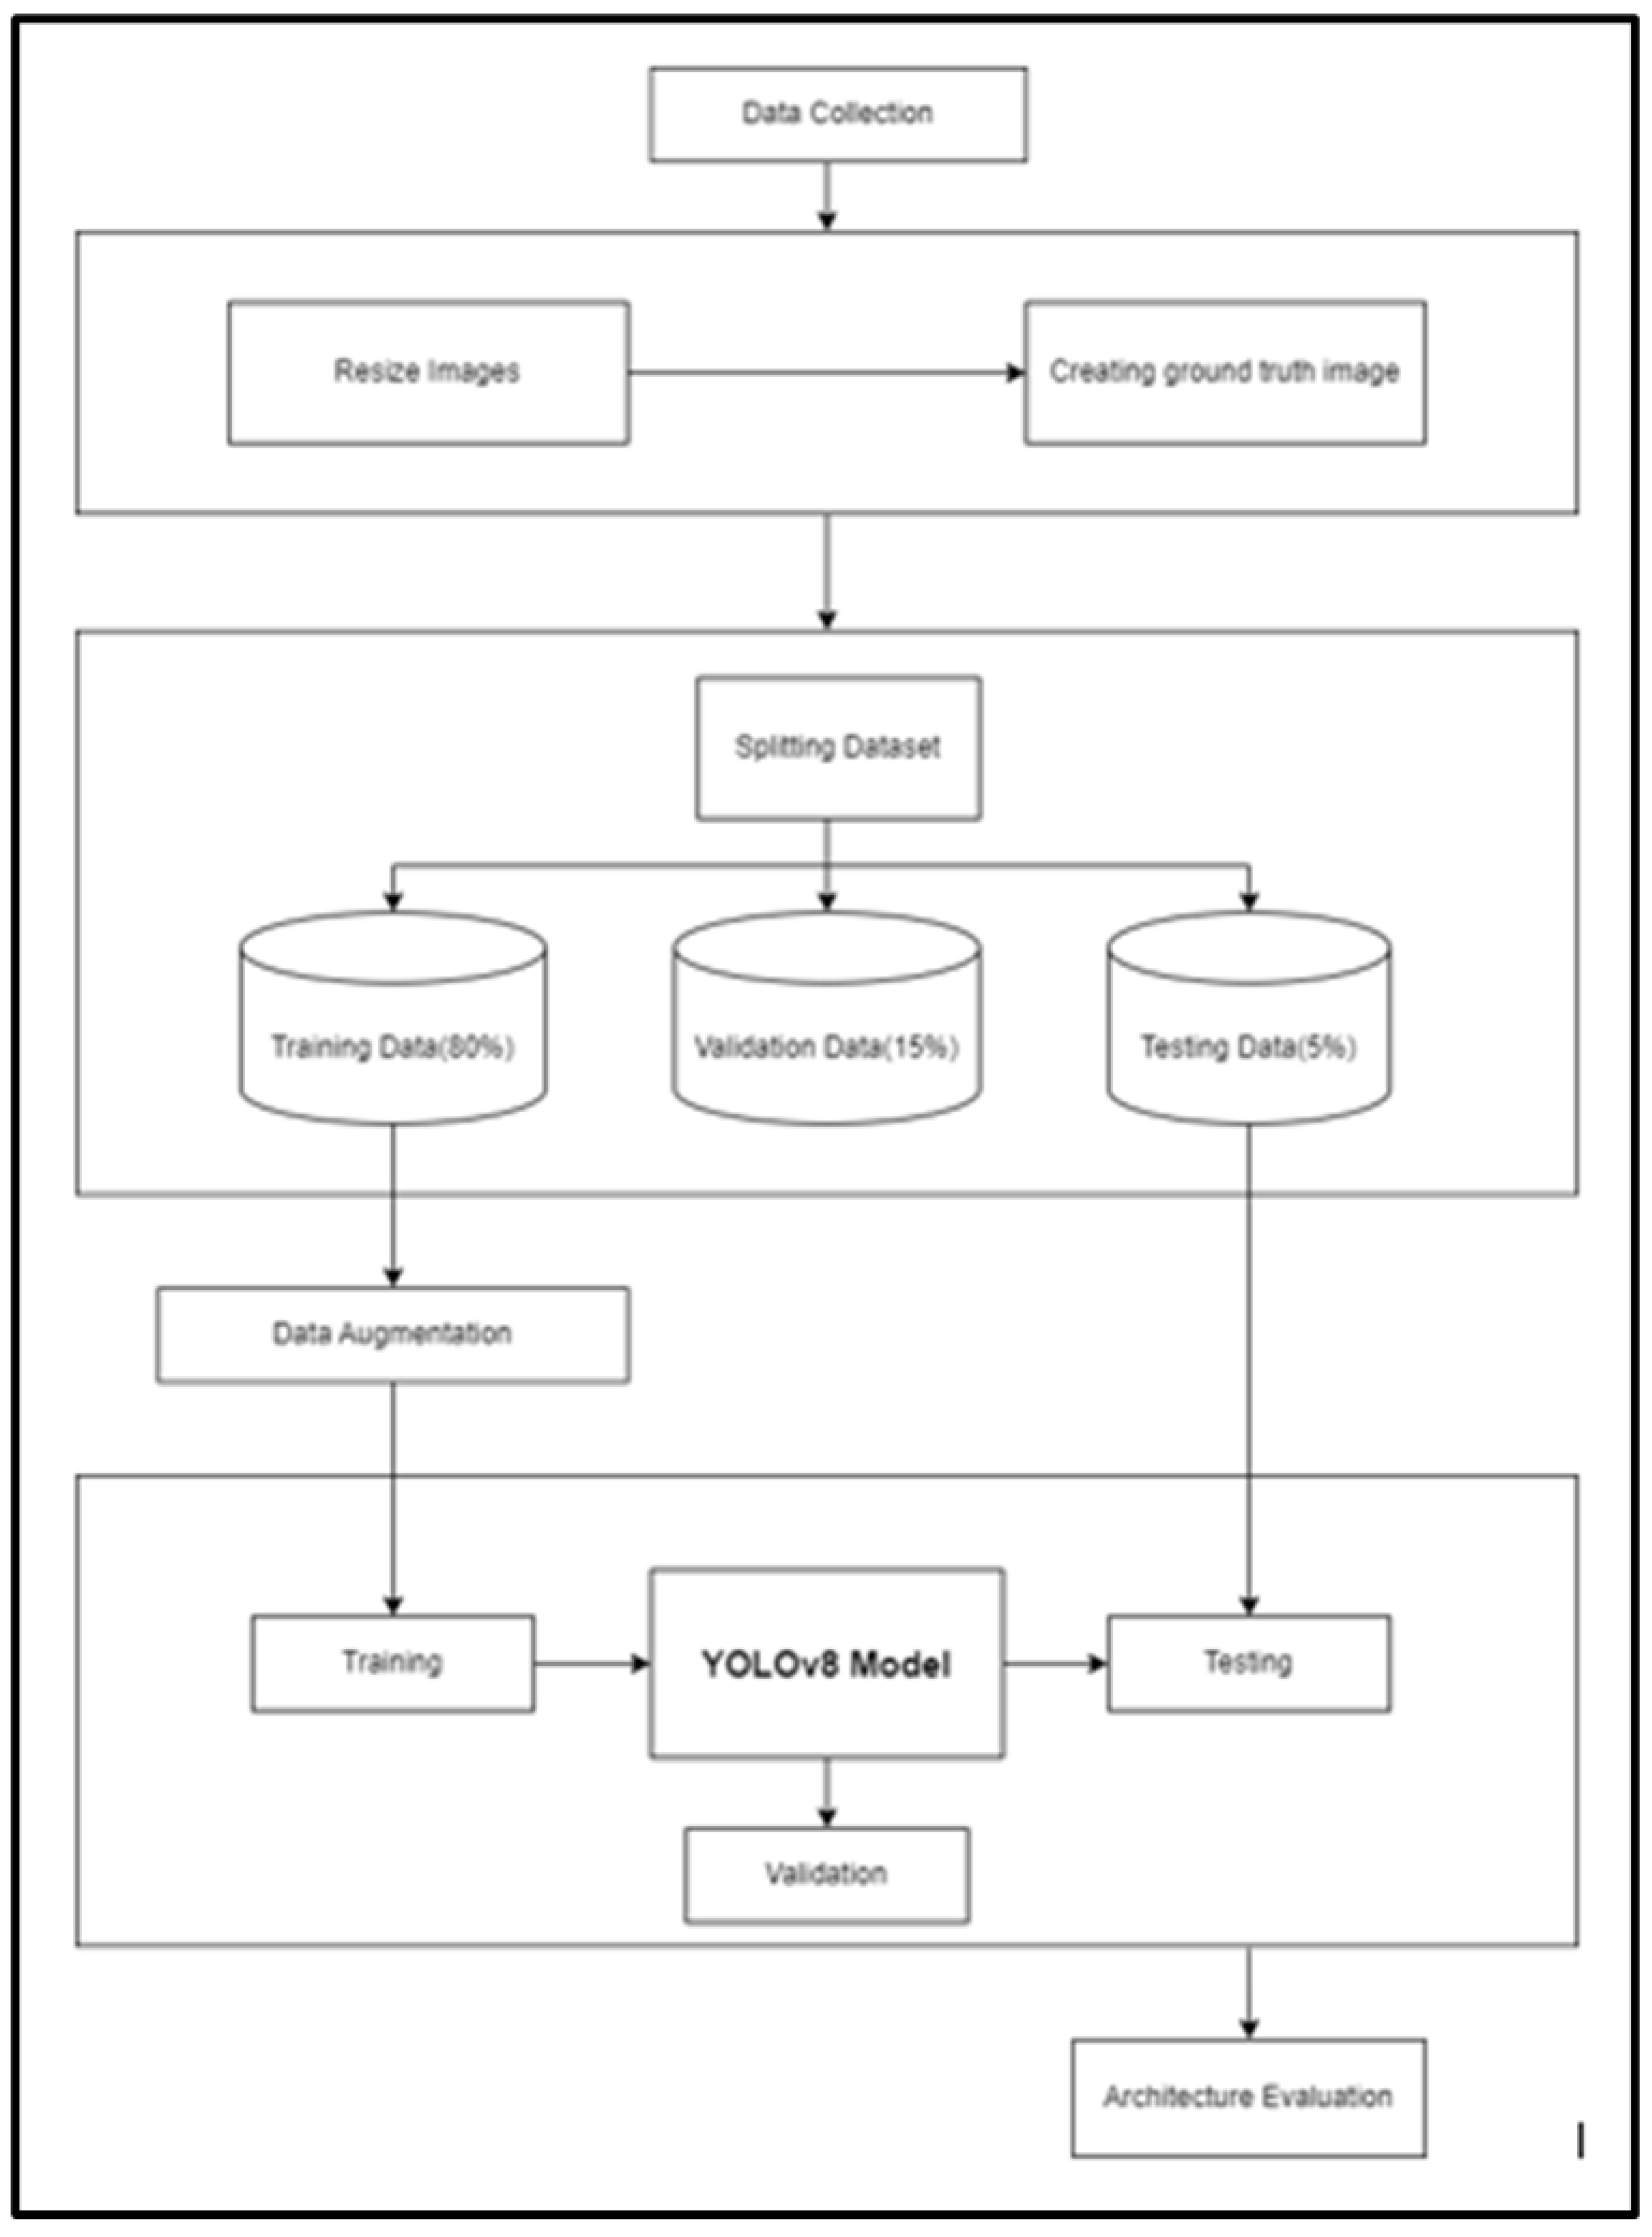
Figure 2.
Images with and without Augmentation.
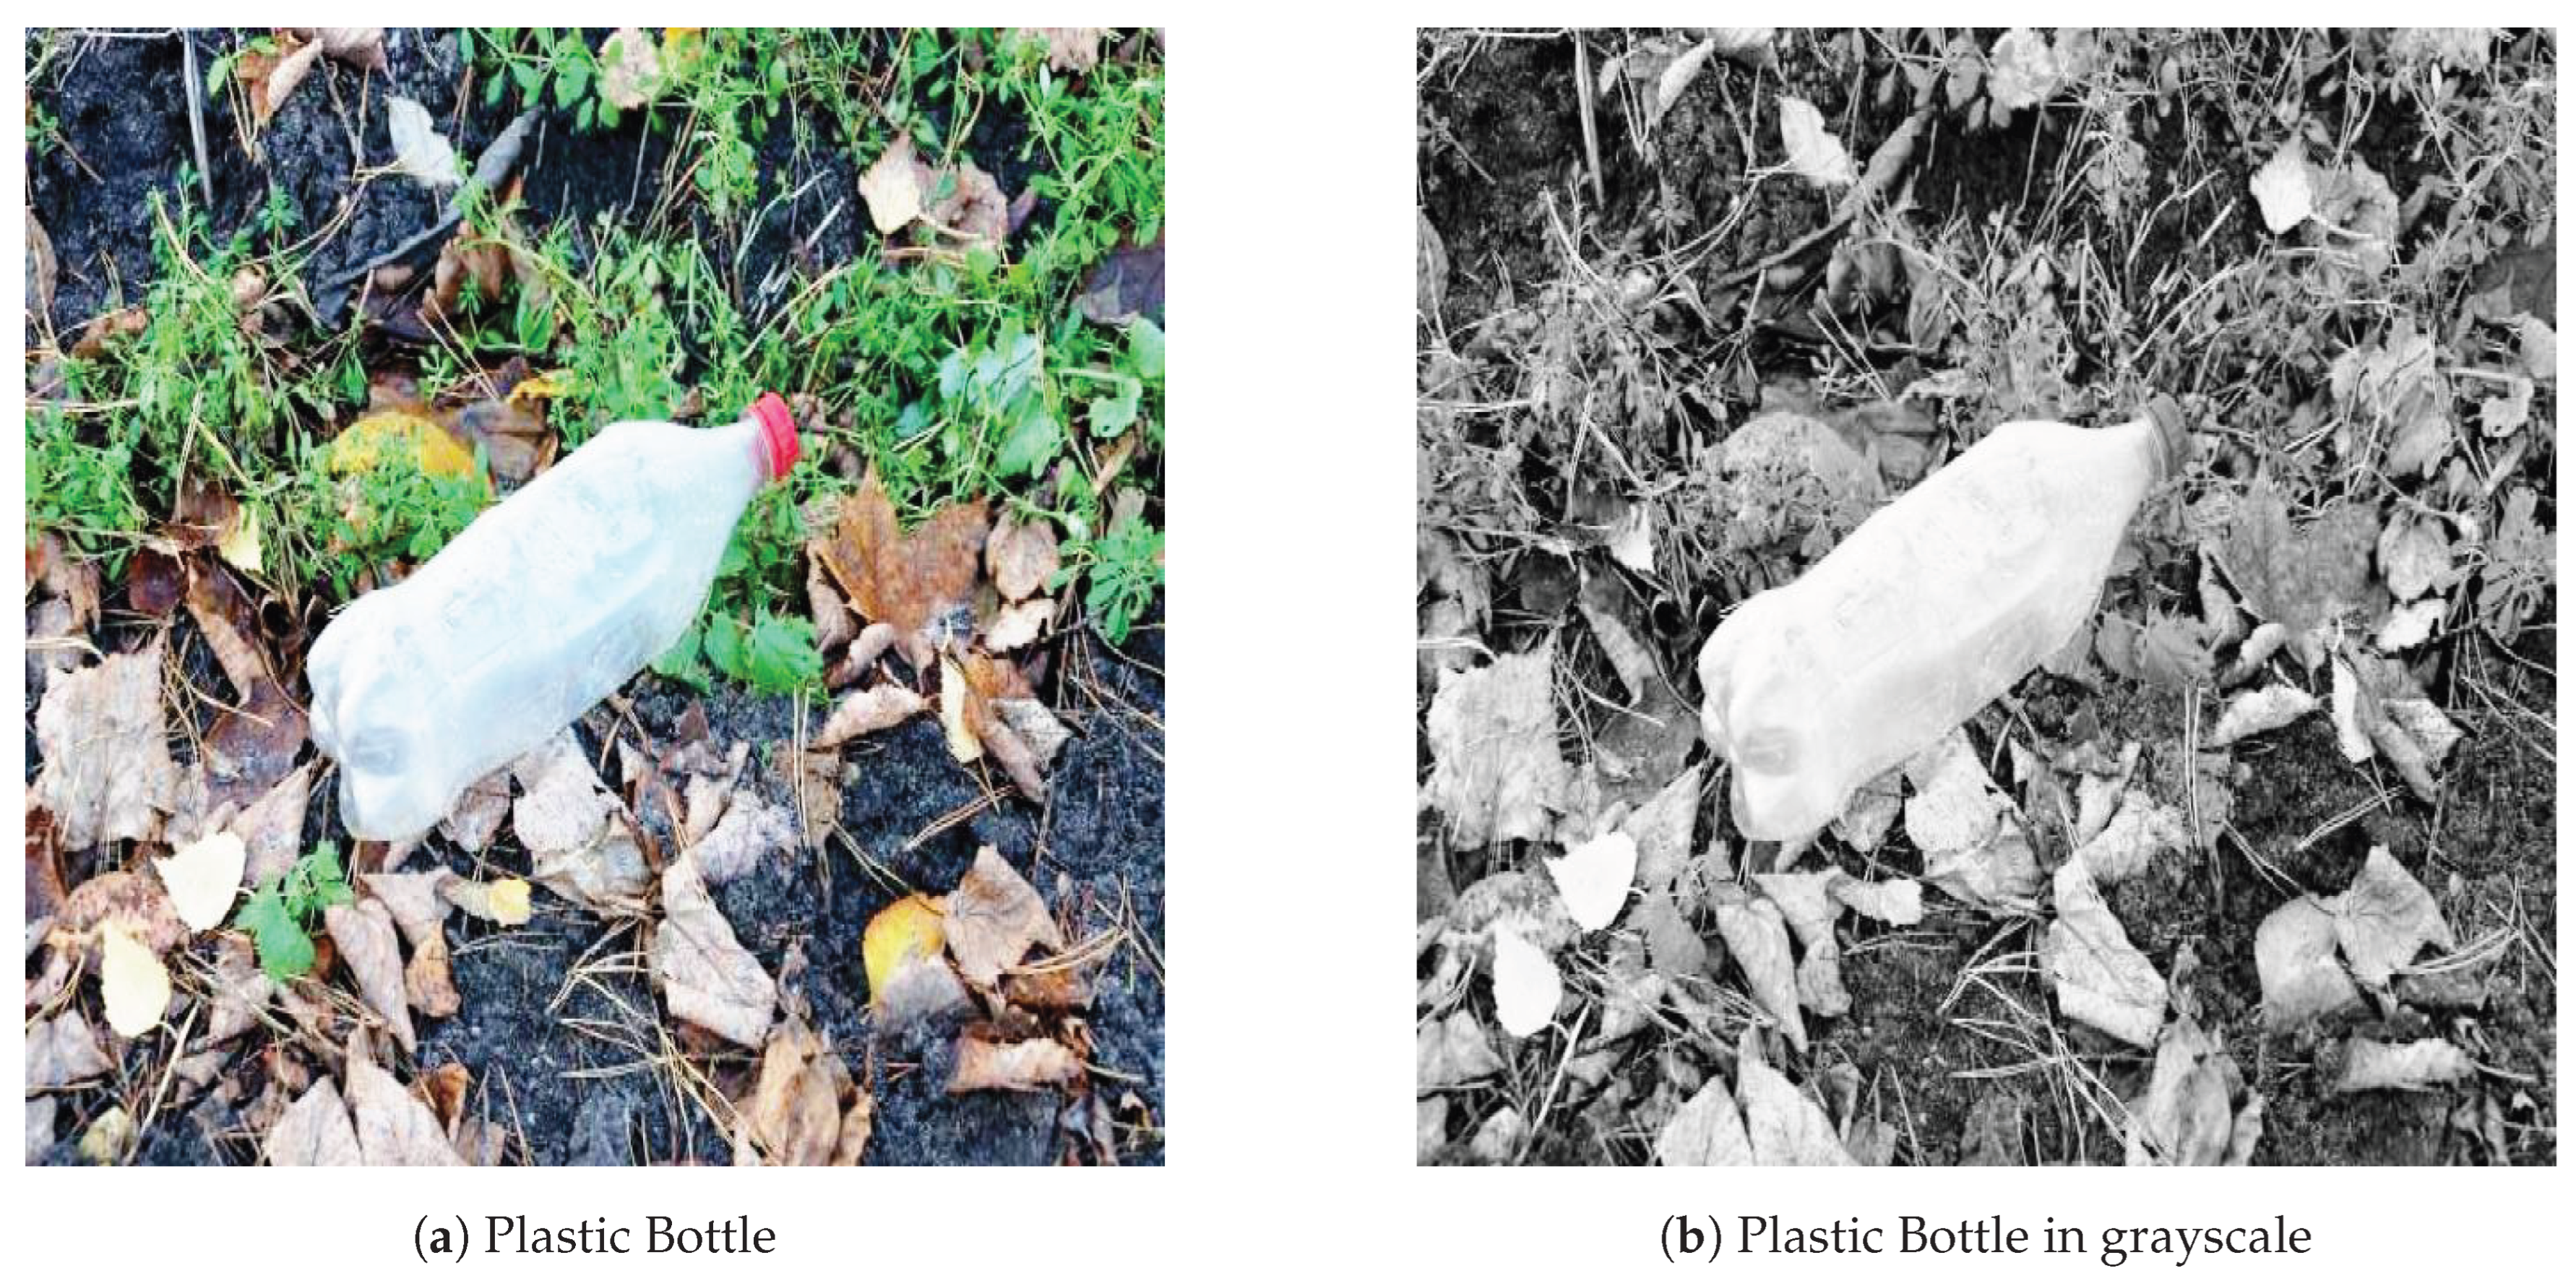
Figure 5.
YOLOv8 Architecture, visualisation made by GitHub user RangeKing
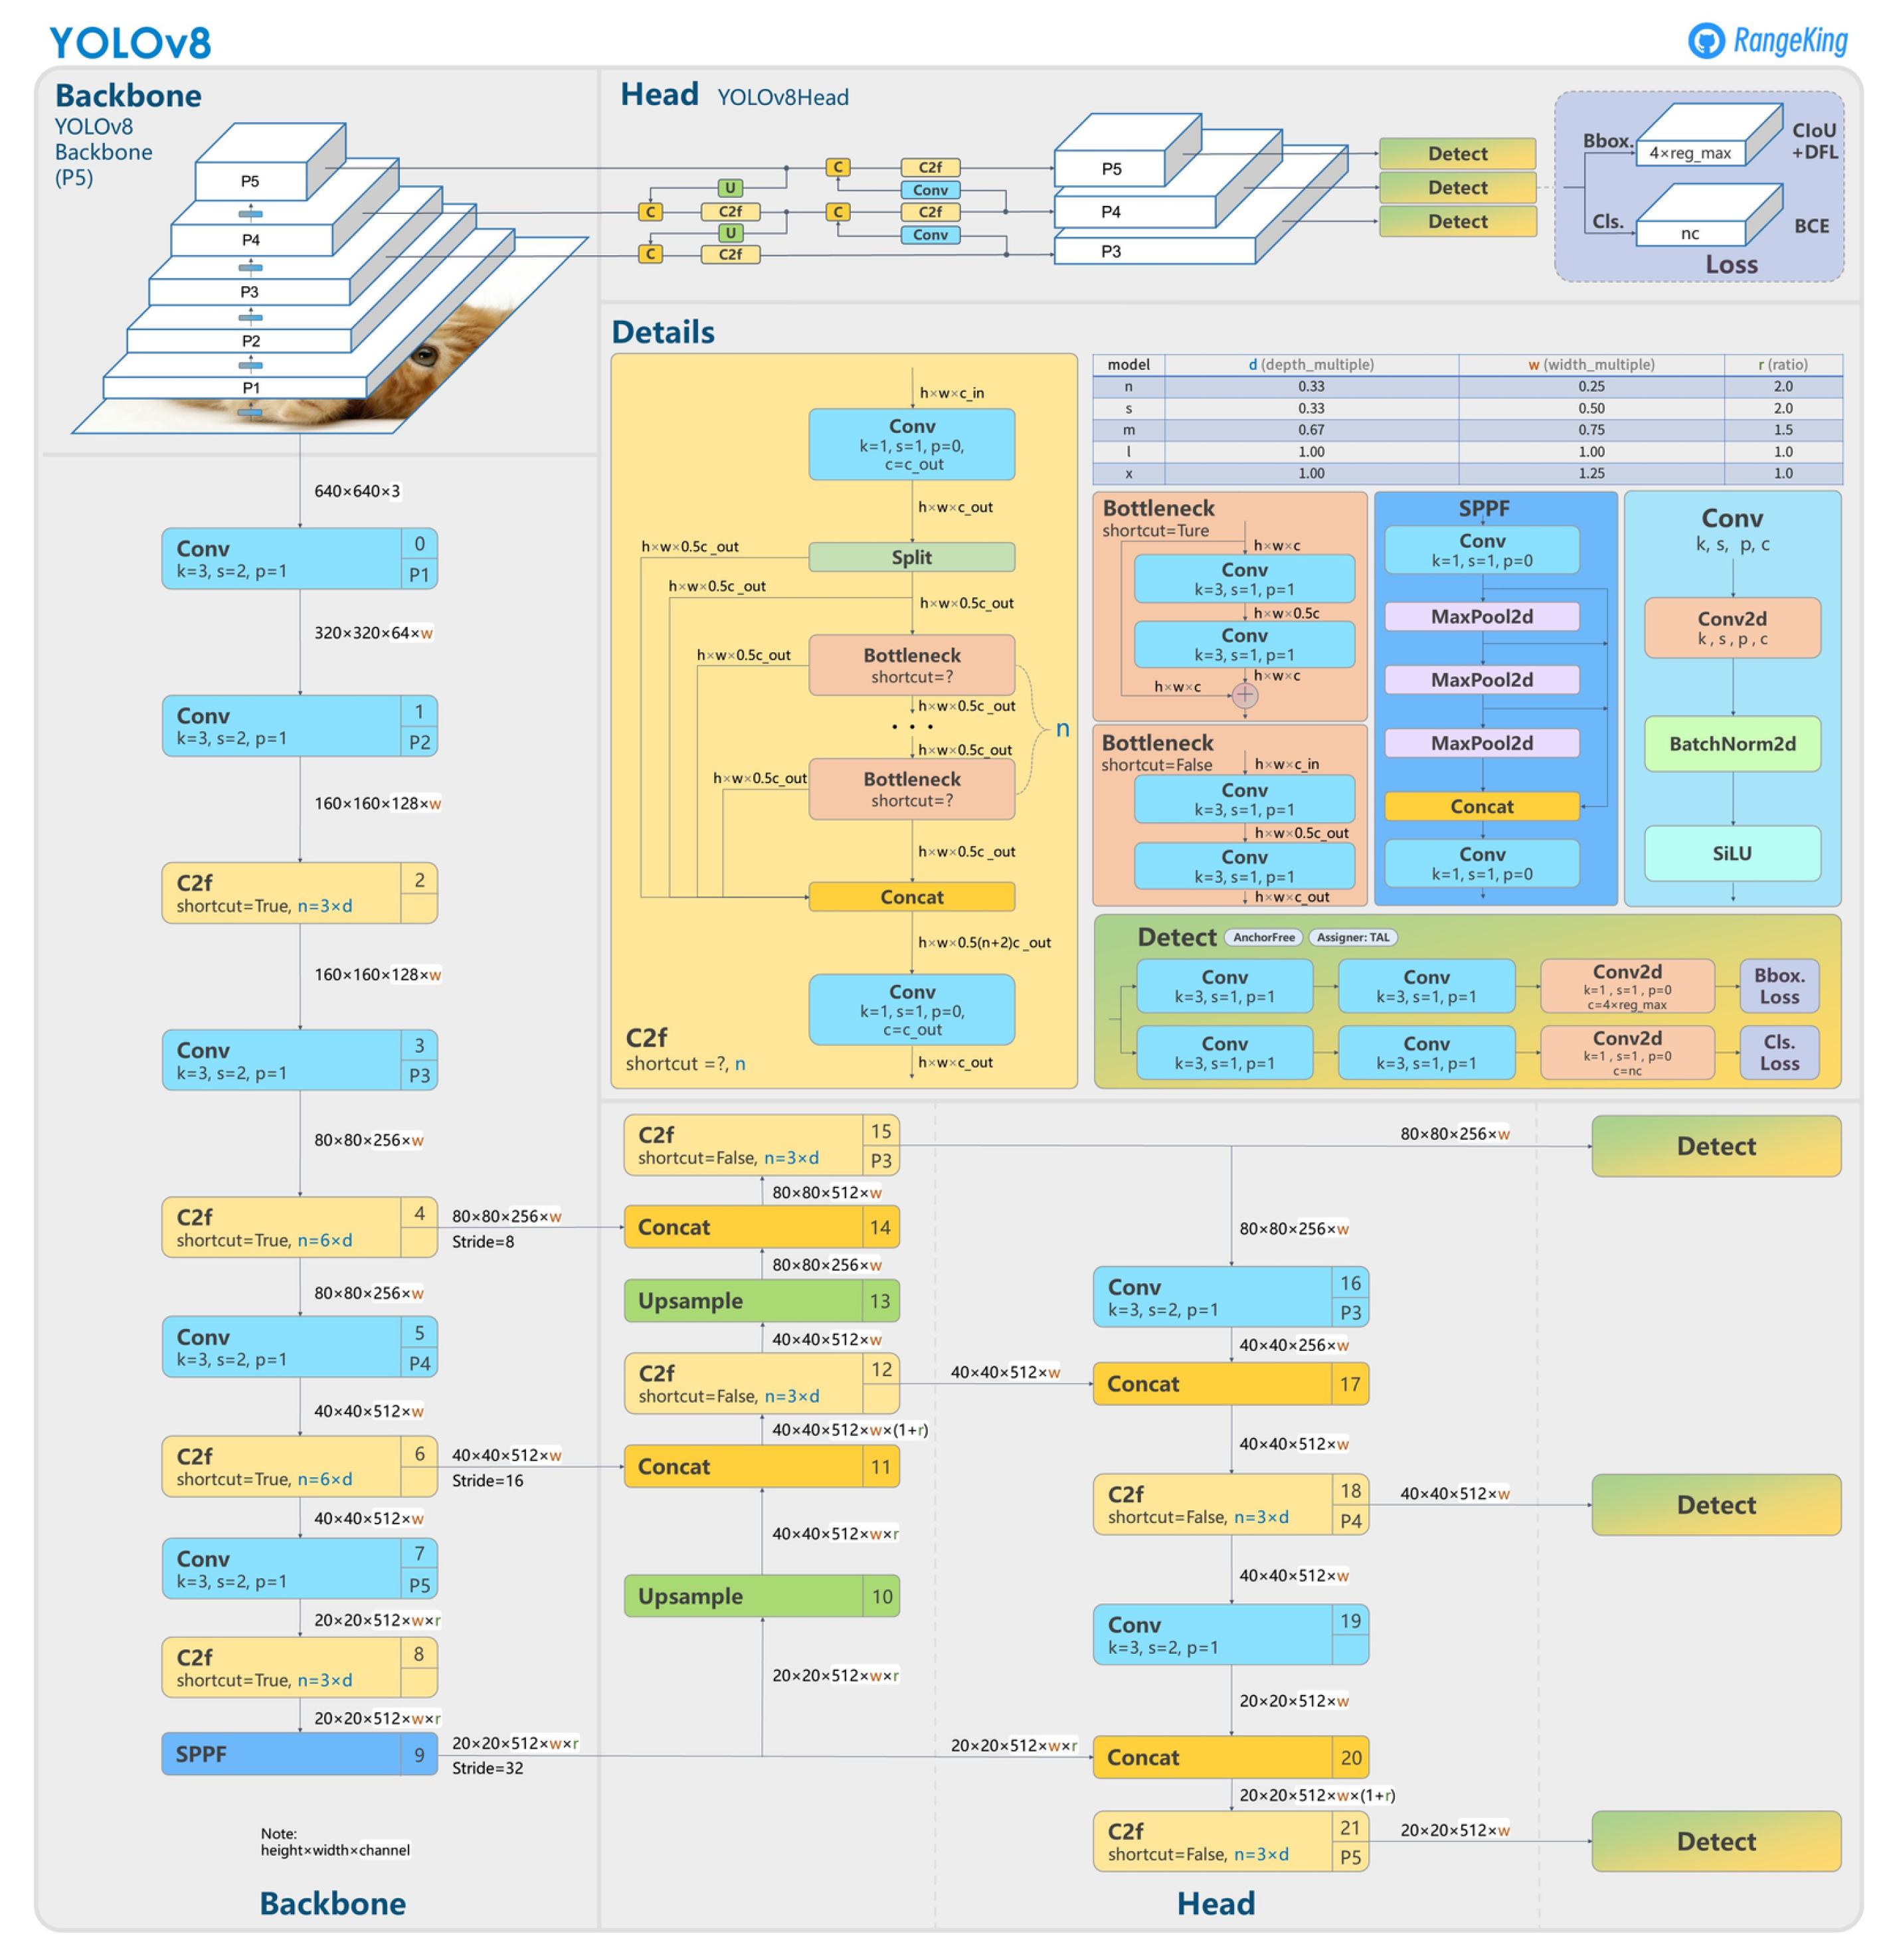
Figure 6.
Precision v/s Confidence
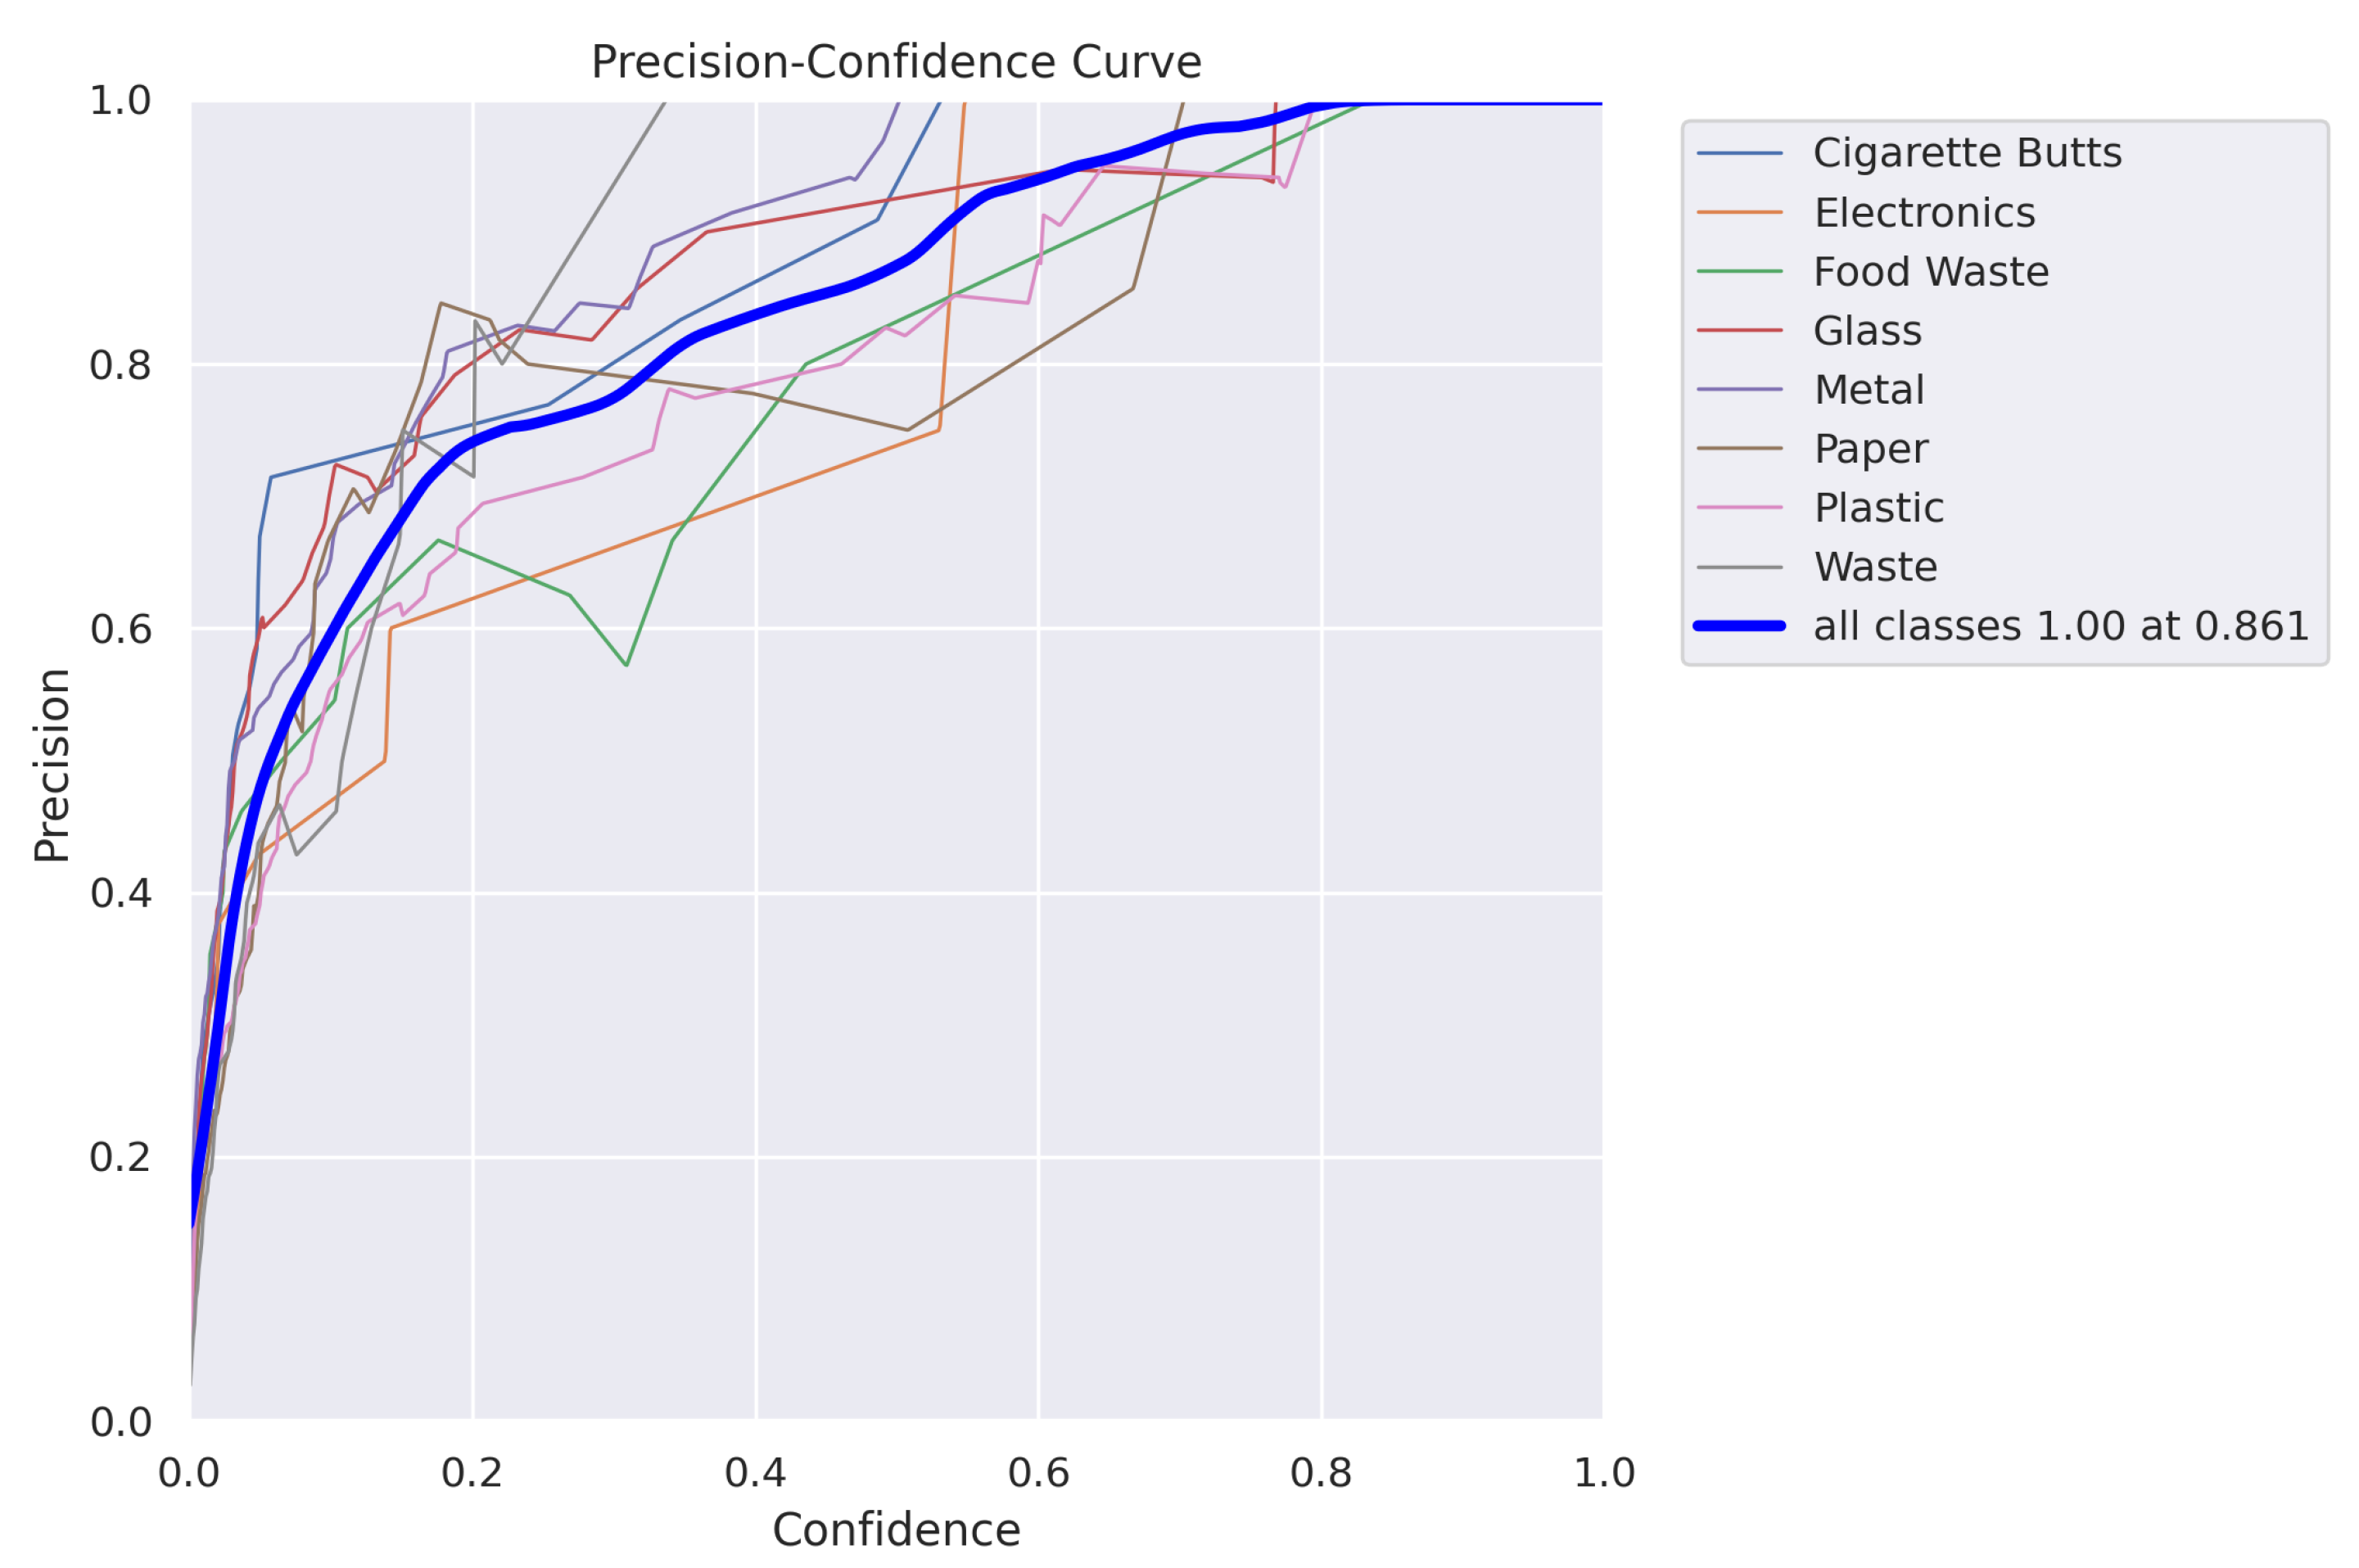
Figure 7.
Recall v/s Confidence
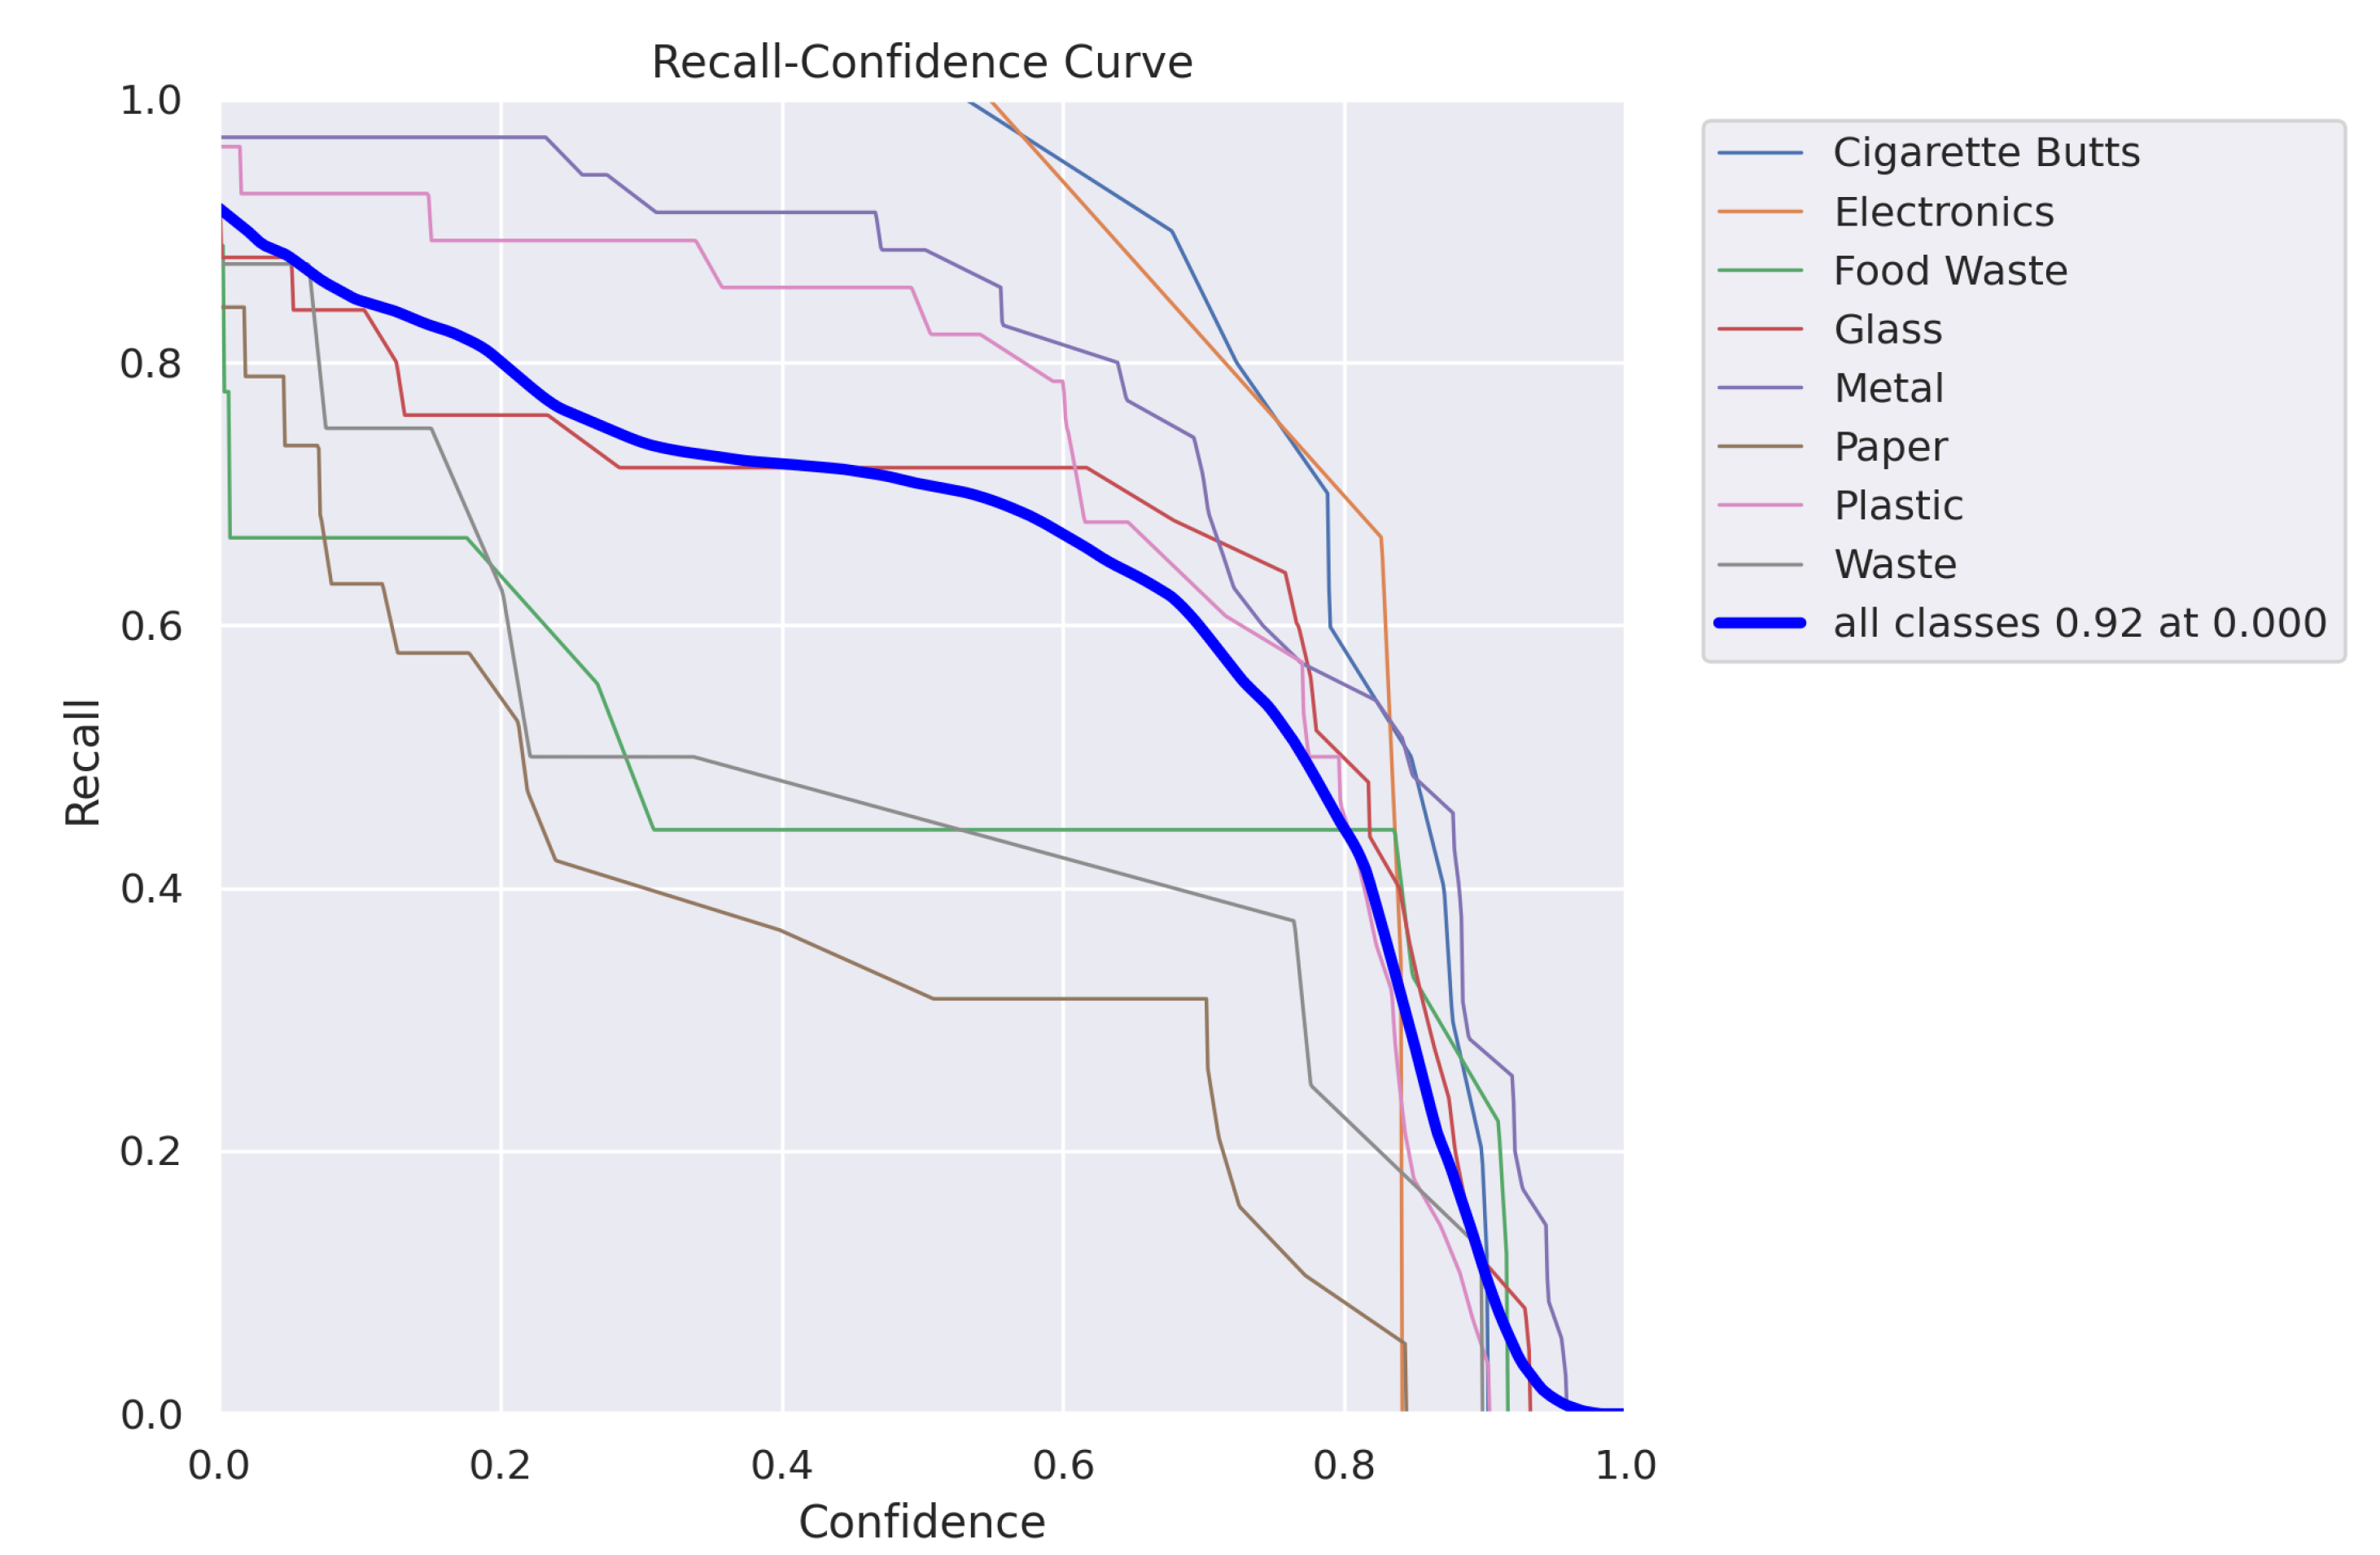
Figure 8.
PR-Curve
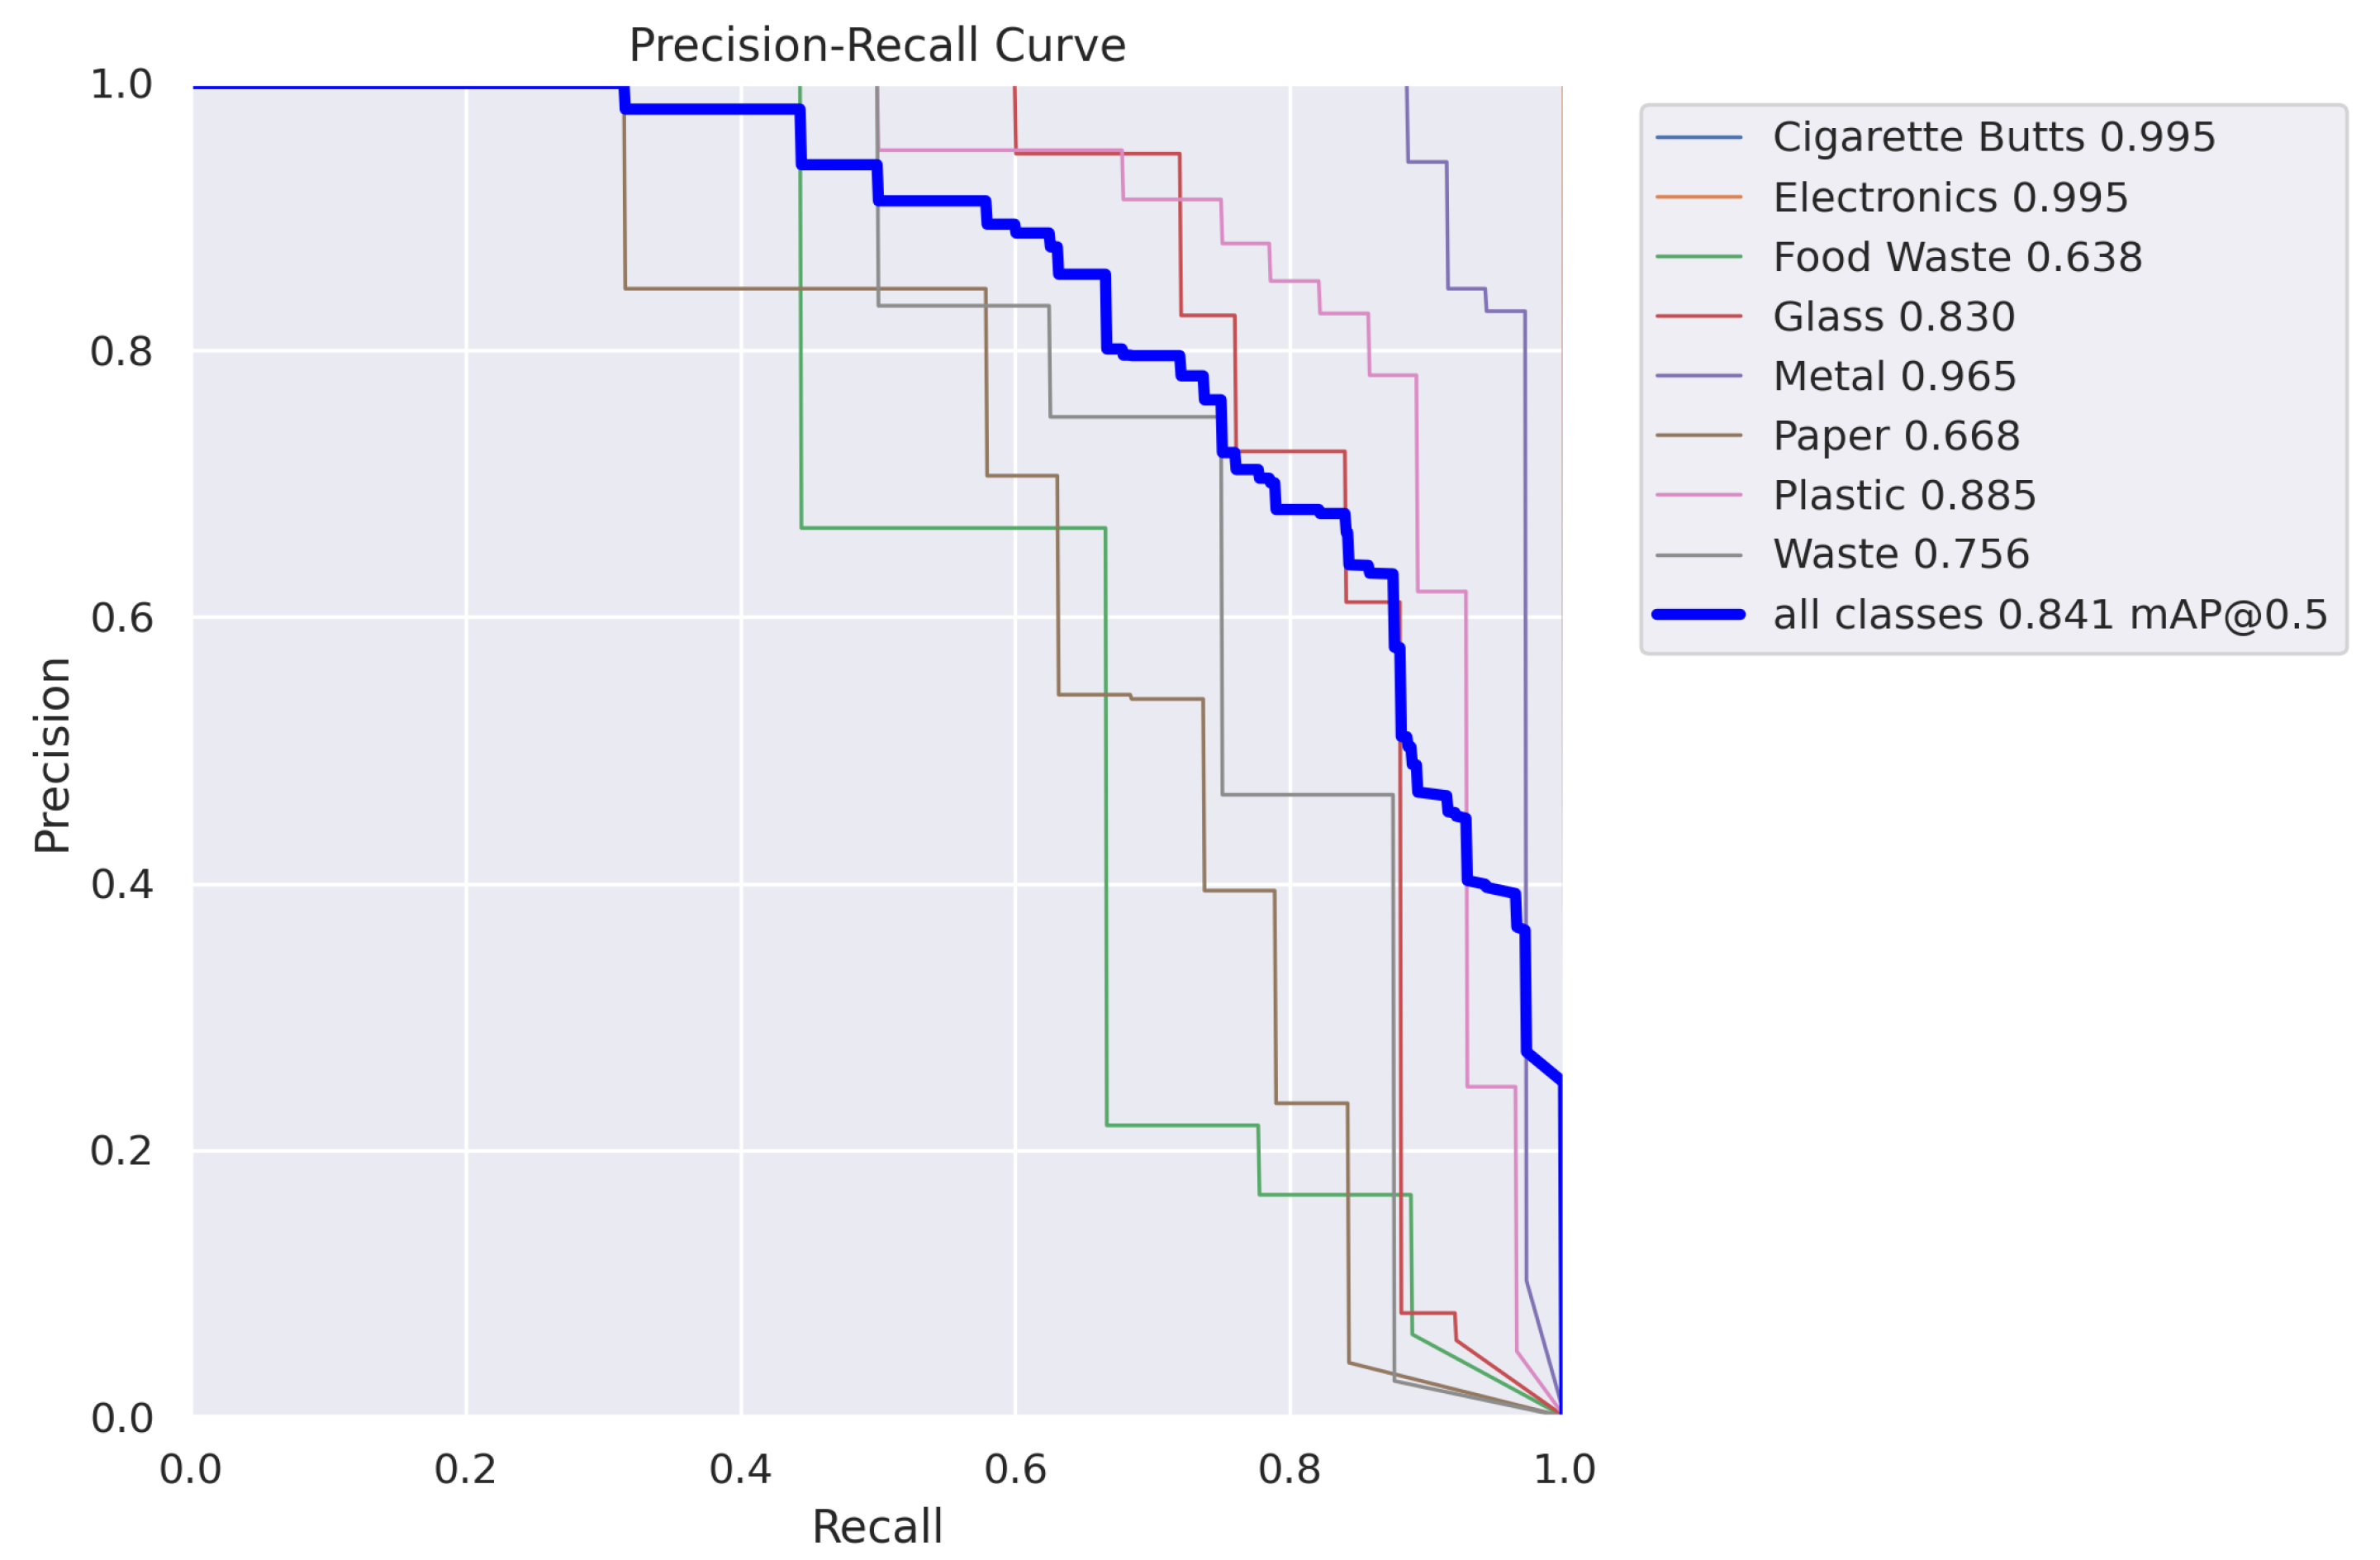
Figure 9.
Confusion Matrix
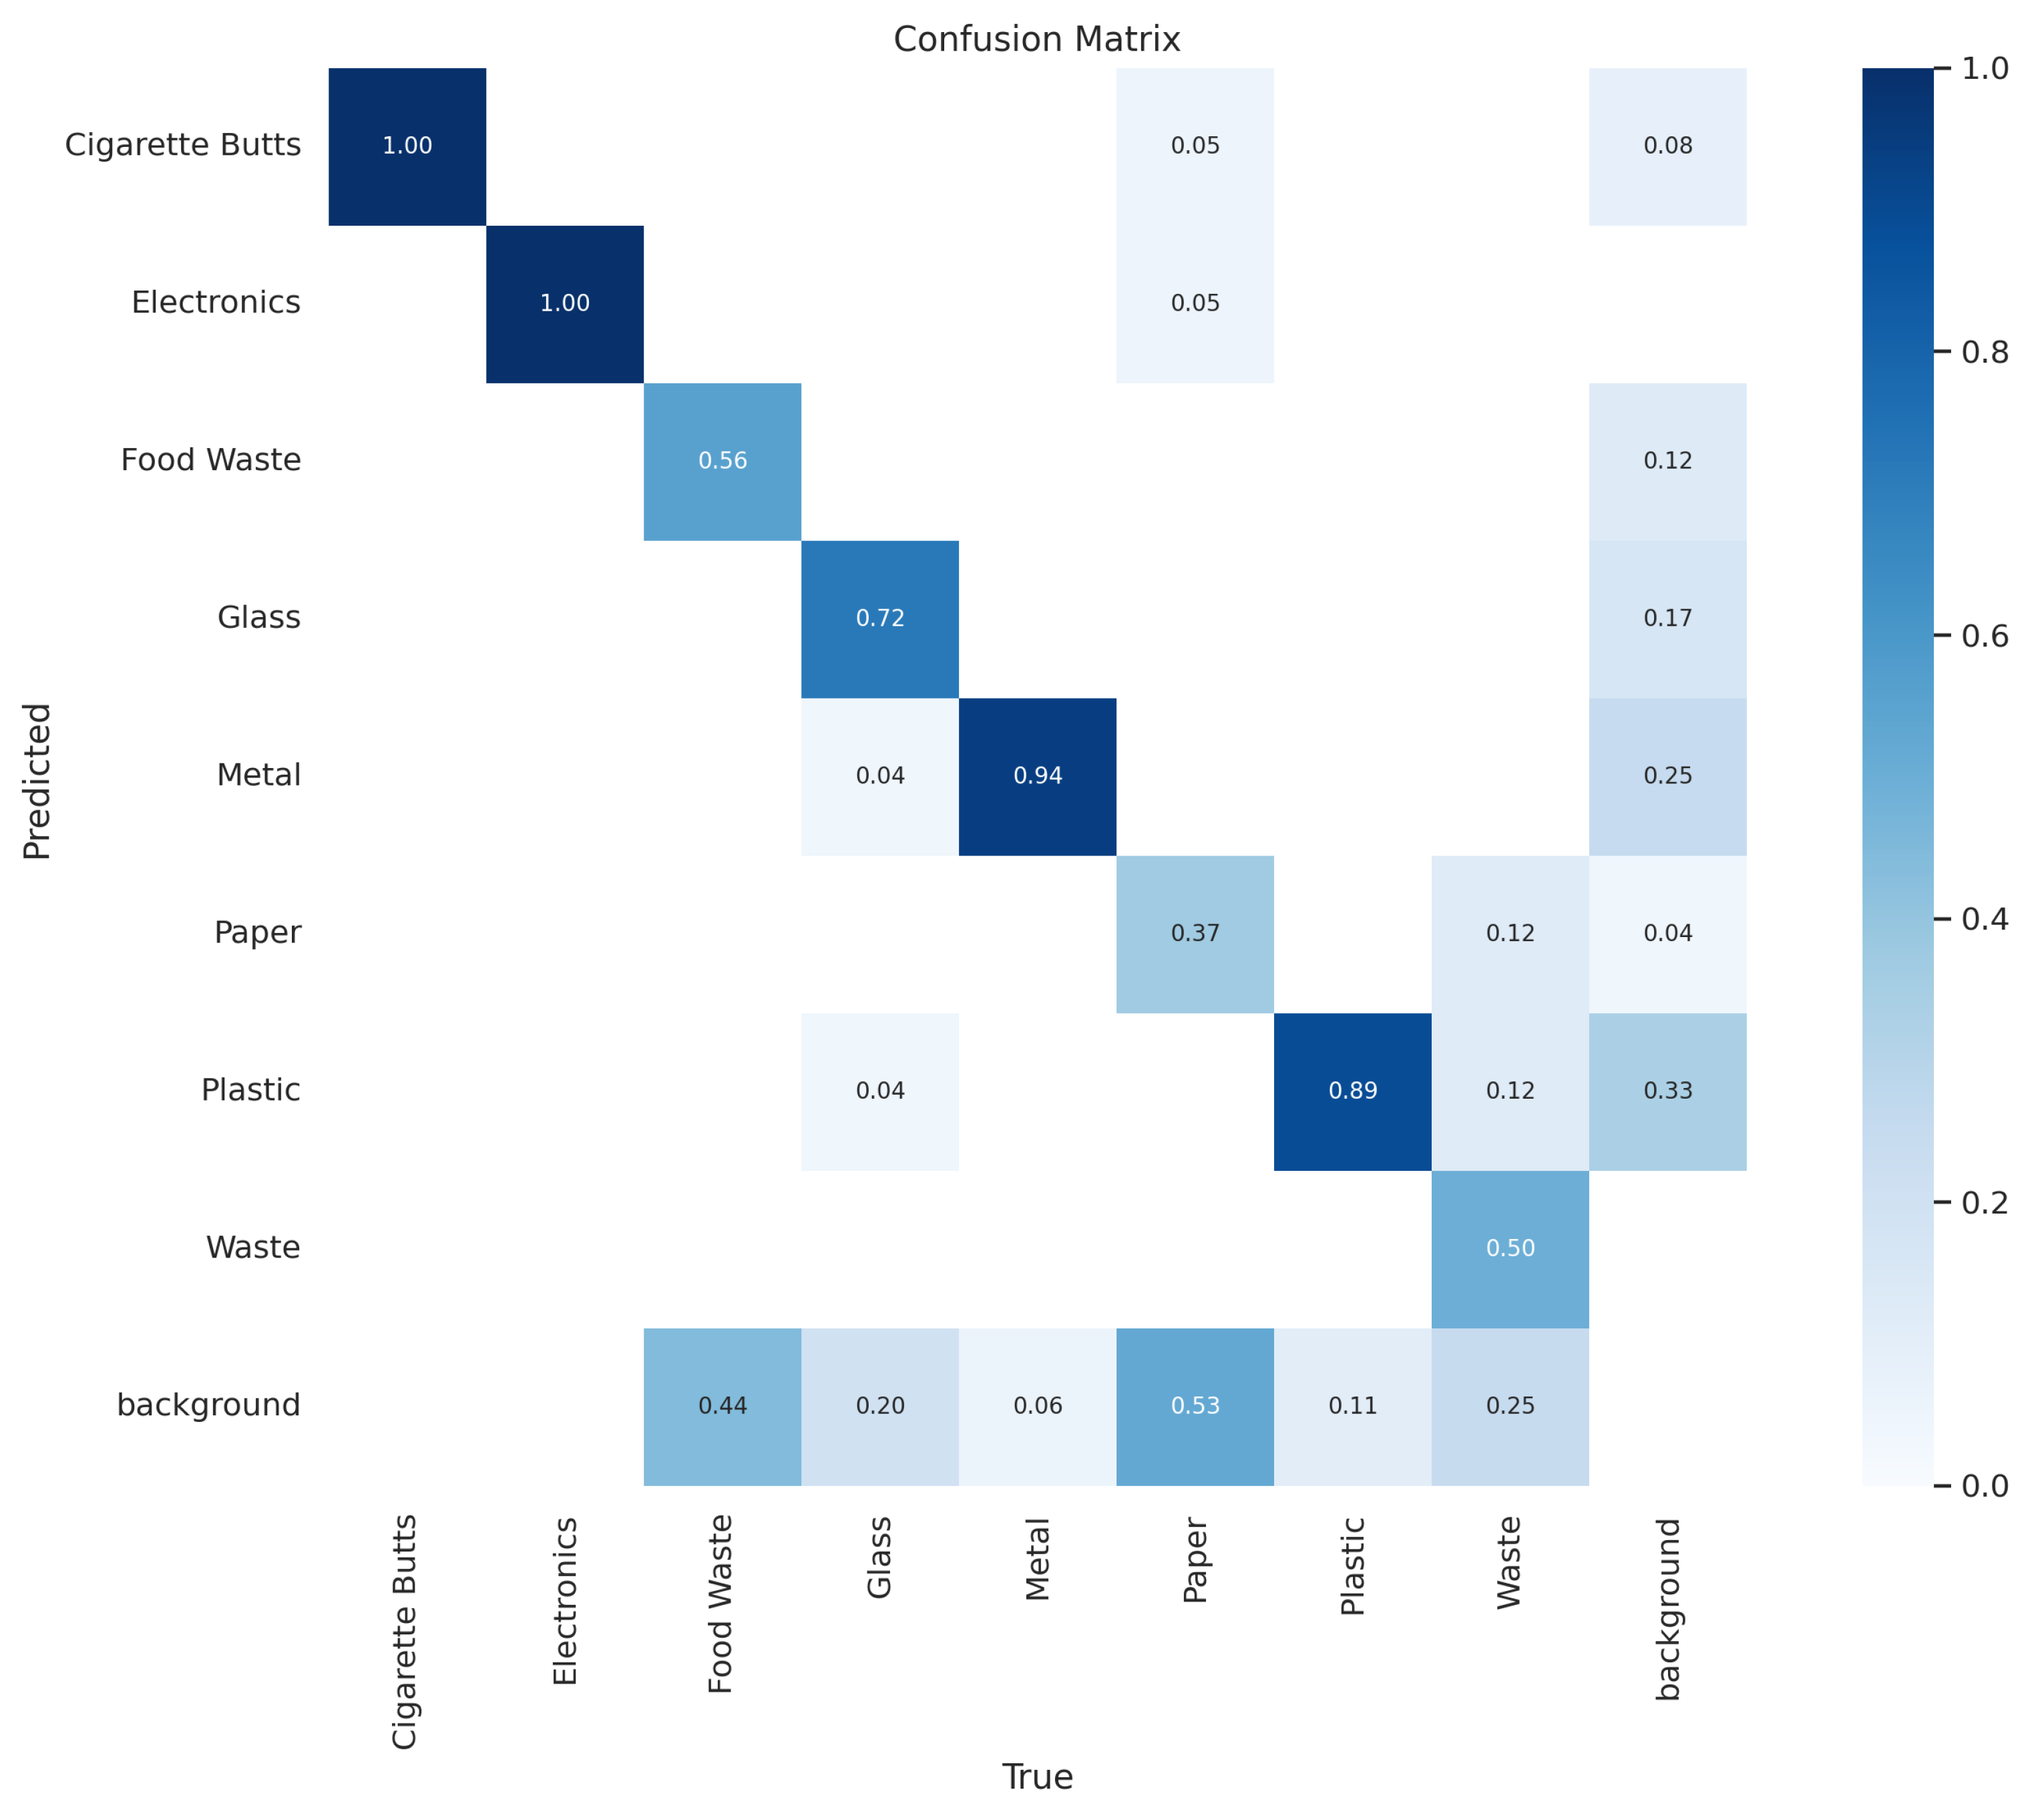
Figure 10.
Results of Model 4
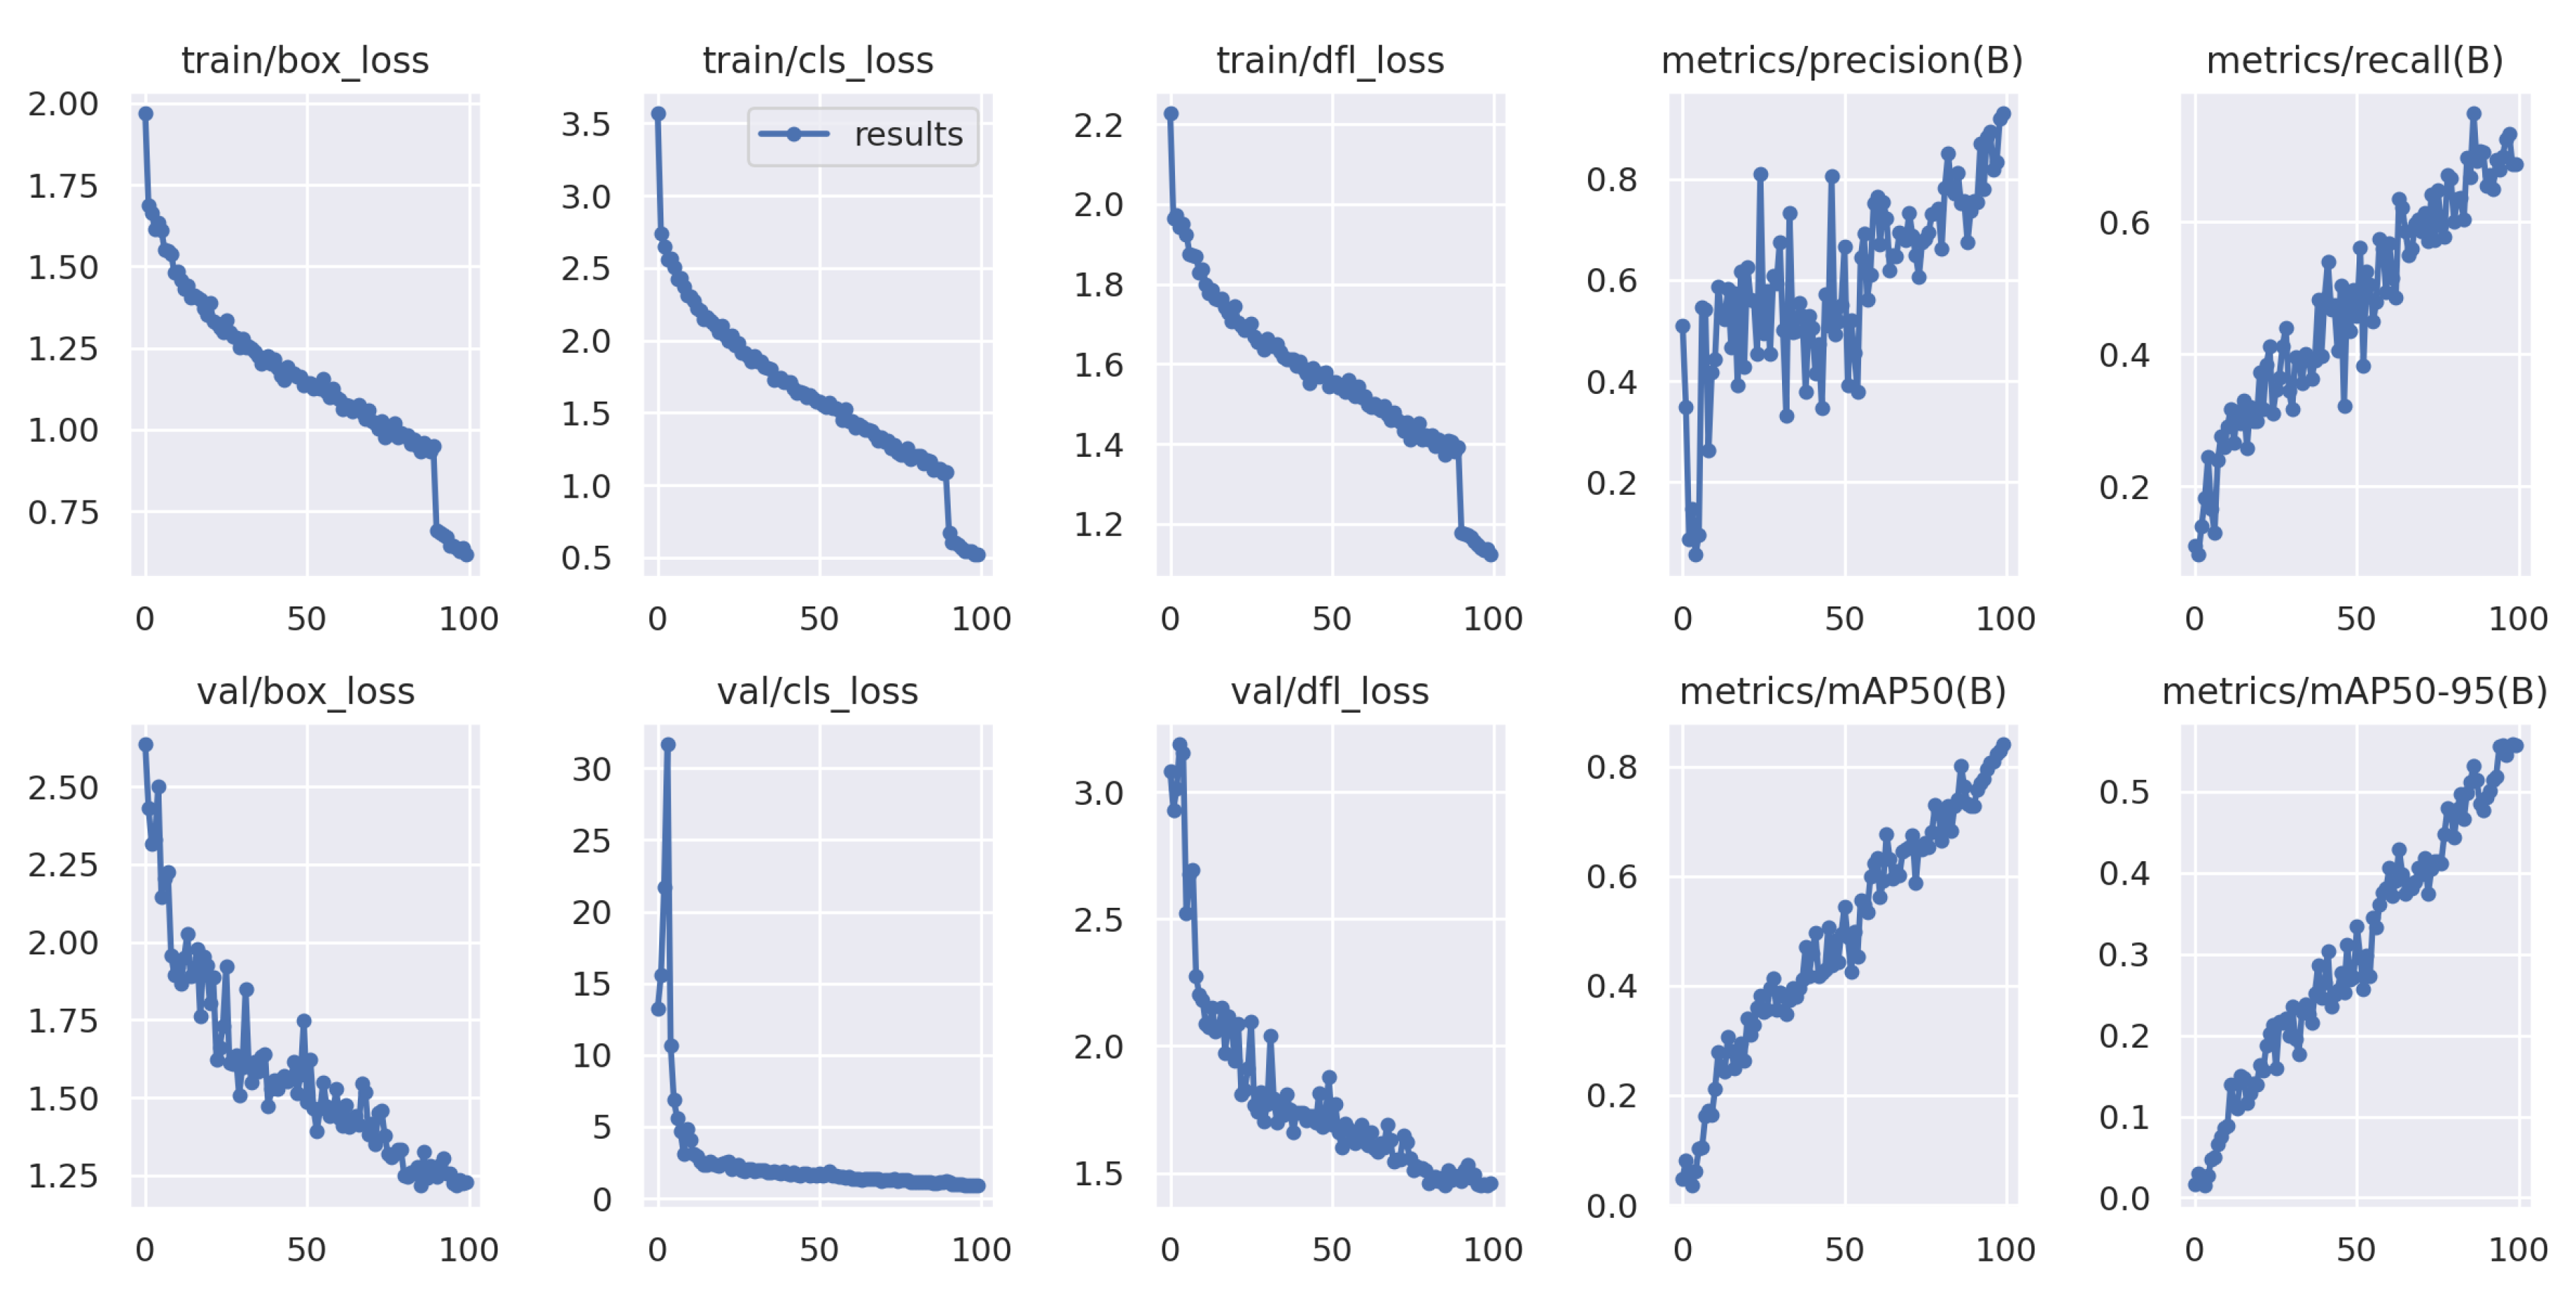

Table 1.
YOLOv8 Results.
| W/o Augmentation | With Augmentation | ||||
| Epochs | 50 | 100 | 50 | 100 | |
| Model | Model 1 | Model 2 | Model 3 | Model 4 | |
| mAP50 | 0.741 | 0.774 | 0.594 | 0.841 | |
| mAP50-95 | 0.544 | 0.555 | 0.406 | 0.557 | |
Table 2.
YOLOv5 Results.
| W/o Augmentation | With Augmentation | ||||
| Epochs | 50 | 100 | 50 | 100 | |
| Model | Model 5 | Model 6 | Model 7 | Model 8 | |
| mAP50 | 0.505 | 0.688 | 0.41 | 0.541 | |
| mAP50-95 | 0.338 | 0.491 | 0.212 | 0.328 | |
Table 3.
YOLOv8(Model 4) Results.
| Class | Precision | Recall | mAP50 | mAP50-95 |
| All | 0.93 | 0.687 | 0.841 | 0.557 |
| Cigarette Butts | 1 | 0.976 | 0.995 | 0.592 |
| Electronics | 1 | 0.979 | 0.995 | 0.764 |
| Food Waste | 0.865 | 0.444 | 0.638 | 0.434 |
| Glass | 0.938 | 0.72 | 0.83 | 0.602 |
| Metal | 1 | 0.825 | 0.965 | 0.684 |
| Paper | 0.789 | 0.316 | 0.668 | 0.35 |
| Plastic | 0.849 | 0.804 | 0.885 | 0.595 |
| Waste | 1 | 0.433 | 0.756 | 0.437 |
Disclaimer/Publisher’s Note: The statements, opinions and data contained in all publications are solely those of the individual author(s) and contributor(s) and not of MDPI and/or the editor(s). MDPI and/or the editor(s) disclaim responsibility for any injury to people or property resulting from any ideas, methods, instructions or products referred to in the content. |
© 2025 by the authors. Licensee MDPI, Basel, Switzerland. This article is an open access article distributed under the terms and conditions of the Creative Commons Attribution (CC BY) license (http://creativecommons.org/licenses/by/4.0/).
Copyright: This open access article is published under a Creative Commons CC BY 4.0 license, which permit the free download, distribution, and reuse, provided that the author and preprint are cited in any reuse.


