
Submitted:
01 February 2025
Posted:
04 February 2025
You are already at the latest version
Abstract
Despite the significant recycling potential, a massive generation of plastic waste is observed year after year. One of the causes of this phenomenon is the issue of ineffective waste stream sorting, primarily arising from the uncertainty in the composition of the waste stream. The recycling process cannot be carried out without proper separation of different types of plastics from the waste stream. Current solutions in the field of automated waste stream identification rely on small-scale datasets that insufficiently reflect real-world conditions. For this reason, the article proposes a real-time identification model based on CNN and a newly constructed, self-built dataset. The model was evaluated in two stages. The first stage was based on the separated validation dataset, and the second on the developed test bench, a replica of the real system. The model was evaluated under laboratory conditions, with a strong emphasis on maximally reflecting real-world conditions. Once included in the sensor fusion, the proposed approach will provide full information on the characteristics of the waste stream, which will ultimately enable efficient separation of plastic from the mixed stream.
Keywords:
waste sorting
; plastic waste
; recycling
; circular economy
; sustainability
; automatic waste classification
; waste identification
; waste management
1. Introduction
Despite being in use for over a century, the global production and consumption of plastics are still increasing exponentially [1]. This ultimately contributes to the massive generation of plastic waste, which raises many environmental concerns associated with prolonged degradation time. However, it is possible to significantly reduce the negative environmental impacts by utilizing plastic's recycling potential, allowing for multiple recycling cycles while preserving its original value and functionality [2]. For recycling to be feasible, a crucial preliminary action is the efficient sorting of collected waste [3] to separate different types of plastics for further processing. Despite the availability of numerous advanced technologies designed to support this process[4,5], successful waste sorting remains a complex and demanding task due to unresolved issues related to the inherent uncertainty of the waste stream.
Solid waste stream indicates high heterogeneity and variability in composition [6]. These attributes are consistently identified as key factors contributing to the challenges in optimizing waste sorting processes aimed at maximizing the recovery of recyclable materials [7]. The primary challenge lies in identifying the composition of the stream, which consists of a wide variety of materials. For this reason, numerous studies have been published in recent years reviewing this issue. A summary of such publications highlighting the key conclusions and limitations of existing developments is presented in Table 1.
In [3], more than fifty studies were reviewed to identify the physical enablers, datasets, and machine learning algorithms used for waste identification in indirect separation systems. A broader coverage is included in [8], where almost two hundred papers were analyzed over a 20-year period on the subject of optical sensors and machine learning algorithms for sensor-based material flow characterization. Similarly, [10] reviewed over two hundred studies that used Machine Learning algorithms for municipal solid waste management, including automatic stream identification. In [9], an extensive review was presented addressing the development trajectory, current state, and future opportunities and challenges of utilizing computer vision for waste sorting. In another [11], commonly utilized sensor-based technologies for solid waste sorting, including spectroscopic- and computer vision-based classification, can be found. It should be noted that all these review publications from the past few years highlight similar limitations of existing solutions for automated waste stream identification. The most frequently reported limitations across all studies include testing under controlled laboratory conditions and challenges arising from using small-scale datasets, such as failure to account for waste diversity or insufficient generalization of models. On the one hand, this highlights the necessity of developing large-scale datasets that account for the specific characteristics of waste originating from different regions. On the other hand, laboratory conditions should be adjusted to replicate real-world scenarios strongly.
Automatic waste stream identification requires real-time, rapid detection of multiple objects within a single frame, accounting for variations in size and orientation. In recent years, convolutional neural networks (CNNs) have been widely employed for automated waste detection and classification, with the YOLO series being one of the most commonly utilized frameworks [13]. Table 2 summarizes recent publications on automatic waste identification using YOLO.
In [14] an improved YOLOv5 model was proposed considering the requirements of construction waste i.e., small object detection and inter-object occlusion. Household waste was subjected to automatic detection and classification in [15,19,20], where self-made datasets were used to train and validate YOLO models. Among studies of this type, the issue of detecting river floating waste can also be found [18]. Plastic waste is also the subject of research. However, it is typically limited to only four [16] or two types [17] of plastics. The analysis of the summary presented in Table 2 reveals three significant limitations. As already highlighted by review articles, a recurring constraint in many studies is that model testing is conducted under laboratory conditions. Most studies evaluate the model by partitioning a portion of the utilized dataset (what has been referred to as static validation), where waste remains stationary during testing. Only in [17] was dynamic validation performed, in which waste moved along a conveyor belt. However, the detection was limited to only PET and PET-G classes. Another limitation concerns the omission of contaminants present in the waste stream, which should serve as the background of the prepared samples rather than being the target of detection. This approach was implemented only in [14,20], where access to recordings from a real-world system was available. The final observed limitation is the low level of detail in the classification of plastic waste. Plastic is most commonly treated as a single class or, at best, divided into a maximum of four classes without distinguishing, for instance, different colors of PET, which is crucial from a recycling perspective.
Considering the identified limitations, this paper aims to develop a model for the automatic identification of plastic waste streams that takes into account the requirements of real-world waste sorting facilities, such as the presence of contaminants and the transportation of waste on a conveyor belt with variable speed. Due to the drawbacks of publicly available datasets, the model will incorporate a preparation process of the dataset. Additionally, the model will be based on CNNs, as they have achieved the best results in image classification in recent years. The main contributions of our paper are the following:
- We based the YOLO model training process on a self-build dataset consisting of over 4,000 images of waste, including contamination.
- We have distinguished six classes reflecting the most commonly separated types of plastic, i.e., blue PET, white PET, green PET, HDPE, tetrapak, and, in addition to plastic, aluminum waste.
- We developed a set of recommendations for dataset creation aimed at automatic waste identification.
- We have applied a combination of three YOLO models to the multi-class waste classification issue.
The model validation was conducted in a laboratory environment using a test setup and waste samples designed to closely replicate real-world conditions, with waste moving on a conveyor and being detected in real-time by a camera.
2. Materials and Methods
The considered automatic waste stream identification is part of an ongoing project funded by the National Centre for Research and Development, entitled “Cyber-physical waste stream control system”. The project aims to develop a cyber-physical control system for municipal waste sorting, i.e. a Digital Twin of a waste sorting system. The structure of the Digital Twin consists of three fundamental components: the physical system, its digital replica, and a bidirectional link connecting the two [21]. A detailed description of the indicated elements and the Digital Twin framework for waste sorting systems are presented in [22]. The foundation of the Digital Twin's operation is the automatic collection of data from the real-world system. Automatic identification of waste stream is therefore one of the key components of the data collection and control layer. The scope of this publication can thus be placed in the Digital Twin framework, as shown in Figure 1.
Based on the results of the literature review, waste characterization, and stream monitoring requirements, the automatic identification of the stream was developed using CNN, specifically the YOLOv5 model.
2.1. Automatic Waste Identification Model Based on YOLOv5
The YOLO series are CNN-based frameworks commonly used in object detection and classification, including waste detection. Its three core components include backbone, neck and head. The backbone, a convolutional neural network, encodes image data into multi-scale feature maps. These maps are then refined by the neck, which consists of layers that enhance and integrate feature representations. Finally, the head module utilizes the processed features to predict object bounding boxes and class labels [23]. The general architecture of YOLOv5 is shown in Figure 2.
The automated waste stream identification model proposed in this paper is based on YOLOv5. Due to the complexity of detecting multiple waste classes and based on the results of our preliminary studies, we employed a combination of three YOLO models. Instead of burdening a single model with all the classes, the division into smaller models allows focusing on a smaller set of classes in each case. This approach enables more precise tailoring of the model to the specific characteristics of the waste. Such a strategy significantly improves detection accuracy and prevents situations where a single model might struggle to distinguish very similar classes. The use of three models allows for more accurate differentiation between classes, which is crucial in the context of waste sorting. Initially, the image is processed by two parallel models (1a and 1b). Each of them detects the same four waste classes (PET, HDPE, tetrapak, and Al), but these models are parameterized differently in terms of confidence score so that one focuses on PET, tetrapak, and Al, while the other focuses on the HDPE class. The other classes are ignored in both models. In the case of detecting the PET class, the output from model 1a is further processed by model 2, which assigns one of three colors to this class: blue, white, or green. The architecture of the proposed model is illustrated in Figure 3.
2.2. Dataset Preparation
A large-scale dataset including many plastic waste images of different types should be implemented in detection and classification models. There are several publicly available datasets with waste images, but they are insufficient for advanced sorting systems. Indeed, effective detection and classification of waste moving along the conveyor requires considering factors such as piling of waste, high irregularity of shapes or presence of contaminants that are not subjected to sorting. The development of a new complex dataset is the first major action needed when considering the problem of automatic waste identification. In the case of self-build datasets, the procedure for their creation is typically described only briefly in publications. Since the dataset significantly impacts both the learning efficiency and the subsequent performance of the model in a real-world system, this study presents the sequential steps required for the development of a self-build dataset. The main stages of dataset creation for automatic waste identification are presented in Figure 4.
The first two stages are related to the data acquisition process. The input data for detection and classification models consists of images. Therefore, it is necessary to collect waste and subsequently capture images of it. The collected waste should include not only the target objects (Figure 5a) but also contaminants (Figure 5b) that typically appear in real-world sorting facilities due to errors in source separation. Such errors arise because people often misclassify waste, incorrectly assigning non-plastic items to plastic waste bins. Additionally, it is necessary to collect multiple instances of the same type of waste to account for the high variation in shape, primarily resulting from different levels of compression.
The considered waste classes include blue PET, white PET, green PET, HDPE, Tetrapak, and additionally, aluminum. For each class, waste was collected while ensuring a balanced number of instances across all categories. The collected waste was then photographed in small groups, positioned differently on the conveyor belt—both in the center and near the edges. Additionally, images were captured with overlapping waste items to reflect real-world conditions.
The collected images require preprocessing before being used for model training, which consists of two main steps: augmentation and labeling. Augmentation is optional, however, it is commonly performed to expand the dataset by applying transformations such as rotation or scaling. In contrast, labeling is a mandatory step for training the YOLO model, as it provides the necessary annotations for object detection. In the case of data augmentation for waste moving along a conveyor belt, geometric transformation is a key augmentation technique. In our dataset, we applied rotation. The final dataset, after augmentation, consisted of 2,242 images used in models 1A and 1B. This dataset was further expanded with additional images for model 2, specifically for detecting blue PET, white PET, and green PET, resulting in a total of 4,042 images. Each image underwent a labeling process involving the annotation of the detected classes. The summary of the applied labels is presented in Figure 6.
The final step in preparing the dataset for use in the YOLO model is to split it into two parts: the training and test sets, with the most commonly accepted ratio being 80/20.
As a summary, Table 3 presents a set of recommendations for each stage of the dataset creation process for waste identification.
2.3. Experimental Environment
In advanced sorting systems, waste is transported between separating points (i.e., NIR separators, sorting robots, etc.). Effective sorting requires automatic identification at multiple stages of the sorting process (at the beginning – input stream, at the end – sorting residues, and before subsequent separation points). Regardless of the sorting stage, automatic identification using computer vision requires placing an RGB camera above the conveyor transporting the waste. To best replicate real-world conditions for the final model validation, a test bed representing a fragment of a real sorting system was constructed, namely, a manual waste sorting cabin. The components of the developed test bed include:
- conveyor belt (speed 0-0.5m/s, 1.2x5m),
- RGB camera positioned above the conveyor (4K, 30 fps, 5-50mm zoom lens),
- computer,
- input stream feeder,
- output stream receiver,
- two manual sorting stations (not considered in this paper)
- hyperspectral camera (not in the scope of the study).
2.4. Waste Sample Preparation for Model Validation
The primary limitation of previously applied approaches in automatic waste identification models is the testing of solutions under laboratory conditions, based on a designated subset of the utilized dataset. The final validation of the model should be conducted under real-world conditions, considering the movement of waste along a conveyor. In the absence of access to a real sorting system, this was substituted by constructing a representative fragment of a real system and using waste samples that reflect the morphology of the Polish plastic waste stream.
In Poland, waste segregation is implemented at the source of generation. This means that before collection, waste is placed in designated containers for paper, glass, mixed waste, and plastics. Metal waste is also disposed of in the plastic waste container; therefore, aluminum cans were included in the developed dataset. The plastic container is also designated for metals; therefore, aluminum cans were included in the developed dataset.
For the final validation of the developed model, a 5kg waste sample reflecting the morphology of Polish municipal waste was prepared based on the Institute of Environmental Protection – National Research Institute (IOS-PIB) report. The morphology of the prepared sample is shown in Figure 9.
The presented figure confirms the significance of considering contaminants in the development of automatic identification models. In the average morphology of the Polish plastic waste stream, contaminants account for more than 50%.
3. Results
3.1. Model Performance Based on Validation Data Separated from the Self-Build Dataset
The proposed automatic waste stream identification model is based on three YOLOv5 models. The performance of each model was evaluated using Precision, Recall, and mean Average Precision (mAP), which are commonly used evaluation metrics for detection problems [27]. In the learning stage of the model, the indicated metrics represent a global perspective without considering each class separately.
Precision indicates the ratio of correct object detections (TP) to the total number of detections (both correct TP and incorrect FP), defined as follows:
Recall represents the ratio of correct object detections to the total number of actual objects, defined as follows:
Mean Average Precision (mAP) denotes the average performance of the detector across all recall values, which is equivalent to the area under the precision-recall curve. It can be mathematically expressed as (4):
and it measures the performance of an object detection model by averaging the area under the Precision-Recall curve across all classes. In this context, mAP_0.5 represents the average precision computed at a fixed IoU threshold of 0.5, whereas mAP_0.5:0.95 is a more rigorous and comprehensive metric, averaging precision over multiple IoU thresholds from 0.5 to 0.95 in increments of 0.05.
The progression of Precision, Recall, and mAP throughout the YOLOv5 training process for each of the three models used is presented in Figure 10.
The comparison of the final performance metrics for each of the three models is presented in Table 4.
Additionally, Figure 11 presents the confusion matrices generated by the trained YOLO models.
3.2. Model Performance Under Replicated Real-World Conditions
The lack of access to the real system was replaced by its replica in laboratory conditions using the developed test bed (described in Subsection 2.3). The model was tested using waste sample with average Polish morphology (described in Subsection 2.4) moving at a speed of 0,2 m/s on the conveyor. The sample was fed onto the conveyor eight times consecutively. The visualization of the model's performance under conditions replicating a real-world sorting facility is presented in Figure 12.
The final results (model output) were analyzed to determine the Accuracy, Precision, Recall, and F1-score for each detected class. These metrics are calculated based on four groups of results for each class separately:
- TP – True Positives (e.g., HDPE detected, which is actually HDPE),
- FP – False Positives (e.g., HDPE detected, which is actually a different fraction),
- TN – True Negatives (e.g., a fraction other than HDPE detected, which is actually a fraction other than HDPE),
- FN – False Negatives (e.g., HDPE not detected).
The comparison of the final performance metrics for each class is presented in Table 5.
4. Discussion
Primary performance measures of models 1a, 1b and 2 shows that Model 2 is the best overall, achieving the highest recall and mAP values, making it the most accurate and generalizable. Model 1b offers a good balance between precision and recall, slightly outperforming 1a in mAP. The combination of high recall (1a), high precision (1b), and strong classification accuracy (2) suggests an optimized pipeline that balances detection and classification accuracy. Model 1a focuses on detecting Tetrapak, Aluminum, and PET, while Model 1b is trained primarily for HDPE detection. This approach improves the accuracy of HDPE detection, which is often more challenging. Since Model 1b disregards all non-HDPE objects, and Model 1a does not output HDPE, the system minimizes false detections and enhances classification confidence. Model 2 improves the accuracy of sorting PET based on color, which is crucial for recycling.
The confusion matrices indicate that the additional model trained for HDPE successfully eliminated the misclassification of HDPE as PET. It is also evident that Model 1a struggles with detecting HDPE, often confusing it with Tetrapak and aluminum. Additionally, each model occasionally detects background objects due to contamination resembling the target fractions. Therefore, the proposed model effectively detects the assigned waste classes, but a significant challenge remains in misclassifying contaminants as sortable objects. This highlights the importance of introducing contaminants into self-built datasets for automatic waste identification, as real-world waste streams often contain more contaminants than recyclable materials—a situation particularly relevant in countries such as Poland. In further research, a more comprehensive examination of contaminants in the stream is planned.
The final validation eliminated a key limitation present in most models available in the literature, which are typically not tested under real-world conditions. A binary classification accuracy ranging from 0.94 to 0.98 indicates a high level of correct detections among all identified objects. If an object is classified, the probability of assigning it to the wrong class remains low. The achieved precision values, ranging from 0.89 to 1.00, demonstrate high classification accuracy for each waste fraction. Once an object is detected, the model very rarely misclassifies it. The highest probability of such an error, at 0.11, was observed for the Tetrapak fraction. The recall values can also be considered high. The lowest recall was recorded for HDPE (0.76), while for the remaining fractions, recall values ranged between 0.85 and 0.9. These values indicate a low probability of failing to detect an object of a given class. PET Classes (Blue, Green, White) show strong overall performance, with particularly high precision, but there is room to improve recall, especially for green and white PET. Tetrapak and Aluminum have a good balance of precision and recall, with minor improvements possible in precision for Tetrapak. HDPE is the weakest in terms of recall, which could mean that more HDPE objects are not being detected.
Under conditions that replicate real-world scenarios, the results remain within acceptable limits, indicating a high potential for the practical applicability of the developed model in waste sorting systems.
5. Conclusions
In advanced waste sorting systems, the automatic identification of the waste stream is crucial for the efficient separation of materials intended for recycling. It is primarily used by automated and robotic sorting components but also for monitoring the waste stream at various stages of processing, which enables the control of the system. The waste detection and classification model presented in this paper is one of the components of the municipal waste sorting system Digital Twin, which is a part of the ongoing project “Cyber-physical waste stream control system”. The proposed model is based on the combination of three YOLOv5 models focused on classifying elements of the waste stream into the following classes: blue PET, white PET, green PET, HDPE, tetrapak, and aluminum. The model was trained using a self-built dataset, and its performance was validated in a replica of a real-world sorting system fragment.
The next step in the development of the data collection layer of the Digital Twin is the application of a lidar sensor for measuring the volume of transported waste. The final fusion of the RGB camera with the lidar sensor will enable real-time collection of all key characteristics of the waste stream, including morphology, as well as volumetric and mass measurements.
Author Contributions
“Conceptualization, R.G. and A.D.; methodology, R.G.; software, M.F.; validation, R.G., A.D. and M.F.; formal analysis, R.G.; investigation, A.D. and M.F.; resources, R.G. and A.D.; data curation, M.F.; writing—original draft preparation, A.D.; writing—review and editing, R.G.; visualization, A.D.; supervision, R.G.; project administration, R.G.; funding acquisition, R.G. All authors have read and agreed to the published version of the manuscript.
Funding
This research was funded by The National Centre for Research and Development, LEADER program, grant number 0212/L-13/2022. The APC was funded by the Faculty of Mechanical Engineering, Wroclaw University of Science and Technology.
Institutional Review Board Statement
Not applicable.
Informed Consent Statement
Not applicable.
Data Availability Statement
The datasets presented in this article are not readily available because the data are part of an ongoing research project.
Conflicts of Interest
The authors declare no conflicts of interest. The funders had no role in the design of the study; in the collection, analyses, or interpretation of data; in the writing of the manuscript; or in the decision to publish the results.
References
- Alhazmi, H.; Almansour, F.H.; Aldhafeeri, Z. Plastic waste management: A review of existing life cycle assessment studies. Sustainability (Switzerland) 2021, 13, 1–21. [Google Scholar] [CrossRef]
- Milios, L.; Davani, A.E.; Yu, Y. Sustainability impact assessment of increased plastic recycling and future pathways of plastic waste management in Sweden. Recycling 2018, 3. [Google Scholar] [CrossRef]
- Arbeláez-Estrada, J.C.; Vallejo, P.; Aguilar, J.; Tabares-Betancur, M.S.; Ríos-Zapata, D.; Ruiz-Arenas, S.; Rendón-Vélez, E. A Systematic Literature Review of Waste Identification in Automatic Separation Systems. Recycling 2023, 8, 1–25. [Google Scholar] [CrossRef]
- Satav, A.G.; Kubade, S.; Amrutkar, C.; Arya, G.; Pawar, A. A state-of-the-art review on robotics in waste sorting: scope and challenges. International Journal on Interactive Design and Manufacturing 2023. [Google Scholar] [CrossRef]
- Lubongo, C.; Alexandridis, P. Assessment of Performance and Challenges in Use of Commercial Automated Sorting Technology for Plastic Waste. Recycling 2022, 7, 1–26. [Google Scholar] [CrossRef]
- Tanguay-Rioux, F.; Spreutels, L.; Héroux, M.; Legros, R. On the limits of empirical partition coefficients for modeling material recovery facility unit operations in municipal solid waste management. Waste Management 2022, 144, 533–542. [Google Scholar] [CrossRef]
- Tanguay-Rioux, F.; Legros, R.; Spreutels, L. On the limits of empirical partition coefficients for modeling material recovery facility unit operations in municipal solid waste management. Journal of Cleaner Production 2021, 293, 126016. [Google Scholar] [CrossRef]
- Kroell, N.; Chen, X.; Greiff, K.; Feil, A. Optical sensors and machine learning algorithms in sensor-based material flow characterization for mechanical recycling processes: A systematic literature review. Waste Management 2022, 149, 259–290. [Google Scholar] [CrossRef]
- Lu, W.; Chen, J. Computer vision for solid waste sorting: A critical review of academic research. Waste Management 2022, 142, 29–43. [Google Scholar] [CrossRef]
- Xia, W.; Jiang, Y.; Chen, X.; Zhao, R. Application of machine learning algorithms in municipal solid waste management: A mini review. Waste Management and Research 2022, 40, 609–624. [Google Scholar] [CrossRef]
- Zhao, Y.; Li, J. Sensor-Based Technologies in Effective Solid Waste Sorting: Successful Applications, Sensor Combination, and Future Directions. Environmental Science and Technology 2022, 56, 17531–17544. [Google Scholar] [CrossRef] [PubMed]
- Maier, G.; Gruna, R.; Langle, T.; Beyerer, J. A Survey of the State of the Art in Sensor-Based Sorting Technology and Research. IEEE Access 2024, 12, 6473–6493. [Google Scholar] [CrossRef]
- Ali, M.L.; Zhang, Z. The YOLO Framework: A Comprehensive Review of Evolution, Applications, and Benchmarks in Object Detection. Computers 2024, 13. [Google Scholar] [CrossRef]
- Zhou, Q.; Liu, H.; Qiu, Y.; Zheng, W. Object Detection for Construction Waste Based on an Improved YOLOv5 Model. Sustainability (Switzerland) 2023, 15. [Google Scholar] [CrossRef]
- Ren, Y.; Li, Y.; Gao, X. An MRS-YOLO Model for High-Precision Waste Detection and Classification. Sensors 2024, 24. [Google Scholar] [CrossRef]
- Son, J.; Ahn, Y. AI-based plastic waste sorting method utilizing object detection models for enhanced classification. Waste Management 2025, 193, 273–282. [Google Scholar] [CrossRef]
- Choi, J.; Lim, B.; Yoo, Y. Advancing Plastic Waste Classification and Recycling Efficiency: Integrating Image Sensors and Deep Learning Algorithms. Applied Sciences (Switzerland) 2023, 13. [Google Scholar] [CrossRef]
- Yang, X.; Zhao, J.; Zhao, L.; Zhang, H.; Li, L.; Ji, Z.; Ganchev, I. Detection of River Floating Garbage Based on Improved YOLOv5. Mathematics 2022, 10. [Google Scholar] [CrossRef]
- Fan, J.; Cui, L.; Fei, S. Waste Detection System Based on Data Augmentation and YOLO_EC. Sensors 2023, 23. [Google Scholar] [CrossRef]
- Liu, S.; Chen, R.; Ye, M.; Luo, J.; Yang, D.; Dai, M. Methodology for Real-Time Detection of Domestic Waste. Sensors 2024. [Google Scholar]
- Werbińska-Wojciechowska, S.; Giel, R.; Winiarska, K. Digital Twin approach for operation and maintenance of transportation system – systematic review. Sensors 2024. [Google Scholar] [CrossRef] [PubMed]
- Giel, R.; Dąbrowska, A. A Digital Twin framework for cyber-physical waste stream control system towards Reverse Logistics 4.0. Logforum 2024, 20, 297–306. [Google Scholar] [CrossRef]
- Terven, J.; Córdova-Esparza, D.M.; Romero-González, J.A. A Comprehensive Review of YOLO Architectures in Computer Vision: From YOLOv1 to YOLOv8 and YOLO-NAS. Machine Learning and Knowledge Extraction 2023, 5, 1680–1716. [Google Scholar] [CrossRef]
- Xu, R.; Lin, H.; Lu, K.; Cao, L.; Liu, Y. A forest fire detection system based on ensemble learning. Forests 2021, 12, 1–17. [Google Scholar] [CrossRef]
- Katsamenis, I.; Karolou, E.E.; Davradou, A.; Protopapadakis, E.; Doulamis, A.; Doulamis, N.; Kalogeras, D. TraCon: A Novel Dataset for Real-Time Traffic Cones Detection Using Deep Learning. Lecture Notes in Networks and Systems 2023, 556 LNNS, 382–391. [Google Scholar] [CrossRef]
- Jia, X.; Tong, Y.; Qiao, H.; Li, M.; Tong, J.; Liang, B. Fast and accurate object detector for autonomous driving based on improved YOLOv5. Scientific Reports 2023, 13, 1–13. [Google Scholar] [CrossRef]
- Sirisha, U.; Praveen, S.P.; Srinivasu, P.N.; Barsocchi, P.; Bhoi, A.K. Statistical Analysis of Design Aspects of Various YOLO-Based Deep Learning Models for Object Detection. International Journal of Computational Intelligence Systems 2023, 16, 1–29. [Google Scholar] [CrossRef]
Figure 1.
Scope of research in the context of the Digital Twin framework for waste sorting systems.
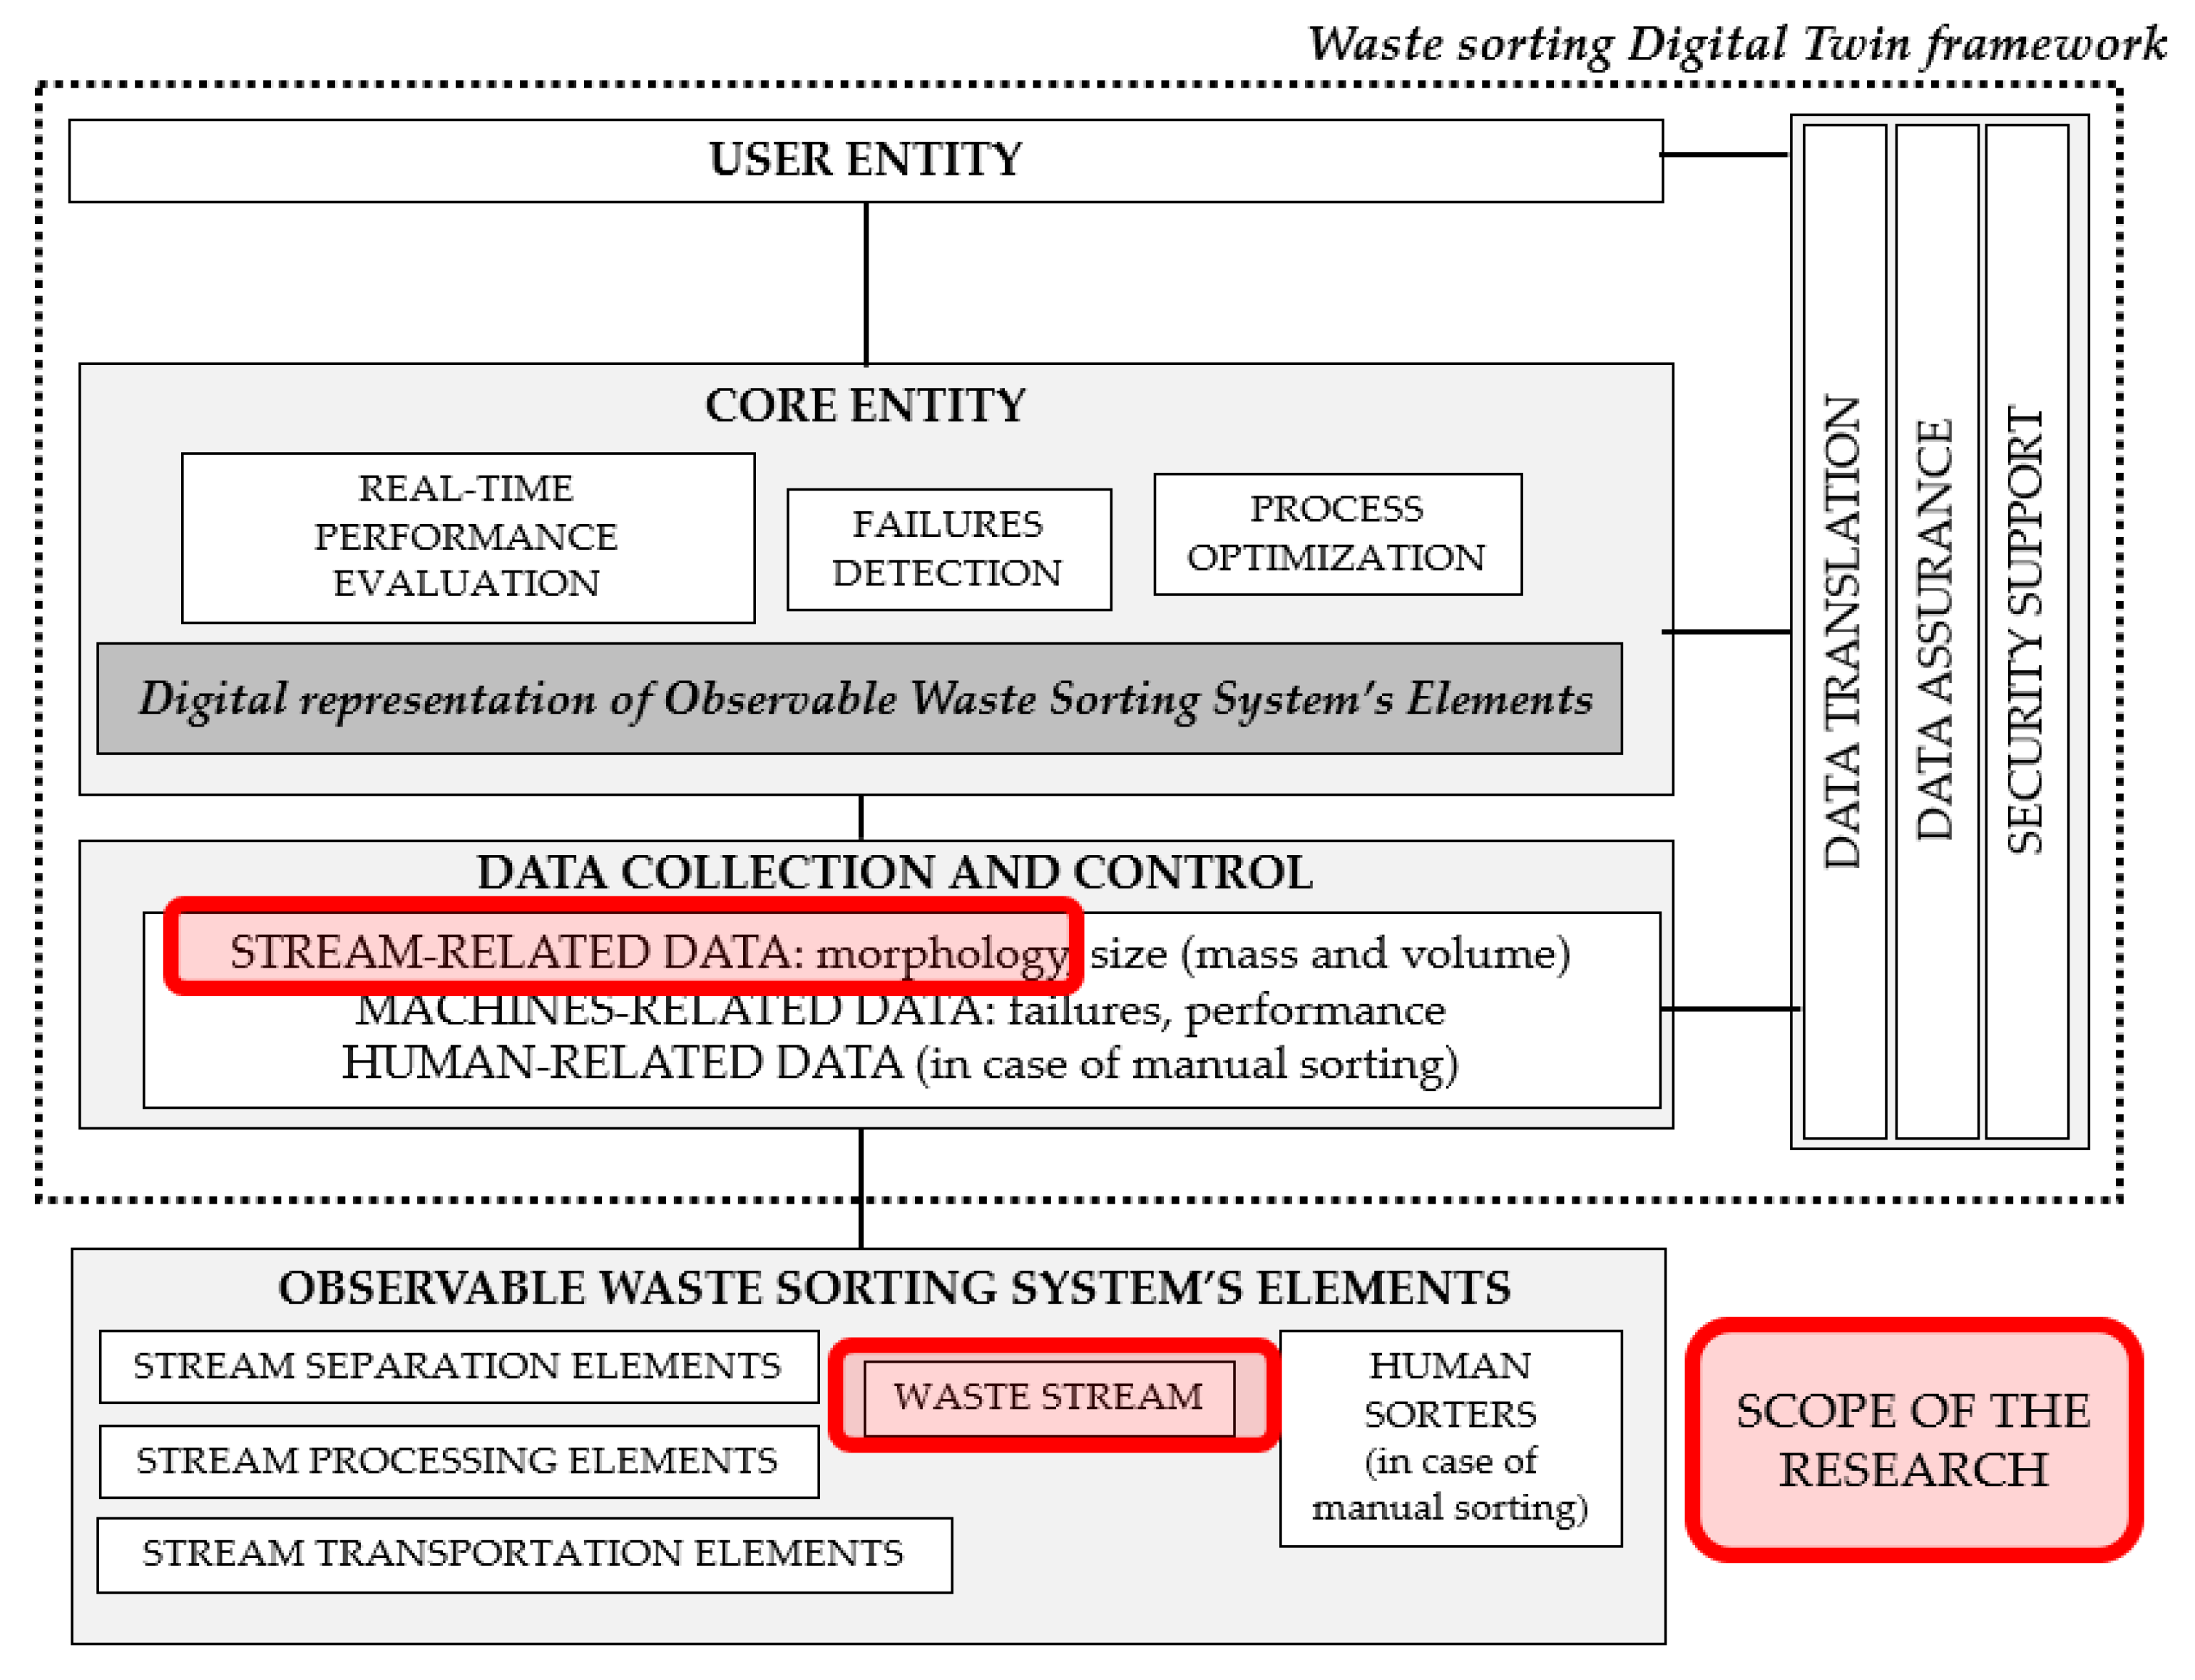
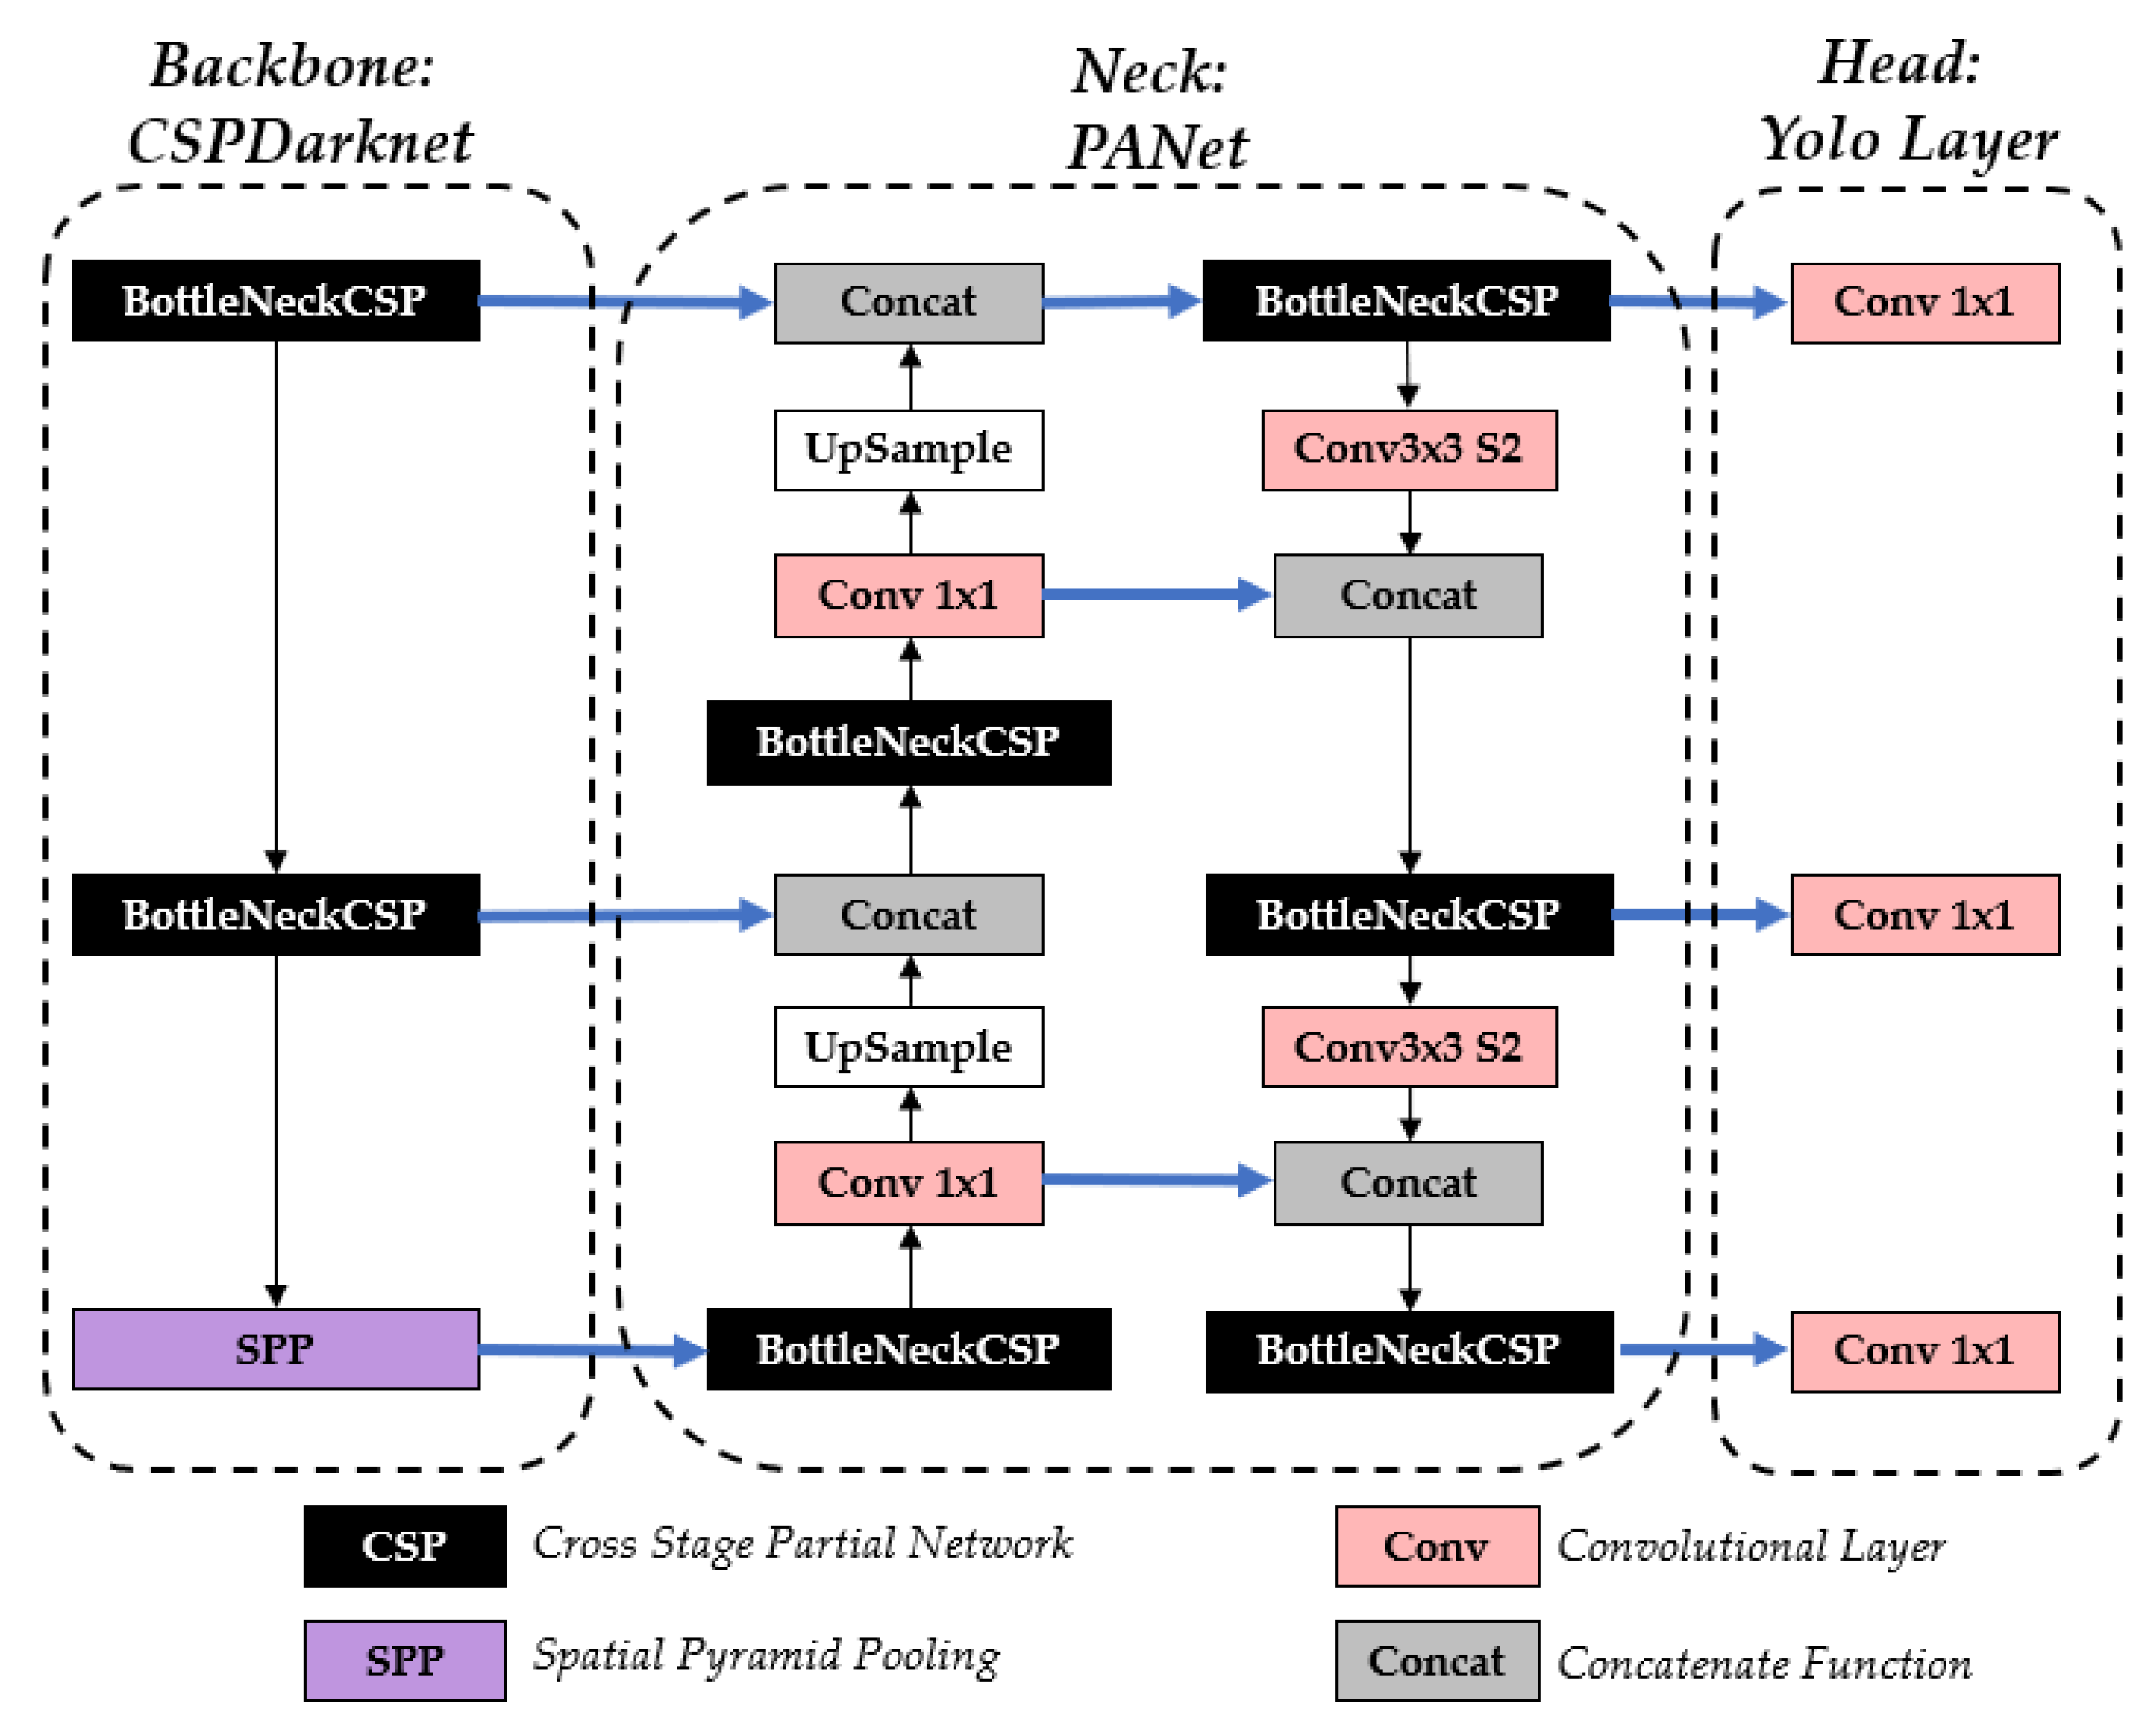
Figure 3.
Architecture of the proposed model for automatic waste stream identification based on YOLOv5.
Figure 3.
Architecture of the proposed model for automatic waste stream identification based on YOLOv5.
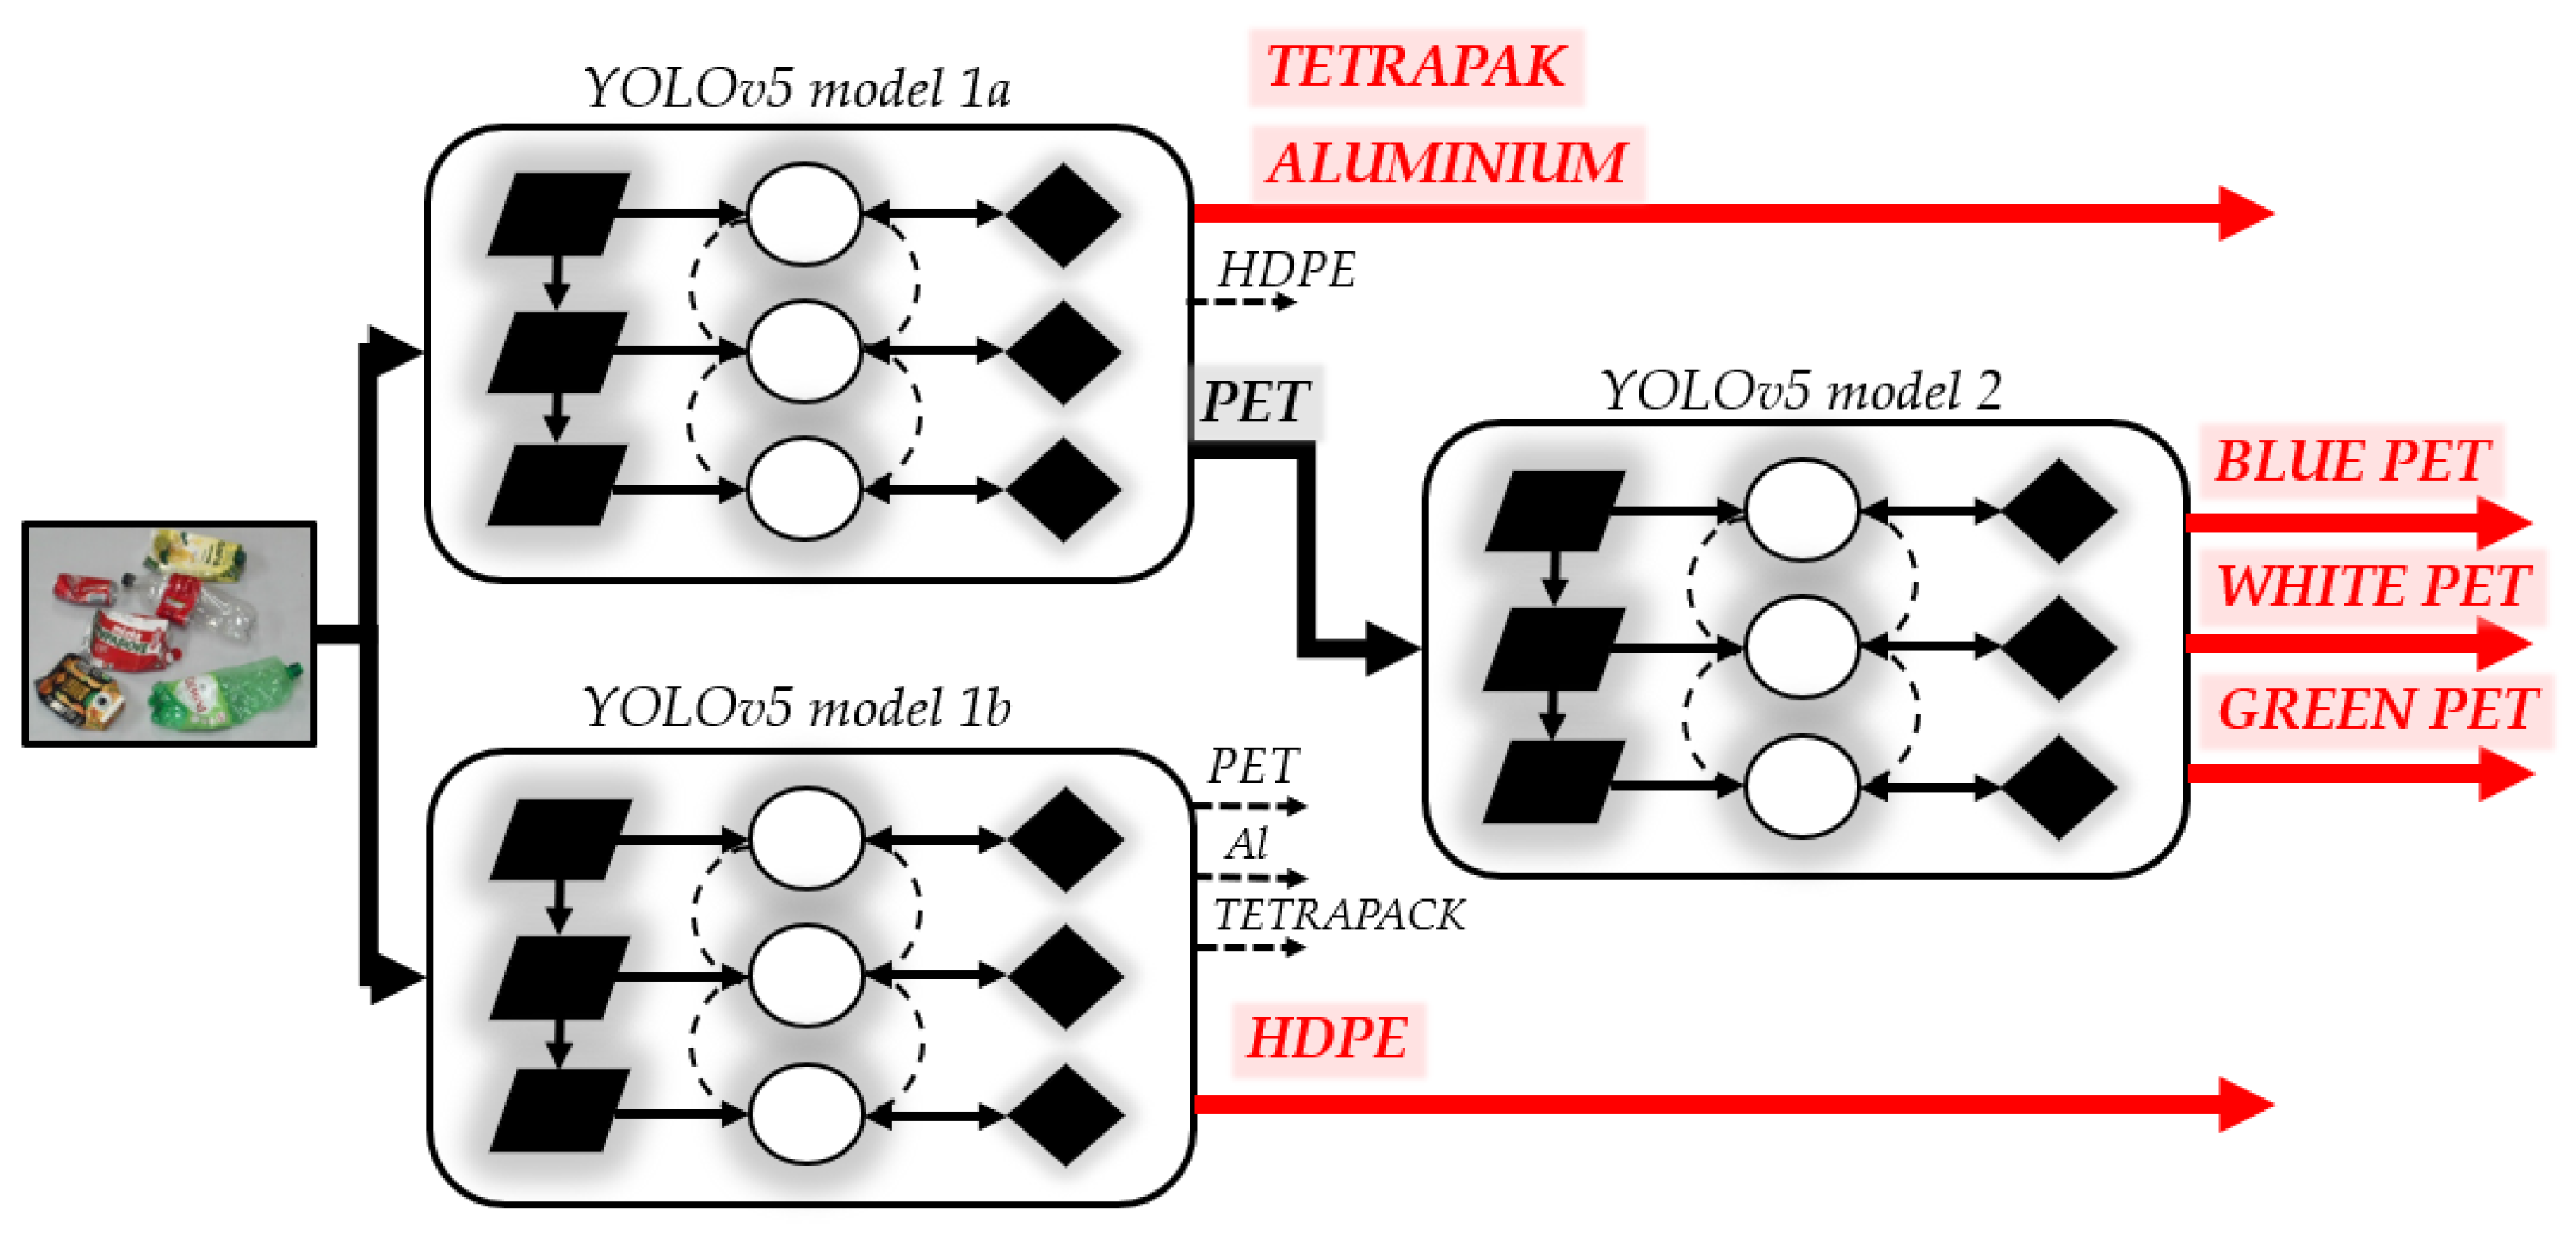
Figure 4.
Main stages of dataset creation for automatic waste identification.
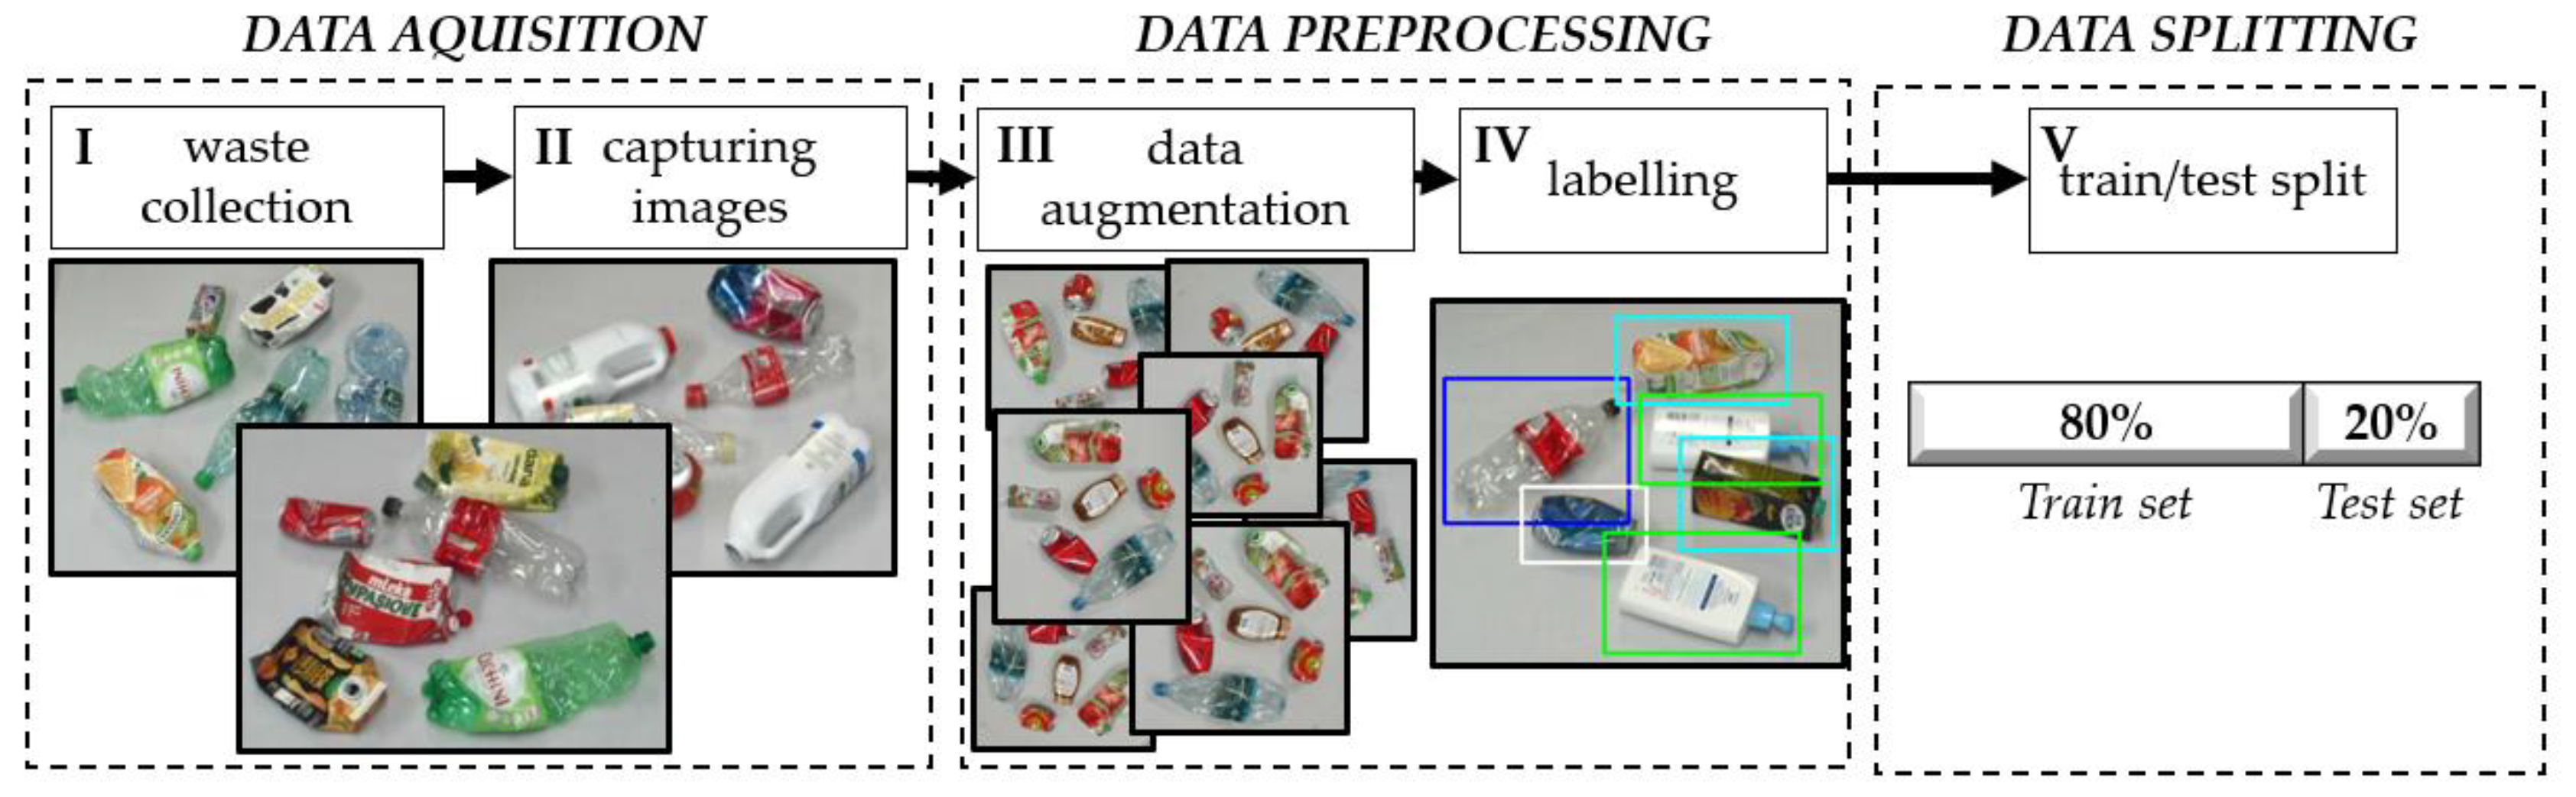
Figure 5.
Example of collected waste: (a) including only target objects; (b) including contaminants.
Figure 5.
Example of collected waste: (a) including only target objects; (b) including contaminants.
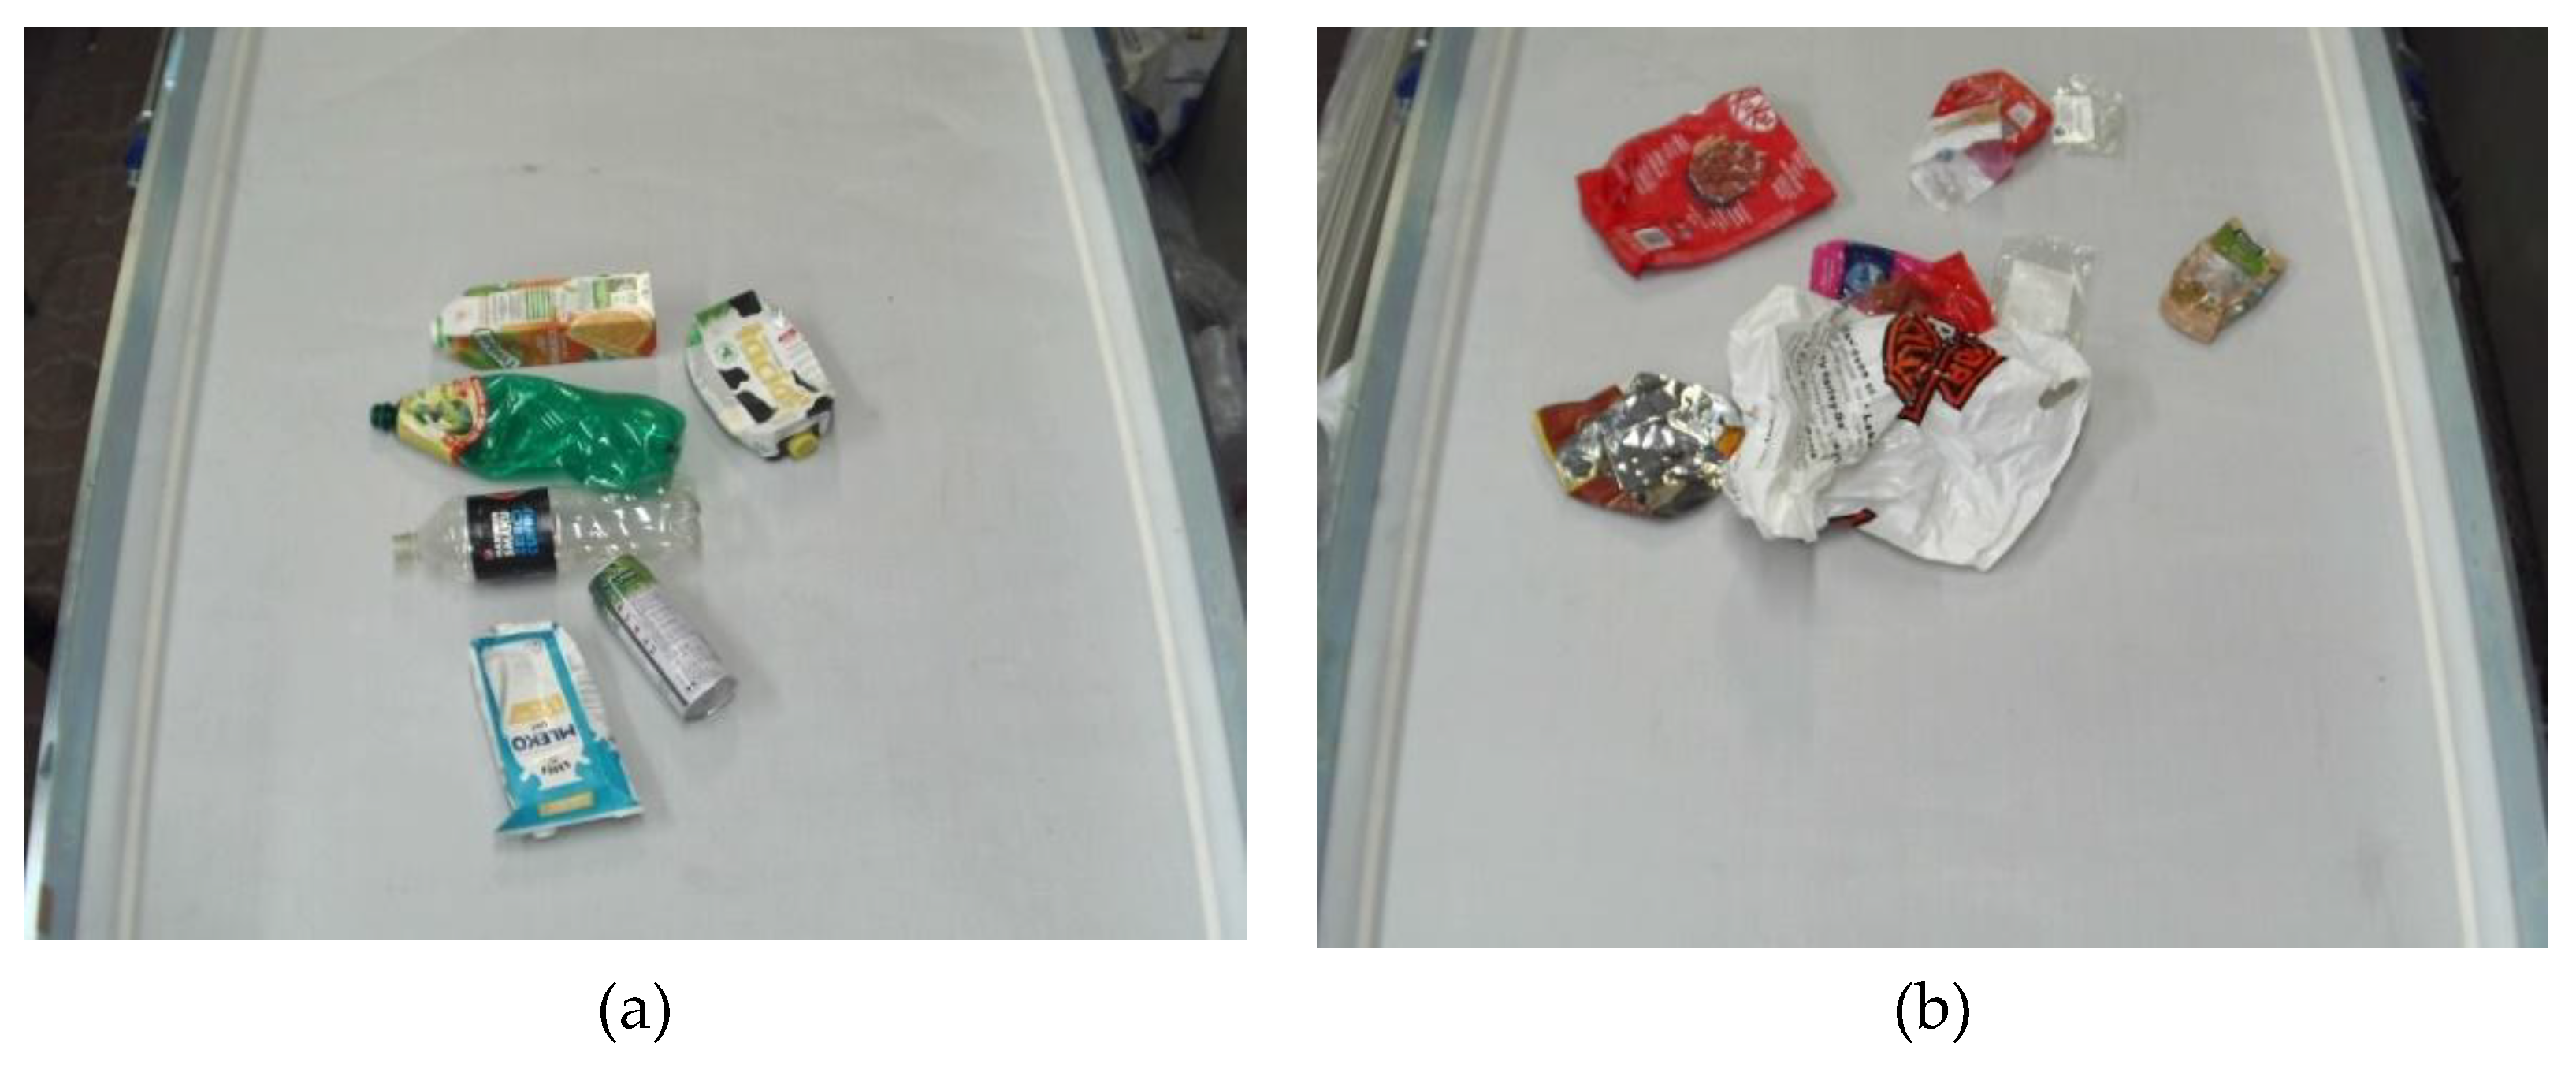
Figure 6.
Distribution of label locations for (a) basic dataset (for model 1a and 1b) (b) extended dataset (for model 2).
Figure 6.
Distribution of label locations for (a) basic dataset (for model 1a and 1b) (b) extended dataset (for model 2).
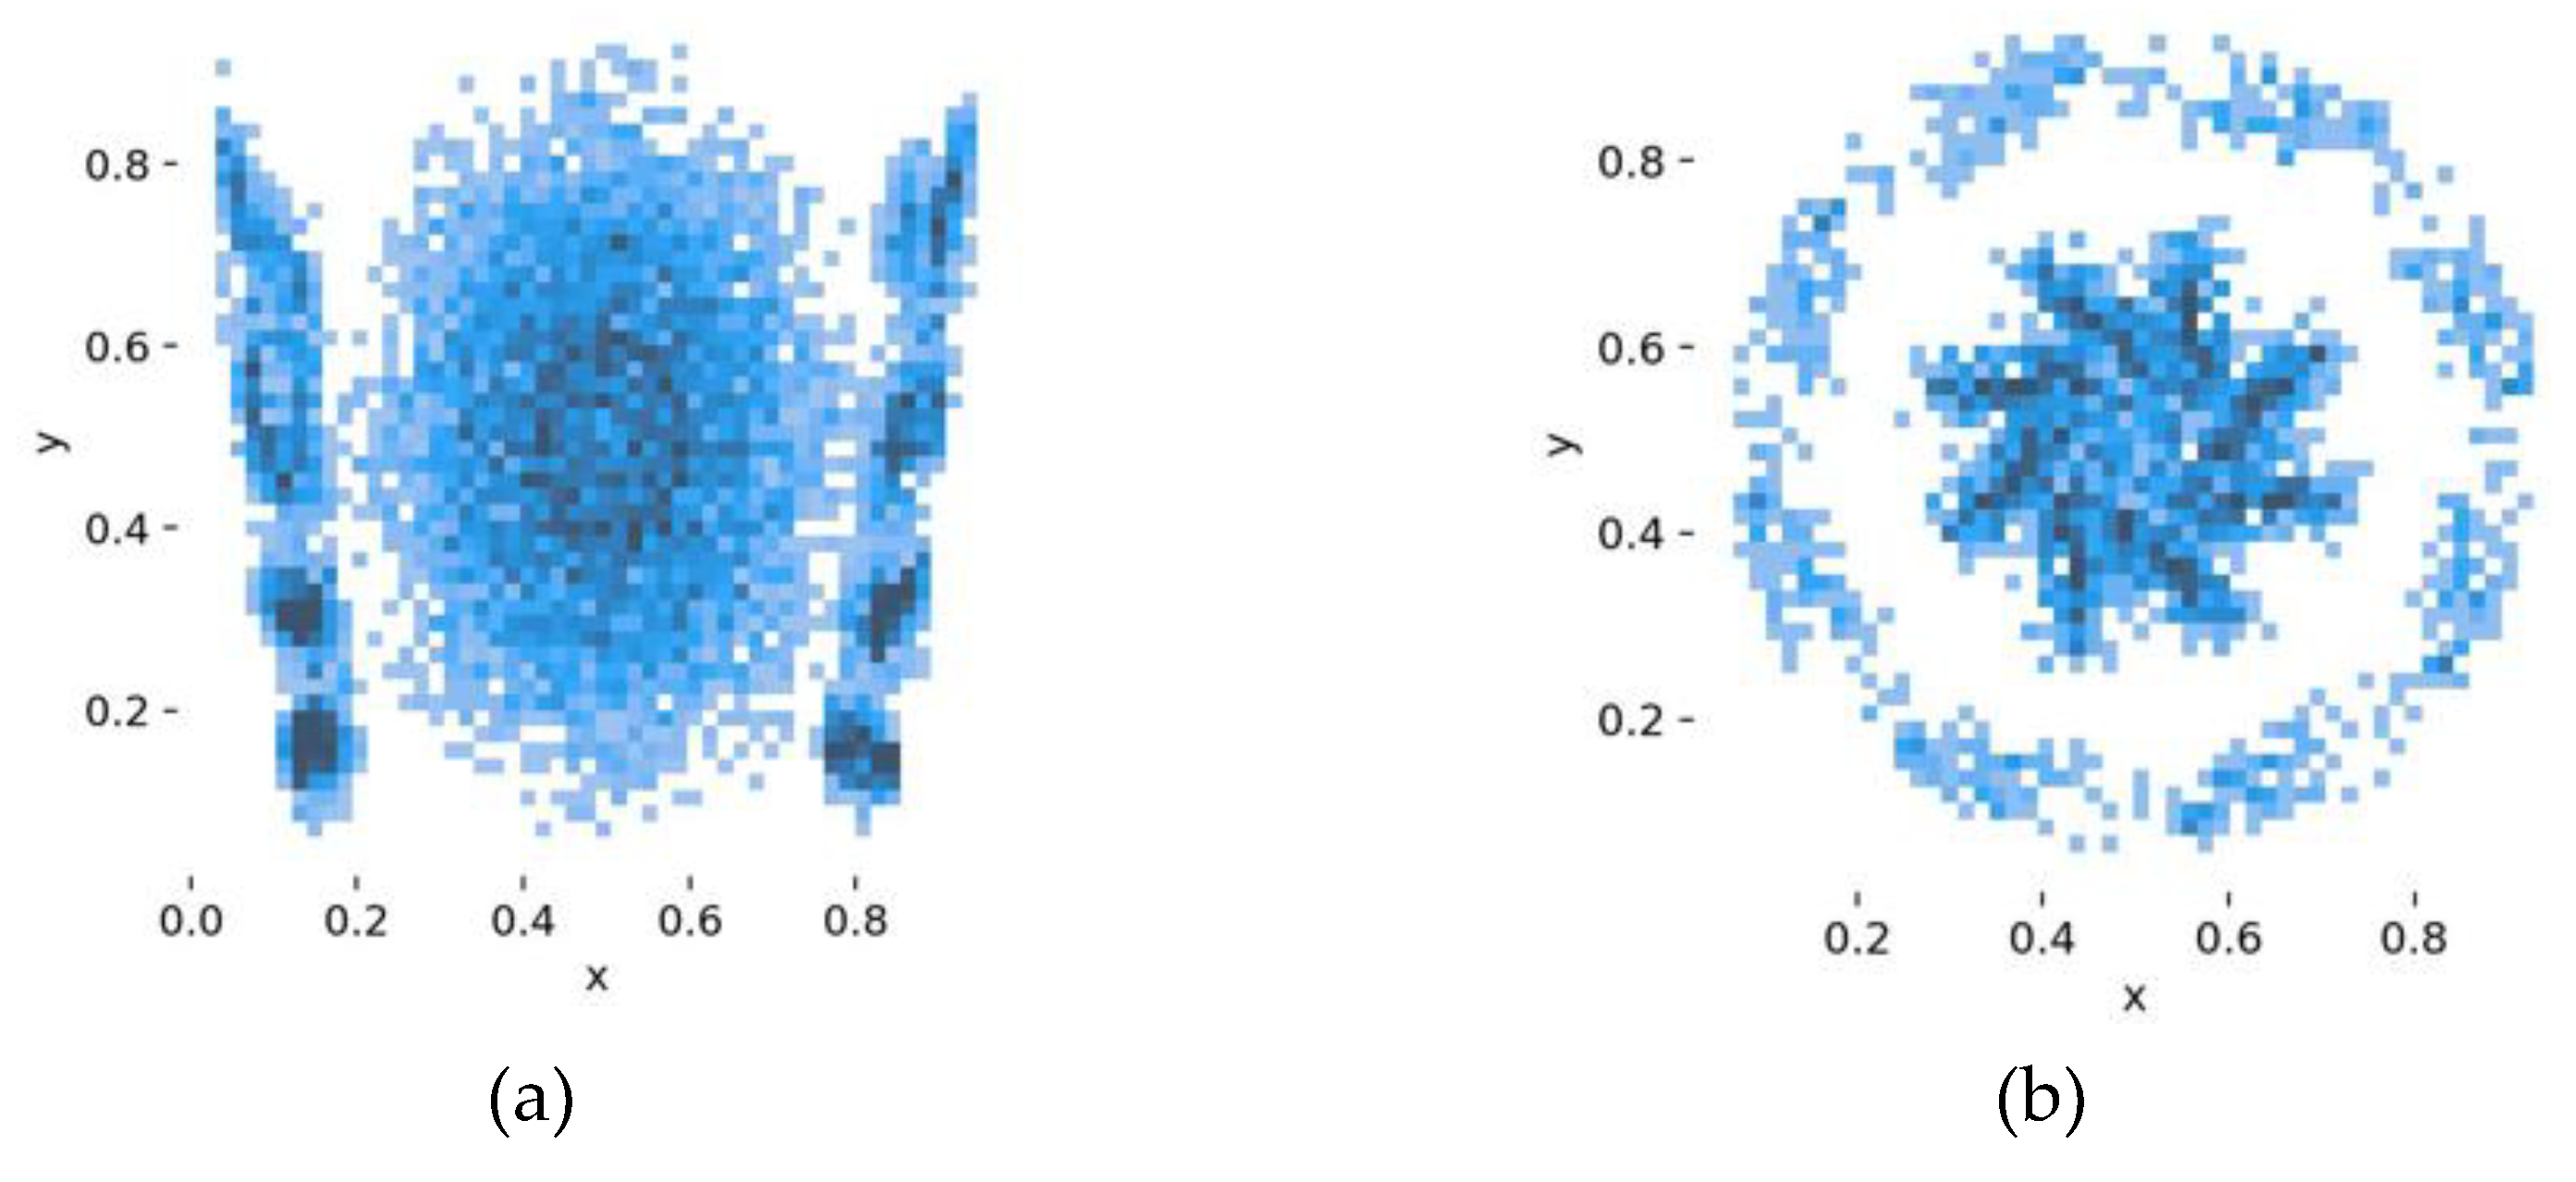
Figure 7.
Scheme of the developed test bed.
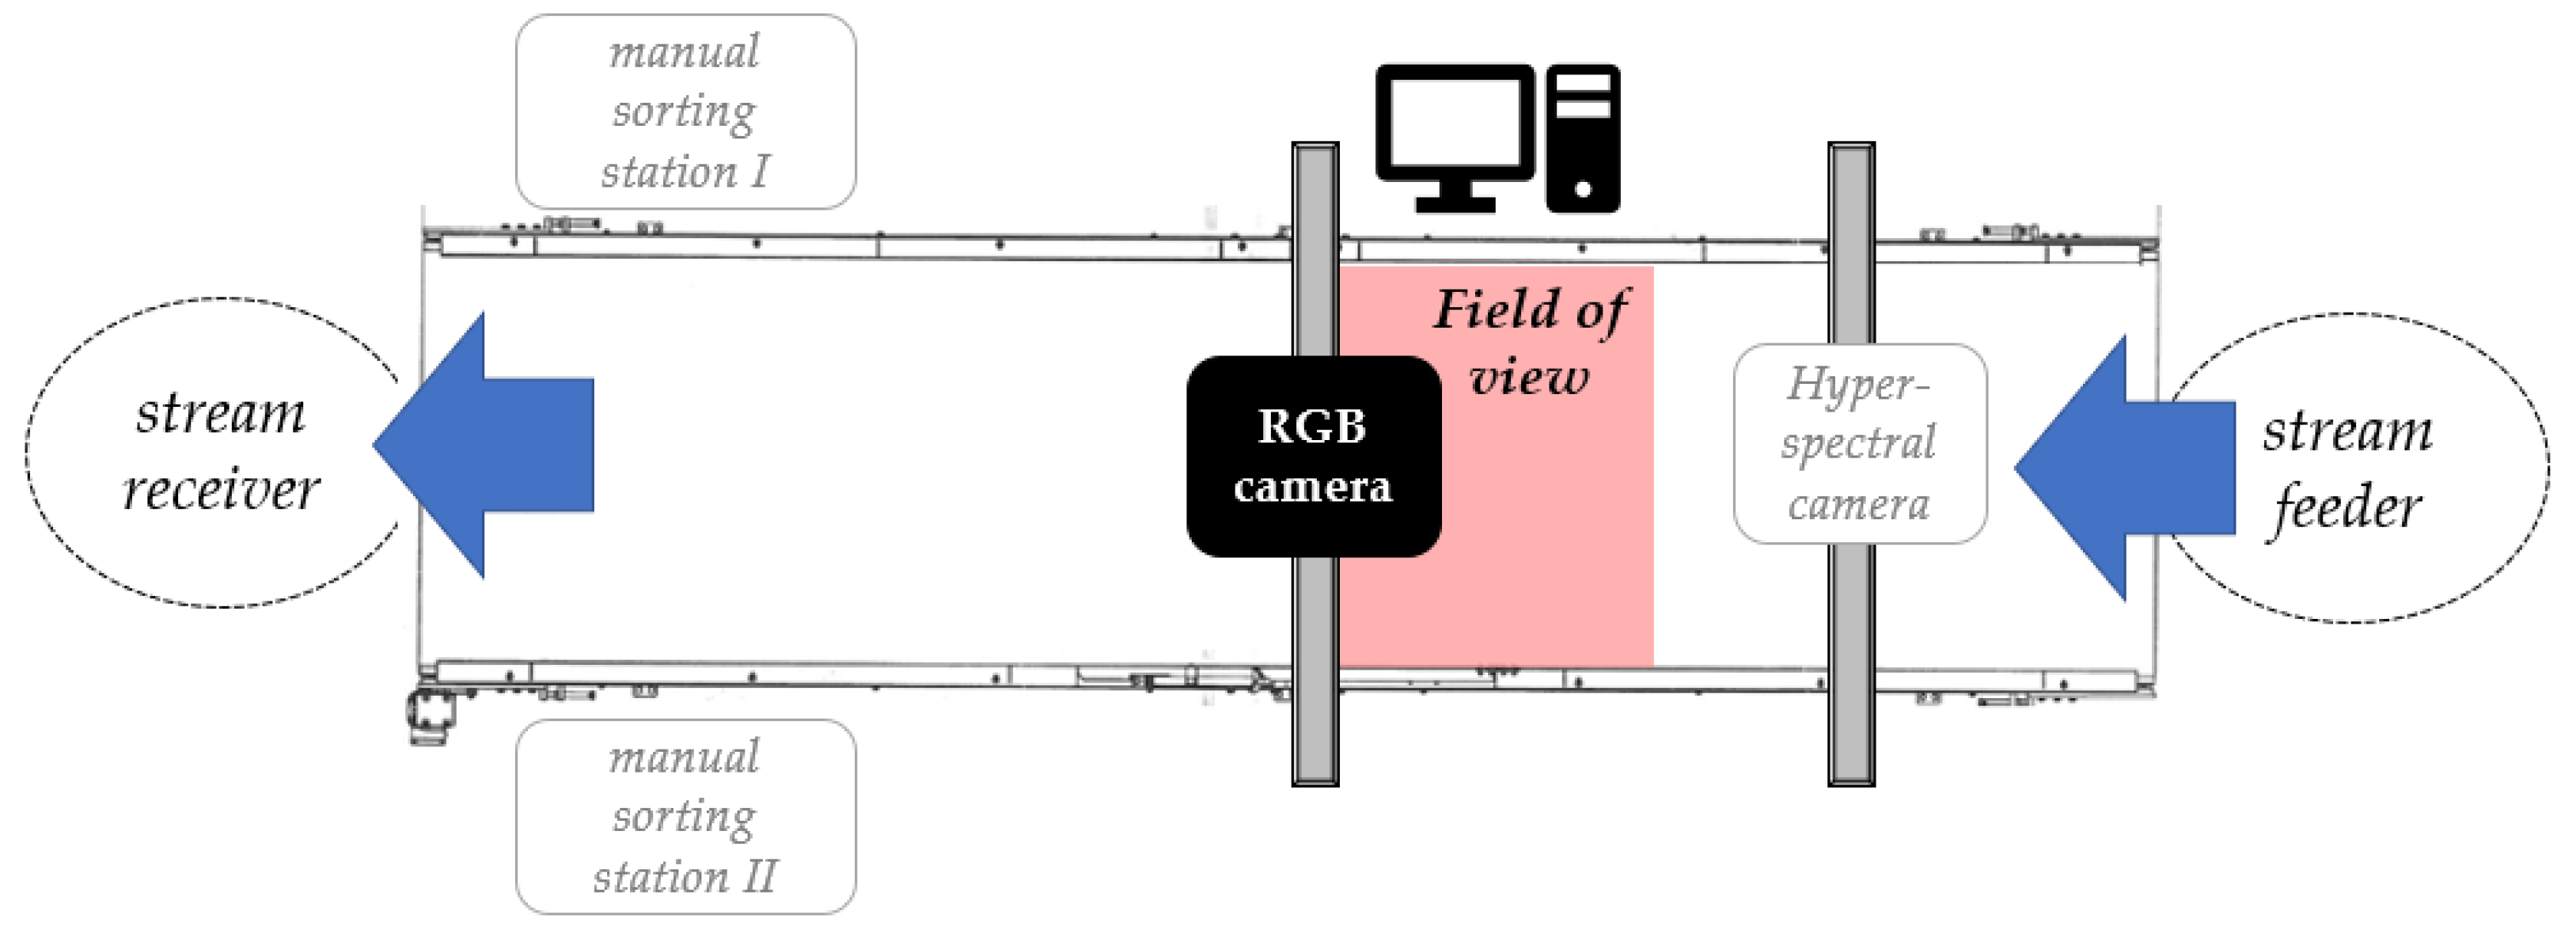
Figure 8.
The developed test bed.
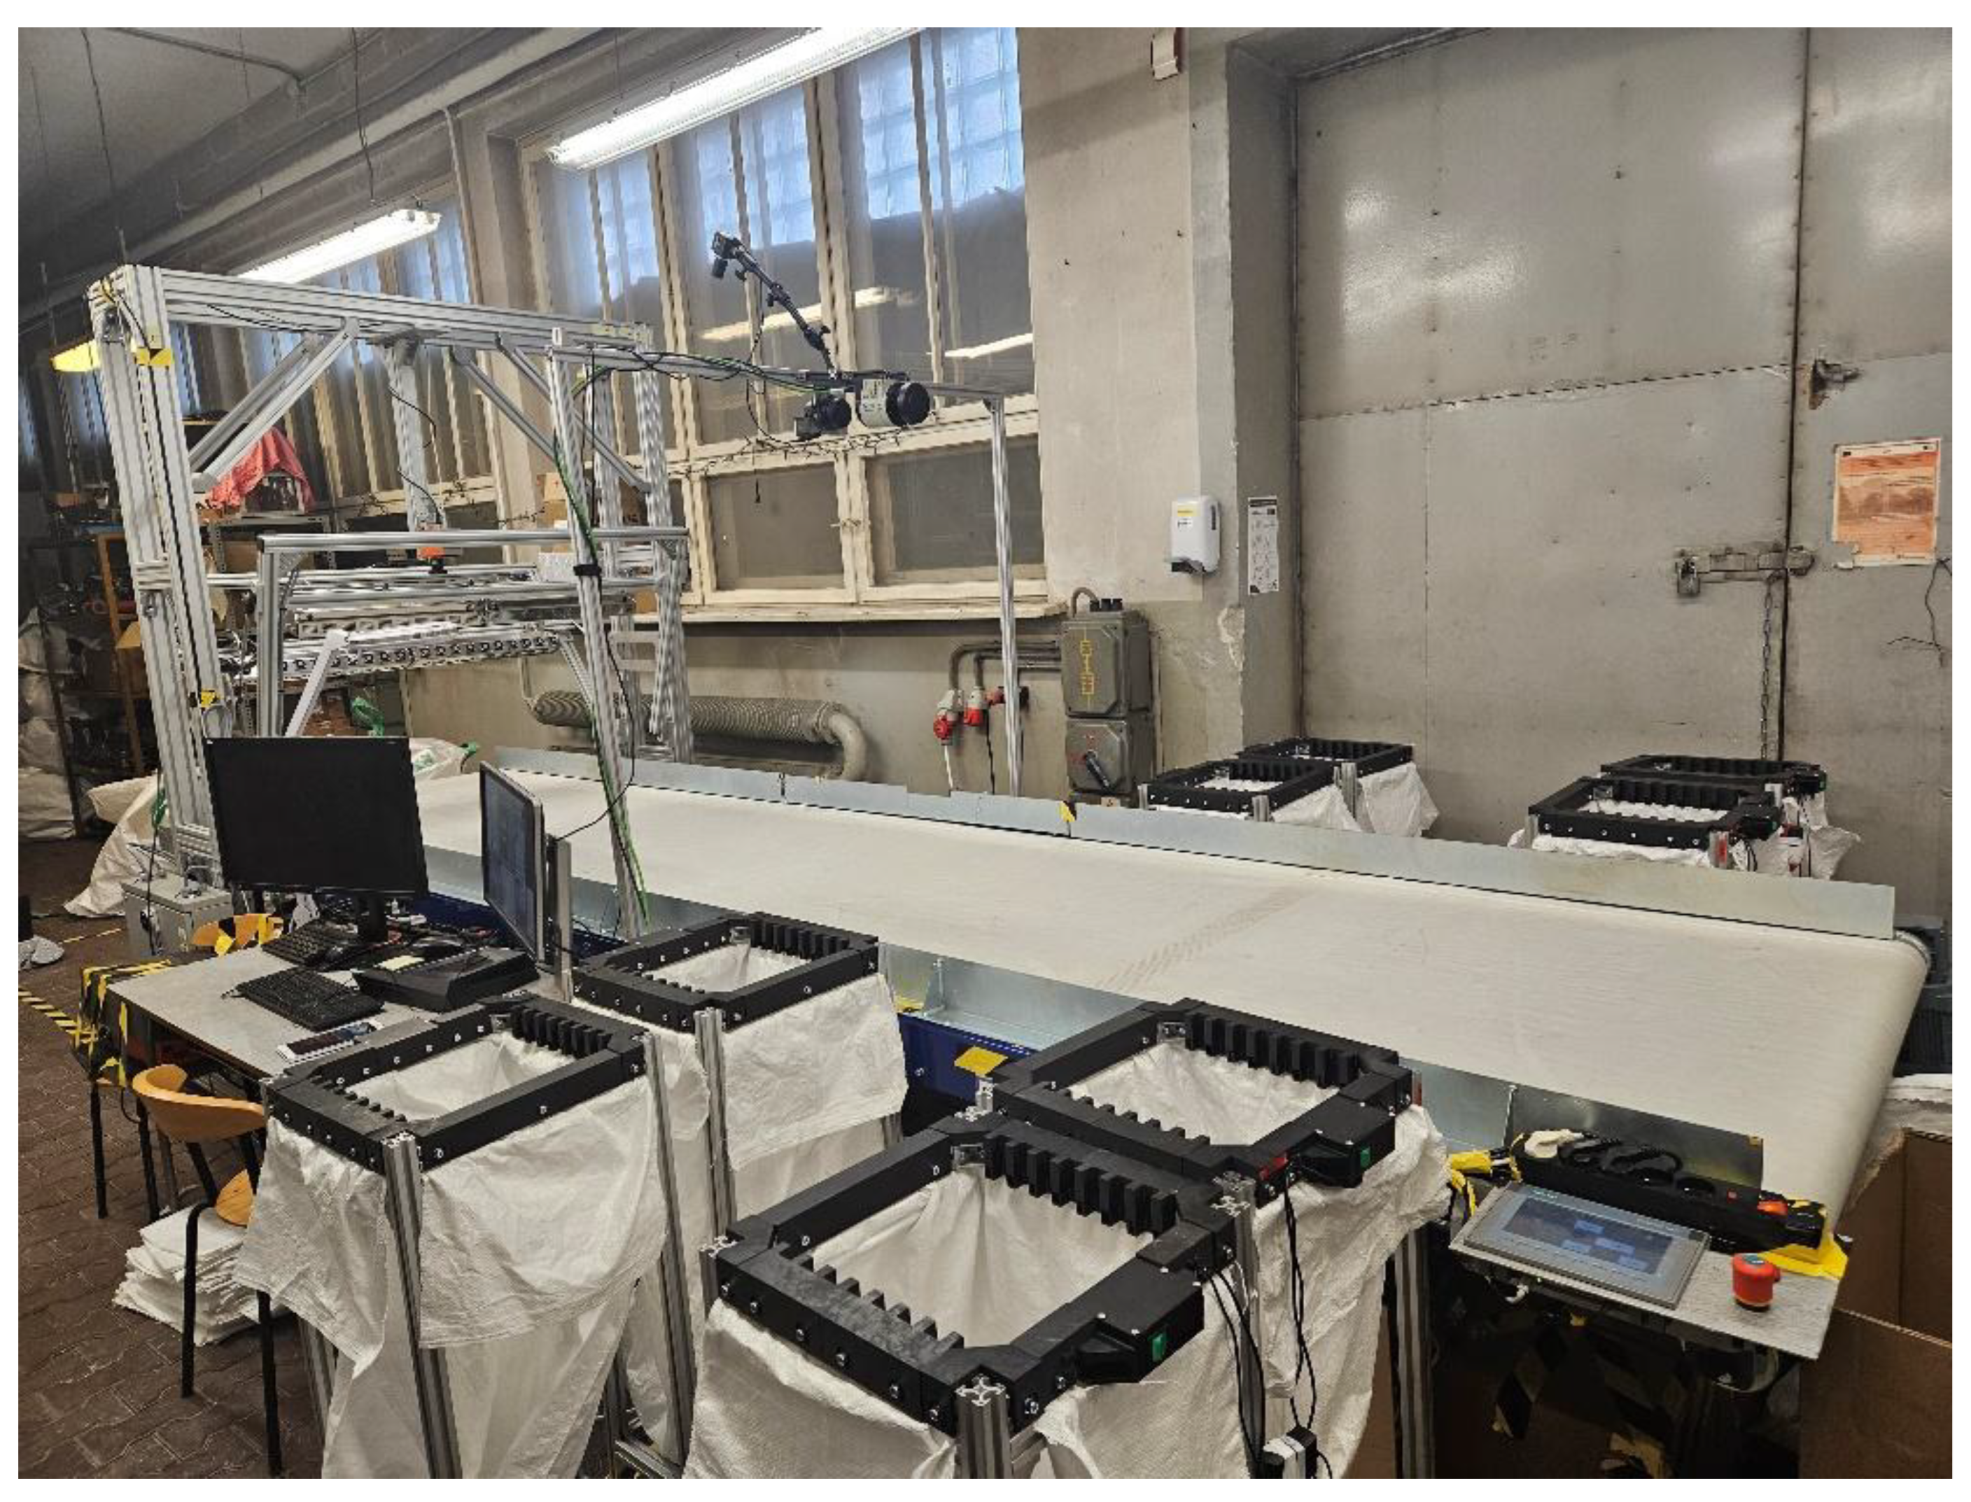
Figure 9.
The morphology of the Polish plastic waste stream compared to the morphology of the prepared sample.
Figure 9.
The morphology of the Polish plastic waste stream compared to the morphology of the prepared sample.
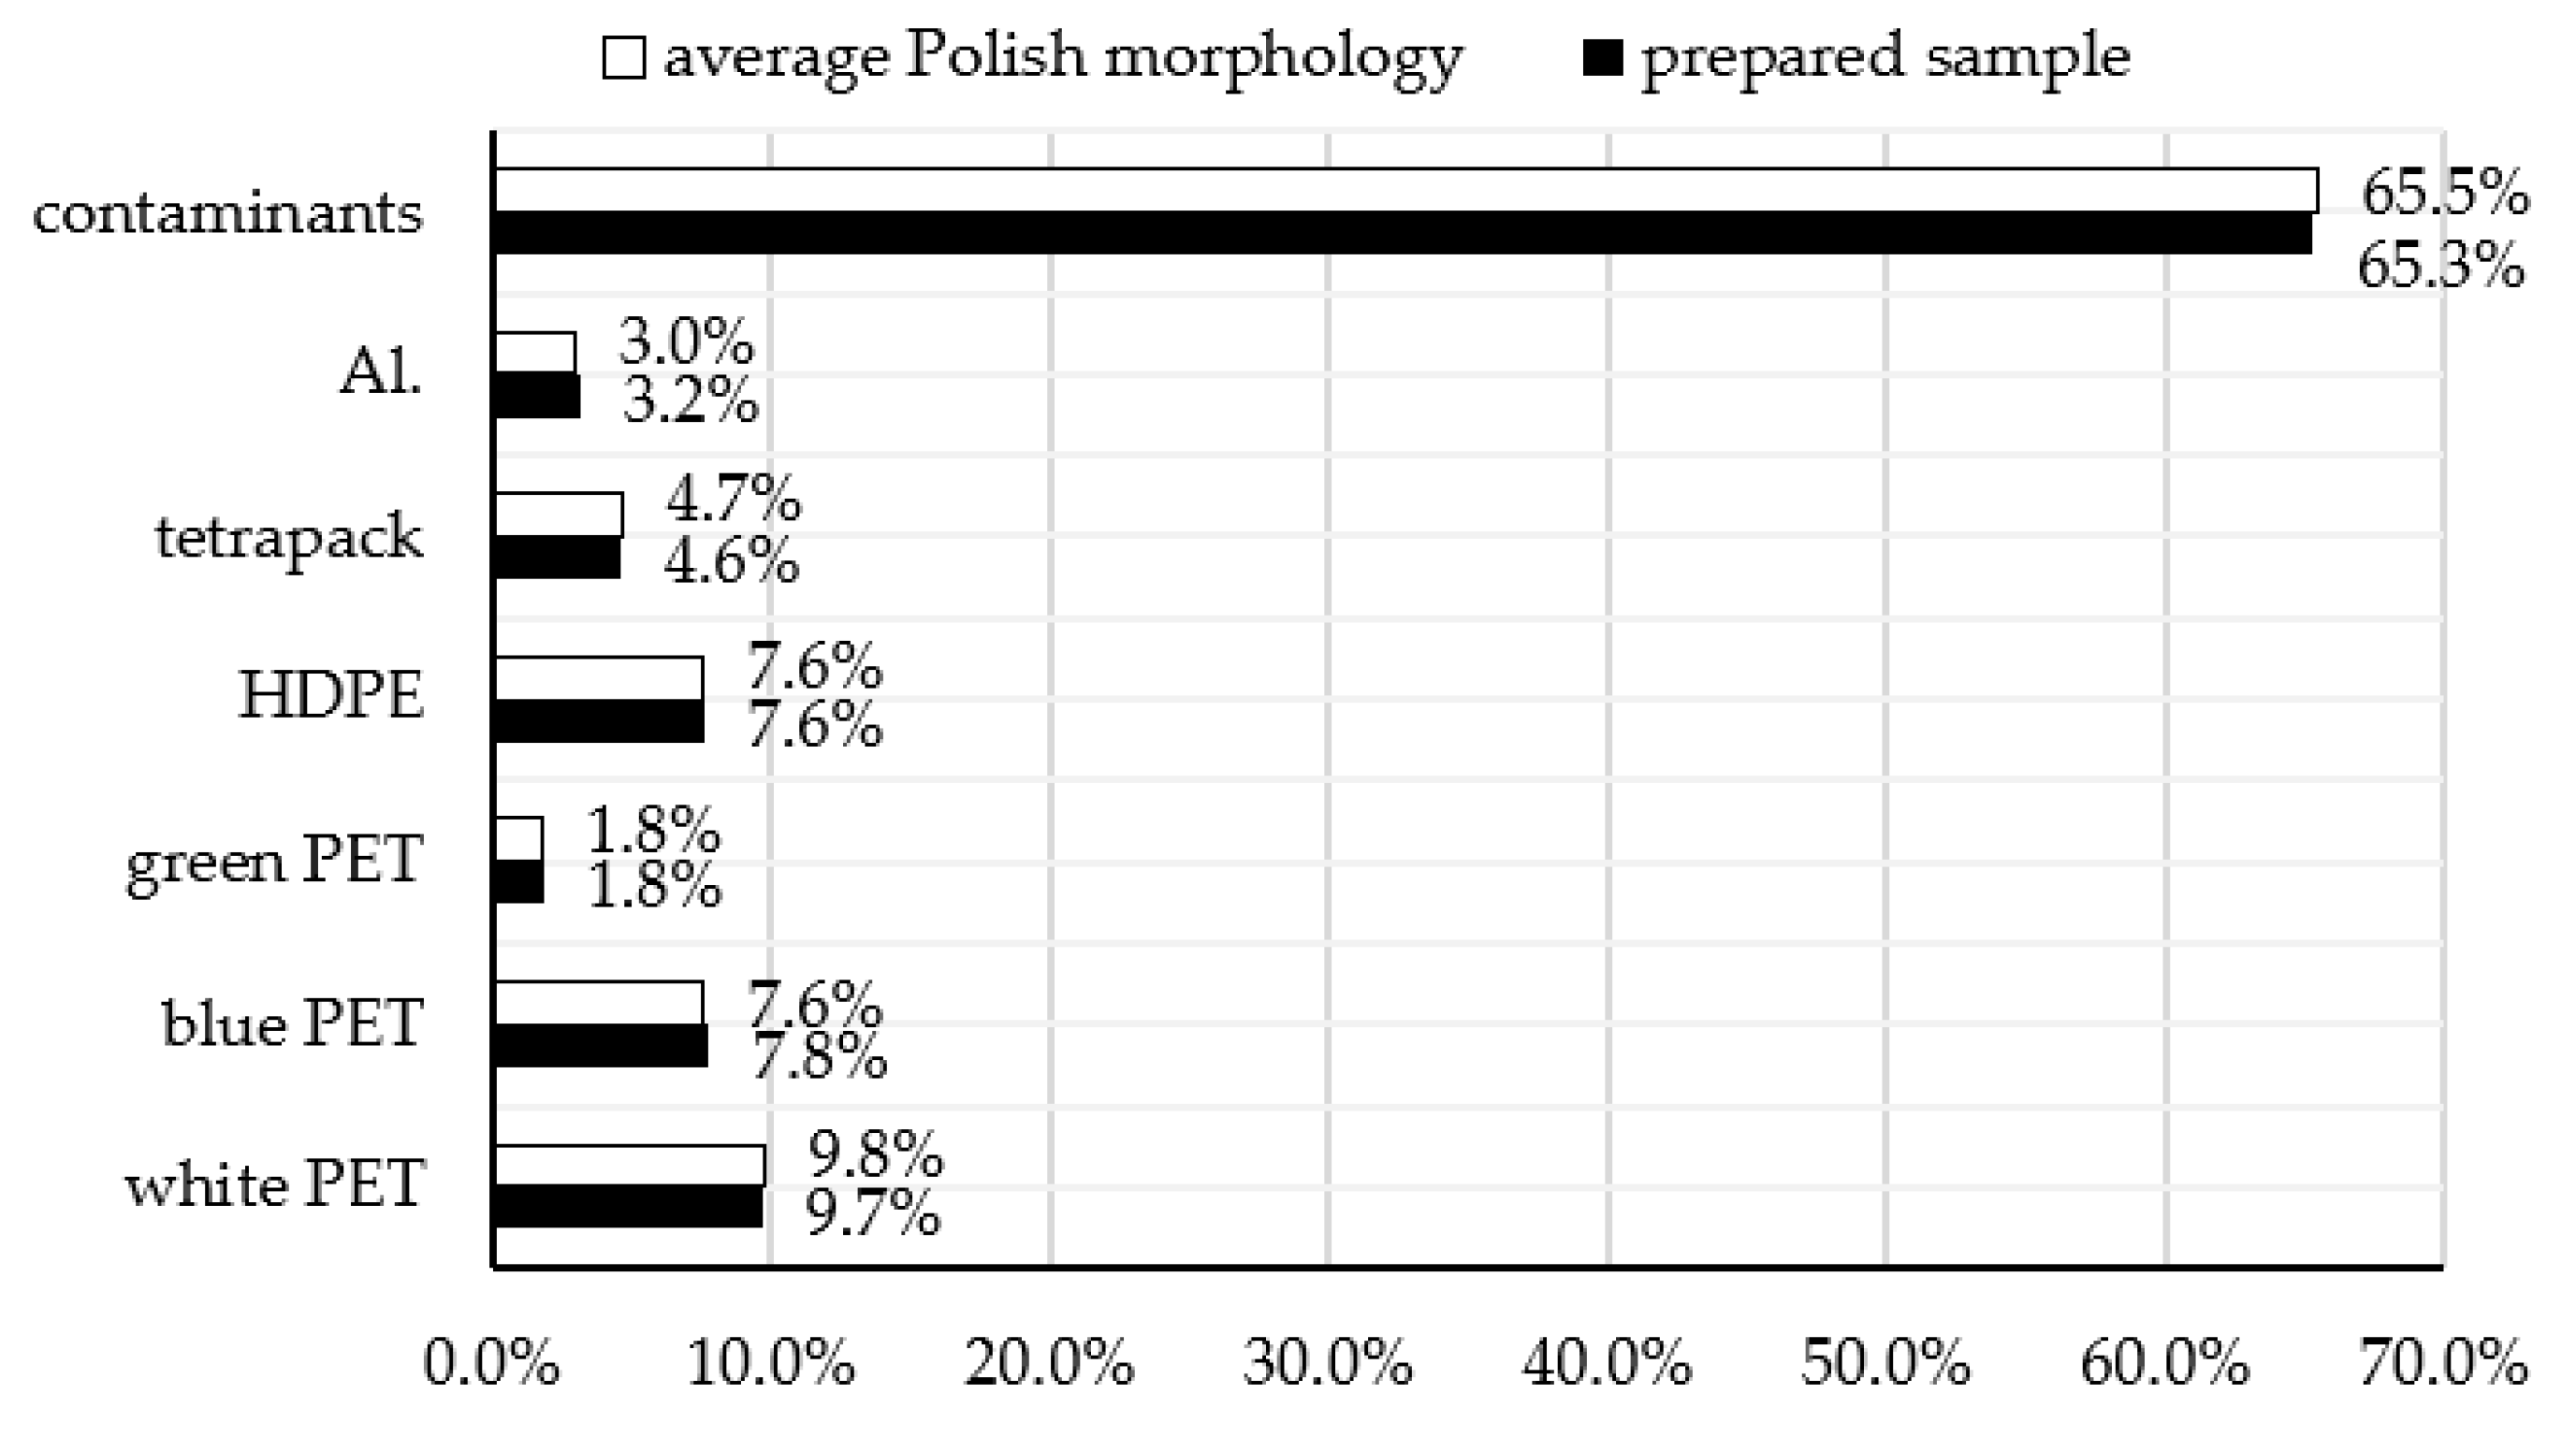
Figure 10.
Progression of Precision, Recall, and mAP throughout the YOLOv5 training process for (a) model 1a (b) model 1b (c) model 2.
Figure 10.
Progression of Precision, Recall, and mAP throughout the YOLOv5 training process for (a) model 1a (b) model 1b (c) model 2.
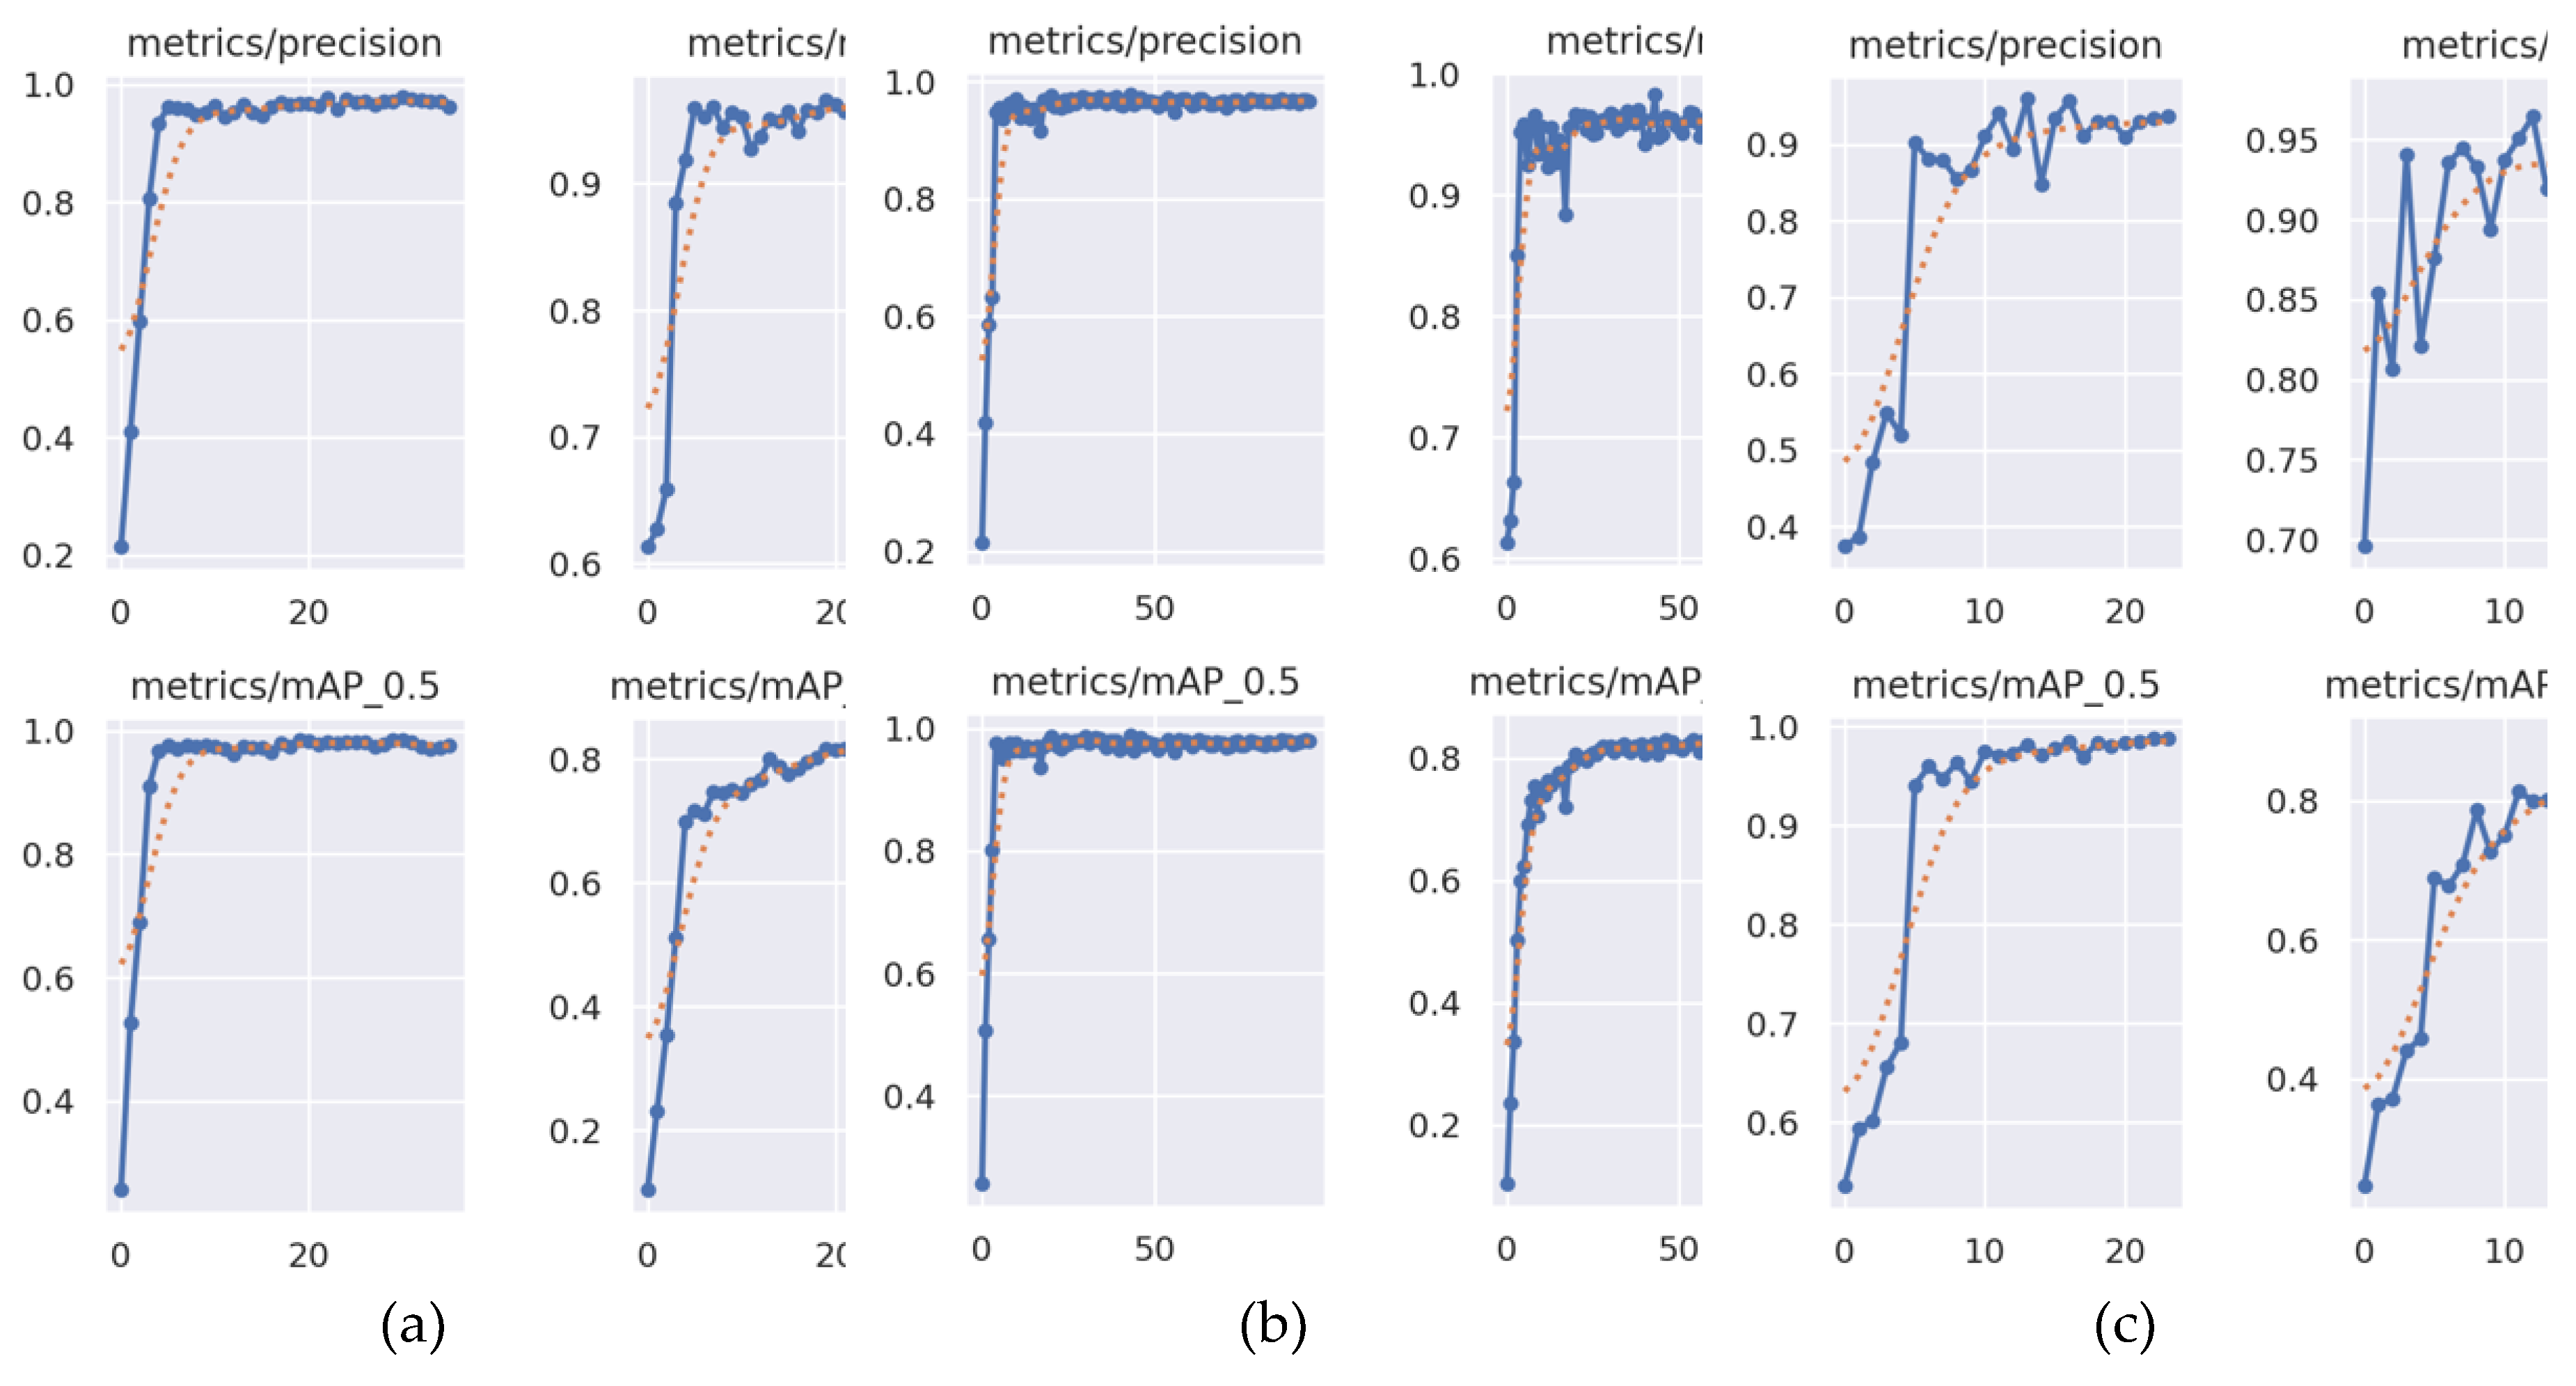
Figure 11.
confusion matrices generated by the trained YOLO models (a) model 1a (b) model 1b (c) model 2.
Figure 11.
confusion matrices generated by the trained YOLO models (a) model 1a (b) model 1b (c) model 2.
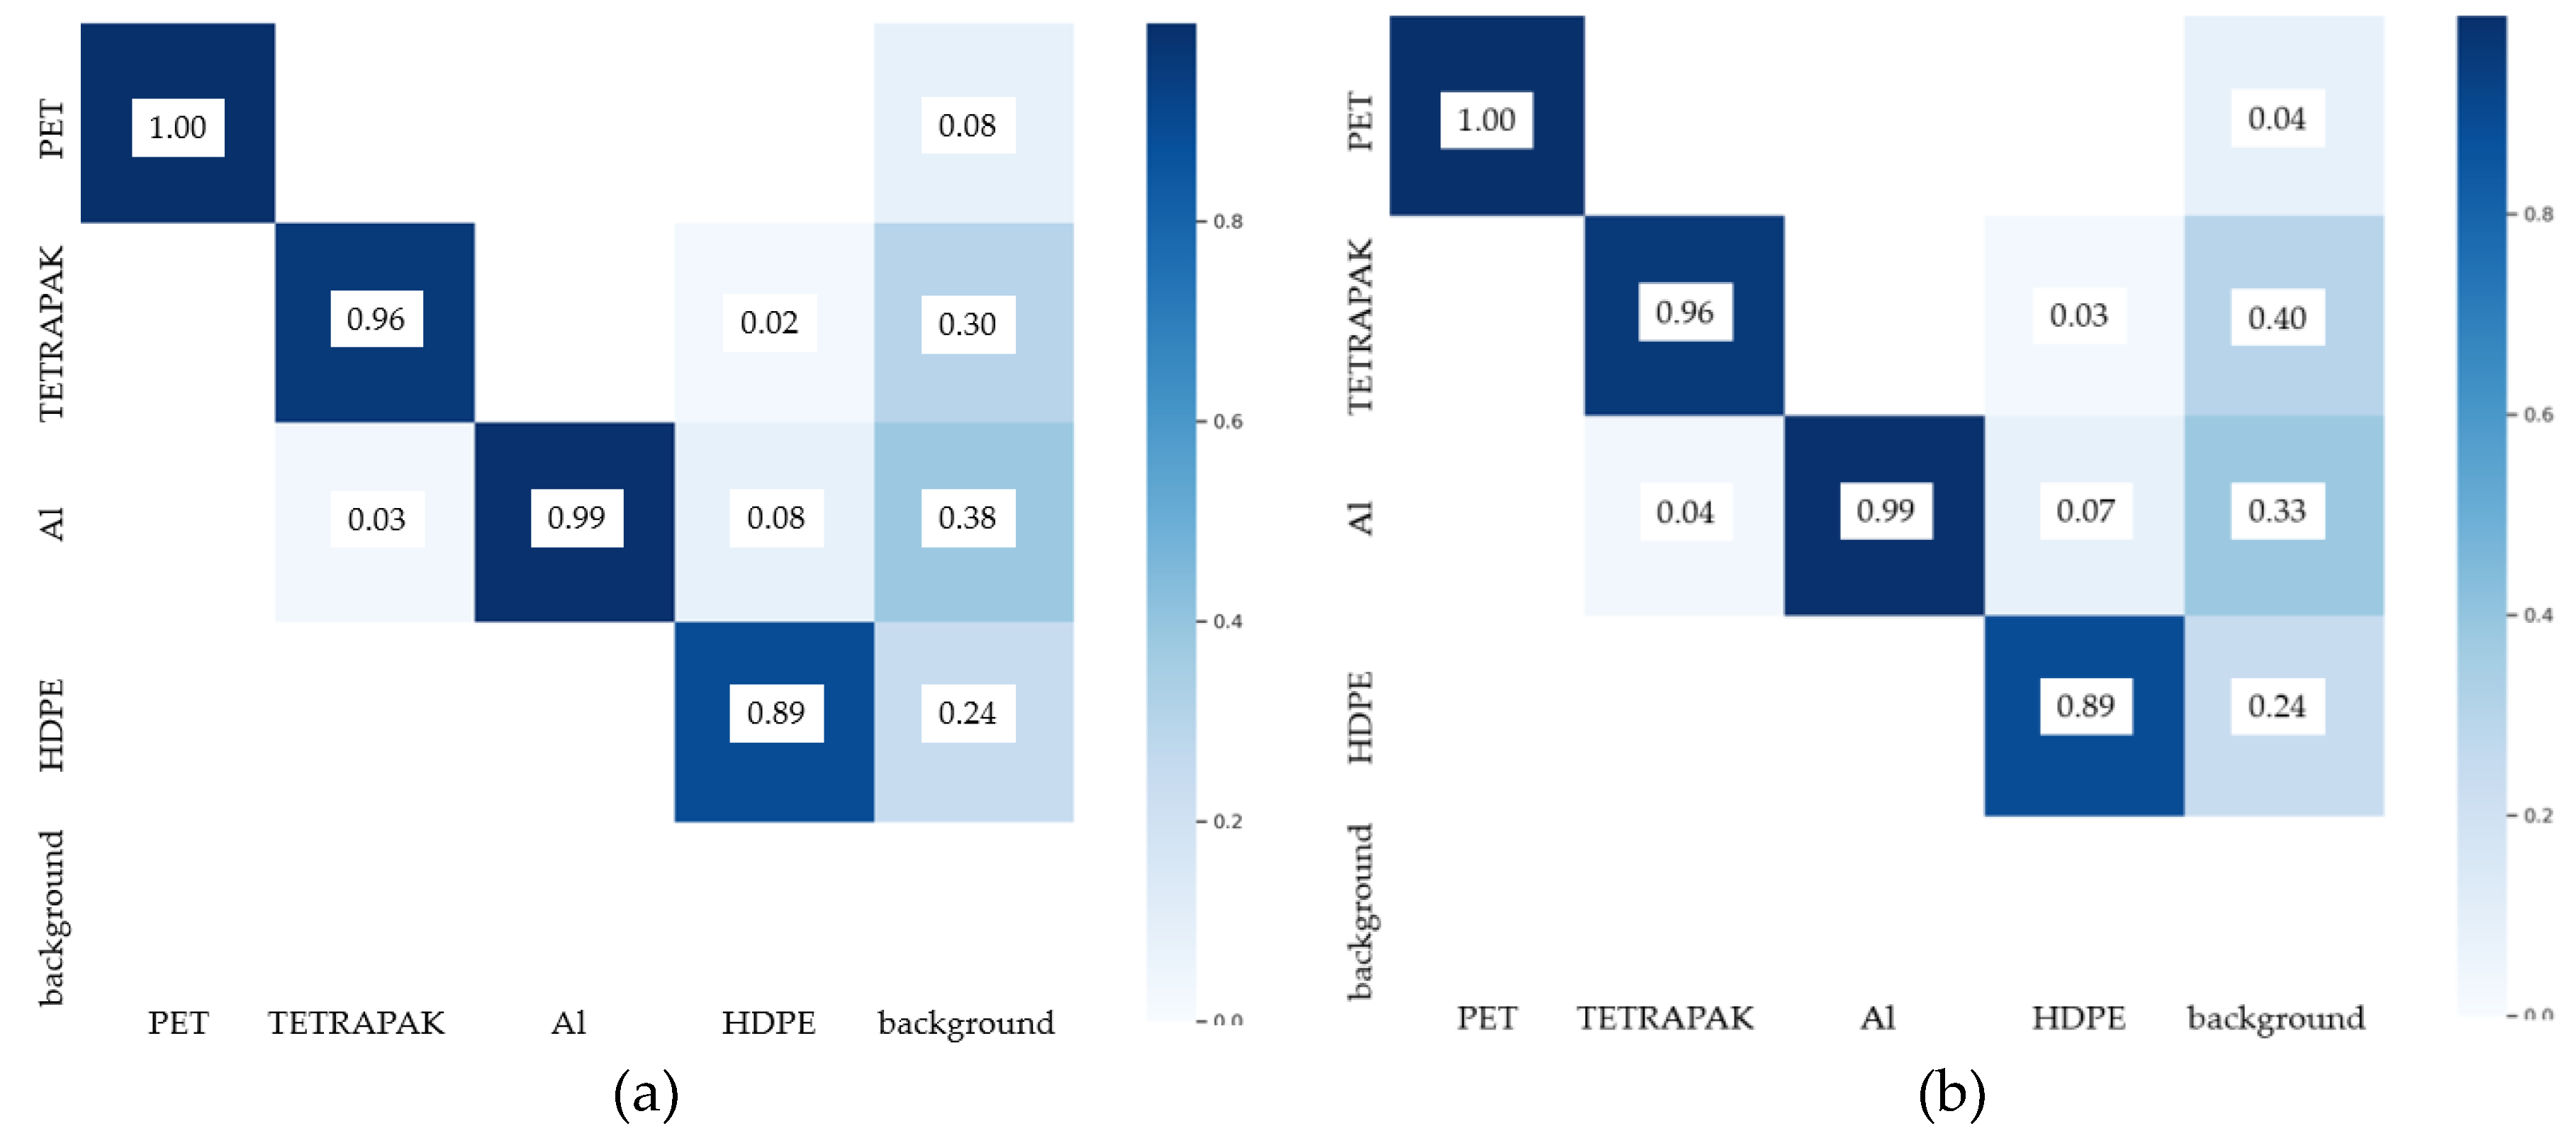
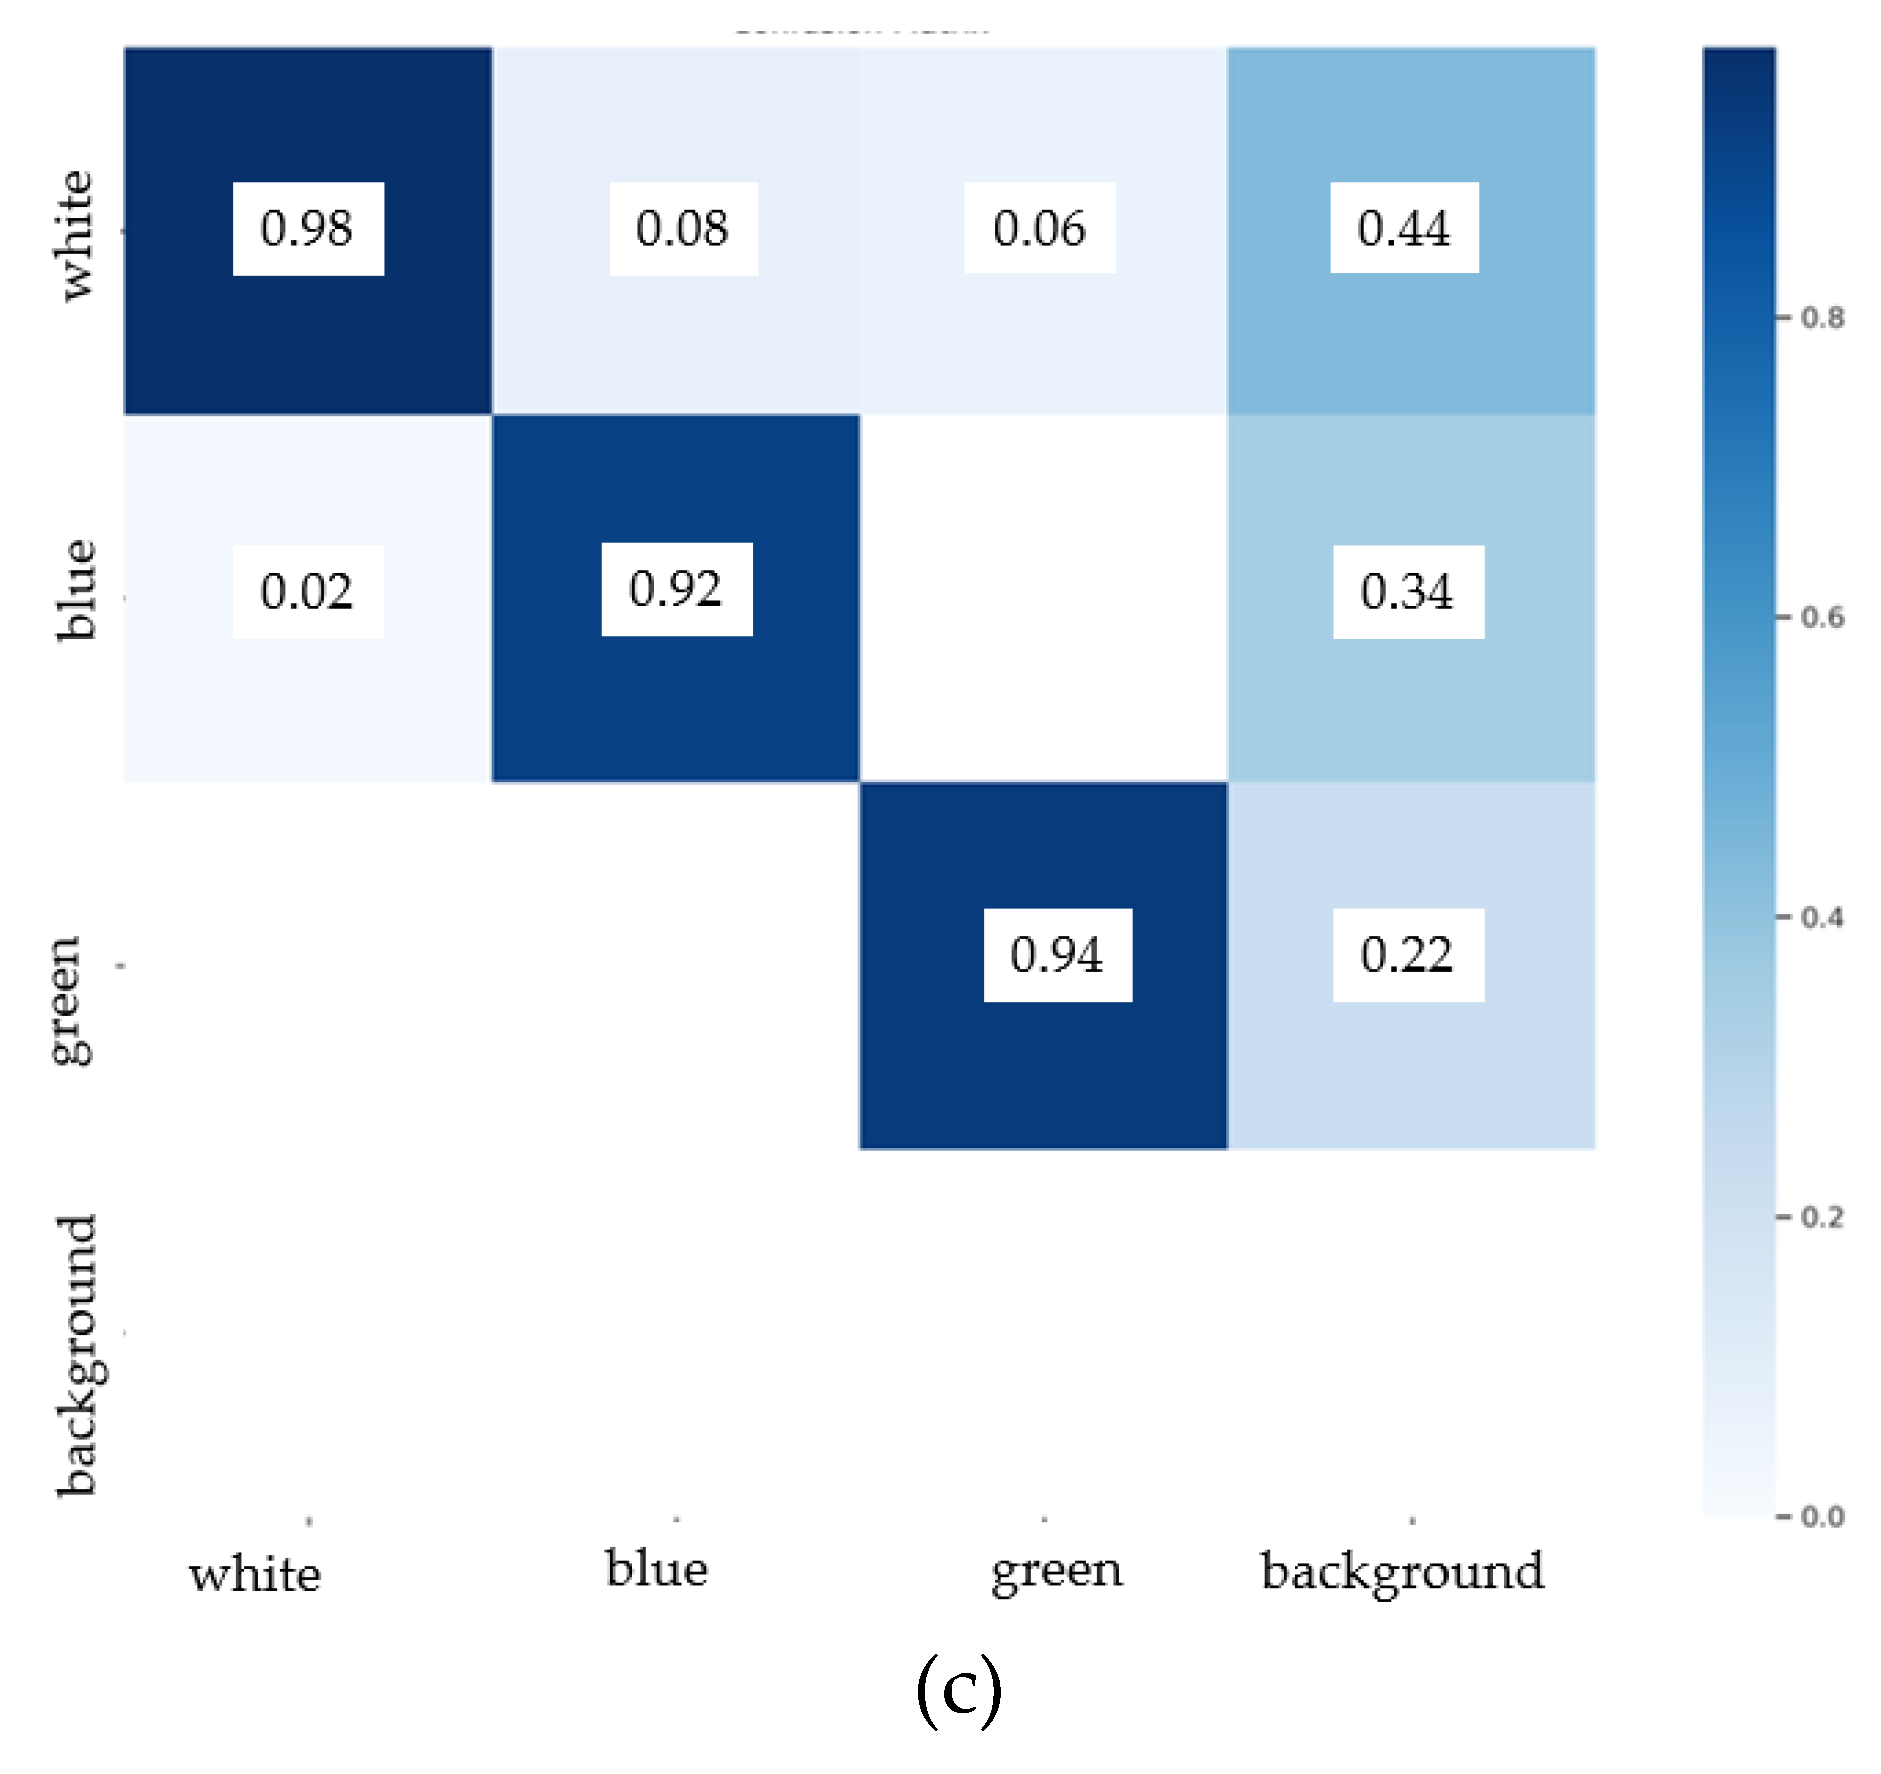
Figure 12.
The visualization of the model's performance under conditions replicating a real-world sorting facility.
Figure 12.
The visualization of the model's performance under conditions replicating a real-world sorting facility.
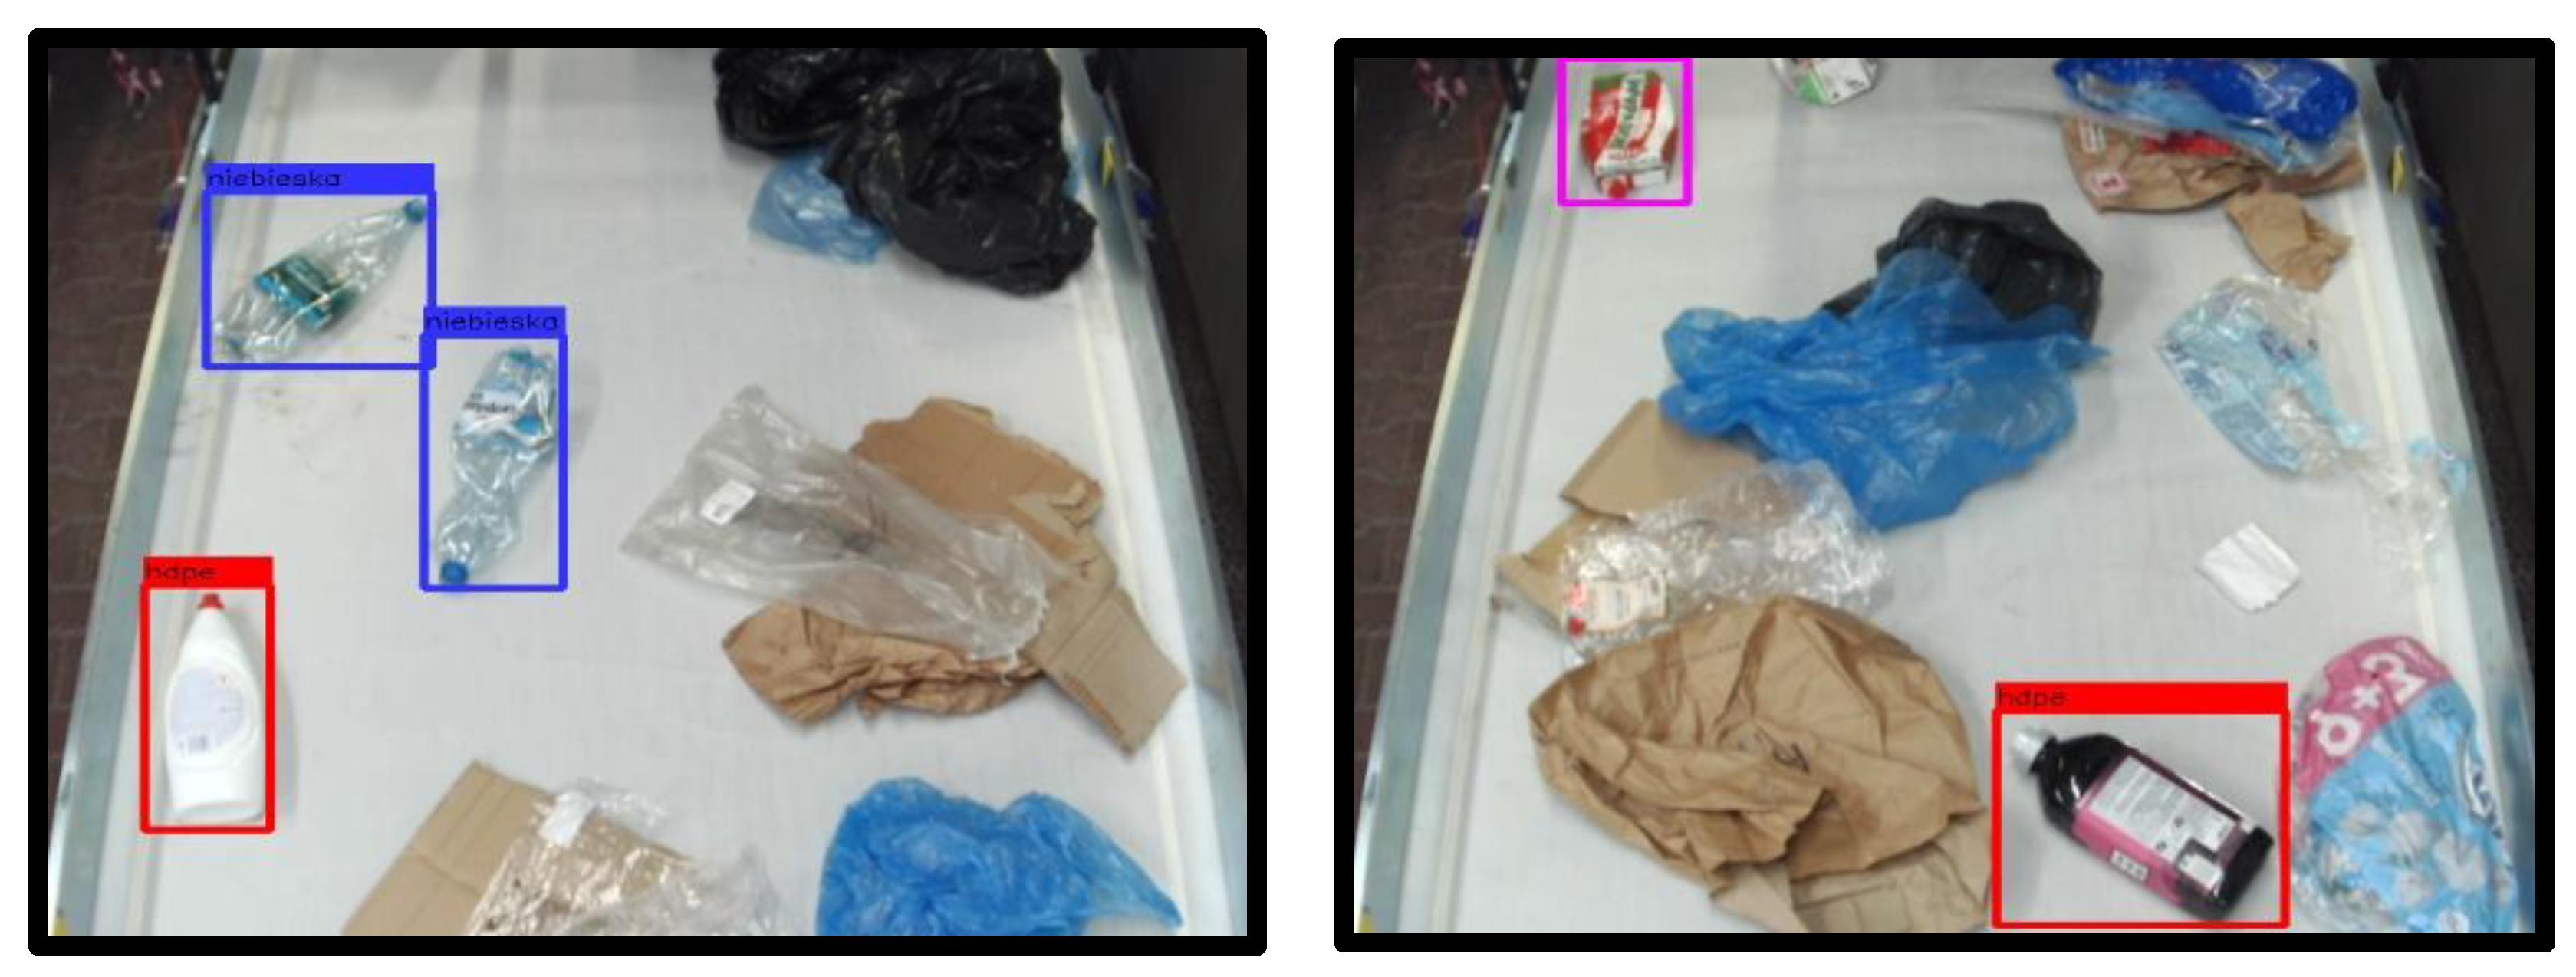

Table 1.
Summary of selected review publications in the area of automatic waste stream identification.
Table 1.
Summary of selected review publications in the area of automatic waste stream identification.
| Ref. | Key conclusions | Main limitations of current developments |
|---|---|---|
| [3] | The predominant approach to waste identification involves processing images captured by visible light cameras utilizing a CNN model. | - unrealistic, generic datasets not specific to any particular geographical region- testing under laboratory conditions- rarely used sensor fusion |
| [8] | CNN has been increasingly applied since 2018 and became the most frequently applied by 2021. Additionally, about a third of all studies focused on plastics. | - more than 90% of all studies were conducted on a laboratory scale- little research addressed material flow level analysis, and no studies were found at the process level |
| [9] | Deep Learning has emerged as the leading computer vision algorithm for enabling efficient solid waste sorting. | - simplified operational conditions resulting in a disconnect between research outcomes and practical applications in real-world settings- lack of publicly accessible real-world datasets that are specifically aligned with industrial waste sorting practices |
| [10] | In recent years, CNN has demonstrated outstanding performance in the field of image classification. | - there are few waste image datasets available for model training- lack of large-scale datasets |
| [11] | Integrating various sensors with suitable algorithms alongside industrial robots can achieve highly effective performance even in complex conditions that challenge human expertise. | - most experiments are conducted in controlled laboratory environments |
| [12] | In recent years, machine learning has gained growing significance in the advancement of sensor-based sorting systems. | - insufficient consideration of plastic waste heterogeneity - capabilities of multi-sensor solutions remains underutilized |
Table 2.
Summary of selected publications from recent years in the area of automatic waste identification based on CNN YOLO.
Table 2.
Summary of selected publications from recent years in the area of automatic waste identification based on CNN YOLO.
| Ref. | Waste type | Contaminants | Validation | Dataset | Classes |
|---|---|---|---|---|---|
| [14] | construction | included (without detection) | static | public and self-build | 4 (bricks, wood, stones, plastics) |
| [15] | household | included (detected class) | static | self-build | 10 (not recyclable, textile, leather, paper, metal, plastic, glass, wood, ceramic, food) |
| [16] | plastic | excluded | static | public | 4 (PET, PE, PP,PS) |
| [17] | plastic | included | dynamic | self-build | 2 (PET, PET-G) |
| [18] | river floating garbage | excluded | static | private and public | only detection |
| [19] | household | excluded | static | self-build | 4 (recyclable, other, harmful, kitchen) |
| [20] | household | included (without detection) | static | self-build | 9 (paper, plastic, snakeskin bags, packed waste, stone, sand, carton, foam, metal) |
Table 3.
Summary of selected publications from recent years in the area of automatic waste.
| Stage | Recommendations |
|---|---|
| I. Waste collection | - collecting waste with as much variation as possible, - collecting the same waste many times with different shapes due to the level of compaction and with various features (e.g., no label, no cap) - consideration of subsequent dataset balancing (class equalization) -collection of not only waste intended for detection but also contaminants |
| II. Capturing images | - taking into account overlapping waste, varying positions on the conveyor, and changing lighting conditions |
| III. Data augmentation | -for the detection of waste, geometric augmentation (rotation, scaling) is of great importance |
| IV. Labelling | -the use of image annotation tools (e.g., Labelimg) to reduce labeling time |
| V. Train/test split | -rule of thumb gives an 80/20 ratio |
Table 4.
Comparison of the final performance metrics of each model.
| Model | Precision | Recall | mAP_0.5 | mAP_0.5:0.95 |
|---|---|---|---|---|
| 1a | 0.961 | 0.964 | 0.977 | 0.824 |
| 1b | 0.967 | 0.963 | 0.979 | 0.837 |
| 2 | 0.936 | 0.972 | 0.988 | 0.899 |
Table 5.
Comparison of the final performance metrics for each class.
| Class | Accuracy | Precision | Recall | F1-score |
|---|---|---|---|---|
| blue PET | 0.96 | 0.99 | 0.90 | 0.94 |
| green PET | 0.98 | 0.99 | 0.85 | 0.91 |
| white PET | 0.94 | 1.00 | 0.84 | 0.91 |
| tetrapak | 0.97 | 0.89 | 0.90 | 0.89 |
| Al | 0.95 | 0.98 | 0.86 | 0.91 |
| HDPE | 0.95 | 0.96 | 0.76 | 0.84 |
Disclaimer/Publisher’s Note: The statements, opinions and data contained in all publications are solely those of the individual author(s) and contributor(s) and not of MDPI and/or the editor(s). MDPI and/or the editor(s) disclaim responsibility for any injury to people or property resulting from any ideas, methods, instructions or products referred to in the content. |
© 2025 by the authors. Licensee MDPI, Basel, Switzerland. This article is an open access article distributed under the terms and conditions of the Creative Commons Attribution (CC BY) license (http://creativecommons.org/licenses/by/4.0/).
Copyright: This open access article is published under a Creative Commons CC BY 4.0 license, which permit the free download, distribution, and reuse, provided that the author and preprint are cited in any reuse.


