
Submitted:
25 July 2025
Posted:
28 July 2025
You are already at the latest version
Abstract
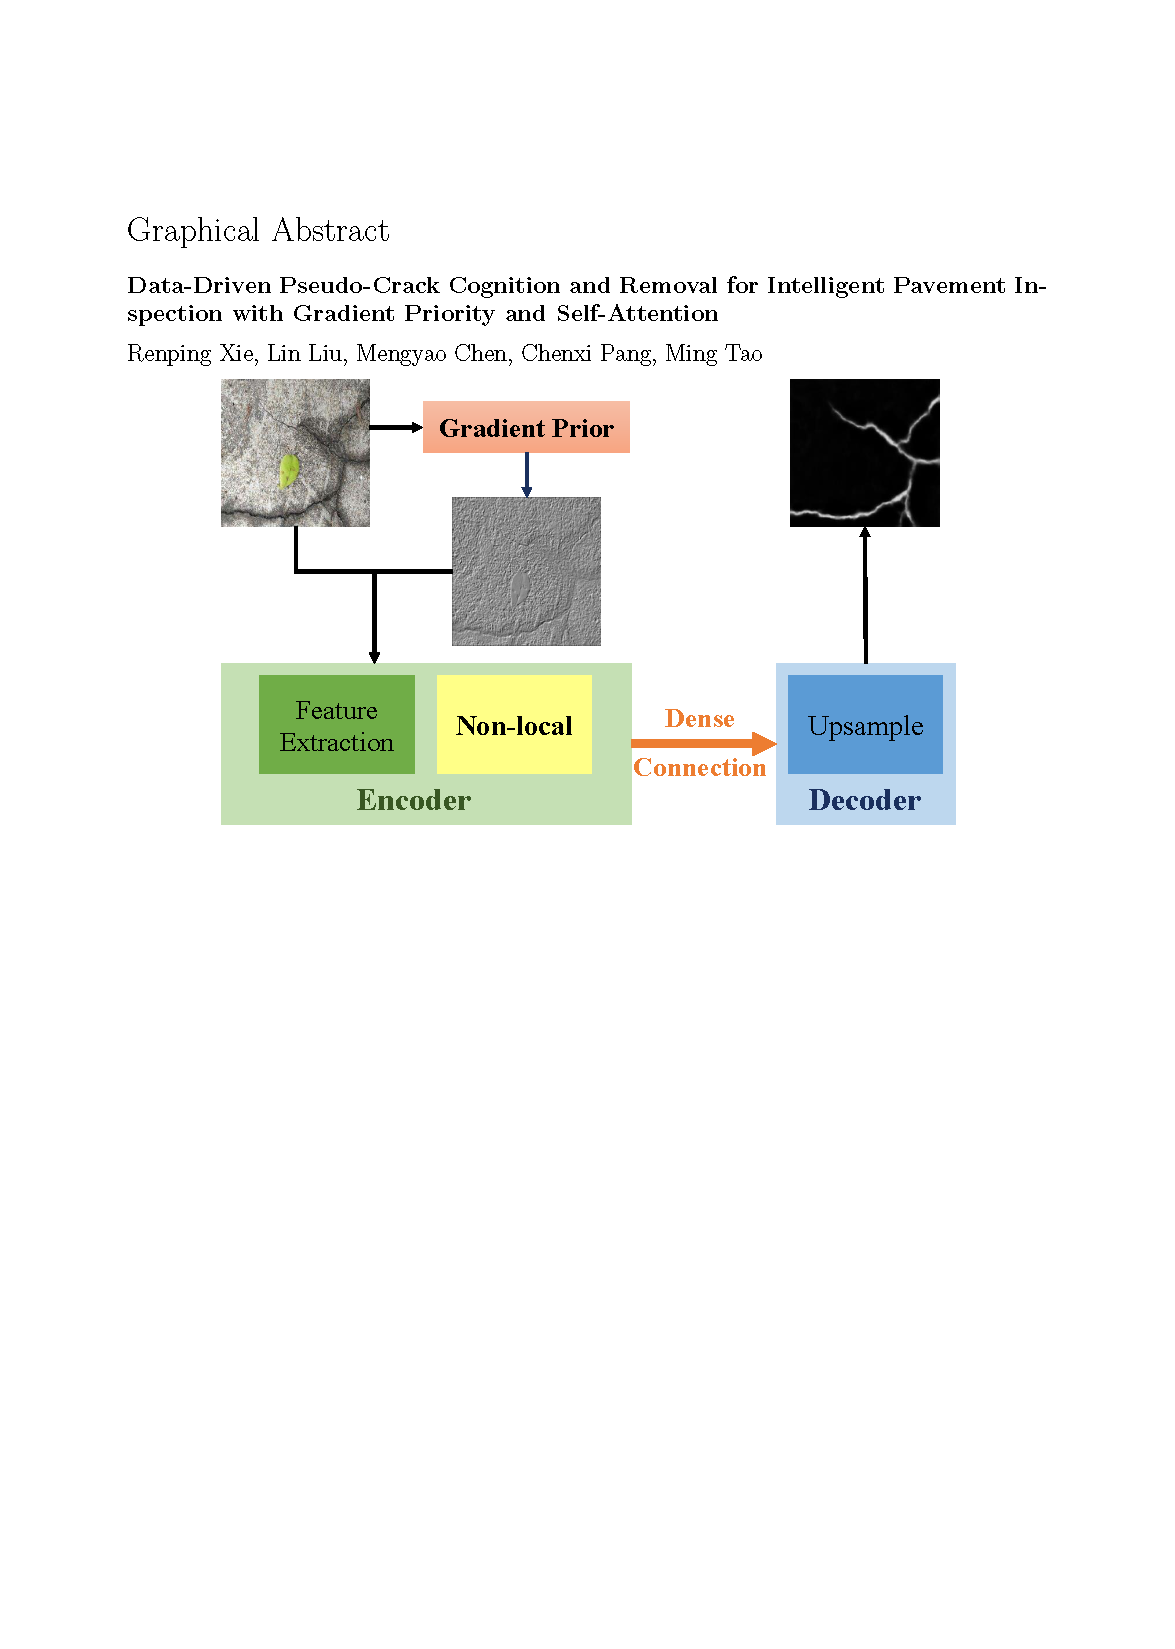
Road surface cracks are the most common and significant diseases in pavement inspection. However, the presence of crack-like edges on objects such as water stains, fallen leaves, and ruts often result in the false detection of road cracks. To better recognize pseudo-cracks, we first construct a novel dataset containing real pseudo-crack images for training and evaluation. To distinguish pseudo-cracks within images, a gradient prior is introduced to enhance the network's perception of the detailed changes in crack edges, thereby improving its crack localization capability. Next, a self-attention mechanism is employed to focus on the extraction of global crack features, effectively mitigating interference from pseudo-crack features. Subsequently, deep global semantic features are fused with shallow detail features through dense connections, enriching feature extraction while circumventing the issue of edge gradient disappearance often encountered in deeper networks. Finally, the concatenation of deep global features with shallow detail features enhances the utilization of effective features, enabling robust pseudo-crack removal and preserving the continuity and integrity of the detected cracks. To validate the effectiveness of the proposed approach, we conduct comparative experiments with several crack detection methods across multiple dataset. The results demonstrate that our method achieves superior performance in both quantitative indicators and visual effects.
Keywords:
crack detection
; pseudo-crack removal
; image segmentation
1. Introduction
The advent of smart cities has driven road inspection departments to utilize automated inspection equipment to obtain surface images of concrete structures, such as bridges and roads. Subsequently, the images are analyzed by intelligent inspection systems to monitor the health of these structures. The timely detection and repair of road problems, such as cracks and honeycomb pockmarks on concrete pavements, is of paramount importance for effective road maintenance [1]. However, interference from objects such as fallen leaves, water stains, and rutting complicates the analysis of road surface images. The edges of these objects often resemble actual cracks, leading to false positives and missed detections [2,3]. Such misidentification impairs the ability of inspection personnel to accurately assess road surface conditions and may delay the detection of potential safety hazards, particularly on concrete bridge pavements. Therefore, enhancing the recognition system’s ability to distinguish pseudo-cracks, eliminate their interference, and accurately extract continuous and complete crack structures is of significant research importance.
The development and application of artificial intelligence is becoming a key trend in road maintenance, with the incorporation of such technology into concrete pavement image inspection systems [4]. Currently, most concrete pavement crack detection methods use traditional fully convolutional neural networks (FCNNs), such as U-Net and VGG16. These methods are typically trained and tested on road images with relatively clean backgrounds and minimal interference, which limits the algorithm’s generalization ability and the effectiveness in actual pavement crack detection. Issues such as incomplete and discontinuous crack and pseudo-crack are common.
A minority of automatic concrete pavement crack detection technologies employ improved FCNNs, which can overcome the limitations of traditional FCNNs. This results in enhanced semantic segmentation, thereby enhancing the accuracy of crack recognition and the efficiency of detection. However, the majority of these improved FCNNs continue to undervalue the significance of information transmission between multiple encoders and decoders. The encoder-decoder structure often relies on a simple cascade relationship and fails to build correlations between the output information of adjacent encoders. This results in the loss of detailed features, which in turn leads to problems with insufficient image features and the inability to eliminate pseudo-cracks in complex environments, as shown in Figure 1. For a clearer comparison, we marked the crack area (, green box) to illustrate the completeness of the detection, and the non-crack area (, red box) to illustrate the method’s anti-interference ability to pseudo-cracks. We can see that the comparison methods are failed under the interference of tree branches, while our methods get more integrity and robust crack detection results.
To effectively remove the pseudo-crack, we propose a data-driven pavement crack detection algorithm that integrates gradient prior and dense connection. There are many pseudo-cracks in real concrete crack images, such as water stains, fallen leaves and shadows. We construct a dedicated pseudo-crack pavement dataset and adopt a data-driven approach to enhance the crack detection system’s ability to recognize and remove pseudo-cracks. By incorporating gradient priors, attention mechanisms, and dense connections, the proposed method improves the model’s capacity to differentiate true cracks from pseudo-cracks, thereby reducing false detections and enhancing the integrity, continuity, and accuracy of crack identification.
The main contributions are as follows:
- A dataset comprising pseudo-crack images is constructed for training and evaluation; The gradient prior is introduced to enhance the localization ability of tiny cracks while accelerating the extraction of network self-learning features;
- The encoder introduces dense connections and self-attention, which enables the network to focus on the extraction of multi-scale features and global features, thereby improving the network’s ability to distinguish pseudo-cracks;
- The decoder employs a concatenation of multi-scale crack feature maps to integrate shallow detail features and deep semantic features, thereby obtaining a more accurate and complete crack segmentation result.
The remainder of this paper is organized as follows. Section 2 briefly describes the related works on morphology-based and deep learning methods for crack detection. In Section 3, we introduce our proposed gradient prior in detail, including the gradient prior, self-attention mechanism and dense connections. Section 4 illustrates the crack detection performance of our method in comparison with other alternatives on the collected crack dataset, followed by some concluding remarks in Section 5.
2. RelatedWork
2.1. Morphology-Based Crack Detection
In comparison to grayscale information regarding cracks, the morphology of cracks, such as crack contours, topological structures, and continuity, more accurately describes their characteristics and is less susceptible to interference from complex backgrounds. The edge of an object typically exhibits significant gray-scale changes, which can be measured by gradient operators. The most commonly employed gradient operators are Sobel, Prewitt, and Laplacian. However, when these gradient operators are used directly for edge detection, they are susceptible to being influenced by background noise [7,8]. The Canny operator, proposed as an optimization of the aforementioned gradient operators, is a widely used method for object edge detection due to its ease of implementation, high efficiency, and high precision [9,10]. Despite these advantages, the Canny operator struggles to identify small and smooth edges and is susceptible to noise [11].
Due to the intricate topological structure of cracks, it is possible to consider them as connected graphs composed of individual pixels. Among the image segmentation methods based on graph theory, the classic algorithms include GraphCut [12], NormalizedCut [13] and GrabCut [14]. Wang et al. [15] proposed an image segmentation method that integrates graph theory and guided filtering. Payab et al. [16] focuses on crack detection based on graph theory. The image skeleton is initially extracted, after which the connected components are identified and the endpoints and branch points of the crack group are located. For each crack group, a connectivity matrix is established, and a tree diagram is created. Finally, the path of the crack is traced from the starting point to the endpoint, and its geometric features, including length, average width, and overall direction, are determined. Building on minimal path selection, Kaddah et al. [17] proposed a more efficient unsupervised crack detection algorithm, which significantly reduced the computation time. However, morphological methods still encounter difficulties in segmenting cracks in road images with complex textures, and they often require manual intervention to configure the algorithm, which consumes significant manpower and material resources.
2.2. Deep Learning for Crack Detection
In recent years, deep learning has been widely used in various image processing fields due to its remarkable capacity for generalization and feature extraction. In theory, it can be used to fit any function, thereby enabling the solution of a multitude of complex real-world problems. The rapid development of neural networks for detection tasks has led to the widespread use of CNNs in the field of crack detection. Compared to traditional image processing methods, CNNs possess self-learning capabilities and do not require manual feature design [18]. Furthermore, the performance of the majority of CNNs is less susceptible to variations in image quality, camera type, and imaging distance.
The fully connected layers of classic CNNs have a substantial number of parameters, require a fixed input image size, and are unable to preserve spatial information. Long et al. [19] replaced the final fully connected layer of CNNs with a convolutional layer, enabling the network to handle pixel-level tasks and perform end-to-end training. To improve the segmentation precision of tiny cracks, Tiny-Crack-Net [20] uses a residual network to capture the local features of tiny cracks and introduces a dual-head attention module to better separate tiny cracks from the background. Based on the encoder-decoder framework, Yang et al. [21] use a progressive context fusion module to aggregate features of adjacent scales, supplement lost detail features, and obtain more global context features. Additionally, a dynamic weight learning module was put forth as a means of augmenting the network’s capacity to fuse features of disparate scales. Liu et al. [5] incorporated an upsampling side output layer into the VGG16 to achieve network supervision and accelerate convergence. Subsequently, the fused images of all side output layers are optimized through conditional random fields and guided filtering, thereby obtaining the final fusion prediction map. The experimental results demonstrate that the F1-score of the DeepCrack network is significantly improved compared to networks such as SegNet [22] and HED [23], and it performs well in detecting cracks with a width of only a few pixels.
2.3. Attention and Dense Connections
The attention mechanism enables neural networks to emulate the human capacity to focus on key areas in input images while ignoring less relevant areas, thereby improving overall performance and efficiency. Al-Huda et al. [24] introduced a dual attention mechanism (DAM) between the U-Net encoder and decoder, integrated multiple loss functions as the network’s loss function to optimize the network. The network proposed an asymmetric dual decoder CNN based on U-Net. Guo et al. [25] uses two U-Net structures to address the shortcomings of inaccurate crack boundaries and blurred edges in prediction results. The initial U-Net locates the crack area and generates a rough prediction, which is then integrated with the output of the edge adaptation module and fed into the second U-Net for more refined crack detection. However, this network requires manual adjustment of the penalty weights for the various types of crack in the loss function. Gao et al. [26] further introduced the atrus spatial pyramid fusion attention module in U-Net to mitigate the impact of non-crack interference in road crack images on crack detection. Additionally, they constructed a remote sensing road crack dataset using UAV. However, due to the limitations of UAV image acquisition distance and imaging conditions, the mIoU and F1-scores of the proposed method are not ideal.
Dense connections facilitate the fusion of features of different depths, enabling the extracted features to incorporate both shallow detail and deep semantic information. The encoder of U-Net consists of convolutional layers and max pooling layers, while the decoder consists of upsampling layers and skip connections [27]. U-Net is a variant of FCNNs, that offers several advantages, including simplicity, efficiency, ease of understanding, and ease of construction. Furthermore, it can be trained using relatively small datasets. It is important to note that while FCNNs fuse features by adding the corresponding position values of feature maps, U-Net fuses features by concatenating the number of channels. Jing et al. [28] introduced a convolutional attention module (CBAM) that combines channel attention and spatial attention in the encoder and decoder of U-Net, and proposed the AR-UNet network model. The CBAM has proven effective in extracting both global and local detail information, resulting in favorable outcomes on current public datasets. Similarly, Li et al. [29] established a new crack detection model, ATCrack, based on the U-Net architecture by introducing a channel attention module in the encoder and adding a spatial attention module in the decoder. The integration of these two attention modules has been demonstrated to enhance the model’s capacity for local feature extraction and background noise suppression.
In order to solve the problem of low crack detection accuracy of existing models in complex environments, Liang et al. [30] proposed an end-to-end crack segmentation network model CSNet, which integrates parallel dilated convolution, multi-scale context fusion module and attention mechanism. In order to obtain multi-scale local information and effectively aggregate deep features to increase the model’s perception of cracks, Hang et al. [31] proposed an attention-based feature fusion network model AFFNet, which uses the vertical horizontal compression attention module to integrate vertical and horizontal information, and then achieves selective concentration on crack features through the context information provided by the efficient channel attention upsampling module.
CNNs are constrained by the receptive field of the convolution kernel, limiting them to extracting only local features. In contrast, self-attention enables the extraction of global features, thereby improving the anti-interference ability against local pseudo-crack features. In light of the above considerations, we incorporate the self-attention mechanism into the encoder of our method, with the objective of enhancing the global feature perception ability.
3. Proposed Method
3.1. The Architecture of Detection Network
The structure of our crack detection network is shown in Figure 2, and comprises three primary components: the gradient prior, the encoder, and the decoder. The gradient prior enhances the edges of tiny cracks and improves the network’s ability to locate cracks. The encoder incorporates self-attention and dense connections, enabling it to focus on extracting global and multi-scale features, thereby enhancing the network’s ability to distinguish pseudo-cracks. The decoder concatenates multi-scale crack feature maps to achieve the fusion of shallow detail features and deep semantic features, resulting in a more accurate and complete crack segmentation map.
3.1.1. Gradient Prior
The feature map of the neural network is generated by applying the self-learning convolution kernel to the output of the preceding layer. A greater value in the feature map indicates greater confidence in the feature described by the convolution kernel at that specific position. The shallow layers of the neural network are responsible for learning detailed features such as edges, which are crucial for crack segmentation. Consequently, we introduce gradient prior as part of the network input, which helps the network focus on edge features and accelerates the self-learning process of the convolution kernel.
The Sobel and Laplace operators are two common gradient operators used for edge detection in image processing. The Sobel operator, a first-order differential, is employed primarily for the approximate gradient calculation of image gray-scale. In contrast, the Laplace operator, a second-order differential, is designed to identify abrupt changes in image gray-scale rather than areas with gradual gray-scale changes, offering stronger edge positioning capability. Therefore, our method introduces a gradient prior, as shown in Figure 3. The gradient prior is a combination of both the Sobel and Laplace operators. The image gradient information extracted by the Sobel operator retains strong texture features, while the Laplace second-order differential operator captures finer-grained texture features. This gradient prior compensates for the loss of detail information in concrete pavement images, enhancing the neural network’s ability to segment and identify cracks, and ensuring more complete and continuous crack extraction in concrete pavement images.
3.1.2. Encoder
As illustrated in Figure 3, the encoder comprises three components: a two–layer encoding convolutional layer, dense connections, and self-attention. The subsequent convolutional layer performs a second convolution operation on the previous output, thereby obtaining the feature map to be encoded.
Dense Connections: To address the problem of insufficient feature extraction in crack detection, our method introduces encoders and decoders connected in a specialized dense connection mode. Shallow neural networks extract local features such as texture, edges, and other detailed information, whereas deep networks extract more abstract semantic information. The specialized dense connection mode proposed by our method propagates deep features to shallow layers, thereby combining the abstract global features of the deep layer with the detailed features of the shallow layer. This approach enables the reuse of effective features. Dense connections enhance the utilization of effective features, thereby enriching the feature information extracted by the network while avoiding issues such as slow training speed and gradient vanishing caused by deepening the network.
Nonlocal: To address the problems of incomplete and discontinuous crack detection and pseudo-crack interference, our method incorporates a self-attention mechanism into the encoder. This mechanism enhances the network’s ability to extract and learn global features by calculating the correlation between each pixel in the input feature map and all other pixels. The incorporation of a nonlocal mechanism enhances the network’s capacity to identify and eliminate pseudo-cracks, thereby improving the accuracy of crack detection.
The self-attention mechanism is typically incorporated into the neural network structure for crack detection through a stacking method. However, this approach may result in the network losing the original convolutional layer outputs, which could lead to segmentation results that focus more on global features while losing shallow detail features, which are crucial for crack extraction. Therefore, our method preserves the convolutional outputs of different layers by means of concatenating connections. The deep encoder is capable of extracting deep semantic information, such as edge contours, color, shape, and other crack features. We add the attention mechanism only after the concatenated output of the deep encoder, ensuring that the decoder focuses more on key information and reduces attention to irrelevant information. This approach not only increases the utilization of effective features but also overcomes the problem of global information interfering with the encoder’s deep feature extraction. This approach enables the network to learn deep semantic features in a more comprehensive and accurate manner.
Moreover, the self-attention mechanism can easily learn deep semantic features containing noise, which can interfere with image segmentation results and reduce the model’s generalization. To address this issue, our method places the self-attention layer before the decoding convolution layer. The deconvolution operation of the decoding convolution layer can then decide whether to superimpose the deep semantic features learned by the self-attention layer while retaining the original network’s features. This approach avoids the interference of noisy deep semantic information on image segmentation results and enhances the network model’s generalization and robustness.
3.1.3. Decoder
The decoder is composed of five sequentially stacked decoding blocks. The function of these decoding blocks is to perform channel concatenation and deconvolution on the output of the corresponding encoder and the subsequent encoder, thereby generating the crack feature map of the pavement image.
The multi-level convolutional layers are capable of extracting both detailed and global features of the image. Shallow convolutional layers are proficient at extracting detailed features, which are crucial for maintaining the integrity of crack outlines and edges. However, it is possible that they may also misinterpret noise edges as cracks. In contrast, deep convolutional layers are better able to extract global features more accurately and effectively separate cracks from the background. However, the excessive number of pooling layers in deep convolutional layers results in the loss of most detailed information, leading to relatively blurry edge extraction of cracks. Therefore, our method utilizes a deconvolution layer to restore the output of different convolutional layers to the size of the input image. Subsequently, the results are concatenated by channel and subsequently passed through the convolutional layer to obtain more comprehensive crack detection results.
Furthermore, in order to guarantee the stability of the network structure, a normalization layer is incorporated after each convolutional layer, followed by an activation function. The normalization layer normalizes each batch of data, which can accelerate model convergence and mitigate the issue of scattered distribution of deep network features. The activation function used is the ReLU function, which performs nonlinear activation following each convolution operation.
3.2. Loss Function
In the conventional approach to CNNs, the model’s loss function is typically calculated based on the output of the final convolutional layer. This results in the loss of local detail information obtained by the shallow convolutional layers. In contrast, we employ a different methodology, whereby the sum of the prediction result loss from each convolutional layer, from Conv1 to Conv5, along with the final fusion (Fuse) prediction result loss, is used as the final loss for the entire network model. The loss functions for the prediction results of each convolutional layer and the final fusion stage can be expressed as follows:
where m is the index of the convolutional layer, x denotes the input image, y represents the labeling image, and denotes the prediction loss weight of each convolutional layer, which can be adjusted as a hyperparameter. The loss function is denoted as . is the fusion weight. In authentic crack images, the proportion of pixels representing cracks to the total number of pixels is typically quite modest. When the gradient descent method is employed to minimize the loss function of the traditional cross-entropy, the background color pixels tend to dominate the optimization process, while the effect of the foreground color pixels on the loss function is relatively minor. Therefore, we employ an extended version of the Focal loss [32] as the loss function, with the following expression:
where the pixel belongs to the background color if . Conversely, if , it is deemed to represent a crack in the image. The parameter serves the function of a balancing factor, which is utilized to adjust the weights of positive and negative samples within the loss function. Given that the number of background pixels is typically much larger than the number of crack pixels, it is necessary to increase the contribution of the crack pixels to the loss function by adjusting the weights. The value of is typically set to 0.25.
The dataset comprises two distinct categories of crack images: those that are readily identifiable due to their clear boundaries and the absence of pseudo-cracks, and those that present greater challenges due to the presence of pseudo-cracks and significant interference. As the weight increases, the contribution of easily distinguishable samples to the total loss decreases. The adjustment factor is employed to balance the training process, with the typical value set at 2. This adjustment ensures a balanced training process that takes into account both simple and challenging crack images.
Therefore, the loss function for each convolutional layer’s prediction result and the loss function for the final fusion (Fuse) prediction result are expressed as follows:
In conclusion, our method enhances the segmentation efficacy of concrete pavement cracks and can expeditiously, efficiently, and accurately identify cracks in concrete pavement images with high usability.
4. Experiment
4.1. Implementation Details
The proposed method is optimized using Stochastic Gradient Descent (SGD) with the following parameters: a batch size of 1, a momentum of 0.9, a weight decay of , the number of training iterations of , and an initial learning rate of . The proposed method is implemented using the PyTorch library with Python 3.6 on the Ubuntu 18.04 operating system. All training and testing are conducted within the same hardware environment with Intel(R) Xeon(R) Silver 4210R CPU @ 2.40GHz and NVIDIA GeForce RTX 3090 GPU.
4.2. Crack Datasets
DeepCrack [5] provides a dataset with 537 images for concrete crack segmentation, but the majority of them have no noise. However, there are many non-crack noise in reality concrete crack images, such as water stains, fallen leaves and shadows. Therefore, a new dataset of 501 crack images with common crack-like noise was created for crack detection and segmentation which are taken on the campus. As shown in Figure 4, it can be seen that most of them contain interference noise to increase the diversity of the samples. Furthermore, all the images are coherently resized to pixels, each with a pixel-wise annotation map.
To address the issue of having fewer images and limited human resources for manual annotation, the original pixel images are rotated at degrees, a total of 8 times. Then horizontal flipping is applied to each rotated image. As a result, the number of images used for training is 16 times large than the original dataset. Finally, the newly proposed dataset and the DeepCrack dataset are merged to create the DeepCrack-AUG dataset.
The remaining three datasets are employed to evaluate the models that have been trained on the DeepCrack-AUG dataset. CRACK500 is presented in [33], and it comprises a substantial number of crack images. The dataset has 3,368 images with pixel-level annotated binary maps collected on Temple University’s main campus using cell phones [34]. Crackdataset [35] consists of 225 pavement survey images from 14 cities. Specifically, the Crackdataset contains 150 images of non-cracks. The CrackForest Dataset (CFD) is proposed in [36,37], which includes 118 urban road crack images with pixel-level annotations.
4.3. Evaluation Criteria
To investigate the effectiveness of the models, the F1-score, ACC (Accuracy), ODS (Optimal Dataset Scale), AUC(Area Under Curve), mIoU(Mean Intersection over Union), mPA(Mean Pixel Accuracy) and AP (Average Precision) are used to quantitatively evaluate the comparison results. For all these metrics, higher values signify better performance. The ODS represents the optimal F1-score obtained by setting the same threshold for all images within the dataset. AUC represents the area under the ROC curve. The mIoU measures the average overlap between the predicted segmentation and the ground truth for all classes. The calculation formulas for ODS [4] is as follows:
where the symbol t represents the threshold, the variable N refers to the number of images in the dataset, and the index i is used to identify individual images. and represent the precision and recall respectively. The values of and are calculated for image i. The calculation formulas for mIoU is as follows:
where represents predicting class i as class j.
4.4. Comparison Experiment on Our DeepCrack-AUG Dataset
To comprehensively evaluate the proposed algorithm, we compare our method with six state-of-the-art approaches, including two specialized crack detection approaches, , DeepCrack [5] and Hierarchical DeepCrack [6], three general segmentation approaches, , DeepLabv3+ [38], Segformer [39] and Segnet [22], and one medical image segmentation approache, , UNet [27]. The DeepCrack-GND is the proposed model that incorporates the gradient block, non-local block and dense connection. The Hierarchical DeepCrack uses an encoder-decoder architecture implemented on SegNet, and the extracted features from the encoder and decoder networks are pairwise fused at the same scale. DeepLabv3+ is a semantic segmentation network that improves spatial accuracy and context understanding by integrating atrous spatial pyramid pooling and encoder-decoder architecture. SegNet represents a conventional deep convolutional encoder-decoder architectural approach, whereas Segformer is a pioneering transformer-based model. UNet is for biomedical image segmentation and is characterized by its U-shaped structure with symmetrical encoder and decoder paths. The DeepCrack-AUG dataset is partitioned into a training set and a test set with a ratio of 7:3, and then employed to train and test the aforementioned models.
4.4.1. Quantitative Comparison
The PR curve of the seven models is plotted according to the experimental results with different thresholds, as shown in Figure 5. The horizontal and vertical coordinates of the PR curve represent recall and accuracy, respectively. It can be observed that the DeepCrack-GND curve consistently lies above the other curves and achieves the best F1-score. The F1-score, which is the harmonic mean of precision and recall, takes into account both the accuracy and the recognition ability of the model [40]. A higher F1-score indicates a better overall performance of our model. When tested on the DeepCrack-AUG dataset, the proposed model achieved higher values in Accuracy(98.45), ODS (84.76), AUC (99.0), mIoU(86.49), mPA(90.7) and AP (94.09), compared to the other models, as shown in Table 1. The results demonstrate that our method is more effective than specialized crack detection approaches, namely DeepCrack and Hierarchical DeepCrack. Additionally, on our proposed dataset, it demonstrates that the proposed method produces superior outcomes compared to state-of-the-art image segmentation approaches, including DeepLabv3+, Segformer, SegNet, and UNet.
4.4.2. Qualitative Comparison
The qualitative comparison of the methods on the DeepCrack-AUG datasets is shown in Figure 6. For a clearer comparison, we marked the crack area (, green box) to illustrate the completeness of the detection, and the non-crack area (, red box) to illustrate the method’s anti-interference ability to pseudo-cracks. In terms of pseudo-crack removal, the proposed methods is capable of effectively distinguishing block spots (first row), fallen leaves and fallen branches (fourth and sixth rows), whereas other models tend to misclassify these as cracks, such as DeepCrack, Hierarchical DeepCrack and DeepLabv3+.
As illustrated in the green boxes in the first and second rows, other models frequently suffer from incomplete detection to varying degrees. In contrast, our proposed model demonstrates consistent capability to identify complete cracks under various conditions. This improvement can be attributed to the enhancement of the network’s segmentation and crack detection capabilities through the introduction of the gradient prior and the incorporation of dense connections, which provide richer feature representations. The incorporation of the non-local module has enhanced the network’s capacity to identify and eliminate false cracks. In particular, as illustrated in the first and fourth rows, our proposed network effectively filters out false cracks caused by shadows, fallen leaves, and other similar artifacts, without mistakenly discarding real cracks. This results in the preservation of more complete crack structures.
It is noteworthy that DeepLabv3+ and our method demonstrate superior capabilities in preserving the integrity of detected cracks. Unfortunately, DeepLabv3+ is susceptible to interference from the edges of some pseudo-cracks (, fallen leaves in the image of fourth row and water stains in the image of sixth row in Figure 6). Consequently, only our method can effectively ensure a more complete crack structure and resist the interference of pseudo-cracks simultaneously.
4.5. Comparison Experiment on Public Datasets
To evaluate the generalizability of the compared networks, the models are tested on the Crack500, CFD and Crackdataset datasets after being trained on the DeepCrack-AUG dataset and selected as the optimal model during the training process.
4.5.1. Quantitative Comparison
The means of ACC, ODS, AUC, mIoU, mPA and AP are computed on three datasets, as shown in Table 2. Our proposed model achieves the highest mean Accuracy (96.27), mIoU (68.84), AP (81.46), and sub-optimal mean ODS (59.49), AUC (94.79), mPA (81.46) which are only slightly lower than the best. A classifier is employed to predict and classify a randomly selected positive and negative sample. The AUC represents the probability that the score assigned to a positive sample will be higher than that assigned to a negative sample. As illustrated in Figure 7, the DeepCrack method (the fourth column) detects a greater number of crack areas than our method, resulting in a slightly higher AUC. However, our approach not only exhibits superior visual performance but also attains the best or comparable results in quantitative index comparison when compared to these comparative methods.
4.5.2. Qualitative Comparison
The visualization of the detection results for the compared methods on the three datasets is shown in Figure 7. As illustrated in the figure, the selected images present a considerable challenge to the generalization abilities of these methods. For a clearer comparison, we marked the crack area (, green box) to illustrate the completeness of the detection, and the non-crack area (, red box) to illustrate the method’s anti-interference ability to pseudo-cracks.
As the model was only tested on these datasets and not trained on them, its performance may not be as robust as previously indicated. Notwithstanding the aforementioned limitations, the proposed model continues to demonstrate promising results. To illustrate, the first, second, and fifth rows demonstrate that our network is capable of detecting even minute cracks, whereas other networks either identify only limited portions or fail to detect them entirely. It is postulated that the the dense connections and the non-local module are believed to have enabled the network to learn a broader range of features, thereby allowing it to perform well even when faced with new data.
In these challenging images, only our method and the original DeepCrack are capable of detecting cracks to a satisfactory degree of completeness. However, the original DeepCrack method has been observed to misidentify non-crack areas as cracks, resulting in a high error rate. As shown in the fourth image of Figure 7, the complex background can readily interfere with crack detection, leading to suboptimal results with the original DeepCrack method. This experiment further demonstrates that only our method can achieve complete and robust crack detection results, regardless of the tiny cracks or complex backgrounds.
4.6. Ablation Experiment
To demonstrate the efficacy of each component, we integrated each module into the baseline DeepCrack to conduct ablation experiments. The DeepCrack-AUG dataset is employed for the training of each models, including baseline DeepCrack, DeepCrack-GD, DeepCrack-NL, DeepCrack-DC, DeepCrack-GND. The DeepCrack-NL is the original DeepCrack network with non-local layers. The DeepCrack-GD incorporates gradient features into the input image within the original DeepCrack network. The DeepCrack-DC is based on the original DeepCrack and added dense connections.
4.6.1. Quantitative Comparison
The gradient module, non-local module, and dense connections all contribute to improved performance, as demonstrated in Figure 8. It can be observed that the DeepCrack-GND curve consistently lies above the other curves and achieves the best F1-score. The DeepCrack-GD and DeepCrack-NL methods achieved suboptimal results, yet demonstrated superior performance relative to the original DeepCrack approach. When tested on the DeepCrack-AUG dataset, DeepCrack-GND achieved higher values in ACC (98.45), AP (94.09), ODS (84.76), mIoU (86.49) and mPA (90.72) compared to the other models, as shown in Table 3.
Methods incorporating gradient modules, non-local operations, or dense connections have shown improved performance compared to the original DeepCrack. Our method, which integrates all three aforementioned modules, has been shown to achieve the best overall performance. Prior to being input into the network, the image is first processed to extract first-order and second-order gradients, which enhances the image. The goal of this approach is to capture deep features with fine-grained detail while retaining coarse-grained features for texture enhancement. Secondly, during feature extraction, the non-local module improves detection accuracy by calculating the correlation between each pixel in the feature map and all other pixels. This allows the network to more effectively extract and learn global feature information. Finally, to address the ineffective use of features, dense connections are incorporated into DeepCrack. These connections integrate features from both shallow and deep layers, fusing detailed and global information. Consequently, feature reuse results in a more comprehensive set of extracted features.
4.6.2. Qualitative Comparison
The visualization results of the ablation experiment are presented in Figure 9. For a clearer comparison, we marked the crack area (, green box) to illustrate the completeness of the detection, and the non-crack area (, red box) to illustrate the method’s anti-interference ability to pseudo-cracks. The DeepCrack-GND, which incorporates the gradient, non-local, and dense modules, shows superior visualization for crack detection compared to models with only one new module added to the baseline DeepCrack. We zoom in on the regions with the green box to illustrate the completeness of crack detection. In addition, a salient area is highlighted by a red box to reveal the issue of non-crack regions being incorrectly identified as cracks. It can be demonstrated that only DeepCrack-GND can ensure the integrity of the detected cracks while exhibiting a higher ability to resist pseudo-crack interference.
5. Conclusion
In this paper, we propose a data-driven pseudo-cracks removal for road crack inspection system. To address the scarcity of pseudo-crack images, we first construct a new dataset with real pseudo-crack images for training and evaluation. To optimize the network architecture, we introduce a gradient prior that enhances the model’s sensitivity to subtle variations along crack boundaries, thereby improving crack-edge localization. Global crack-feature extraction is prioritized through the incorporation of self-attention mechanisms, which effectively suppress interference from pseudo-crack artifacts. Next, dense connections are employed to fuse deep global semantic features with shallow detail features, strengthening representation capacity while mitigating the gradient-vanishing problem inherent to deeper networks. Finally, the refined fusion of deep and shallow features ensures the complete utilization of informative cues and guarantees the continuity and integrity of the extracted cracks. Extensive experiments on our newly established dataset and several public benchmarks demonstrate that the proposed method outperforms state-of-the-art alternatives in both effectiveness and robustness.
However, there are also some deficient aspects that need further improved in our approach. Given that the pseudo-cracks in some images are connected to the real cracks and share similar image features, it is possible that our method may still result in misjudgment during the actual recognition process. Currently, the real-time performance of the network is not yet optimal. To address this, optimizing and adjusting the network structure is necessary to enhance processing speed and efficiency. These problems will be explored in greater depth in forthcoming research.
Author Contributions
Conceptualization, R.X.; methodology, R.X. and M.C.; software, M.C.; validation, R.X., M.C. and C.P.; formal analysis, L.L. and M.T.; resources, L.L. and M.T.; data curation, C.P. and M.C.; writing—original draft preparation, R.X. and M.C.; writing—review and editing, M.T. and C.P.; visualization, M.C.; funding acquisition, L.L. and M.T. All authors have read and agreed to the published version of the manuscript.
Funding
This research is supported in part by Dongguan Science and Technology of Social Development Program (Grant No. 20211800904712); in part by the 2023 Shaoguan City Project for Scientific Researchers (Project No. 230330178036169).
Conflicts of Interest
The authors declare that the research was conducted in the absence of any commercial or financial relationships that could be construed as a potential conflict of interest.
References
- Simler, C.; Trostmann, E.; Berndt, D. Automatic Crack Detection on Concrete Floor Images. In Proceedings of the Photonics and Education in Measurement Science; 2019; pp. 191–200. [Google Scholar]
- Safaei, N.; Smadi, O.; Safaei, B.; et al. Efficient Road Crack Detection Based on an Adaptive Pixel-Level Segmentation Algorithm. Transportation Research Record 2021, 2675, 370–381. [Google Scholar] [CrossRef]
- Chen, X.; Li, J.; Huang, S.; et al. An Automatic Concrete Crack-Detection Method Fusing Point Clouds and Images Based on Improved Otsu’s Algorithm. Sensors 2021, 21, 1581. [Google Scholar] [CrossRef]
- Cao, W.; Liu, Q.; He, Z. Review of Pavement Defect Detection Methods. Ieee Access 2020, 8, 14531–14544. [Google Scholar] [CrossRef]
- Liu, Y.; Yao, J.; Lu, X.; et al. DeepCrack: A Deep Hierarchical Feature Learning Architecture for Crack Segmentation. Neurocomputing 2019, 338, 139–153. [Google Scholar] [CrossRef]
- Zou, Q.; Zhang, Z.; Li, Q.; et al. Deepcrack: Learning Hierarchical Convolutional Features for Crack Detection. IEEE Transactions on Image Processing 2018, 28, 1498–1512. [Google Scholar] [CrossRef]
- Ma, W.Y.; Manjunath, B.S. Edge Flow: A Framework of Boundary Detection and Image Segmentation. In Proceedings of the IEEE Computer Society Conference on Computer Vision and Pattern Recognition; 1997; pp. 744–749. [Google Scholar]
- Tao,M.; Chen, Z.; Liao, L.; et al. Edge Intelligence empowered Social Image Recognition using Microservices Architecture. 2024 IEEE International Conference on Social Computing and Networking, 2024; pp. 34–41.
- Canny, J. A Computational Approach to Edge Detection. IEEE Transactions on Pattern Analysis and Machine Intelligence 1986, 6, 679–698. [Google Scholar] [CrossRef]
- Wang, L.; Gu, X.; Liu, Z.; et al. Automatic Detection of Asphalt Pavement Thickness: A Method Combining GPR Images and Improved Canny Algorithm. Measurement 2022, 196, 111248. [Google Scholar] [CrossRef]
- Li, Y.; Liu, B. Improved Edge Detection Algorithm for Canny Operator. In Proceedings of the 2022 IEEE 10th Joint International Information Technology and Artificial Intelligence Conference (ITAIC); 2022; pp. 1–5. [Google Scholar]
- Boykov, Y.; Funka-Lea, G. Graph Cuts and Efficient ND Image Segmentation. International Journal of Computer Vision 2006, 70, 109–131. [Google Scholar] [CrossRef]
- Chew, S.E.; Cahill, N.D. Semi-Supervised Normalized Cuts for Image Segmentation. In Proceedings of the IEEE International Conference on Computer Vision; 2015; pp. 1716–1723. [Google Scholar]
- Rother, C.; Kolmogorov, V.; Blake, A. GrabCut: Interactive Foreground Extraction Using Iterated Graph Cuts. ACM Transactions on Graphics (TOG) 2004, 23, 309–314. [Google Scholar] [CrossRef]
- Wang, W.; Tu, A.; Bergholm, F. Improved Minimum Spanning Tree Based Image Segmentation with Guided Matting. KSII Transactions on Internet and Information Systems (TIIS) 2022, 16, 211–230. [Google Scholar]
- Payab, M.; Abbasina, R.; Khanzadi, M. A Brief Review and a New Graph-Based Image Analysis for Concrete Crack Quantification. Archives of Computational Methods in Engineering 2019, 26, 347–365. [Google Scholar] [CrossRef]
- Kaddah, W.; Elbouz, M.; Ouerhani, Y.; et al. Optimized Minimal Path Selection (OMPS) Method for Automatic and Unsupervised Crack Segmentation within Two-Dimensional Pavement Images. The Visual Computer 2019, 35, 1293–1309. [Google Scholar] [CrossRef]
- LeCun, Y.; Bottou, L.; Bengio, Y.; et al. Gradient-Based Learning Applied to Document Recognition. Proceedings of the IEEE 1998, 86, 2278–2324. [Google Scholar] [CrossRef]
- Long, J.; Shelhamer, E.; Darrell, T. Fully Convolutional Networks for Semantic Segmentation. In Proceedings of the IEEE Conference on Computer Vision and Pattern Recognition; 2015; pp. 3431–3440. [Google Scholar]
- Chu, H.; Wang, W.; Deng, L. Tiny-Crack-Net: A Multiscale Feature Fusion Network with Attention Mechanisms for Segmentation of Tiny Cracks. Computer-Aided Civil and Infrastructure Engineering 2022, 37, 1914–1931. [Google Scholar] [CrossRef]
- Yang, L.; Huang, H.; Kong, S.; et al. PAF-NET: A Progressive and Adaptive Fusion Network for Pavement Crack Segmentation. IEEE Transactions on Intelligent Transportation Systems 2023, 24, 12686–12700. [Google Scholar] [CrossRef]
- Badrinarayanan, V.; Kendall, A.; Cipolla, R. Segnet: A Deep Convolutional Encoder-Decoder Architecture for Image Segmentation. IEEE Transactions on Pattern Analysis and Machine Intelligence 2017, 39, 2481–2495. [Google Scholar] [CrossRef] [PubMed]
- Xie, S.; Tu, Z. Holistically-nested Edge Detection. In Proceedings of the IEEE International Conference on Computer Vision; 2015; pp. 1395–1403. [Google Scholar]
- Al-Huda, Z.; Peng, B.; Algburi, R.N.A.; et al. Asymmetric Dual-Decoder-U-Net for Pavement Crack Semantic Segmentation. Automation in Construction 2023, 156, 105138. [Google Scholar] [CrossRef]
- Guo, J.M.; Markoni, H.; Lee, J.D. BARNet: Boundary Aware Refinement Network for Crack Detection. IEEE Transactions on Intelligent Transportation Systems 2021, 23, 7343–7358. [Google Scholar] [CrossRef]
- Gao, Y.; Cao, H.; Cai, W.; et al. Pixel-level Road Crack Detection in UAV Remote Sensing Images Based on ARD-Unet. Measurement 2023, 219, 113252. [Google Scholar] [CrossRef]
- Ronneberger, O.; Fischer, P.; Brox, T. U-net: Convolutional Networks for Biomedical Image Segmentation. In Proceedings of the Medical Image Computing and Computer-Assisted Intervention, Munich, Germany; 2015; pp. 234–241. [Google Scholar]
- Jing, P.; Yu, H.; Hua, Z.; et al. Road Crack Detection Using Deep Neural Network Based on Attention Mechanism and Residual Structure. IEEE Access 2022, 11, 919–929. [Google Scholar] [CrossRef]
- Li, Y.; Yu, M.; Wu, D.; et al. Automatic Pixel-Level Detection Method for Concrete Crack with Channel-Spatial Attention Convolution Neural Network. Structural Health Monitoring 2023, 22, 1460–1477. [Google Scholar] [CrossRef]
- Liang, J.; Gu, X.; Jiang, D.; et al. CNN-Based Network With Multi-Scale Context Feature and Attention Mechanism for Automatic Pavement Crack Segmentation. Automation in Construction 2024, 164, 105482. [Google Scholar] [CrossRef]
- Hang, J.; Wu, Y.; Li, Y.; et al. A Deep Learning Semantic Segmentation Network with Attention Mechanism for Concrete Crack Detection. Structural Health Monitoring 2023, 22, 3006–3026. [Google Scholar] [CrossRef]
- Lin, T.Y.; Goyal, P.; Girshick, R.; et al. Focal Loss for Dense Object Detection. In Proceedings of the IEEE International Conference on Computer Vision; 2017; pp. 2980–2988. [Google Scholar]
- Zhang, L.; Yang, F.; Zhang, Y.D.; et al. Road Crack Detection Using Deep Convolutional Neural Network. In Proceedings of the 2016 IEEE International Conference on Image Processing (ICIP); 2016; pp. 3708–3712. [Google Scholar]
- Yang, F.; Zhang, L.; Yu, S.; et al. Feature Pyramid and Hierarchical Boosting Network for Pavement Crack Detection. IEEE Transactions on Intelligent Transportation Systems 2019, 21, 1525–1535. [Google Scholar] [CrossRef]
- Song, W.; Jia, G.; Zhu, H.; et al. Automated Pavement Crack Damage Detection Using Deep Multiscale Convolutional Features. Journal of Advanced Transportation 2020, 2020, 6412562. [Google Scholar] [CrossRef]
- Shi, Y.; Cui, L.; Qi, Z.; et al. Automatic Road Crack Detection Using Random Structured Forests. IEEE Transactions on Intelligent Transportation Systems 2016, 17, 3434–3445. [Google Scholar] [CrossRef]
- Cui, L.; Qi, Z.; Chen, Z.; et al. Pavement Distress Detection Using Random Decision Forests. In Proceedings of the International Conference on Data Science; 2015; pp. 95–102. [Google Scholar]
- Chen, L.C.; Zhu, Y.; Papandreou, G.; et al. Encoder-Decoder with Atrous Separable Convolution for Semantic Image Segmentation. In Proceedings of the European Conference on Computer Vision (ECCV); 2018; pp. 801–818. [Google Scholar]
- Xie, E.; Wang, W.; Yu, Z.; et al. SegFormer: Simple and Efficient Design for Semantic Segmentation with Transformers. Advances in Neural Information Processing Systems 2021, 34, 12077–12090. [Google Scholar]
- Dadson, J.K.; Asiedu, N.Y.; Iggo, J.A.; et al. A Proposed Two-Level Classification Approach for Forensic Detection of Diesel Adulteration Using NMR Spectroscopy and Machine Learning. Analytical and Bioanalytical Chemistry 2024, 1–12. [Google Scholar] [CrossRef] [PubMed]
Figure 1.
Comparison with several state-of-the-art crack detection methods on pavement images, including DeepCrack [5] and Hierarchical DeepCrack [6].
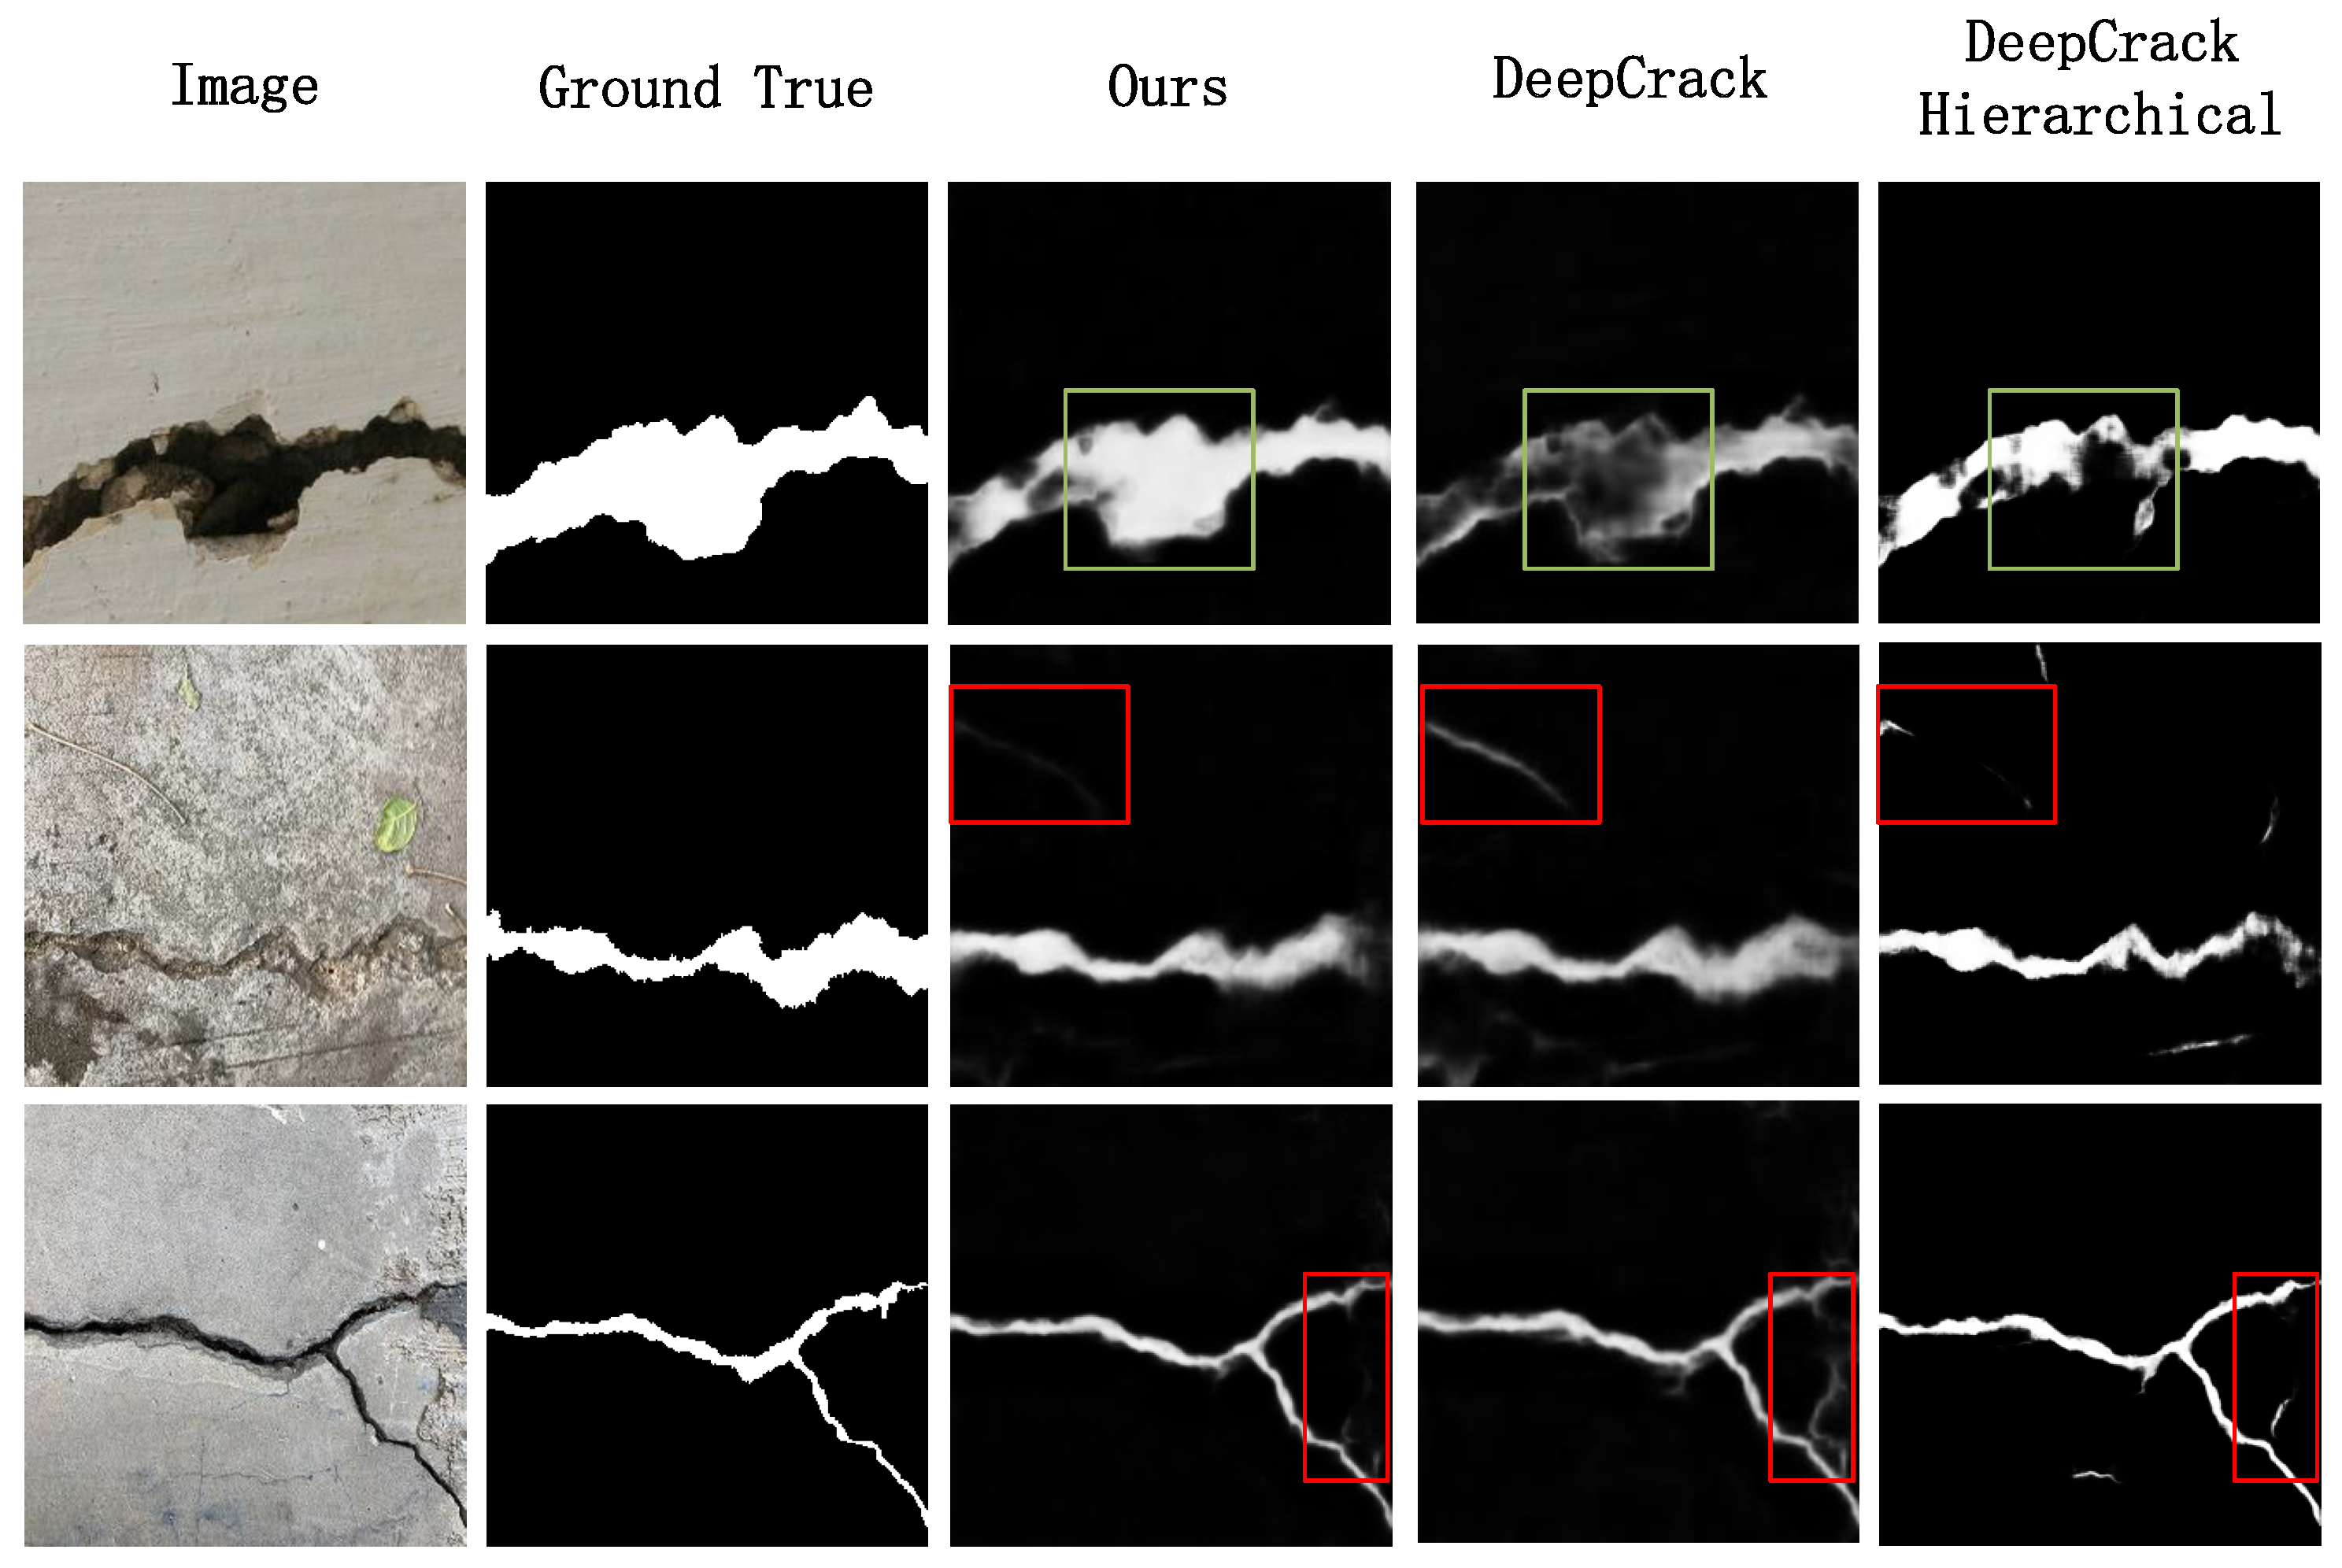
Figure 2.
The architecture of our method, and comprises of three primary components: the gradient prior, the encoder, and the decoder. The gradient prior will be introduced later.
Figure 2.
The architecture of our method, and comprises of three primary components: the gradient prior, the encoder, and the decoder. The gradient prior will be introduced later.
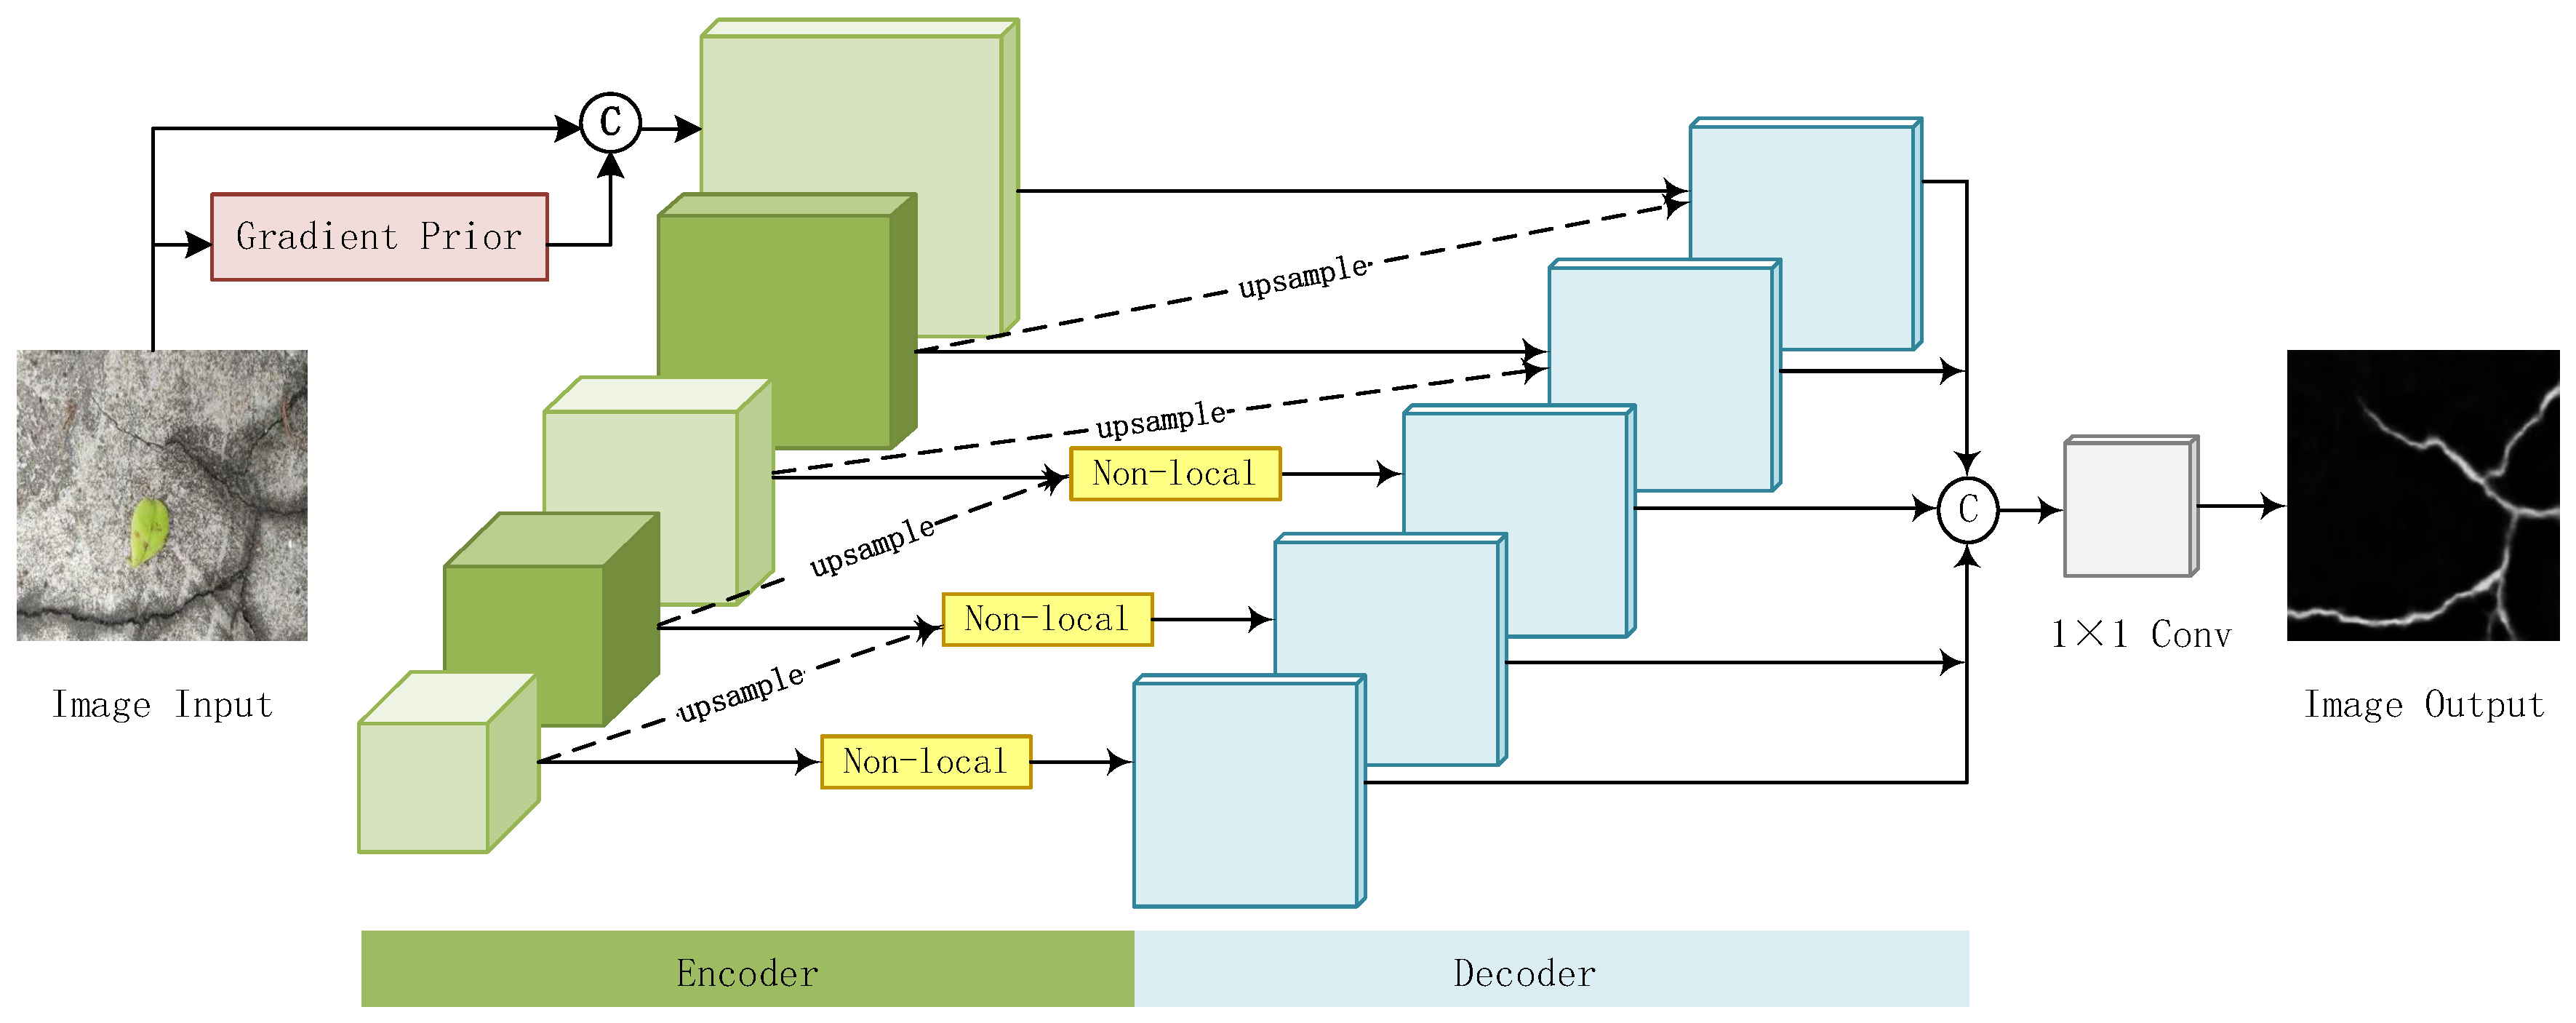
Figure 3.
The architecture of gradient prior. ’3× 3 64’ means the kernel size is , the channel is 64 in a convolutional layer.
Figure 3.
The architecture of gradient prior. ’3× 3 64’ means the kernel size is , the channel is 64 in a convolutional layer.
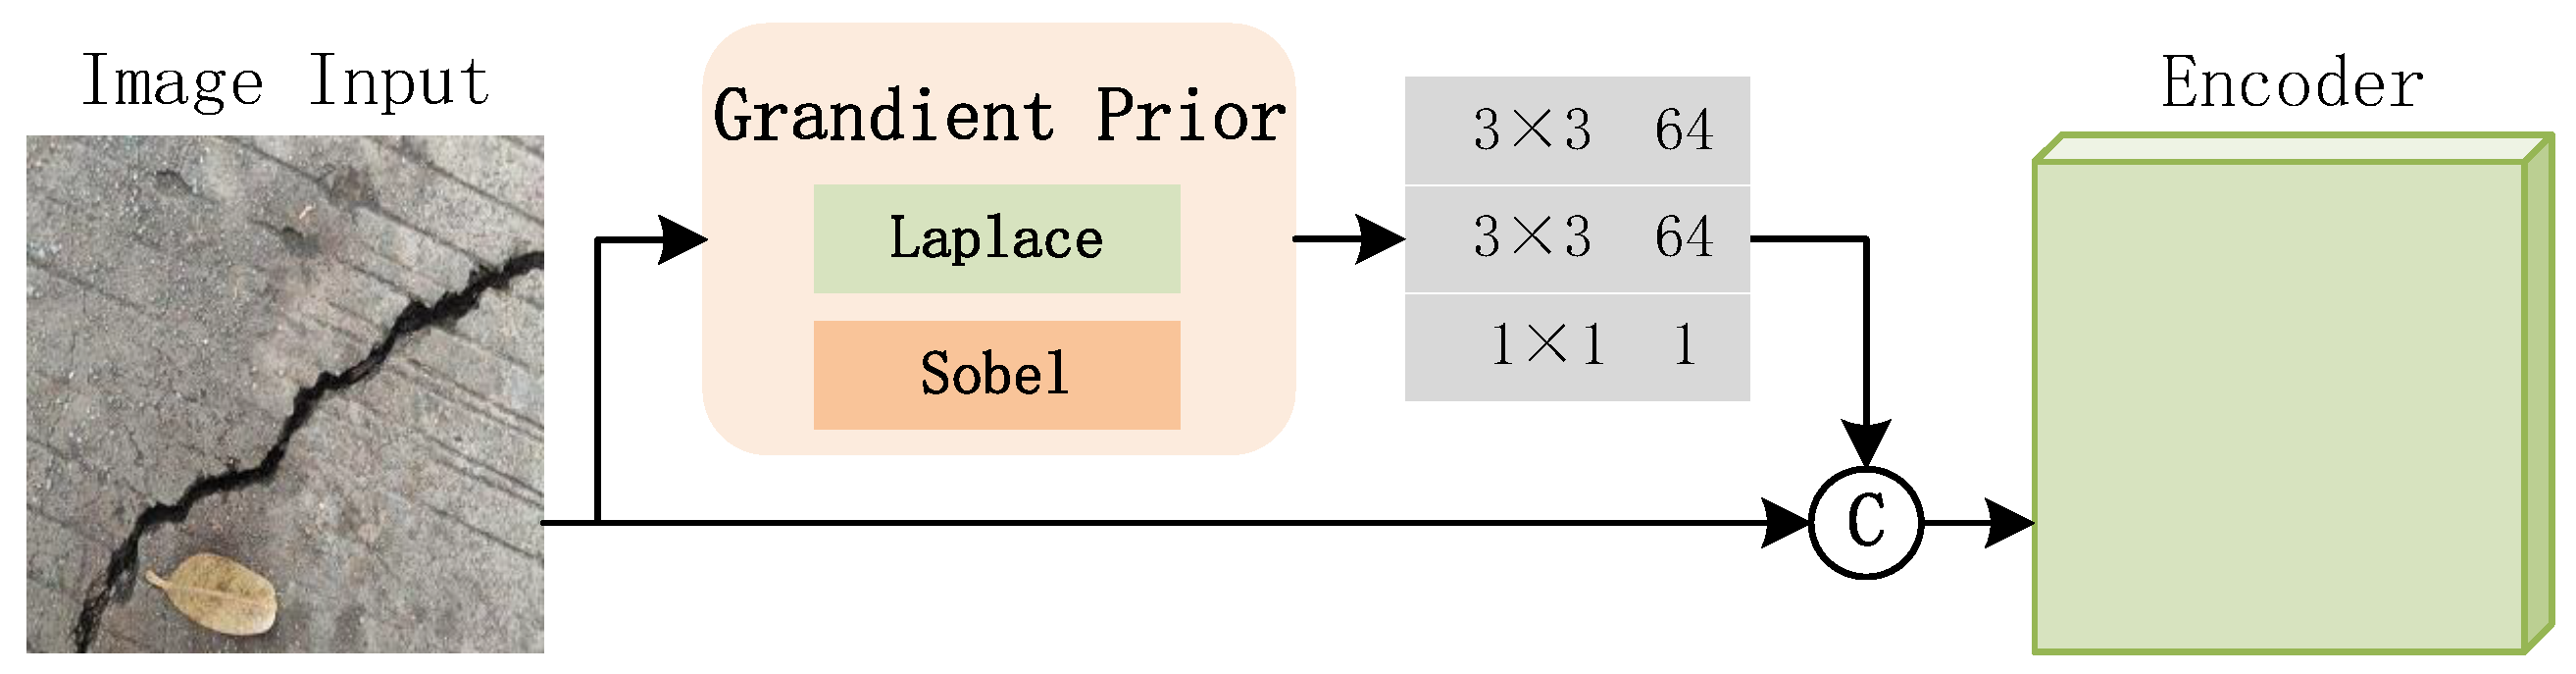
Figure 4.
Some representative samples in our dataset. There are many non-crack noise in concrete crack images, such as water stains, fallen leaves and shadows.
Figure 4.
Some representative samples in our dataset. There are many non-crack noise in concrete crack images, such as water stains, fallen leaves and shadows.
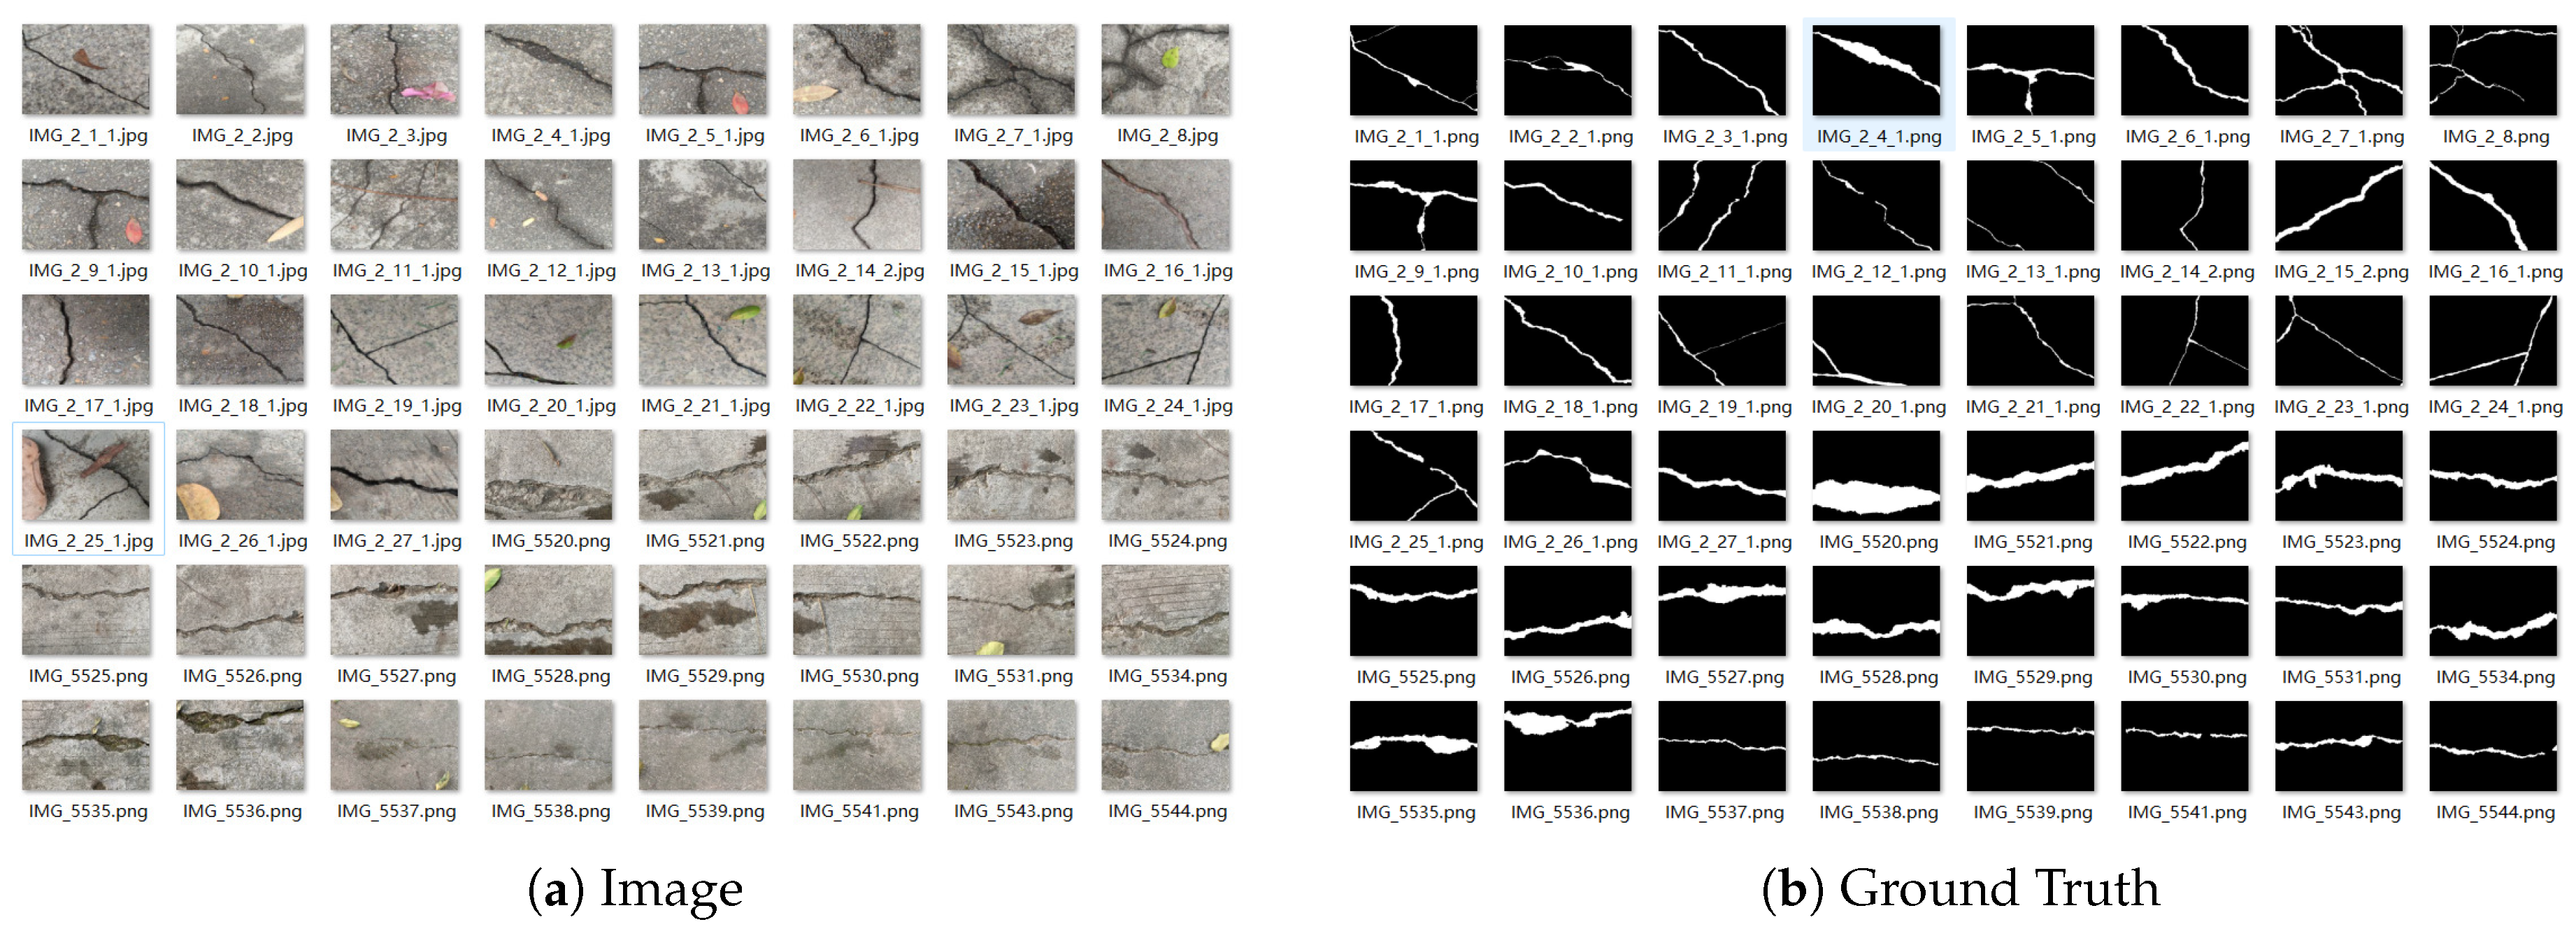
Figure 5.
The PR curve of compared models, including DeepCrack-GND (Ours), the Original DeepCrack [5] model, Hierarchical DeepCrack [6] model, DeepLabv3+ [38] model, Segformer [39] model, Segnet [22] model and UNet [27] model.
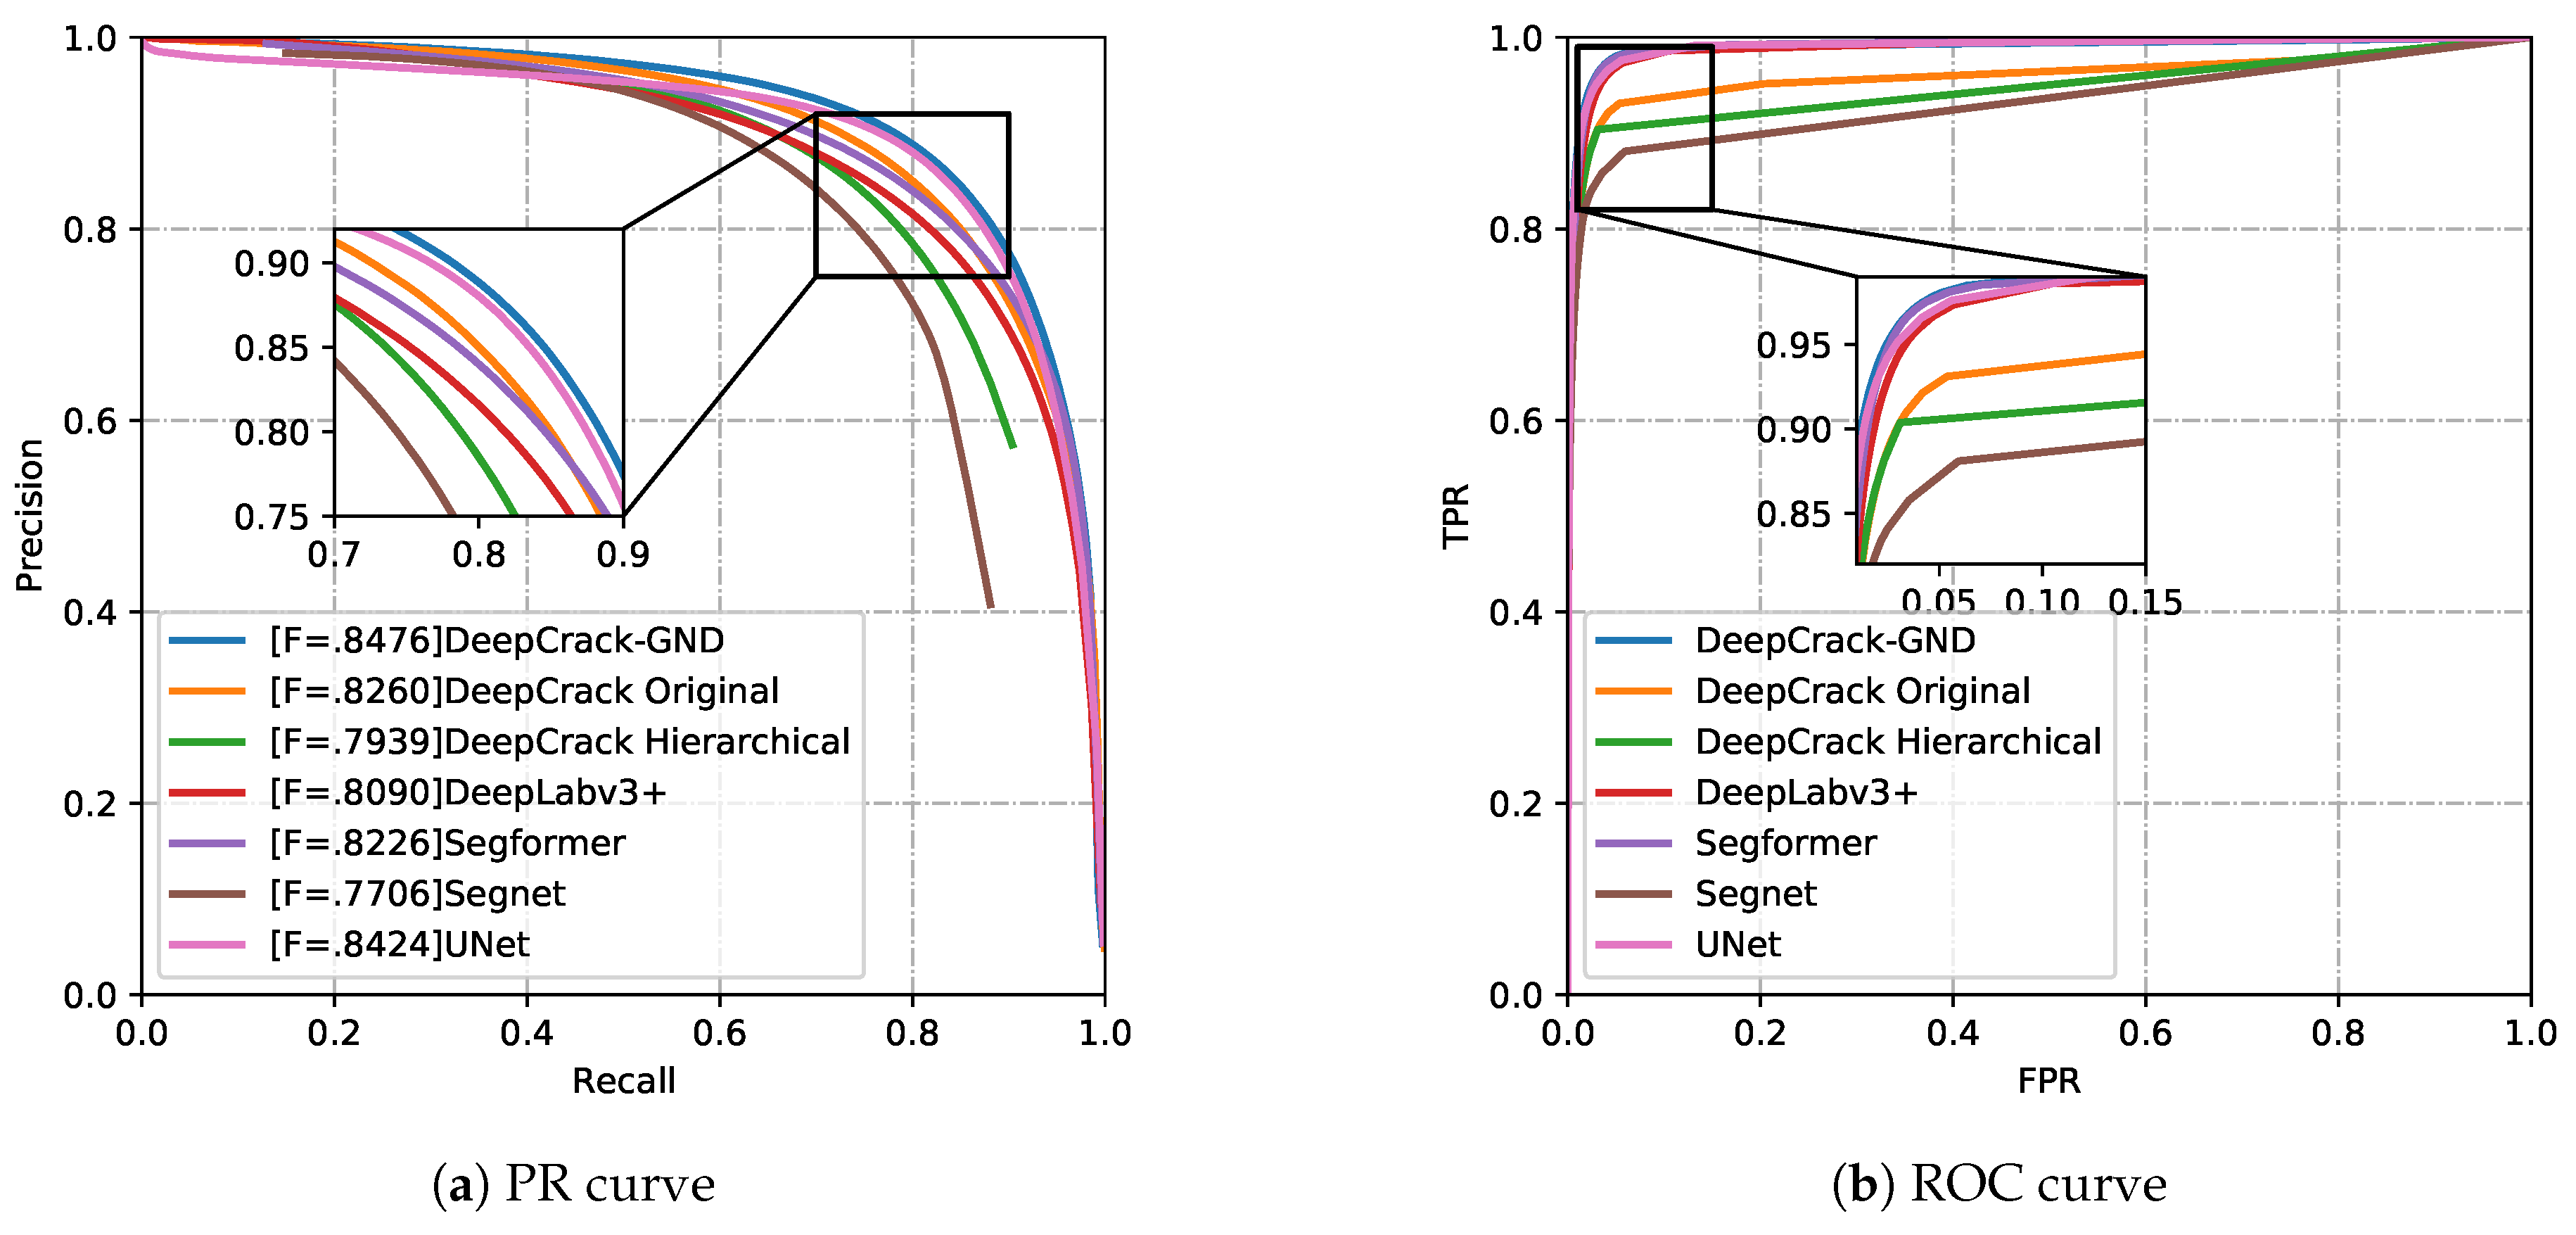
Figure 6.
The detection results of compared models on the DeepCrack-AUG datasets.
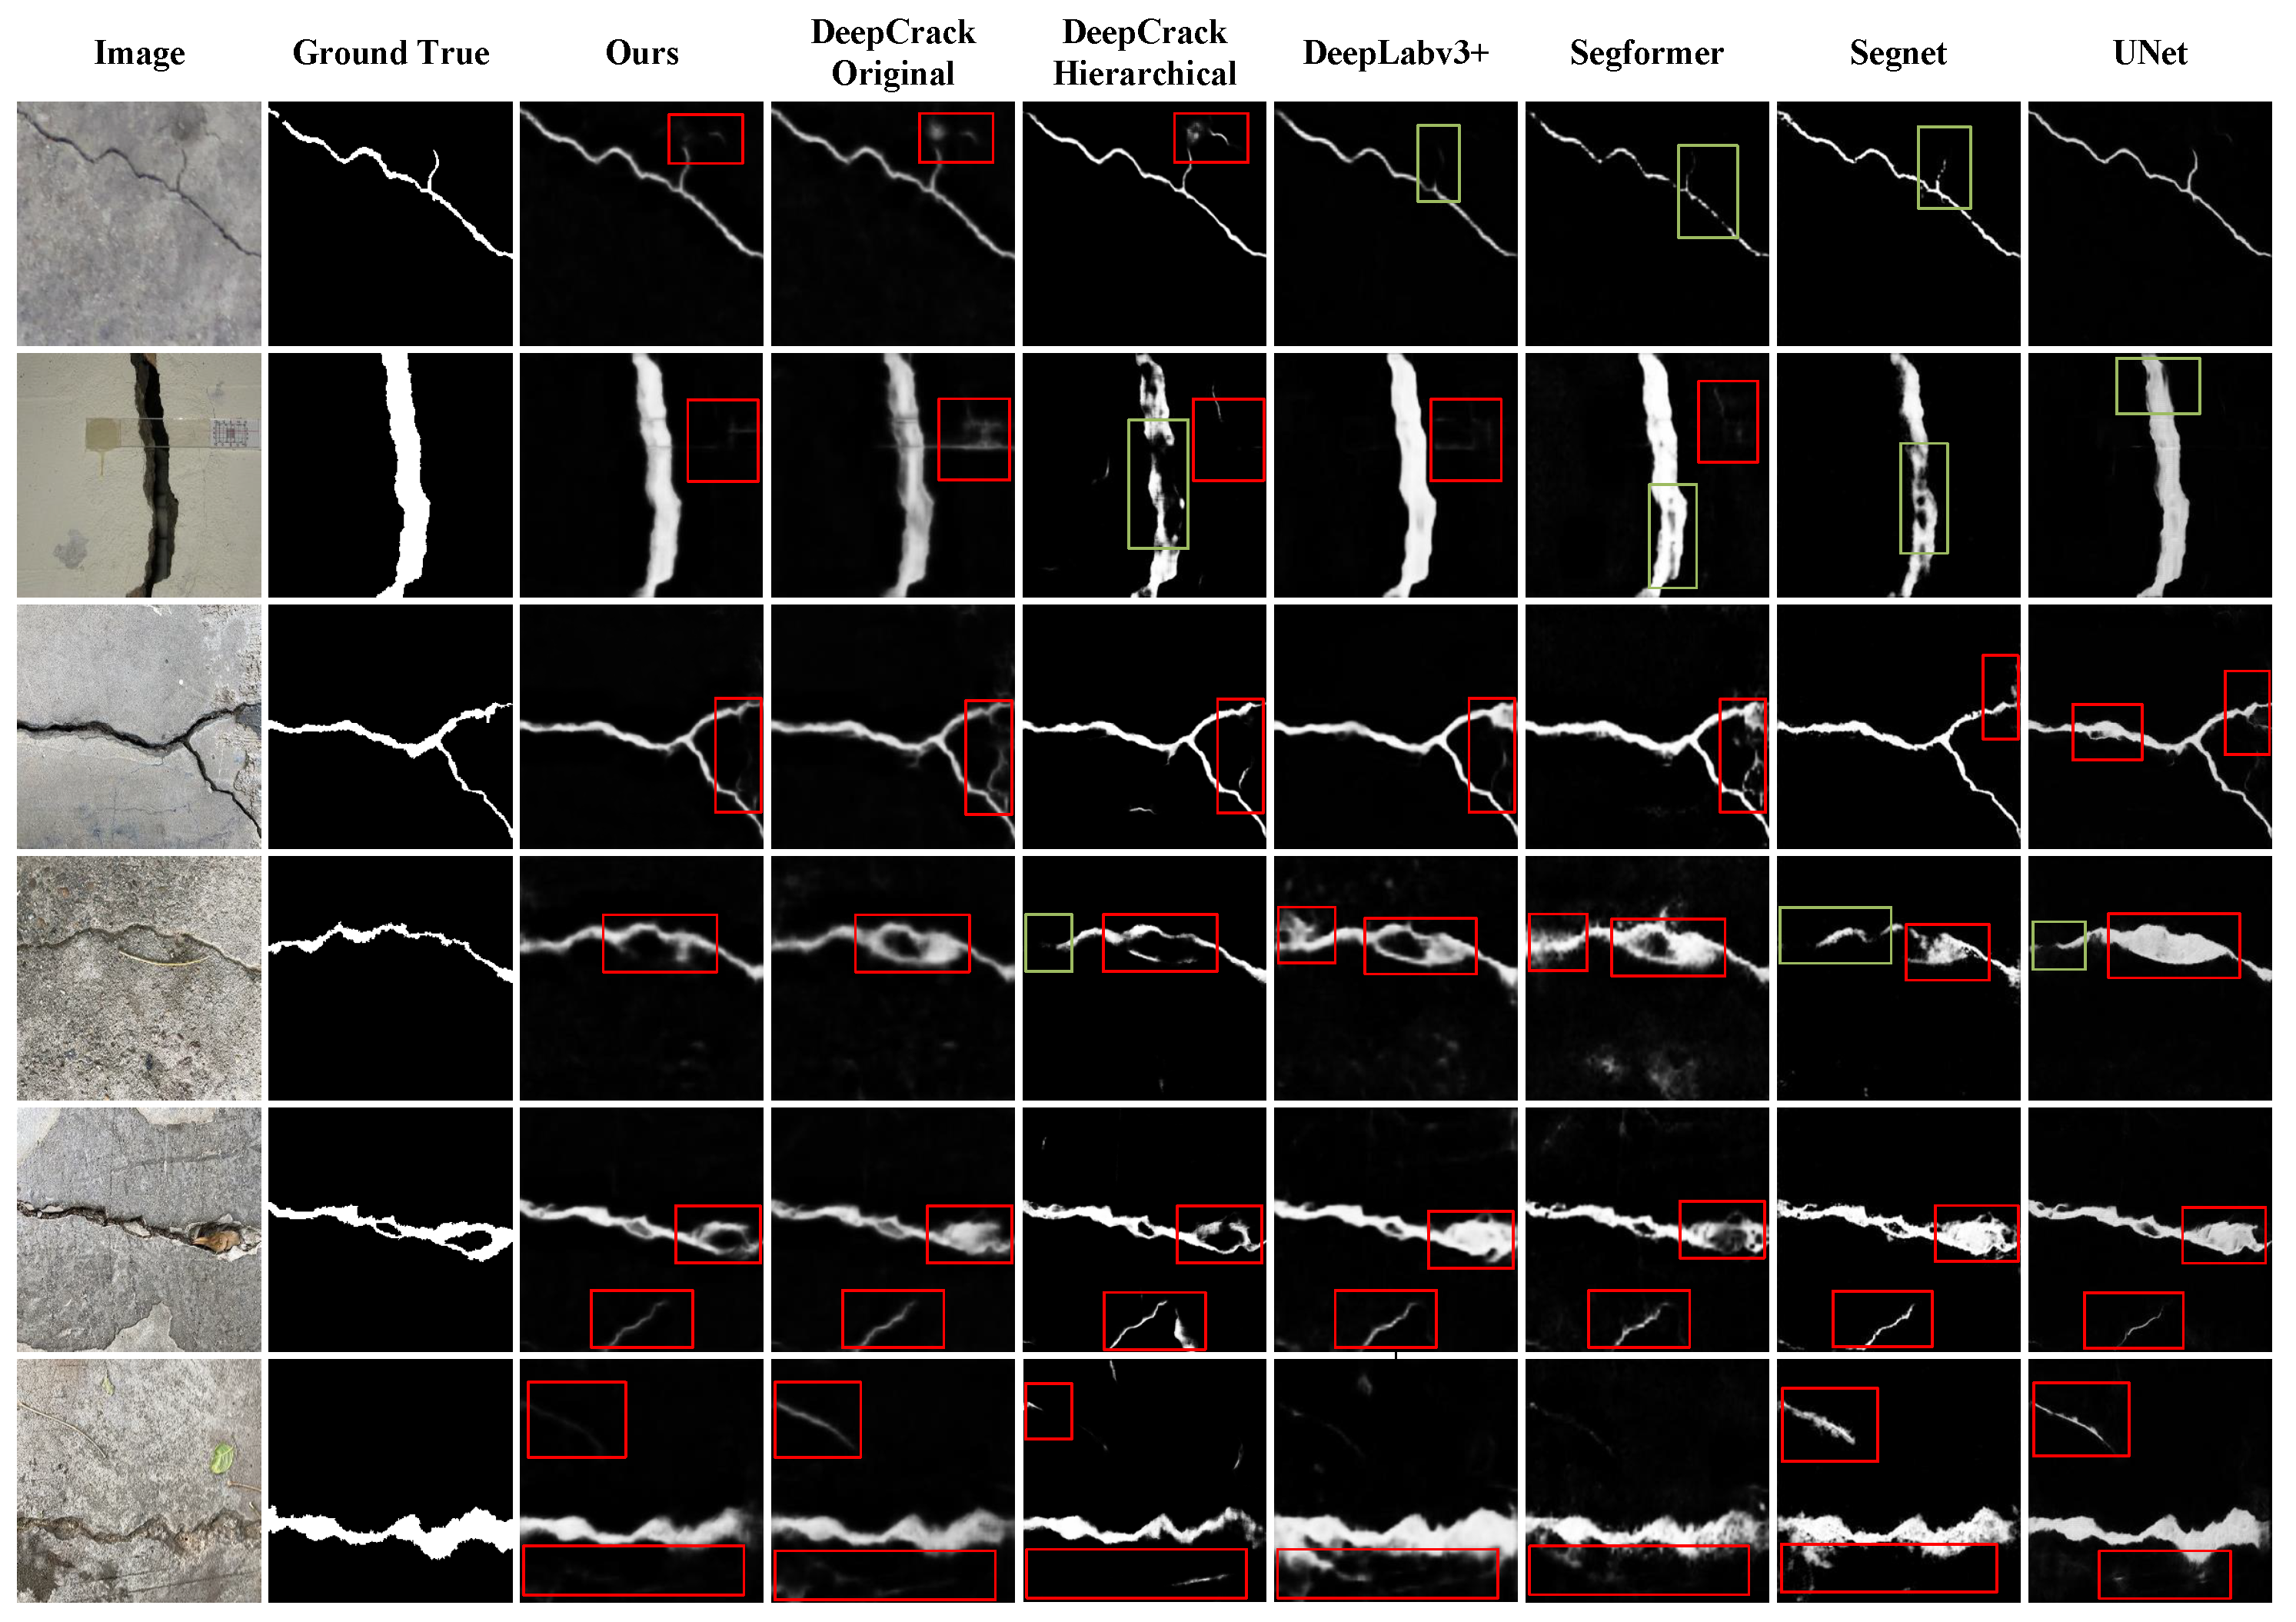
Figure 7.
The visualization of the detection results of the compared methods on the following datasets: (a) CFD dataset, (b) Crack500 dataset and (c) Crackdataset.
Figure 7.
The visualization of the detection results of the compared methods on the following datasets: (a) CFD dataset, (b) Crack500 dataset and (c) Crackdataset.
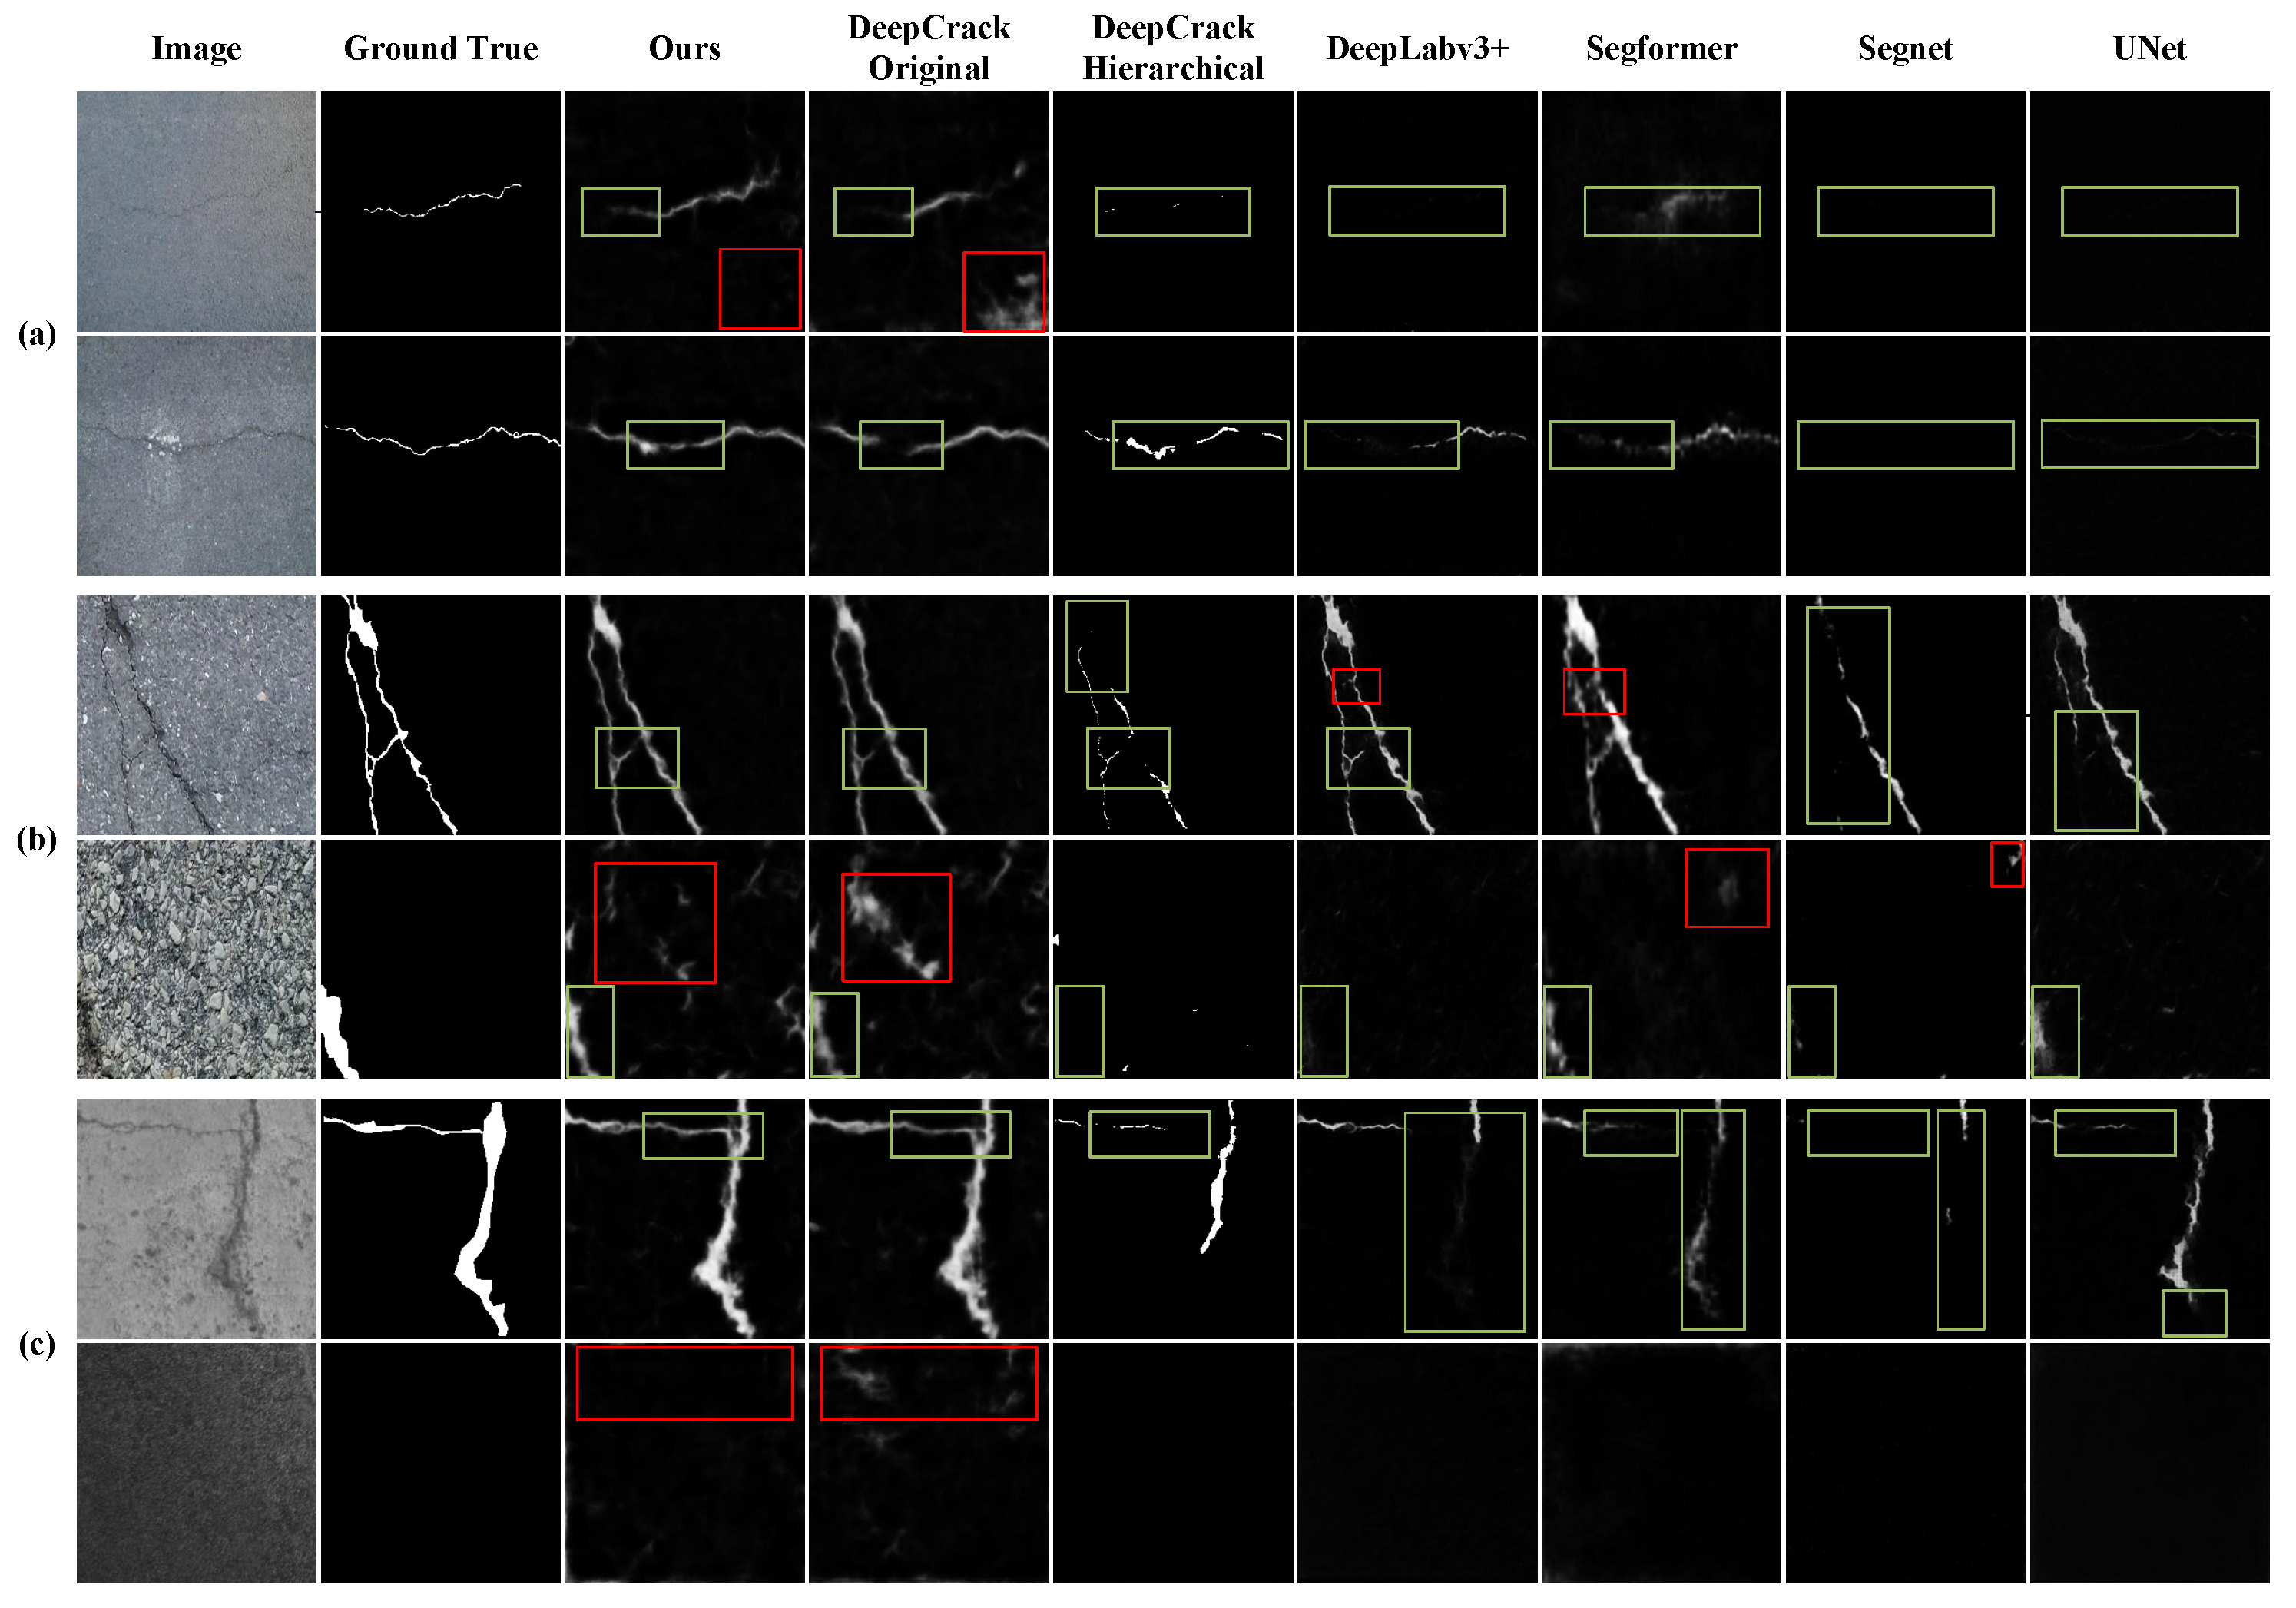
Figure 8.
The PR and ROC curve of ablation studies. The DeepCrack-GD, DeepCrack-NL, and DeepCrack-DC are derived from the baseline DeepCrack by integrating gradient prior, self-attention, and dense connections, respectively. The DeepCrack-GND means the proposed detection network.
Figure 8.
The PR and ROC curve of ablation studies. The DeepCrack-GD, DeepCrack-NL, and DeepCrack-DC are derived from the baseline DeepCrack by integrating gradient prior, self-attention, and dense connections, respectively. The DeepCrack-GND means the proposed detection network.
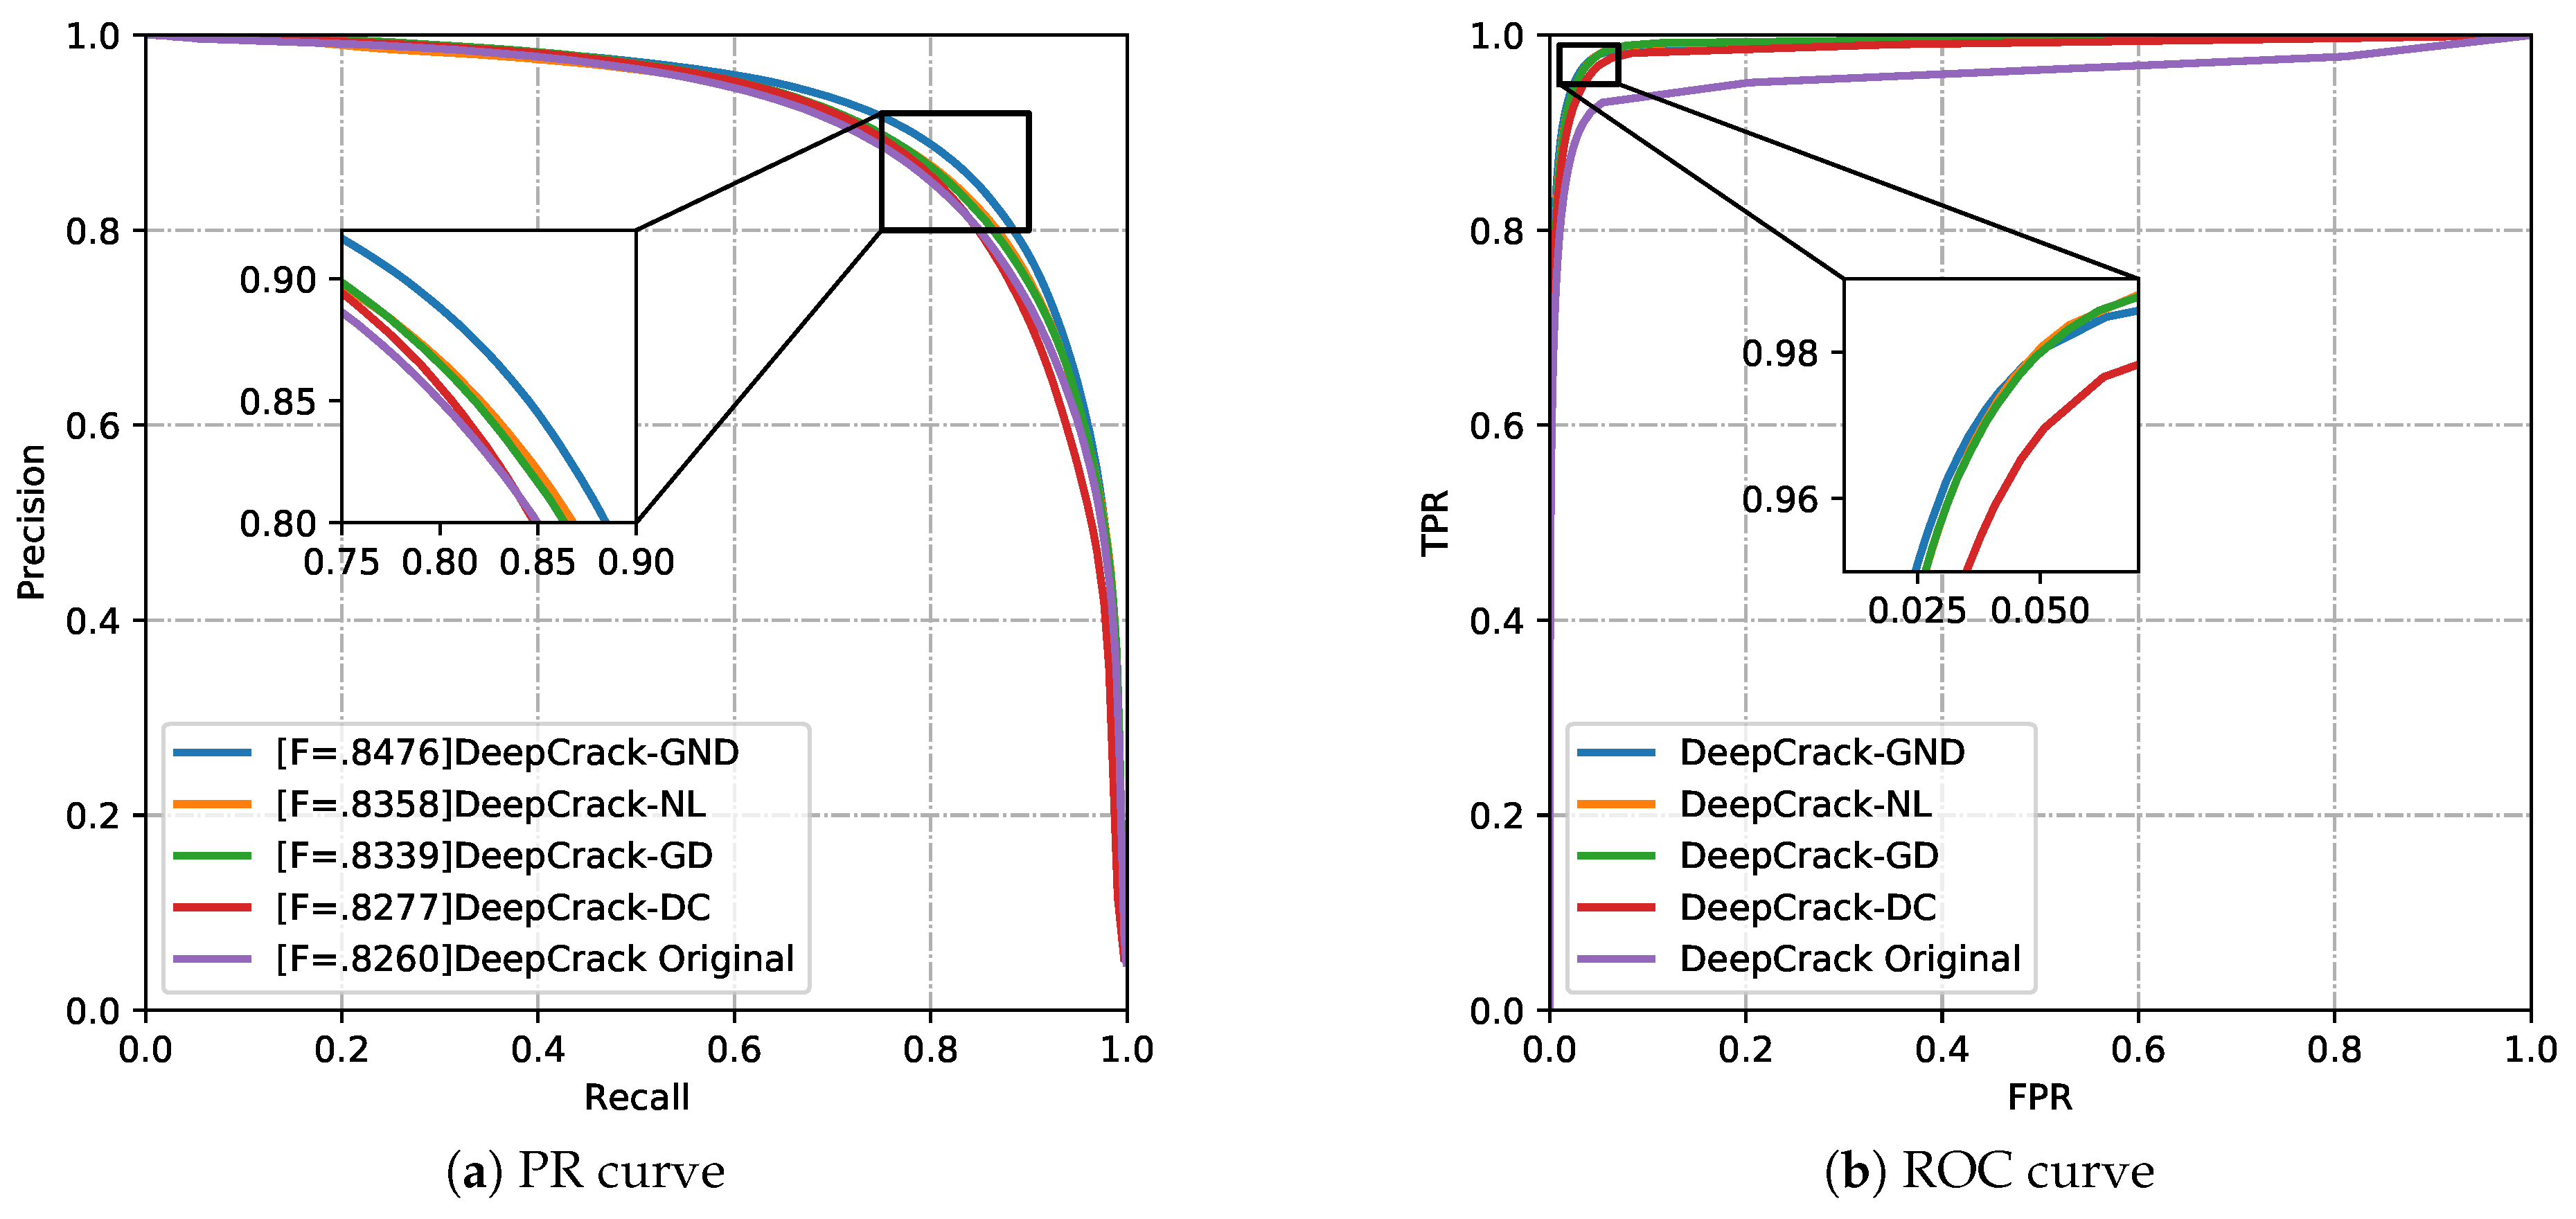
Figure 9.
The detection results of ablation studies. (I) Input image. (II) Ground true. (III) DeepCrack-GND (Ours). (IV) DeepCrack-GD. (V) DeepCrack-NL. (VI) DeepCrack-SC.
Figure 9.
The detection results of ablation studies. (I) Input image. (II) Ground true. (III) DeepCrack-GND (Ours). (IV) DeepCrack-GD. (V) DeepCrack-NL. (VI) DeepCrack-SC.
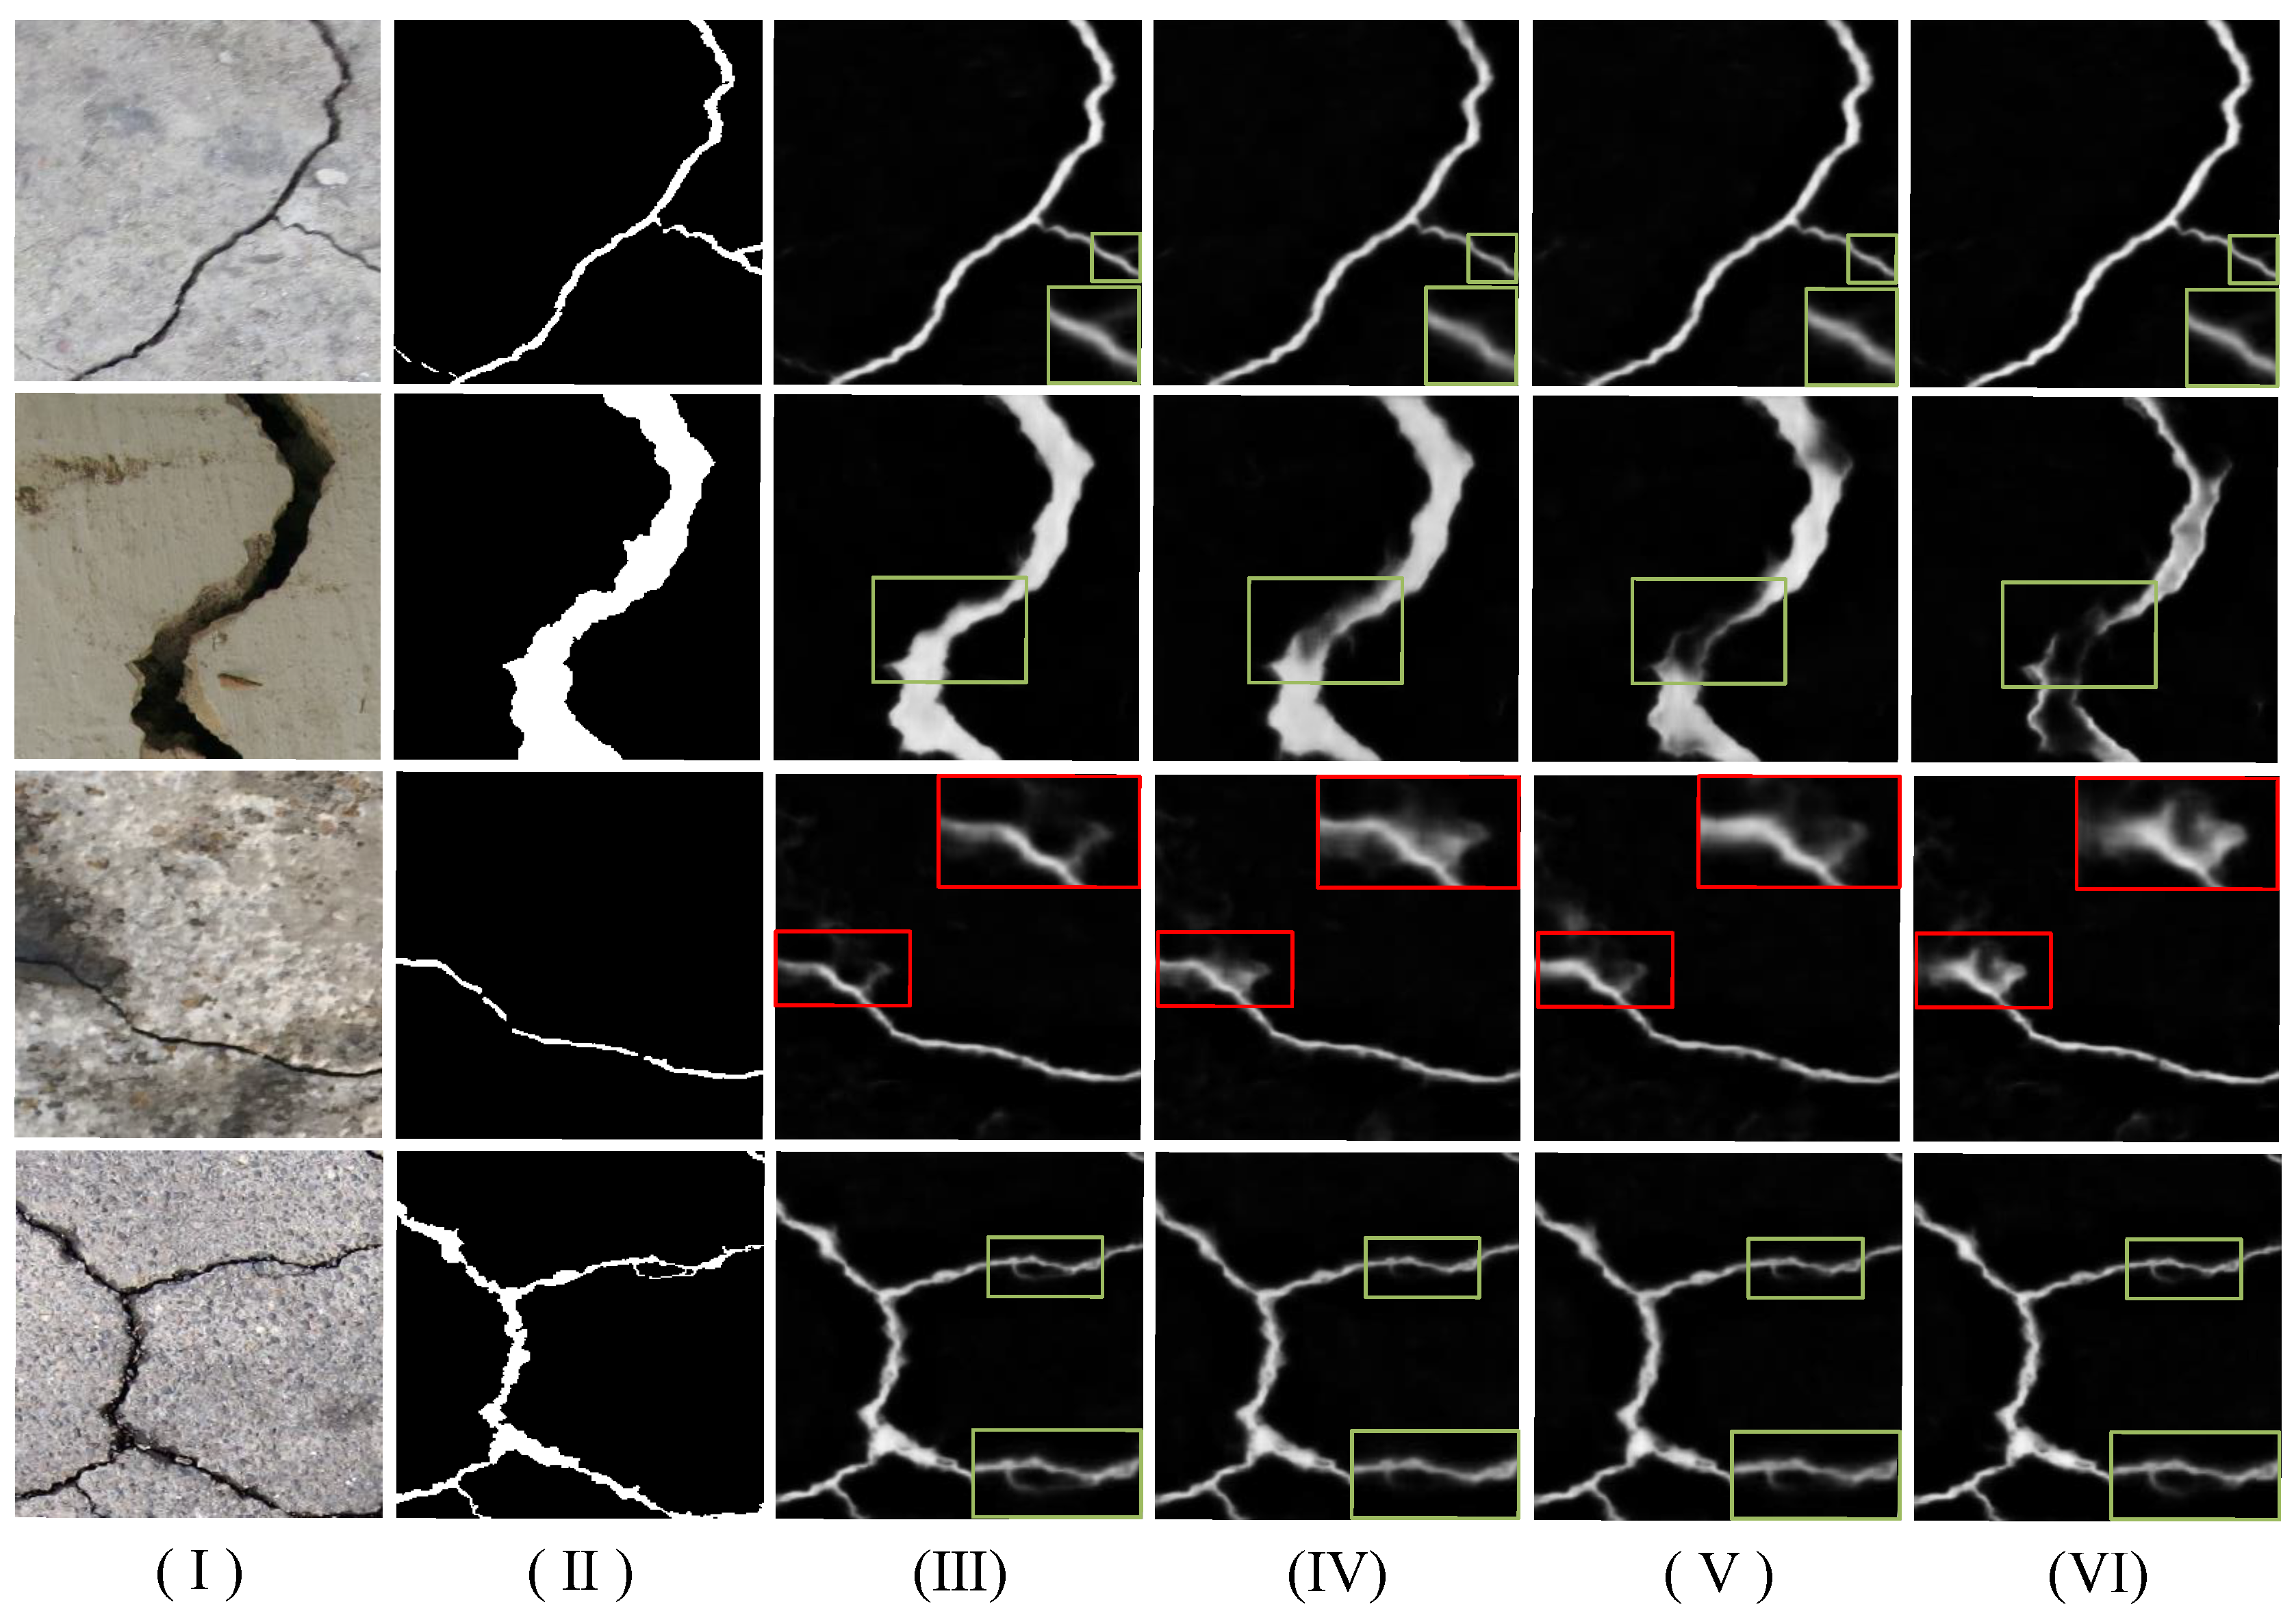

Table 1.
The ACC (Accuracy), ODS, AUC, mIoU and mPA of compared models on DeepCrack-AUG dataset. Red represents the best result.
Table 1.
The ACC (Accuracy), ODS, AUC, mIoU and mPA of compared models on DeepCrack-AUG dataset. Red represents the best result.
| Methods | ACC(%) | ODS(%) | AUC(%) | mIoU(%) | mPA(%) | AP(%) |
|---|---|---|---|---|---|---|
| DeepCrack Origin | 97.05 | 82.60 | 96.0 | 78.19 | 88.0 | 85.15 |
| DeepCrack Hierarchical | 98.15 | 79.39 | 94.7 | 81.13 | 85.84 | 91.89 |
| DeepLabv3+ | 98.21 | 80.89 | 98.84 | 82.03 | 87.36 | 91.40 |
| Segformer | 98.31 | 82.25 | 99.0 | 83.12 | 88.94 | 91.20 |
| Segnet | 97.99 | 77.05 | 93.28 | 79.30 | 83.48 | 92.06 |
| UNet | 98.41 | 84.24 | 99.0 | 82.97 | 85.96 | 94.07 |
| Ours | 98.45 | 84.76 | 99.0 | 86.49 | 90.7 | 94.09 |
Table 2.
The mean of ACC (Accuracy), ODS, AUC, mIoU and mPA over datasets Crack500, CFD and Crackdataset. Red represents the best result and blue represents the second best result.
Table 2.
The mean of ACC (Accuracy), ODS, AUC, mIoU and mPA over datasets Crack500, CFD and Crackdataset. Red represents the best result and blue represents the second best result.
| Methods | ACC(%) | ODS(%) | AUC(%) | mIoU | mPA | AP |
|---|---|---|---|---|---|---|
| DeepCrack Origin | 96.16 | 58.97 | 95.47 | 68.57 | 77.93 | 78.29 |
| DeepCrack Hierarchical | 96.02 | 54.17 | 84.76 | 59.58 | 62.98 | 80.36 |
| DeepLabv3+ | 96.22 | 49.03 | 94.65 | 62.46 | 66.50 | 79.10 |
| Segformer | 96.48 | 60.05 | 94.06 | 68.61 | 74.21 | 81.30 |
| Segnet | 95.25 | 38.66 | 93.28 | 55.73 | 58.17 | 80.09 |
| UNet | 96.45 | 53.57 | 92.73 | 63.46 | 66.98 | 79.53 |
| Ours | 96.27 | 59.49 | 94.79 | 68.84 | 77.65 | 81.46 |
Table 3.
The ACC (Accuracy), AP, ODS, AUC, mIoU and mPA of ablation studies on DeepCrack-AUG dataset. Red represents the best result.
Table 3.
The ACC (Accuracy), AP, ODS, AUC, mIoU and mPA of ablation studies on DeepCrack-AUG dataset. Red represents the best result.
| Methods | ACC(%) | AP(%) | ODS(%) | AUC(%) | mIoU(%) | mPA(%) |
|---|---|---|---|---|---|---|
| DeepCrack Origin | 97.05 | 85.15 | 82.60 | 96.0 | 78.19 | 88.00 |
| DeepCrack-GD | 98.38 | 93.40 | 83.39 | 99.2 | 86.02 | 90.7 |
| DeepCrack-NL | 98.40 | 93.68 | 83.58 | 99.1 | 86.13 | 90.62 |
| DeepCrack-DC | 98.31 | 94.09 | 82.77 | 98.7 | 85.2 | 89.18 |
| DeepCrack-GND | 98.45 | 94.09 | 84.76 | 99.0 | 86.49 | 90.72 |
Disclaimer/Publisher’s Note: The statements, opinions and data contained in all publications are solely those of the individual author(s) and contributor(s) and not of MDPI and/or the editor(s). MDPI and/or the editor(s) disclaim responsibility for any injury to people or property resulting from any ideas, methods, instructions or products referred to in the content. |
© 2025 by the authors. Licensee MDPI, Basel, Switzerland. This article is an open access article distributed under the terms and conditions of the Creative Commons Attribution (CC BY) license (https://creativecommons.org/licenses/by/4.0/).
Copyright: This open access article is published under a Creative Commons CC BY 4.0 license, which permit the free download, distribution, and reuse, provided that the author and preprint are cited in any reuse.


