
Submitted:
25 July 2025
Posted:
25 July 2025
You are already at the latest version
Abstract
Urbanization profoundly influences social, economic, and environmental systems, imposing a comprehensive understanding of spatial and temporal land use and land cover (LULC) transformations. This study aims to quantify the LULC changes from 2014–2023 in Penang Island, Malaysia using SPOT 6 and SPOT 7 satellite imageries with 1.5 m spatial resolution. After preprocessing and transforming data, five LULC classes that are built-up, forest, water bodies, agriculture and horticulture, and barren land were classified. Support Vector Machines (SVM) classifier achieved accuracies of 90.8% in 2014, 91% in 2019, and 94.2% in 2023, with kappa coefficients of 0.85, 0.84, and 0.9 respectively. Analysis at the district level revealed that built-up area decreased by 4.53 km², forest expanded by 10.32 km², water bodies grew by 0.26 km², agriculture and horticulture increased by 8.47 km², and barren land declined by 11.84 km². Interestingly, the decline in built-up areas presents a paradox to the conventional narrative of urban growth, which typically anticipates an increase in developed land over time. This counterintuitive trend invites further inquiry into factors that may have driven such a reversal in urbanization patterns. Nevertheless, the findings align with SDG 11 and the NPP, which advocate for sustainable and resilient urban development.
Keywords:
urbanization
; land use land cover change (LULC)
; support vector machine (SVM)
; sustainable development goal (SDG) 11
; national physical plan (NPP)
1. Introduction
Urbanization is a major global trend of the 21st century, driving significant changes in landscapes, economies, and societies [1,2,3]. As people flock to urban centers in pursuit of better opportunities, cities grow and spread, triggering profound land use and land cover (LULC) transformations that reshape the landscape and leave lasting environmental scars [4]. While urban growth supports economic and social development, it also presents major challenges. Therefore, understanding the spatial and temporal patterns of LULC change is crucial, especially in rapidly developing areas.
On the global scale, the 11th Sustainable Development Goals (SDGs) stress the importance of making cities inclusive, safe, resilient, and sustainable [5,6]. Achieving this goal requires strong land use planning and management. Scholars such as Allan et al. (2024) [7], Nabiyeva et al. (2023) [8], and Moallemi et al. (2020) [9] highlight the need for innovative approaches that balance urban growth with ecosystem and resource preservation.
The National Physical Plan (NPP) is Malaysia’s strategic blueprint for development, integrating economic, social, and sectoral policies into spatial planning. NPP Thrust 2 focuses on Spatial Sustainability and Climate Change, promoting holistic land use planning, sustainable resource management, and progress toward a carbon-neutral nation [10]. It emphasizes balancing urban growth with environmental stewardship to ensure inclusive and sustainable development.
This study centers on Penang Island, known for its vibrant economy, diverse population, and cultural heritage [11,12,13]. However, rapid urban expansion poses challenges to its environmental sustainability. Given its limited land area, understanding how urban growth affects LULC is critical. Using Remote Sensing (RS) and Geographic Information Systems (GIS), this study quantifies the spatiotemporal dynamics of LULC changes from 2014 to 2023 and assesses their implications for sustainable urban development, aligning with SDG 11 and NPP Thrust 2.
2. Materials and Methods
2.1. Study Area
Penang Island, located at 5.35°N and 100.36°E, has a tropical climate that shapes its ecosystems, biodiversity, and land use, which are key elements in urban and environmental research. Its rapid urbanization alongside rich ecological diversity makes it a focal point for development and sustainability studies. The island comprises two main districts: Northeast and Southwest Penang Island. These districts display contrasting LULC changes and urban growth patterns.
Covering about 298 km2, Penang Island features varied topography, including hills, lowlands, and coastal areas. The northeast, where George Town is located, is densely populated and urbanized [14,15] while the south remains largely rural, with forests and agricultural lands [16]. Figure 1 shows the map of Penang Island, Malaysia.
2.2. Primary Data
The primary data source for this study was raster imagery from the Malaysian Space Agency (MYSA) in JPEG 2000 (JP2) format. JPEG 2000 offers efficient compression, producing files up to five times smaller than GeoTIFF, which enhances storage, handling, postprocessing, and streaming [17]. It is well-suited for high-resolution imagery like SPOT 6 and SPOT 7 and allows direct use without decompression [18].
Two compression options are available: JPEG 2000 Optimized and JPEG 2000 Regular. The Optimized format uses lossy compression (3.5 bits per pixel), favoring fast downloads and data sharing with minimal, irreversible spatial distortions [19]. In contrast, the Regular format uses lossless compression (about 8 bits per pixel), preserving full data integrity for high-precision analysis. For this study, data from 2014, 2019, and 2023 were provided in JPEG 2000 Regular format to ensure accuracy in post-processing.
2.3. Secondary Data
The secondary data comprised vector data for Penang Island from 2014, 2019, and 2023, provided by PLANMalaysia Pulau Pinang. Originally divided into 12 land use classes, the data was reclassified into five classes to align with the raster dataset. This ensured consistency and enabled accurate comparative analysis, enhancing the efficiency of land use change detection and understanding of spatial development patterns. Additionally, the vector data served as both the boundary reference and ancillary information to aid in cross-checking the classification results, thereby improving the reliability of the interpretation.
2.4. Processing Software
This study utilizes ArcGIS 10.6.1, ArcGIS Pro, and ERDAS IMAGINE for image processing and data analysis. The integration of RS and GIS technologies facilitates comprehensive change detection analysis, offering advanced tools to assess spatial dynamics and transformations effectively. Each software package plays a distinct role in handling both raster and vector data, ensuring a thorough and detailed analytical process.
2.5. LULC Classification
2.6. Accuracy Assessment
Accuracy assessment was conducted to evaluate the reliability of the LULC classification for 2014, 2019, and 2023. A total of 500 reference points were selected using stratified random sampling, ensuring proper representation across built-up areas, forests, water bodies, agriculture and horticulture, and barren land. The study area was divided into distinct LULC classes, with points randomly sampled within each class, and the number of points was proportional to the area of each class. Figure 2 displays the panel used for generating accuracy assessment points in ArcGIS.
The classification’s accuracy was sequentially evaluated using a Confusion Matrix, also known as an Error Matrix, which compared the classified map with the ground truth data. Key accuracy metrics, including overall accuracy, producer’s accuracy, user’s accuracy, and the Kappa coefficient were calculated to quantify the classification’s performance. This comprehensive assessment ensured that the LULC classification was reliable and suitable for applications in land management and environmental monitoring. Table 2, Table 3, and Table 4 present the Confusion Matrix computed for the years 2014, 2019, and 2023 respectively.
The 2014 LULC classification confusion matrix demonstrates strong classification performance in several categories, with an overall accuracy of 90.8% and a Kappa coefficient of 0.847769. The Built-up and Forest classes show high reliability, with User’s Accuracies of 94.25% and 98.21% respectively, indicating that most pixels classified as Built-up and Forest were indeed correct. Producer’s Accuracies for these classes are also high, at 90.11% for Built-up and 91.64% for Forest, suggesting that the model effectively captured most actual Built-up and Forest areas. The Water Bodies class, while achieving a Producer’s Accuracy of 77.78%, struggled the same with User’s Accuracy at 77.78%. Agriculture and Horticulture had moderate accuracy, with 88.89% Producer’s Accuracy and 71.11% User’s Accuracy. Barren Land performed reasonably well, with Producer’s Accuracy of 93.1% and User’s Accuracy of 77.14%, reflecting relatively accurate identification.
In 2019, classification accuracy increased by 0.2%, achieving 91% overall accuracy with a Kappa coefficient of 0.83521. Built-up and Forest classes were again accurately classified, maintaining User’s Accuracies of 94.25% and 97.69%, respectively, indicating reliable classification for these urban and natural areas. Producer’s Accuracies for Built-up and Forest were 85.42% and 97.75% respectively, showing the model’s effectiveness in capturing the true extent of these classes. Water Bodies saw a marked improvement in classification accuracy, with a User’s Accuracy of 93.54% and a Producer’s Accuracy of 68.88%, suggesting that the model was progressively successful in classifying pixels as Water Bodies. Agriculture and Horticulture showed moderate success, with a User’s Accuracy of 76.36% and a Producer’s Accuracy of 80%, indicating effective identification but some challenges in perfect classification. Barren Land maintained consistent performance, with 80% User’s Accuracy and Producer’s Accuracy, indicating reliable classification though slightly lower than the other main categories.
The 2023 classification results yield the highest accuracy of all years, with an overall accuracy of 94.2% and a Kappa coefficient of 0.900456, reflecting near-perfect agreement. Built-up and Forest classes continued to show excellent accuracy, with User’s Accuracies of 98.72% for Built-up and 96.75% for Forest, reflecting a high proportion of correct classifications for these key land uses. Producer’s Accuracies were similarly high at 88.51% for Built-up and 96.98% for Forest. Water Bodies achieved perfect classification in 2023, with both User’s and Producer’s Accuracies at 100%, reflecting outstanding reliability in identifying this class. Whereas Agriculture and Horticulture showed strong improvement with a User’s Accuracy of 82.18% and a Producer’s Accuracy of 93.26%, indicating that most classified pixels and actual areas for this class were correctly identified. Barren Land also showed improvement, with a User’s Accuracy of 81.25% and a Producer’s Accuracy of 76.47%, though it remained slightly lower than other classes, indicating ongoing but improved classification performance. Thus, the results show consistent accuracy for Built-up and Forest classes across all years, with significant improvement in Water Bodies classification by 2023, as well as notable enhancements in Agriculture and Horticulture classification.
2.7. Conceptual Framework
Figure 3 shows the conceptual framework for LULC change detection on Penang Island, summarizing the comprehensive workflow employed in the study. This framework is systematically divided into four key stages that are input, preprocessing, main processing, and output.
The input stage outlines the collection of high-resolution satellite imagery and ancillary data serving as foundational datasets. Whereas the preprocessing stage involves critical steps such as radiometric and geometric correction, image mosaicking, and normalization to ensure data consistency and usability. In the main processing stage, SVM classification is applied to extract significant conformations and identify LULC changes. Finally, the output stage consolidates the results, presenting detailed maps, statistical reports, and visualizations that quantify and interpret the changes over time.
This structured framework integrates state-of-the-art tools and methodologies to ensure the accuracy and robustness of the results, providing valuable insights into sustainable urban development on Penang Island.
3. Results and Discussion
3.1. LULC from 2014 Until 2023 & Three Phases of Changes in Penang Island
As shown in Table 5, the LULC of Penang Island in 2014 was primarily characterized by forested areas, covering 169.07 km2, which represented 56.62% of the total land area. Agricultural and horticultural lands were the second most extensive category, occupying 54.2 km2 (18.15%), followed closely by built-up areas at 52.82 km2 (17.69%). Barren lands and water bodies were the least represented, covering 21.12 km2 (7.07%) and 1.39 km2 (0.46%), respectively. This spatial distribution of LULC reflects a landscape largely shaped by natural vegetation, with forests and agricultural areas as the dominant land covers.
Figure 4 geovisualizes the 2014 LULC of Penang Island. By 2019, Penang Island showed significant changes in LULC patterns. Forested areas saw an unexpected increase, expanding to 199.51 km2 (66.09%). In contrast, agricultural and horticultural areas experienced a substantial decline, dropping to 33.52 km2 (11.1%). Built-up areas remained relatively stable, with a slight decrease to 52.23 km2 (17.3%). Barren land shrank to 15.26 km2 (5.06%), while water bodies remained largely unchanged, with a small decrease to 1.37 km2 (0.45%). Figure 5 illustrates the LULC spatial distribution of Penang Island for the year 2019.
In 2023, forested areas had decreased to 179.39 km2, making up 59.55% of the total area, while agricultural and horticultural lands expanded to 62.67 km2, representing 20.8%. Built-up areas continued to decrease, reaching 48.29 km2 (16.03%), and barren land shrank further to 9.28 km2 (3.08%). Meanwhile, water bodies increased to 1.64 km2, covering 0.55%. Figure 6 illustrates the spatial distribution of LULC in Penang Island for 2023.
3.2. Changes in Built-up LULC Areas
The overall change from 2014 to 2023 revealed a decrease of about 4.53 km2 (1.66%) in the built-up area on Penang Island. Both time intervals, from 2014 to 2019 and from 2019 to 2023, showed reductions of 0.58 km2 (0.39%) and 3.95 km2 (1.27%) in built-up areas, respectively. When analyzed spatially, both phases indicated no significant expansion of the built-up area or development in any specific direction, with urban growth remaining confined to existing boundaries. In other words, changes only take place internally. This observation aligns with the minor statistical changes recorded.
The limited growth can be further explained by the island’s significant mountainous terrain, which covers approximately 50% of the land area [21]. The majority of the island’s mountains are concentrated in the central region [22], contributing to an uneven spatial distribution of urban development, which is primarily concentrated in the flatter areas of the Northeast District.
As shown in Figure 4, the built-up area is predominantly concentrated in the Northeast District, particularly in George Town. This concentration has increased pressure on available land, leading to conflicts over land use and the displacement of rural communities [23]. Furthermore, achieving the target for publicly accessible open space in urban areas remains a significant challenge. With only 1.3% of its land designated as open space for public use, Penang is far from meeting the desired target of 17% by 2030 [24,25]. These factors may help explain the slight reduction in built-up areas, as land is periodically converted between built-up and non-built-up uses in response to these pressures.
Before the adoption of the industrialization policy in the 1970s, Penang was heavily forested, and its economy was primarily based on agriculture and regional trade. Since the 1970s, Penang has experienced rapid urbanization, with its economy transitioning from a resource-based economy to one focused on trading and manufacturing. A notable increase in built-up areas occurred from 1990 to 2005 [21,26]. As a result, Penang Island now faces challenges in expanding its urban areas without causing environmental damage or encroaching on agricultural and forested lands. Consequently, the rate of new built-up areas is slowing as the land supply dwindles, leading to the introduction of land reclamation and the growth of vertical development.
A comparison between Figure 4, Figure 5, and Figure 6 reveals that the intense redshade representing the built-up area began to show yellow hues in between. This indicates the gradual infiltration of small patches of agricultural and horticultural land into the urban area. In other words, some areas of the built-up land have been supplemented by the presence of urban agriculture and horticulture.
As a result, this mixing of land uses led to classification ambiguities, which contributed to the minor changes and reduction in the recorded built-up area. This underlines that SPOT 6 and SPOT 7 were able to detect small changes and patches between the complex and complicated elements and structure of the pixels. As described by Airbus Defence and Space (2013)[17], SPOT 6 and SPOT 7 products can be easily integrated into a GIS environment or used to derive thematic geoinformation.
Figure 7 expounds the transition recorded in Table 5 into a map. It shows the changes in built-up areas in the Northeast and Southwest Districts between 2014 and 2023. Mars red shows the unchanged built-up, cordovan brown represents non-built-up to built-up, and rose quartz displays built-up to non-built-up.
The overall change observed between 2014 and 2023 shows a slight reduction in the built-up area on Penang Island. This suggests that the expansion of urban development has been counterbalanced by the presence of agricultural land within urban areas. If this trend persists, it could lead to a slowdown in urbanization, promoting a more balanced and sustainable development pattern for Penang Island.
3.3. Changes in Forest LULC Areas
The overall change in forested areas on Penang Island shows an increase of 10.32 km2 (2.92%) over the past decade. During the first phase, there was a significant gain of 30.44 km2 (9.46%) in forested areas. However, in the subsequent phase, the island experienced a loss of approximately 20.12 km2 (6.54%) of forested land. Despite this loss, it did not surpass the earlier gain, resulting in a net increase of 10.32 km2 (2.92%) in forested areas overall.
Despite rapid urbanization, there was an increase in forest cover, and this suggests that urban expansion did not entirely replace forested areas, and some reforestation or afforestation efforts might have been implemented to counterbalance urban growth in Penang Island [27].
Besides, Chan et al. (2023)[28] highlighted that Malaysia has implemented various sustainable forest management (SFM) practices, such as the Selective Management System (SMS) and Reduced Impact Logging (RIL). These practices aim to balance development needs with forest conservation, which likely contributed to the stabilization and slight increase in forest cover on Penang Island. Chan et al. (2023)[28] also noted that the Malaysian government is committed to maintaining at least 50% of the country’s land mass under forest and tree cover. This policy has likely influenced local efforts on Penang Island to preserve and increase forest cover. Additionally, the enforcement of land-use policies and the enhancement of forest law and governance have played a crucial role in mitigating forest loss and promoting reforestation.
Effective strategies such as afforestation, reforestation, and urban greening practices, including rooftop gardening, have been proposed and likely implemented to improve carbon storage capacity and reduce the impacts of climate change. These initiatives contribute to the increase in forest cover by adding new forested areas and enhancing existing ones [29]. Likewise, the reduction in agricultural land, particularly the decline in oil palm expansion, has also contributed to the increase in forest cover. As agricultural activities decrease, previously cleared lands may either regenerate naturally or be actively reforested [30,31].
During the second phase, forest loss on Penang Island was driven by road and infrastructure development, which increased accessibility and accelerated deforestation [32]. Privately owned hill forests were more vulnerable due to weaker management compared to state forests, often driven by timber demand [33]. Areas like Penang National Park also face pressure from tourism development, leading to environmental degradation [34]. Landslides and floods, intensified by deforestation, further damage forest areas [32].
Additionally, while specific data for Penang is limited, oil palm expansion and other agricultural activities remain as major deforestation drivers across Malaysia [35,36,37,38,39].
Figure 8 interprets the transition of forested areas recorded in Table 5 into a map. Medium apple indicates unchanged forest area, peacock green represents non-forest to forest area, and olivenite green signifies forest to non-forest area.
The decline of forest on Penang Island during the second phase is concerning because these activities have significant environmental and socio-cultural impacts, underscoring the urgent need for sustainable management and conservation efforts to prevent further degradation.
3.4. Changes in Water Bodies LULC Areas
Water bodies on Penang Island occupy a relatively small area. As a result, between 2014 and 2023, only a modest gain of 0.26 km2 (0.08%) was observed. During the first phase, there was a slight loss of 0.02 km2 (0.01%), but the second phase saw a gain of 0.28 km2 (0.09%). Still, there must be underlying factors that contributed to these changes.
One of the reasons is, Penang has experienced significant changes in climate, including increased temperatures and altered precipitation patterns. The annual mean maximum temperature increased significantly on Penang Island, contributing to higher evaporation rates and reduced water availability [40].
Additionally, extreme drought events, particularly during strong El Niño years (e.g., 2014-2016), have exacerbated water scarcity. These droughts have led to reduced water levels in rivers and reservoirs [40,41]. This is tally with the factor that caused decrease in agriculture and horticulture between 2014-2019.
The heavy urbanization in Penang has led to increased water demand and significant land use changes. Thus, urban development often results in the reduction of natural water bodies due to land reclamation and construction activities [42,43]. Also, Yen et al. (2017)[42] added that increased urban runoff and pollution from residential and industrial areas have consequently degraded water quality, making some water bodies unsuitable for use and contributing to their decline.
Conversely, the area of water bodies increased between 2019 and 2023. One of the factors contributing to the rise in water bodies on Penang Island during the second phase is water conservation initiatives. Efforts to manage water resources more sustainably, such as the construction of water recycling plants and rainwater harvesting systems, may lead to the creation of new water bodies [41].
Additionally, global warming has caused sea levels to rise, which can lead to coastal flooding and the formation of new water bodies in low-lying areas. This phenomenon has been observed in other parts of Malaysia and could similarly affect Penang Island [44].
For water bodies, only a small portion of the areas were detected due to an issue with the raster image’s color representation, which caused it to be confused with built-up areas. As a result, this misclassification led to reduced accuracy in identifying water bodies.
3.5. Changes in Agricultural and Horticultural LULC Areas
According to Table 5, the overall change indicated that agriculture and horticulture in Penang Island increased by 8.46 km2 (2.65%). However, this contrasted with the initial phase, which saw a significant decline in this category. This finding aligns with the Penang Green Council’s 2020[45] report, which identified the ongoing loss of agricultural land as the sector’s most pressing challenge. Mohammad et al. (2011)[21], back then, also reported a decline in agricultural land in Balik Pulau from 6,171.32 ha to 4,727.83 ha between 1992 and 2002.
Spatially proven for the first phase, a comparison between Figure 4 and Figure 5 shows that these changes predominantly occurred in Balik Pulau, located in the Southwest District. The decline in agricultural land can be attributed to rising land values and increasing development pressures, which are driving the conversion of agricultural areas to non-agricultural uses, both legally and illegally. While these conversions may provide economic benefits, such as increased revenue from urban development and infrastructure expansion, they ultimately result in the continued loss of farmland [45,46].
Climate change intensifies pressure on Penang’s agricultural sector, threatening long-term food security [45]. Flooding is a major factor, with a severe event in September 2017 affecting over 100 locations and displacing more than 1,000 people, as water levels rose between 0.3 m and 0.5 m [47]. A more devastating flood followed in November 2017, caused by a storm and high tides, displacing over 3,000 residents and affecting nearly 100,000 households. Some areas recorded 372 mm of rainfall overnight—equivalent to 1.5 months’ precipitation [48,49].
Penang also faces increasing drought risk, particularly in the northeast [50]. Between 2015 and 2020, frequent cloud-seeding was needed, with each operation costing up to RM27,000 [51]. In 2016 alone, 17 operations were carried out, linked to the El Niño-driven temperature anomaly [52]. By April 2020, water storage at the Air Itam and Teluk Bahang dams dropped to 33.3% and 20.9%, respectively [53]. These extreme events have significantly impacted agriculture, contributing to its observed decline.
Agriculture is often seen as unattractive to youth due to low profitability, traditional practices, and limited technological integration. This discourages innovation, such as the use of IT in farming. Additionally, the sector contributes to environmental issues like soil and water pollution, though data on these impacts remains limited [45]. In the second phase (see Figure 5 and Figure 6), agricultural and horticultural areas show an increasing trend, especially in the Northeast District.
While urbanization has reduced traditional farming, it has also encouraged urban agriculture to meet rising food demand. This aligns with the Department of Agriculture’s Urban Agriculture Program (UAP) launched in 2014 to enhance food security and community well-being [54,55]. However, challenges such as low community participation and slow progress persist [55].
A few programs initiated by the Department of Agriculture Penang, particularly urban agriculture, have the potential to catalyze significant progress and improvements in just a few years. For instance, Khor (2023)[56] reported that a community farm program was launched in 2015 in Kampung Bahru, Air Itam, Northeast District. The program aimed to transform a neglected dumping ground into a thriving green space. In an interview, a resident mentioned that in 2018, she initially planned to plant fruits but switched to growing vegetables due to space limitations. To overcome this challenge, they began experimenting with vertical planting. Vertical farming is emerging as a promising innovation, especially in high-rise buildings, to address space constraints and improve food security [57].
In heavily urbanized areas such as George Town, there is limited space for green infrastructure due to factors that constrain the growth of vegetation, along with a crowded and congested living environment and resource competition. However, driven by growing awareness of the benefits of green spaces, studies have indicated a high likelihood of resident participation in rooftop farming [58].
Figure 10 translates the transition recorded in statistical form from Table 5 into a map, showcasing the changes in agricultural and horticultural areas in the Northeast and Southwest Districts between 2014 and 2023. Solar yellow indicates an unchanged agriculture and horticulture area, olivenite green shows non-agriculture and horticulture to agriculture and horticulture, and citron yellow represents agriculture and horticulture to non-agriculture and horticulture.
The LULC changes on Penang Island since 2000 have been marked by fluctuations in agricultural trends and shifts in agricultural land. As a result, sustainable urban planning and the promotion of urban agriculture practices are essential to maintain the island’s ecological balance. While the agriculture sector is not a primary economic driver in Penang, it remains vital for ensuring food security and continues to be an important source of income for rural communities.
3.6. Changes in Barren Land LULC Areas
The total change in barren land on Penang Island has consistently decreased over both phases, resulting in a total loss of 11.84 km2 (3.99%) over the past 10 years. The decrease in barren land was almost evenly distributed between the two phases, with a loss of 5.85 km2 (2.02%) in the first phase and 5.99 km2 (1.98%) in the second phase.
Efforts to increase green cover through afforestation and reforestation have contributed to the reduction of barren land. These initiatives aim to improve carbon sequestration and mitigate urban heat island effects, leading to a decrease in barren areas [29].
Economic development in Penang has increased demand for infrastructure, housing, and commercial spaces, leading to the conversion of barren land into built-up areas [21,59]. Emphasis on balanced development and sustainable land use planning has helped minimize the negative effects of urbanization. Although the overall expansion of built-up areas has declined, transitions from barren to built-up land indicate that physical development is still ongoing on Penang Island.
Moreover, coastal development and land reclamation projects have also played a significant role. Historical and current topographic maps show that land reclamation has replaced coastal swamps, mangrove forests, and other natural habitats with urbanized areas. This process has reduced the extent of barren land along the coast of Penang Island [16]. Additionally, there has been a slight increase in forested areas on the island, which contributes to the reduction of barren land. From 2010 to 2021, forest areas saw a modest increase of 1.57%. These efforts help stabilize the soil and prevent the land from becoming barren [27].
4. Discussion
4.1. Overall Change and Transition Matrix (2014-2023)
Figure 12 shows the overall change and Table 6 presents the Transition Matrix of LULC in Penang Island from 2014 until 2023. The highest transition in the chart is “Forest - Forest,” representing the stability of forested areas throughout the study period. This indicates that most forest lands have remained unchanged and their crucial role in maintaining biodiversity, regulating climate, and supporting ecosystem services can be retained.
The second highest transition is “Built-up - Built-up,” showing firmness in urbanized areas. This reflects that previously developed lands have continued to be used for urban purposes, which is typical in established cities or areas with consolidated infrastructure. The consistency in urban land use suggests that these areas are undergoing minor changes rather than significant transformations. Even when changes occur, they tend to happen within the already-developed areas.
Ranked third is “Agriculture and Horticulture - Agriculture and Horticulture,” which indicates continuity in agricultural practices across much of the region with the presence of urban agriculture. The introduction of urban agriculture has balanced the deterioration of traditional agriculture. Whereas the “Agriculture and Horticulture – Forest” transition could be the result of traditional agriculture being abandoned. As these areas were neglected, they eventually allowed for the natural growth of forests as a replacement.
“Forest - Agriculture and Horticulture” is the next significant transition, highlighting the conversion of forested areas into agricultural land. This could be driven by increased demand for agricultural products or policy changes that encourage agricultural expansion. Such transitions often come at the expense of forest ecosystems, potentially affecting biodiversity and natural resource availability.
Interestingly, some transitions occurred from built-up areas to agriculture and horticulture, indicating shifts in land-use priorities toward food production, possibly due to economic or policy changes. However, these changes may also reflect classification confusion, where small urban agriculture patches within built-up zones were categorized as agricultural. The growing recognition of urban agriculture may have contributed to these areas being reclassified. Though rare, such reversals highlight the dynamic nature of land-use change.
The transition from “Barren Land - Agriculture and Horticulture” suggests efforts to rehabilitate degraded or unused lands for agricultural purposes. This is likely to reflect land management initiatives aimed at increasing food production or restoring previously unproductive areas. Although smaller in magnitude, such transitions represent positive contributions to land-use dynamics.
The transition from “Agriculture and Horticulture - Built-up” is another prominent trend, reflecting the expansion of urban areas into agricultural zones. This shift is largely driven by infrastructure development and population growth, which increases the demand for land for residential, commercial, and industrial purposes. The conversion of agricultural land to urban use poses significant implications for food security and rural livelihoods, highlighting the importance of sustainable urban planning that minimizes the loss of fertile agricultural land. Again, this transition could be partly attributed to classification confusion, as areas of urban agriculture within built-up zones may have been categorized as agricultural land during the classification process.
The chart reveals a hierarchy of transitions, with stability observed in Forest, Built-up, and Agriculture and Horticulture areas being the dominant trends. Significant shifts, especially those involving the conversion of natural and agricultural lands to urban uses, and vice versa, reflect the evolving dynamics of LULC in response to changing needs. While minor transitions may appear less impactful, they are crucial in understanding the localized and nuanced nature of land-use changes. Addressing these transitions through sustainable policies and planning is essential for achieving balanced and sustainable development.
4.2. Implications of the Changes Towards SDG 11 and National Physical Plan (NPP)
The LULC changes in Penang Island from 2014 to 2023 present both opportunities and challenges for aligning with Sustainable Development Goal 11 and Malaysia’s National Physical Plan (NPP). While the previous heavy and rapid urbanization back in the years has brought economic growth, it has also raised concerns about sustainability and environmental stewardship.
The extreme expansion of built-up areas, though indicative of progress, has often come at the expense of green spaces and ecosystem services. This growth exacerbates urban challenges such as heat islands, increased housing demand, and strain on infrastructure, potentially undermining the inclusivity and sustainability objectives of SDG 11. Furthermore, unregulated urban sprawl conflicts with the NPP’s directive for compact, planned development, jeopardizing efforts to balance urban and rural systems.
The decline in forest cover during the Second Phase is particularly alarming, as forests are vital for flood regulation, climate adaptation, and biodiversity. This loss undermines the ecological balance championed by the NPP and raises questions about the effectiveness of reforestation programs and conservation strategies.
Traditional agricultural and horticultural land, vital for food security and rural livelihoods, has begun to diminish. This trend threatens sustainable food systems, placing additional pressure on urban centers. Urban agriculture, typically practiced on a small scale for self-sufficiency, cannot fully compensate for the loss of larger agricultural areas. These changes suggest that economic priorities often take precedence over the goals of the National Physical Plan (NPP), which aims to preserve agricultural land for long-term sustainability.
These LULC changes reveal critical imbalances in Penang Island’s development trajectory, with short-term economic growth often prioritized over ecological preservation and social equity. The trends point to deficiencies in policy enforcement, monitoring mechanisms, and stakeholder inclusion. Marginalized communities and ecological stakeholders’ risk being excluded from decision-making, contradicting the inclusivity mandate of SDG 11.
5. Conclusions
In conclusion, a decade (2014–2023) of LULC changes on Penang Island, analyzed using the SVM image classifier on SPOT imagery, achieved mapping accuracies of 90.8%, 91%, and 94.2%, respectively. Over this period, the built-up area decreased by 4.53 km2 (1.67%), while forest areas expanded by 10.32 km2 (2.92%), water bodies grew by 0.26 km2 (0.08%), and agricultural and horticultural areas increased by 8.47 km2 (2.65%). Meanwhile, barren land declined by 11.84 km2 (3.99%). These LULC transformations highlight the need for a more integrated and sustainable approach to urban planning on Penang Island. Stricter regulatory enforcement, the adoption of green infrastructure, and inclusive governance are essential to balancing economic development with environmental integrity and social equity. By addressing these gaps, Penang Island can better align its growth with national and global sustainability goals, ensuring a resilient and inclusive future. The observed LULC changes present significant challenges to achieving SDG 11. However, with effective strategies and sustainable urban planning, it is possible to mitigate these impacts and foster more resilient and sustainable urban environments.
Author Contributions
Conceptualization, N.F.Y. and M.H.I.; methodology, N.F.Y., M.H.I. and A.A.Z; software, N.F.Y.; validation, N.F.Y. and M.H.I.; formal analysis, N.F.Y.; investigation, N.F.Y.; resources, N.F.Y.; data curation, N.F.Y. and M.H.I.; writing—original draft preparation, N.F.Y.; writing—review and editing, N.F.Y, M.H.I. and A.A.Z.; visualization, N.F.Y.; supervision, M.H.I. and A.A.Z.; project administration, M.H.I.; funding acquisition, M.H.I. All authors have read and agreed to the published version of the manuscript.
Funding
This research was funded by the Graduate Research Fellowship (GRF) Scheme and the research grant GP-IPS/2023/9768400. The authors extend their gratitude to the Research Management Centre (RMC), Universiti Putra Malaysia (UPM), for their financial and administrative support, which was instrumental in the successful completion of this study.
Conflicts of Interest
The authors declare no conflicts of interest.
Abbreviations
The following abbreviations are used in this manuscript:
| LULC | Land Use and Land Cover |
| SDGs | Sustainable Development Goals |
| NPP | National Physical Plan |
| RS | Remote Sensing |
| GIS | Geographic Information Systems |
| MYSA | Malaysian Space Agency |
| SVM | Support Vector Machine |
| JP2 | JPEG2000 |
| SFM | Sustainable Forest Management |
| SMS | Selective Management System |
| RIL | Reduced Impact Logging |
| UAP | Urban Agriculture Program |
References
- Akhtar, M.Z.; Zaman, K.; Khan, M.A. The impact of governance indicators, renewable energy demand, industrialization, and travel & transportation on urbanization: A panel study of selected Asian economies. Cities 2024, 151, 103723. [Google Scholar] [CrossRef]
- Voukkali, I.; Papamichael, I.; Loizia, P.; Zorpas, A.A. Urbanization and solid waste production: Prospects and challenges. Environ. Sci. Pollut. Res. 2024, 31, 17678–17689. [Google Scholar] [CrossRef]
- Carlucci, M.; Salvati, L. Assessing path-dependent urban growth with geographically weighted regressions. Environ. Impact Assess. Rev. 2023, 98, 106958. [Google Scholar] [CrossRef]
- Huang, M.; Zhao, S. Tracing trajectories and co-evolution of metropolitan urbanization in the United States, Europe, and China. Sci. Total Environ. 2024, 945, 167576. [Google Scholar] [CrossRef] [PubMed]
- United Nations (UN). Sustainable Development Goal 11: Make cities and human settlements inclusive, safe, resilient, and sustainable; United Nations: New York, NY, USA, 2021. [Google Scholar]
- Koch, F.; Krellenberg, K. How to contextualize SDG 11? Looking at indicators for sustainable urban development in Germany. ISPRS Int. J. Geo-Inf. 2018, 7, 464. [Google Scholar] [CrossRef]
- Allan, M.; Rajabifard, A.; Foliente, G. Climate resilient urban regeneration and SDG 11 – stakeholders’ view on pathways and digital infrastructures. Int. J. Digit. Earth 2024, 17. [Google Scholar] [CrossRef]
- Nabiyeva, G.N.; Wheeler, S.M.; London, J.K.; Brazil, N. Implementation of Sustainable Development Goal 11 (Sustainable Cities and Communities): Initial good practices data. Sustainability 2023, 15, 14810. [Google Scholar] [CrossRef]
- Moallemi, E.A.; Malekpour, S.; Hadjikakou, M.; Raven, R.; Szetey, K.; Ningrum, D.; Dhiaulhaq, A.; Bryan, B.A. Achieving the Sustainable Development Goals requires transdisciplinary innovation at the local scale. One Earth 2020, 3, 300–313. [Google Scholar] [CrossRef]
- PLANMalaysia. Rancangan Fizikal Negara: Apa itu RFN4? 2024. Retrieved from https://www.planmalaysia.gov.my/index.php/pages/view/265.
- Gao, G.; San, L.H.; Zhu, Y. Flood Inundation Analysis in Penang Island (Malaysia) Based on InSAR Maps of Land Subsidence and Local Sea Level Scenarios. Water 2021, 13, 1518. [Google Scholar] [CrossRef]
- Gin, O.K. Disparate identities: Penang from a historical perspective, 1780–1941. Kajian Malaysia 2015, 33, 27–52. [Google Scholar]
- Ngah, K. Peraturan dan kawalan guna tanah bandar: Bab 5 perancangan guna tanah bandar Pulau Pinang; Dewan Bahasa dan Pustaka: Kuala Lumpur, Malaysia, 1993. [Google Scholar]
- Samat, N.; Mahamud, M.A.; Tan, M.L.; Maghsoodi Tilaki, M.J.; Tew, Y.L. Modelling Land Cover Changes in Peri-Urban Areas: A Case Study of George Town Conurbation, Malaysia. Land 2020, 9, 373. [Google Scholar] [CrossRef]
- Yin, N.S.; Siong, H.C. The relationship between urban population density and transportation fuel consumption in Malaysian cities. Planning Malaysia 2010, 8, 45–66. [Google Scholar]
- Chee, S.Y.; Othman, A.G.; Sim, Y.K.; Mat Adam, A.N.; Firth, L.B. Land reclamation and artificial islands: Walking the tightrope between development and conservation. Glob. Ecol. Conserv. 2017, 12, 80–95. [Google Scholar] [CrossRef]
- Airbus Defence and Space. SPOT 6/7 Imagery - User Guide; Report No. SI/DC/13034-v1.0; Airbus Defence and Space Intelligence: France, 2013. [Google Scholar]
- MicroImages, Inc. Radiometric correction of satellite images; MicroImages, Inc.: Nebraska, USA, 2016. [Google Scholar]
- Astrium Services. SPOT 6/7 Imagery - User Guide; Report No. SI/DC/13034-v1.0; Astrium Services: France, 2013. [Google Scholar]
- Mohd Hasmadi, I.; Kamaruzaman, J. Satellite Data Classification Accuracy Assessment Based from Reference Dataset. World Acad. Sci. Eng. Technol. 2008, 15. [Google Scholar]
- Mohammad, K.S.; Samat, N.; Khalid, H.N. Using remote sensing and GIS for observing land use land cover changes and quantifying arable land loss in Penang Island: A case study of Balik Pulau. In Proceedings of the 32nd Asian Conference on Remote Sensing (ACRS); Taipei, Taiwan; 2011. [Google Scholar]
- Elmahdy, S.I.; Marghany, M.M.; Mohamed, M.M. Application of a weighted spatial probability model in GIS to analyze landslides in Penang Island, Malaysia. Geomatics Nat. Hazards Risk 2014, 7, 345–359. [Google Scholar] [CrossRef]
- Ghazali, S. Sense of place and the politics of “Insider-ness” in villages undergoing transition: The case of city kampung on Penang Island. In Cleavage, Connection, and Conflict in Rural, Urban, and Contemporary Asia; pp. 117–142, 2012.
- Vaghefi, N. Penang’s progress towards the Sustainable Development Goals by 2030; Penang Institute Monographs, 2024.
- Department of Statistics Malaysia (DoSM). SDG Indikator Pulau Pinang 2022. 2022. Retrieved from https://dosm.gov.my.
- Shariff, N.M. Modelling urban land use change using geographically weighted regression and the implications for sustainable environmental planning. In Proceedings of the 5th Biennial Conference of the International Environmental Modelling and Software Society (iEMSs) 2010, 2, 1249–1256. [Google Scholar]
- Akomolafe, G.F.; Rosazlina, R. Land use and land cover changes influence the land surface temperature and vegetation in Penang Island, Peninsular Malaysia. Sci. Rep. 2022, 12, 21250. [Google Scholar] [CrossRef]
- Chan, C.K.; Ling, G.H.T.; Ho, C.S.; Kanniah, K.D. Sustainable forest management and effective land use policies for mitigating forest loss: The case of Malaysia. Chem. Eng. Trans. 2023, 106, 799–804. [Google Scholar]
- Rahaman, Z.A.; Al Kafy, A.; Saha, M.; et al. Assessing the impacts of vegetation cover loss on surface temperature, urban heat island, and carbon emission in Penang city, Malaysia. Build. Environ. 2022, 222, 109425. [Google Scholar] [CrossRef]
- Hamdan, O.; Rahman, K.A.; Samsudin, M. Quantifying rate of deforestation and CO2 emission in Peninsular Malaysia using PALSAR imageries. IOP Conf. Ser. Earth Environ. Sci. 2016, 37, 012028. [Google Scholar] [CrossRef]
- Miyamoto, M.; Mohd Parid, M.; Noor Aini, Z.; Michinaka, T. Proximate and underlying causes of forest cover change in Peninsular Malaysia. For. Policy Econ. 2014, 44, 18–25. [Google Scholar] [CrossRef]
- Masum, K.M.; Mansor, A.; Sah, S.A.M.; Lim, H.S. Effect of differential forest management on land-use change (LUC) in a tropical hill forest of Malaysia. J. Environ. Manag. 2017, 200, 468–474. [Google Scholar] [CrossRef] [PubMed]
- Wallace, B.J. Village-based illegal logging in northern Luzon. Asia-Pac. Soc. Sci. Rev. 2011, 11, 19–26. [Google Scholar]
- Weng, C.N.; Mohamed, B.; Wern, H.C. Potentials, threats, and challenges in managing natural heritage in the Penang National Park. Kemanusiaan 2015, 22, 47–65. [Google Scholar]
- Gopal, S.; Kelly-Fair, M.; Ma, Y. Palm oil – The increasing materiality of deforestation and biodiversity risks in Indonesia and Malaysia. In IGARSS 2023 - IEEE Int. Geosci. Remote Sens. Symp. 2023, pp. 374–2377. [CrossRef]
- Turner, E.C.; Snaddon, J.L. Deforestation in Southeast Asia. In Biological and Environmental Hazards, Risks, and Disasters, 2nd ed.; Sivanpillai, R., Shroder, J.F., Eds.; Elsevier: Amsterdam, Netherlands, 2023; pp. 319–334. [Google Scholar]
- Xu, Y.; Yu, L.; Li, W.; Ciais, P.; Cheng, Y.; Gong, P. Annual oil palm plantation maps in Malaysia and Indonesia from 2001 to 2016. Earth Syst. Sci. Data 2020, 12, 847–867. [Google Scholar] [CrossRef]
- Shevade, V.S.; Loboda, T.V. Oil palm plantations in Peninsular Malaysia: Determinants and constraints on expansion. PLoS ONE 2019, 14. [Google Scholar] [CrossRef]
- Rahim, A.S.A.; Wahid, H.O.M.S. Determinants of deforestation in Peninsular Malaysia: An ARLD approach. Malaysian Forester 2009, 72, 155–164. [Google Scholar]
- Tan, M.L.; Zhang, F.; Derek, C.J.C.; Yu, K.H.; Shaharudin, S.M.; Chan, N.W.; Asyirah, A.R. Spatio-temporal analysis of precipitation, temperature, and drought from 1985 to 2020 in Penang, Malaysia. Water Supply 2022, 22, 4757–4768. [Google Scholar] [CrossRef]
- Chan, N.W.; Ghani, A.A.; Samat, N.; Roy, R.; Tan, M.L.; Rahman, H.A. Addressing water resources shortfalls due to climate change in Penang, Malaysia. Springer Water.
- Yen, L.J.; Matsumoto, Y.; Yin, C.S.; et al. Characteristics of water quality of rivers related to land-use in Penang Island, Malaysia. AIP Conf. Proc. 2017, 1892, 1–8. [Google Scholar]
- Lai, C.H.; Chang, C.K.; Zakaria, N.A. Institutional reform for water conflict resolution in Malaysia: A preliminary study of Penang state and Kedah state. In Proc. 38th IAHR World Congress 2019, pp. 467–475.
- Samsuddin, S.S.; Abdul, M.K.N.; Othman, A.K.; et al. Extensive assessment of climate change impacts on coastal zone paddy growth using multispectral analysis and hydrodynamic modelling. Sci. Total Environ. 2023, 868, 161442. [Google Scholar] [CrossRef]
- Penang Green Council. Penang Green Agenda 2030: Agriculture; Think Tank & Policy Division, Agriculture Working Group: Penang, Malaysia, 2020. [Google Scholar]
- Penang Institute. Penang Economic Development Report 2019/2020; Penang Institute: Penang, Malaysia, 2020. Retrieved from https://penanginstitute.org/wp-content/uploads/2021/03/Penang-Economic-and-Development-Report-2019-2020.pdf.
- Yaakob, F.F. Banjir kilat lagi di Pulau Pinang. Berita Harian Online, 4 November 2017. Retrieved from https://www.bharian.com.my/berita/wilayah/2017/11/346360/banjir-kilat-lagi-di-pulau-pinang.
- Teoh, S. Seven dead in worst floods to hit Penang. Straits Times, 6 November 2017. Retrieved from https://www.straitstimes.com/asia/se-asia/seven-dead-in-worst-floods-to-hit-penang.
- Saleh, A.; Yuzir, A.; Abustan, I. Flood mapping using Sentinel-1 SAR imagery: Case study of the November 2017 flood in Penang. IOP Conf. Ser. Earth Environ. Sci. 2020, 479, 012013. [Google Scholar] [CrossRef]
- Chan, N.W.; Ghani, A.A. Addressing Water Resources Shortfalls Due To Climate Change. In Water Security and Climate Change; 17. 20 January.
- Malaysian Meteorological Department (MMD). Cloud Seeding Operations Report 2015–2020; Malaysian Meteorological Department: Petaling Jaya, Malaysia, 2020. [Google Scholar]
- Rohde, R. Global Temperature Report for 2020; Berkeley Earth: California, USA, 2021. [Google Scholar]
- Dermawan, A. Penang mahu pembenihan awan, tampung sumber air. Harian Metro, 15 April 2020. Retrieved from https://www.hmetro.com.my/mutakhir/2020/04/566804/penang-mahu-pembenihan-awantampung-sumber-air.
- Chong, N.O.; Nawawi, F.N.; Ali, M.M.; Ahmad, M.S.; Juhari, S.K. Urban agriculture activities scenario in relation to food security: Delving into urban farming practices. Planning Malaysia 2024, 22, 307–319. [Google Scholar]
- Amira Yusuf, M.S.; Man, N.; Mohamed Haris, N.B.; Ismail, I.A.; Maruf, A. Evaluating urban agriculture program effectiveness using the CIPP model: A review. E3S Web Conf. 2021, 306, 01012. [Google Scholar] [CrossRef]
- Khor, T.C. Community farms start to flourish in Penang. The Sun, 12 December 2024. Retrieved from https://thesun.my/malaysia-news/community-farms-start-to-flourish-in-penang-DO11860210.
- Papathy, S. An overview of vertical farming: Highlighting the potential in Malaysian high-rise buildings. Pertanika J. Sci. Technol. 2022, 30, 949–981. [Google Scholar] [CrossRef]
- Then, E.; Hong, M. Urban Agriculture: The Feasibility of Rooftop Farming in Penang Island, Malaysia. J. Reg. City Plan. 2022, 33, 116–130. [Google Scholar] [CrossRef]
- Osmadi, A.; Ling, G.S.; Yusof, N. Effects of rapid development of high-rise buildings on the environment in Penang Island. Adv. Environ. Biol. 2015, 9, 101–103. [Google Scholar]
Figure 1.
The Map of Penang Island, Malaysia.
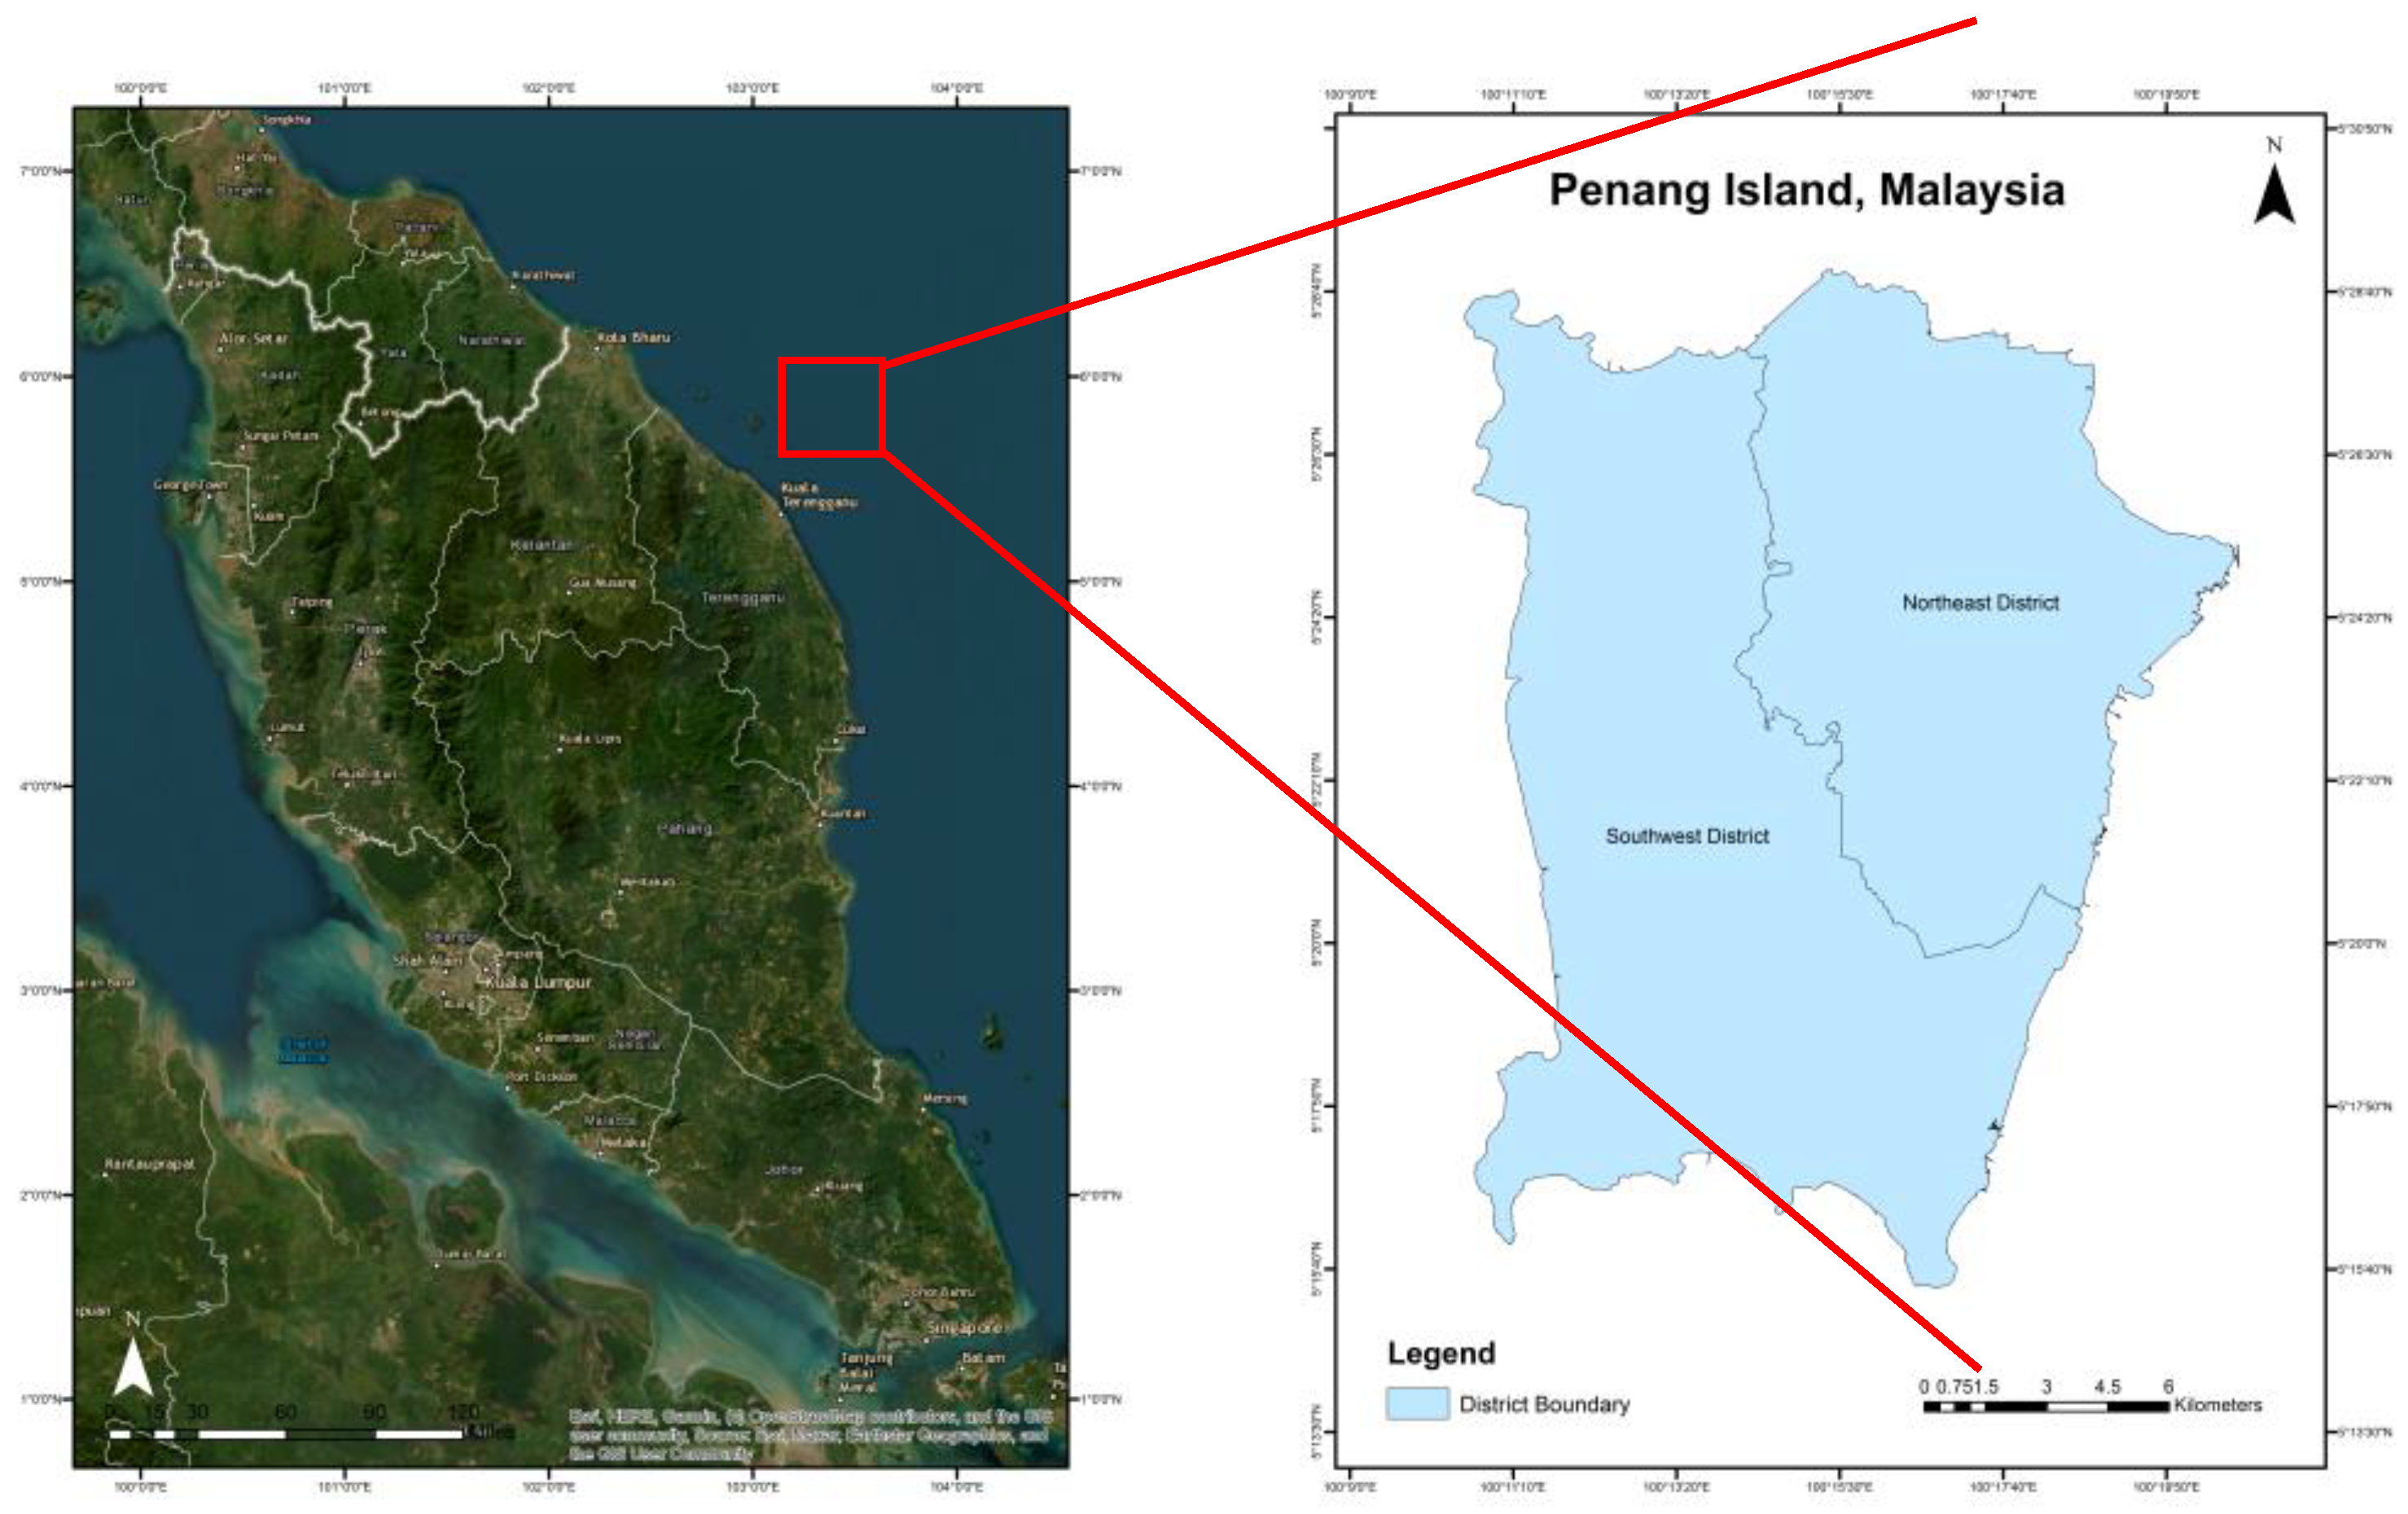
Figure 2.
Accuracy Assessment Points Function in ArcGIS 10.6.1.
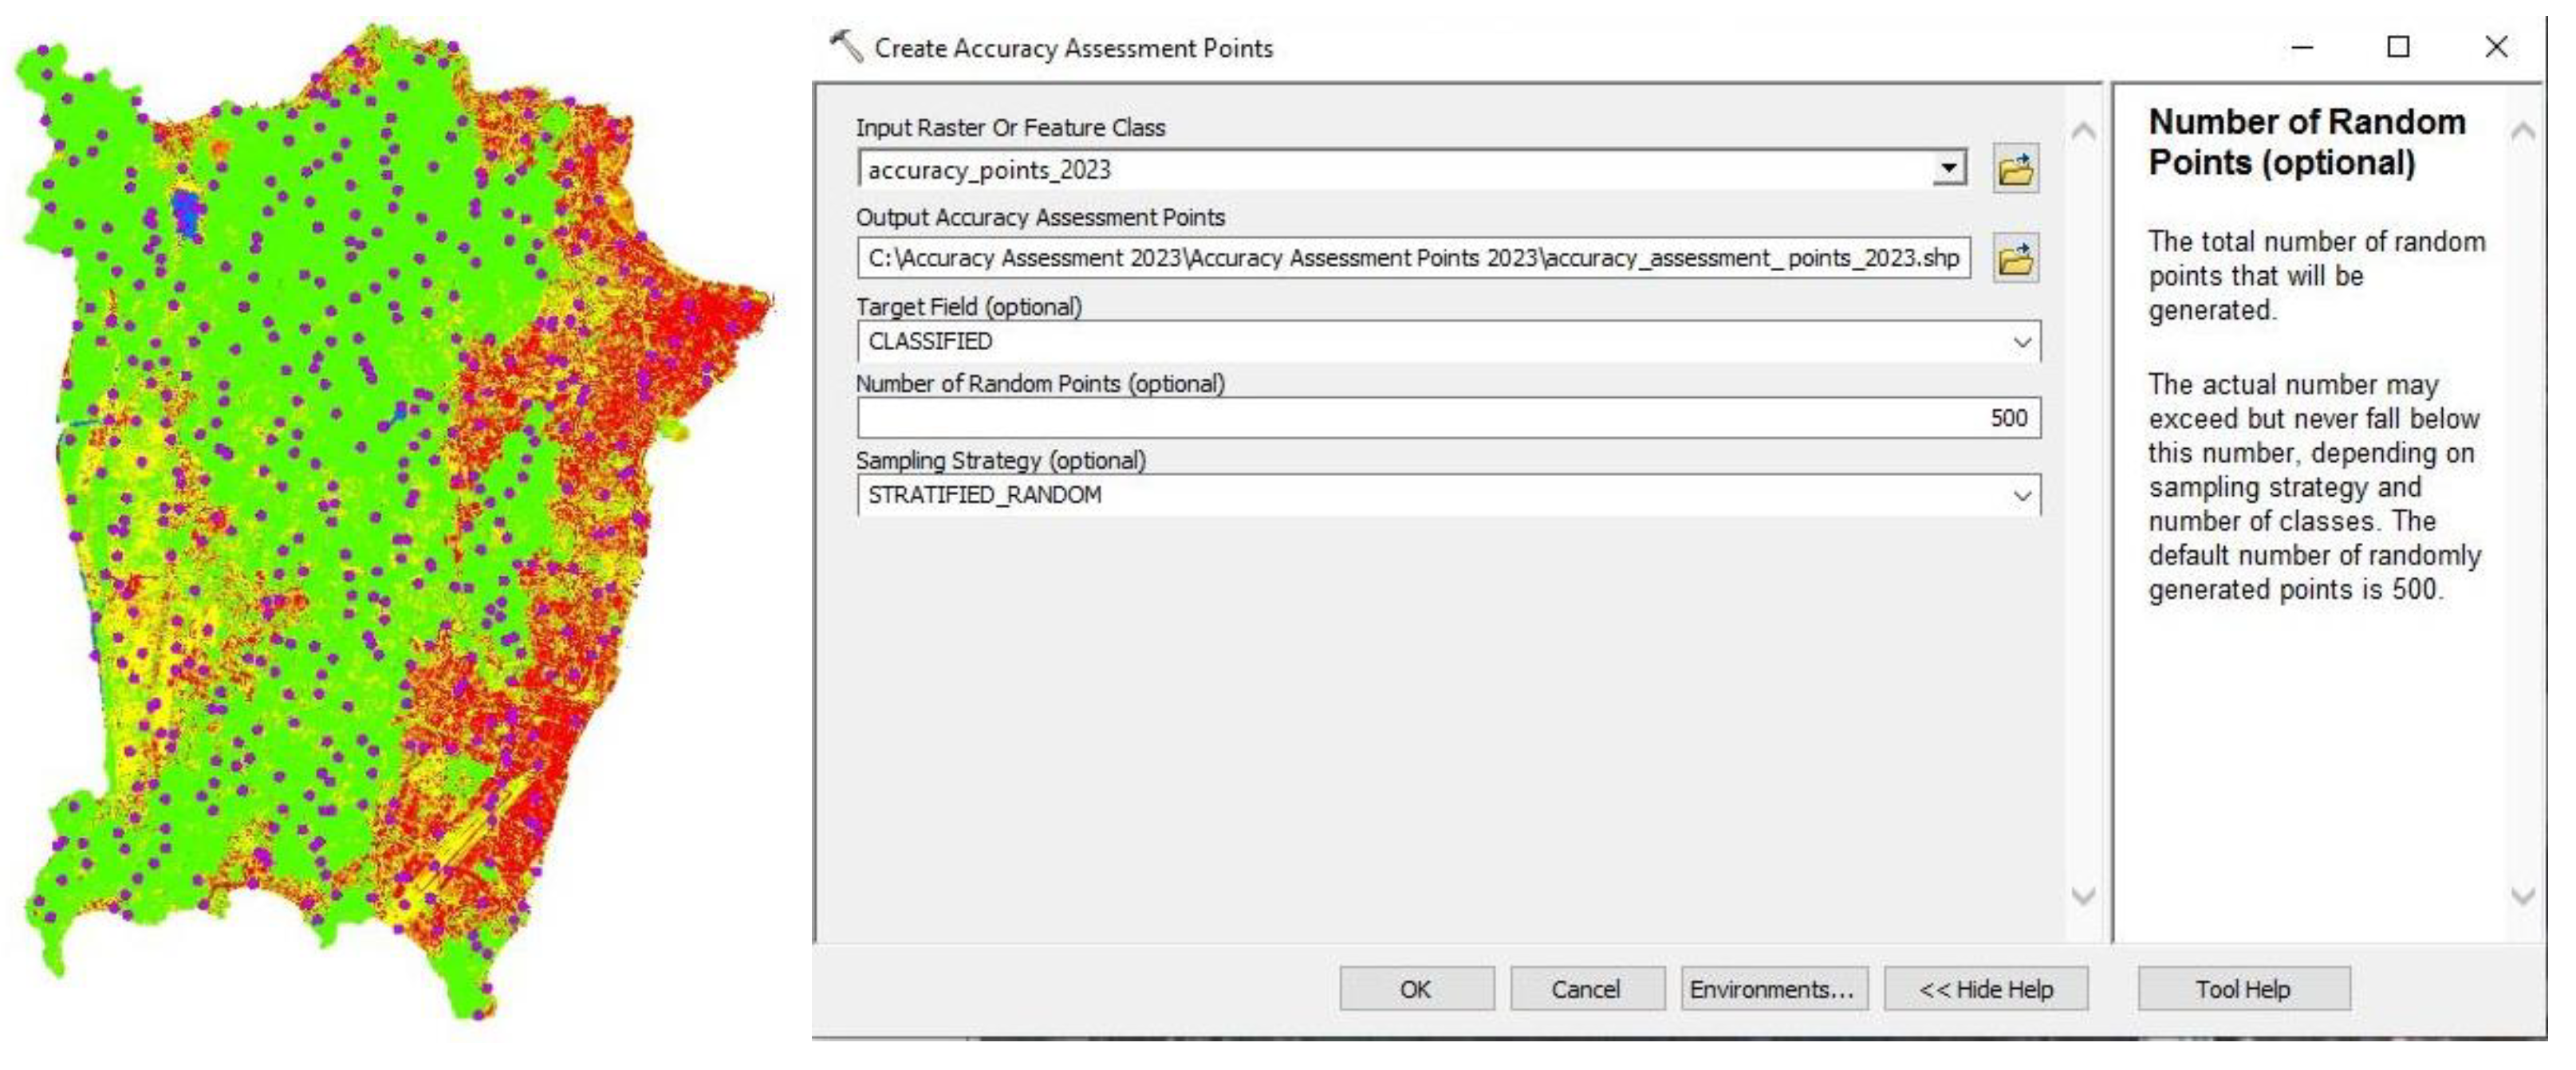
Figure 3.
Conceptual Framework of LULC Change Detection on Penang Island, Malaysia.
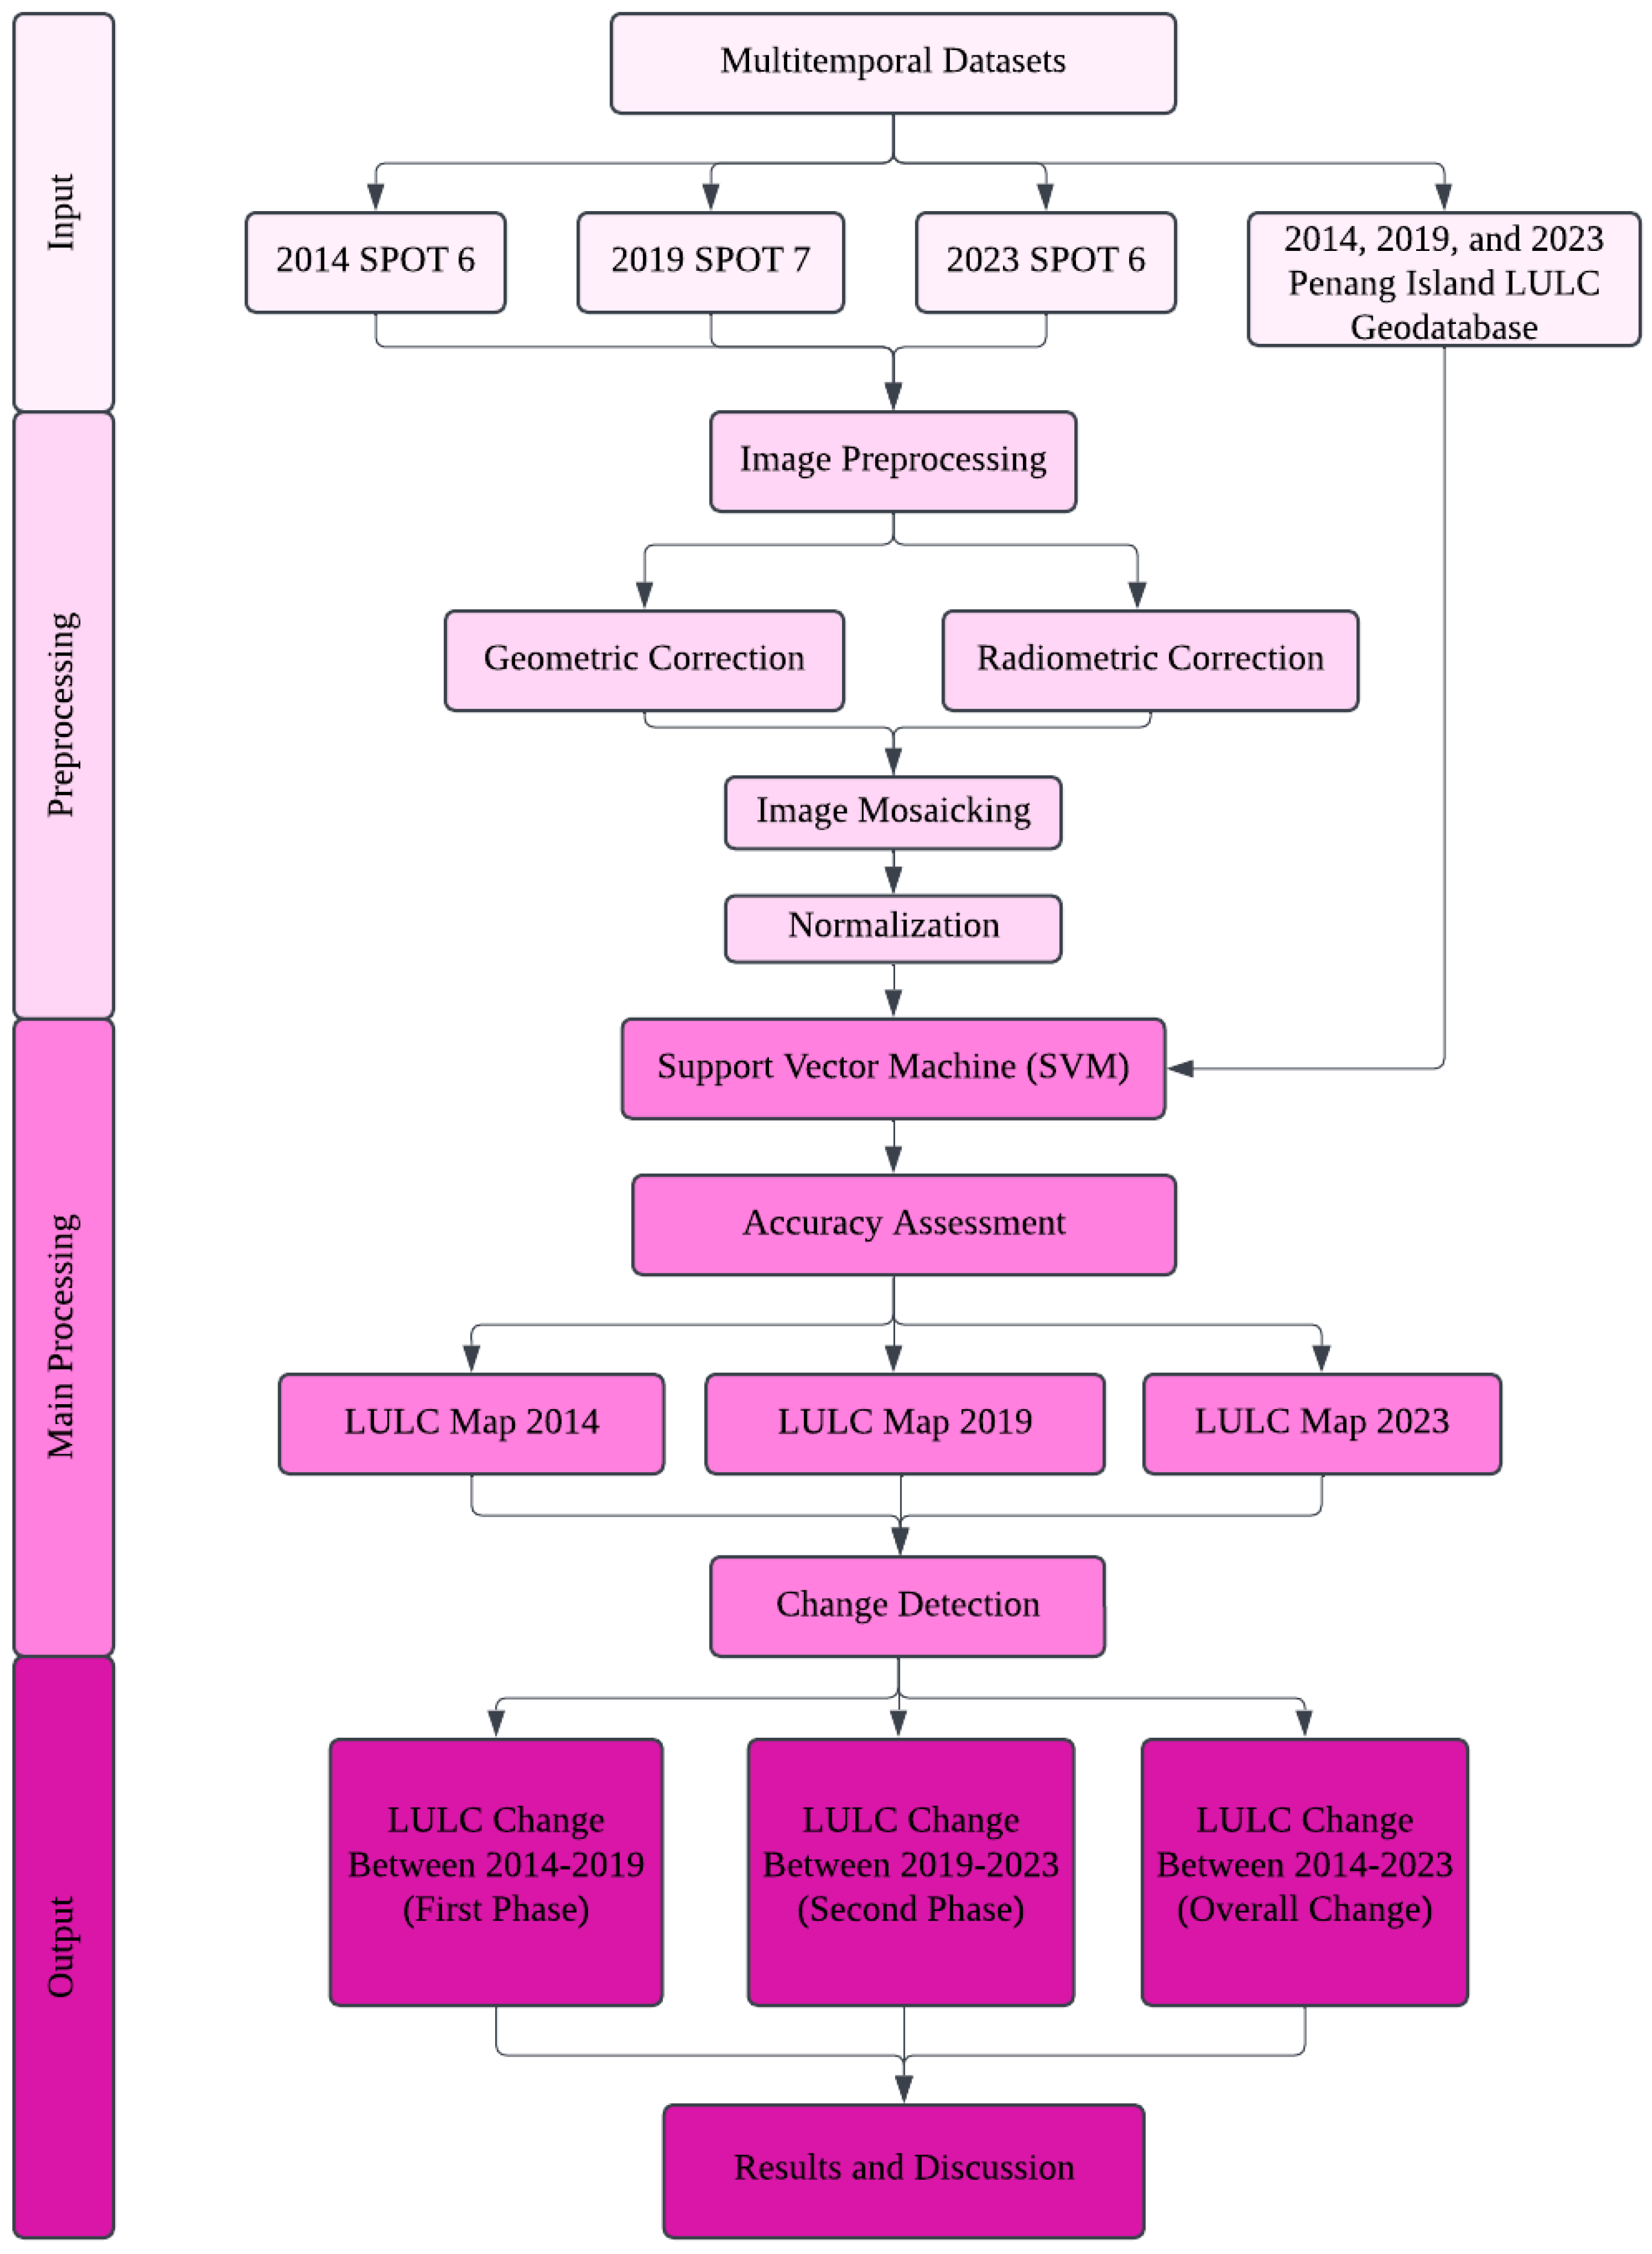
Figure 4.
2014 LULC Classification of Penang Island.
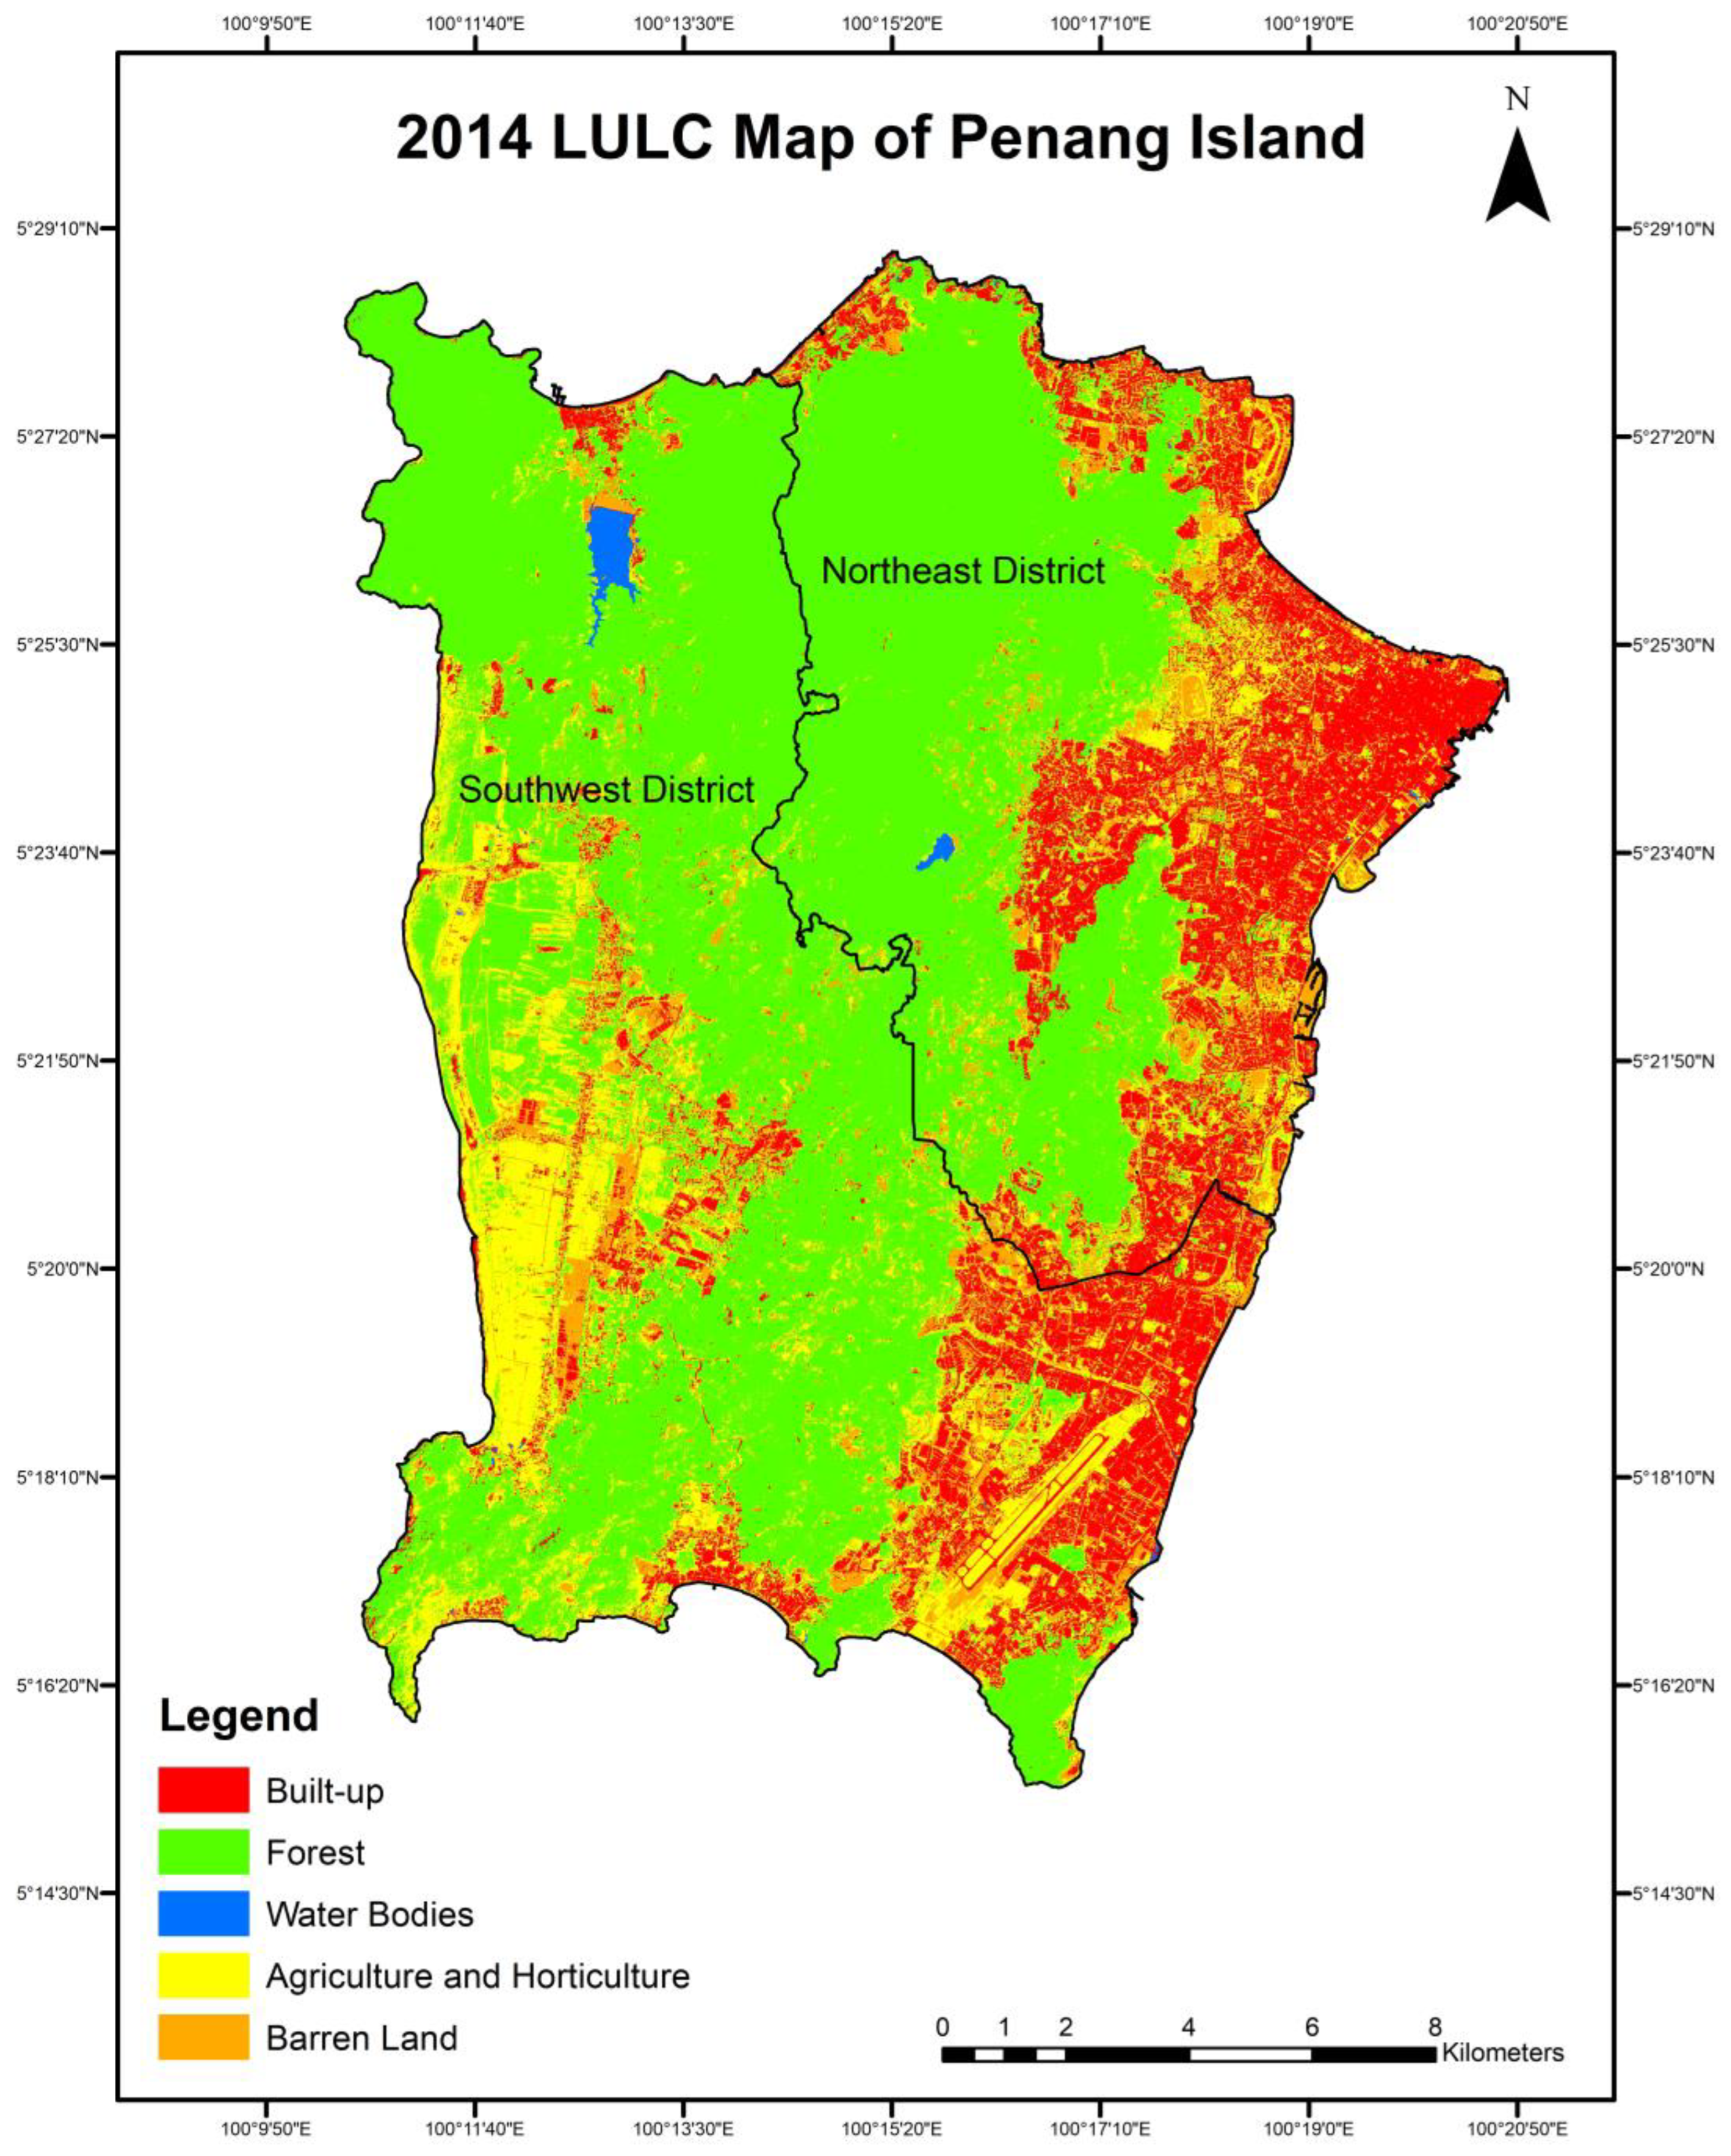
Figure 5.
2019 LULC Classification of Penang Island.
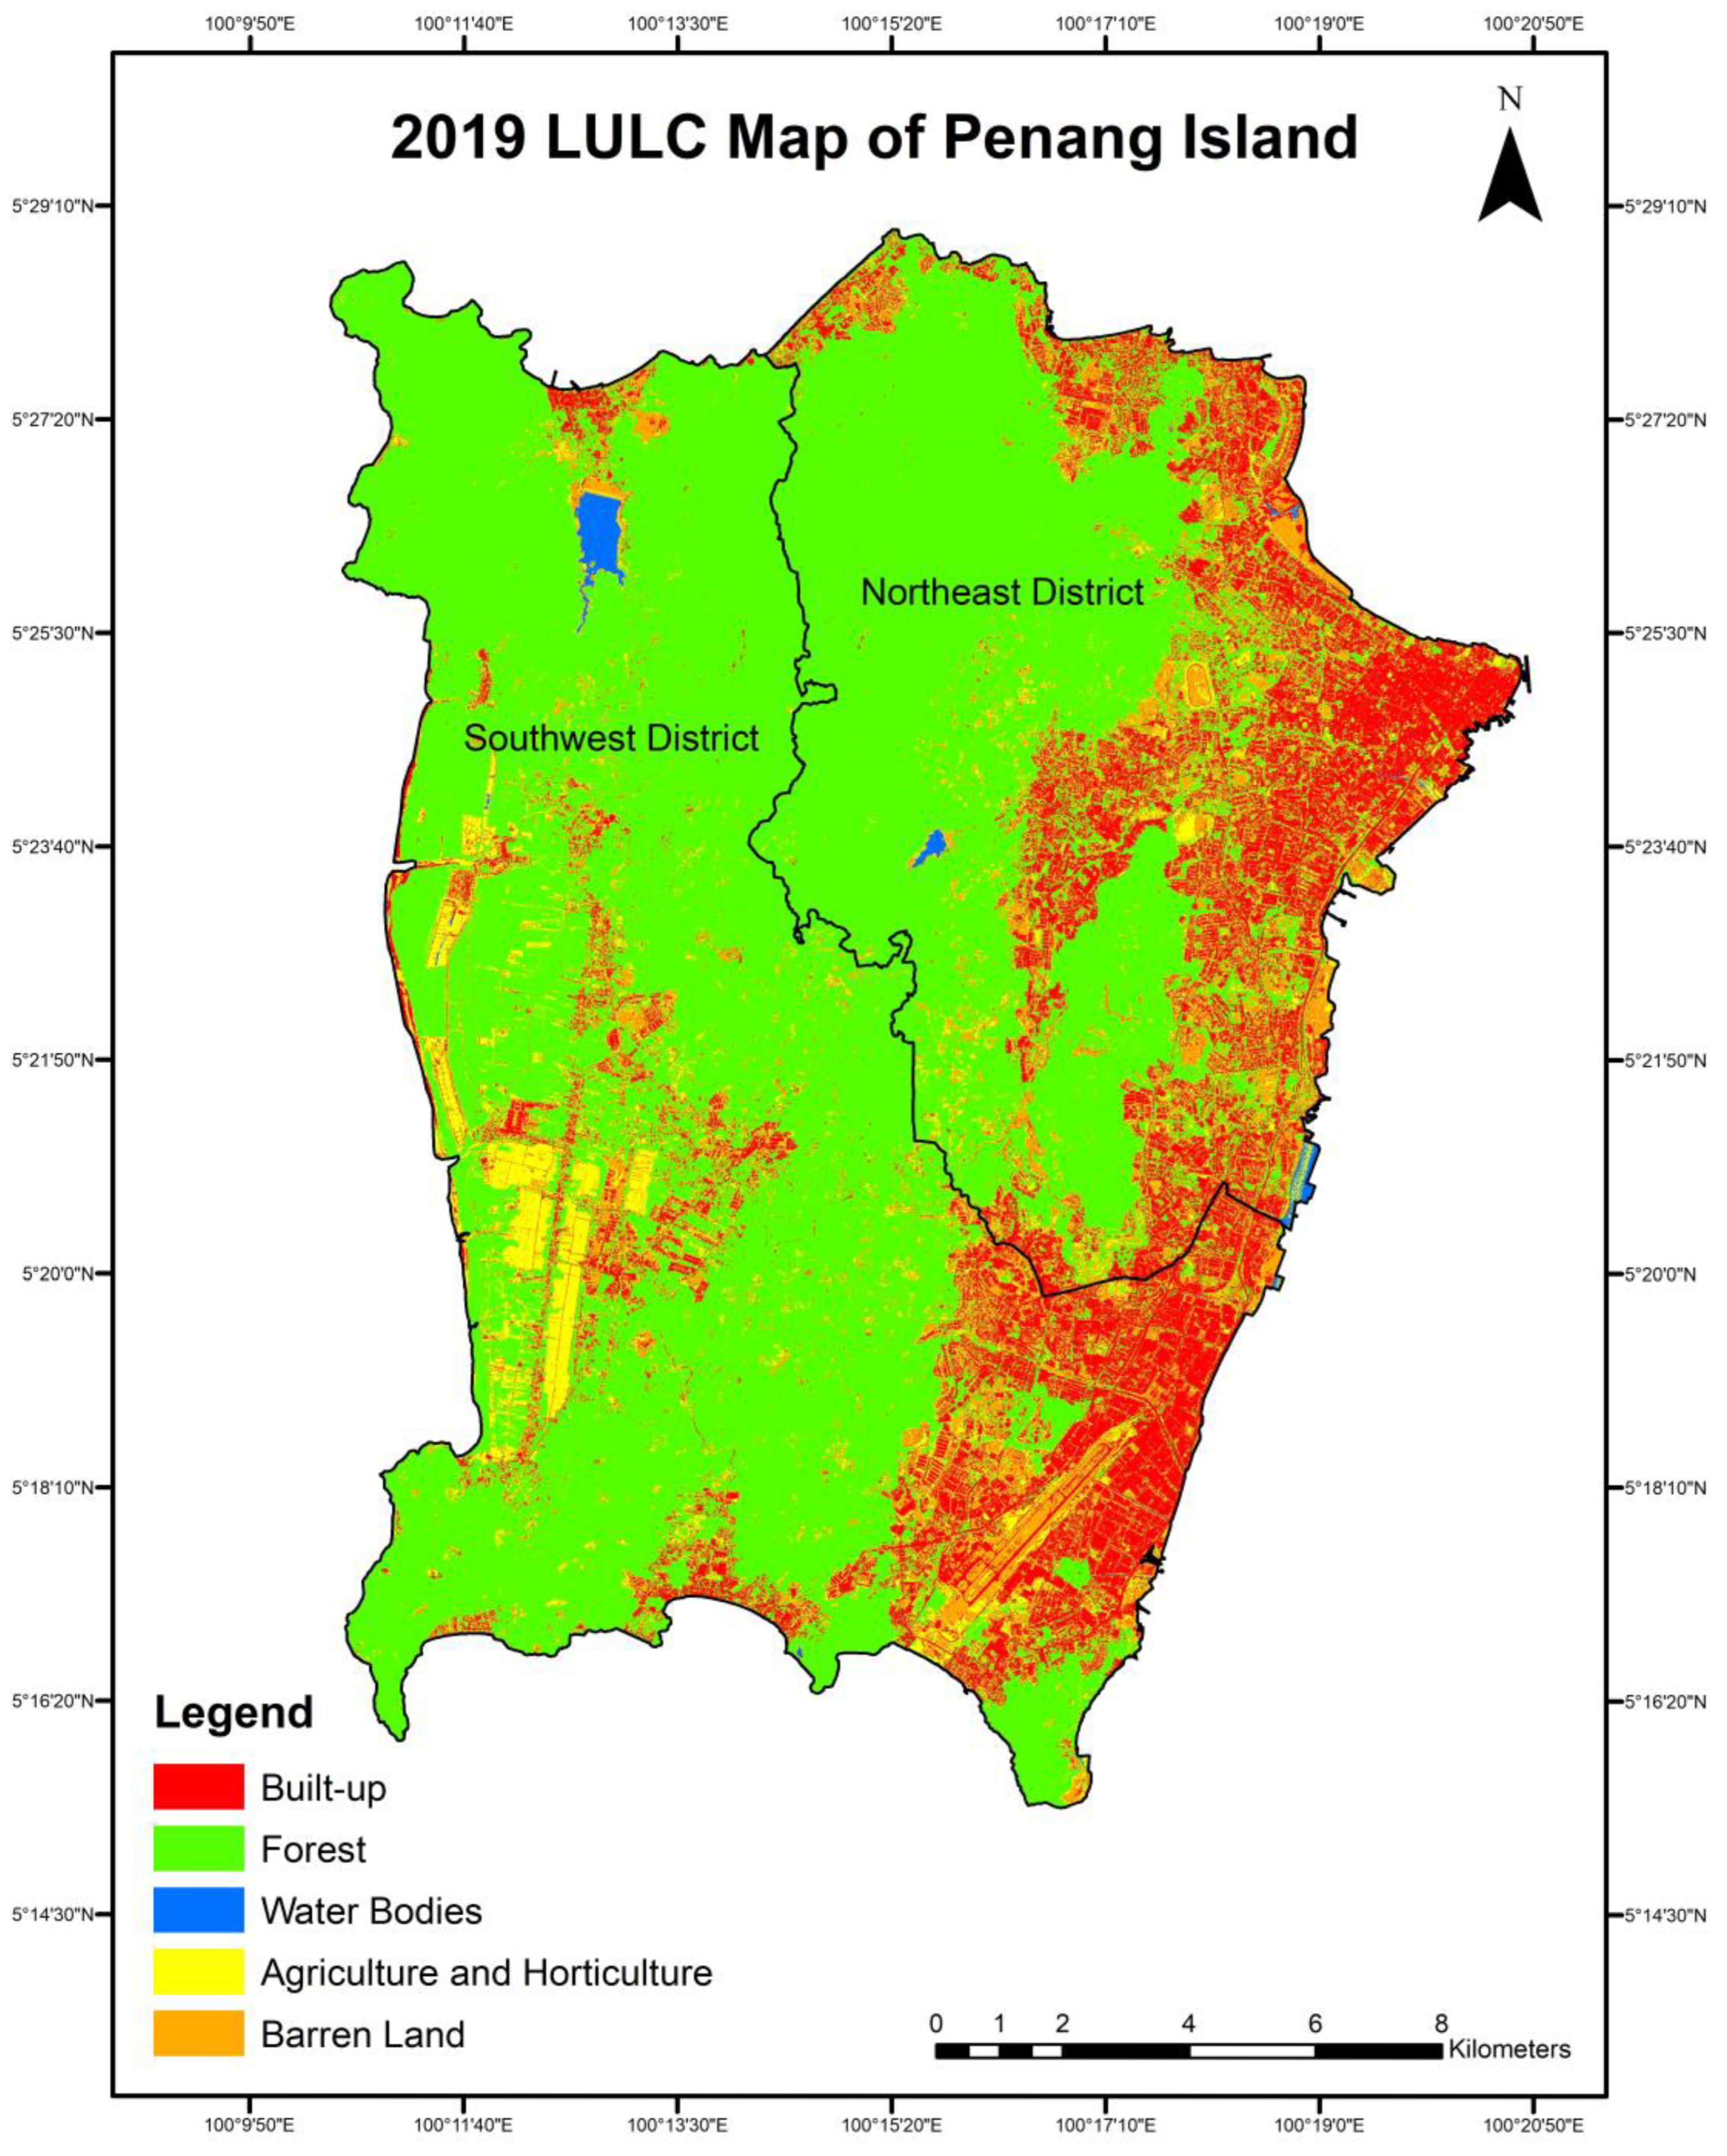
Figure 6.
2023 LULC Classification of Penang Island.
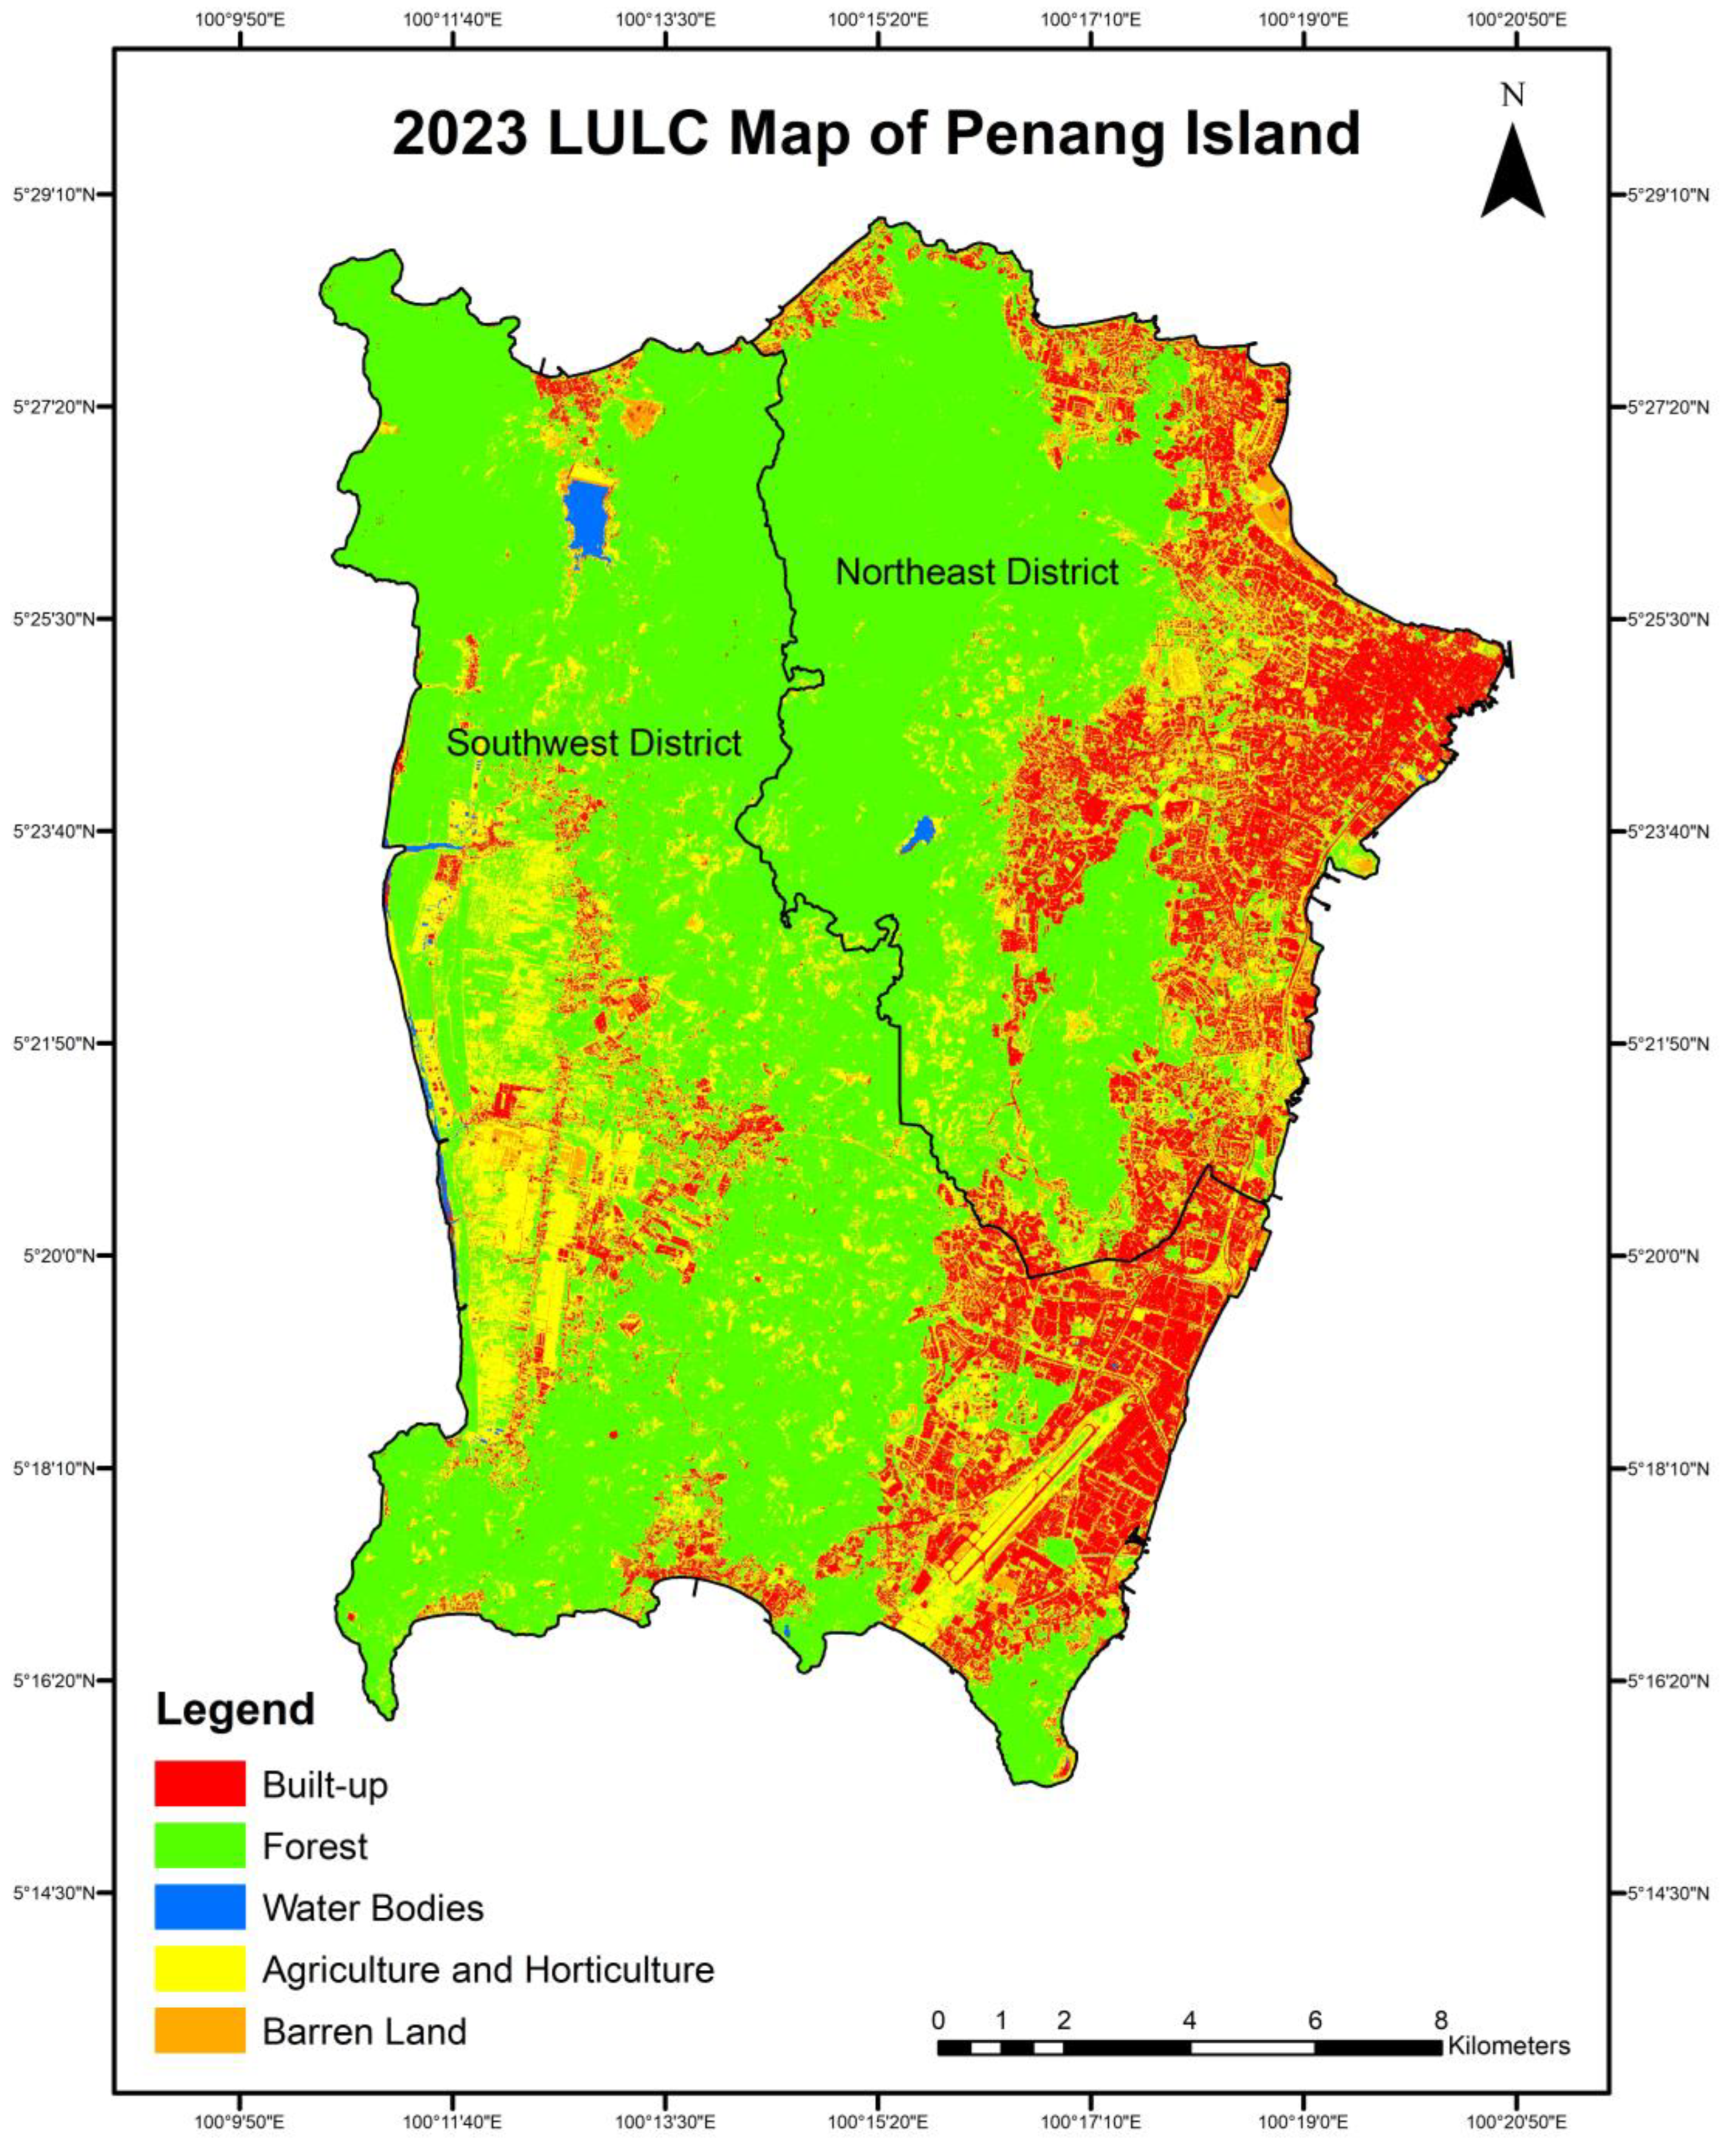
Figure 7.
Overall Change of Built-up Areas.
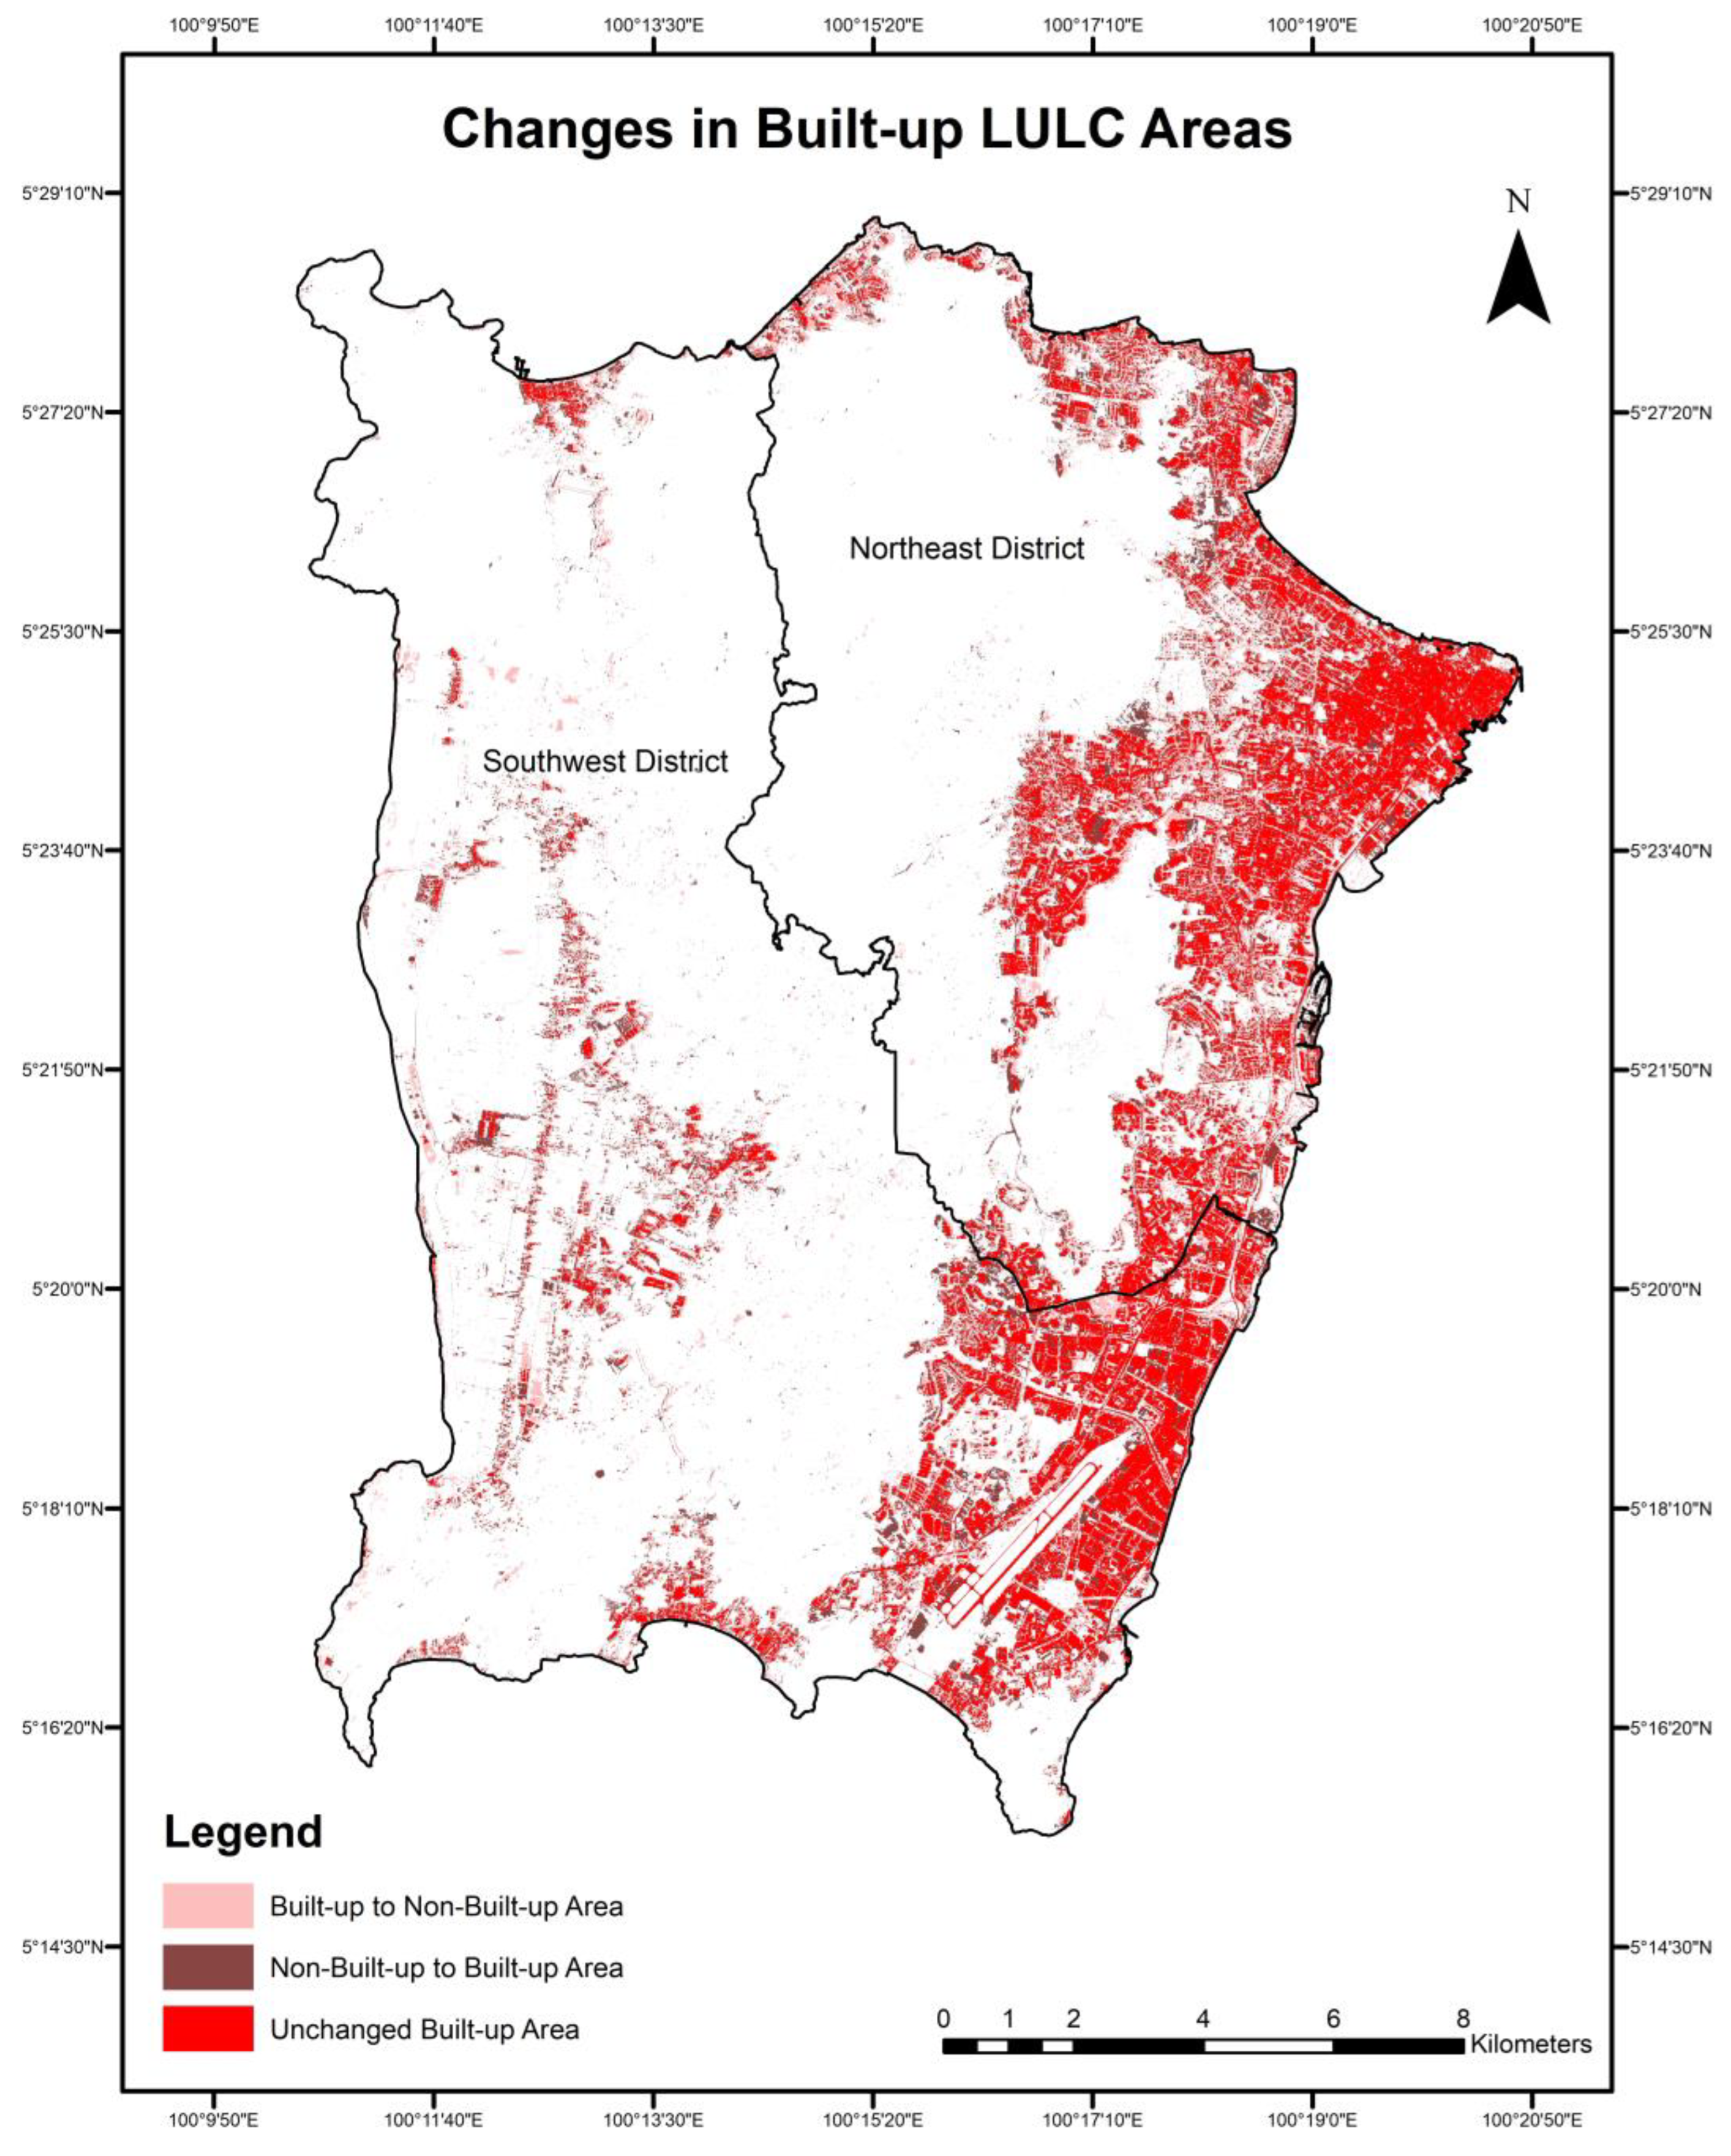
Figure 8.
Overall Change of Forest Areas.
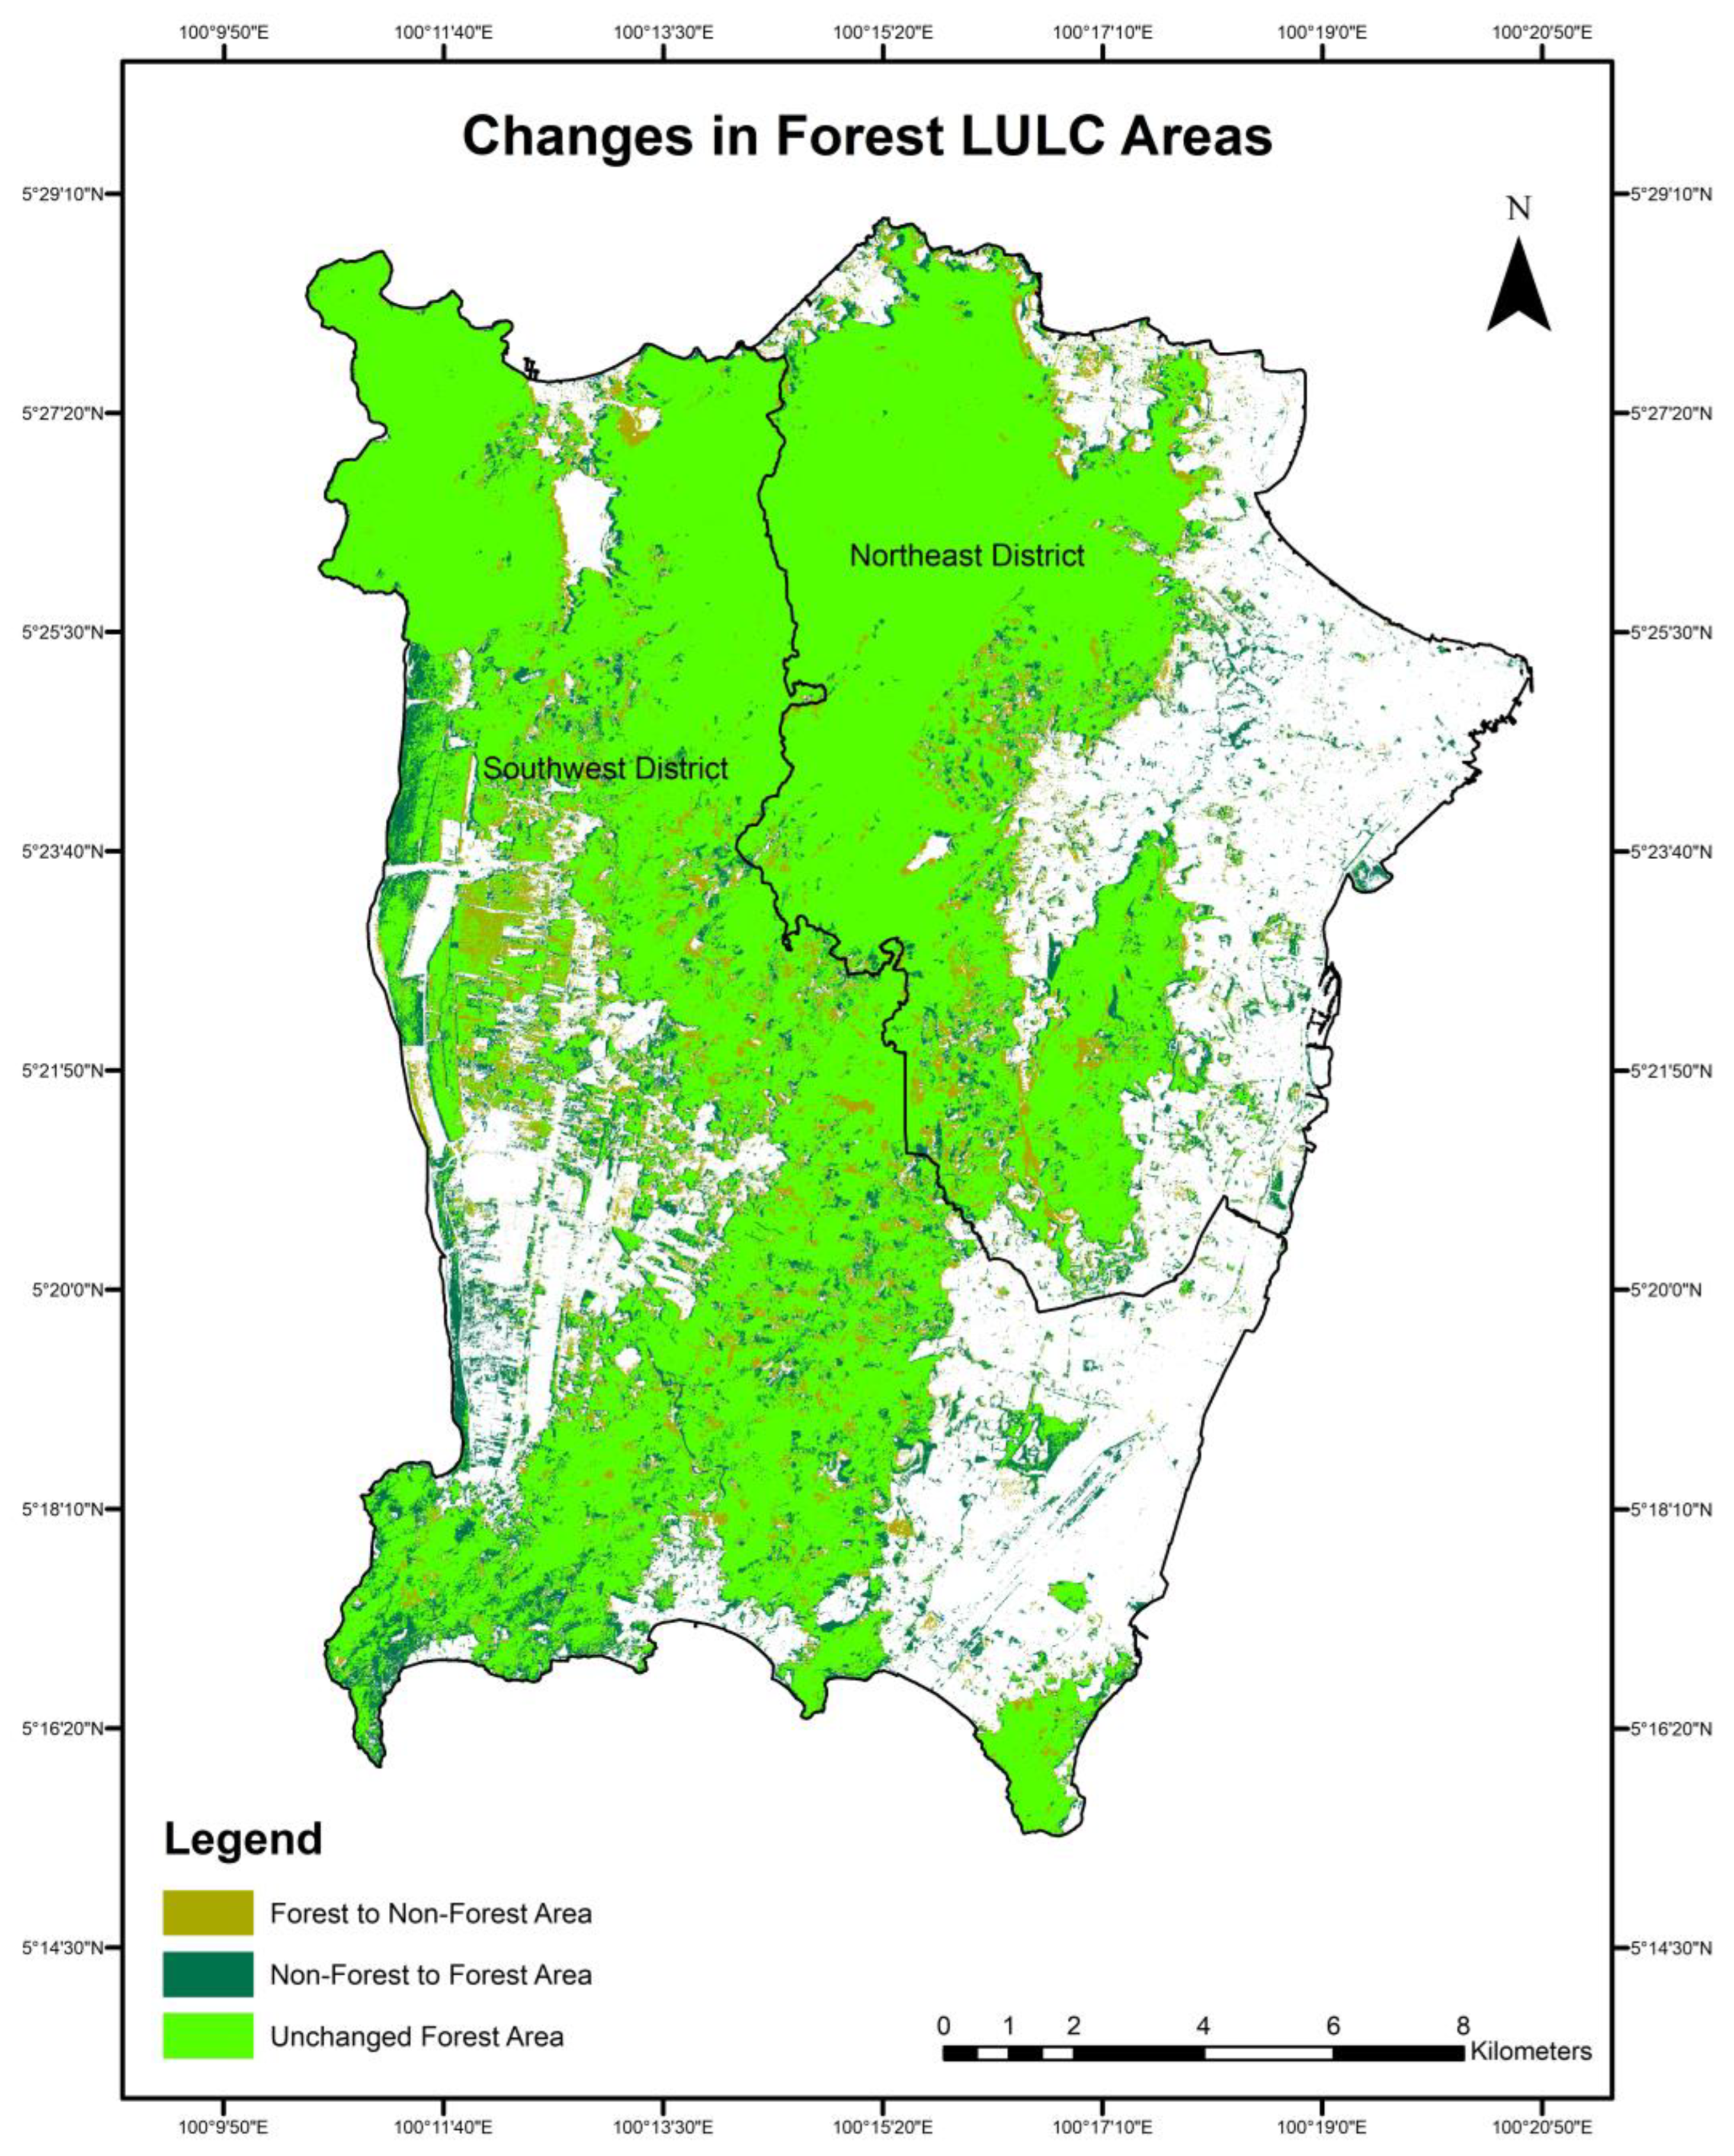
Figure 9.
Overall Change of Water Bodies Areas.
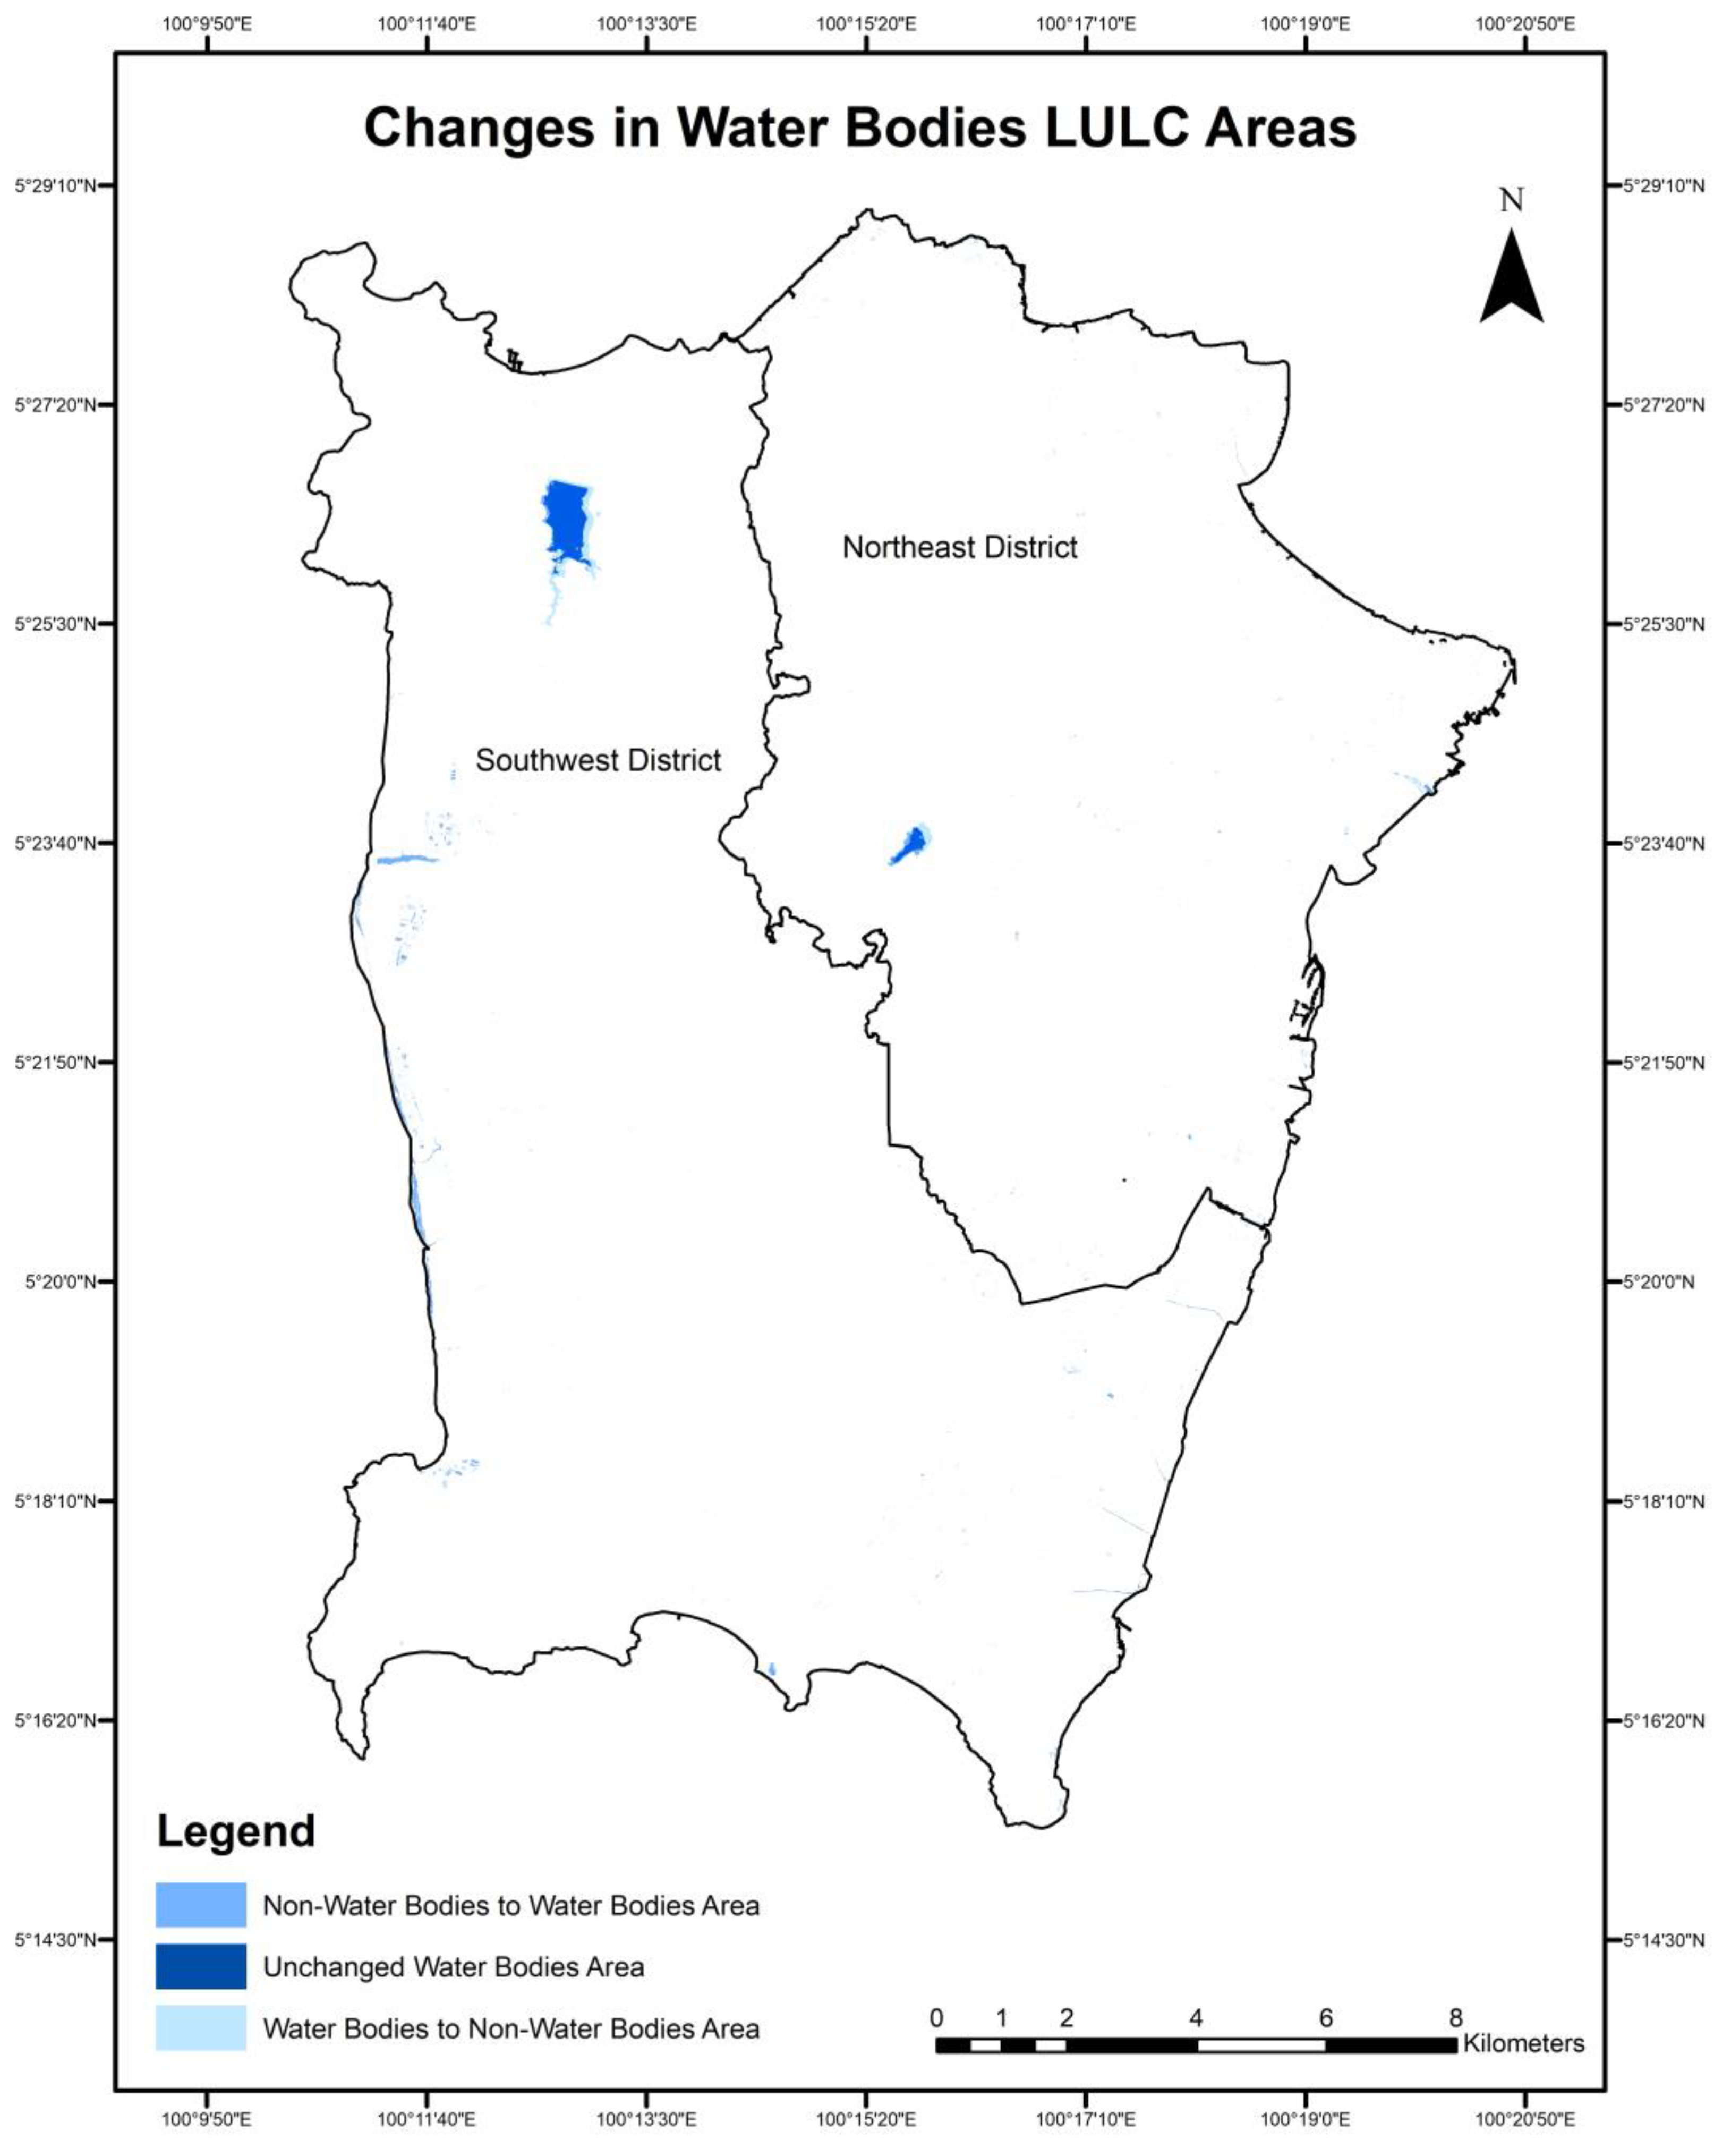
Figure 10.
Overall Change of Agriculture and Horticulture Areas.
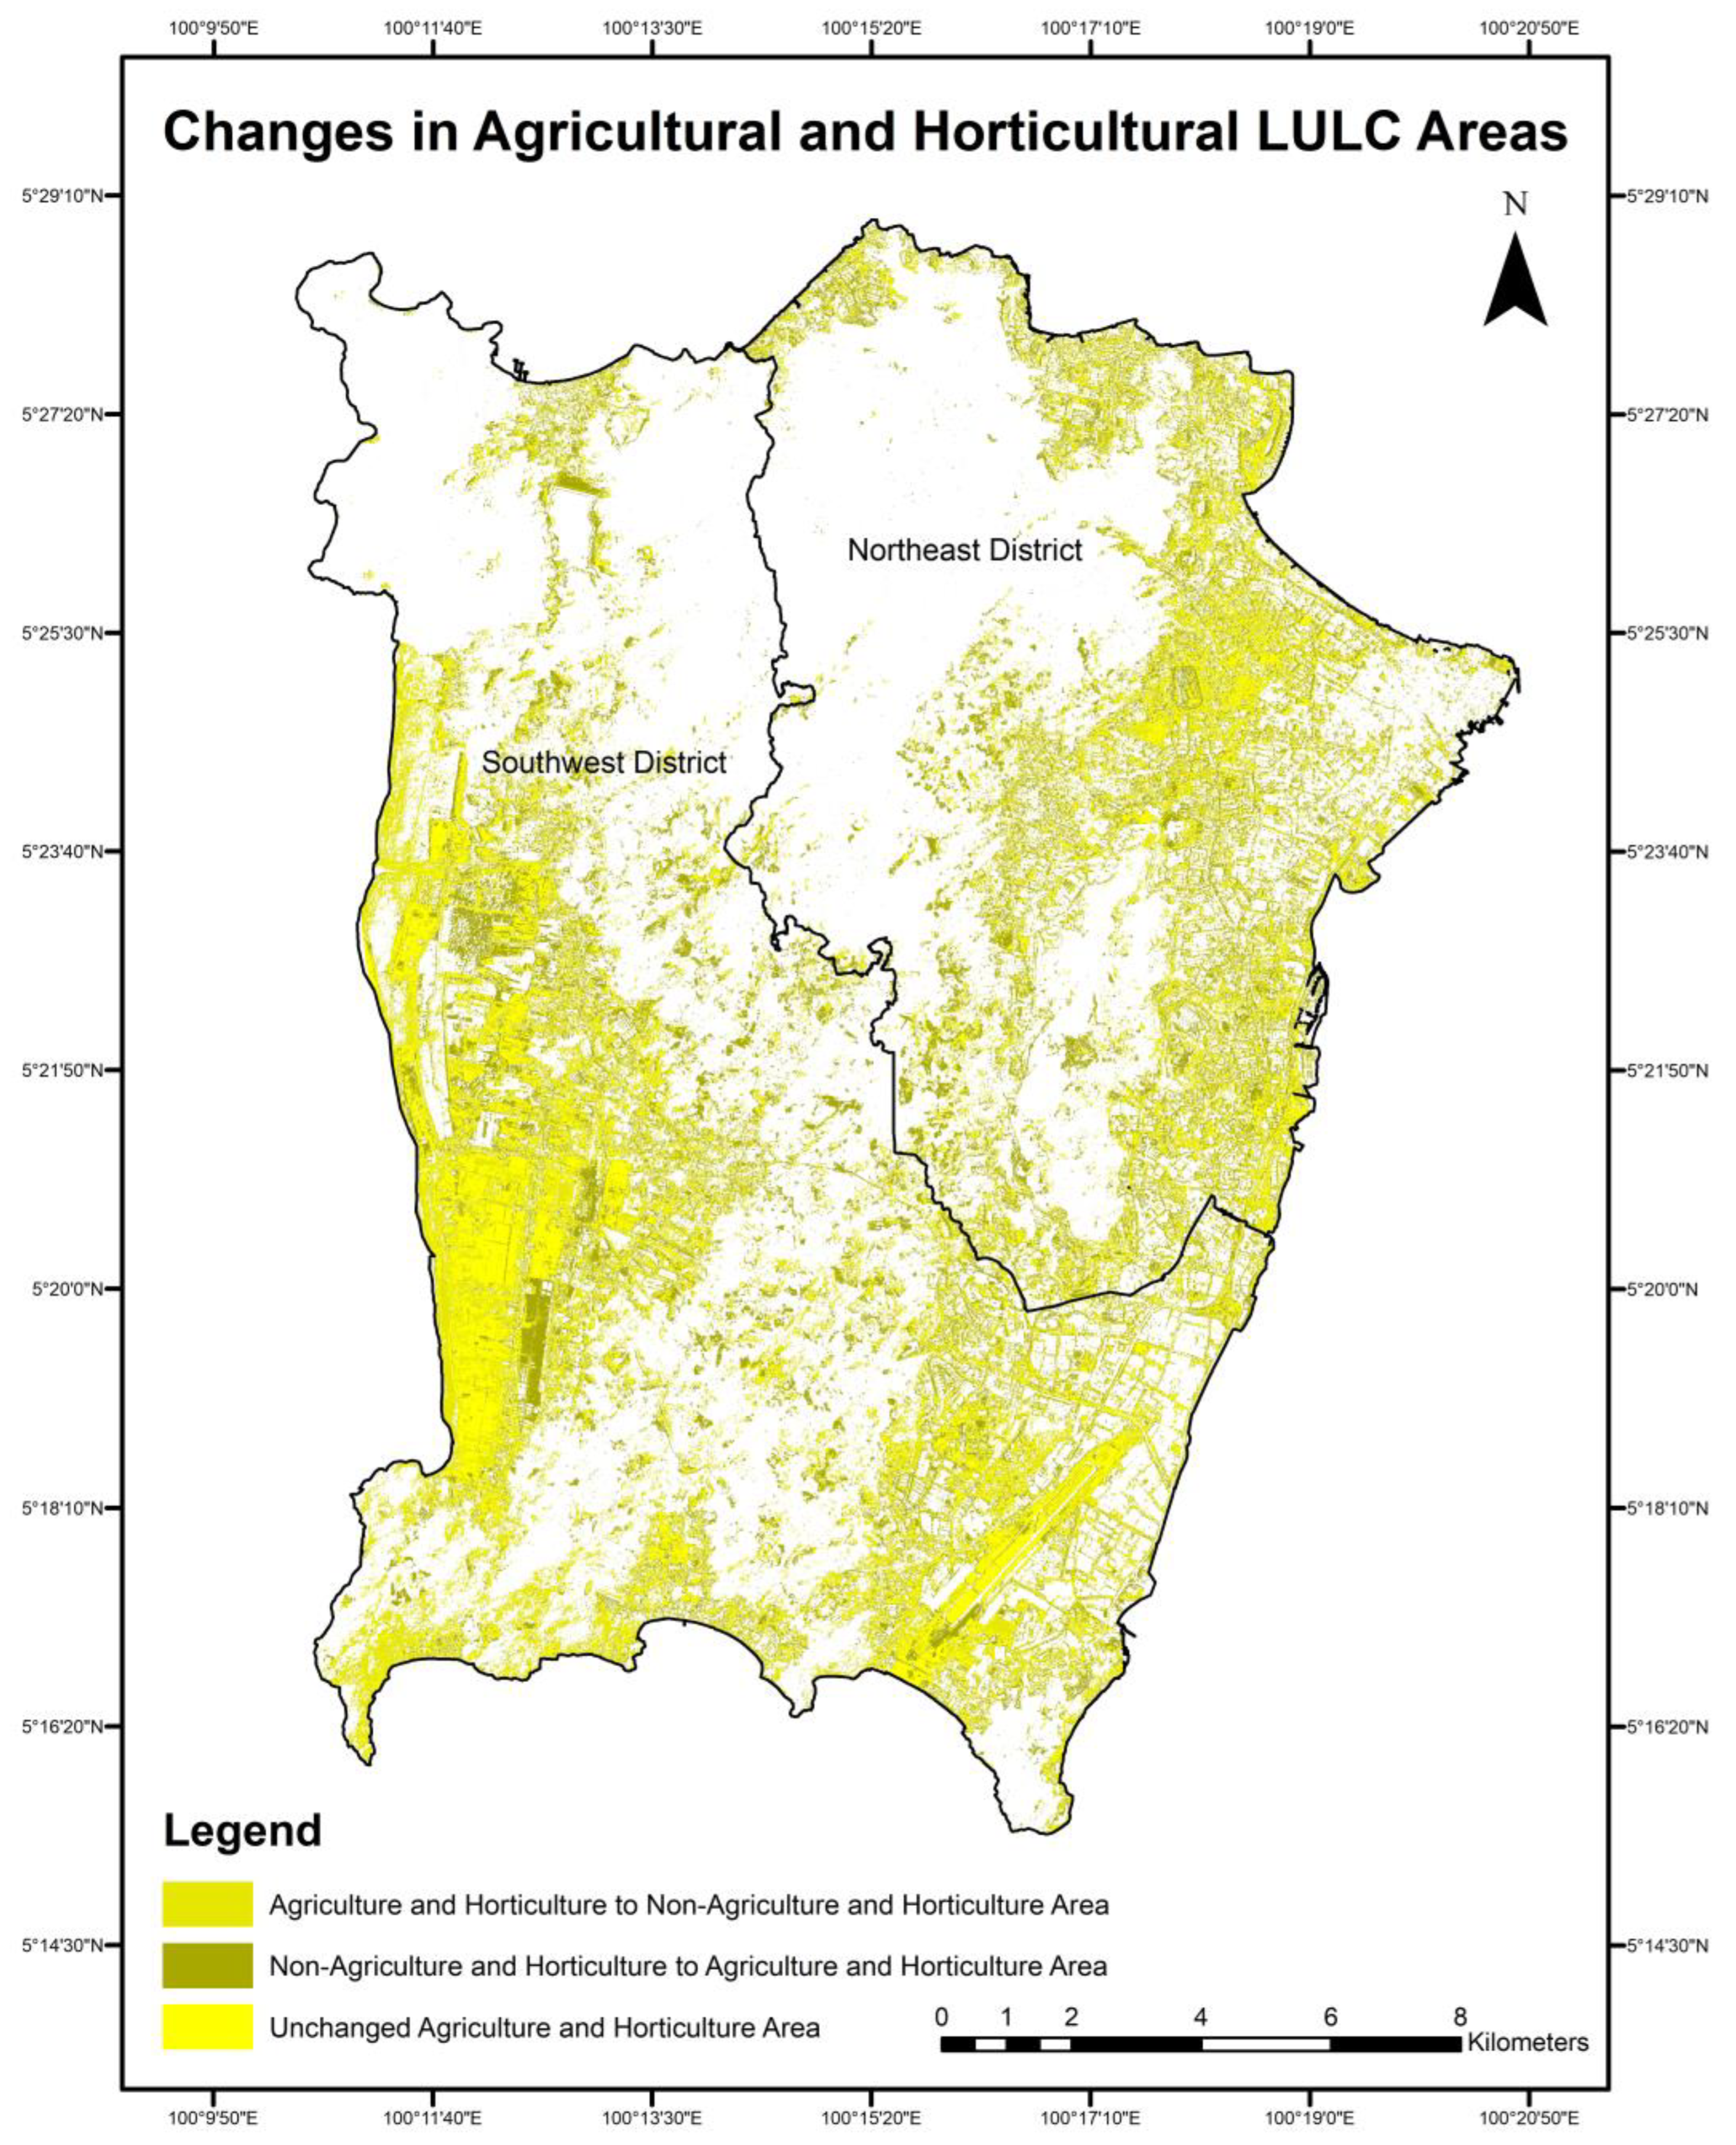
Figure 11.
Overall Change of Barren Land Areas.
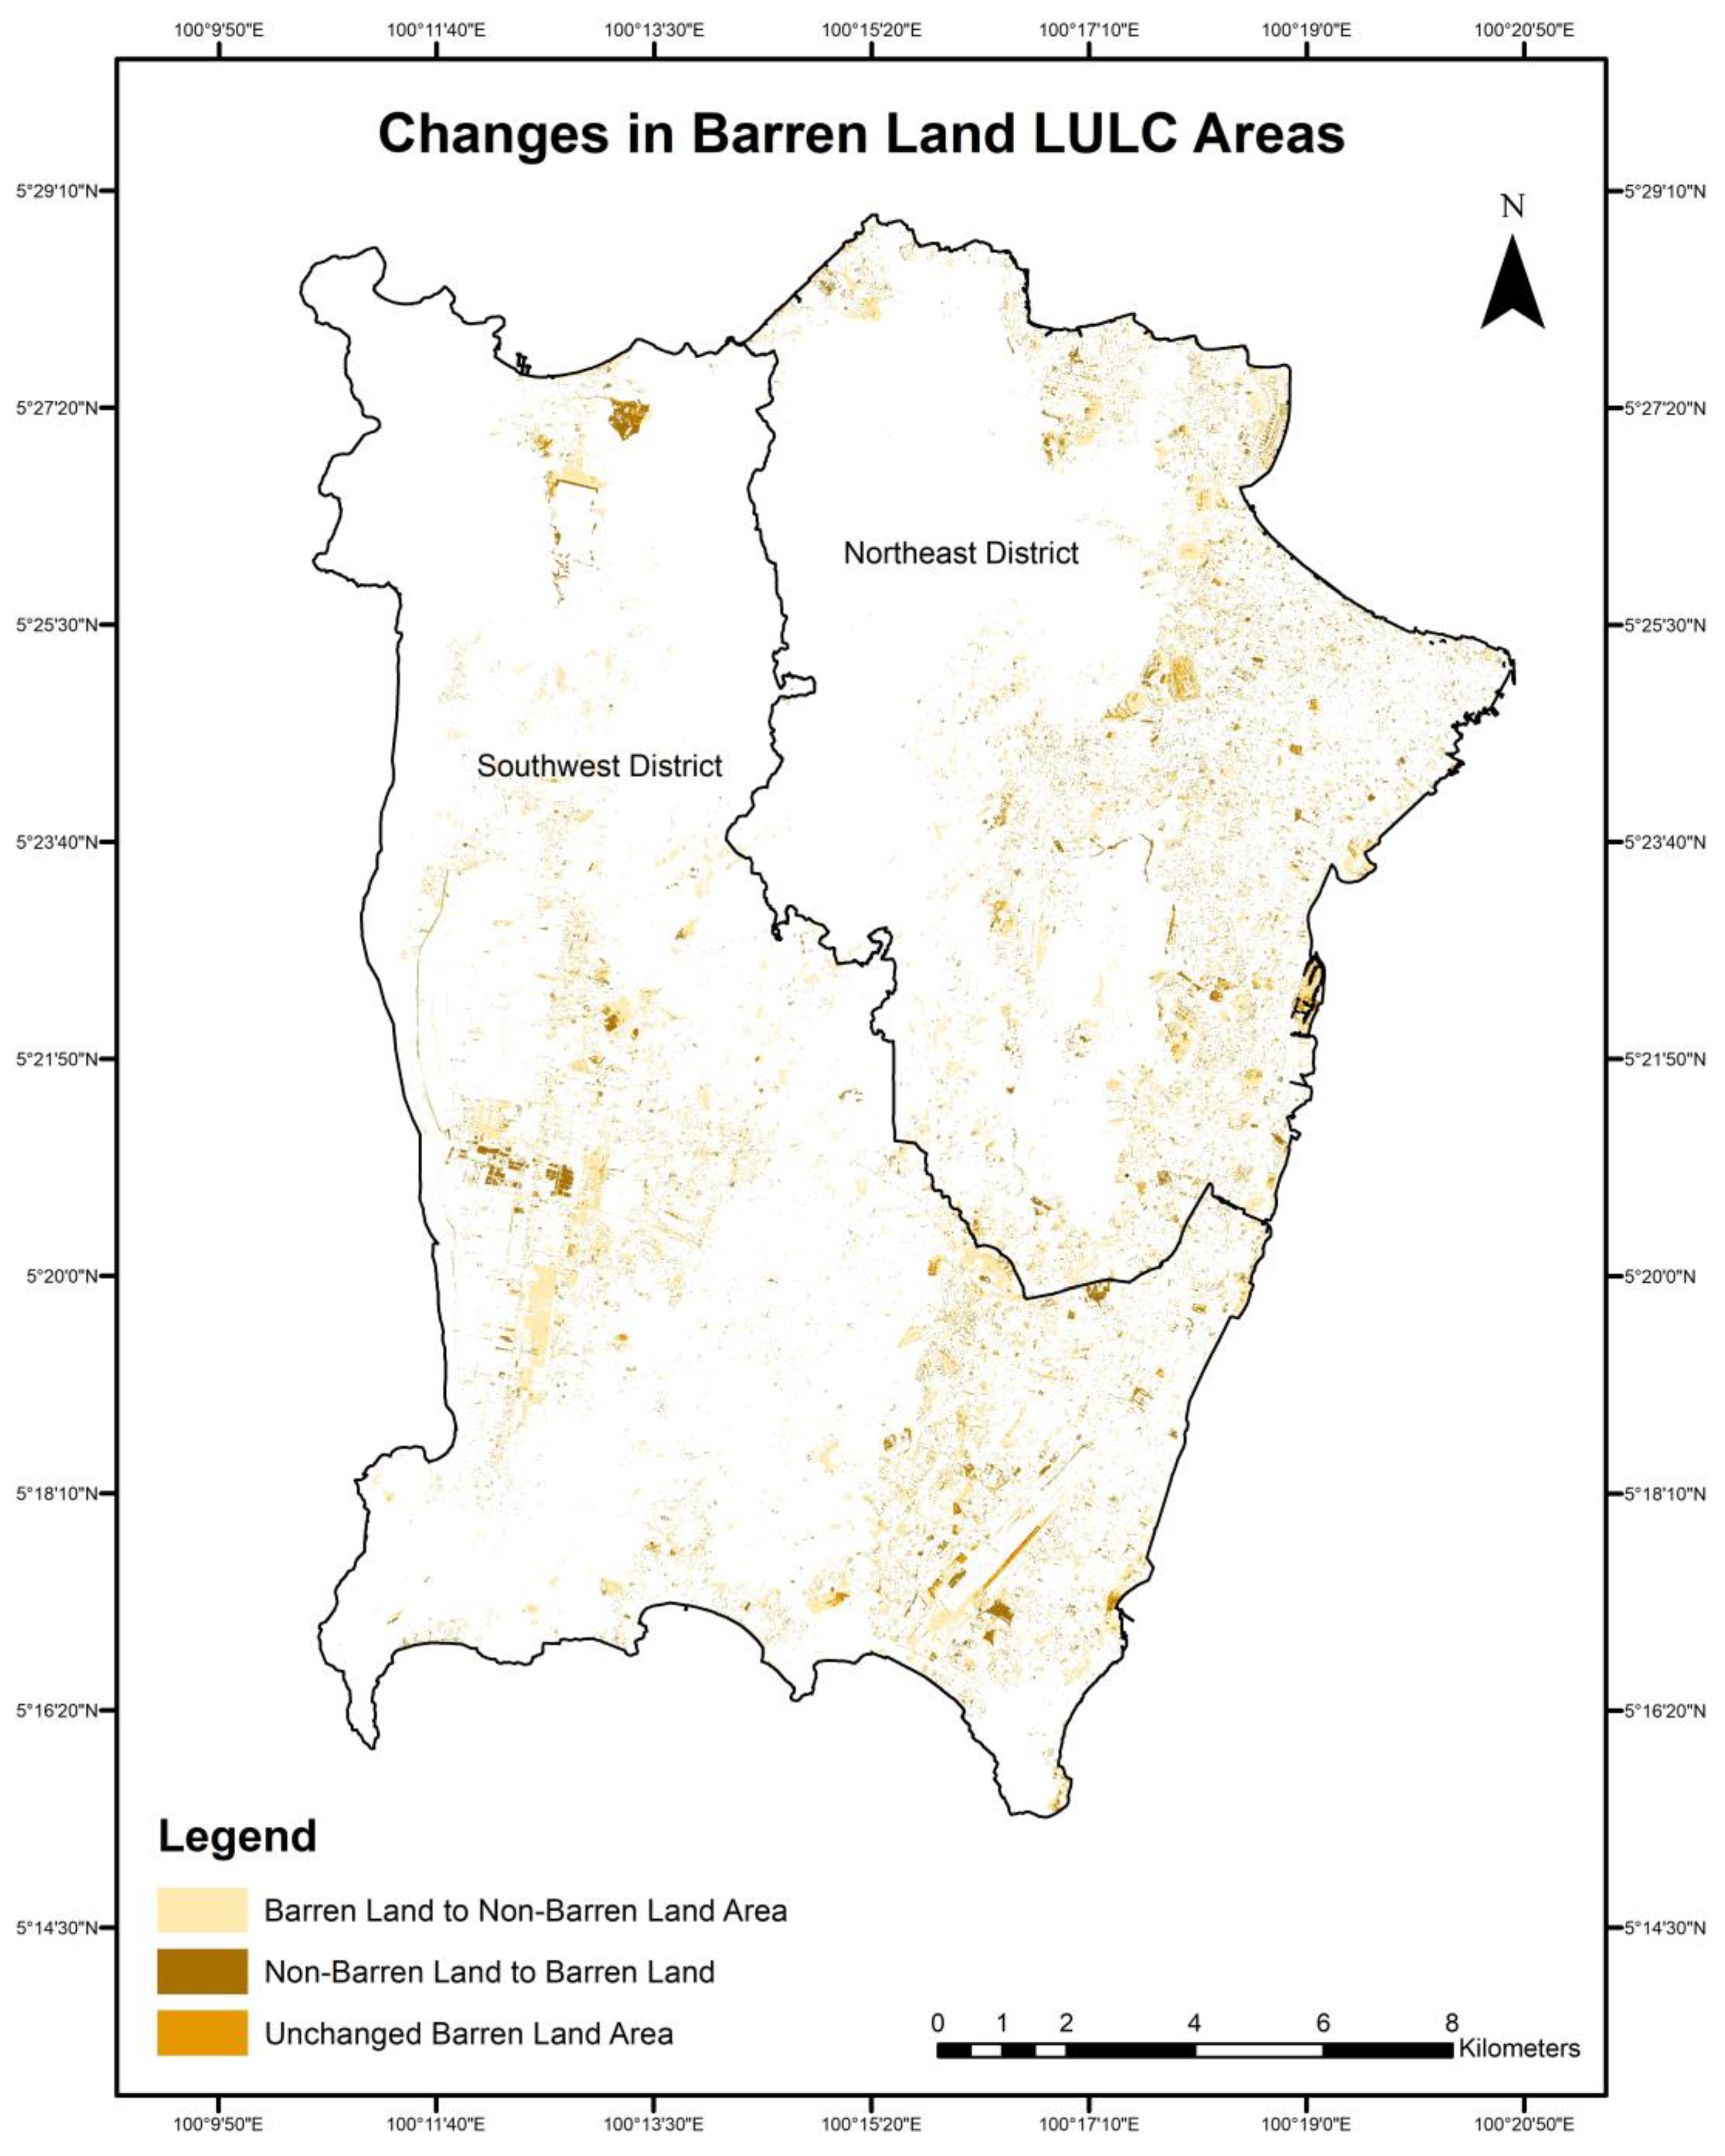
Figure 12.
LULC Changed Area (km2) in Penang Island (2014-2023).
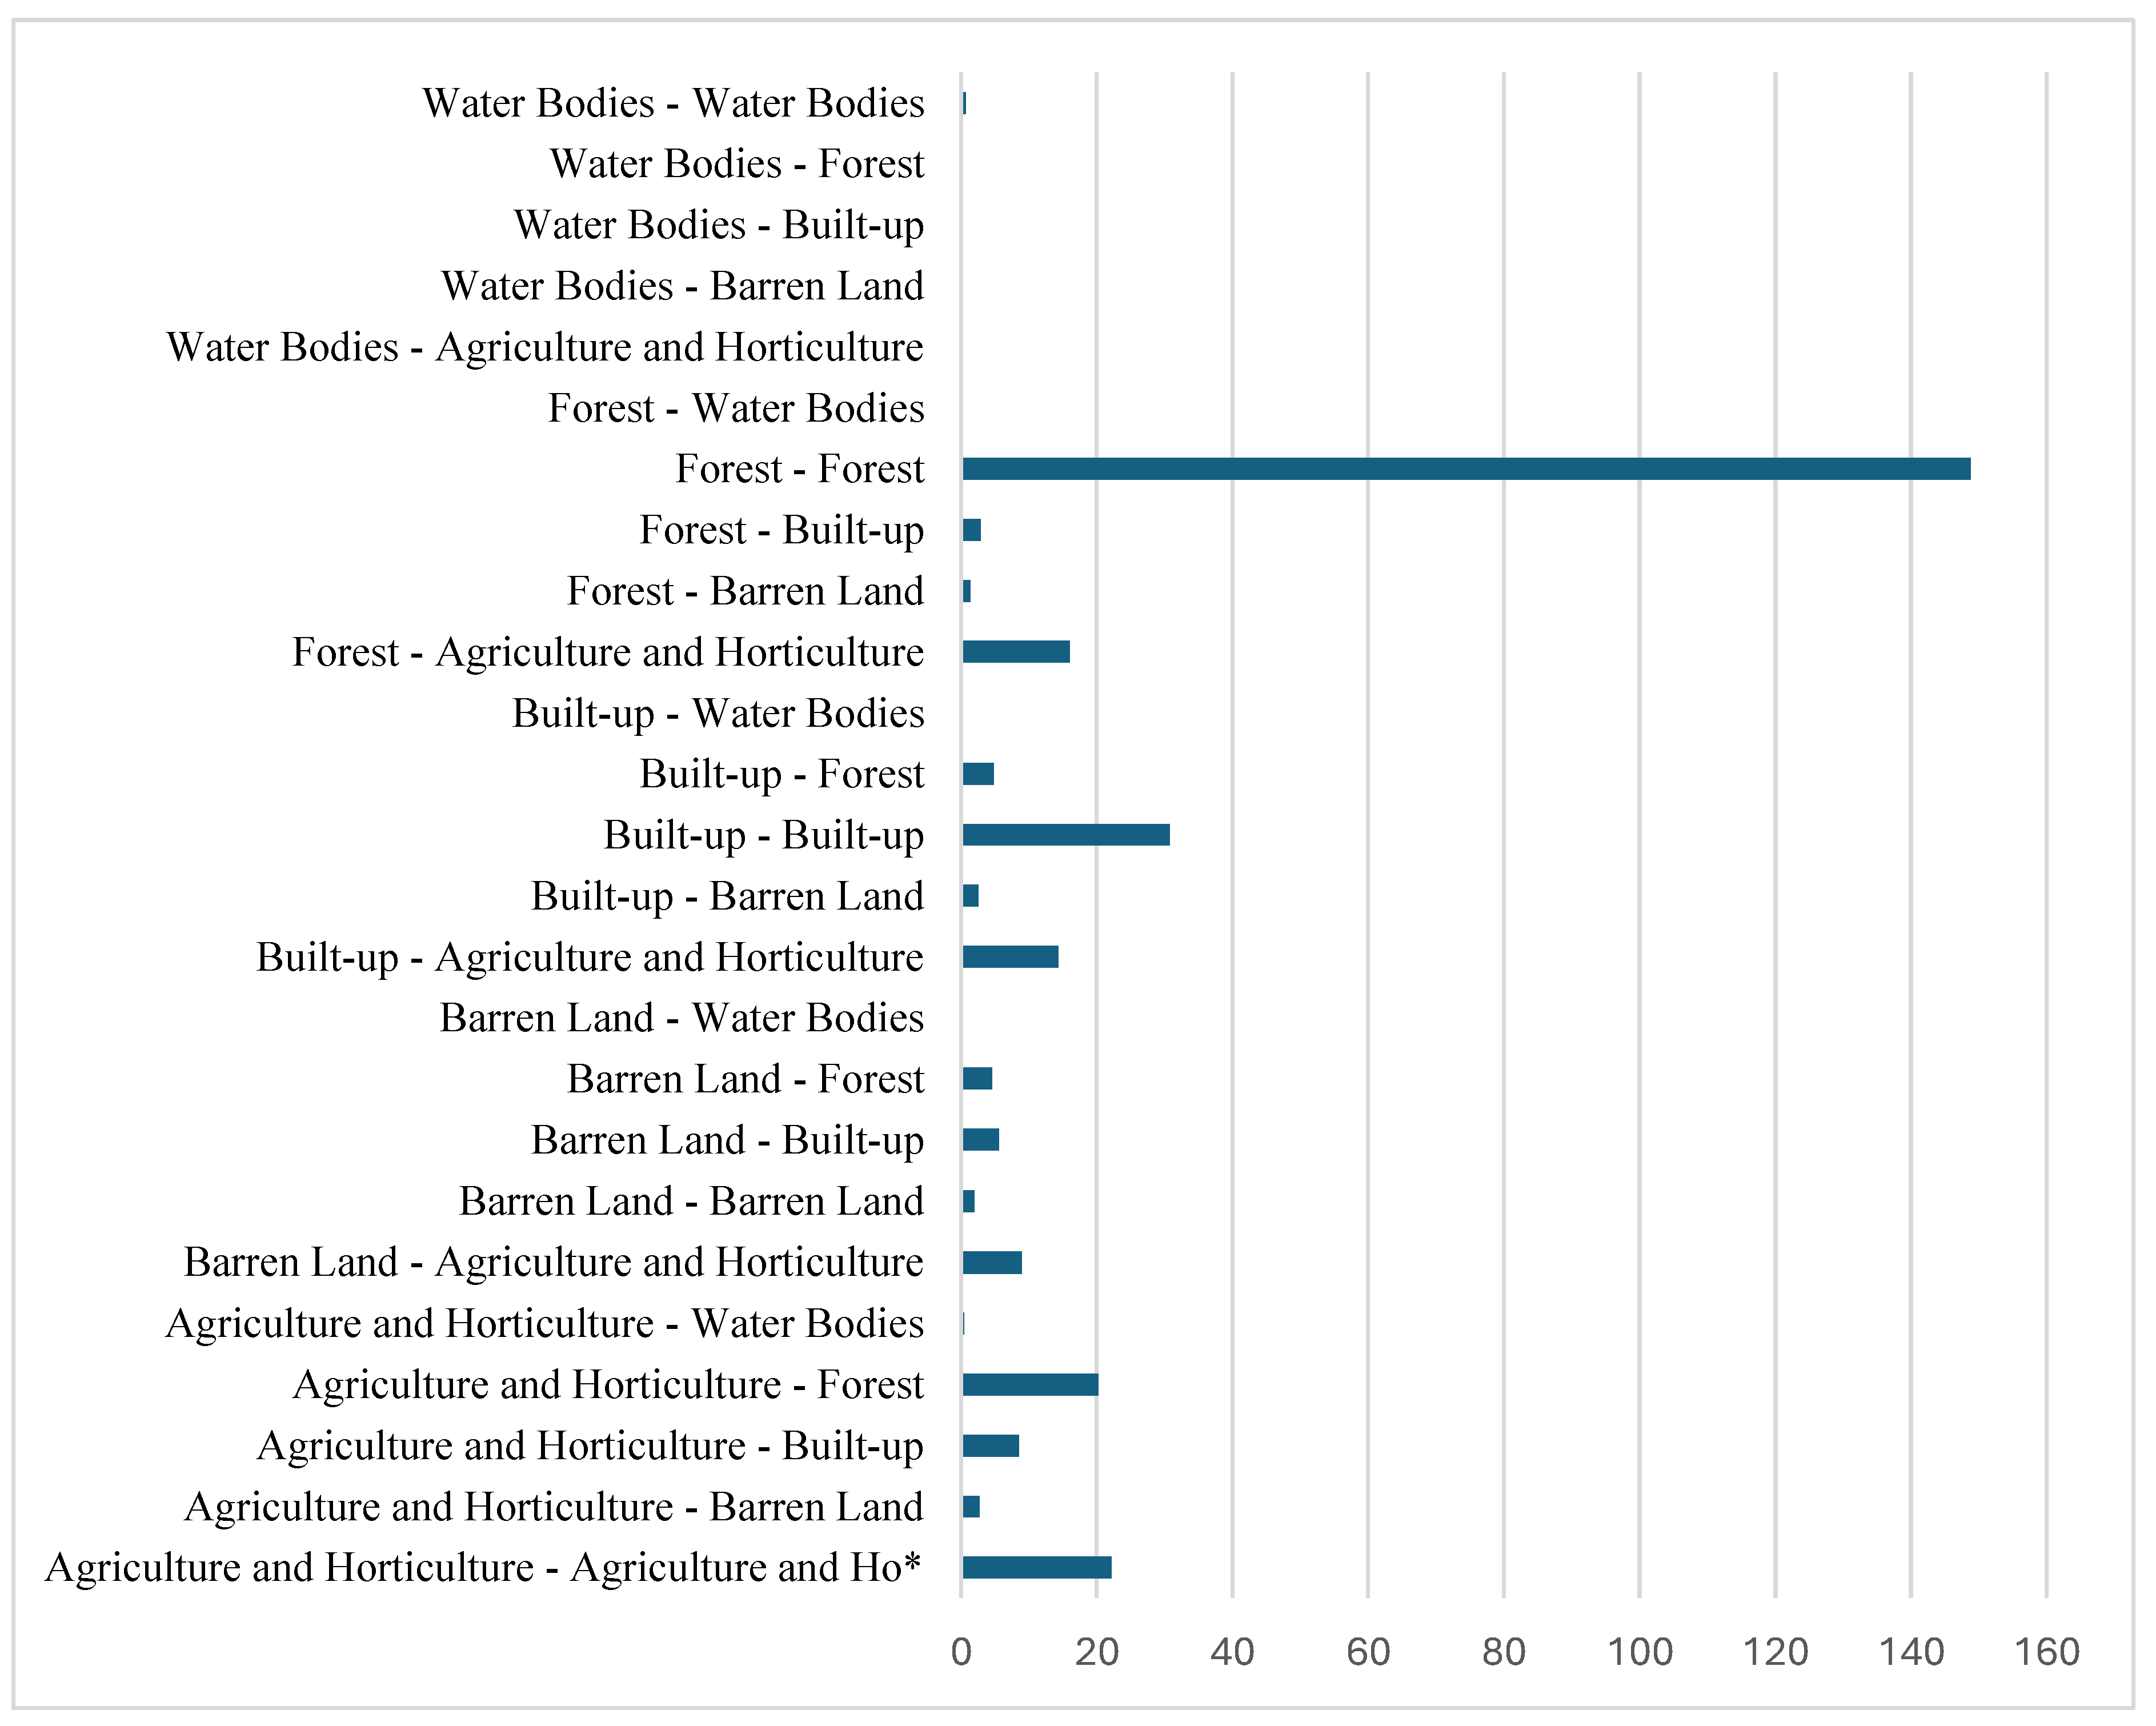

Table 1.
LULC Classification used in the study for Penang Island, Malaysia.
| LULC Type | Description |
|---|---|
| Built-up | Residential, commercial areas, industrial establishments, roads, and other uncategorized surface pavements |
| Forest | Mangrove and all other forest fields |
| Water Bodies | Open water bodies like rivers, streams, lakes, ponds and reservoirs |
| Agriculture and Horticulture |
Orchards and cropland |
| Barren Land | Exposed soils, landfills, and areas of active excavation |
Table 2.
Confusion Matrix for 2014 Land Use and Land Cover (LULC) Classification.
| Class | Built-up | Forest | Water Bodies | Agriculture and Horticulture | Barren Land | Total | User’s Accuracy | Kappa |
|---|---|---|---|---|---|---|---|---|
| Built-up | 82 | 1 | 0 | 3 | 1 | 87 | 0.942 | 0 |
| Forest | 0 | 274 | 0 | 5 | 0 | 279 | 0.982 | 0 |
| Water Bodies | 0 | 1 | 7 | 0 | 1 | 9 | 0.777 | 0 |
| Agriculture and Horticulture | 1 | 23 | 2 | 64 | 0 | 90 | 0.711 | 0 |
| Barren Land | 8 | 0 | 0 | 0 | 27 | 35 | 0.771 | 0 |
| Total | 91 | 299 | 9 | 72 | 29 | 500 | 0 | 0 |
| Producer’s Accuracy | 0.901 | 0.916 | 0.777 | 0.888 | 0.931 | 0 | 0.908 | 0 |
| Kappa | 0 | 0 | 0 | 0 | 0 | 0 | 0 | 0.847 |
Table 3.
Confusion Matrix for 2019 Land Use and Land Cover (LULC) Classification.
| Class | Built-up | Forest | Water Bodies | Agriculture and Horticulture | Barren Land | Total | User’s Accuracy | Kappa |
|---|---|---|---|---|---|---|---|---|
| Built-up | 82 | 0 | 0 | 0 | 5 | 87 | 0.942 | 0 |
| Forest | 1 | 7 | 0 | 0 | 0 | 8 | 0.875 | 0 |
| Water Bodies | 2 | 0 | 304 | 19 | 0 | 325 | 0.935 | 0 |
| Agriculture and Horticulture | 6 | 0 | 7 | 42 | 0 | 55 | 0.763 | 0 |
| Barren Land | 5 | 0 | 0 | 0 | 20 | 25 | 0.8 | 0 |
| Total | 96 | 7 | 311 | 61 | 25 | 500 | 0 | 0 |
| Producer’s Accuracy | 0.854 | 1 | 0.977 | 0.688 | 0.8 | 0 | 0.91 | 0 |
| Kappa | 0 | 0 | 0 | 0 | 0 | 0 | 0 | 0.835 |
Table 4.
Confusion Matrix for 2023 Land Use and Land Cover (LULC) Classification.
| Class | Built-up | Forest | Water Bodies | Agriculture and Horticulture | Barren Land | Total | User’s Accuracy | Kappa |
|---|---|---|---|---|---|---|---|---|
| Built-up | 77 | 0 | 0 | 0 | 1 | 78 | 0.987 | 0 |
| Forest | 1 | 289 | 0 | 6 | 0 | 296 | 0.976 | 0 |
| Water Bodies | 0 | 0 | 9 | 0 | 0 | 9 | 1 | 0 |
| Agriculture and Horticulture | 6 | 9 | 0 | 83 | 3 | 101 | 0.821 | 0 |
| Barren Land | 3 | 0 | 0 | 0 | 13 | 16 | 0.812 | 0 |
| Total | 87 | 298 | 9 | 89 | 17 | 500 | 0 | 0 |
| Producer’s Accuracy | 0.885 | 0.969 | 1 | 0.932 | 0.764 | 0 | 0.942 | 0 |
| Kappa | 0 | 0 | 0 | 0 | 0 | 0 | 0 | 0.900 |
Table 5.
LULC from 2014 until 2023 and Three Phases of Changes in Penang Island.
| LULC Type | 2014 | 2019 | 2023 | Change Over 2014-2019(First Phase) | Change Over 2019-2023(Second Phase) | Change Over 2014-2023(Overall Change) | ||||||
|---|---|---|---|---|---|---|---|---|---|---|---|---|
| km2 | % | km2 | % | km2 | % | km2 | % | km2 | % | km2 | % | |
| Built-up | 52.81575 | 17.68807 | 52.23185 | 17.30155 | 48.28617 | 16.02778 | -0.5839 | -0.38652 | -3.945684 | -1.27377 | -4.529584 | -1.6603 |
| Forest | 169.0714 | 56.62228 | 199.5084 | 66.0862 | 179.3908 | 59.54576 | 30.43699 | 9.463925 | -20.117587 | -6.54044 | 10.319403 | 2.923485 |
| Water Bodies | 1.387488 | 0.464672 | 1.365743 | 0.452396 | 1.642832 | 0.54531 | -0.021745 | -0.01228 | 0.277089 | 0.092914 | 0.255344 | 0.080638 |
| Agriculture and Horticulture | 54.20424 | 18.15308 | 33.52118 | 11.10373 | 62.66777 | 20.80151 | -20.683066 | -7.04936 | 29.146596 | 9.697782 | 8.46353 | 2.648427 |
| Barren Land | 21.11634 | 7.071896 | 15.264 | 5.056126 | 9.277889 | 3.079639 | -5.852347 | -2.01577 | -5.986108 | -1.97649 | -11.838455 | -3.99226 |
Table 6.
2014-2023 LULC Transition Matrix.
| Sum of Area Change (KM2) | 2023 LULC | ||||||
|---|---|---|---|---|---|---|---|
| Agriculture and Horticulture | Barren Land | Built-up | Forest | Water Bodies | Grand Total | ||
| 2014 LULC | Agriculture and Horticulture | 22.123 | 2.719 | 8.536 | 20.257 | 0.3913 | 54.028 |
| Barren Land | 8.934 | 1.911 | 5.595 | 4.591 | 0.050 | 21.084 | |
| Built-up | 14.363 | 2.556 | 30.735 | 4.808 | 0.220 | 52.684 | |
| Forest | 15.968 | 1.359 | 2.889 | 148.757 | 0.087 | 169.062 | |
| Water Bodies | 0.240 | 0.0539 | 0.095 | 0.2425 | 0.714 | 1.347 | |
| Grand Total | 61.631 | 8.601 | 47.852 | 178.657 | 1.464 | 298.206 | |
Disclaimer/Publisher’s Note: The statements, opinions and data contained in all publications are solely those of the individual author(s) and contributor(s) and not of MDPI and/or the editor(s). MDPI and/or the editor(s) disclaim responsibility for any injury to people or property resulting from any ideas, methods, instructions or products referred to in the content. |
© 2025 by the authors. Licensee MDPI, Basel, Switzerland. This article is an open access article distributed under the terms and conditions of the Creative Commons Attribution (CC BY) license (http://creativecommons.org/licenses/by/4.0/).
Copyright: This open access article is published under a Creative Commons CC BY 4.0 license, which permit the free download, distribution, and reuse, provided that the author and preprint are cited in any reuse.


