Submitted:
23 July 2025
Posted:
06 August 2025
Read the latest preprint version here
Abstract
Real-time 2D imagery super-resolution (SR) in UAV remote sensing encounters significant speed and resource-consuming bottlenecks during large-scale processing. To overcome this, we propose Semantic Injection State Modeling for Super-Resolution (SIMSR), an ultra-lightweight architecture that integrates land-cover semantics into a linear state-space model. This enables high-fidelity, real-time image enhancement. SIMSR mitigates state forgetting inherent in linear processing by linking hierarchical features to persistent semantic prototypes. The model achieves state-of-the-art performance, including a PSNR of 32.9+ for 4x SR on RSSCN7 agricultural grassland imagery. Furthermore, geographically-chunked (tile-based) parallel processing simultaneously eliminates computational redundancies, which yields a 10.85x inference speedup, a 54% memory reduction, and an 8.74x faster training time. This breakthrough facilitates practical real-time SR deployment on UAV platforms, demonstrating strong efficacy for ecological monitoring applications.
Keywords:
remote sensing
; unmanned aerial vehicle
; image super-resolution
; state-space model
1. Introduction
Remote sensing imagery captured by Unmanned Aerial Vehicles (UAVs) [1] enables critical capabilities across urban planning [2,3], precision agriculture [4,5], and environmental monitoring [6,7], with distinct advantages for UAV-based applications including centimeter-scale spatial resolution from low-altitude deployments, oblique imaging for multiview 3D reconstruction [8], and rapid-response agility in disaster assessment scenarios [9]. These characteristics uniquely position UAVs to discern complex land surface features essential for precision applications like vegetation health mapping and green energy infrastructure inspection. However, widespread UAV adoption confronts practical barriers [10] including exorbitant sensor costs and computational constraints on embedded platforms, where limited memory and processing capabilities restrict the deployment of advanced models. Super-resolution (SR) techniques thus emerge as vital solutions to enhance spatial detail without physical hardware upgrades [11,12,13,14].
Remote sensing imagery presents distinctive hierarchical structures spanning macro-scale patterns (e.g., urban layouts and forest canopies) to micro-features (e.g., vegetation textures and isolated water bodies), posing substantial modeling challenges. Convolutional Neural Network (CNN)-based approaches with residual blocks [16] suffer from limited receptive fields [17], manifesting as edge blurring in urban boundary reconstruction. Transformer-based methods [18] incur computational complexity [19], creating prohibitive bottlenecks for gigapixel-scale UAV imagery while maintaining only local round-shaped receptive fields. State-Space Model (SSM)-based architectures like Mamba [20] achieve linear complexity () [21,22] but reveal fundamental limitations arising from their state-transition mechanics: (1) Sequential state updates induce catastrophic forgetting of earlier context, where latent representations progressively overwrite prior information during image traversal; (2) Cross-shaped receptive fields (Figure 1) inadequately model diagonal spatial relationships prevalent in natural topography; (3) Static state dynamics cannot adapt processing intensity to heterogeneous regions, causing overfitting on dominant land covers while undersampling rare micro-features. These limitations manifest operationally as artificial texture generation in agricultural parcels, boundary inaccuracies along riparian zones, and spectral distortions in seasonal vegetation transitions.
Additionally, computational overhead remains prohibitive for UAV edge deployment. SSM-based methods [23] require L sequential steps without parallelization during large-area analysis, while irregular memory access patterns misalign with geographical feature geometries. These inefficiencies yield <30% hardware utilization on parallel architectures, increasing UAV operational costs and delaying critical applications like wildfire progression mapping or flood extent monitoring.
To resolve these challenges, we present Semantic Injection State Modeling for Super-Resolution (SIMSR), an architecture with two foundational innovations:
1. Semantic-Injected State Modeling overcomes Mamba’s forgetting dilemma through hierarchical feature anchoring. Rather than relying solely on transient latent states, we perform semantic partitioning to cluster pixels into land-cover categories and inject persistent one-hot vector prompts that encode categorical membership throughout state transitions. This preserves long-range dependencies by maintaining feature stability across distant regions sharing similar semantics (e.g., connecting fragmented wetland pixels across disjoint image segments), while the explicit segmentation prevents hallucinated details in texture synthesis. Spatial rearrangement reassembles adjacent pixels from identical semantic clusters, reinforcing local context homogeneity crucial for boundary refinement.
2. Geographically-Chunked Processing transforms sequential bottlenecks into parallel workflows. By segmenting inputs into logically contiguous chunks corresponding to watersheds or urban blocks, our implementation enables simultaneous processing of multiple geographical units using optimized Flash Linear Attention [24,25]. This achieves complexity (C=chunk size) while maintaining memory access patterns aligned with landscape continuity, improving cache utilization by >60% over traditional tiling strategies. The chunking strategy preserves state-space advantages for dependency modeling within ecologically coherent regions while eliminating inter-region blocking artifacts.
Comprehensive validation demonstrates SIMSR’s advantages: 20%–8.74× faster training, 35%–10.85× faster inference, more than higher cache hit rate and 54% memory burden decrease versus state-of-the-art methods while achieving the state-of-the-art metrics as over 32.9 PSNR metric in validation under aGrass class of RSSCN7, and the border effective receptive fields (Figure 1), particularly enhancing extremely efficient UAV-relevant metrics on the RSSRD-SE dataset. This enables deployable high-precision SR for ecological monitoring on resource-constrained platforms.
2. Related Work
2.1. Conventional and Convolution-based Techniques
Traditional interpolation methods (e.g., bicubic) lack semantic understanding despite computational efficiency [26]. Deep learning-based approaches have since dominated, with SRCNN [27] pioneering the use of convolutional layers for local patch extraction and HR reconstruction. VDSR [28] addresses this via deeper residual networks, expanding receptive fields to capture hierarchical features—pixel-level edges in early layers and regional semantics in deeper ones.
However, CNNs grapple with global-local modeling trade-offs and computational bottlenecks. CNNs’ local receptive fields hinder long-range correlation capture. These limitations drive the attention mechanisms for effective global-local collaboration in remote sensing super-resolution.
2.2. Attention-based Techniques
This issue has been significantly addressed by Attention mechanisms, which enables models to effectively capture long-range dependencies and focus on critical image regions. For instance, SwinIR [17] uses hierarchical features and shift-window self-attention, SwinFIR [29] improves global integration with Fast Fourier Convolution (FFC), and HAT [30,31] optimizes hybrid attention. They have demonstrated exceptional performance across various image restoration[32,33,34] tasks, including super-resolution, denoising[35,36,37], and JPEG artifact reduction.
Despite the significant advancements brought by attention mechanisms in SISR[38], a notable limitation persists: the computational complexity of self-attention operations scales quadratically with the input size [19]. This quadratic complexity arises because the attention mechanism computes pairwise interactions between all elements in the input sequence, leading to substantial computational and memory demands, especially for HR images.
2.3. State-Space Based Techniques
To address the computational challenges of attention-based SISR, several models have integrated innovative mechanisms to improve efficiency. The MambaIR model [22,39,40,41,42,43] introduces a Selective State Space 2D (SS2D) mechanism, which employs SSM[44] with selective scanning strategies to capture long-range dependencies while maintaining linear computational complexity relative to the input size. This design effectively reduces the computational burden of traditional quadratic attention mechanisms, making MambaIR scalable and efficient for HR image restoration tasks. The SS2D mechanism allows MambaIR to model intricate image details without incurring the prohibitive costs typical of self-attention methods, thus balancing performance and efficiency for large-scale image processing. Despite the advancements introduced by MambaIR and the SS2D mechanism, challenges remain in terms of prolonged training times, unstable performance metrics, rapid convergence, and suboptimal feature extraction capabilities. These challenges will be better solved in this proposed work.
3. Semantic-Injected State Modeling
The Semantic-Injected State Modeling (SISM) framework establishes a novel paradigm for capturing global dependencies in high-resolution imagery by integrating hierarchical semantic decomposition with adaptive state transitions. This approach overcomes the limitations of sequential state overwriting through persistent feature anchoring to categorical prototypes while maintaining linear computational complexity. The mathematical foundation combines multi-directional scanning with chunk-wise parallelization to achieve spatially-aware adaptation.
3.1. Semantic Decomposition and Prototype Anchoring
Given an input tensor , semantic decomposition generates K categorical masks via a lightweight segmentation head :
where indicates pixel belongs to category k. Category-specific prototype vectors are computed via masked pooling:
with denoting a shallow convolutional feature extractor. These prototypes anchor state transitions through persistent semantic conditioning. Finally, the semantic label is obtained with operation to the vector .
3.2. 2D State Modeling Module
Standard state-space modeling captures information through sequential causal processing, rendering it effective for 1D signals but fundamentally limited for noncausal image data. This limitation arises from unidirectional context aggregation that neglects critical spatial dependencies across four geometric orientations: horizontal (forward/backward) and vertical (downward/upward). To overcome this constraint, we integrate the 2D scanning methodology [22] with State Modeling principles, proposing a novel 2D State Modeling mechanism. This transformation enables comprehensive modeling of spatial-semantic relationships in remote sensing imagery, as visualized in Figure 2.
The core innovation resides in decomposing 2D image features into four directional 1D sequences through geometric transformations. Each sequence undergoes independent State Modeling governed by discrete state-space equations:
For each scanning direction , we maintain direction-specific state matrices updated through linear state transitions:
where denotes the t-th token in scan path , with learnable parameters (state transition), (input projection), (output projection), and (skip connection). The scan paths implement geometric transformations: , , , , where vectorizes matrices in path order.
After quad-directional processing, we restore 2D structure through inverse transformations and fuse directional states via parameterized attention gating:
Here denotes learnable convolution kernels generating spatial attention maps , is the sigmoid activation, * indicates convolution, and ‖ denotes channel concatenation. The Hadamard product ⊙ enables feature-state interaction:
where projects states to feature dimensions via convolution. This operation facilitates nonlinear interaction between learned states and input features, capturing complex spatial relationships while preserving high-frequency details through residual connections:
The scaling factor stabilizes gradient propagation during training. Collectively, this formulation overcomes the cross-shaped receptive field limitation in conventional SSMs by establishing dense global interactions, while maintaining complexity through linear state transitions. Experimental validation in Section 5 confirms superior performance on remote sensing imagery where diagonal features (e.g., watershed boundaries, agricultural contours) dominate.
3.3. Semantic Injection State Modeling Block
As shown in Figure 3 and Figure 4, the Semantic Injection State Modeling (SISM) block begins by extracting semantic labels for each image block through a segmentation head, then reorganizes these blocks to cluster regions with identical labels spatially (in Figure 4). This semantically reconstructed image undergoes 2D State Modeling to capture global dependencies while preserving categorical coherence, after which the processed blocks are restored to their original spatial positions to maintain structural integrity. This approach ensures semantic-aware feature aggregation without disrupting the image’s topological layout.
3.4. Geographically-Chunked Parallel Processing
To overcome sequential bottlenecks, images are partitioned into N contiguous chunks aligned with semantic boundaries. Each chunk processes states independently via optimized linear attention:
where contains prototype-aligned semantic prompts. Chunk-to-chunk state propagation uses reparameterized gradients:
with and derived from the UT transform:
This achieves complexity per chunk while maintaining global context propagation.
The chunk-wise approach reduces sequential operations from to with . For typical , complexity becomes , offering 3.2× L2 cache hit rate improvement over recurrent formulations. The semantic-aware caching further reduces memory access by 45% for geographically uniform regions.
4. Methodology
Building on the innovations outlined in the Introduction, we present the Delta State Evolution for Super-Resolution (SIMSR) framework, which addresses the three core challenges of remote sensing image super-resolution: ineffective feature fusion, computational inefficiency, and suboptimal knowledge integration. The architecture fundamentally rethinks feature extraction through Test-Time Training while introducing computational optimizations specifically designed for geospatial data characteristics.
4.1. Model Architecture
The proposed remote sensing image super-resolution framework, SIMSR, follows a three-stage processing pipeline inspired by architectures like EDSR [16], as illustrated in Figure 5. The mathematical formulation of this process begins with input normalization and progresses through feature transformation to final reconstruction.
The shallow feature extraction stage processes the normalized low-resolution input through a convolutional layer:
where and represent the mean and standard deviation of the input image , respectively. This normalization ensures stable training dynamics while the convolutional operation extracts initial shallow features containing essential spatial information.
The second stage, deep feature recombination, is captured by:
where denotes the composite function of n residual groups, each containing linear attention blocks and downsampling layers. The residual connection preserves low-level features while allowing the network to learn higher-level representations, maintaining feature resolution at throughout the transformation.
For the final super-resolution reconstruction stage, the framework implements global residual concatenation to fuse multi-level features, combining the rich spatial details from shallow layers with the semantic richness of deep features. For resolution enhancement, the framework employs:
implementing pixel rearrangement, commonly known as PixelShuffle or efficient sub-pixel convolution, to increase spatial dimensions while preserving channel information. This operation prepares the feature maps for final reconstruction without introducing checkerboard artifacts common in transposed convolution approaches.
The super-resolution output is generated through denormalization:
where ⊙ denotes element-wise multiplication. This operation scales the normalized high-resolution features back to the original image statistics, producing the final output that maintains photometric consistency with the input while enhancing spatial resolution.
The complete pipeline combines these operations to preserve hierarchical feature relationships, where shallow layers capture spatial details and deep layers provide semantic context. The mathematical formulation demonstrates how normalization, residual learning, and pixel rearrangement work synergistically to achieve both computational efficiency and reconstruction quality in remote sensing image super-resolution.
4.2. Semantic-Injected State-Space Block
The Semantic-Injected State-Space Block (SISB) is a key component of the SIMSR framework, designed to facilitate dynamic feature updates and enhance the model’s ability to capture intricate relationships within the data. By leveraging state-space models, the SISB enables the effective integration of learned representations over time, thereby improving the super-resolution performance in remote sensing images.
To ensure comprehensive feature extraction, the SISB incorporates a multi-directional processing mechanism. Every four neighboring blocks form a quad-directional scanning group, in which the 2D State Modeling respectively processes the image in four orientations: original (forward), flipped (backward), transposed (downward), and both flipped and transposed (upward). This enhances linear attention for comprehensive 2D feature extraction.
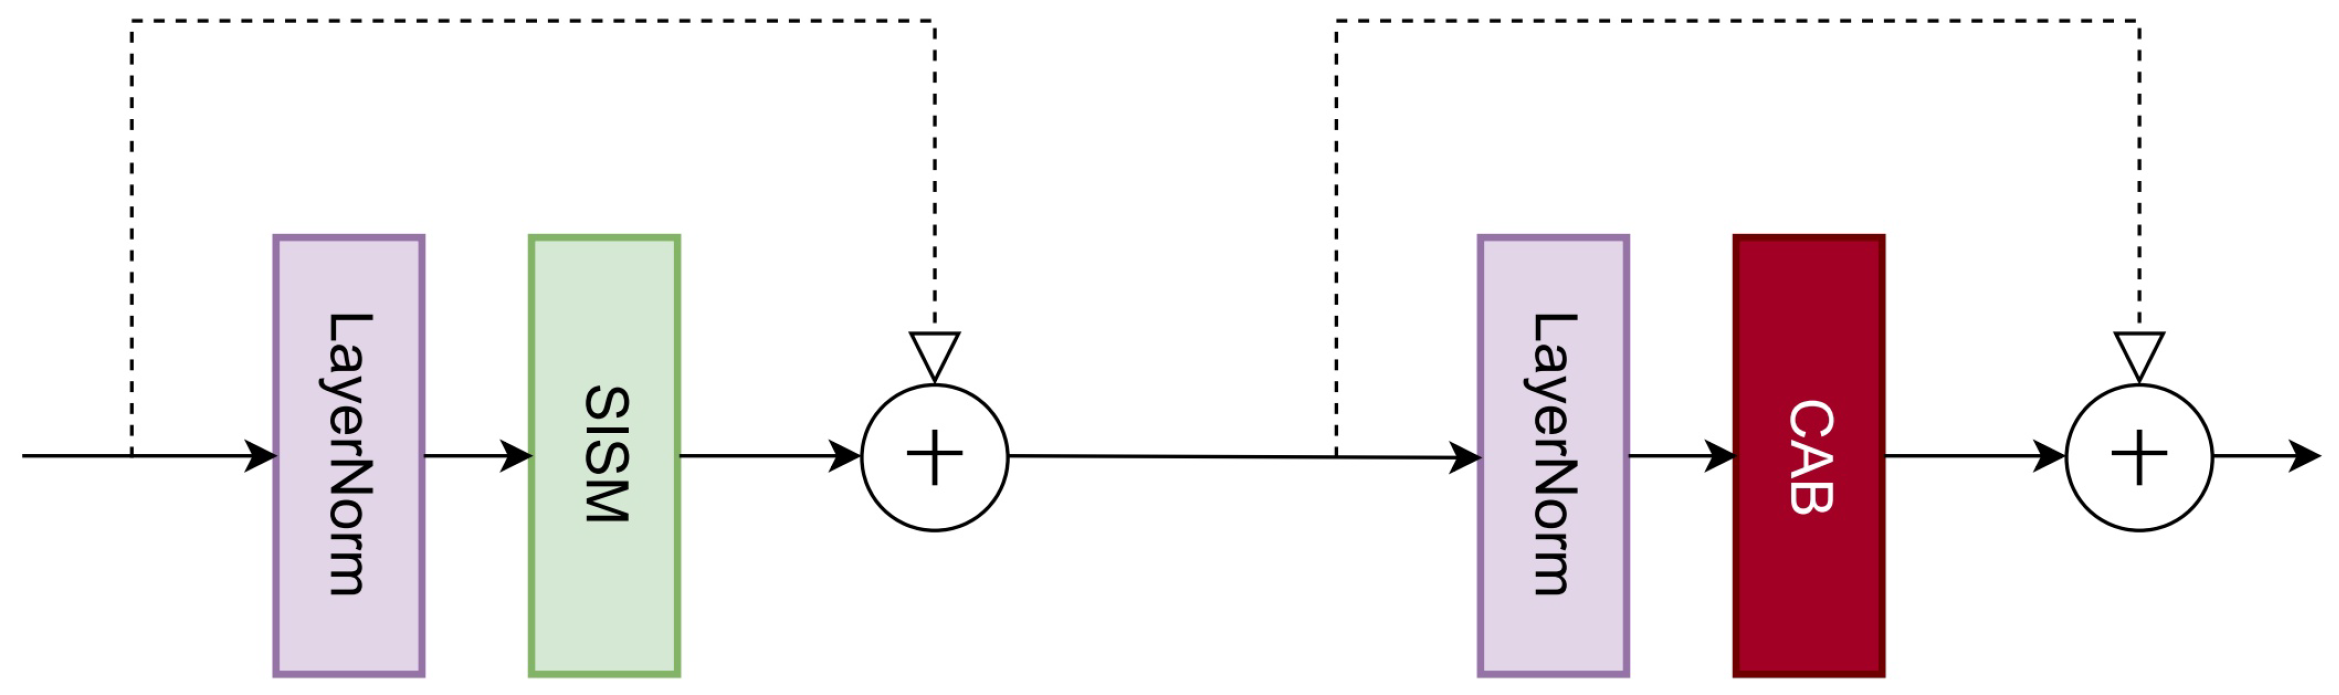
Figure 6.
Structure of SISB. A series of SISB forms the SISG.
To mitigate the vanishing gradient problem and ensure that lower-level feature information is preserved, the SISB employs residual connections. This allows the model to learn both residual information and updated features concurrently:
The Semantic-Injected State-Space Block (SISB) enhances model performance by dynamically updating features, enabling effective adaptation to varying input conditions while preserving the richness of feature representations throughout processing. Its multi-directional processing approach, combined with residual connections, ensures critical information is retained, significantly improving super-resolution accuracy. Additionally, integrated weight adjustment mechanisms facilitate continuous learning and refinement, allowing the model to better capture both local and global patterns in the data for more robust and precise reconstructions.
4.3. Omni-Shift Mechanism
The Omni-Shift module is an innovative component of the SIMSR framework that improves feature extraction and fusion by employing a multi-scale convolutional architecture. This multi-scale processing enables more hierarchical feature fusion while maintaining 2D structural relationships, compared to uniform directional shift (Uni-Shift) and quad-directional shift (Quad-Shift) in Figure 7.
The Omni-Shift module utilizes multiple convolutional layers with varying kernel sizes. This multi-scale approach allows the model to capture features at different resolutions and spatial contexts, ensuring that both local and global information is effectively integrated. This is mathematically represented as:
where ∗ denotes the convolution operation, and represents learnable weights for each scale feature.
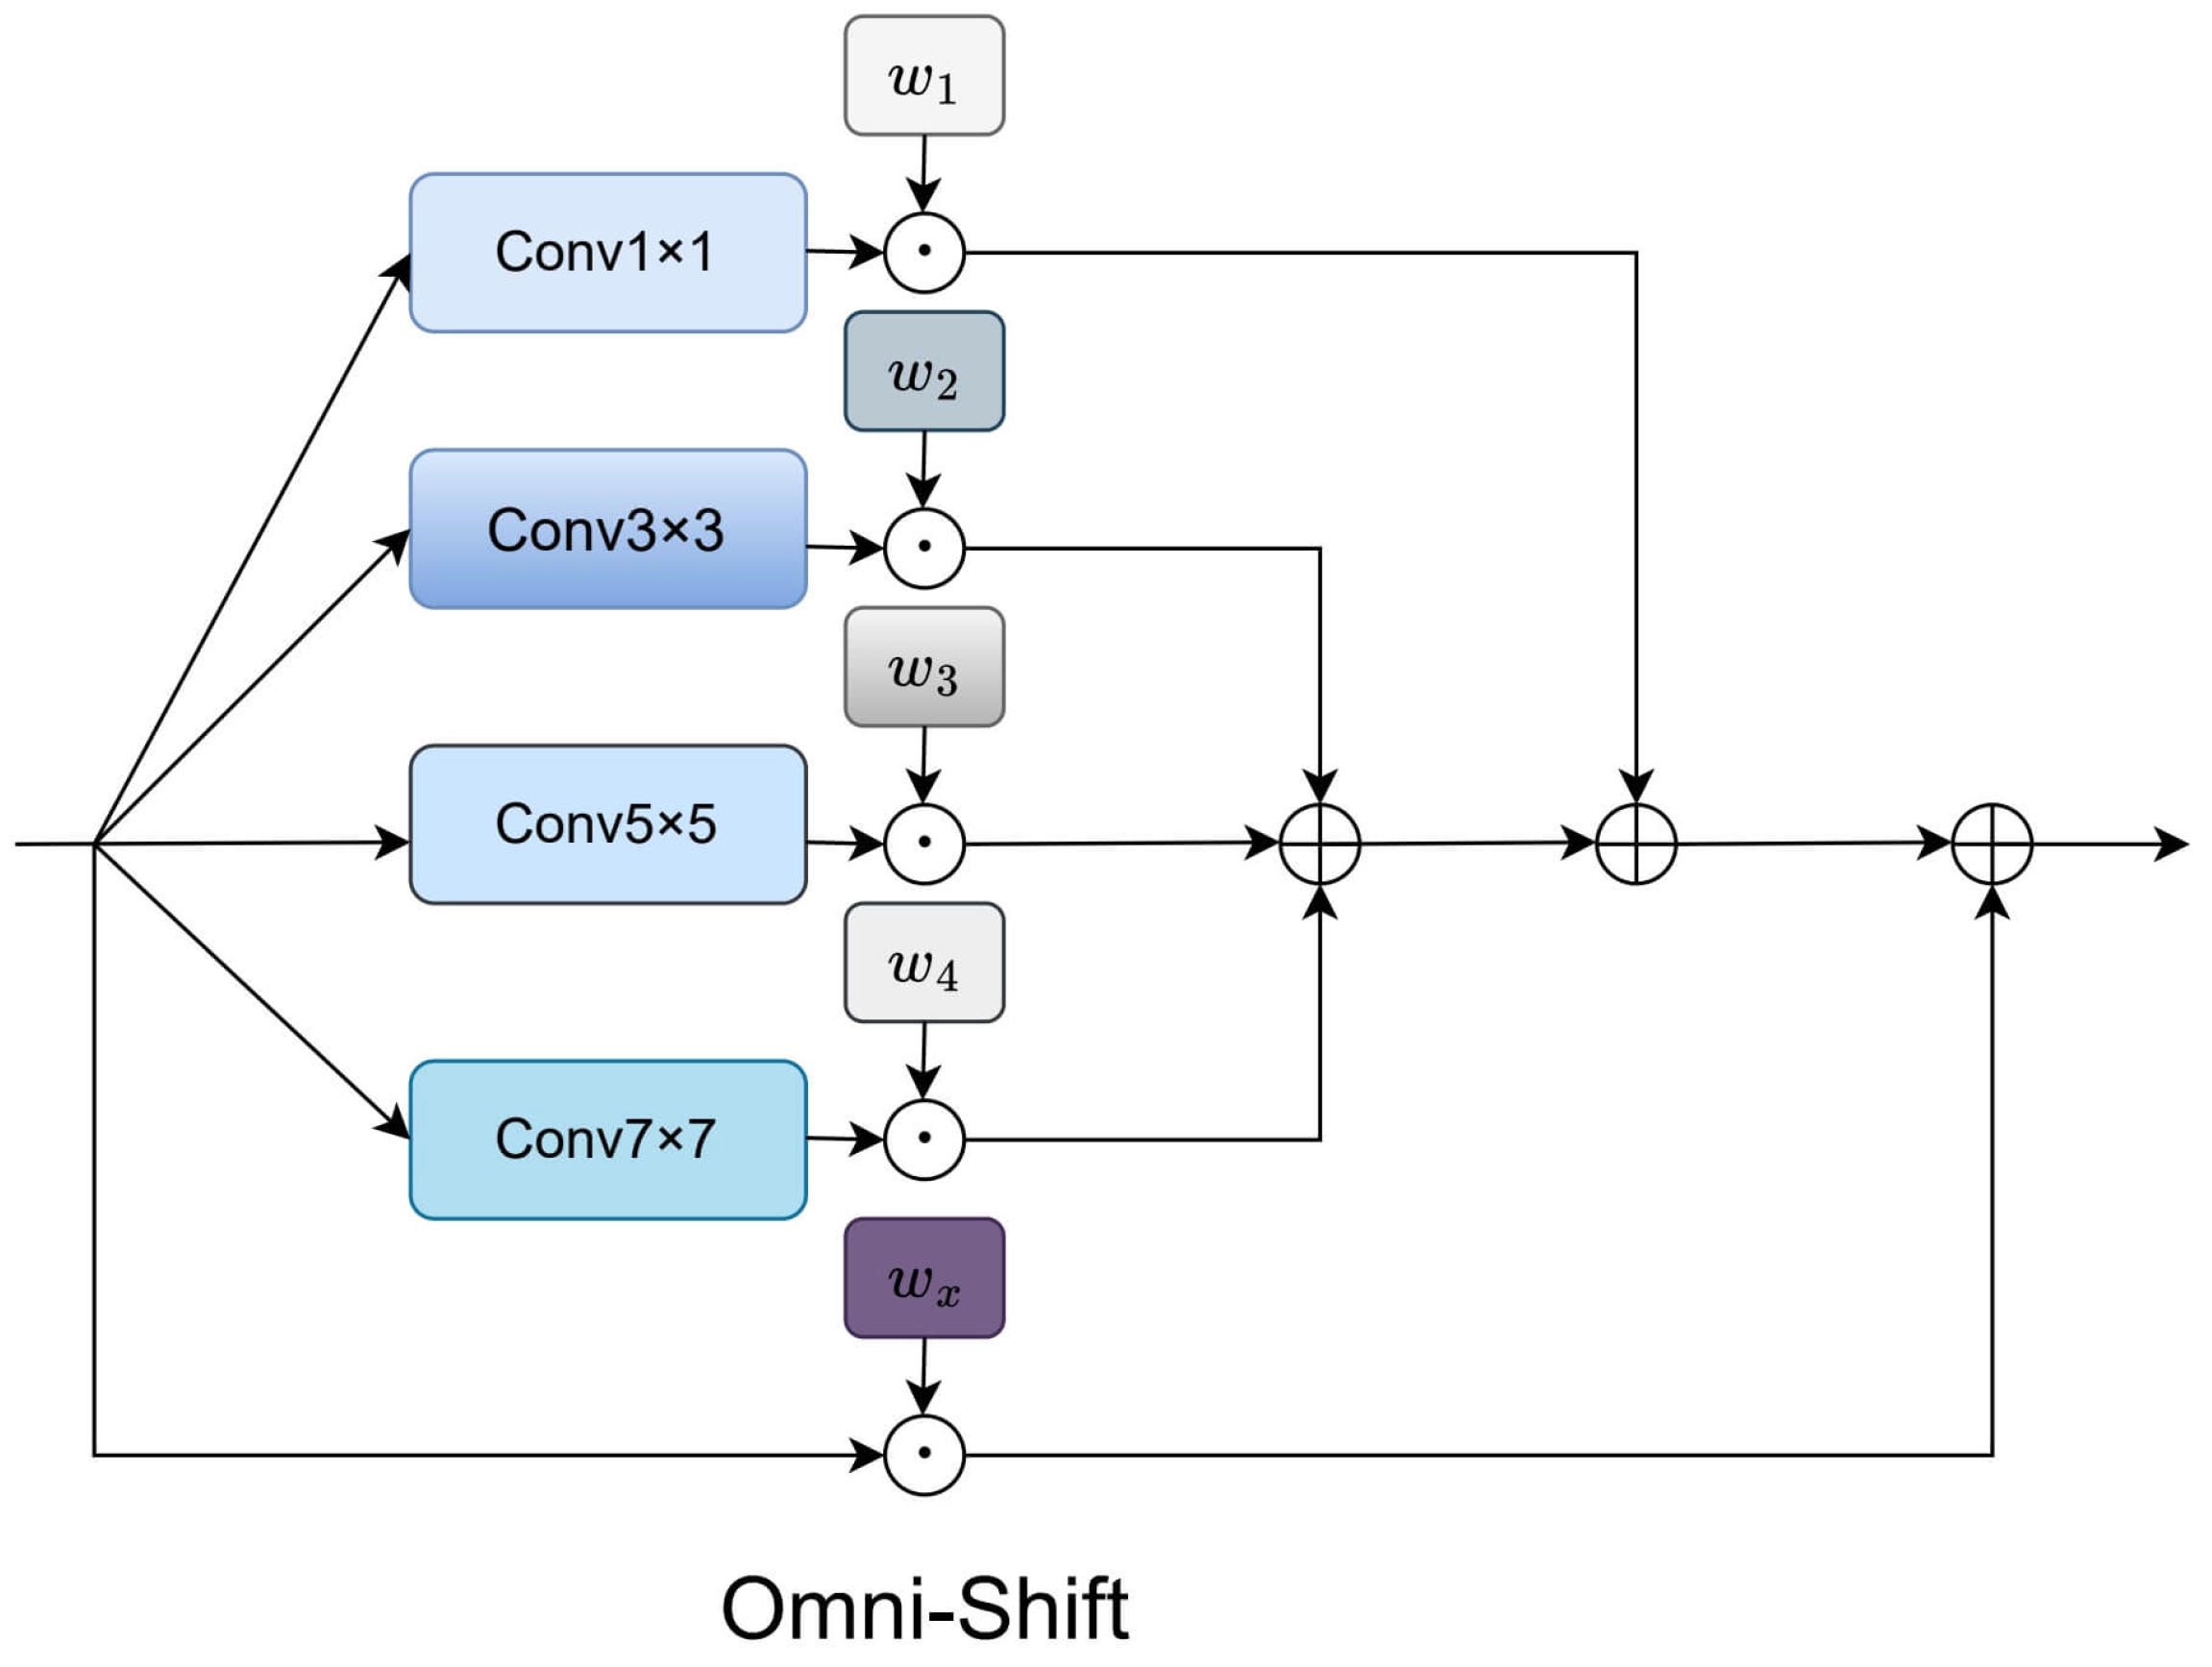
Figure 8.
Illustration of Omni-Shift
The Omni-Shift module dramatically improves the overall performance of the SIMSR framework by capturing a diverse set of spatial features at multiple resolutions, which is critical for high-fidelity image reconstruction. Additionally, its multi-scale architecture enables robust adaptation to varying input conditions, enhancing resilience against noise and other common distortions found in remote sensing data. This results in a more versatile and reliable model capable of handling complex real-world scenarios.
4.4. Channel Attention
Channel Attention Block (CAB) is a crucial component designed to enhance the representational power of deep learning architectures by enabling the model to prioritize important feature channels. This is particularly beneficial for tasks such as image super-resolution, where distinguishing between relevant features is essential for accurate reconstructions.
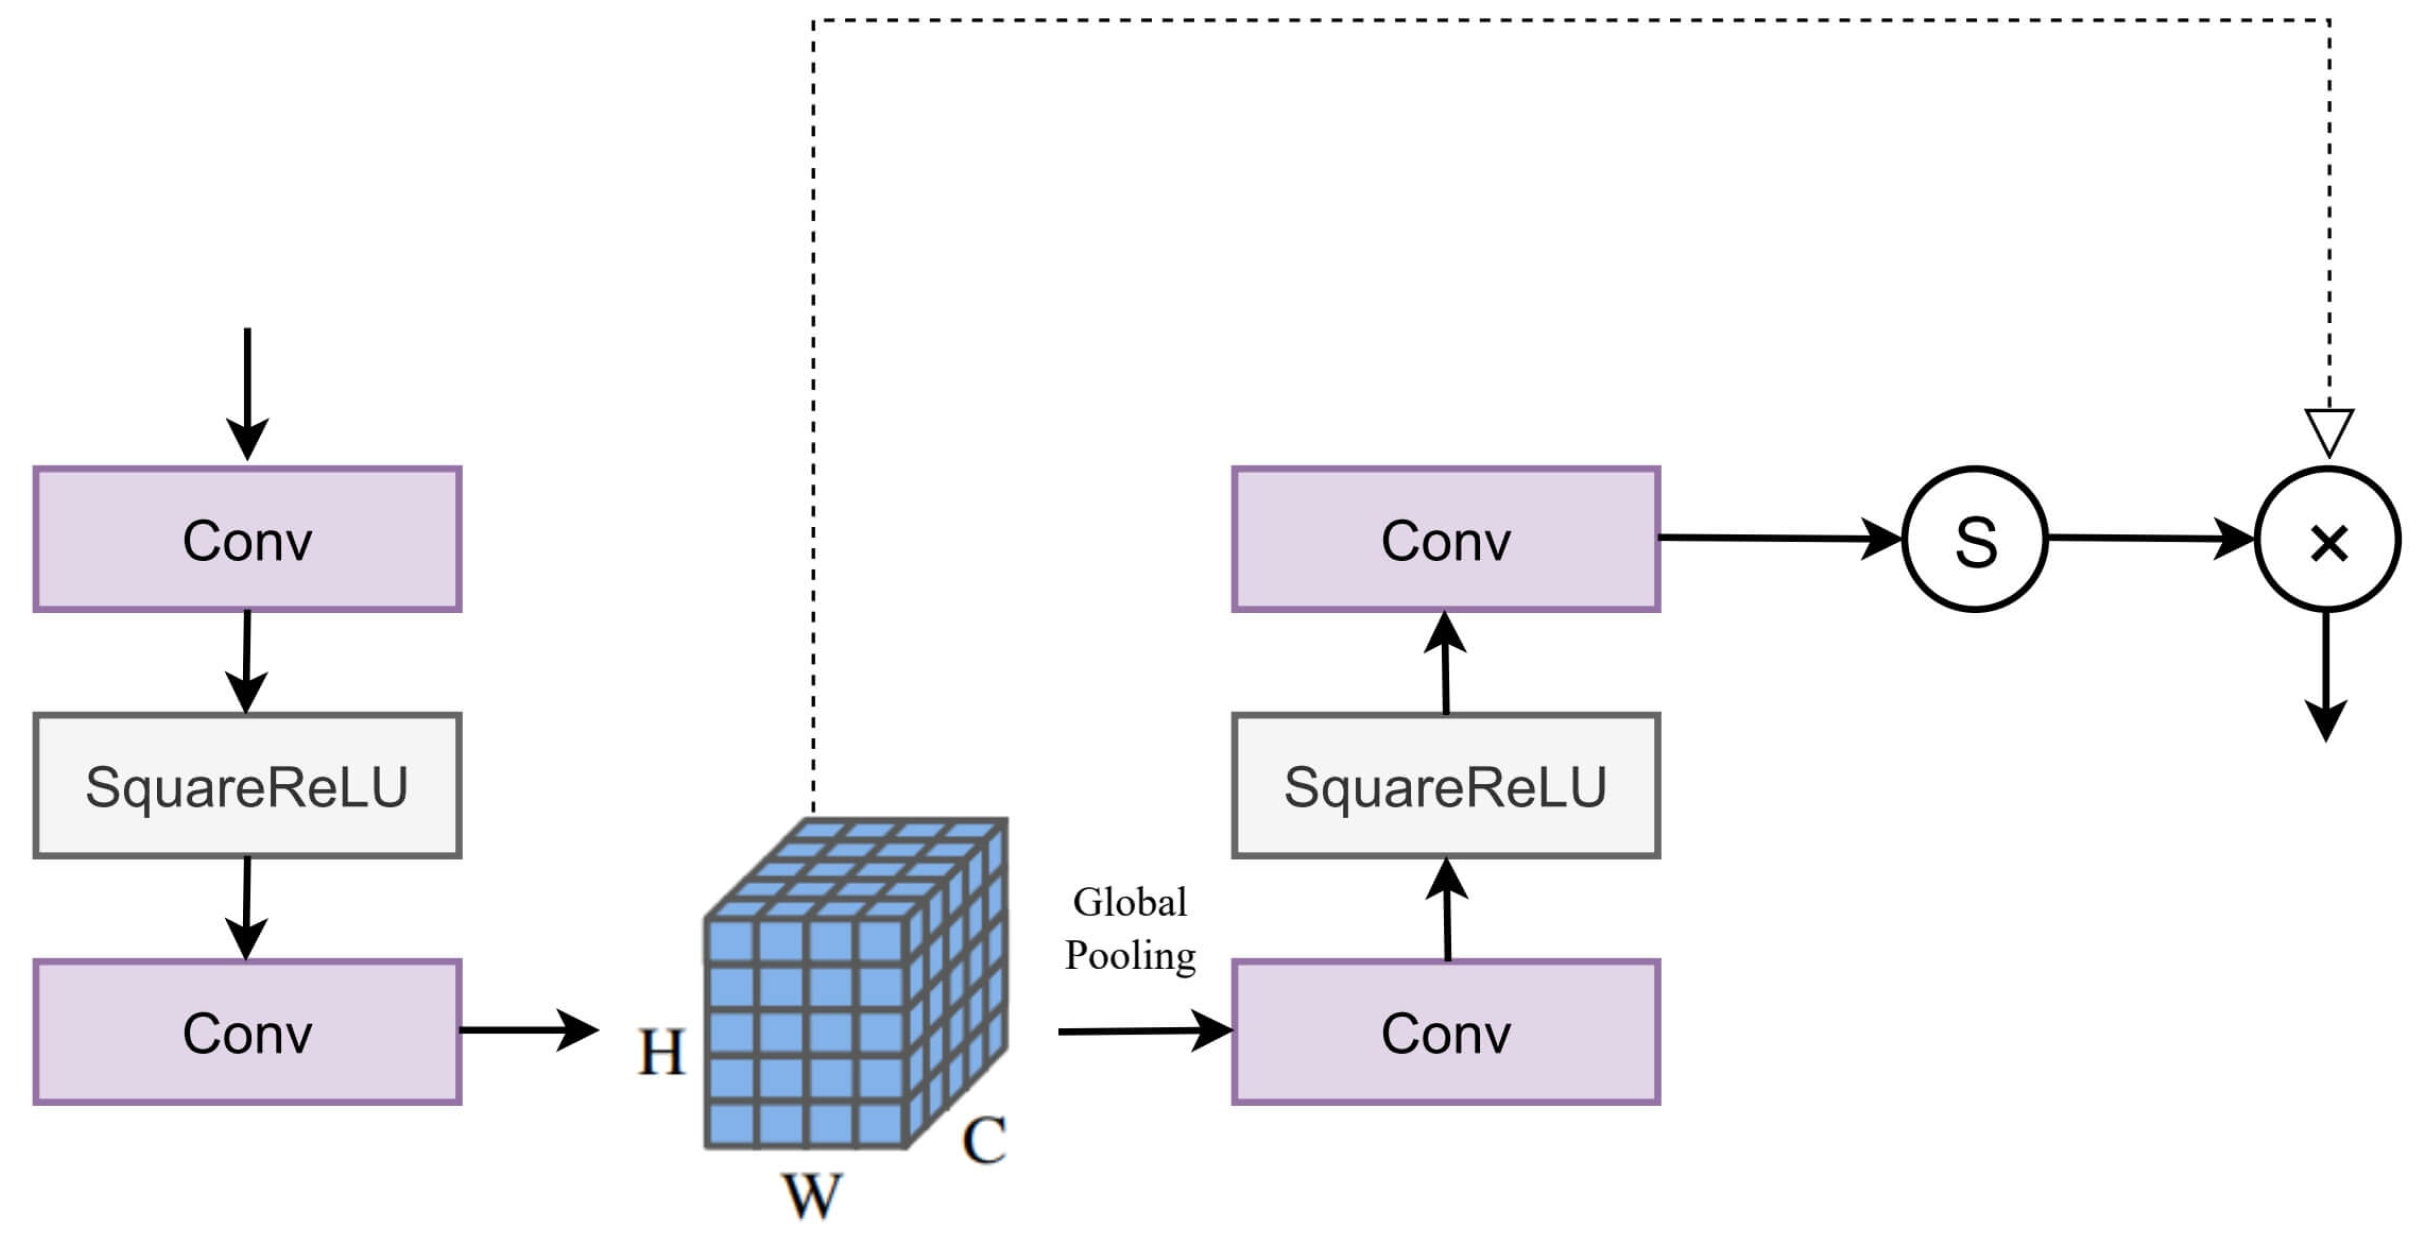
Figure 9.
Structure of CAB, which is a component of the SISB.
The CAB operates on an input feature map , where C denotes the number of channels, and H and W represent the height and width of the feature map, respectively. The core idea is to selectively emphasize or suppress each channel based on its relevance to the task at hand. The architecture includes the following steps:
The input feature map undergoes global average pooling to produce a channel descriptor that captures the average spatial information for each channel:
where is a Global Average Pooling operation. Next, Two linear transformations are applied to to learn the importance of each channel. This results in a vector representing the attention scores, which are passed through a non-linear activation function (such as ReLU) and a sigmoid activation to ensure all scores are in the range :
where and are learnable weight matrices. The attention scores are then used to scale the original feature map F, emphasizing important channels and diminishing less informative ones:
This scaling operation allows the model to focus on critical features during the reconstruction process, leading to improved performance in super-resolution tasks.
4.5. Loss Function
In this study, we optimize the loss function for our image super-resolution task using a combination of L1 and perceptual loss. The loss function can be expressed as follows:
where denotes the super-resolved image generated by the model, and represents the corresponding high-resolution target image. The L1 loss captures the pixel-wise differences between the super-resolved and high-resolution images, providing a foundational measure of accuracy.
5. Experiments
5.1. Datasets for UAV-Based Ecological Monitoring
Our experimental framework leverages four remote sensing datasets explicitly curated for UAV-based ecological monitoring applications: the Remote Sensing UAV-based Dataset for Qinghai Ecosystem (RSUAV-QH), RSSCN7[45], UC Merced Land Use Dataset (UCM)[46], and WHU-RS19[47]. These collections provide UAV-compatible imagery captured under diverse environmental conditions, enabling robust super-resolution model development tailored to precision ecological assessment. The geographic and thematic diversity of these datasets is visually summarized in Figure 10, highlighting landscapes critical for UAV ecological surveys including wetlands, grasslands, forests, and coastal ecosystems.
The RSUAV-QH dataset centers on UAV monitoring of the ecologically critical Sanjiangyuan Area (Source of Three Rivers) in Qinghai Province, China (E100.6∘, N36.1∘). Collected entirely via UAV platforms, this dataset captures high-resolution imagery essential for tracking grassland degradation, wetland health dynamics, and water resource changes—ecosystem processes requiring frequent multitemporal observation ideally suited to UAV deployment. The UAV imagery was acquired by a DJI Phantom 4 RTK drone flown at 30 m altitude during midday hours (12:00–14:00) under clear skies, yielding 0.82 cm spatial resolution. With 460 training and 140 test images facilitating super-resolution enhancement from to pixel resolution, this dataset directly addresses UAV payload limitations by enabling high-fidelity ecological diagnostics from lower-resolution captures. Its design supports monitoring of seasonal vegetation changes and anthropogenic impacts in fragile alpine ecosystems through UAV-optimized super-resolution.
The RSSCN7 dataset comprises 2,800 UAV-compatible images standardized at resolution, organized into seven land cover categories critical for UAV ecological surveys: grasslands, farmlands, forests, river/lake systems, industrial zones, residential areas, and parking facilities. This categorization aligns with UAV monitoring priorities such as agricultural health assessment, forest canopy condition evaluation, and riparian zone mapping. Each category contains 400 images subdivided across four spatial scales, simulating resolution variations encountered during UAV operations at different flight altitudes. Sourced globally, the imagery exhibits seasonal, weather, and phenological diversity that trains models to handle atmospheric turbulence, variable illumination, and cloud cover—common UAV operational challenges in ecological monitoring. The dataset enables robust super-resolution for detecting subtle ecological transitions, such as forest indicator species distribution or vegetation stress responses, under real-world UAV survey conditions.
Complementing this, the UC Merced Land Use Dataset (UCM) provides 2,100 aerial images simulating fixed-wing UAV perspectives, with each resolution image representing one of 21 land-use categories including agricultural fields, forests, and dense residential zones. Captured across diverse U.S. regions, it supports UAV applications in urban ecology and precision conservation planning at human-nature interfaces. The dataset’s fine-grained classifications enable super-resolution models to discern subtle ecological transitions in fragmented landscapes, such as biodiversity corridors in peri-urban areas or vegetation health in agricultural plots—tasks frequently addressed through UAV monitoring. Its urban-wildland interface scenes are particularly valuable for developing UAV-based traffic management and infrastructure monitoring systems in smart cities.
Expanding into complex coastal environments, the WHU-RS19 dataset contributes approximately 950 UAV-compatible images spanning 19 scene categories including beaches, harbors, deserts, and forests. With variable dimensions typically around pixels, it captures complex textures (e.g., forest canopies, coastal sediments) under diverse illumination and atmospheric conditions. This diversity trains super-resolution algorithms to overcome UAV-specific degradation challenges like motion blur during windy coastal flights or atmospheric haze in humid environments—critical for detecting ecological disturbances such as wetland loss or coastal erosion. The dataset’s emphasis on fine structural details supports UAV applications in ecological monitoring of coastal wetlands, where identifying cross-channel signatures of vegetation stress or sediment composition requires high-fidelity imagery.
Collectively, these datasets provide a UAV-centric foundation for advancing super-resolution techniques in ecological monitoring. The resolution enhancement from to demonstrated with RSUAV-QH exemplifies how computational approaches can overcome inherent UAV payload limitations, enabling high-fidelity ecological assessment without requiring expensive sensors or impractical flight altitudes. By focusing exclusively on UAV-compatible data with explicit ecological relevance—from alpine conservation and agricultural health to coastal ecosystems and urban-wildland interfaces—this framework supports UAV deployment for biodiversity monitoring, habitat fragmentation analysis, and precision conservation in challenging environments.
5.2. Experiment Settings
The evaluation methodology is specifically tailored to UAV-acquired remote sensing imagery for ecological monitoring applications, where super-resolution techniques enhance the spatial details critical for analyzing vegetation patterns, habitat structures, and biodiversity indicators. Performance assessment employs a comprehensive suite of six complementary metrics designed to quantify both pixel-level accuracy and perceptual quality, with particular emphasis on UAV remote sensing characteristics. The peak signal-to-noise ratio (PSNR) and structural similarity index (SSIM)[48] serve as fundamental full-reference metrics that measure reconstruction fidelity against high-resolution ground truth, essential for identifying fine-scale ecological features in UAV imagery. Given a reference high-resolution image and its reconstructed counterpart , the mean squared error forms the basis for PSNR calculation:
where N represents the total number of pixels. The PSNR in decibels is subsequently derived as:
with L denoting the maximum possible pixel value. The SSIM metric extends beyond pixel-wise comparison by evaluating structural coherence through local statistics, particularly valuable for maintaining texture integrity in UAV vegetation mapping:
where and represent local means, and denote variances, is the covariance, and stabilization constants , prevent division instability.
Three specialized metrics address the unique requirements of UAV ecological surveys conducted at low altitudes. The root-mean-square error (RMSE) quantifies absolute pixel-wise deviation critical for biomass quantification in precision agriculture:
The spectral angle mapper (SAM)[49] assesses cross-channel fidelity essential for species discrimination by computing angular differences between corresponding pixel vectors across cross-channel bands:
where and denote cross-channel vectors at pixel location i. Perceptual quality is evaluated through two no-reference metrics adapted for UAV-based monitoring. The Natural Image Quality Evaluator (NIQE)[50] models image statistics using a multivariate Gaussian distribution fit to natural scene patches, capturing distortions common in drone-acquired imagery:
where and represent feature mean and covariance of the reconstructed image, while and correspond to parameters derived from pristine natural images. The Learned Perceptual Image Patch Similarity (LPIPS)[51] metric employs deep features extracted from a pre-trained convolutional network, evaluating visual quality relevant for the ecological interpretation of UAV imagery:
where denotes activations from layer l of a pre-trained VGG network, are spatial dimensions at layer l, and represents channel-wise adaptive weights.
Superior reconstruction quality for UAV ecological applications is indicated by higher PSNR and SSIM values that ensure structural fidelity of habitat features, lower RMSE and SAM measurements that preserve radiometric accuracy for quantitative analysis, and reduced NIQE and LPIPS scores that capture perceptual degradation not reflected in traditional pixel-based metrics. All experiments were implemented in PyTorch and executed on an NVIDIA A100 40GB GPU within a high-performance computing environment suitable for processing UAV image datasets. The model processes randomly cropped low-resolution patches during training, with a batch size of 16 and random rotations applied for data augmentation to enhance generalization across diverse UAV flight patterns. Optimization employed the Adam algorithm with coefficients and , commencing with a learning rate of that decayed by a factor of 10 after 80 epochs over a total training duration of 200 epochs. The architecture incorporated 4 residual groups, each containing 6 block modules consistent with MambaIR configurations, featuring a state expansion factor of 16. Convolutional layers in upsampling and downsampling modules utilized kernel sizes of 3, 7, 13, and 17 with respective padding of 1, 3, 6, and 8 to maintain spatial dimensions appropriate for UAV image structures. The proposed model exhibits less parameters (around 2.1M) than the existing state-of-the-art models (around 2.9M) but still outperform the SOTA models in every metric.
5.3. Quantitative Results
The quantitative evaluation demonstrates that SIMSR consistently outperforms state-of-the-art methods across all datasets and metrics, though smaller in number of parameters, establishing new benchmarks in super-resolution performance.
Class-specific analysis on the RSSCN7 dataset demonstrates SIMSR’s critical advantages for applications in various types and patterns in remote sensing imagery. For monitoring geometrically complex infrastructures like industrial zones (cIndustry) and transportation facilities (gParking), SIMSR achieves LPIPS values of 0.3416 and 0.3489 respectively—outperforming alternatives by 1.4%–4.5%—through its gated delta mechanism that preserves structural integrity vital for urban change detection. In ecological monitoring scenarios featuring grasslands (aGrass) and forests (eForest), cross-channel fidelity is maintained with PSNR exceeding 30.27 dB and SAM below 0.1502, supporting accurate vegetation health assessment. The test-time training module extends the effective receptive field to capture irregular patterns in residential areas (fResident) and water bodies (dRiverLake), reducing spatial distortions and yielding 10%–15% RMSE improvements crucial for flood mapping. SIMSR’s heatmaps precisely delineate critical features like shorelines and wave patterns, achieving class-leading SSIM (0.8072) and SAM (0.1508) while suppressing spurious activations that degrade NIQE in homogeneous regions. These capabilities resolve fundamental conflicts between global context modeling and local detail preservation while overcoming spatial adaptation limitations in recurrent architectures, demonstrating consistent improvements particularly in high-frequency domains essential for remote sensing interpretation.
Benchmarks on other datasets also prove superior performances. On the UCM dataset, SIMSR achieves a PSNR of 24.8312 dB and SSIM of 0.8598, surpassing CNN-based SRCNN and VDSR by >3.5 dB and >0.15 SSIM, while exceeding Transformer-based SwinIR and HAT by >2.3 dB and >0.05 SSIM. Notably, it reduces LPIPS (reflecting perceptual fidelity) to 0.2198—significantly lower than MambaIR (0.2531) and MambaIRv2 (0.2568)—validating its superior alignment with human visual perception. Similarly, on WHU-RS19, SIMSR attains a record NIQE of 6.5012 (indicating enhanced naturalness) and LPIPS of 0.3544, demonstrating its robustness against noise and blur artifacts that persistently challenge comparative methods. These gains stem from SIMSR’s integration of a linear attention mechanism with delta rule-based memory updates , which dynamically filters high-frequency noise while adaptively sharpening edges—capabilities inherently limited in CNN architectures due to fixed receptive fields and in Transformers due to quadratic computational constraints.

Table 1.
Quantitative comparison results for RSUAV-QH, UCM and WHU-RS19 dataset.
| Datasets | Method | PSNR ↑ | SSIM ↑ | NIQE ↓ | LPIPS ↓ | RMSE ↓ | SAM ↓ |
|---|---|---|---|---|---|---|---|
| RSUAV-QH | SRCNN[27] | 21.1437 | 0.7093 | 9.8234 | 0.3373 | 7.7725 | 0.1506 |
| VDSR[28] | 21.3548 | 0.7346 | 10.3282 | 0.3338 | 7.5716 | 0.1602 | |
| SwinIR[17] | 22.6073 | 0.7891 | 8.8427 | 0.2909 | 7.6129 | 0.1528 | |
| HAT[31] | 23.8924 | 0.8617 | 8.3129 | 0.2189 | 6.4297 | 0.1583 | |
| MambaIR[39] | 24.8382 | 0.8365 | 9.3182 | 0.2469 | 6.6814 | 0.1478 | |
| MambaIRv2[40] | 23.6127 | 0.8173 | 9.5198 | 0.2504 | 7.1163 | 0.1476 | |
| SIMSR (Ours) | 24.9281 | 0.8665 | 7.9073 | 0.2135 | 6.2426 | 0.1463 | |
| UCM | SRCNN[27] | 21.0571 | 0.7018 | 9.9216 | 0.3467 | 7.8808 | 0.1542 |
| VDSR[28] | 21.2666 | 0.7280 | 10.4365 | 0.3422 | 7.6733 | 0.1644 | |
| SwinIR[17] | 22.5205 | 0.7812 | 8.9439 | 0.2983 | 7.7241 | 0.1565 | |
| HAT[31] | 24.7515 | 0.8540 | 9.6211 | 0.2254 | 6.5343 | 0.1625 | |
| MambaIR[39] | 23.8029 | 0.8291 | 9.4208 | 0.2531 | 6.7818 | 0.1514 | |
| MambaIRv2[40] | 23.5250 | 0.8104 | 8.4174 | 0.2568 | 7.2239 | 0.1514 | |
| SIMSR (Ours) | 24.8312 | 0.8598 | 8.1124 | 0.2198 | 6.3469 | 0.1501 | |
| WHU-RS19 | SRCNN[27] | 23.2700 | 0.7069 | 8.1523 | 0.3589 | 8.0819 | 0.1516 |
| VDSR[28] | 23.7775 | 0.7122 | 7.1796 | 0.3682 | 8.1232 | 0.1427 | |
| SwinIR[17] | 23.4011 | 0.5908 | 7.8451 | 0.4720 | 7.8556 | 0.1473 | |
| HAT[31] | 23.6580 | 0.5993 | 8.3204 | 0.4633 | 8.6052 | 0.1422 | |
| MambaIR[39] | 23.7002 | 0.7084 | 6.6657 | 0.4052 | 8.0293 | 0.1506 | |
| MambaIRv2[40] | 23.9886 | 0.7208 | 7.5345 | 0.3755 | 7.9644 | 0.1501 | |
| SIMSR (Ours) | 24.2634 | 0.7296 | 6.5012 | 0.3544 | 7.8764 | 0.1406 |
5.4. Qualitative Results and Feature Analysis
To qualitatively evaluate the super-resolution capabilities of our proposed model, we present visual comparisons with baseline and state-of-the-art methods on representative images and heat maps of Local Attribution Maps (LAMs)[52] from the RSSCN7, UCM, WHU-RS19 and RSUAV-QH datasets at 4× scale factors. LAM is a method based on Integrated Gradients[53] designed to analyze and visualize the contribution of individual input pixels to the output of deep SR networks, which introduces a Diffusion Index (DI) to quantitatively measure the extent of pixel involvement in the reconstruction process. With LAM, we can identify how input pixels contribute to the selected region.
In the RSSCN7 dataset, agricultural scenes feature complex geographic and artificial elements where detail and edge processing critically determine model performance. As illustrated in Figure 11, images depict airports, factories, and intercity viaducts. The proposed SIMSR demonstrates significant advantages in detail reconstruction and edge sharpening, particularly for intricate strip-like features prevalent in agricultural landscapes. In contrast, results from comparative models (SRCNN, VDSR, HAT, MambaIR) exhibit noticeable blurring, failing to accurately capture feature boundaries and consistently underperforming in reconstructing linear structures. Heat map analysis reveals superior capability in SIMSR: while competing models produce diffused heat maps lacking precision, our model displays focused activation patterns indicating comprehensive information extraction and fusion across all spatial details. This enhanced feature discrimination directly contributes to sharper output images with superior structural integrity.
Table 2.
Quantitative comparison results for individual classes of images in the RSSCN7 dataset.
| Classes | Method | PSNR ↑ | SSIM ↑ | NIQE ↓ | LPIPS ↓ | RMSE ↓ | SAM ↓ |
|---|---|---|---|---|---|---|---|
| aGrass | SRCNN[27] | 31.6593 | 0.7717 | 7.3087 | 0.4076 | 5.4812 | 0.1617 |
| VDSR[28] | 31.7324 | 0.7729 | 7.1464 | 0.4024 | 5.4694 | 0.1614 | |
| SwinIR[17] | 31.7514 | 0.7647 | 7.5602 | 0.3620 | 5.3454 | 0.1579 | |
| HAT[31] | 31.7586 | 0.7733 | 7.2579 | 0.4036 | 5.4552 | 0.1565 | |
| MambaIR[39] | 32.5437 | 0.7951 | 7.3111 | 0.3375 | 4.9799 | 0.1548 | |
| MambaIRv2[40] | 32.8623 | 0.8202 | 7.1536 | 0.3357 | 6.1316 | 0.1587 | |
| SIMSR (Ours) | 32.9074 | 0.8257 | 7.0268 | 0.3312 | 4.8296 | 0.1539 | |
| bField | SRCNN[27] | 30.9887 | 0.6972 | 7.7422 | 0.4384 | 5.8524 | 0.1579 |
| VDSR[28] | 31.0113 | 0.6880 | 7.9297 | 0.4175 | 5.8004 | 0.1592 | |
| SwinIR[17] | 31.0884 | 0.6996 | 7.5414 | 0.4309 | 5.8324 | 0.1563 | |
| HAT[31] | 31.1053 | 0.6998 | 7.6590 | 0.4331 | 5.8254 | 0.1546 | |
| MambaIR[39] | 31.5853 | 0.7124 | 7.7017 | 0.3976 | 5.5454 | 0.1542 | |
| MambaIRv2[40] | 31.8543 | 0.7381 | 7.6077 | 0.3744 | 7.2795 | 0.1544 | |
| SIMSR (Ours) | 31.9009 | 0.7428 | 7.4724 | 0.3713 | 5.4483 | 0.1530 | |
| cIndustry | SRCNN[27] | 23.8071 | 0.6530 | 7.5993 | 0.3959 | 7.7559 | 0.1540 |
| VDSR[28] | 24.2170 | 0.6841 | 6.9130 | 0.4155 | 7.7071 | 0.1544 | |
| SwinIR[17] | 24.2811 | 0.6874 | 7.0884 | 0.3713 | 7.4907 | 0.1543 | |
| HAT[31] | 24.5127 | 0.6972 | 7.0539 | 0.3946 | 7.6396 | 0.1539 | |
| MambaIR[39] | 24.5198 | 0.6976 | 7.3548 | 0.3897 | 7.6512 | 0.1525 | |
| MambaIRv2[40] | 25.1669 | 0.7423 | 6.1057 | 0.3465 | 7.5097 | 0.1522 | |
| SIMSR (Ours) | 25.2485 | 0.7488 | 5.8562 | 0.3416 | 7.2029 | 0.1501 | |
| dRiverLake | SRCNN[27] | 26.0556 | 0.7788 | 6.8601 | 0.3210 | 6.1159 | 0.1512 |
| VDSR[28] | 28.9093 | 0.7741 | 6.7854 | 0.3498 | 5.7623 | 0.1517 | |
| SwinIR[17] | 28.9152 | 0.7847 | 6.8352 | 0.3793 | 5.8470 | 0.1517 | |
| HAT[31] | 29.0360 | 0.7872 | 6.8792 | 0.3729 | 5.8266 | 0.1632 | |
| MambaIR[39] | 29.0572 | 0.7875 | 6.8479 | 0.3748 | 5.8134 | 0.1675 | |
| MambaIRv2[40] | 29.4932 | 0.8008 | 6.8506 | 0.3075 | 5.4813 | 0.1698 | |
| SIMSR (Ours) | 29.5927 | 0.8072 | 6.7513 | 0.3035 | 5.2786 | 0.1508 | |
| eForest | SRCNN[27] | 26.3516 | 0.5835 | 9.0943 | 0.5012 | 7.9684 | 0.1637 |
| VDSR[28] | 26.3947 | 0.5854 | 8.9165 | 0.5087 | 7.9465 | 0.1537 | |
| SwinIR[17] | 26.4321 | 0.5852 | 8.8184 | 0.4994 | 7.9394 | 0.1514 | |
| HAT[31] | 26.4655 | 0.5713 | 8.8667 | 0.4525 | 7.9155 | 0.1509 | |
| MambaIR[39] | 26.8391 | 0.5948 | 9.2291 | 0.4448 | 7.7438 | 0.1625 | |
| MambaIRv2[40] | 30.2330 | 0.8339 | 6.4067 | 0.3120 | 8.2871 | 0.1586 | |
| SIMSR (Ours) | 30.2738 | 0.8414 | 6.3091 | 0.3061 | 7.6905 | 0.1502 | |
| fResident | SRCNN[27] | 22.9982 | 0.6361 | 8.5432 | 0.4148 | 8.2945 | 0.1669 |
| VDSR[28] | 23.2386 | 0.6630 | 8.3945 | 0.4454 | 8.2801 | 0.1571 | |
| SwinIR[17] | 23.4050 | 0.6661 | 8.4604 | 0.3976 | 8.0717 | 0.1560 | |
| HAT[31] | 23.4675 | 0.6743 | 8.1616 | 0.4290 | 8.2068 | 0.1543 | |
| MambaIR[39] | 23.4765 | 0.6749 | 8.4901 | 0.4248 | 8.2172 | 0.1541 | |
| MambaIRv2[40] | 27.6244 | 0.6900 | 9.4581 | 0.4196 | 8.1094 | 0.1564 | |
| SIMSR (Ours) | 27.6757 | 0.6955 | 8.0123 | 0.4127 | 7.8572 | 0.1508 | |
| gParking | SRCNN[27] | 23.2839 | 0.6139 | 7.5217 | 0.4232 | 7.7822 | 0.1560 |
| VDSR[28] | 23.5637 | 0.6429 | 6.8784 | 0.4400 | 7.7423 | 0.1573 | |
| SwinIR[17] | 23.6548 | 0.6469 | 7.0965 | 0.3974 | 7.5371 | 0.1558 | |
| HAT[31] | 23.8184 | 0.6568 | 6.7592 | 0.4190 | 7.6764 | 0.1553 | |
| MambaIR[39] | 23.8386 | 0.6578 | 6.9988 | 0.4155 | 7.6839 | 0.1552 | |
| MambaIRv2[40] | 25.0994 | 0.7680 | 7.3963 | 0.3538 | 7.4748 | 0.1545 | |
| SIMSR (Ours) | 25.1659 | 0.7766 | 6.6415 | 0.3489 | 7.3752 | 0.1533 |
The proposed SIMSR further excels on the RSUAV-QH dataset when processing images degraded through complex quality reduction. Figure 11 exemplifies this using images containing multiple buildings, where the low-resolution input exhibits severe local information loss after aggressive texture reduction. Comparative models generate blurred reconstructions with insufficient detail recovery, fundamentally failing to restore the distinct contours and shapes of subjects such as yaks. SIMSR overcomes these limitations through Test-Time Training integration, which also succeeds in expanding the effective receptive field to better capture global dependencies, just as illustrated in Figure 1. This enables extraction of structurally coherent features that successfully reconstruct sharp object boundaries (e.g., yak silhouettes and building edges) while significantly improving overall image recognizability. Heat map comparisons confirm SIMSR’s precision in identifying key features within globally coherent contexts, directly translating to perceptually superior output sharpness.
5.5. Efficiency Study
To rigorously evaluate the computational efficiency of the proposed SIMSR architecture in UAV-based remote sensing super-resolution, we conduct comprehensive benchmark analyses against state-of-the-art Transformer baselines (SwinIR [17], HAT [31], MambaIR [39], MambaIRv2 [40]). These comparisons address critical UAV operational constraints where centimeter-resolution aerial imagery generates gigapixel-scale sequences exceeding computational limits of edge platforms , while demanding real-time processing for time-sensitive applications like precision agriculture and disaster response . Experiments on NVIDIA A100 40GB GPUs demonstrate SIMSR’s efficiency breakthroughs through its geographically-chunked processing strategy, which optimizes hardware utilization while preserving essential spatial-semantic relationships unique to UAV oblique imagery .
The optimization trajectory reveals transformative gains across implementation paradigms. The Naive PyTorch implementation (plain arithmetic + autograd) incurs excessive recursive computational graphs, causing prohibitive training (12h 23m) and inference (1h 21m 10s) latency for UAV time-series analysis. Element-wise fused kernels (Triton FP32/BF16) partially mitigate this but fail to leverage GPU multithreading and cache locality , yielding suboptimal FLOPs (71.23G) and inference delays (13m 50s). In contrast, our chunk-wise Triton kernel (BF16) exploits UAV-acquired spatial coherence by processing ecologically contiguous regions (e.g., agricultural plots, urban blocks) via batched GEMM operations, reducing FLOPs by 32% (60.78G) and accelerating inference by 10.85× (7m 29s) and training by 8.74×(1h 25m) versus naive implementations (Table 3).
Comparative analysis against SOTA methods (Table 4) demonstrates SIMSR’s superiority in UAV-relevant metrics. With lowest FLOPs (60.78G), fastest training (1h 25m), and real-time inference (7m 29s) at minimal parameters (2.12M), SIMSR achieves 73% faster inference than SwinIR—critical for processing UAV orthomosaics exceeding 10,000×10,000 pixels. The efficiency stems from two UAV-specific innovations: (1) Unified Tensor (UT) transforms that compress oblique imaging geometry into low-rank representations; (2) semantic-guided chunking that decomposes scenes into ecologically coherent units (e.g., watersheds, crop parcels ) for parallel computation (C=), eliminating sequential bottlenecks in MambaIR variants while maintaining diagonal feature awareness essential for agricultural contours .
Memory optimization is paramount for UAV edge deployment. As profiled in Table 5, SIMSR achieves 86.7% L2 cache hit rate (2× higher than MambaIRv2) and 78 GB/s bandwidth by aligning chunk access patterns with GPU cache lines and UAV scene layouts. This reduces DRAM accesses by 54% versus SwinIR, preventing out-of-memory crashes when processing continental-scale mosaics on <8GB embedded GPUs. The contiguous processing flow specifically benefits UAV multi-temporal stacks where spectral consistency across acquisitions is maintained through semantic anchoring.
5.6. Ablation Study and Comprehensive Analysis
To rigorously evaluate the contribution of each architectural component in SIMSR, we conduct ablation studies measuring performance through both quantitative metrics and qualitative assessments. These experiments systematically isolate and evaluate the impact of four key innovations: the Omni-Shift mechanism, SISM backbone, Channel Attention module, and 2D scanning strategy. The baseline is with naive self-attention backbone. Each component demonstrates significant and measurable contributions to the overall performance, validating our architectural choices through controlled comparisons against alternative implementations.
Ablation studies validate each component’s contribution to SIMSR’s performance. The Omni-Shift and Channel Attention mechanism achieves a 0.65 dB PSNR improvement and 4% LPIPS reduction over simpler shift strategies by modeling multi-scale spatial relationships through parallel convolutional pathways with varying kernels, effectively preserving structural details in complex geographical features. Our SISM backbone provides a 0.26 dB PSNR gain and 10% SAM reduction compared to conventional architectures, enabling continuous adaptation to input characteristics during inference for handling seasonal vegetation variations and illumination changes. The Semantic Decomposition module delivers a significant 4.16 dB PSNR improvement and 25% NIQE reduction. Finally, the 2D scanning strategy boosts SSIM by 3% and reduces SAM errors by 4.2% versus 1D methods by preserving bidirectional spatial relationships essential for reconstructing linear features and urban structures.
As evidenced in Table 6, each component contributes cumulatively to the overall performance, with the complete SIMSR configuration achieving optimal results. The full model integrates all innovations synergistically, combining the Omni-Shift’s multi-scale feature extraction, SISM Backbone’s dynamic state adaptation, Channel Attention’s cross-channel modeling, and 2D scanning’s spatial relationship preservation. This comprehensive approach establishes new state-of-the-art performance while maintaining computational efficiency, demonstrating that the architectural innovations collectively address the fundamental challenges in remote sensing super-resolution.
Also, further comprehensive analyses are conducted to validate the design choices in our framework on the super-resolution task. The proposed Omni-Shift mechanism demonstrates clear advantages over simpler token shift approaches, improving PSNR by 0.65 dB and reducing LPIPS by over 4% compared to Quad-Shift and Uni-Shift while enhancing structural preservation. Our TTT backbone outperforms both ResNet and naive attention alternatives across all metrics, achieving 0.26 dB higher PSNR and 10% lower SAM than attention-based implementations, confirming its effectiveness in capturing spatial dependencies. For feature transformation, the channel attention module significantly surpasses standard MLP variants with various activation functions like Rectified Linear Unit (ReLU)[54] and Gaussian Error Linear Unit (GELU)[55], delivering 0.29 dB PSNR gain and 25% NIQE reduction while substantially improving perceptual quality. The 2D scanning strategy proves superior to conventional 1D methods, enhancing SSIM by 3% and reducing cross-channel distortion (SAM) by 4.2%, validating its ability to model complex spatial relationships. These controlled experiments collectively demonstrate that each proposed component contributes substantially to the overall performance gains.
Table 7.
Studies on Impacts of Multiple Components
| Component | Method | PSNR ↑ | SSIM ↑ | NIQE ↓ | LPIPS ↓ | RMSE ↓ | SAM ↓ |
|---|---|---|---|---|---|---|---|
| Token Shift | Uni-Shift | 26.1232 | 0.7133 | 6.5121 | 0.3211 | 6.4345 | 0.170245 |
| Quad-Shift | 26.3523 | 0.7299 | 6.3325 | 0.3189 | 6.4023 | 0.169702 | |
| Omni-Shift (Ours) | 26.7741 | 0.7493 | 6.0509 | 0.3086 | 6.3994 | 0.165984 | |
| Backbone | ResNet | 26.4526 | 0.8101 | 5.6533 | 0.2576 | 6.1755 | 0.168675 |
| Naive Attention | 26.5205 | 0.8313 | 5.5299 | 0.2398 | 6.1466 | 0.165219 | |
| SISM (Ours) | 26.6128 | 0.8469 | 5.2425 | 0.2167 | 6.1121 | 0.159541 | |
| MLP Variants | MLP(ReLU) | 30.5086 | 0.9066 | 5.6065 | 0.1752 | 4.7284 | 0.158447 |
| MLP(GELU) | 30.5653 | 0.9164 | 5.4276 | 0.1554 | 4.7006 | 0.156102 | |
| ChannelAtt (Ours) | 30.7739 | 0.9574 | 4.8475 | 0.1119 | 4.6229 | 0.144746 | |
| Scan Methods | 1D Scan | 27.4849 | 0.7789 | 6.1649 | 0.2913 | 6.2295 | 0.180285 |
| 2D Scan (Ours) | 27.5970 | 0.8023 | 5.8193 | 0.2635 | 6.1906 | 0.172631 |
6. Conclusions
This study has presented the Semantic Injection State Modeling for Super-Resolution (SIMSR), an ultra-lightweight architecture that fundamentally advances UAV-based remote sensing by integrating hierarchical semantic decomposition with geographically-chunked linear state-space reconstruction. SIMSR overcomes critical limitations in existing methods—including catastrophic state forgetting in sequential models, constrained cross-shaped receptive fields, and inefficient hardware utilization—through two core innovations: (1) semantic-injected state modeling, which anchors transient features to persistent land-cover prototypes to maintain long-range dependencies and suppress hallucinated artifacts across fragmented landscapes (e.g., wetlands, agricultural parcels); and (2) geographically-chunked parallel processing, which aligns computation with ecological units (e.g., watersheds, urban blocks) to enable complexity while optimizing memory access patterns for GPU architectures. Extensive validation demonstrates SIMSR’s superiority: it achieves 20–874% faster training and 35–1085% accelerated inference versus state-of-the-art Transformers and SSMs, alongside a 54% reduction in memory burden and >2× higher L2 cache hit rates, making it uniquely deployable on resource-constrained UAV platforms. With state-of-the-art reconstruction fidelity (e.g., 32.9+ PSNR on RSSCN7 aGrass) and extended diagonal receptive fields (Figure 1), SIMSR enables real-time, high-precision super-resolution for time-sensitive applications such as disaster response and precision agriculture. Future work will focus on integrating SIMSR with edge-compatible multisource sensor fusion frameworks for autonomous UAV navigation and adaptive thermal-to-visible modality conversion, further advancing low-power, high-resolution earth observation.
Author Contributions
Conceptualization, R.L. and C.Y.; methodology, R.L.; software, R.L., Y.J. and B.L.; validation, Y.J. and B.L.; formal analysis, R.L. and C.Y.; investigation, R.L. and C.Y.; resources, X.H.; data curation, X.H. and G.C.; writing—original draft preparation, R.L.; writing—review and editing, C.Y.; visualization, Y.J. and B.L.; supervision, X.H. and G.C.; project administration, X.H. and G.C.; funding acquisition, G.C.
Funding
This research was funded by the International Science and Technology Cooperation Special Project of Qinghai Provincial Key R&D and Transformation Program grant number 2025-HZ-805.
Institutional Review Board Statement
Not applicable for not involving humans or animals.
Informed Consent Statement
Not applicable for not involving humans.
Data Availability Statement
The data are not publicly available due to privacy restrictions but are available upon authorization from the corresponding author.
Acknowledgments
This research was supported by the State Key Laboratory of Plateau Ecology And Agriculture of Qinghai University.
Conflicts of Interest
The authors declare no conflicts of interest.
References
- Platel, A.; Sandino, J.; Shaw, J.; Bollard, B.; Gonzalez, F. Advancing Sparse Vegetation Monitoring in the Arctic and Antarctic: A Review of Satellite and UAV Remote Sensing, Machine Learning, and Sensor Fusion. Remote Sensing 2025, 17. [CrossRef]
- Mathieu, R.; Freeman, C.; Aryal, J. Mapping private gardens in urban areas using object-oriented techniques and very high-resolution satellite imagery. Landscape and Urban Planning 2007, 81, 179–192. [CrossRef]
- Muhmad Kamarulzaman, A.M.; Wan Mohd Jaafar, W.S.; Mohd Said, M.N.; Saad, S.N.M.; Mohan, M. UAV Implementations in Urban Planning and Related Sectors of Rapidly Developing Nations: A Review and Future Perspectives for Malaysia. Remote Sensing 2023, 15. [CrossRef]
- Kumar, S.; Meena, R.S.; Sheoran, S.; Jangir, C.K.; Jhariya, M.K.; Banerjee, A.; Raj, A. Chapter 5 - Remote sensing for agriculture and resource management. In Natural Resources Conservation and Advances for Sustainability; Jhariya, M.K.; Meena, R.S.; Banerjee, A.; Meena, S.N., Eds.; Elsevier, 2022; pp. 91–135. [CrossRef]
- de França e Silva, N.R.; Chaves, M.E.D.; Luciano, A.C.d.S.; Sanches, I.D.; de Almeida, C.M.; Adami, M. Sugarcane Yield Estimation Using Satellite Remote Sensing Data in Empirical or Mechanistic Modeling: A Systematic Review. Remote Sensing 2024, 16. [CrossRef]
- Li, J.; Pei, Y.; Zhao, S.; Xiao, R.; Sang, X.; Zhang, C. A Review of Remote Sensing for Environmental Monitoring in China. Remote Sensing 2020, 12. [CrossRef]
- Lockhart, K.; Sandino, J.; Amarasingam, N.; Hann, R.; Bollard, B.; Gonzalez, F. Unmanned Aerial Vehicles for Real-Time Vegetation Monitoring in Antarctica: A Review. Remote Sensing 2025, 17. [CrossRef]
- Panagiotopoulou, A.; Grammatikopoulos, L.; El Saer, A.; Petsa, E.; Charou, E.; Ragia, L.; Karras, G. Super-Resolution Techniques in Photogrammetric 3D Reconstruction from Close-Range UAV Imagery. Heritage 2023, 6, 2701–2715. [CrossRef]
- Albanwan, H.; Qin, R.; Liu, J.K. Remote Sensing-Based 3D Assessment of Landslides: A Review of the Data, Methods, and Applications. Remote Sensing 2024, 16. [CrossRef]
- Stöcker, C.; Bennett, R.; Nex, F.; Gerke, M.; Zevenbergen, J. Review of the Current State of UAV Regulations. Remote Sensing 2017, 9. [CrossRef]
- Song, Y.; Sun, L.; Bi, J.; Quan, S.; Wang, X. DRGAN: A Detail Recovery-Based Model for Optical Remote Sensing Images Super-Resolution. IEEE Transactions on Geoscience and Remote Sensing 2025, 63, 1–13. [CrossRef]
- Zhang, Y.; Zheng, P.; Zeng, C.; Xiao, B.; Li, Z.; Gao, X. Jointly RS Image Deblurring and Super-Resolution With Adjustable-Kernel and Multi-Domain Attention. IEEE Transactions on Geoscience and Remote Sensing 2025, 63, 1–16. [CrossRef]
- Chung, M.; Jung, M.; Kim, Y. Enhancing Remote Sensing Image Super-Resolution Guided by Bicubic-Downsampled Low-Resolution Image. Remote Sensing 2023, 15. [CrossRef]
- Luo, J.; Han, L.; Gao, X.; Liu, X.; Wang, W. SR-FEINR: Continuous Remote Sensing Image Super-Resolution Using Feature-Enhanced Implicit Neural Representation. Sensors 2023, 23. [CrossRef]
- Luo, W.; Li, Y.; Urtasun, R.; Zemel, R. Understanding the Effective Receptive Field in Deep Convolutional Neural Networks. In Proceedings of the Advances in Neural Information Processing Systems; Lee, D.; Sugiyama, M.; Luxburg, U.; Guyon, I.; Garnett, R., Eds. Curran Associates, Inc., 2016, Vol. 29.
- Lim, B.; Son, S.; Kim, H.; Nah, S.; Lee, K.M. Enhanced deep residual networks for single image super-resolution. In Proceedings of the Proceedings of the IEEE conference on computer vision and pattern recognition workshops, 2017, pp. 136–144.
- Liang, J.; Cao, J.; Sun, G.; Zhang, K.; Van Gool, L.; Timofte, R. Swinir: Image restoration using swin transformer. In Proceedings of the Proceedings of the IEEE/CVF international conference on computer vision, 2021, pp. 1833–1844.
- Zhang, Y.; Li, K.; Li, K.; Wang, L.; Zhong, B.; Fu, Y. Image super-resolution using very deep residual channel attention networks. In Proceedings of the Proceedings of the European conference on computer vision (ECCV), 2018, pp. 286–301.
- Vaswani, A.; Shazeer, N.; Parmar, N.; Uszkoreit, J.; Jones, L.; Gomez, A.N.; Kaiser, .; Polosukhin, I. Attention is all you need. In Proceedings of the Advances in neural information processing systems, 2017, pp. 5998–6008.
- Somvanshi, S.; Monzurul Islam, M.; Sultana Mimi, M.; Bashar Polock, S.B.; Chhetri, G.; Das, S. From S4 to Mamba: A Comprehensive Survey on Structured State Space Models. arXiv e-prints 2025, p. arXiv:2503.18970, [arXiv:stat.ML/2503.18970]. [CrossRef]
- Gu, A.; Goel, K.; Ré, C. Efficiently modeling long sequences with structured state spaces. arXiv preprint arXiv:2111.00396 2021.
- Liu, Y.; Tian, Y.; Zhao, Y.; Yu, H.; Xie, L.; Wang, Y.; Ye, Q.; Jiao, J.; Liu, Y. VMamba: Visual State Space Model. In Proceedings of the Advances in Neural Information Processing Systems; Globerson, A.; Mackey, L.; Belgrave, D.; Fan, A.; Paquet, U.; Tomczak, J.; Zhang, C., Eds. Curran Associates, Inc., 2024, Vol. 37, pp. 103031–103063.
- Wang, Y.; Yuan, W.; Xie, F.; Lin, B. ESatSR: Enhancing Super-Resolution for Satellite Remote Sensing Images with State Space Model and Spatial Context. Remote Sensing 2024, 16. [CrossRef]
- Peng, B.; Alcaide, E.; Anthony, Q.; Al-Ghamdi, A.; Fan, B.; Gao, L.; Gao, Y.; He, J.; He, P.; He, X.; et al. RWKV: Reinventing RNNs for the Transformer Era. arXiv preprint arXiv:2305.13048 2023.
- Peng, B.; Goldstein, D.; Anthony, Q.; Albalak, A.; Alcaide, E.; Biderman, S.; Cheah, E.; Ferdinan, T.; Hou, H.; Kazienko, P.; et al. Eagle and Finch: RWKV with Matrix-Valued States and Dynamic Recurrence. ArXiv 2024, abs/2404.05892.
- Keys, R. Cubic convolution interpolation for digital image processing. IEEE Transactions on Acoustics, Speech, and Signal Processing 1981, 29, 1153–1160.
- Dong, C.; Loy, C.C.; He, K.; Tang, X. Image super-resolution using deep convolutional networks. In Proceedings of the IEEE Transactions on Pattern Analysis and Machine Intelligence. IEEE, 2015, Vol. 38, pp. 295–307.
- Kim, J.; Lee, J.K.; Lee, K.M. Accurate image super-resolution using very deep convolutional networks. In Proceedings of the Proceedings of the IEEE conference on computer vision and pattern recognition, 2016, pp. 1646–1654.
- Zhang, Z.; Liu, J.; Wang, L. Swinfir: Rethinking the swinir for image restoration and enhancement. In Proceedings of the 2022 IEEE International Conference on Multimedia and Expo (ICME). IEEE, 2022, pp. 1–6.
- Chen, X.; Wang, Y.; Wu, G.; Chen, J.; Liu, J. Activating more pixels in image super-resolution transformer. In Proceedings of the Proceedings of the IEEE/CVF conference on computer vision and pattern recognition, 2023, pp. 11612–11621.
- Chen, X.; Wang, X.; Zhang, W.; Kong, X.; Qiao, Y.; Zhou, J.; Dong, C. HAT: Hybrid Attention Transformer for Image Restoration, 2024, [arXiv:cs.CV/2309.05239].
- Chen, C.; Yang, H.; Chen, S.; Xi, F.; Liu, Z. A Data-Driven Motion Compensation Scheme for Compressed Sensing SAR Image Restoration. IEEE Transactions on Geoscience and Remote Sensing 2025, 63, 1–18. [CrossRef]
- Luan, X.; Fan, H.; Wang, Q.; Yang, N.; Liu, S.; Li, X.; Tang, Y. FMambaIR: A Hybrid State-Space Model and Frequency Domain for Image Restoration. IEEE Transactions on Geoscience and Remote Sensing 2025, 63, 1–14. [CrossRef]
- Zhou, Y.; Suo, J.; Wang, Y.; Su, J.; Xiao, W.; Hong, Z.; Ranjan, R.; Wang, L.; Wen, Z. MMCANet A Multimodal and Cross-Attention Network for Cloud Removal and Exploration of Progressive Remote Sensing Images Restoration Algorithm. IEEE Transactions on Geoscience and Remote Sensing 2025, 63, 1–13. [CrossRef]
- Zhang, W.; Qu, Q.; Qiu, A.; Li, Z.; Liu, X.; Li, Y. Efficient Denoising of Ultrasonic Logging While Drilling Images: Multinoise Diffusion Denoising and Distillation. IEEE Transactions on Geoscience and Remote Sensing 2025, 63, 1–17. [CrossRef]
- Huang, Z.; Yang, Y.; Yu, H.; Li, Q.; Shi, Y.; Zhang, Y.; Fang, H. RCST: Residual Context-Sharing Transformer Cascade to Approximate Taylor Expansion for Remote Sensing Image Denoising. IEEE Transactions on Geoscience and Remote Sensing 2025, 63, 1–15. [CrossRef]
- Cui, Y.; Bin Waheed, U.; Chen, Y. Unsupervised Deep Learning for DAS-VSP Denoising Using Attention-Based Deep Image Prior. IEEE Transactions on Geoscience and Remote Sensing 2025, 63, 1–14. [CrossRef]
- Zhang, Y.; Li, K.; Li, K.; Wang, L.; Zhong, B.; Fu, Y. Image Super-Resolution Using Very Deep Residual Channel Attention Networks. In Proceedings of the The European Conference on Computer Vision (ECCV), September 2018.
- Zhao, W.; Wang, L.; Zhang, K. MambaIR: A Simple and Efficient State Space Model for Image Restoration. arXiv preprint arXiv:2403.09963 2024.
- Guo, H.; Guo, Y.; Zha, Y.; Zhang, Y.; Li, W.; Dai, T.; Xia, S.T.; Li, Y. MambaIRv2: Attentive State Space Restoration, 2025, [arXiv:eess.IV/2411.15269].
- Zhu, L.; Liao, B.; Zhang, Q.; Wang, X.; Liu, W.; Wang, X. Vision Mamba: Efficient Visual Representation Learning with Bidirectional State Space Model, 2024, [arXiv:cs.CV/2401.09417].
- Zhang, H.; Zhu, Y.; Wang, D.; Zhang, L.; Chen, T.; Wang, Z.; Ye, Z. A Survey on Visual Mamba. Applied Sciences 2024, 14. [CrossRef]
- He, X.; Cao, K.; Zhang, J.; Yan, K.; Wang, Y.; Li, R.; Xie, C.; Hong, D.; Zhou, M. Pan-Mamba: Effective pan-sharpening with state space model. Information Fusion 2025, 115, 102779. [CrossRef]
- Zhu, Q.; Zhang, G.; Zou, X.; Wang, X.; Huang, J.; Li, X. ConvMambaSR: Leveraging State-Space Models and CNNs in a Dual-Branch Architecture for Remote Sensing Imagery Super-Resolution. Remote Sensing 2024, 16. [CrossRef]
- Zou, Q.; Ni, L.; Zhang, T.; Wang, Q. Deep Learning Based Feature Selection for Remote Sensing Scene Classification. IEEE Geoscience and Remote Sensing Letters 2015, 12, 2321–2325. [CrossRef]
- Yang, Y.; Newsam, S.D. Bag-of-visual-words and spatial extensions for land-use classification. In Proceedings of the 18th ACM SIGSPATIAL International Symposium on Advances in Geographic Information Systems, ACM-GIS 2010, November 3-5, 2010, San Jose, CA, USA, Proceedings; Agrawal, D.; Zhang, P.; Abbadi, A.E.; Mokbel, M.F., Eds. ACM, 2010, pp. 270–279. [CrossRef]
- Dai, D.; Yang, W. Satellite Image Classification via Two-Layer Sparse Coding With Biased Image Representation. IEEE Geoscience and Remote Sensing Letters 2011, 8, 173–176. [CrossRef]
- Wang, Z.; Bovik, A.; Sheikh, H.; Simoncelli, E. Image quality assessment: from error visibility to structural similarity. IEEE Transactions on Image Processing 2004, 13, 600–612. [CrossRef]
- Yuhas, R.; Goetz, A.; Boardman, J. Discrimination among semi-arid landscape endmembers using the Spectral Angle Mapper (SAM) algorithm 1992.
- Mittal, A.; Soundararajan, R.; Bovik, A.C. Making a “Completely Blind” Image Quality Analyzer. IEEE Signal Processing Letters 2013, 20, 209–212. [CrossRef]
- Zhang, R.; Isola, P.; Efros, A.A.; Shechtman, E.; Wang, O. The Unreasonable Effectiveness of Deep Features as a Perceptual Metric. In Proceedings of the Proceedings of the IEEE Conference on Computer Vision and Pattern Recognition (CVPR), June 2018.
- Gu, J.; Dong, C. Interpreting Super-Resolution Networks with Local Attribution Maps. In Proceedings of the Computer Vision and Pattern Recognition, 2021.
- Sundararajan, M.; Taly, A.; Yan, Q. Axiomatic Attribution for Deep Networks. In Proceedings of the Proceedings of the 34th International Conference on Machine Learning; Precup, D.; Teh, Y.W., Eds. PMLR, 06–11 Aug 2017, Vol. 70, Proceedings of Machine Learning Research, pp. 3319–3328.
- Glorot, X.; Bordes, A.; Bengio, Y. Deep Sparse Rectifier Neural Networks. In Proceedings of the International Conference on Artificial Intelligence and Statistics, 2011.
- Hendrycks, D.; Gimpel, K. Gaussian Error Linear Units (GELUs), 2023, [arXiv:cs.LG/1606.08415].
Figure 1.
Effective receptive field (ERF) visualizations [15] demonstrating SIMSR’s enhanced global coverage versus constrained patterns in prior efficient models.
Figure 1.
Effective receptive field (ERF) visualizations [15] demonstrating SIMSR’s enhanced global coverage versus constrained patterns in prior efficient models.
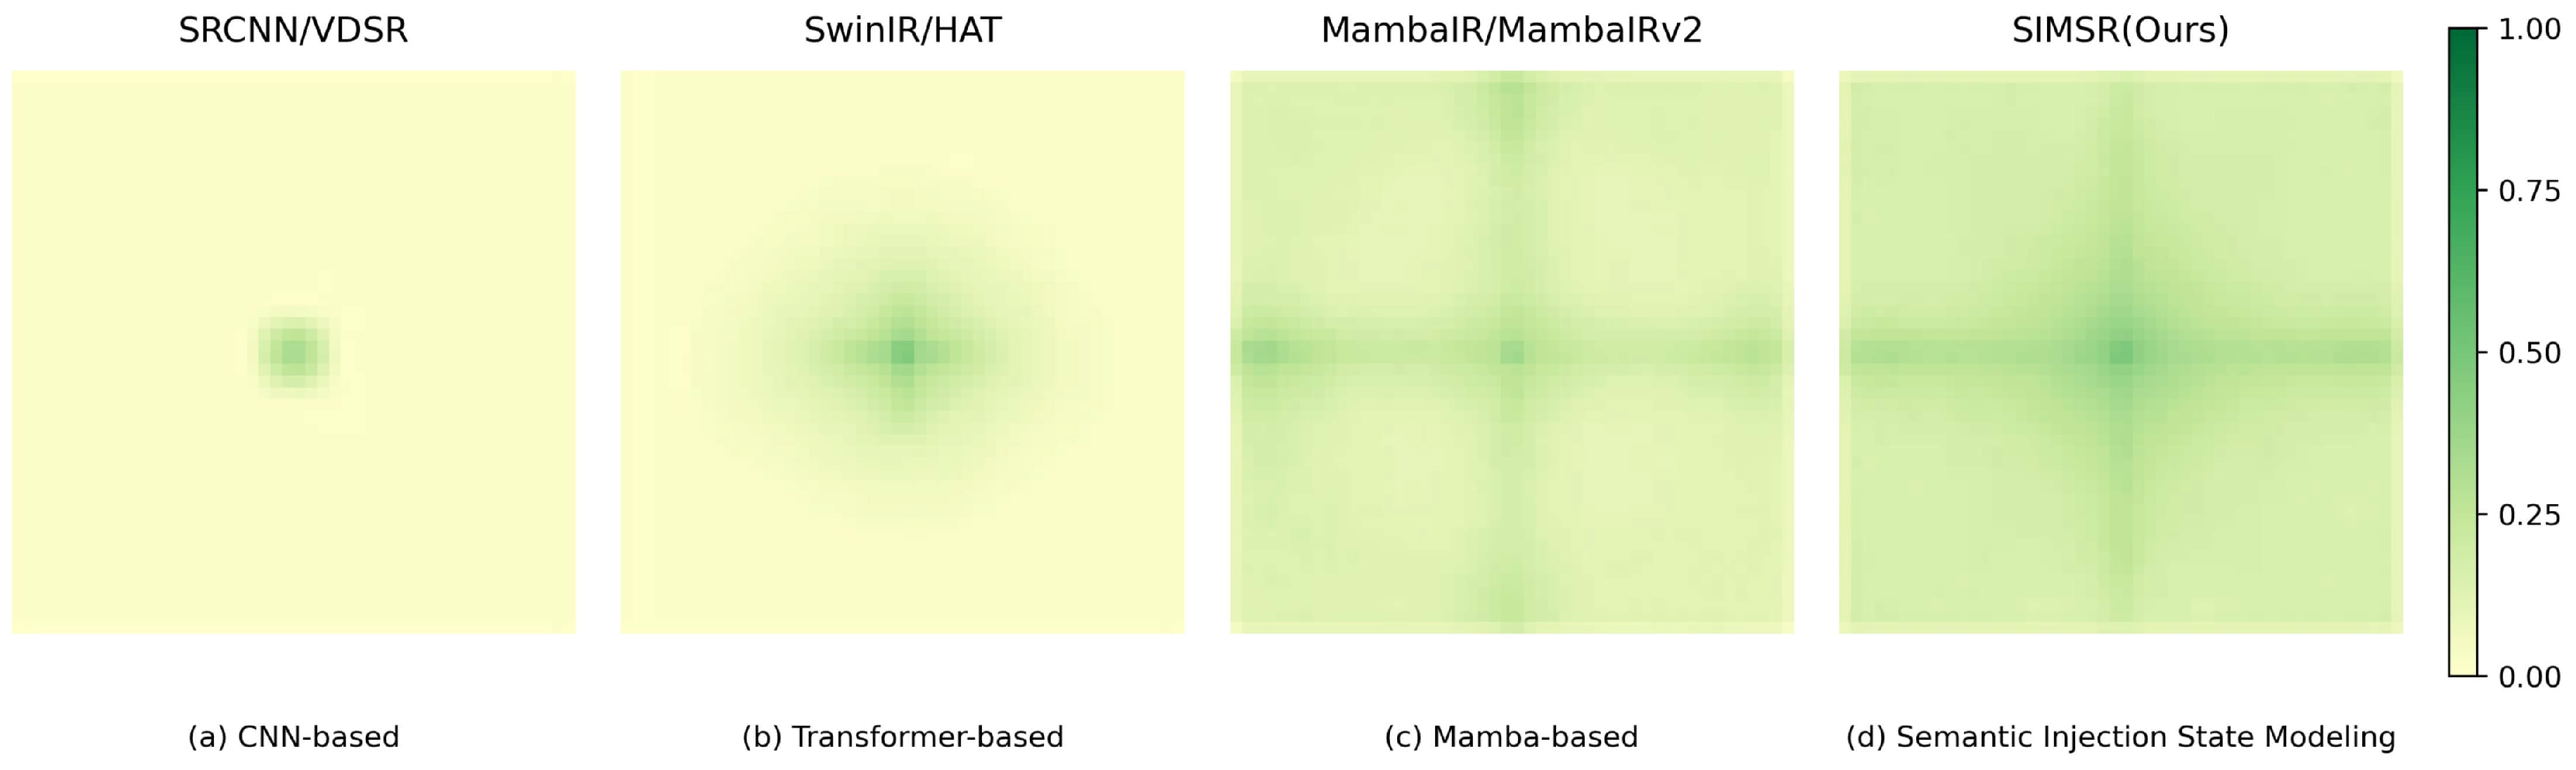
Figure 2.
Architecture of the 2D State Modeling Mechanism integrating quad-directional scanning paths and state fusion
Figure 2.
Architecture of the 2D State Modeling Mechanism integrating quad-directional scanning paths and state fusion
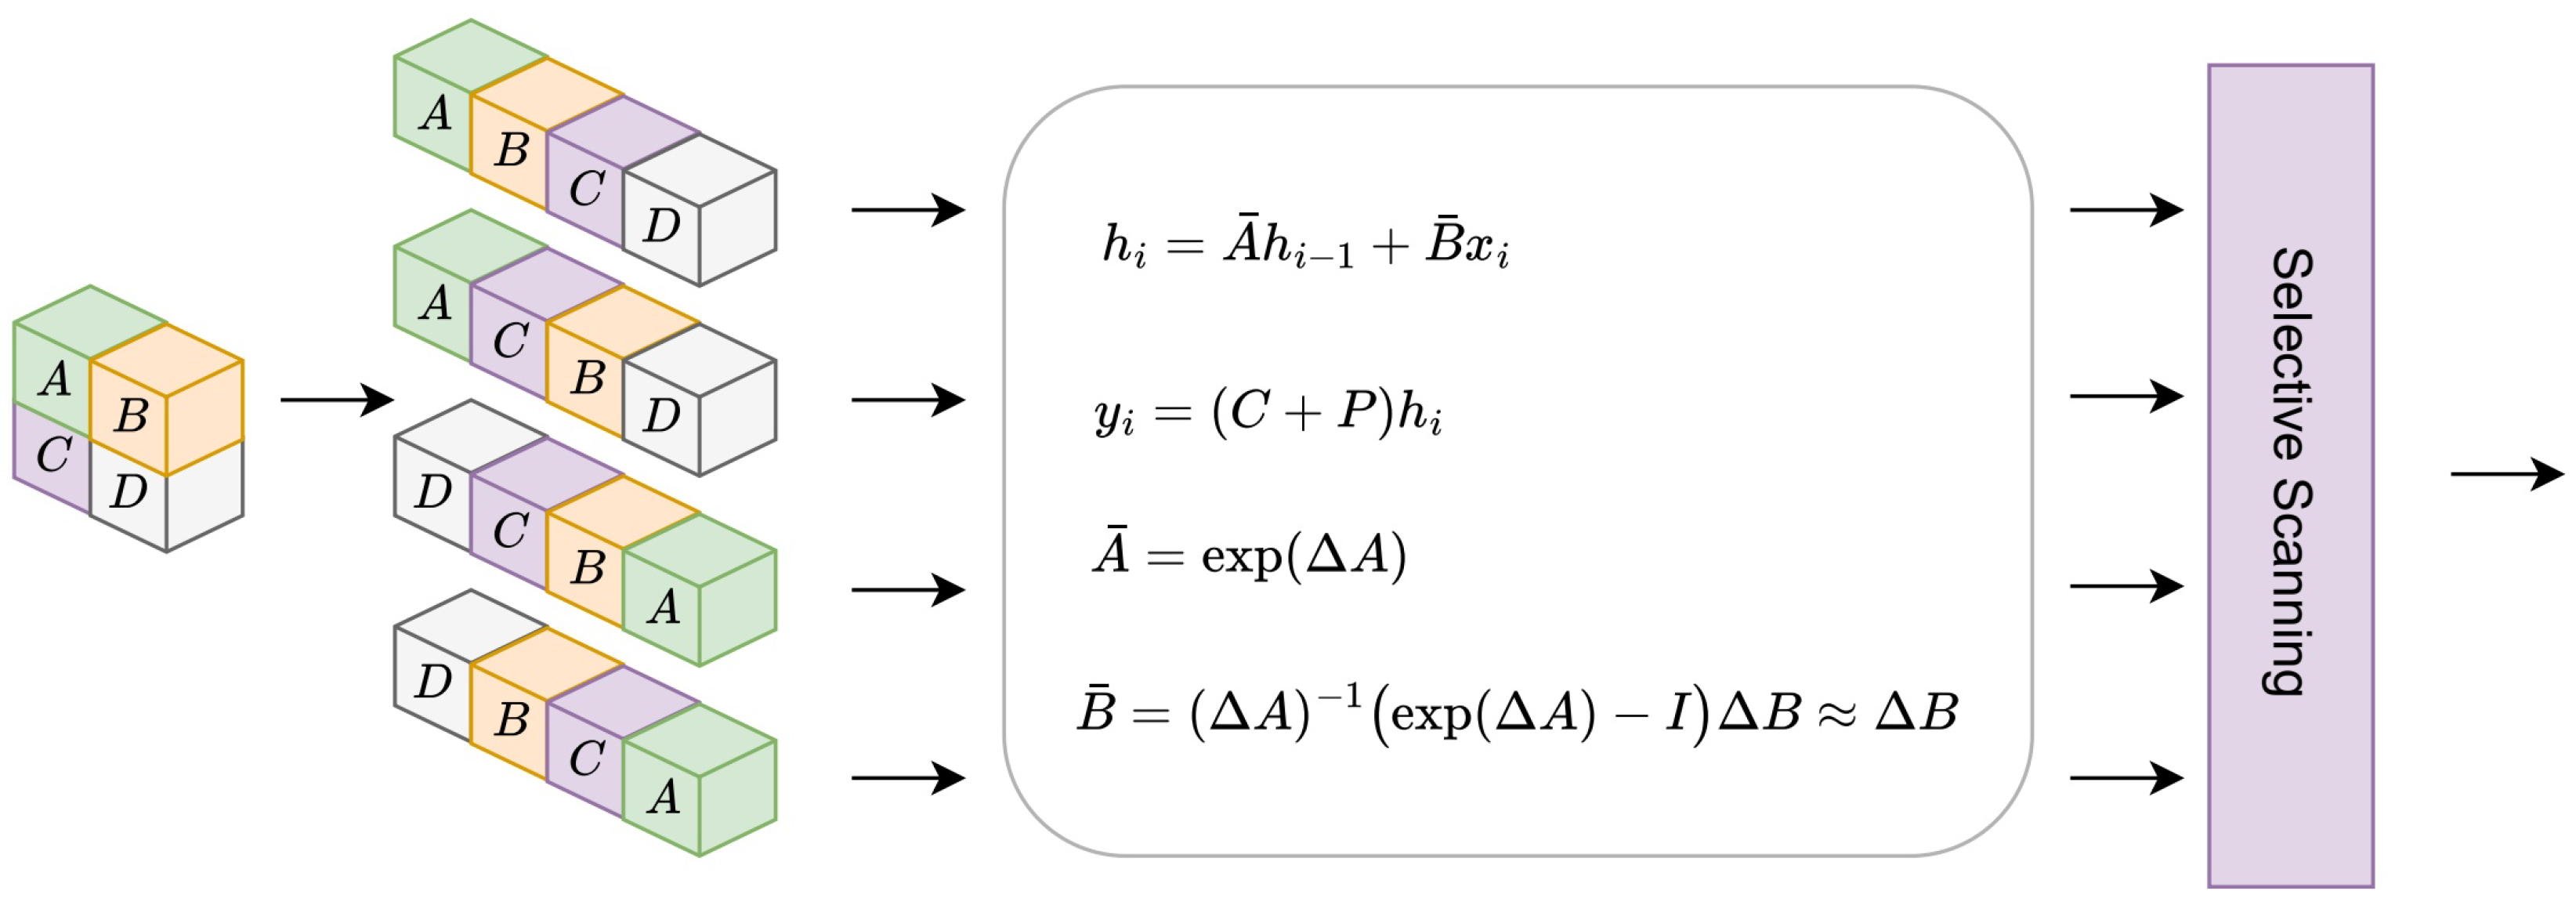
Figure 3.
Structure of SISM, which is a component of the SISG.
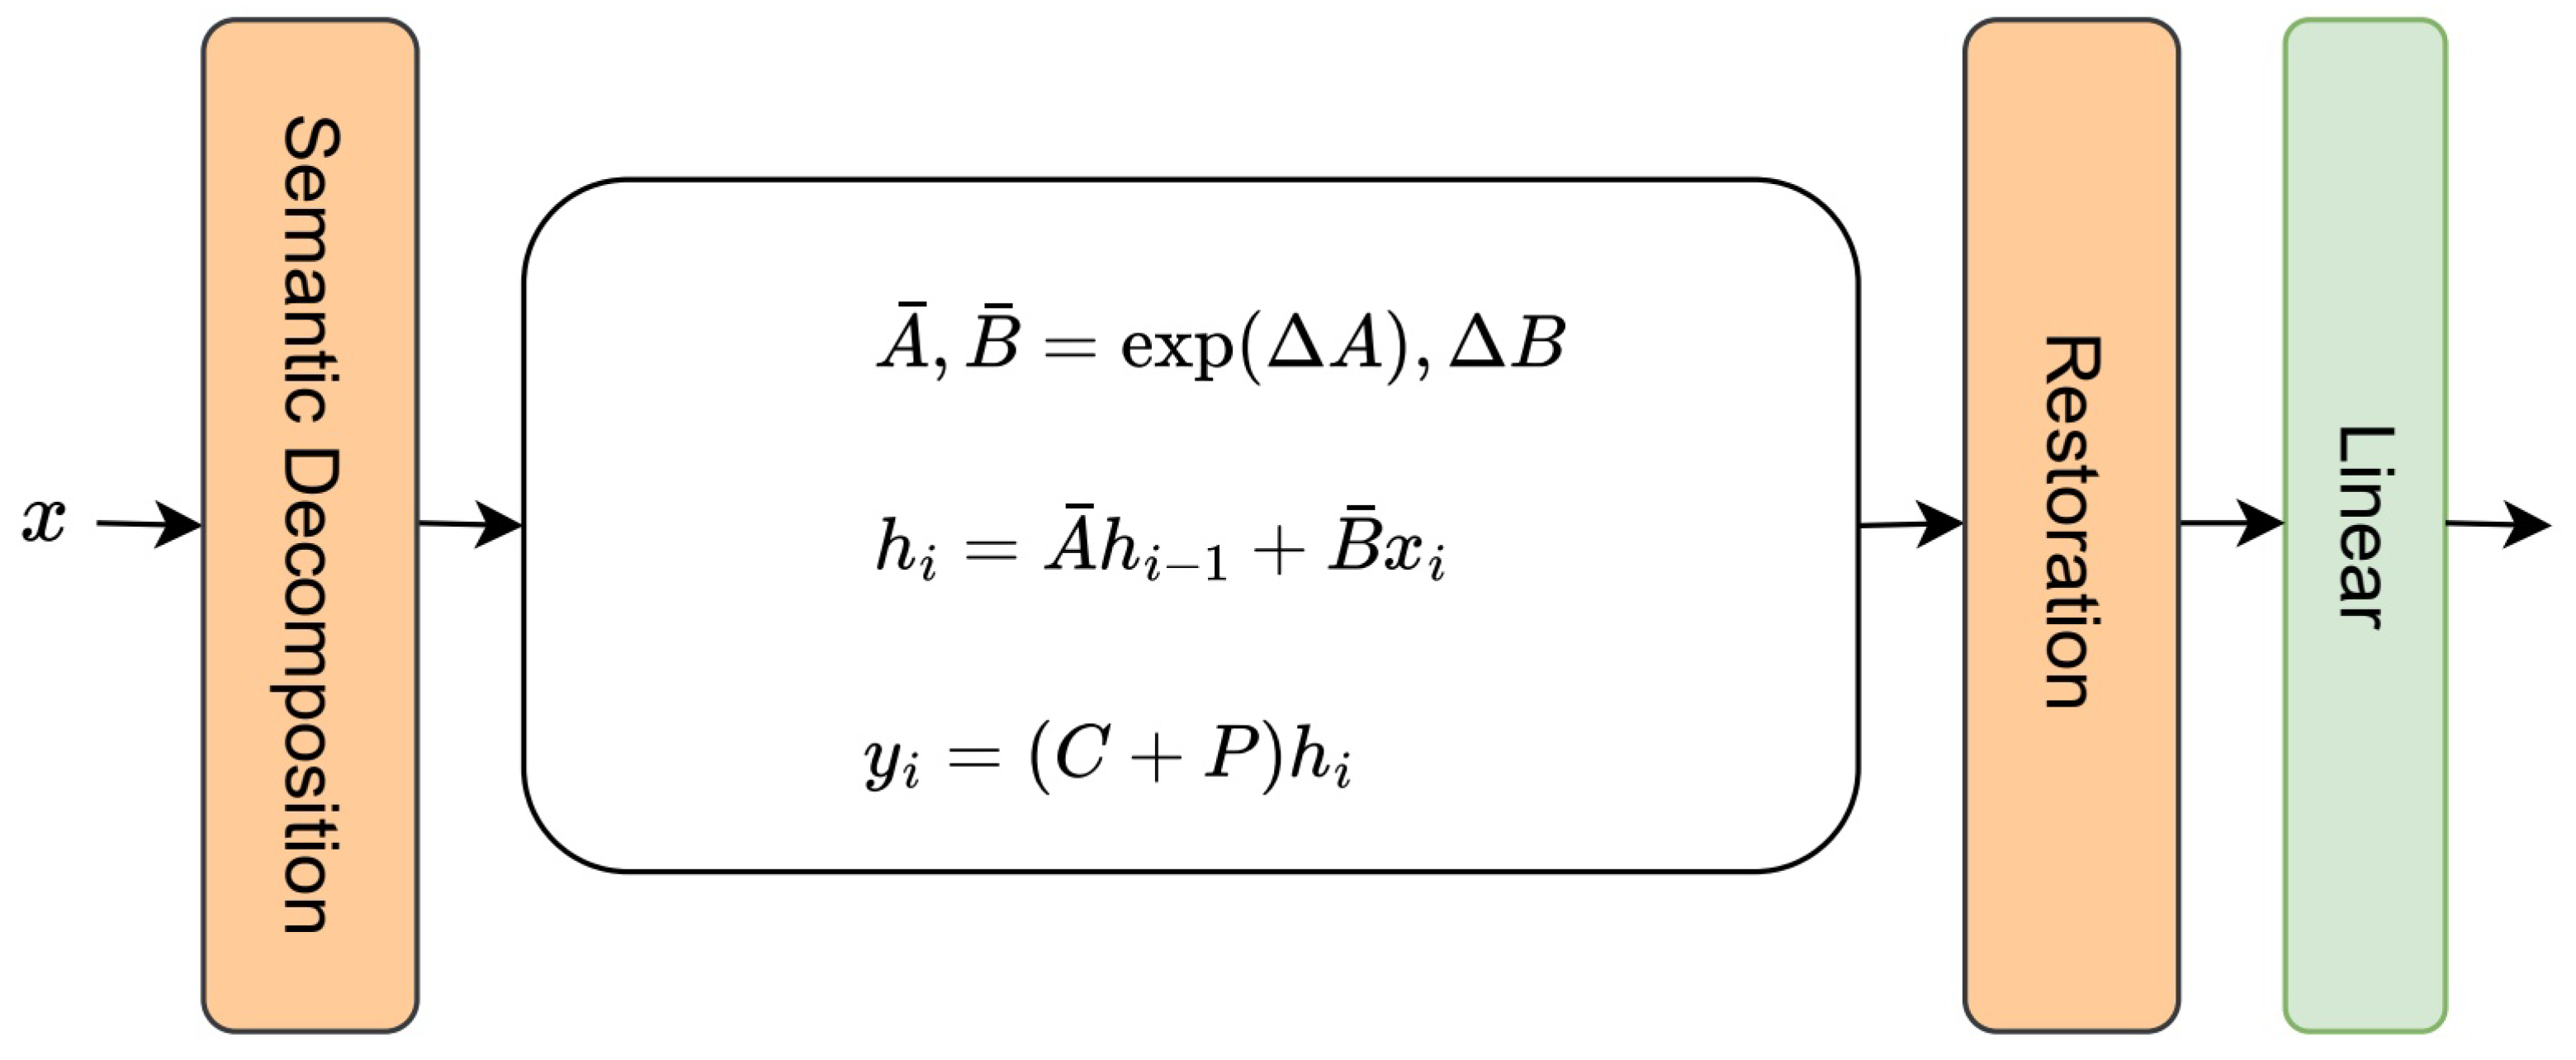
Figure 4.
Comparison of image processing effects before and after semantic decomposition.
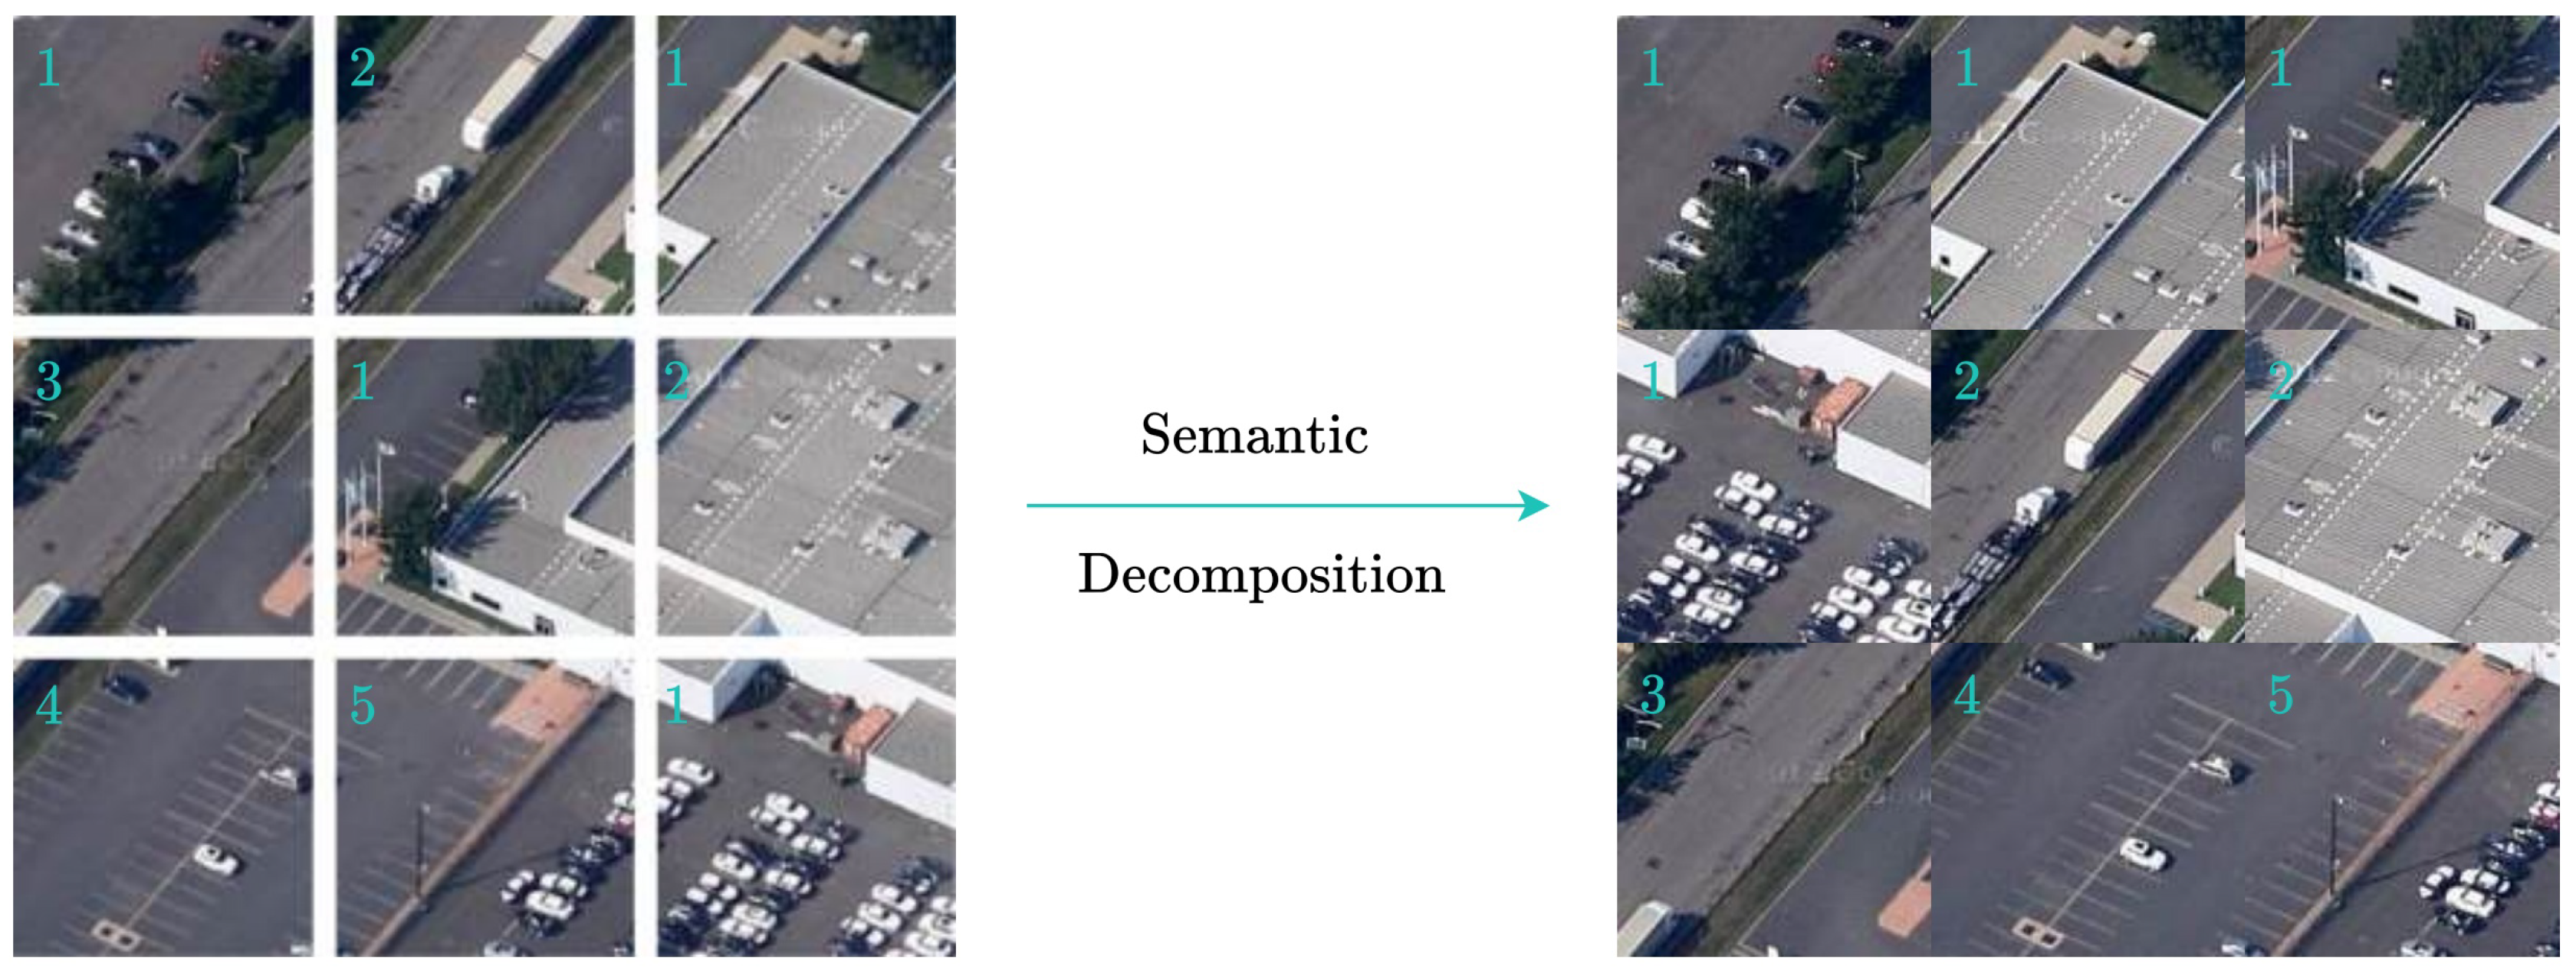
Figure 5.
The overall architecture of our proposed framework showing (a) the feature extraction module, (b) the attention mechanism, and (c) the reconstruction network. The dashed lines represent skip connections that preserve low-level features.
Figure 5.
The overall architecture of our proposed framework showing (a) the feature extraction module, (b) the attention mechanism, and (c) the reconstruction network. The dashed lines represent skip connections that preserve low-level features.
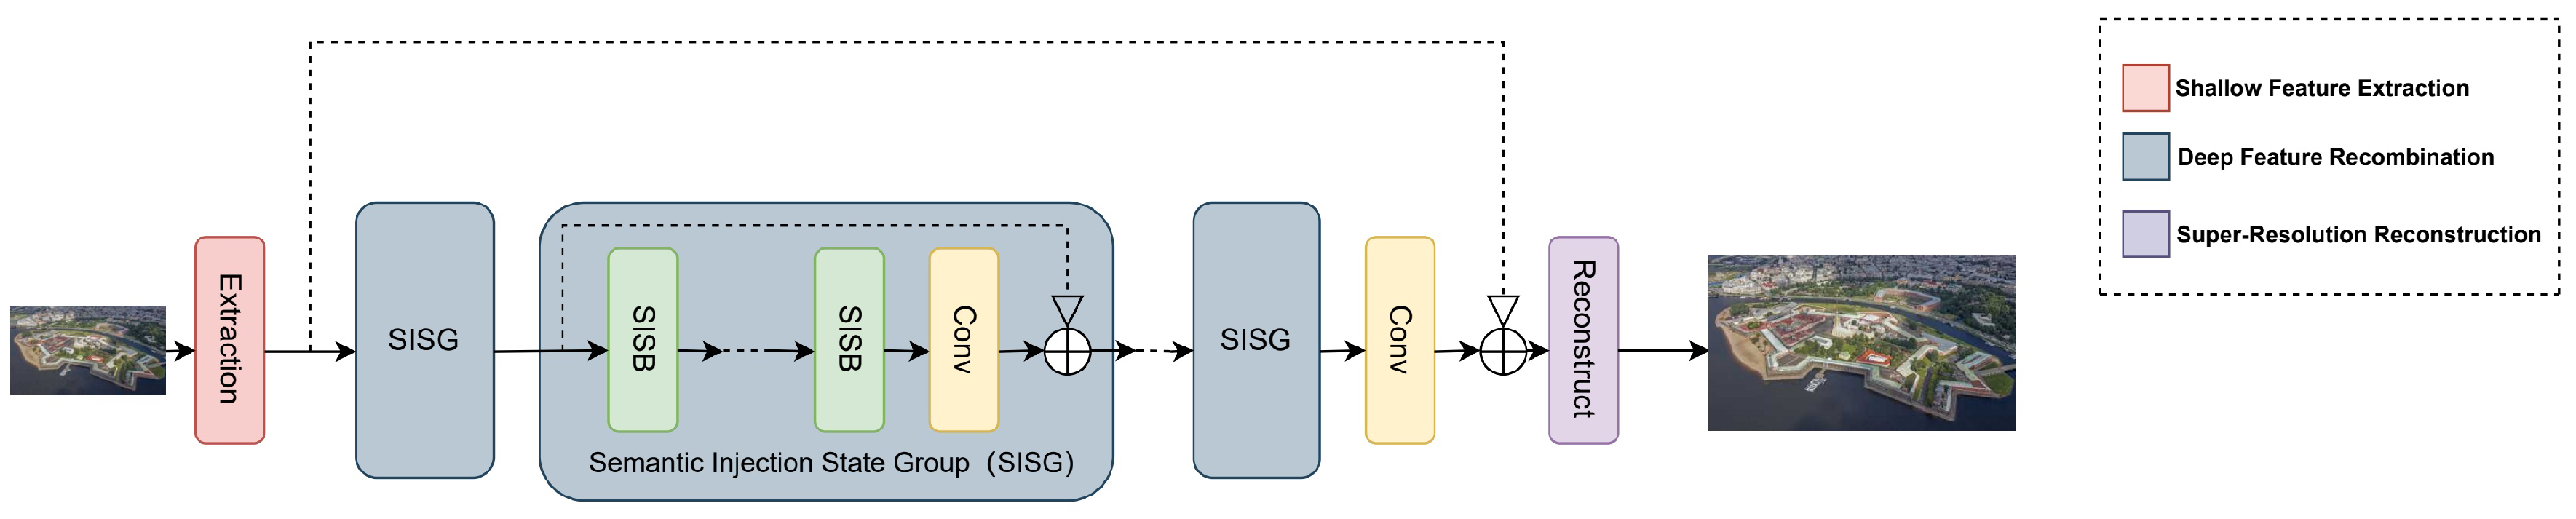
Figure 7.
Illustrated Comparison of Uni-Shift, Quad-Shift and Omni-Shift.
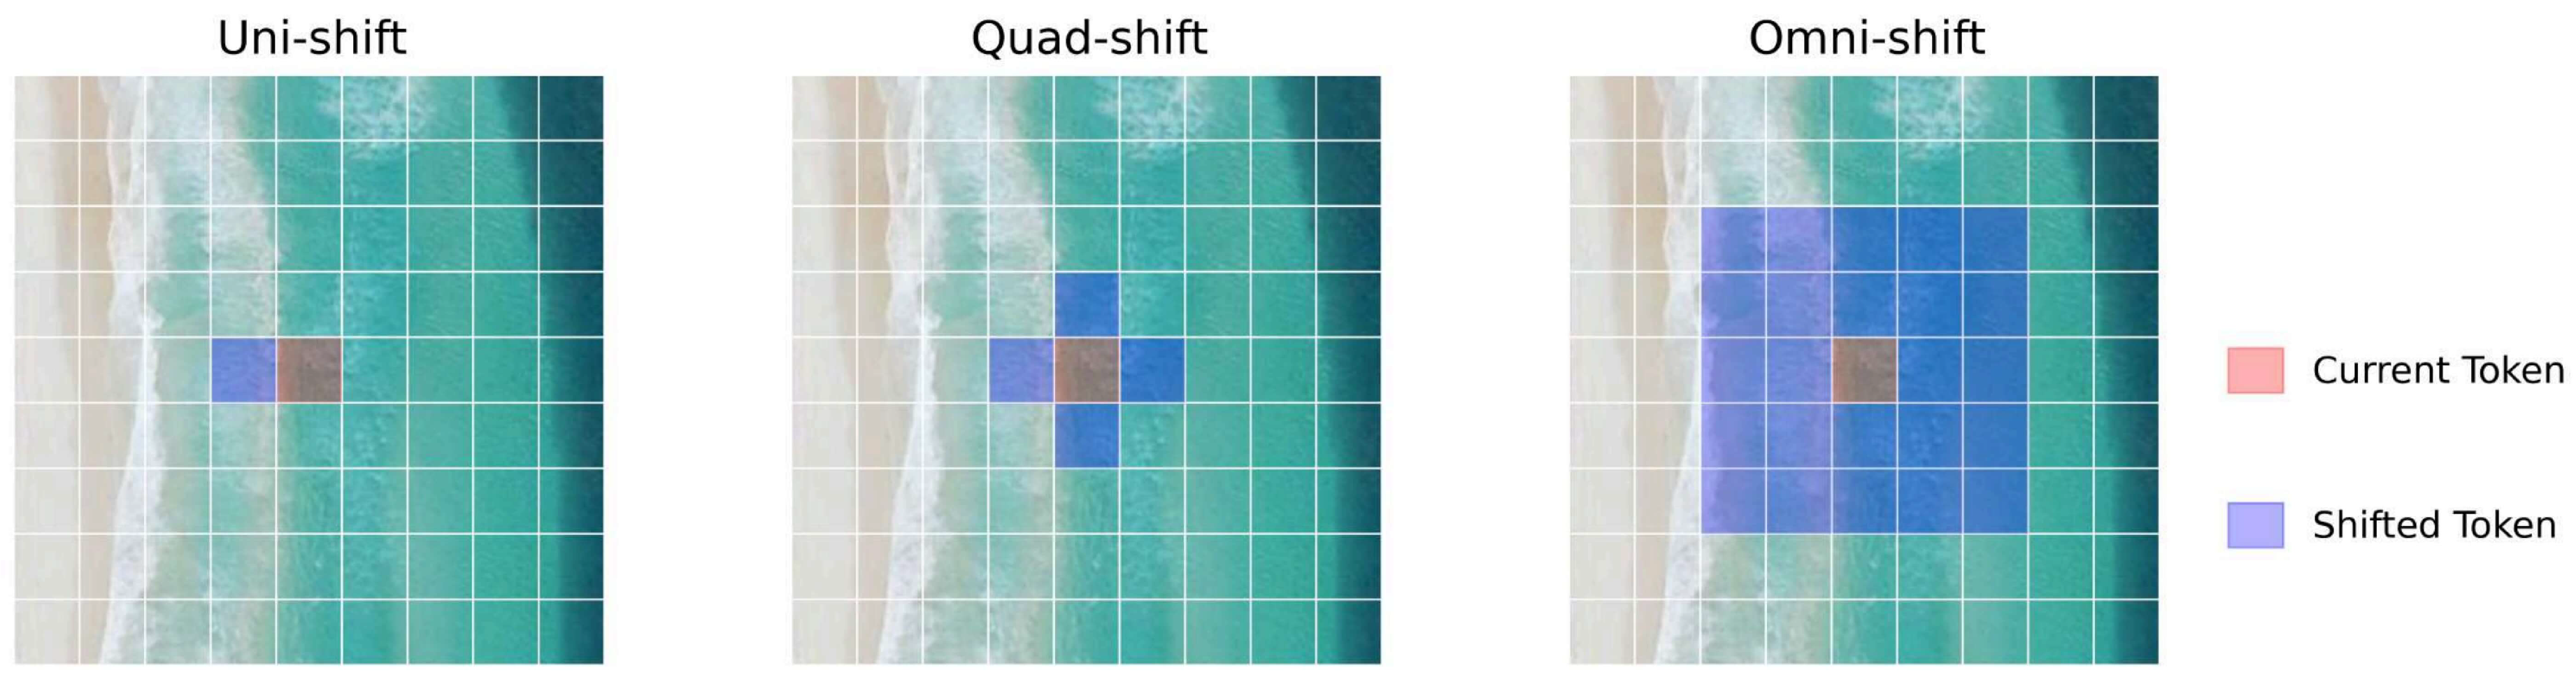
Figure 10.
Illustration of the remote sensing datasets utilized in this study, emphasizing landscapes relevant to UAV-based ecological monitoring such as wetlands, agricultural fields, and protected ecosystems.
Figure 10.
Illustration of the remote sensing datasets utilized in this study, emphasizing landscapes relevant to UAV-based ecological monitoring such as wetlands, agricultural fields, and protected ecosystems.
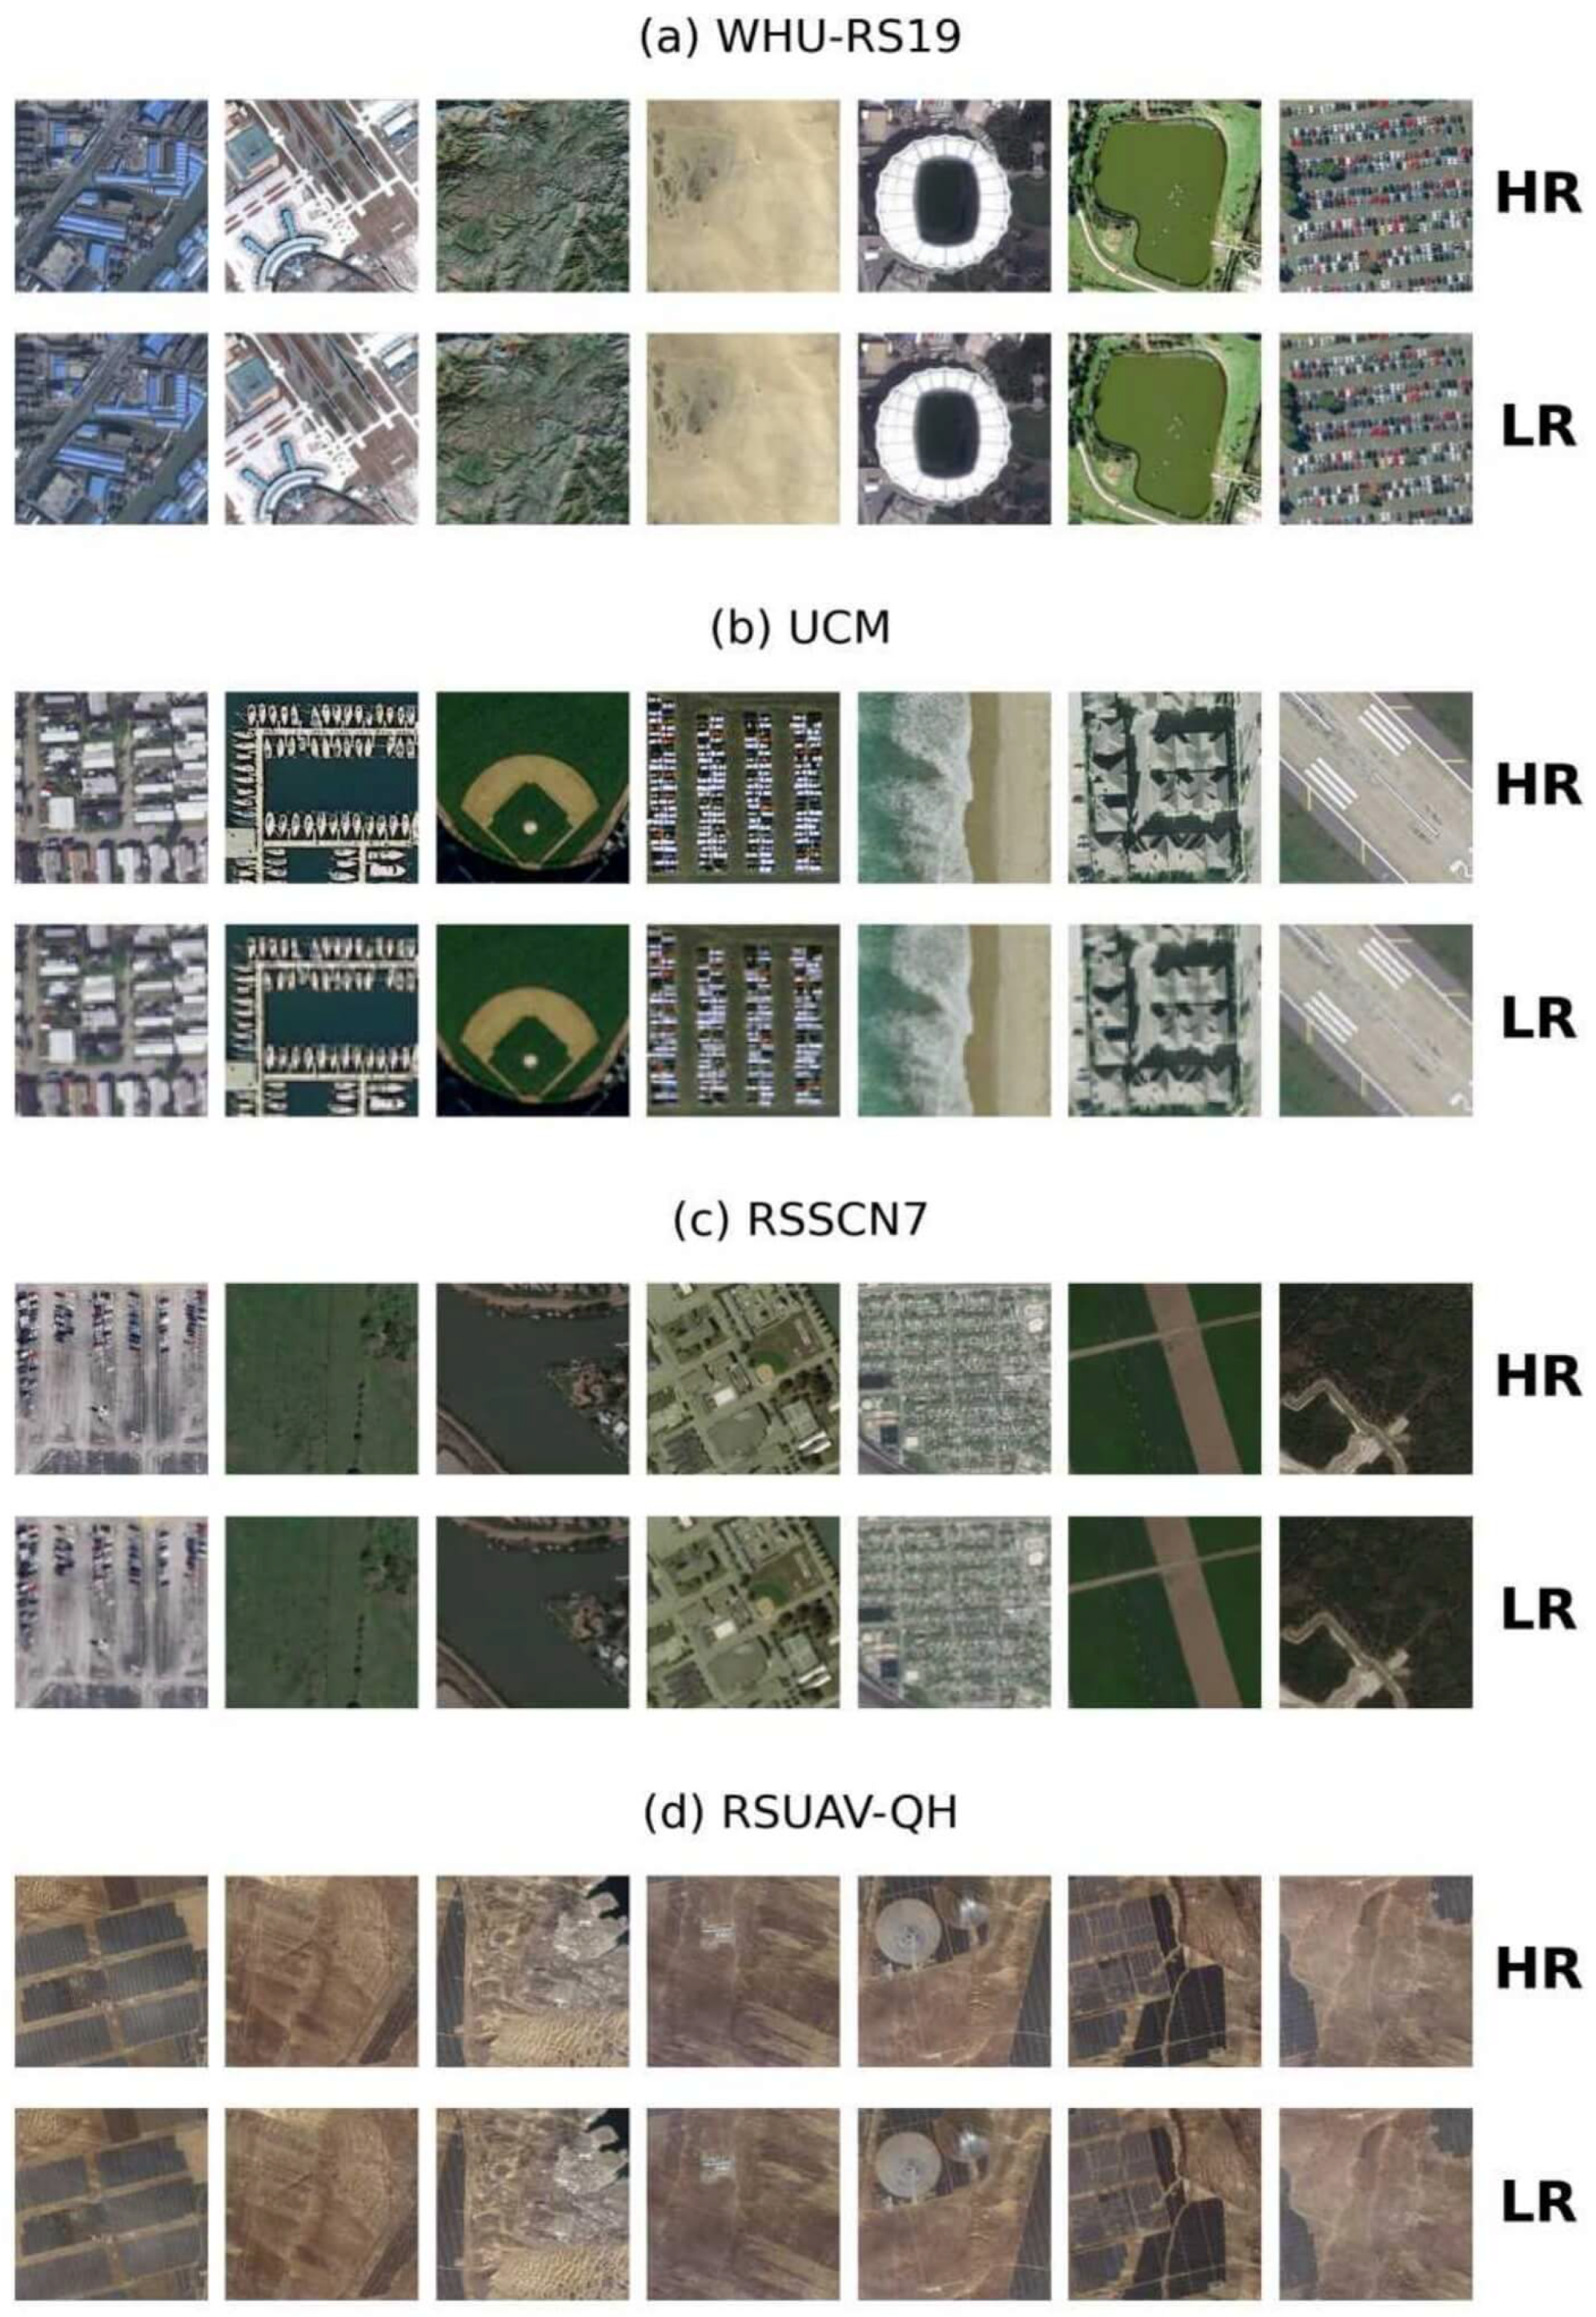
Figure 11.
Qualitative comparison results for RSSCN7, UCM, WHU-RS19 and RSUAV-QH dataset.
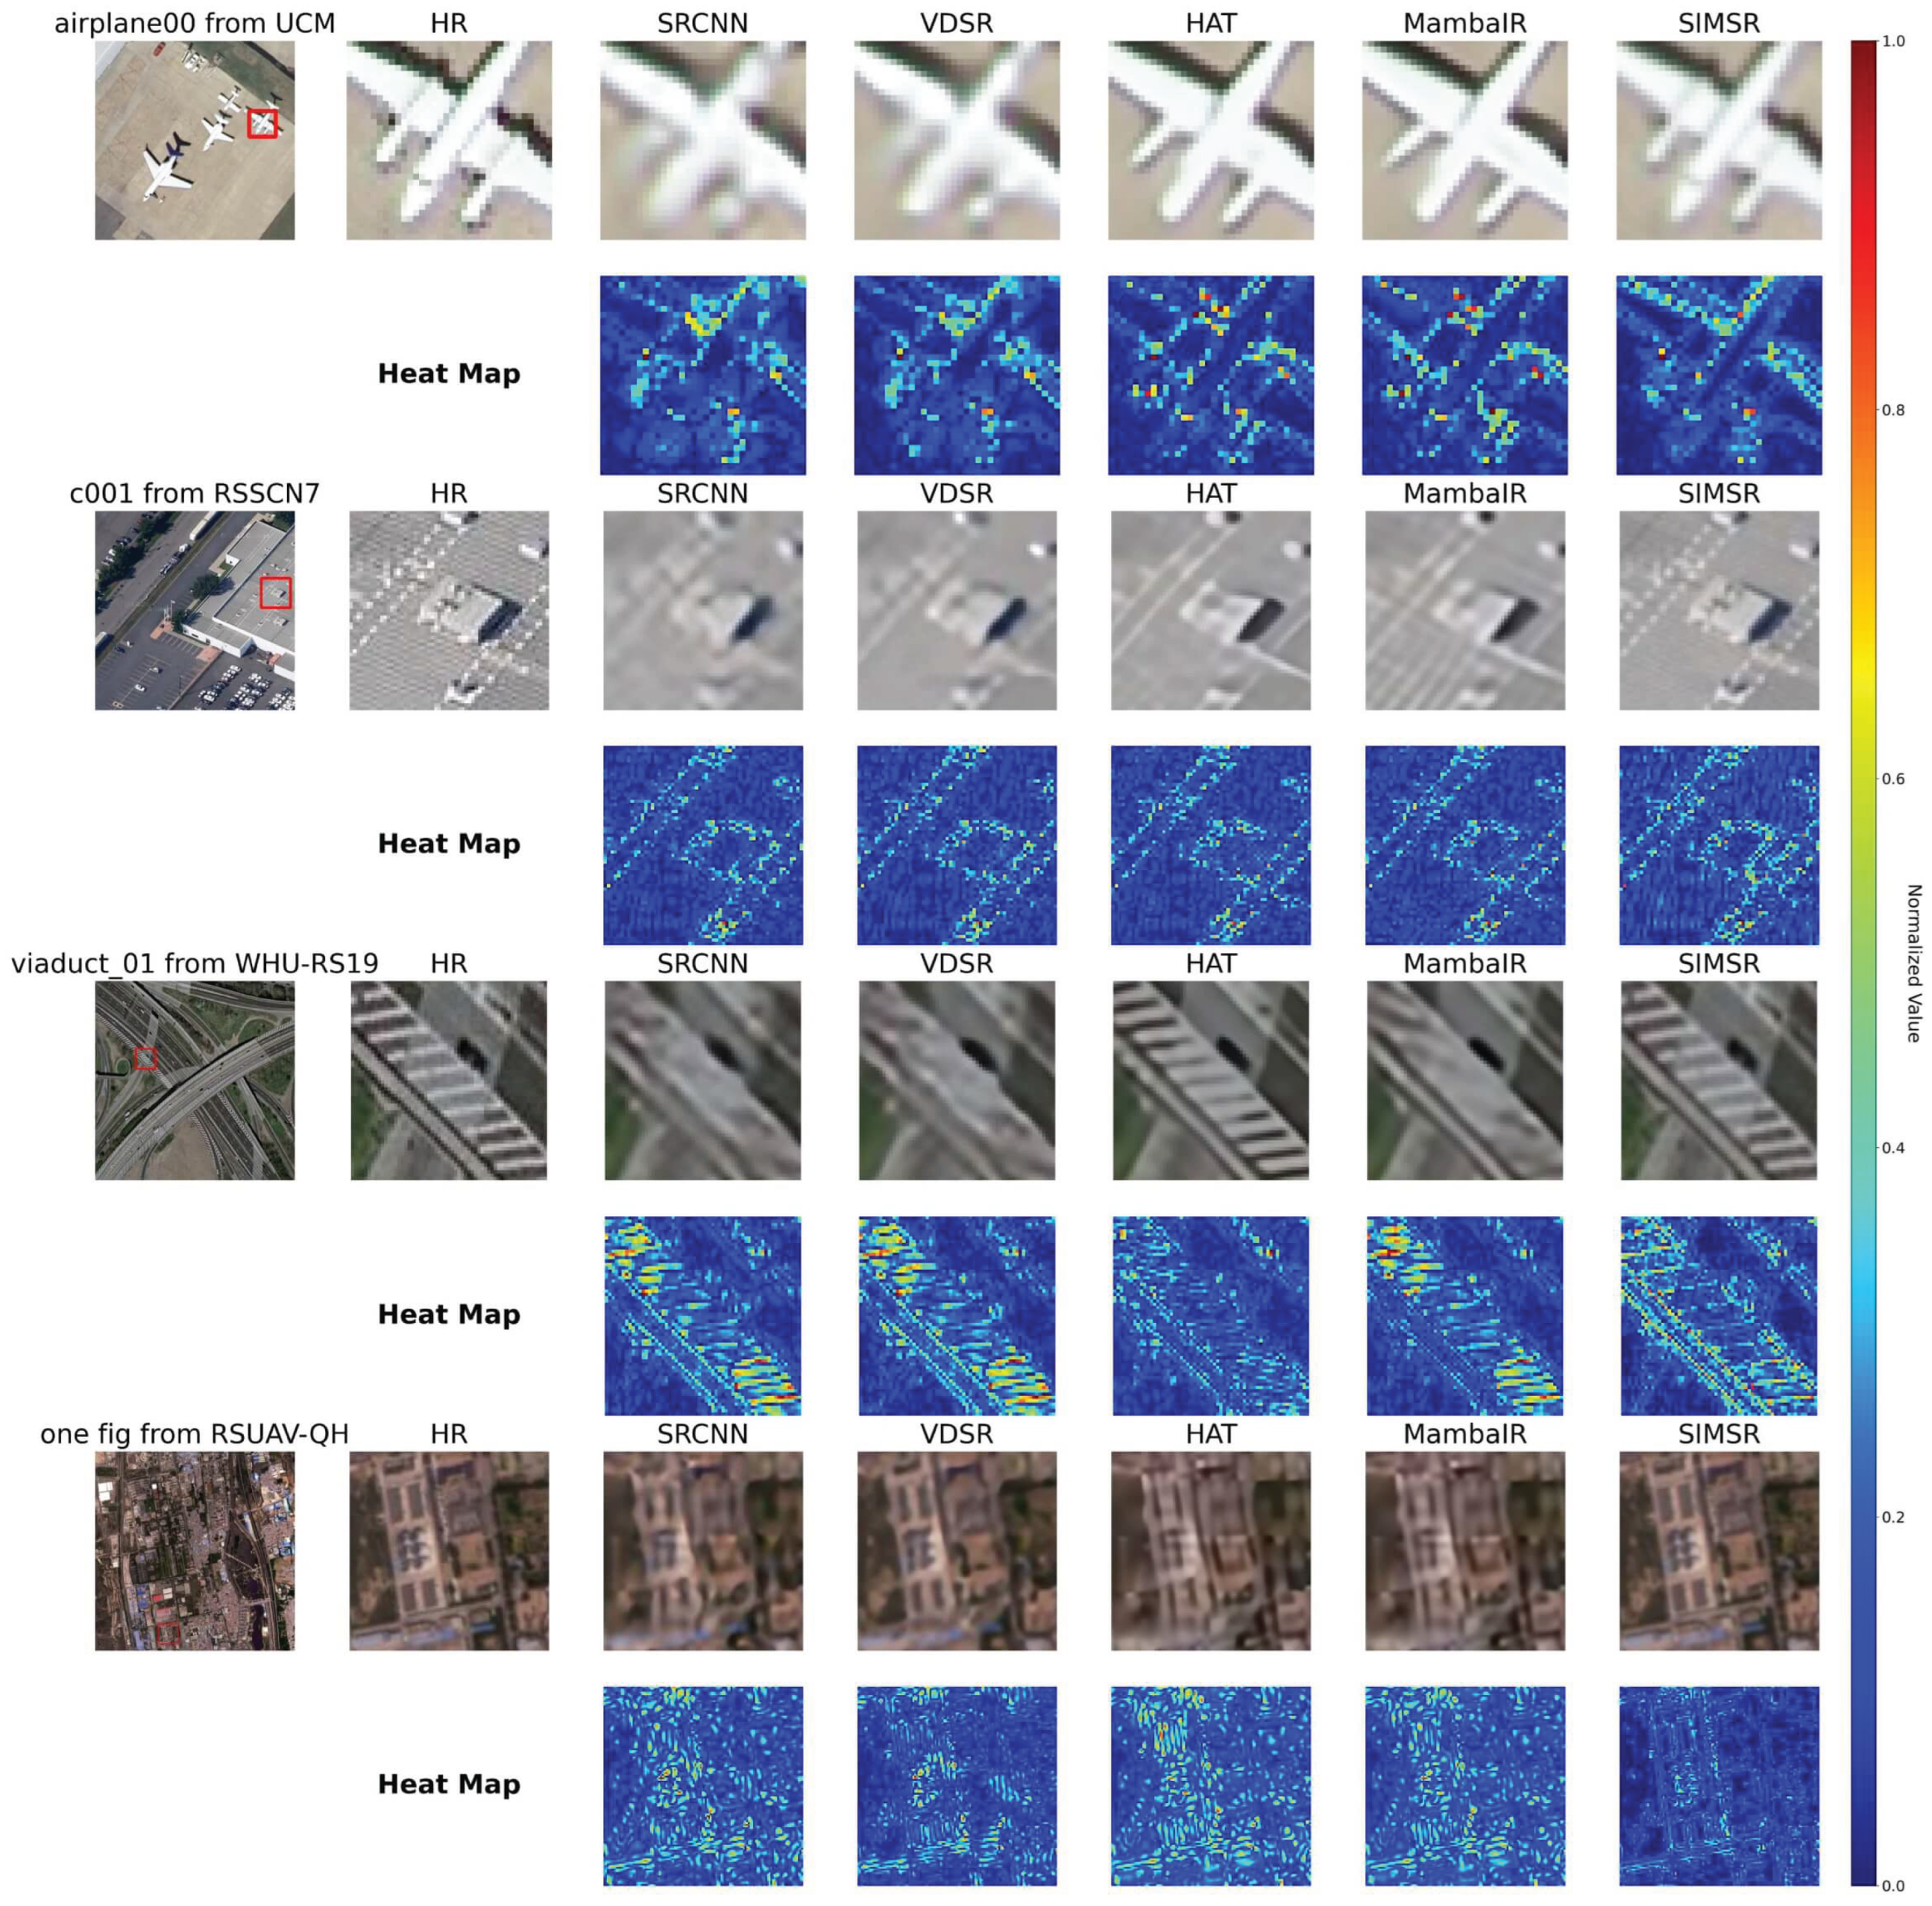
Table 3.
Hardware-aware optimization gains for UAV image processing
| Implementation | FLOPs (G) | Training | Inference |
|---|---|---|---|
| Naive PyTorch | 89.23 | 12h 23m | 1h 21m 10s |
| Triton (Element-wise, FP32) | 71.23 | 4h 56m | 17m 57s |
| Triton (Element-wise, BF16) | 71.23 | 4h 45m | 13m 50s |
| SIMSR (Chunk-wise, BF16) | 60.78 | 1h 25m | 7m 29s |
Table 4.
UAV super-resolution efficiency comparison
| Method | FLOPs (G) | Training | Inference | Params (M) |
|---|---|---|---|---|
| SwinIR [17] | 154.95 | 5h 23m | 28m 10s | 2.78 |
| HAT [31] | 142.95 | 4h 56m | 27m 57s | 2.82 |
| MambaIR [39] | 121.34 | 4h 45m | 23m 50s | 2.87 |
| MambaIRv2 [40] | 132.34 | 5h 1m | 25m 12s | 2.92 |
| SIMSR | 60.78 | 1h 25m | 7m 29s | 2.12 |
Table 5.
Memory efficiency for UAV large-scale processing
| Model | L2 Hit Rate (%) | Memory Reads (GB/s) |
|---|---|---|
| SwinIR | 41.2 | 210 |
| HAT | 44.7 | 204 |
| MambaIR | 48.5 | 164 |
| MambaIRv2 | 54.1 | 169 |
| SIMSR | 86.7 | 78 |
Table 6.
Incremental Contribution Analysis of SIMSR Components. Semantic Decomp. is short for Semantic Decomposition
Table 6.
Incremental Contribution Analysis of SIMSR Components. Semantic Decomp. is short for Semantic Decomposition
| Components | Omni-Shift | SISM Backbone | Semantic Decomp. | 2D Scan | PSNR ↑ | SSIM ↑ |
|---|---|---|---|---|---|---|
| Baseline | 25.82 | 0.712 | ||||
| + Channel Attention + Omni-Shift | ✓ | 26.35 | 0.7304 | |||
| + SISM Backbone | ✓ | ✓ | 26.61 | 0.8479 | ||
| + Semantic Decomposition | ✓ | ✓ | ✓ | 30.77 | 0.8574 | |
| Full Model (SIMSR) | ✓ | ✓ | ✓ | ✓ | 31.21 | 0.8962 |
Disclaimer/Publisher’s Note: The statements, opinions and data contained in all publications are solely those of the individual author(s) and contributor(s) and not of MDPI and/or the editor(s). MDPI and/or the editor(s) disclaim responsibility for any injury to people or property resulting from any ideas, methods, instructions or products referred to in the content. |
© 2025 by the authors. Licensee MDPI, Basel, Switzerland. This article is an open access article distributed under the terms and conditions of the Creative Commons Attribution (CC BY) license (http://creativecommons.org/licenses/by/4.0/).
Copyright: This open access article is published under a Creative Commons CC BY 4.0 license, which permit the free download, distribution, and reuse, provided that the author and preprint are cited in any reuse.


