
Submitted:
23 July 2025
Posted:
24 July 2025
You are already at the latest version
Abstract
This study aimed to analyze user perceptions of the Netflix mobile app by combining sentiment analysis and statistical modeling. A total of 13,500 reviews were scraped from the Google Play Store using Python, then processed and analyzed in R. Sentiment scores were computed using the Syuzhet package, and key patterns were visualized through word clouds and emotion plots. Spearman correlation, ordinal logistic regression, and multinomial logistic regression were used to examine relationships between sentiment, star ratings, and thumbs-up counts. Results showed that 61.89% of reviews were positive, with “good,” “love,” and “awesome” as dominant emotions. Sentiment scores were strong predictors of user ratings, while thumbs-up counts were slightly associated with critical reviews. In conclusion, combining sentiment and statistical methods provides deeper insight into user satisfaction, with emotionally detailed reviews—both positive and negative—drawing more engagement.
Keywords:
sentiment analysis
; Netflix
; reviews
1. Introduction
The technological innovation for online streaming services has transformed the way audiences’ access and engage with content, enabling seamless, on-demand viewing across a wide range of devices. Features such as adaptive streaming, personalized recommendations, offline downloads, and artificial intelligence (AI) data-driven technologies that personalize consumer–brand interactions across curated touchpoints [4]. As a result, platforms like Netflix have reshaped media consumption habits globally, creating new expectations for content delivery, quality, and interactivity.
Netflix today is one of the world most popular platforms for on-demand streaming entertainment, with millions of users across the globe with over 13, 370, 730 downloads on google play store. Its expansive library of movies, series, documentaries, and original content has redefined how audiences consume media—reflected in its extensive collection of over 8,000 titles and a subscriber base exceeding 200 million by mid-2021 [13]—has redefined how audiences consume media. These advancements not only improve user experience but also shape expectations in an increasingly competitive digital media environment [12] [2]. As Netflix continues to evolve in a highly competitive digital ecosystem, understanding user feedback has become increasingly vital not just for improving services, but also for shaping content strategies, marketing approaches and customer satisfaction efforts. The User reviews on platforms such as Google Play Store offer a rich source of unstructured data that reflects customer sentiment, expectations, and experiences. While numerical ratings provide a general indicator of satisfaction, they often fail to capture the full nuance of user opinion. Netflix is constantly improving its streaming infrastructure to guarantee a smooth and excellent viewing experience for all of its users, making it essential to understand how such efforts are perceived by the audience [8]. A deeper analysis that combines sentiment analysis of written reviews with statistical modelling techniques can yield more comprehensive insights into user behavior, preferences, and potential service gaps.
This study aims to bridge this gap by performing a combined sentiment and statistical analysis of Netflix user reviews extracted from google play store using the App ID “com.netflix.mediaclient”. Specifically, it examines the emotional tone of reviews using natural language processing tools, identifies mismatches between sentiment and numerical ratings, and employs regression models to explore the relationships between sentiment scores, user ratings, and engagement metrics such as thumbs-up-counts. By integrating both qualitative and quantitative data, this study seeks to uncover patterns that might otherwise be overlooked in traditional review analysis, offering practical implications for platform enhancement and user experience design.
2. Materials and Methods
2.1. Data Collection
User reviews were extracted from the Google Play Store using the google_play_scraper Python module. Integration of Python within the RStudio environment was achieved through the reticulate package [14], which enables seamless interoperability between R and Python. The application ID "com.netflix.mediaclient" was specified to target reviews specifically for the Netflix app. A total of 13,500 reviews were scraped using the reviews_all() function, capturing comprehensive user feedback. Each review entry included key metadata such as the review text, review ID, thumbs-up count, and the date of submission, providing a rich dataset for subsequent analysis.
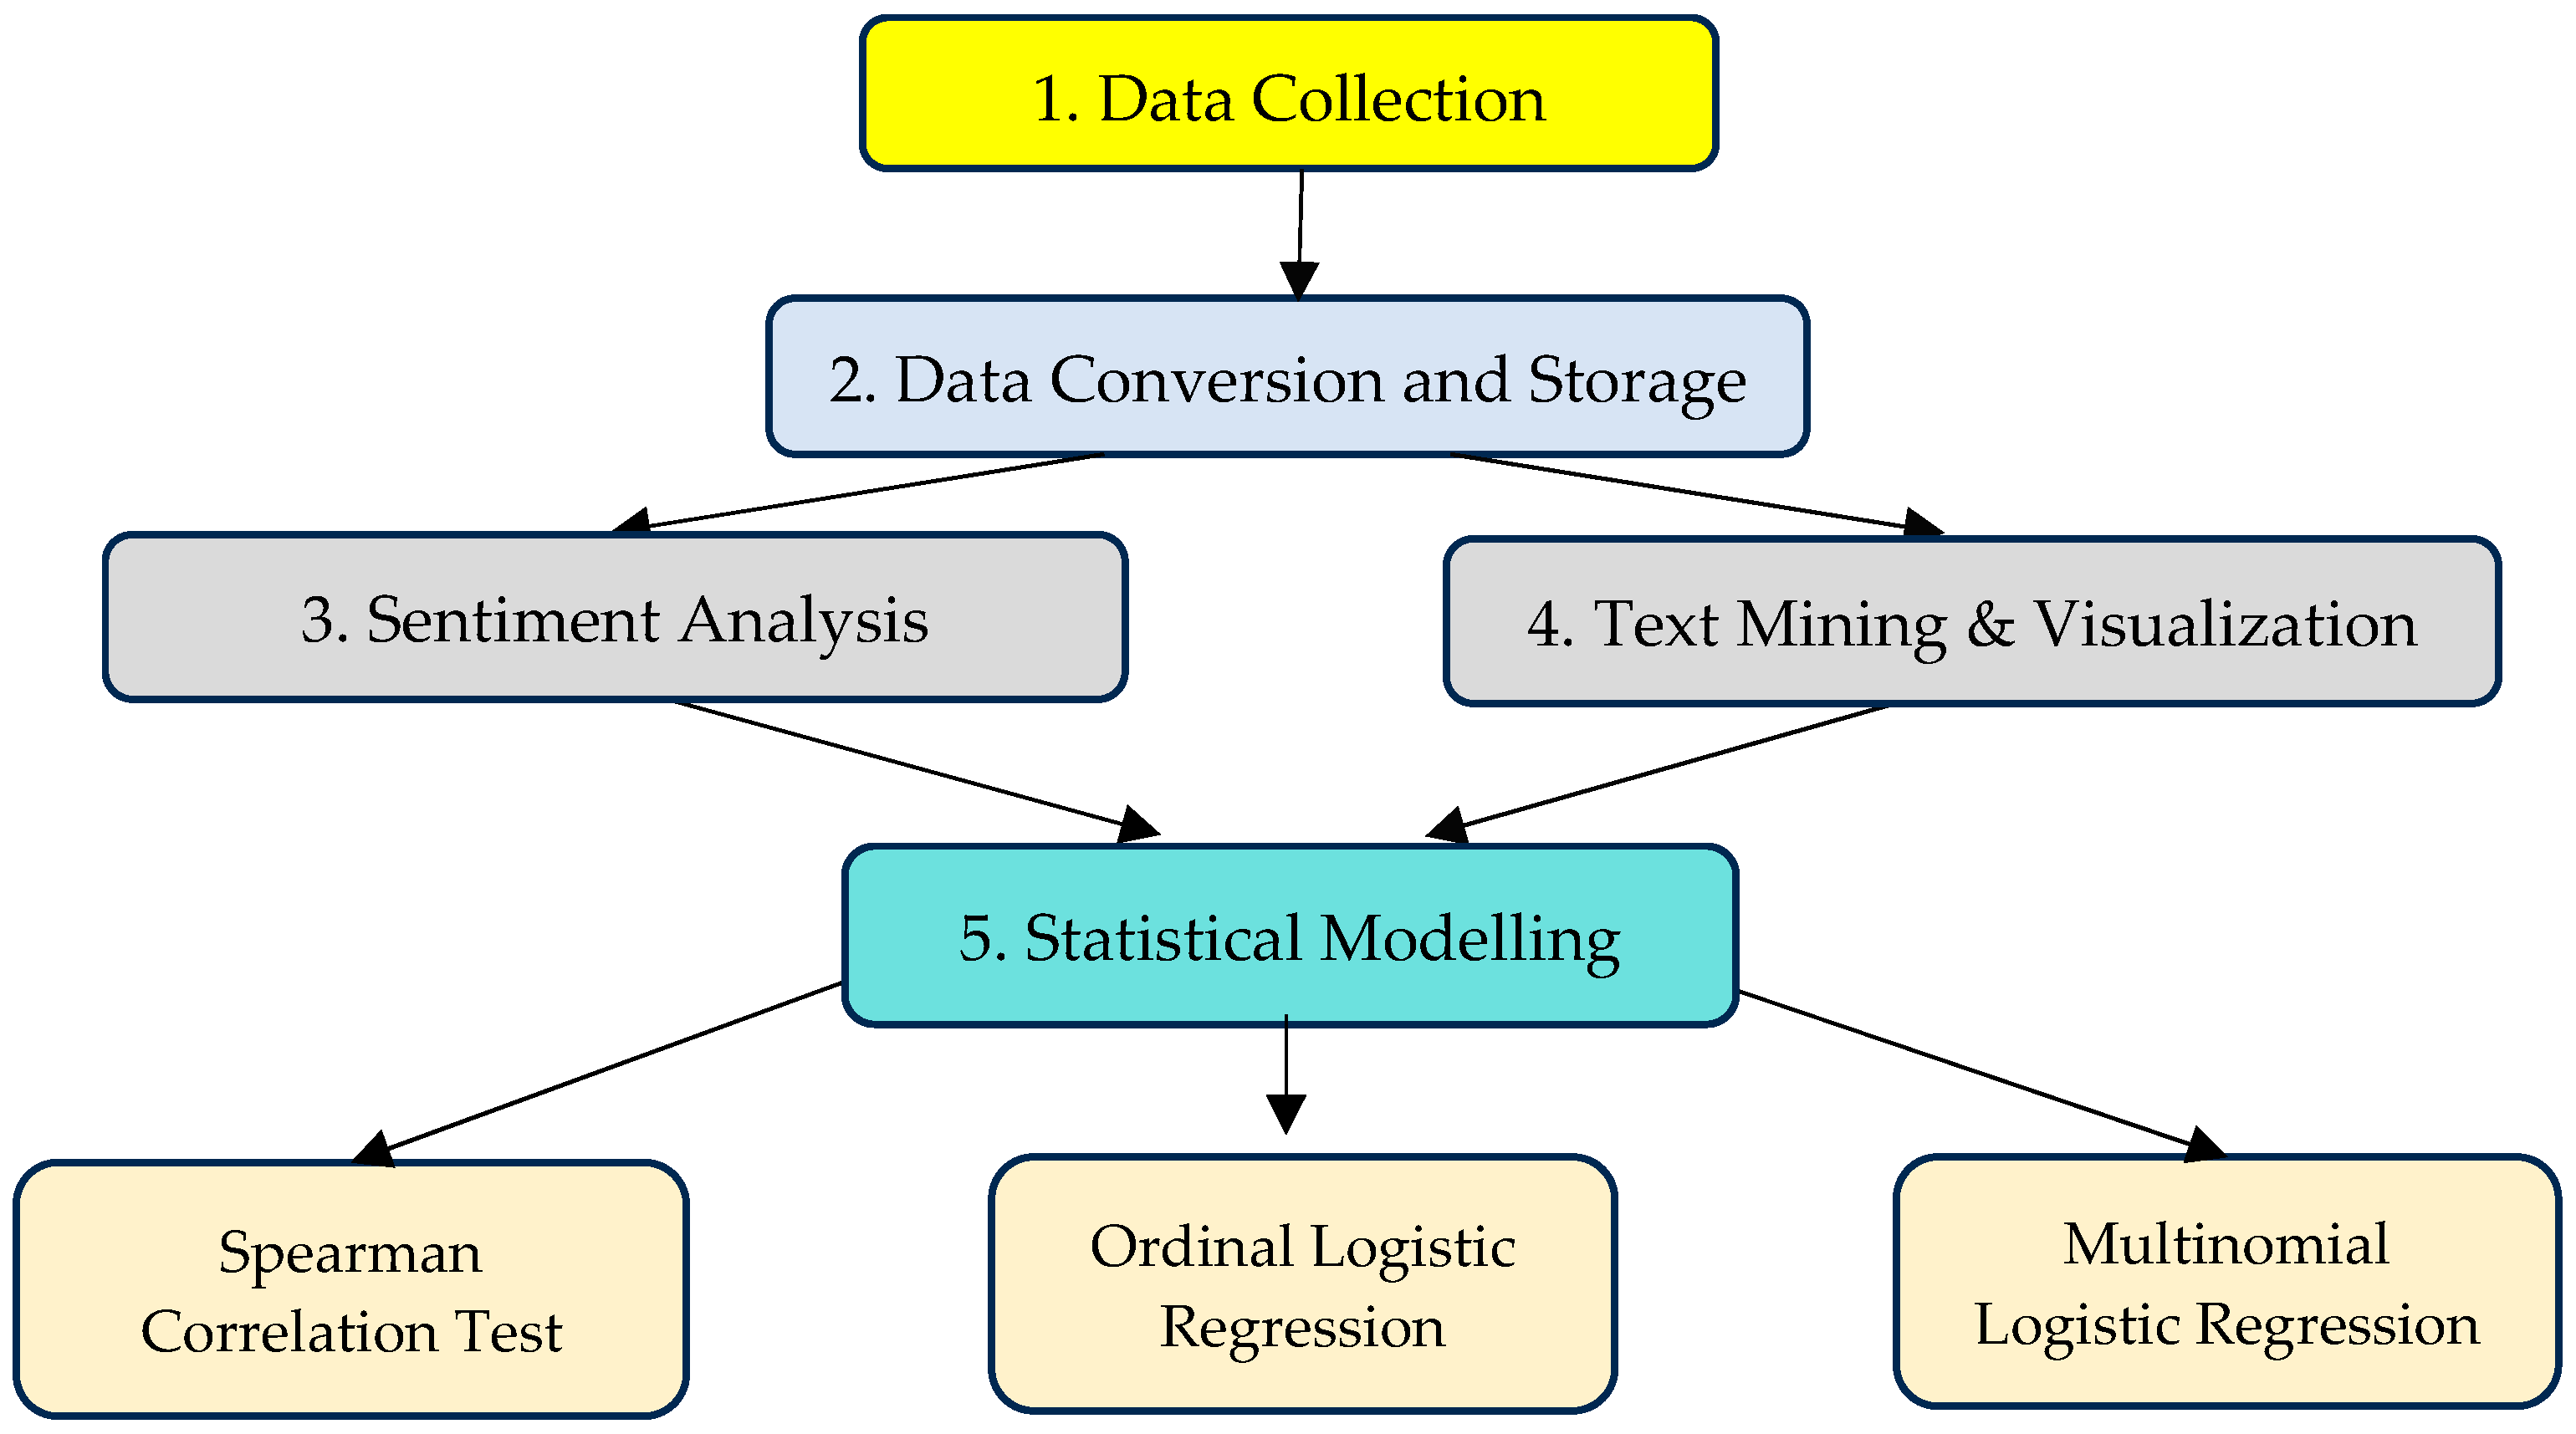
Figure 1.
Flowchart of the study’s methodology.
2.2. Data Conversion and Storage
The extracted Python list object containing the user reviews was converted into a structured tabular format within the R environment. To achieve this, the jsonlite package [9] was used, specifically the fromJSON() function, which allowed for flattening nested elements into a data frame. The raw Python object was first transformed to JSON using toJSON() and then parsed with fromJSON() to create a usable R data frame: df <- fromJSON(toJSON(reviews), flatten = TRUE). After ensuring the dataset's structure and completeness, the data frame was exported and saved as a CSV file using the command write.csv(df, "netflix_reviews.csv", row.names = FALSE) for subsequent analysis.
2.3. Sentiment Analysis
To quantify the emotional polarity of each user review, sentiment scores were computed using the get_sentiment() function from the syuzhet package in R. The "syuzhet" method was selected for its lexicon-based approach, which assigns a numerical sentiment score to each review based on the presence of emotionally weighted words. Reviews with scores greater than 0 were classified as Positive, scores less than 0 as Negative, and scores equal to 0 as Neutral. In addition to sentiment labels, numeric sentiment codes were assigned: 1 = Positive, 2 = Neutral, and 3 = Negative. These sentiment scores and classifications were appended as new columns—sentiment_score, sentiment_label, and sentiment_code—to the existing dataset containing user ratings (scores) and thumbs-up counts. Finally, the enriched dataset was exported as a .csv file for further statistical and machine learning analysis. Data analysis was conducted using RStudio (version 4.5.1).
2.4. Text Mining and Visualization
To gain a deeper understanding of the structure and distribution of sentiments in the user reviews, several text mining techniques and visualizations were applied. A word cloud was generated using the wordcloud package to highlight the most frequently mentioned terms across all reviews, providing a quick visual summary of dominant themes. Emotion counts derived from the NRC lexicon were summarized in a bar plot to illustrate the prevalence of specific emotional categories such as trust, joy, or anger. Additionally, a histogram of sentiment polarity scores was created to visualize the overall distribution of sentiments, ranging from negative to positive. Finally, a frequency table was compiled to report the number of reviews classified as Positive, Neutral, or Negative. These visual tools collectively enabled a more intuitive interpretation of user feedback and emotional responses toward the Netflix application.
2.5. Advanced Statistical Modelling
To further explore the relationship between review characteristics and sentiment, advanced statistical analyses were conducted. A Spearman’s rank-order correlation was conducted to assess the relationship between user rating (score) thumbs-up count and sentiment score in Netflix user reviews. Two regression models were then applied. An ordinal logistic regression was used to model the rating score as an ordinal outcome, with sentiment score and thumbs-up count included as predictors. Separately, a multinomial logistic regression was performed using the sentiment label (Positive, Neutral, Negative) as the categorical dependent variable, with thumbs-up count and rating score as predictors. In both models, multicollinearity diagnostics were conducted using Variance Inflation Factor (VIF) and Tolerance values to ensure the validity of model assumptions and to avoid inflated standard errors due to correlated predictors.
3. Results
A visual sentiment analysis was conducted using a word cloud and bar plot derived from user reviews of the Netflix streaming application (see Figure 2). In this visualization, the size and boldness of each word correspond to its frequency in the dataset, allowing for an intuitive assessment of the most commonly expressed sentiments and themes.
The term “good” appears most prominently, reflecting generally favorable attitudes toward Netflix's streaming service. Other positive descriptors such as “love,” “awesome,” “excellent,” “great,” and “nice” suggest a widespread appreciation for the app’s content and functionality. These terms are indicative of high user satisfaction, both in terms of the platform’s usability and the quality of entertainment offered. Additionally, words like “app,” “Netflix,” “movie,” “watch,” and “show” highlight the primary focus of user interaction—streaming content—underscoring the platform’s relevance and core service appeal.
Functional aspects of user experience are also reflected in terms such as “download,” “update,” “account,” and “play,” which suggest the topics most discussed in user feedback. Although the overall sentiment is strongly positive, a few smaller terms such as “problem,” “error,” “worst,” and “can’t” indicate occasional dissatisfaction, likely related to technical issues, bugs, or limitations in service. However, these negative terms are significantly less prominent, reinforcing the predominance of positive experiences among Netflix users. Overall, the word cloud reveals that users generally express satisfaction with the Netflix streaming app, particularly regarding its content and ease of use, with only minor concerns related to technical performance.
On the other hand, an emotion-based sentiment analysis was conducted on 13,500 user reviews of the Netflix streaming application. As illustrated in Figure 3, the emotional landscape of user feedback is predominantly positive, with trust (n = 7,715), anticipation (n = 7,477), and joy (n = 6,317) emerging as the top three emotional categories. These findings indicate a high level of user confidence in the platform, alongside feelings of excitement and satisfaction with the content and service. Negative emotions such as fear (n = 3,876), sadness (n = 3,255), anger (n = 2,780), and disgust (n = 2,206) were also present but occurred less frequently. These emotions likely reflect frustration with technical issues, customer service, or specific content themes. The emotion surprise (n = 3,528) appears to play a more neutral or mixed role, potentially corresponding to unexpected content outcomes or features.
The prevalence of trust and anticipation suggests that users not only rely on Netflix but also look forward to its content updates and releases. Meanwhile, the notable expression of joy affirms overall satisfaction with the entertainment experience. In summary, the emotional profile of Netflix user reviews skews strongly positive, reinforcing earlier findings from the word cloud analysis. Negative emotions are present but do not dominate the overall sentiment landscape, suggesting high user engagement and general approval of the streaming service.
Consequently, to further examine the polarity of user sentiment, a sentiment score distribution was computed using the Syuzhet package (see Figure 4). This method assigns numerical sentiment scores to each review, where negative values indicate negative sentiment, positive values indicate positive sentiment, and values around zero represent neutral sentiment.
The relatively narrow spread and sharp peak also suggest that most reviews are moderately opinionated rather than strongly polarized. This pattern is consistent with earlier findings from the word cloud and emotion analysis, which indicated a strong prevalence of positive terms such as “good,” “love,” and “awesome,” while negative expressions were fewer and less intense. Overall, the sentiment score distribution supports the conclusion that user feedback on the Netflix streaming app is predominantly neutral to positive, with minimal extreme sentiment in either direction.
A categorical sentiment classification was performed on 13,500 user reviews of the Netflix streaming application, categorizing each review as either positive, neutral, or negative. The distribution is summarized in Table 1. The results indicate that the majority of reviews were classified as positive (n = 8,355; 61.89%), reflecting an overall favorable perception of the Netflix platform. A smaller proportion of reviews were classified as neutral (n = 2,192; 16.24%), suggesting that while these reviews contained relevant content, they were largely objective, balanced, or lacked strong emotional valence. Negative sentiment was present in 21.87% of the reviews (n = 2,953), highlighting
a minority of users who expressed dissatisfaction or encountered issues with the app. These proportions reinforce previous findings from the word cloud, emotion distribution, and sentiment score analyses, all of which collectively demonstrate a sentiment landscape that is predominantly positive, with only limited expressions of negativity. This pattern suggests strong user engagement and general satisfaction with the Netflix streaming experience.
3.1. Statistical Findings
Statistical findings in sentiment analysis serve to quantify and validate subjective textual data. By applying statistical methods, researchers can identify patterns, test hypotheses, and assess relationships between sentiment and external variables [6]. These findings enable the transformation of qualitative opinions into measurable insights, supporting evidence-based conclusions and enhancing model reliability [10]. First, a boxplot was generated to illustrate the distribution and variability of user ratings, providing an initial overview of central tendency and potential outliers.
A boxplot was constructed to examine the distribution of sentiment scores across user rating categories (1 to 5 stars) (see Figure 5). The analysis revealed a general upward trend in median sentiment scores with increasing rating values, suggesting a positive association between star rating and user sentiment. Specifically, the median sentiment scores were lowest for 1-star reviews and increased progressively through to 4-star reviews. Notably, the 4-star rating category exhibited the highest median sentiment score.
Despite the overall trend, the 5-star category showed slightly lower median sentiment compared to 4-star ratings and exhibited the widest interquartile range, indicating higher variability in sentiment. A considerable number of both high and low sentiment outliers were also observed in this category, suggesting inconsistencies between textual sentiment and assigned rating. Conversely, the 1-star category, as expected, had a lower median and a narrower interquartile range, yet still included a few positive sentiment outliers. This underscores the importance of analyzing both numerical ratings and textual reviews in tandem to accurately interpret user feedback.
Due to this, a statistical modeling approach was employed to generate deeper insights into the relationship between viewer responses and engagement metrics on the Netflix platform. Variables included in the analysis were user ratings (Score), sentiment scores derived from review text, the number of thumbs-up reactions (ThumbsUpCount), and sentiment labels (e.g., positive, negative, neutral).
A Spearman’s rank-order correlation was conducted to assess the relationship between user rating (score), thumbsUpCount and sentiment score (sentiment_score) in Netflix user reviews. This non-parametric test was selected because the assumption of normality for sentiment_score was violated, as confirmed by histogram and Q-Q plot inspection. In addition, the Spearman correlation coefficient was computed using the formula provided below:
Where; spearmans rank correlation coefficient, difference between the two ranks of each observation and = number of observations.
Results in Table 2 revealed a moderate positive correlation between score and sentiment_score, ρ = .42, p < .001, indicating that higher app ratings were associated with more emotionally positive reviews, it also exhibits statistical significance at the 1% level (p < 0.01), confirming the robustness of the correlation results. For instance, several empirical studies such as [13], achieved high accuracy classifying sentiments that aligned with users’ rating behavior, and earlier exploratory analysis of [15] for Netflix fields suggesting systematic covariance between sentiment-derived features and rating scores. On the other hand, there is a moderate negative correlation was also observed between score and thumbsUpCount, ρ = −.29, p < .001, suggesting that lower-rated reviews tended to receive more user approval via thumbs-up reactions. Finally, a very weak negative correlation was found between sentiment_score and thumbsUpCount, ρ = −.04, p < .001, indicating that the emotional tone of reviews had minimal association with user engagement.
An ordinal logistic regression analysis was also conducted to investigate the relationship between one or more independent factors and the likelihood that an ordinal outcome will fall into a certain category or a higher category. It is a statistical method for modelling and analyzing ordinal categorical outcome is ordinal logistic regression, commonly referred to as ordered logistic regression. It is defined as:
Where; = are model coefficient parameters (intercepts and slopes), J-1. Due to parallel lines assumption, slopes are constant across categories whereas intercepts are different. Hence our equation can be re-written as:
Where;= is the cumulative probability of the response variable falling in or below category j, = is the threshold parameter for category j and are the coefficients associated with the predictor variables . This model is used to examine whether the sentiment score of a review and the number of helpfulness votes (thumbsUpCount) significantly predicted the star rating (score) given to a streaming service application on the Google Play Store. The dependent variable, score, was treated as an ordinal factor ranging from 1 to 5.
Prior to analysis, multicollinearity was assessed using Variance Inflation Factors (VIFs). The VIF values for both predictors were approximately 1.00, with corresponding Tolerance values near 1.00, indicating no multicollinearity concerns (sentiment_score VIF = 1.001, Tolerance = 0.999; thumbsUpCount VIF = 1.001, Tolerance = 0.999). This model was used was conducted to examine whether user rating (score) and the number of helpfulness votes (thumbsUpCount) predict the sentiment label of app reviews (sentiment_label: Negative, Neutral, Positive). The reference category for the outcome variable was set to Neutral.
Results in Table 3 revealed that sentiment score was a strong positive predictor of rating (β = 0.85, SE = 0.023, t = 39.04, p < .001), suggesting that more positive sentiment in review text is associated with higher user ratings. In contrast, thumbsUpCount was a small but statistically significant negative predictor (β = –0.0010, SE = 0.0003, t = –3.29, p = .001), indicating that reviews receiving more helpfulness votes were slightly more likely to be associated with lower ratings. This may reflect a bias toward critical reviews being more informative or visible. Several sentiment analysis studies of [7] confirm the reliability of sentiment classification in Netflix reviews. Broader investigations using LSTM- and deep-learning models ([16] [1] indicates that sentiment is a strong predictor of rating outcomes. Additionally, research by [11] supports the observation that critical reviews garner more helpfulness votes—consistent with the modest negative predictive effect of thumbs-up count in the present study.
In addition, Levene’s test for homogeneity of variance indicated that the variance of sentiment scores differed significantly across rating levels, F(4, 13,495) = 100.83, p < .001. This finding suggests that sentiment scores are more dispersed at some rating levels (e.g., 1-star) than others, possibly reflecting mixed emotional expressions within low ratings. The model demonstrates that review sentiment is a robust predictor of user ratings, while helpfulness votes may reflect underlying dissatisfaction that is not captured by rating alone.
Lastly, Multinomial logistic regression is applied when the dependent variable has more than two categories that are not ordered. This method extends binary logistic regression to deal with multiple classes by estimating the probability of each outcome category relative to a baseline. estimates the probability of each target variable's possible category (class). To calculate the probability of a specific class, we use a formula:
Where; is the target class, is the input features, are the weights (coefficients) for each class and is the mathematical constant (Euler’s number). For each class, we calculate a score , which is just a weighted sum of the input features. The final probability for each class is based on the ratio of its score compared to all other classes.
Prior to model estimation, multicollinearity was assessed using Variance Inflation Factor (VIF) and Tolerance statistics. Both predictors exhibited VIF values of 1.00 and Tolerance values of 1.00, indicating no violation of multicollinearity assumptions and confirming that the predictors were sufficiently independent. A multinomial logistic regression was performed to model the relationship between the predictor variables (score and thumbsUpCount) and sentiment classification (Negative, Neutral, and Positive). The Table 4 fit between the model in containing only the intercept and the observed data improved significantly with the addition of the predictor variables, χ²(4, N = 13,500) = 4096.71, p < .001. The final model explained approximately 38% of the variance in sentiment classification, as indicated by Nagelkerke R² = .38, and demonstrated an acceptable fit to the data.
Results in Table 5 indicated that both score and thumbsUpCount were significant predictors of sentiment classification. Specifically, an increase in score was associated with a decreased likelihood of a review being classified as Negative ( = –0.49, SE = 0.02, z = –24.78, p < .001), and a greater likelihood of being labeled Positive ( = 0.31, SE = 0.014, z = 22.65, p < .001). These findings are consistent with prior studies demonstrating that higher star ratings or satisfaction scores tend to predict more positive sentiment in textual reviews [3] [17].
Moreover, the thumbsUpCount variable significantly contributed to sentiment classification. For both Positive and Negative labels (versus Neutral), an increase in thumbs-up count was associated with higher odds of classification, with nearly identical coefficients ( ≈ 0.146, SE = 0.021, z ≈ 6.94, p < .001) and ( ≈ 0.313, SE = 0.014, z ≈ 22.65, p < .001). This finding is supported by recent research demonstrating that emotionally intense reviews whether they are highly positive or negative are more likely to receive helpfulness votes (i.e., thumbs-up), suggesting that extreme sentiment expressions attract more user engagement [5].
4. Discussion
This study aimed to examine user perceptions of the Netflix mobile application by combining sentiment analysis with statistical modeling, using 13,500 Google Play Store reviews. Specifically, it explored how emotional tone (sentiment), star ratings, and thumbs-up counts interact to reflect user satisfaction and engagement.
Findings This study revealed that the majority of Netflix app users express positive sentiment in their reviews, with terms like “good,” “love,” and “awesome” frequently appearing. Emotion analysis further supported this, with trust, anticipation, and joy being the most common emotions. While higher star ratings generally aligned with more positive sentiment, 5-star reviews showed more variability, indicating that some users rated the app highly despite mixed feelings in their comments.
Statistical modeling showed a moderate positive correlation between sentiment scores and ratings, confirming that emotionally positive reviews tend to result in higher ratings. Interestingly, reviews with more thumbs-up were slightly more likely to be critical, suggesting users find detailed or negative feedback more helpful. Both ordinal and multinomial logistic regressions supported sentiment and thumbs-up count as significant predictors of ratings and review classification.
This study was limited to Google Play Store reviews and used a lexicon-based sentiment analysis method that may miss nuanced expressions like sarcasm and only limited to specific country which is the United States to obtain English language reviews. Other factors affecting user ratings, such as app updates or external influences, were not included, and causal relationships cannot be inferred due to the observational design.
5. Conclusions
This study combined sentiment analysis and statistical modeling to better understand user perceptions of the Netflix mobile application based on 13,500 Google Play Store reviews. The findings revealed that a majority of users expressed positive sentiments, with emotions such as trust, anticipation, and joy being the most prominent. Sentiment scores showed a strong association with higher star ratings, confirming their usefulness as indicators of user satisfaction. Additionally, while thumbs-up counts were weakly linked to sentiment, they tended to be higher for critical or detailed reviews, suggesting that users engage more with emotionally expressive or informative feedback.
These results highlight the value of integrating qualitative and quantitative approaches when analyzing user reviews. Star ratings alone may not capture the full depth of user opinion, and sentiment analysis provides a richer understanding of how users experience and evaluate digital platforms. For developers and product teams, this approach can help identify service strengths and areas needing improvement. Future research should include data from other app stores and incorporate more context-sensitive sentiment tools to capture complex expressions like sarcasm or cultural nuance.
Data Availability Statement
The data that support the findings of this study are confidential and are not publicly available due to privacy restrictions. Access to the dataset may be granted upon reasonable requests and with permission from the corresponding data owner.
Conflicts of Interest
The author declares no conflict of interest associated in this study.
References
- Atandoh, P., Zhang, F., Al-Antari, M. A., Addo, D., & Gu, Y. H. (2024). Scalable deep learning framework for sentiment analysis prediction for online movie reviews. Heliyon, 10(10), e30756. [CrossRef]
- Deloitte Development LLC. (2024). Digital Media Trends Survey, 18th edition. https://www.mediafinance.org/assets/Presentations/Deloitte%20Presentation.pdf.
- Hadwan, M., Al-Sarem, M., Saeed, F., & Al-Hagery, M. A. (2022). An Improved Sentiment Classification Approach for Measuring User Satisfaction toward Governmental Services’ Mobile Apps Using Machine Learning Methods with Feature Engineering and SMOTE Technique. Applied Sciences, 12(11), 5547. [CrossRef]
- Hardcastle, K., Vorster, L., & Brown, D. M. (2025). Understanding customer responses to AI-Driven personalized journeys: impacts on the customer experience. Journal of Advertising, 1–20. [CrossRef]
- Li, J., Xu, X., & Ngai, E. W. (2024). How review content, sentiment and helpfulness vote jointly affect trust of reviews and attitude. Internet Research, 34(6), 2232–2256. [CrossRef]
- Liu, B. (2012). Sentiment analysis and opinion mining. Synthesis Lectures on Human Language Technologies, 5(1), 1–167. [CrossRef]
- Mahendra, A., Wijaya, A. B., & Arifudin, D. (2025). Implementation naive Bayes algorithm in sentiment analysis for Netflix reviews on Google Play Store. ejurnal.seminar-id.com. [CrossRef]
- Nelsa, P., Paradita, A. X., Hermawan, F. F., Ghifari, M. Y., & Lubis, M. (2025). Netflix’s Digital Transformation Strategy: A Systematic review of challenges and risk mitigation approaches. JIPI (Jurnal Ilmiah Penelitian Dan Pembelajaran Informatika), 10(2), 1133–1143. [CrossRef]
- Ooms, J. (2014). The jsonlite Package: A Practical and Consistent Mapping Between JSON Data and R Objects. arXiv:1403.2805 [stat.CO]. https://arxiv.org/abs/1403.2805.
- Pang, B., & Lee, L. (2008). Opinion mining and sentiment analysis. Foundations and Trends® in Information Retrieval, 2(1–2), 1–135. [CrossRef]
- Shah, A., Gohary, A., & Lie, D. (2023). Looking for negativity! How review sentiment and review subjectivity form review helpfulness across cultures. Journal of Consumer Behaviour, 23(3), 1193–1207. [CrossRef]
- Tang, W., & Wei, M. (2023). Streaming media business strategies and audience-centered practices: a comparative study of Netflix and Tencent Video. Online Media and Global Communication, 2(1), 3–24. [CrossRef]
- Thomas, J., Kumar, T. K. S., Menon, V. A., & Thomas, L. P. (2024). Analyzing sentiment in Netflix User Opinions: A Statistical Examination. In Lecture Notes in Networks and Systems (pp. 587–601). [CrossRef]
- Ushey, K., Allaire, J., & Tang, Y. (2025). reticulate: Interface to 'Python'. R package version 1.42.0. https://github.com/rstudio/reticulate, https://rstudio.github.io/reticulate/.
- Vadloori, K., & Sanghishetty, S. M. (2021). Exploratory and Sentiment Analysis of Netflix Data. https://www.researchgate.net/publication/354719521_Exploratory_and_Sentiment_Analysis_of_Netflix_Data.
- Verma, V., Gupta, A., & Kumawat, S. (2021). Sentiment analysis for movie ratings using deep learning. In Advances in Intelligent Systems and Computing (pp. 59–66). [CrossRef]
- Wang, W., Carnegie Mellon University, Han, J., Amazon Inc, Liang, C., Google Inc, Chen, T., Google Inc, Meta Platforms, Huang, J., Meta Platforms, & Wang, W. (2023). Sentiment Analysis: A Systematic Case Study with Yelp Scores. Advances in Artificial Intelligence and Machine Learning, 1259–1273. https://www.oajaiml.com/uploads/archivepdf/11561174.pdf.
Figure 2.
Word cloud and Bar plot representing sentiment and keyword frequency from user reviews of the Netflix streaming app.
Figure 2.
Word cloud and Bar plot representing sentiment and keyword frequency from user reviews of the Netflix streaming app.
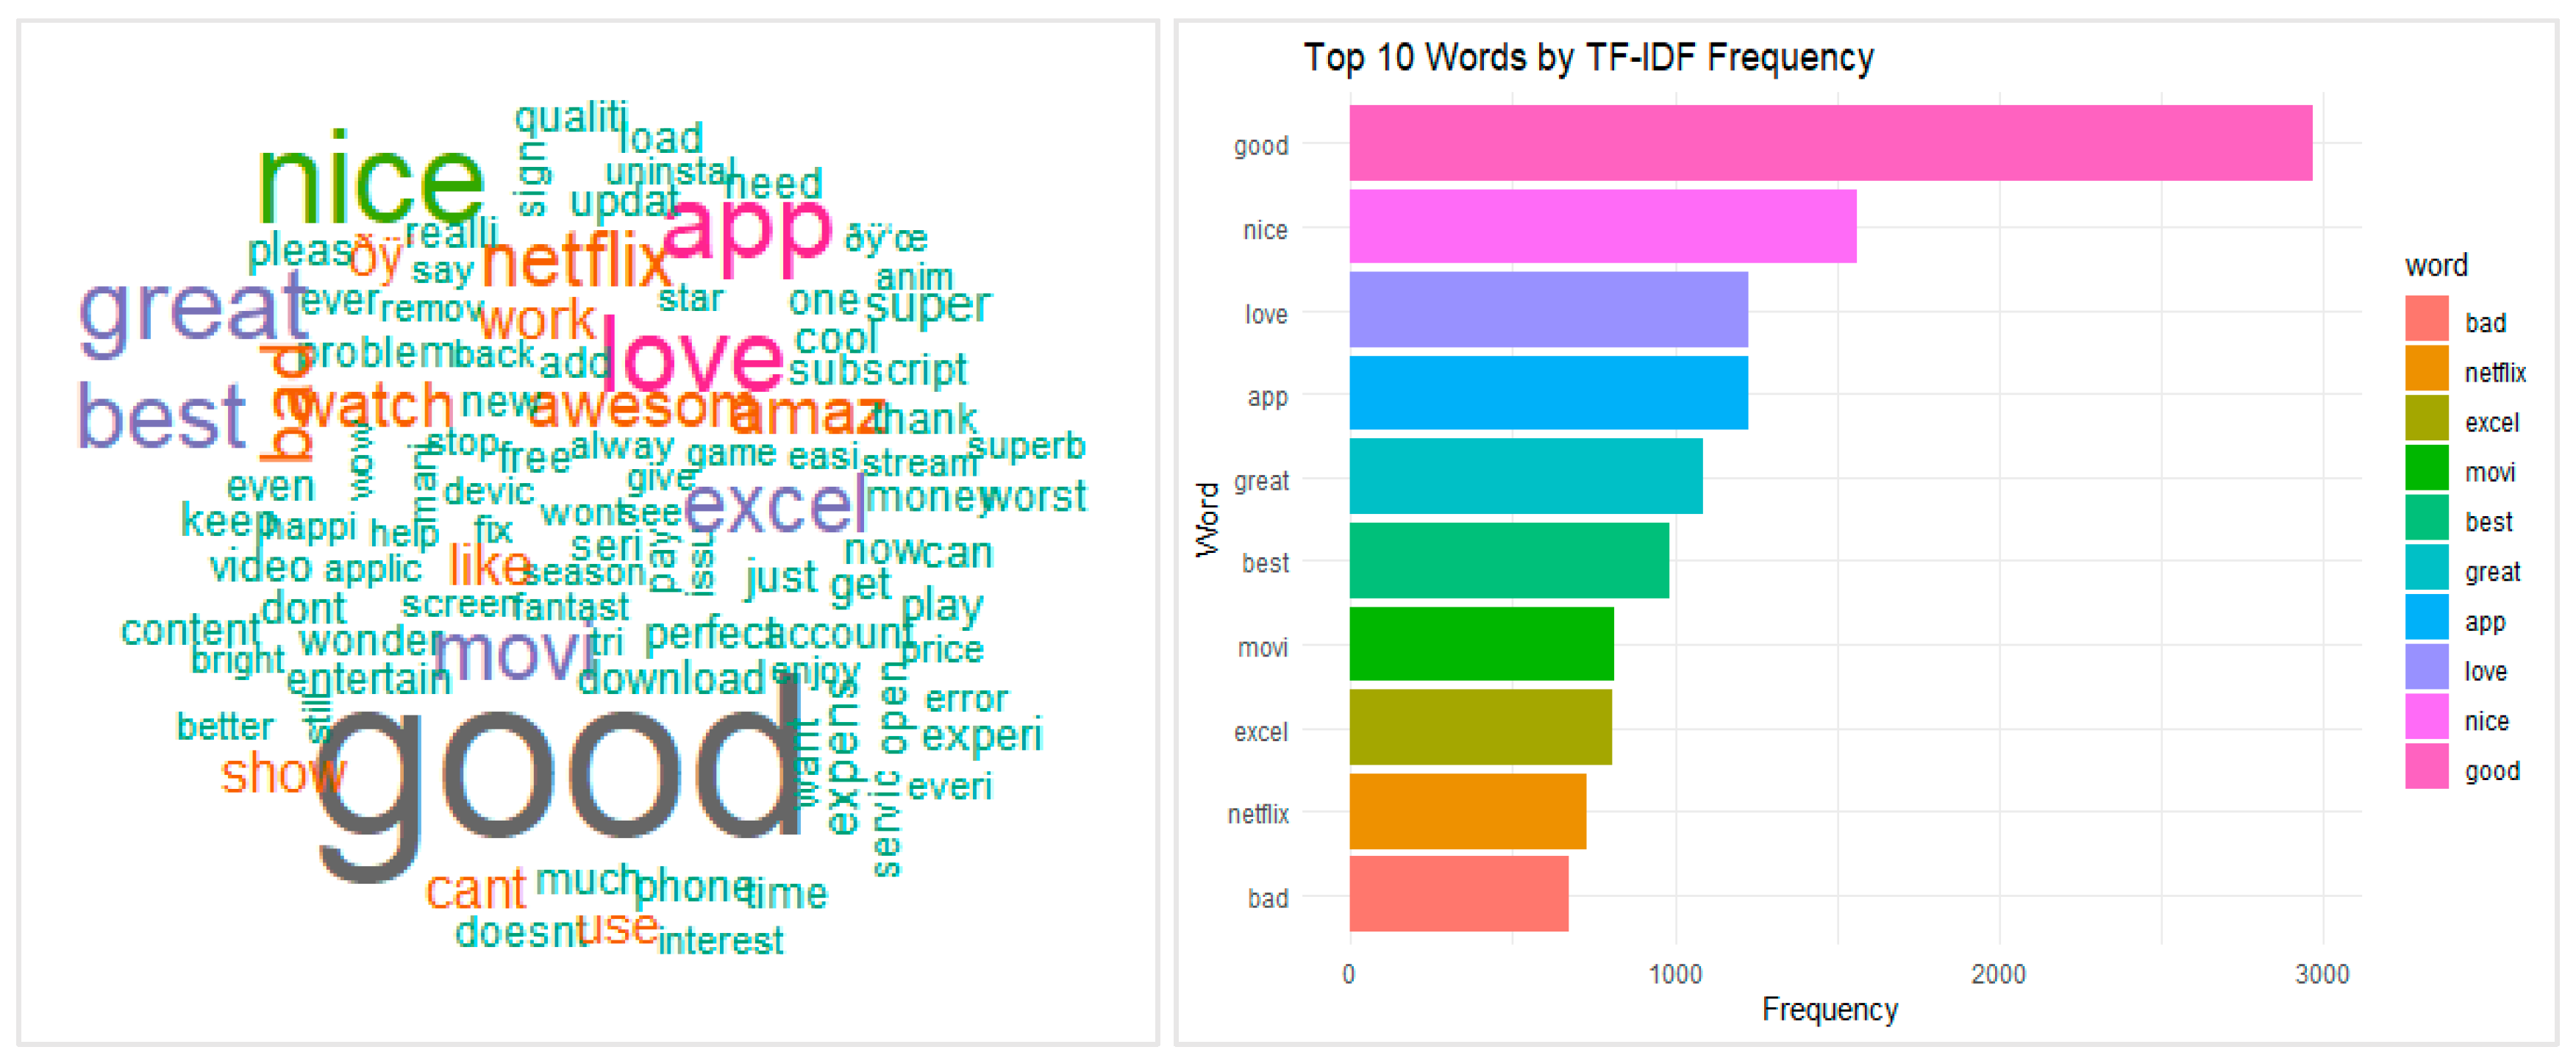
Figure 3.
Bar chart showing the distribution of eight core emotions across 13,500 user reviews of the Netflix streaming app.
Figure 3.
Bar chart showing the distribution of eight core emotions across 13,500 user reviews of the Netflix streaming app.
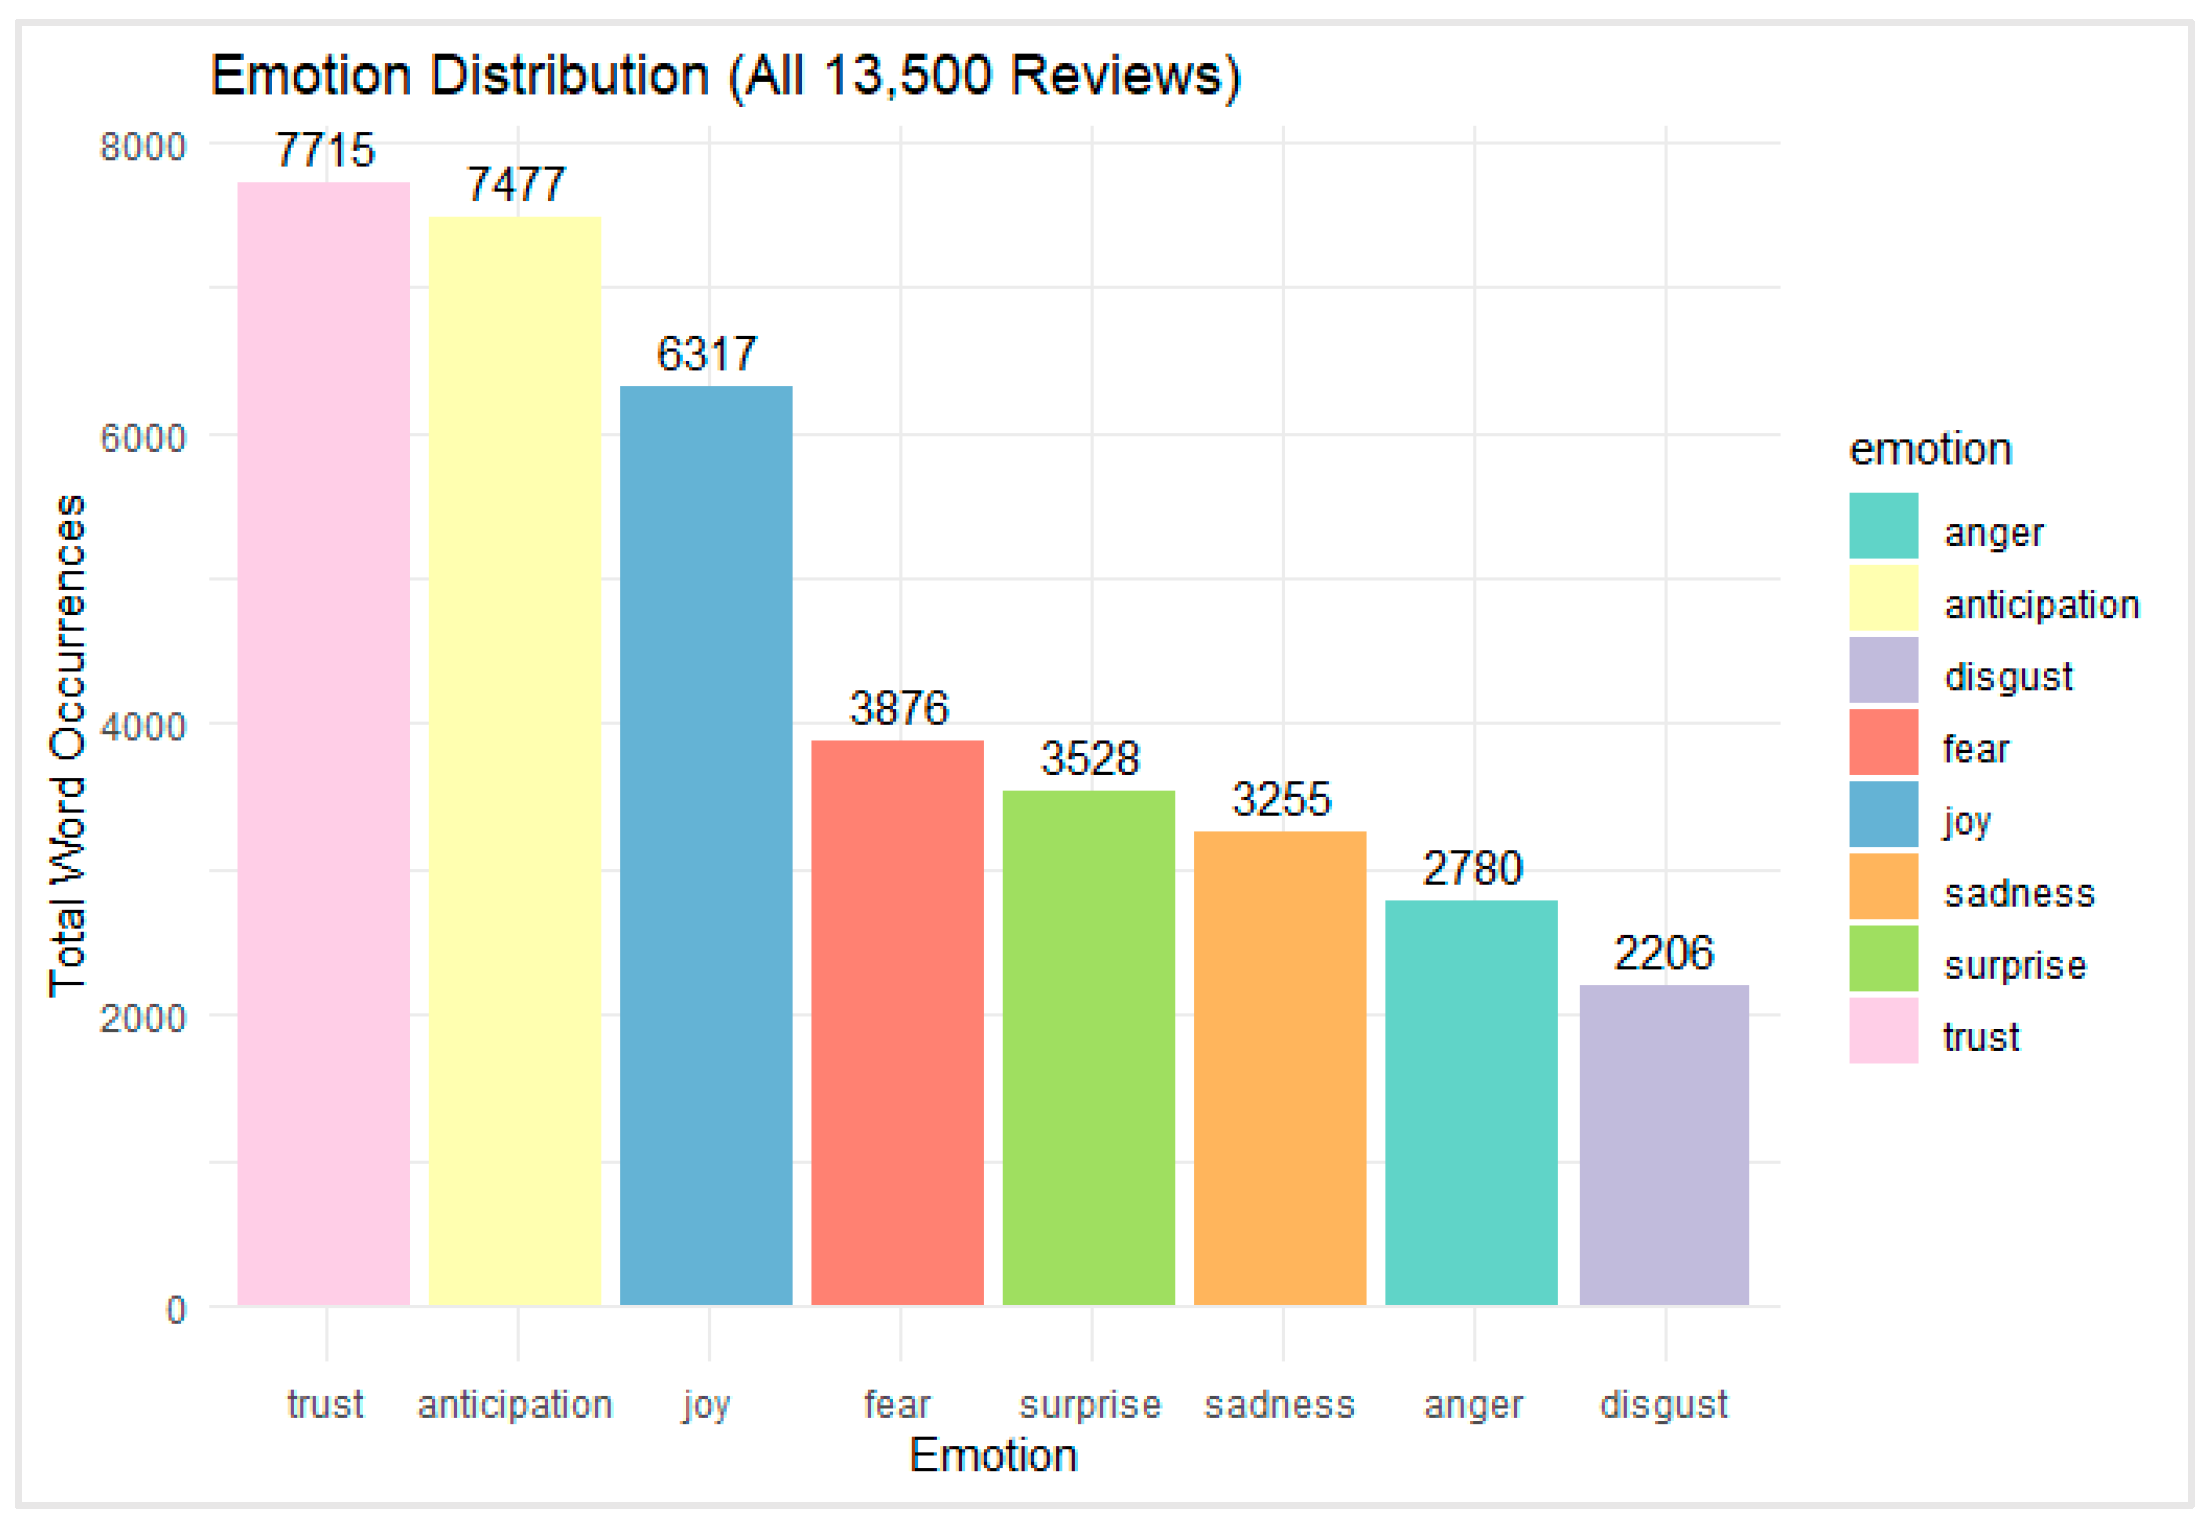
Figure 4.
Histogram showing the sentiment score distribution of Netflix app reviews using the Syuzhet method.
Figure 4.
Histogram showing the sentiment score distribution of Netflix app reviews using the Syuzhet method.
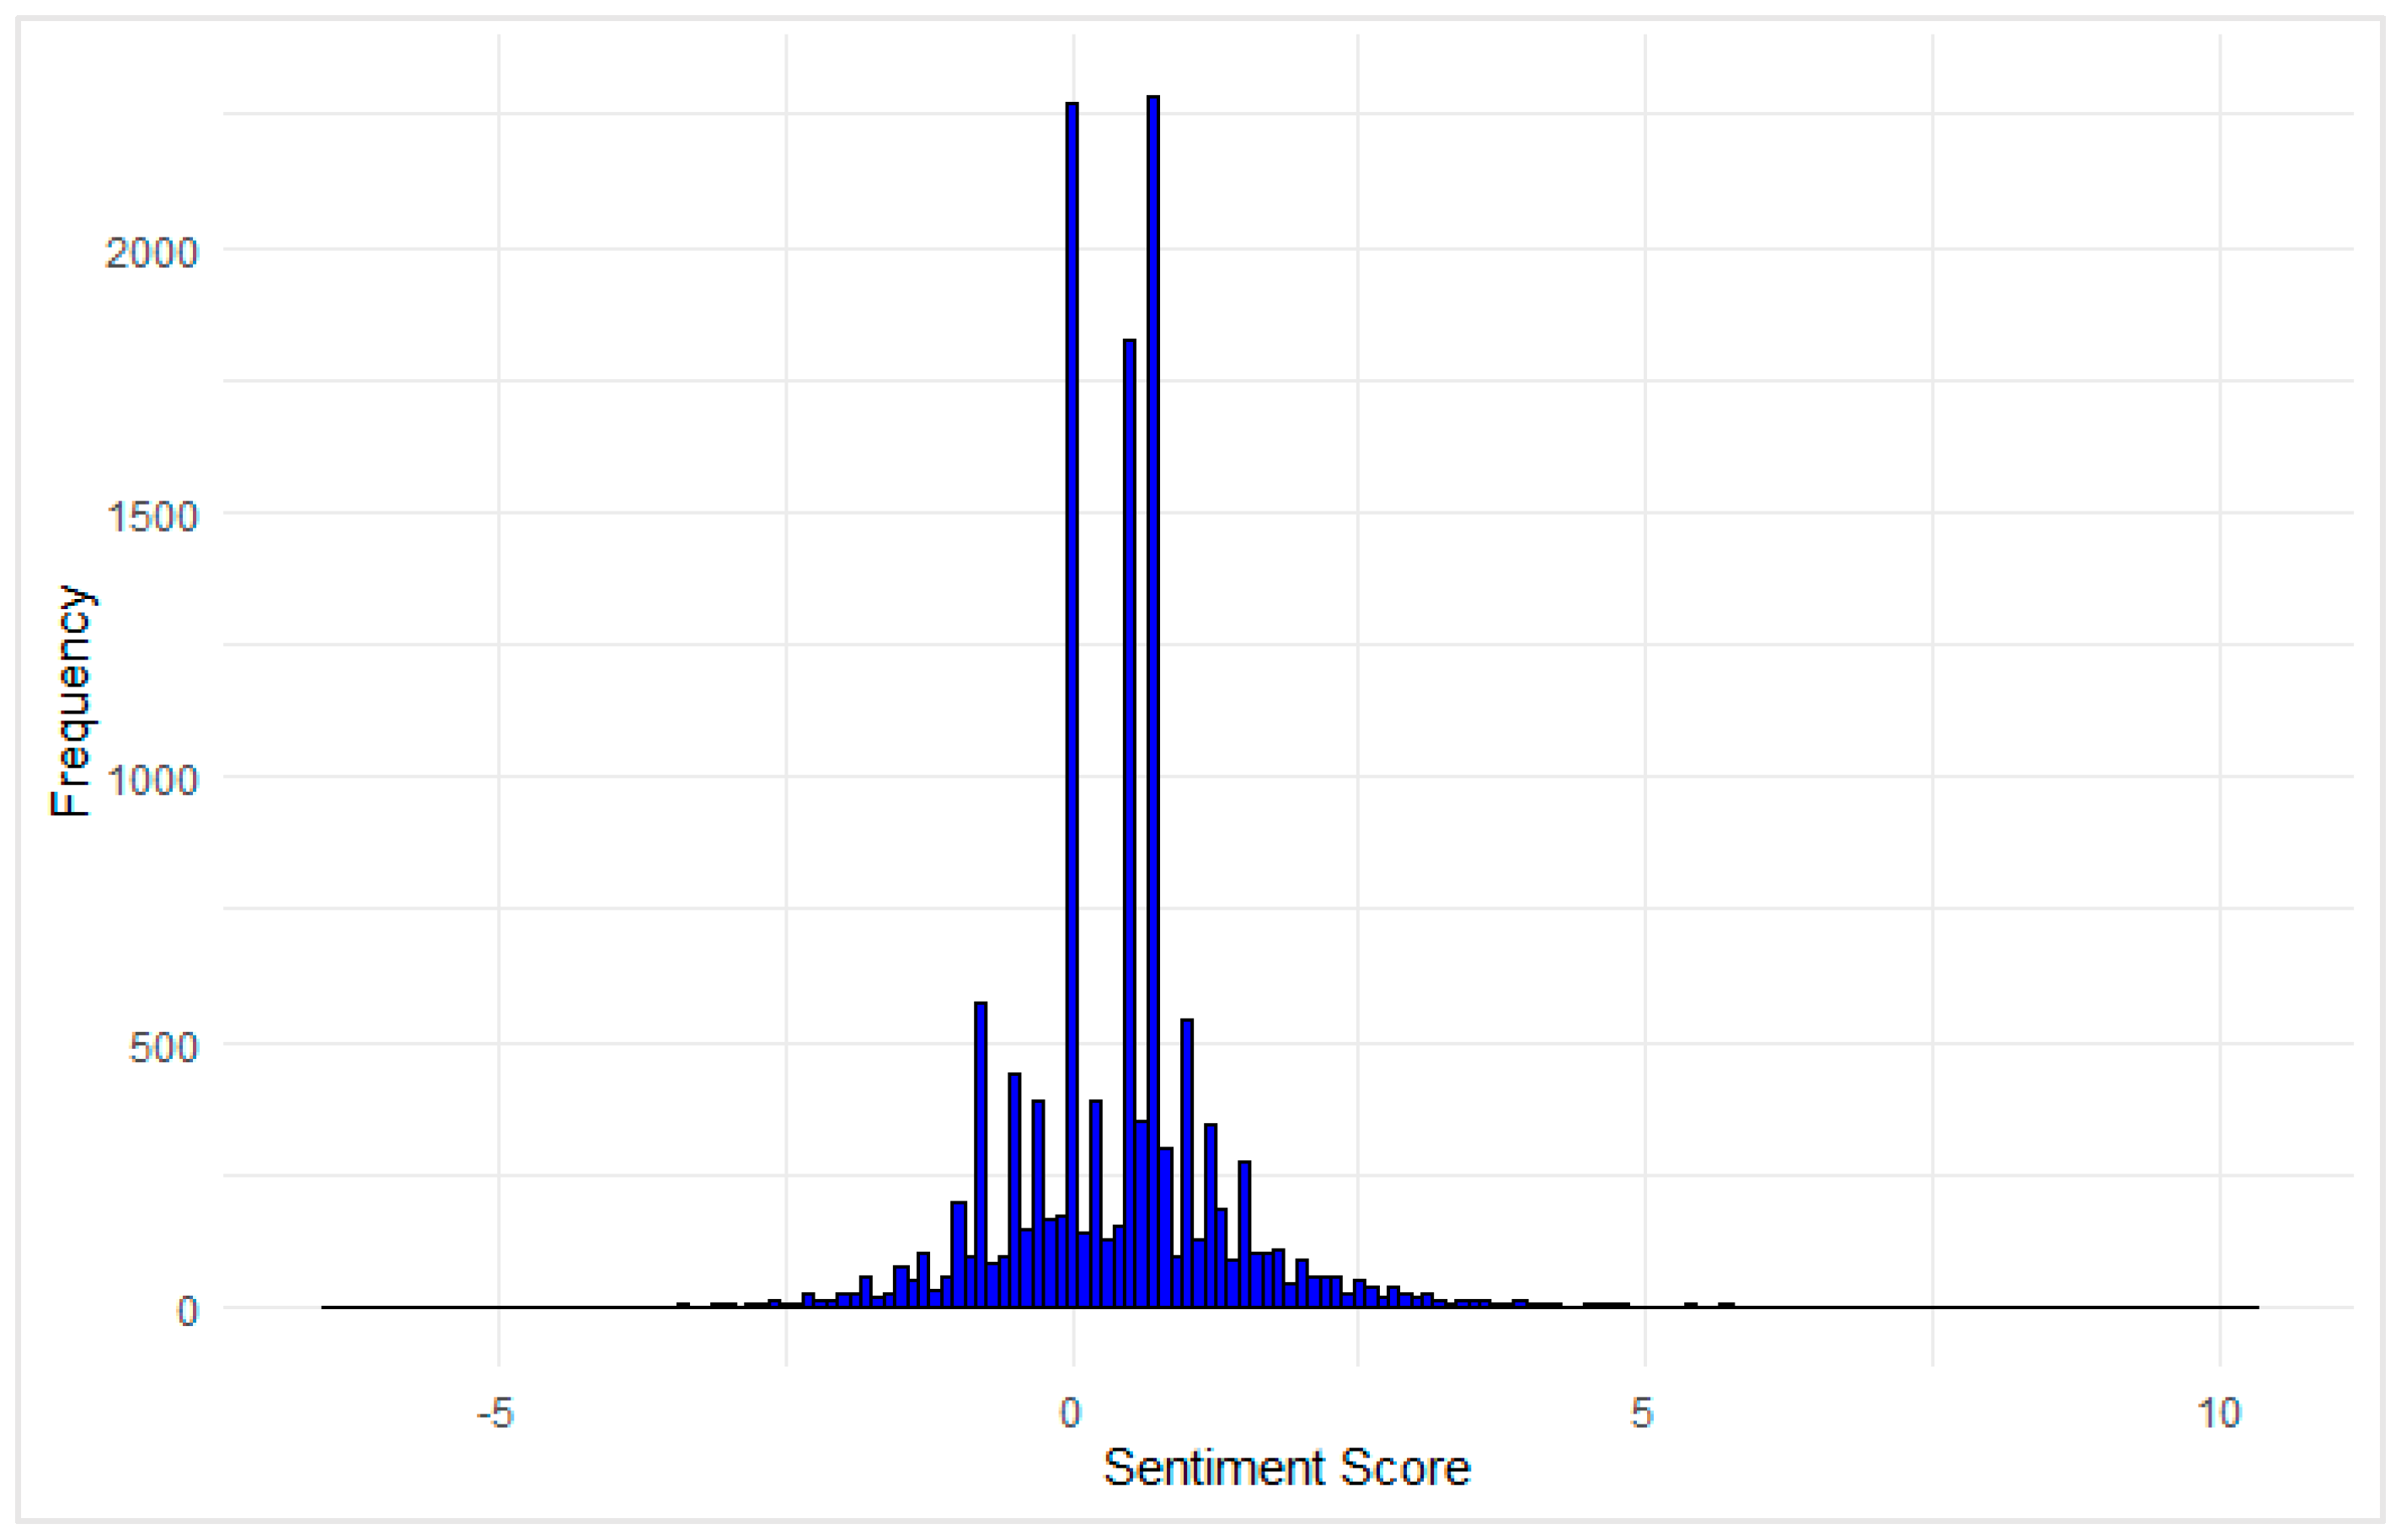
Figure 5.
Boxplot of User Ratings Distribution.
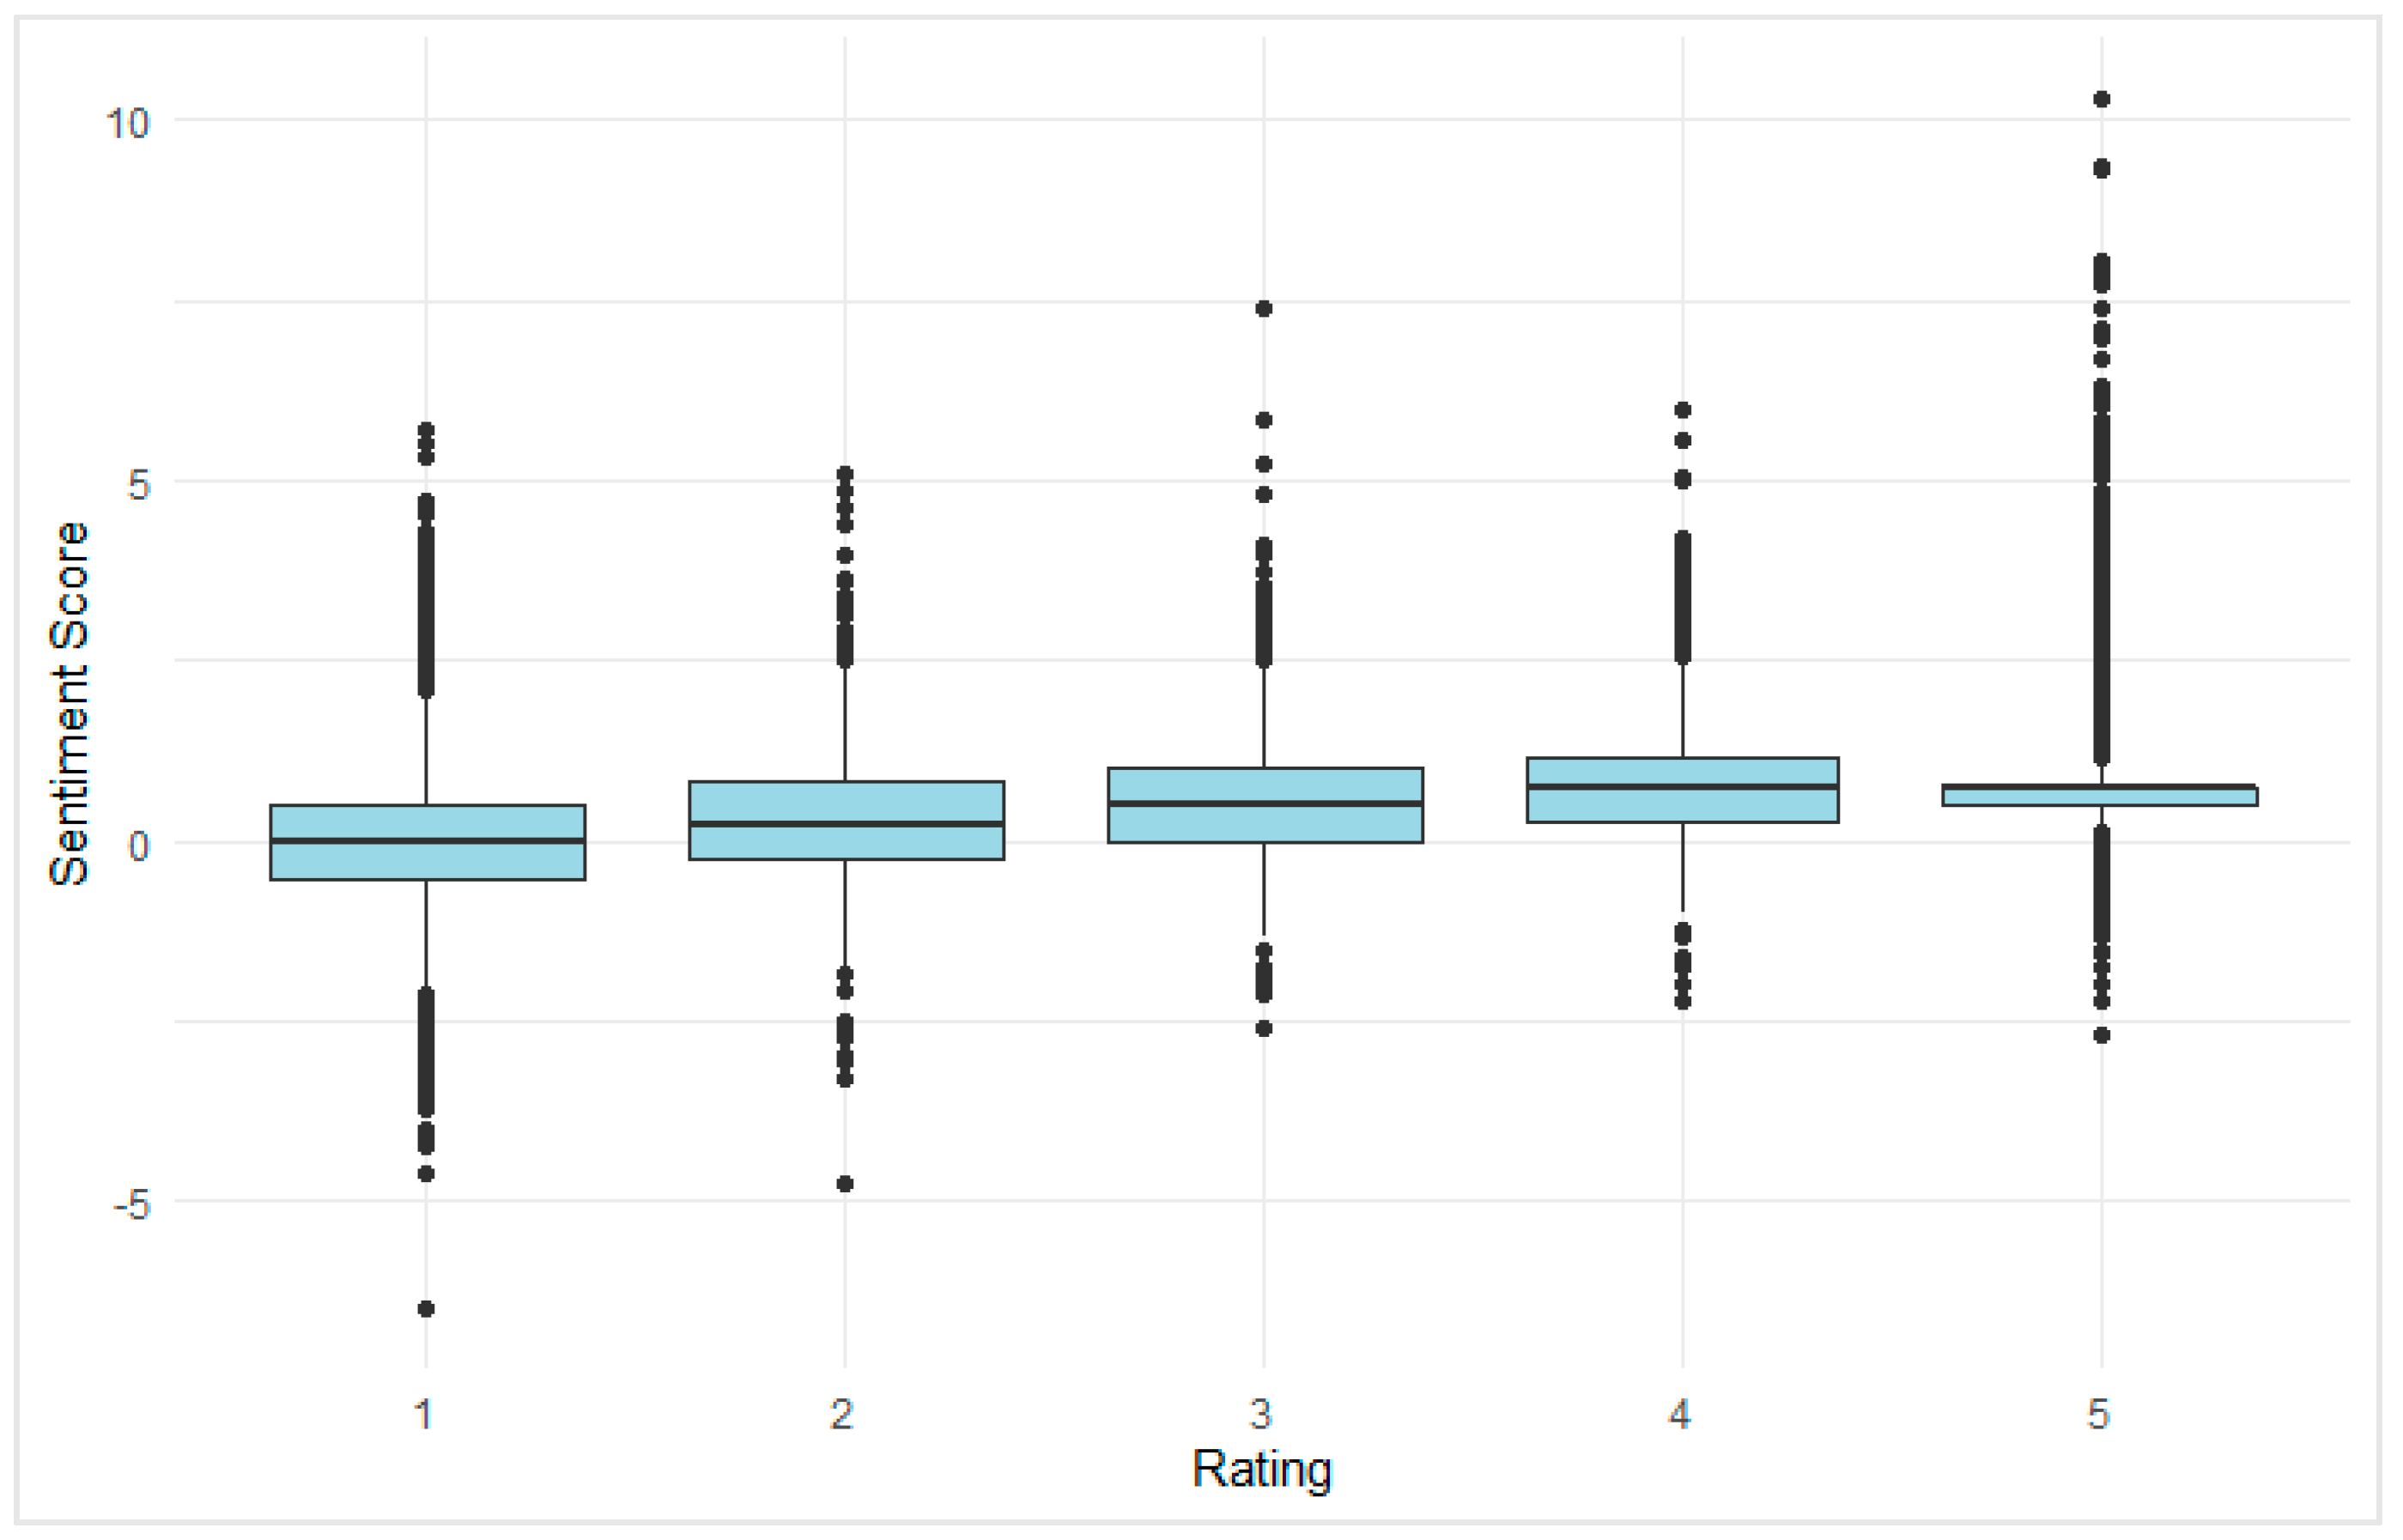

Table 1.
Sentiment Label Distribution of Netflix App Reviews (N = 13,500).
| Sentiment_label | Frequency | Percentage (%) |
| Positive | 8355 | 61.89 |
| Neutral | 2192 | 16.24 |
| Negative | 2953 | 21.87 |
Table 2.
Correlation test for score, sentiment_score and thumbsUpCount.
| Variable 1 | Variable 2 | Spearman’s rho (ρ) | p-value |
| score | sentiment_score | 0.424 | < .001** |
| score | thumbsUpCount | -0.291 | < .001** |
| thumbsUpCount | sentiment_score | -0.036 | < .001** |
| Note: * p < .001** High significance, p <.05* Significant , p >.05 Not significant | |||
Table 3.
Ordinal Logistic Regression for score (ratings).
| Variables | Coefficient | SE | p-value |
| Sentiment score | 0.8502 | 0.0227 | p < .001 |
| thumbsUpCount | –0.0010 | 0.0003 | .001 |
| Note: * p < .001** High significance, p <.05* Significant , p >.05 Not significant | |||
Table 4.
Model summary of Multinomial Logistic Regression.
| Residual Deviance | AIC | df | Nagelkerke R2 | p-value |
| 21,464.64 | 21,476.64 | 4 | 0.38 | p < .001 |
Table 5.
Multinomial Logistic Regression for sentiment_label.
| Predictors | Sentiment | Coefficient | SE | z-value | p-value |
| score | Negative | −0.493 | 0.020 | −24.78 | < .001 |
| thumbsUpCount | Negative | 0.146 | 0.021 | 6.91 | < .001 |
| score | Positive | 0.313 | 0.014 | 22.65 | < .001 |
| thumbsUpCount | Positive | 0.146 | 0.021 | 6.94 | < .001 |
| Note: * p < .001** High significance, p <.05* Significant , p >.05 Not significant | |||||
Disclaimer/Publisher’s Note: The statements, opinions and data contained in all publications are solely those of the individual author(s) and contributor(s) and not of MDPI and/or the editor(s). MDPI and/or the editor(s) disclaim responsibility for any injury to people or property resulting from any ideas, methods, instructions or products referred to in the content. |
© 2025 by the authors. Licensee MDPI, Basel, Switzerland. This article is an open access article distributed under the terms and conditions of the Creative Commons Attribution (CC BY) license (http://creativecommons.org/licenses/by/4.0/).
Copyright: This open access article is published under a Creative Commons CC BY 4.0 license, which permit the free download, distribution, and reuse, provided that the author and preprint are cited in any reuse.


