Submitted:
18 July 2025
Posted:
23 July 2025
You are already at the latest version
Abstract
Urban areas face growing challenges such as traffic congestion, air pollution, and inefficient space use—issues compounded by outdated infrastructure and ineffective plan-ning. Efforts to implement data-driven or smart solutions are often hindered by disconnects among communities, entrepreneurs, policymakers, and investors, whose differing expectations and priorities limit collaboration and innovation. In response to this growing concern, this study investigates the entrepreneurial impact on sustainable urban development from the perspectives of key stakeholders. This investigation yields three notable findings: (1) critical factors influencing entrepreneurs' adoption of da-ta-driven approaches for sustainable urban space allocation; (2) the social, governance, and smart city integration impacts of space-sharing practices in urban environments; and (3) strategies to encourage investment in entrepreneurial projects aimed at optimizing space allocation in urban areas for sustainability. Previous studies have often siloed discussions on entrepreneurship, governance, and technological feasibility; this review reveals a pressing need for interdisciplinary frameworks that not only underscore the academic and practical significance of the topic but also redefine entrepreneurial urbanism as a collaborative, data informed, and equity driven discipline. To address the study’s complexity, the authors began the study with a comprehensive review of relevant theoretical frameworks and established theories. An interdisciplinary mixed-methods approach was then adopted, combining mixed methods with both qualitative and quantitative methodologies. The qualitative analysis provided valuable insights and revealed critical themes drawn from a multi-dimensional social discourse, encompassing 50 survey responses, 10 in-depth interviews, and a diverse range of published conversations. The quantitative analysis presented numerical data from sen-timent analytics related to community engagement and sustainable entrepreneurial practices. Additionally, inferential statistical methods were applied to validate relationships between urban performance metrics and the Global Innovation Index (GII) across a sample of 77 cities worldwide. Finally, the practical execution component of the study explored key aspects of the research through real-world case studies, offering actionable recommendations for entrepreneurial and data-driven initiatives aimed at building sustainable cities that foster a high quality of life.
Keywords:
sustainable urban development
; innovative entrepreneurship
; urban space allocation
; quadruple helix partnerships
Introduction
1.1. Background
Globally and locally, sustainable urbanisation and smart city initiatives are becoming increasingly prevalent. However, these initiatives are often still in the pilot phase or are implemented city-by-city, sometimes within the framework of national laws and regulations [1]. Despite numerous investigations into sustainable urbanisation, there remains a significant gap in practical execution and implementation approaches. In particular, the role of project-based practices in fostering collaboration among entrepreneurs, city planners, consumers, and investors in the development of sustainable urbanisation and smart city initiatives is underexplored. This research is inspired by vibrant discussions and real-world challenges emerging within startup communities, where ideas and initiatives, especially those related to impactful projects, are being actively proposed and explored.
The aim of this study is to examine the role of entrepreneurship in advancing sustainable urban development, with a particular emphasis on initiatives and projects that deliver urban services. Through a case study on space allocation, the research explores emerging standards of space sharing in urban environments, encourages data-driven project implementation, and evaluates the broader social and governance implications. Additionally, this study seeks to uncover diverse perspectives within urban communities and among key stakeholders involved in entrepreneurial efforts toward sustainable urban transformation.
1.1. Addressing Research Gaps
The literature review reveals that existing research predominantly focuses on technological feasibility rather than on critical factors influencing or expectations of stakeholders from entrepreneurial data-driven adoption from the perspective of a smart urban service. While prior research has siloed discussions on entrepreneurship, governance, and technology, there is a pressing need for interdisciplinary frameworks that:
- Connect data-driven innovation with participatory governance by integrating Smart City initiatives and addressing economic, social, and environmental dimensions;
- Embed equity in space-sharing models, including innovation diffusion and social return on investment;
- Leverage quadruple helix partnerships among entrepreneurs, policymakers, investors, and residents for scalable impact.
Moreover, the frequently raised issue is the imbalance in status, decision-making power, and capacity for collaboration between policymakers and entrepreneurs, which hinders positive and harmonious development and change. This study proposes a shared objective for both parties, encouraging co-creation strategies to achieve that goal.
2. Materials and Methods
2.1. Research Design
In this research, we followed twelve critical steps from the initial conceptualization of the study. Each step was carefully reviewed by professional experts to ensure transparency and integrity throughout the process. Among these, three key stages stand out: identifying research gaps, formulating the research design, and exploring the research findings. These core steps help ensure that the study addresses both academic and practical gaps, thereby enhancing the precision and reliability of the results. This study incorporates four theories and conceptual models, along with five theoretical and research frameworks, to guide its design and analysis. A mixed-methods approach was employed in this study, integrating both qualitative and quantitative methodologies concurrently. These interdisciplinary approaches foster diversity, complementarity, generalizability, and triangulation, thereby enhancing the credibility and robustness of the research findings. The scope of this study is broad, with outcomes shaped by a diverse set of variables grounded in multiple theoretical frameworks—reflecting the complexity and depth of the research context. The qualitative methods included analyzing transcripts from survey responses and conducting interviews with urban residents, entrepreneurs, and city planners. We also utilized transcriptions from video recordings provided by credible sources, featuring presentations by experts or leaders from governmental bodies, investment funds, and private organizations. This study applies quantitative methods to collect and analyze respondent data via automated sentiment analysis, and to conduct scientific computations and queries. These techniques enabled the extraction of meaningful insights and the generation of informative visualizations. Moreover, the case studies are framed within multi-level futuristic frameworks and supported by practical projects that highlight the role of entrepreneurial activities and initiatives in addressing real-world challenges. These implementations also help to underscore the importance of collaboration among relevant stakeholders in shaping innovative models for future urban development.
2.2. Theories and Conceptual Models
The theories and conceptual models for this research were designed to illustrate the relationships between entrepreneurial activities, space allocation and optimization, and sustainable urban development. It served as a guide for the study, outlining the key variables and their interactions. These conceptual models illustrate the sequence of entrepreneurial factors, urban development outcomes, and smart city integration. Space-sharing practices serve as a moderating effect between entrepreneurial factors and urban development outcomes.
- Entrepreneurial Factors: innovation in data-driven solutions; investment attraction strategies; collaboration with stakeholders.
- Urban Development Outcomes: social impact; governance impact; environmental impact.
- Smart City Integration: alignment with the smart-city framework; enhanced data-driven city planning; synergies between public and private urban services.
- Urban Spatial Service Practices: efficiency in space utilization; adoption of technology-based services; technology integration—decentralize systems.
2.3. Theoretical and Research Framework
2.3.1. Entrepreneurship Theory
In terms of the concept of entrepreneurial function, entrepreneurs are innovators who carry out new combinations of economic development, which are new goods, a new method of production, new markets, new sources of raw materials, or a new organizational form [2]. In this study, the entrepreneurship model emphasizes efficiencies, market processes, and the theories of uncertainty and innovation, which significantly impact sustainable urban services, particularly in the context of space allocation.
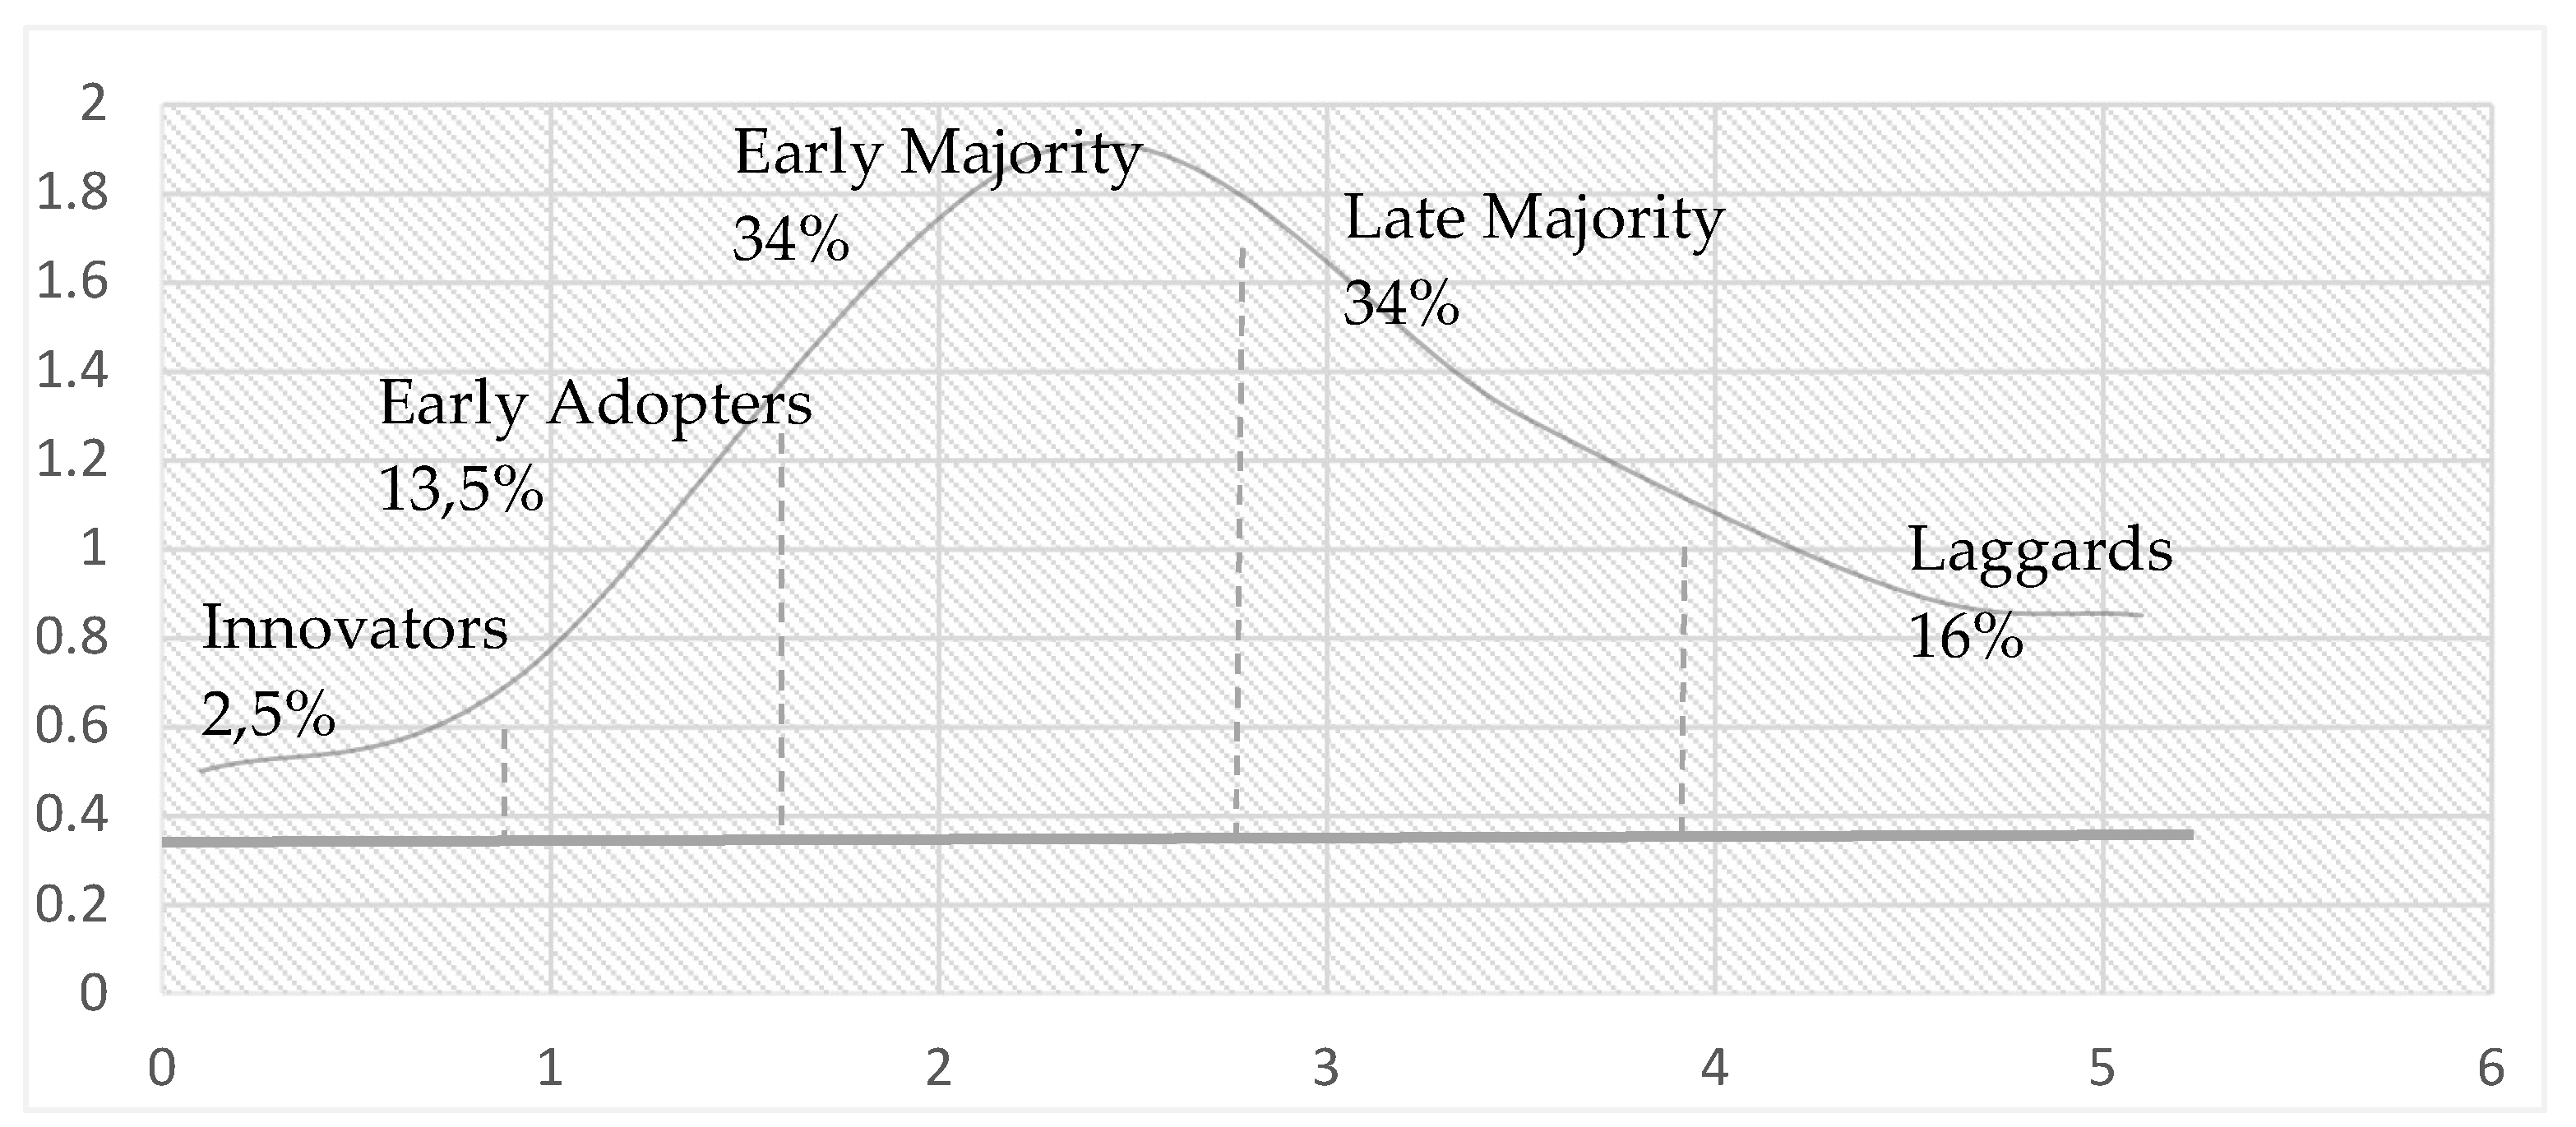
2.3.2. Diffusion of Innovation Theory
Diffusion of Innovation Theory (DOI) relates to the process by which an innovation is communicated through certain channels over time among the members of a social system or a specific population [3]. This study examines the adoption of urban space allocation projects by key stakeholders—including innovators, consumers, city planners, and investors—focusing on their awareness of the need for such initiatives, their decision-making processes regarding innovation adoption, and their initial and continued use of innovative services or products. The research also analyzed the main factors that influence adoption of the entrepreneurial projects.
Figure 1.
An example of applying the Diffusion of Innovation Theory. Source: Adapted from Dearing [4].
Figure 1.
An example of applying the Diffusion of Innovation Theory. Source: Adapted from Dearing [4].
2.3.3. Graph Theory
Graph theory concepts have been widely applied across various domains in computer science [5]. In this study, we extend the exploration of graph theory to its applications within the geosciences. Geoscience applications of graph theory can be grouped in five general categories: Quantification of complex network properties such as connectivity, centrality, and clustering; Tests for evidence of particular types of structures that have implications for system behavior, such as small-world or scale-free networks; Testing dynamical system properties, e.g., complexity, coherence, stability, synchronization, and vulnerability; Identification of dynamics from historical records or time series; spatial analysis [6]. This study applies graph theory principles to compute urban performance metrics by extracting street network data from open-source databases across a large sample of cities, enabling a robust quantitative analysis of spatial structure and connectivity.
2.3.4. Triple Bottom Line (TBL) Framework
By definition, the TBL is a comprehensive framework for incorporating economic, social, and environmental factors into decision-making [7]. It is particularly relevant for sustainable urban development as it encourages a holistic approach to evaluating the impact of entrepreneurial activities on urban spaces. This framework assesses how entrepreneurial initiatives contribute to sustainable urban space allocation by examining their economic viability, social benefits, and environmental sustainability. The integration of the Triple Bottom Line (TBL) framework provides deeper insights into its factors, enhancing strategies to attract policymakers involved with startup initiatives and to increase opportunities for investments.
2.3.5. Smart City Framework
This framework focuses on the integration of information and communication technologies to enhance the quality and performance of urban services. It includes aspects like city goals, smart-city concepts, assessment models, and implications of policies and programs [8]. This research applied the Smart-City Framework to identify entrepreneurial data-driven services and initiatives related to space sharing and allocation, examining their impact on the integration into smart-city conceptualization and city governance.
2.4. Data Collection and Analysis
Five data collection methods were utilized during this study, each contributing unique insights and perspectives to support the research objectives (Table 1). Quantitative analysis in this study was conducted using scientific computing and data science techniques, alongside automated sentiment analysis. JupyterLab—an open-source platform—was employed to develop and run programs for data retrieval, computation, and visualization of large datasets [9]. Additionally, the Insights feature in Microsoft Forms proved valuable for automatically generating interactive results from survey responses [10]. For qualitative data, thematic analysis was applied to various transcription files. This method involves systematically examining qualitative data to identify recurring themes, topics, or patterns. Its flexibility allows it to be applied across diverse data types, including interview transcripts, focus group discussions, and open-ended survey responses. NVivo is a robust qualitative data analysis (QDA) software that empowers researchers to organize, analyze, and interpret unstructured or semi-structured data [11]. In this study, we utilized NVivo to perform thematic analysis, leveraging its functionality to systematically code data and identify recurring themes and patterns. The Explore feature enables us to generate visualized charts and maps, as well as query specific words or text within the data.
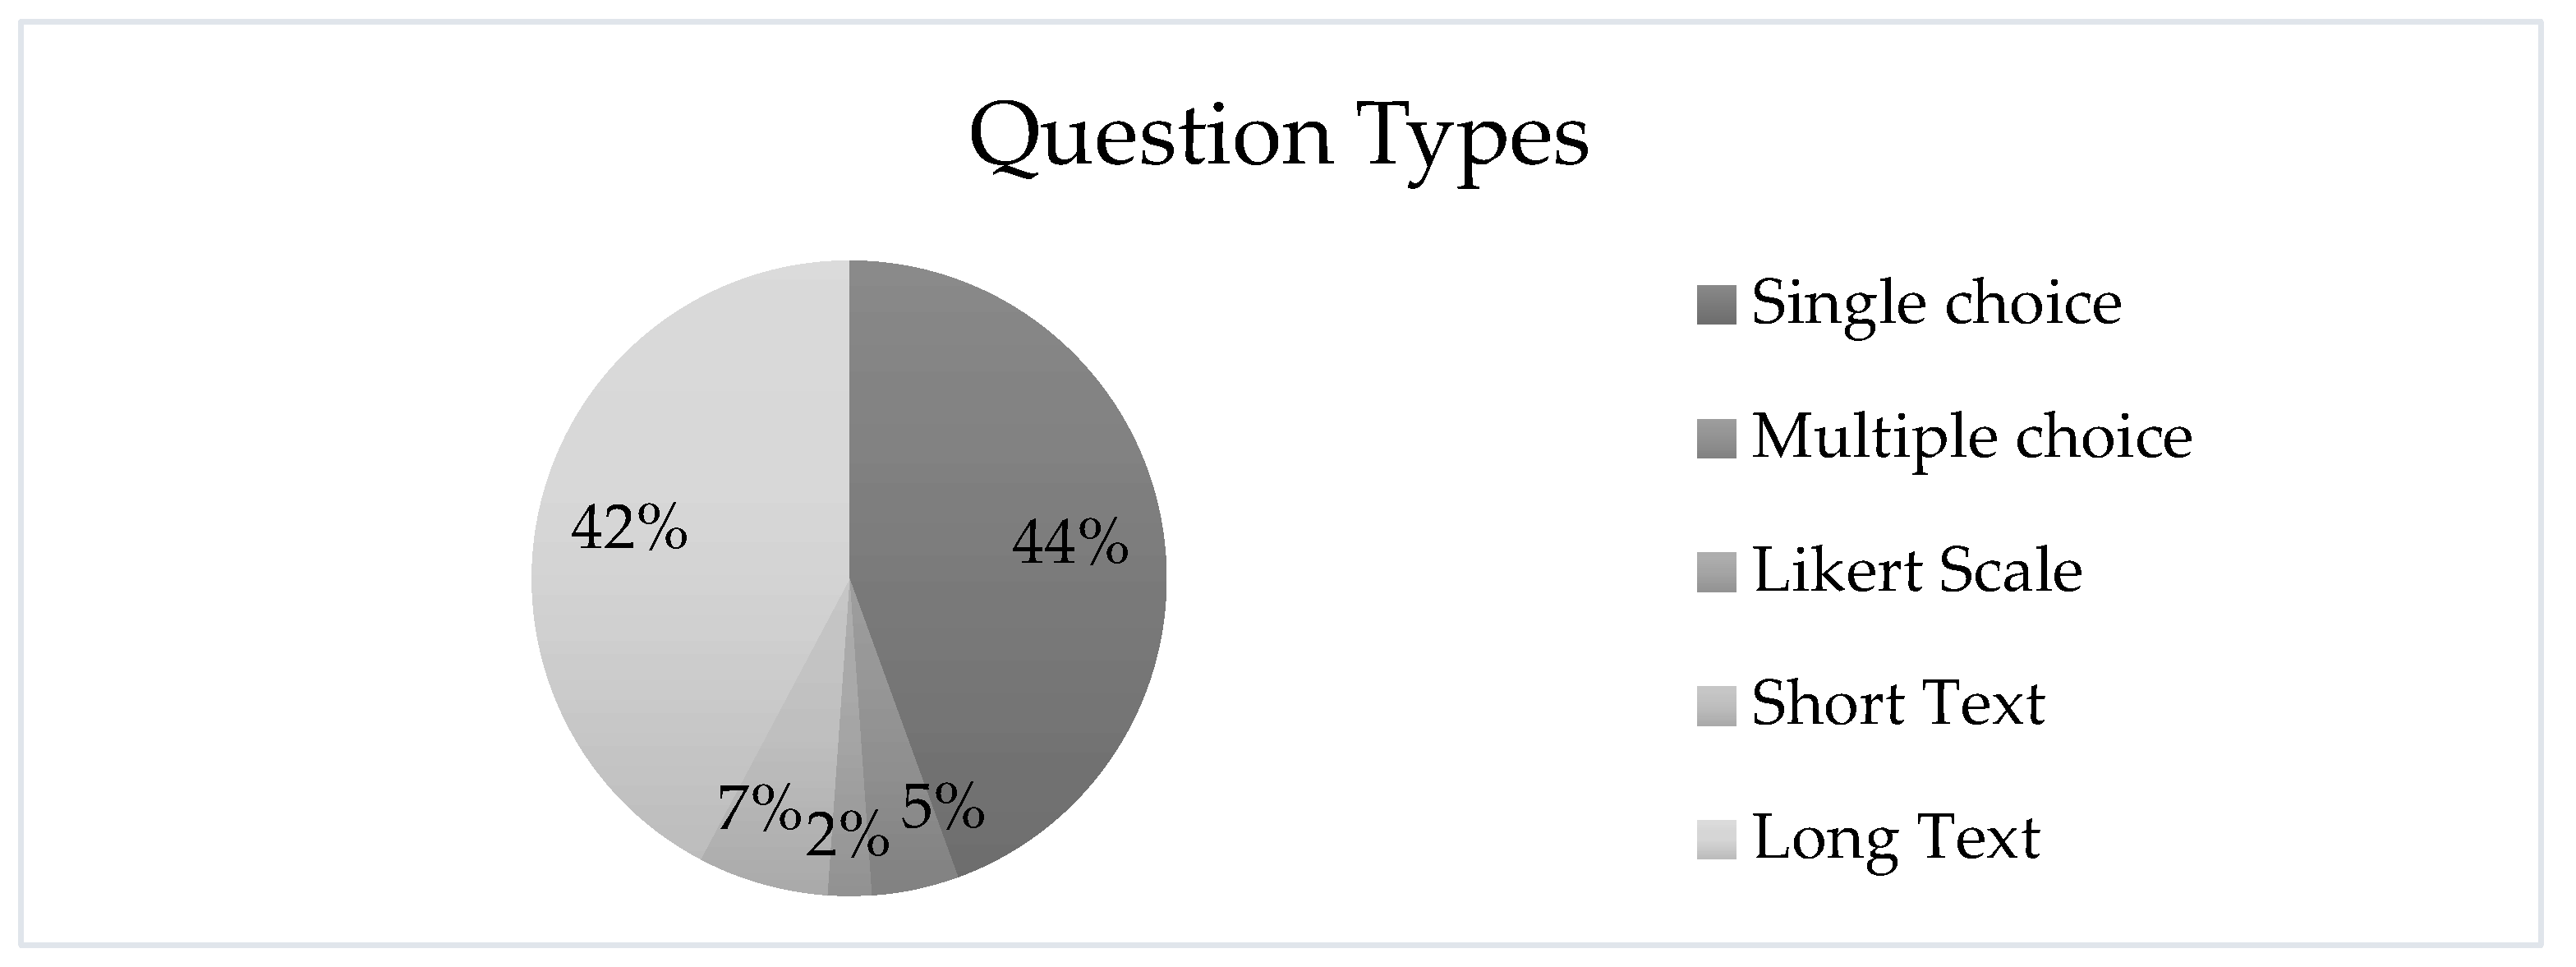
This study employed a semi-structured interview approach, in which an interview protocol was developed to guide the conversation. While the protocol included a mix of closed-ended and open-ended questions, the interview process remained flexible, allowing interviewees to share insights freely and enabling the discovery of perspectives beyond the scope of the existing thesis. The survey questions were designed to include both closed-ended and open-ended types (Figure 2). This approach ensures convenience for respondents while balancing the collection of statistical data and qualitative insights.
While closed-ended questions were used to gather demographic and contextual data—such as age, role, integration of sustainable practices, and opinions on entrepreneurial initiatives—open-ended questions explored deeper insights into challenges faced by startups, perceptions of traffic-related issues, and strategies for fostering entrepreneurial ecosystems.
Figure 3.
Bar chart showing the types of survey questions used in this study.
2.5. Thematic Analysis
Thematic analysis is a type of qualitative analysis. It is a technique searcher that involves examining qualitative data to identify recurring themes, topics, or patterns. It is a flexible method that can be applied to various types of data, such as interview transcripts, focus group discussions, surveys, or other textual data. Thematic analysis illustrates the data in detail and deals with diverse subjects via interpretations [13]. Thematic analysis was chosen as the primary analytic method for this research due to its flexibility. It supports independent coding and thematic analysis across multiple transcripts and textual data, promoting a nuanced and contextually grounded understanding of the findings.

Table 2.
Summary of thematic analysis steps [14].
Table 2.
Summary of thematic analysis steps [14].
| Steps | Description |
|---|---|
| 1 | Transcription, Familiarization with the Data, and Selection of Quotations |
| 2 | Selection of Keywords |
| 3 | Coding |
| 4 | Theme Development |
| 5 | Conceptualization Through Interpretation of Keywords, Codes, and Themes |
| 6 | Development of Conceptual Model |
Source: Adapted from Naeem et al. [14].
In this research, we combined both inductive and deductive methodologies in the context of thematic analysis. We began with a set of predefined themes or codes based on existing theories and literature, then read through the data multiple times to identify patterns, themes, and insights that emerged naturally. This bottom-up approach allows for new themes to be discovered that may not have been anticipated.
2.6. Ethical Considerations
2.6.1. Consent
We ensure that participant autonomy, voluntary participation, informed consent, written consent, and privacy are described as follows:
- Individuals had the right to make informed decisions about their involvement, including the ability to provide, withdraw, or control the use of their personal information;
- Participants engaged in the research willingly, without any form of pressure or coercion.
- Participants were fully informed about the research's purpose, procedures, risks, and benefits before agreeing to take part.
2.6.2. Anonymization
We prioritize the protection of participants' personal information and maintain strict confidentiality throughout the study. Only essential details—such as email, age, and city of residence—are collected solely for the purpose of research findings. This information is neither linked to individual identities nor shared with third parties for any other purposes, ensuring the utmost respect for participants' privacy. In accordance with data protection protocols, all submitted information will be permanently deleted one week after the report is submitted. Additionally, we ensure that every citation of participants' contributions will not directly reference their identities, maintaining strict confidentiality and respect for their privacy.
2.6.3. Integrity
Since the research aimed to provide objective insights, we implemented a procedure to ensure that the findings were rigorously double-checked by an independent professional party, thereby upholding ethical standards. The review includes checking for data integrity, verifying statistical methods, ensuring the logical flow of arguments, and assessing the clarity of the report.
3. Results
The research finding includes qualitative analysis, quantitative analysis, and case study analysis. While the qualitative analysis plays the critical role as the primary findings, helps us to narrow down the huge of data collection to achieve the research aims and objectives. Other analysis including quantitative analysis and case study strengthens the research to reach concrete and strong confidence of this research.
3.1. Quantivative Findings
3.1.1. Descriptive Statistics
Our first observation pertains to the demographics of the respondents. There was a total of 50 respondents, all of whom were over eighteen years old. The participants were categorized into distinct age brackets to facilitate a more detailed analysis (Figure 4).
To capture the depth of participants' understanding, this method was employed to explore complex questions that necessitate thoughtful reflection and experiential observation. Additionally, the participants came from various regions and countries around the world, ensuring that the data collected is diverse and objective—minimizing the risk of subjectivity and bias in the study. It was found that the participants are citizens who have lived in various cities around the world, including Paris (France), New York City (USA), London (UK), Hong Kong (China), Mulhouse (France), Leeds (UK), Rennes (France), Istanbul (Turkey), Madrid (Spain), Addis Ababa (Ethiopia), Abu Dhabi (UAE), Belfast (UK), Taipei (Taiwan), Ho Chi Minh City (Vietnam), Danang (Vietnam), Hanoi (Vietnam), and Binh Duong (Vietnam).
In examining the community engagement statistics, sentiment analysis results indicate that 73% of respondents believe entrepreneurial initiatives play a crucial role in driving sustainable urban development and addressing key challenges. These findings suggest strong confidence in the ability of entrepreneurship to foster innovation, improve infrastructure, and create inclusive solutions that contribute to long-term urban resilience. In addition, among the respondents, 45% believe that tech startups provide the greatest benefits to urban communities compared to local businesses and social enterprises. A strong majority—68% of respondents—believe that entrepreneurial projects play a vital role in driving economic growth in their area. These preferences highlight the transformative potential of technology-driven ventures in addressing urban challenges. In contrast, only 14% actively show regular interest, while the majority of respondents either never engage or do so only very rarely with entrepreneurial initiatives in their city. Meanwhile, the demand for community engagement is significantly higher compared to the actual figures collected; 36% of respondents answered yes when asked if they wished to have access to entrepreneurial innovations and projects.
Table 3.
Contrast between the belief in and engagement with entrepreneurial initiatives.
| Feedbacks | Percentage(%) | Mean | Standard Deviation (S.D.) |
|---|---|---|---|
| Entrepreneurial initiatives play a crucial role addressing key challenges | 73 | 0.594 | 0.308 |
| Regular interest with entrepreneurial initiatives in their city | 14 | 0.361 | 0.346 |
| Entrepreneurial projects play a vital role in driving economic growth | 68 | 0.765 | 0.303 |
| Wish to have access to entrepreneurial innovations and projects | 36 | 0.659 | 0.247 |
Similarly, the result also reveals that 71% of entrepreneurial respondents reported integrating sustainable practices into their business models. This significant majority demonstrates a growing trend among entrepreneurs to prioritize sustainability, reflecting both a shift in consumer expectations and the increasing awareness of environmental and social impacts in business operations. Such adoption indicates promising progress toward more sustainable economic systems. However, it also highlights room for improvement, as nearly 30% of respondents have yet to embrace these practices. Encouraging broader participation could further accelerate positive change in the business landscape.
3.1.2. Urban Performance Metrics
This analysis investigates the correlation between GII scores and urban performance metrics. GII scores for 77 cities worldwide was sourced from publicly available datasets provided by 2thinknow. A comprehensive set of 162 indicators was selected to construct the Innovation Cities Index ranking [15]. In parallel, urban street metrics were extracted using automated data mining techniques and scientific computing applied to the OpenStreetMap dataset, enabling a detailed assessment of urban infrastructure and spatial characteristics.
The OSMnx Python library was utilized to model and analyze the urban street networks and amenities of various cities. Version 2.0 of the OSMnx public API provides modules that support scientific research across multiple disciplines, including geography, urban planning, transportation engineering, and computer science [16]. At its core, OSMnx leverages graph theory as the fundamental modeling framework. A graph is a data structure composed of two sets: a set of nodes (N), representing intersections or points of interest, and a set of edges (E), representing the connections or streets between nodes. These edges are typically defined as pairs of nodes. This graph-based approach enables rigorous spatial and network analysis of urban infrastructure [16,17]. To estimate the sample size for analyzing the mathematical graph representations of urban environments, OSMnx provides the graph_from_gdfs function. This function enables the conversion of a MultiGraph or MultiDiGraph into node and edge GeoDataFrames, facilitating spatial and network-based analysis [18]. The following table presents sampling examples that was converted from each graph used in the calculation (Table 4):
After converting the original multi-directed graph to an undirected graph, edge directionality and duplicate edges are removed, resulting in a simplified representation of connectivity [19]. The essential metric, Average Degree, for cities measures the network connectivity—how many direct connections (edges) each node (vertex) has.
Table 5.
Example of Urban Performance Metrics in three largest cities in Vietnam (May, 2025).
| Attributes | Ha Noi City | Da Nang City | Ho Chi Minh City |
|---|---|---|---|
| Average Degree * | 2.57 | 2.72 | 2.45 |
| Clustering Coefficient | 0.02 | 0.03 | 0.02 |
| Green Space Density | 0.2384 | 0.7244 | 0.1547 |
| Urban Amenities Count | 13589 | 3005 | 10348 |
| Public Transport Stops Count | 4947 | 732 | 4939 |
* In term of urban form, a higher average degree often corresponds to more intersections and connections. A lower average degree might reflect a more sprawling and hierarchical layout.
While the Average Degree (AV) is calculated as follows
where kv is degree of node v, and n is number of nodes.
The local clustering coefficient indicates the level of cohesion in the neighborhood of a node [20]. The clustering coefficient of node v can be computed by:
where Ev is number of triangles involving node v.
The average clustering coefficient is the mean of the local clustering coefficients across all nodes:
The Green Space Density is calculated as the ratio of land designated as parks, forests, and meadows to the total land use within each city. This metric demonstrates the extent to which natural environments are integrated into urban landscapes, serving as an indicator of ecological sustainability and quality of life.
A regression analysis was conducted as an inferential statistical method to estimate the relationship between GII Score and Average Degree. Figure 5 illustrates this relationship across 77 cities worldwide, providing a visual representation of the observed trends.
The regression equation is expressed as follows:
where
and
the mean value of X, calculated using the dataset, is = 2.839, while the mean GII score is = 41.882. The equation for the calculation of coefficient of determination:
where
is residual sum of squares and
is total sum of squares.
Based on the results of the calculation, an R² value of 0.228 indicates that approximately 22.8% of the variance in the GII score can be explained by the Average Degree metric, the remaining 77.2% is due to other factors not included in this model. Additionally, p-value ≈ 0.000013 confirms that Average Degree has a meaningful impact on GII Score. This suggests that more efficient urban mobility—reflected in higher connectivity—may facilitate innovation by enhancing access to resources, services, and opportunities. Conversely, innovative environments may also drive improvements in mobility infrastructure. In contrast, an additional regression analysis examining the relationship between GII score and Green Space Density reveals that while environmental and spatial factors such as green areas and open spaces contribute significantly to urban livability, they are not primary drivers of innovation performance.
3.2. Qualitative Findings
The data sources for qualitative analysis are derived from survey responses, interviewee records, and transcriptions, ensuring a comprehensive and well-rounded examination of the subject matter. Drawing from these sources, the findings reveal nuanced variations in urban residents' concerns regarding spatial arrangements and the dynamics of space-sharing in their city. For example, respondents from London did not highlight concerns about public spaces and infrastructure but instead focused on housing-related issues. In contrast, Parisian respondents emphasized green spaces and areas for biking. Meanwhile, residents in Taipei (Taiwan) expressed concerns about public transportation accessibility, including sidewalks and proximity to transit options. Conversely, respondents from Ho Chi Minh City and Ha Noi City (Vietnam) were primarily worried about traffic congestion and parking challenges.
Undoubtedly, encouraging participation, engagement, and connection in entrepreneurial projects aimed at addressing challenges has led to a diverse range of responses. Some proposed innovative solutions such as urban gamification, user-friendly systems or applications, and enhanced accessibility. Other participants underscored different priorities, such as the need for accessible services, employment opportunities, economic development, and child-friendly spaces. For complex questions regarding residents' expectations on entrepreneurial projects, responses varied significantly. This variation is reflected in the differing perspectives: while some participants emphasized the critical role of local businesses, others expressed confidence in tech-based entrepreneurial initiatives, highlighting their potential as democratic solutions to urban challenges.
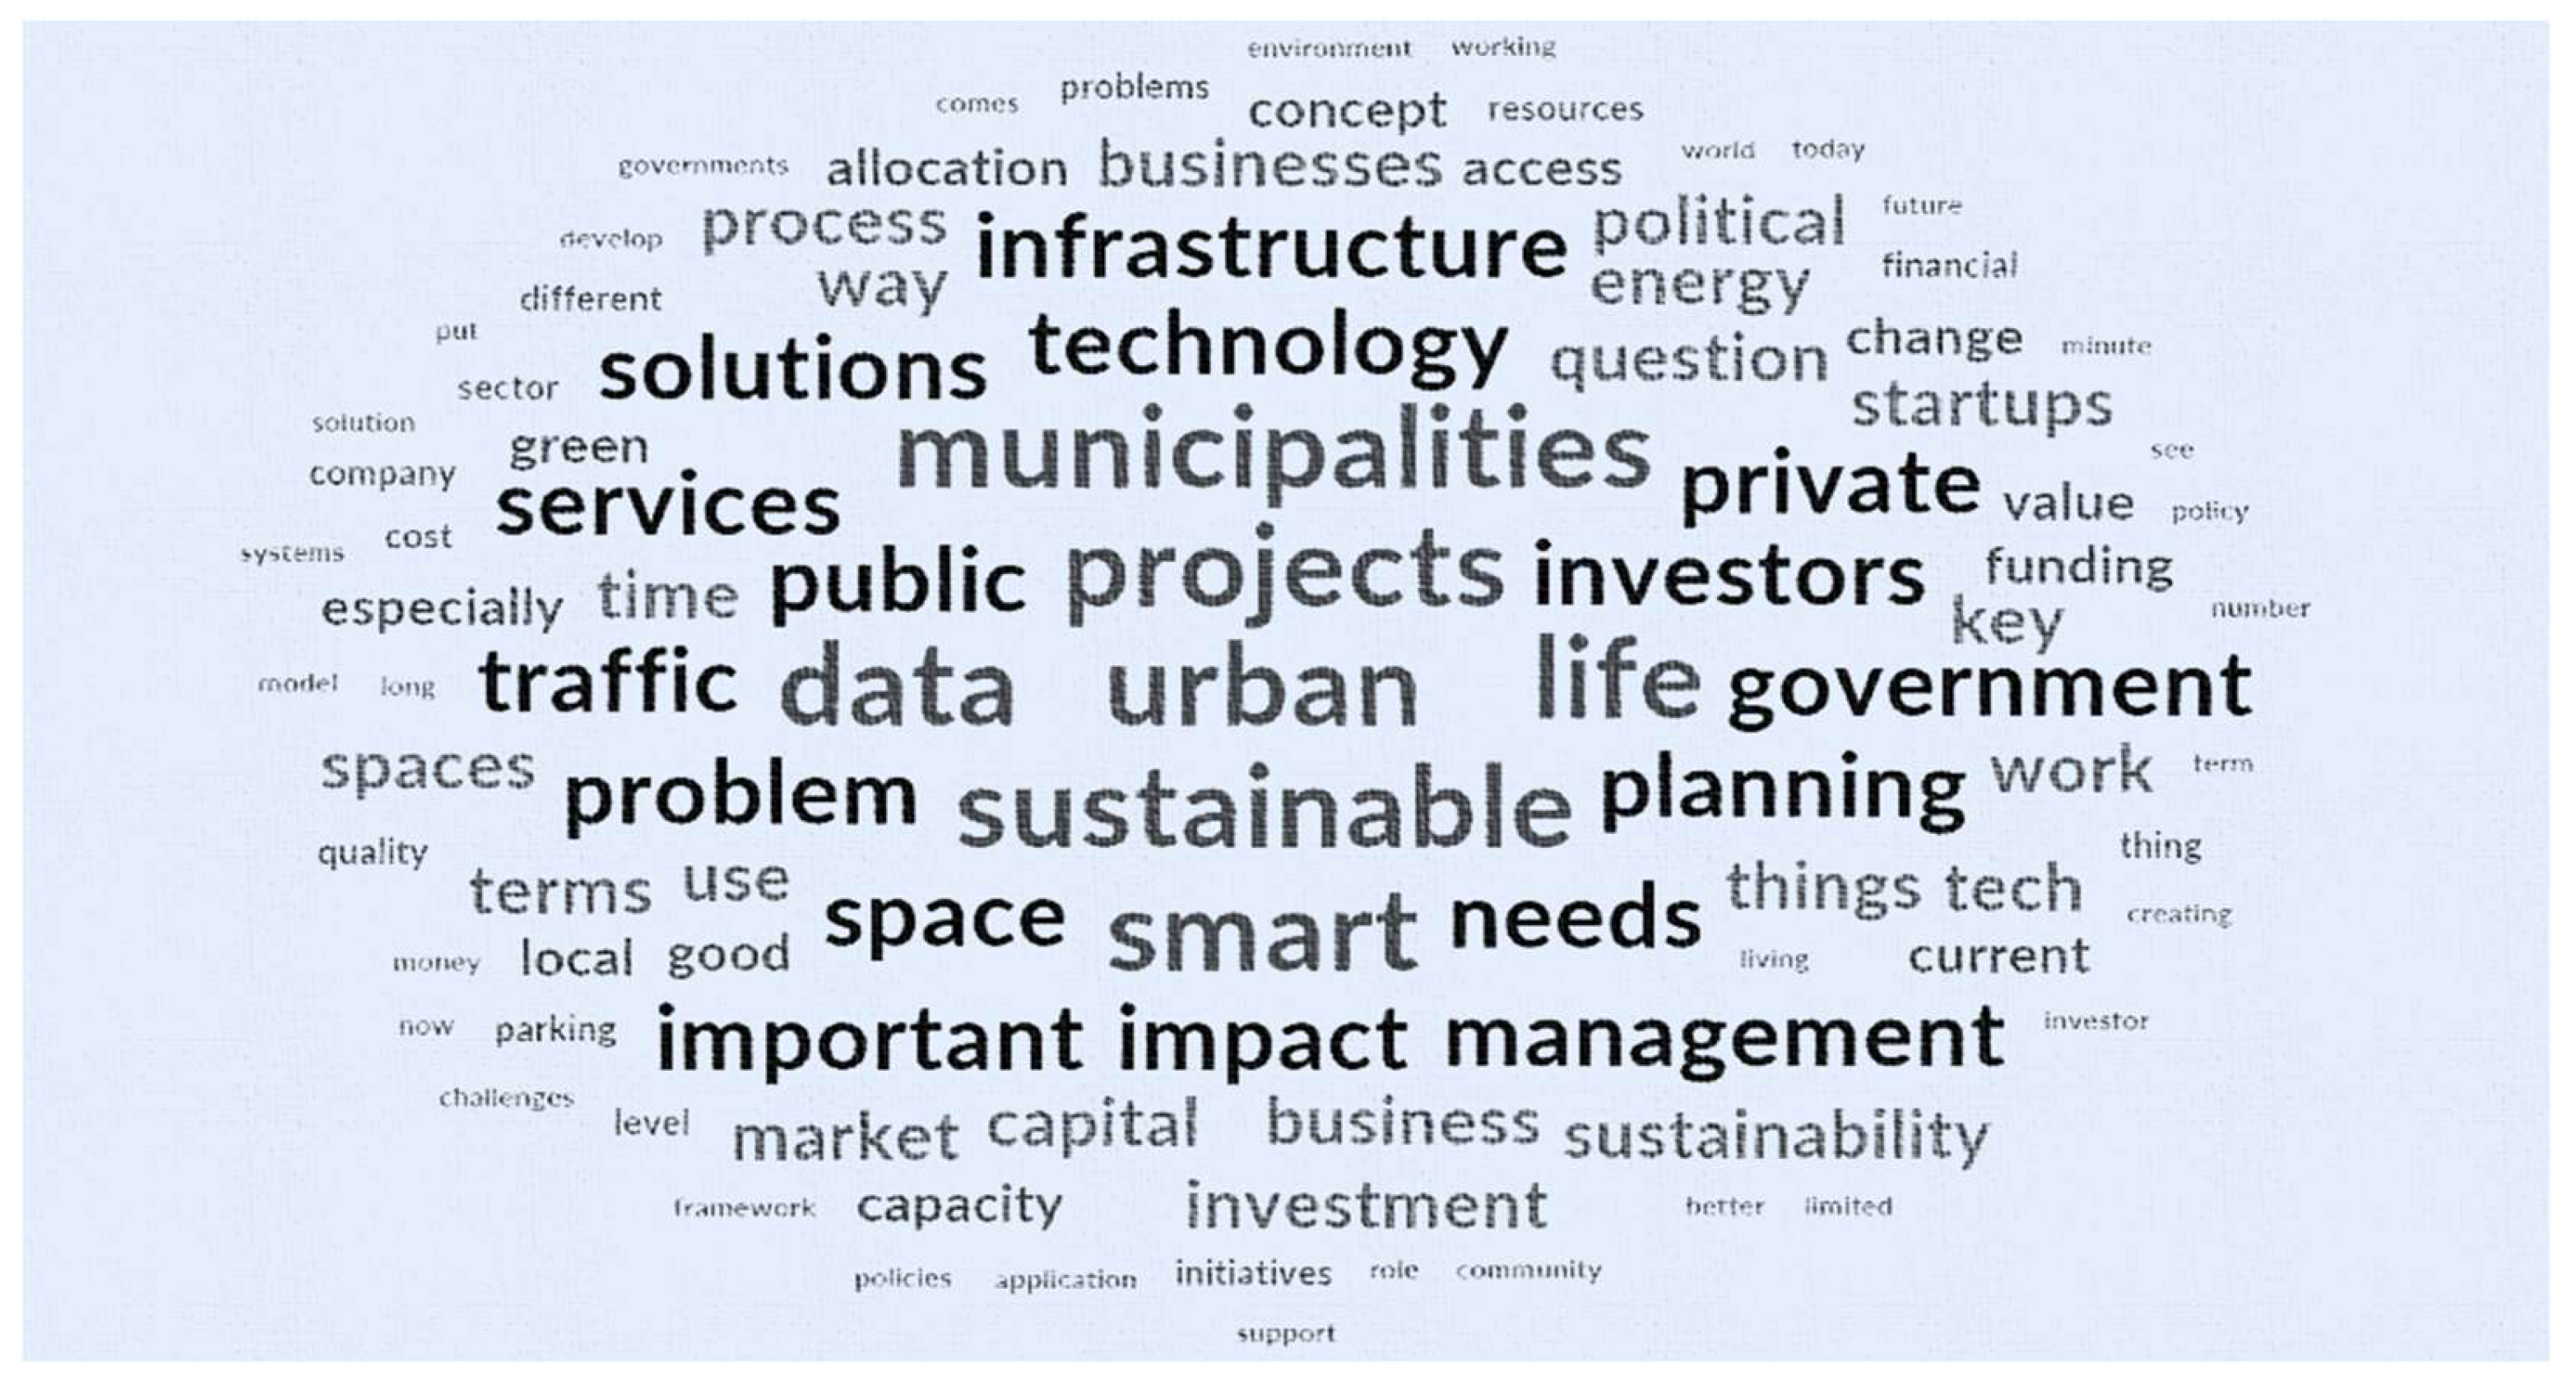
Figure 6.
Word frequency across all data sources, including interview transcripts, public conversations, and survey responses.
Figure 6.
Word frequency across all data sources, including interview transcripts, public conversations, and survey responses.
Thematic analysis was employed as a systematic and adaptable method for coding qualitative data, facilitating the identification of salient sub-themes throughout the analytical process. It enables the extraction of detailed attributes that effectively contribute to and reinforce meaningful insights, enriching the depth and reliability of the research findings. By applying the technique strictly to the collected data, we found six critical themes, as shown in the following table (Table 6):
Aligned with established theoretical research, one of the main themes—key factors driving entrepreneurial adoption of data-driven approaches have been categorized. Through analytical assessment, the study identified ten distinct patterns that supports the parent theme (Figure 7). Among the codes analyzed within this group, technology adoption capabilities emerged as the most influential factor, followed by strategic vision, team and network dynamics, marketing challenges, and regulatory constraints.
In contrast, from a startup's perspective, the most pressing challenge is the inability to master and adapt to emerging technologies, coupled with industry-specific obstacles that hinder growth and innovation. Qualitative data also reveals that while some entrepreneurs grasp these technologies at a know-how or how-to-use level, the persistent gap in advancing to the how-to-build level gives rise to notable consequences, including the absence of a data-driven approach to urban space development. Moreover, when considering other factors, several interviewees provided valuable insights that complement the established pattern; their perspectives add diversity and depth to the analysis, shedding light on nuanced elements that enrich the overall understanding. These observations reflect a broad range of experiences and viewpoints, offering a well-rounded foundation for drawing meaningful conclusions.
Figure 8 illustrates the theme Roles of Entrepreneurial Initiatives in Space Allocation and Urban Development, which is structured around three interrelated sub-themes: shaping urban governance, advancing smart city integration, and fostering community and social benefits. Together, these sub-themes reflect the multifaceted contributions of entrepreneurial initiatives to urban transformation, highlighting their influence on policy development, technological integration, and social inclusivity. Each sub-theme reflects a distinct dimension of how entrepreneurial initiatives contribute to the reconfiguration of urban spaces, influence policy-making processes, and promote inclusive development.
Each of three primary sub-themes further branches into a set of more specific sub-themes, identified through the systematic coding procedures of thematic analysis (see Figure 9, Figure 10, and Figure 11). For instance, within the sub-theme concerning the influence of entrepreneurial initiatives on urban governance, key dimensions include the effective utilization of societal resources and the development and expansion of urban green spaces and eco-friendly services. These are followed by additional, though less prominent, factors such as the creation of long-term investment returns, the promotion of sustainable finance, and the contribution of business growth to the broader goal of building sustainable cities.
The next two patterns identified in the analysis highlight the crucial roles of entrepreneurs and policymakers in fostering sustainable investment in urban areas. While each group of the patterns contributes through distinct responsibilities, their efforts are complementary—working together to establish effective co-creation strategies that attract investment and support sustainable urban development. The theme of Entrepreneurial Strategies to Attract Investment in Projects Aimed at Urban Services is anchored on six essential elements, each carrying different weights as in the following hierarchy chart (Figure 12):
In parallel, based on the data analysis, a strategic framework for policymakers aiming to attract investment has been developed. This framework consists of six distinct elements that illustrate actionable approaches for effectively drawing investment into sustainable initiatives (Figure 13). Its components are dominated by fostering collaboration and active engagement among parties and de-risking projects by sponsoring at early stages and encouraging stakeholder participation at all levels.
The bottom-up approach, applied through an inductive method, also identified two secondary themes. The entrepreneurship theory presented in Section 2.3.1 offers one of the most precise definitions of entrepreneurs, emphasizing their roles within both market dynamics and the broader economic context. Furthermore, the findings on barriers to investment in sustainable entrepreneurship are enriched by insights into investor oversight—particularly in relation to sustainable startup initiatives and the complexities involved in funding them. This analysis highlights the challenges entrepreneurial initiatives face in crafting strategies to attract investor support for sustainable urban development. While triple bottom line projects aim to deliver social, environmental, and economic benefits, their financial returns are often difficult to predict and quantify. Additionally, a lack of political will to address fund mismanagement—especially in cities or projects where accountability mechanisms are absent—further complicates investment efforts.
The last theme—vital role of stakeholder collaboration in driving success is played by the critical roles of various stakeholders—such as investors, governments, municipalities, private sectors, entrepreneurs, or citizens—as evident in the findings presented above. As entrepreneurs, their most actively engaged stakeholders are consumers and urban citizens. This theme offers suggestions on how to foster effective relationships with these groups through the adoption of specific practices.
3.3. Case Study Analysis
3.3.1. Background
There are several entrepreneurial initiatives to solve the problem of traffic congestion and pollution by allocating spaces for sustainability. Some of the most well-formed solutions of sustainable urban space allocation lie in three main domains: alternative ways of using spaces, sustainable resource management, and sustainable transportation. These three key solutions have emerged for promoting sustainable urban space allocation. Alternative ways of using spaces involve encouraging adaptive uses of space, which allow for flexible and innovative repurposing of underutilized urban areas. The sustainable resource management focuses on improving resource management through advanced infrastructure systems, including the implementation of smart grids, which enhance the efficiency of energy distribution and consumption. A notable example is the 2,000-watt Smart IT-Town initiative in Switzerland, an entrepreneurial project designed to reduce individual energy usage to 2,000 watts per person annually [21]. Whist, sustainable transportation emphasizes sustainable transportation strategies, these include the use of information technologies to optimize road space allocation and the expansion of shared mobility services, such as ride-sharing platforms and bike-sharing programs, which help reduce traffic congestion and lower emissions. Additionally, the promotion of electric vehicles (EVs) is supported through the development of EV infrastructure, including the installation of charging stations [22]. Additionally, the promotion of public transportation is supported through the implementation of transit-oriented development (TOD), a planning strategy that encourages the creation of compact, walkable communities centered around high-quality public transit systems. TOD aims to minimize car dependency by maximizing access to walking, cycling, and public transit options, thereby fostering more sustainable and livable urban environments [23].
To illustrate these points, this research delves into two detailed case studies, examining their correlation with various factors and stakeholders.
3.3.2. 15-Minutes City Framework
The concept offers a novel perspective of chrono-urbanism—thinking about cities in terms of time, proximity, and daily and seasonal rhythms [24]. Its key ambition is to “repair” car-centric cities by moving toward a model of mixed-use neighborhoods where residents are within 15 minutes of essential services using non-polluting forms of transportation, such as walking, biking, or public transport. It relies on the seven basic principles of human-scale urban design: density, diversity, flexibility, proximity, digitalization, and connectivity. These principles can contribute to social, economic, and environmental sustainability in various ways [25,26].
- The entrepreneurial adoption of data-driven approaches: It plays a pivotal role in advancing urban innovation. Central to this is the foundational principle of the Smart City concept, which involves deploying a diverse array of technologies to optimize various dimensions of urban infrastructure and services. A network of interconnected Internet of Things (IoT) devices enables real-time data collection and transmission to centralized systems, where the data is processed, analyzed, and disseminated to relevant urban departments for responsive action. When integrated with advanced technologies such as artificial intelligence (AI), big data analytics, machine learning, and crowd computing, these systems collectively support the realization of the 15-Minute City model—a vision for urban living that emphasizes accessibility, sustainability, and reduced reliance on private vehicles [24].
- The critical role of essential urban services in sustainable development: In the 15-Minute City model, startups and entrepreneurs contribute by developing innovative Information and Communication Technology (ICT) services that align with the concept, such as flexible parking solutions, bike-sharing services, and dynamic spaces for hourly essential service providers. These can include tech-driven urban mobility solutions, smart city technologies, and sustainable business practices. Other services related to public spaces, parks, and cultural amenities—often overlooked in the past—experienced a surge in popularity and demand with the implementation of the 15-Minute City concept. This newfound demand for soft mobility and community-based urban services is forcing mayors and city managers to facilitate and, where possible, render those temporary urban responses permanent [24];
- The implementation of the 15-Minute City philosophy has led policymakers to acknowledge the importance of delivering proximity-based services to urban residents. Achieving this vision requires coordinated investment and active collaboration among multiple stakeholders, including private companies, startups, and public institutions. This has led to a comprehensive review of urban policies, particularly in transportation and infrastructure, which are viewed as connective threads to addressing various urban challenges. While banks and financial institutions focus on large-scale infrastructure projects, private investors play a critical role in funding real estate developments and innovative entrepreneurial urban solutions.
3.3.3. SLink Service
SLink’s solution offers a convergence of technological methodologies that enable parking demand to be met by leveraging existing spaces or shared parking zones, thereby reducing the need for new construction [26]. Instead of using a broad framework, analyzing SLink—an early adopter in diffusion of innovation (DOI) theory—provides practical insights into entrepreneurial strategies that focus directly on customer and market engagement through a specific case study.
Indeed, this solution strengthens the democratic approach by fostering collaboration among distributed service providers and city resources while also attracting community and consumer involvement. According to Salalabs (2025), the solution integrates IoT and AI to collect real-time data on all parking spaces within cities, streamlining this information to navigation apps [26,27]. This enables more flexible and responsive usage for consumers, policymakers, and service providers. Such integration is essential for the development of a sustainable and intelligent transportation system, as it facilitates real-time decision-making, optimizes mobility patterns, and enhances overall urban efficiency. The scarcity of parking lots leads to constant cruising for free spots, which not only wastes time but also contributes to air pollution and unnecessary fuel consumption as drivers search for parking. However, in a developing country like Vietnam, attracting investment for urban sustainable development faces common challenges, as highlighted in this research. Effective collaboration among all parties, particularly city planners, is essential.
4. Discussion
4.1. Interpret Themes
Drawing on data analysis and supported by case studies of the 15-Minute City and the SLink service, the findings identify the primary finding that underscores the practical challenges entrepreneurs encounter in implementing data-driven solutions, these factors are shaped by a combination of internal dynamics and external influences. The roles of entrepreneurial initiatives in space allocation and urban development explain how urban services, particularly space allocation, influence urban governance, enhance social benefits, and support the integration of smart city initiatives. Alongside with these finding, by exploring the holistic relationships among multiple levels of stakeholders, this study has uncovered practical strategies that entrepreneurs and policymakers can implement to attract investments for projects aimed at optimizing urban space allocation.
Unlike much of the existing literature, which tends to emphasize technical feasibility, this study highlights the importance of aligning innovation with real-world operational dynamics. This is particularly relevant when the goal is to catalyze a new wave of collaboration through strategies focused on startup initiatives—such as co-creation approaches designed to attract investment and actively engage citizens in data-driven technological applications.
4.2. Theoretical and Practical Implications
The following section explores both the theoretical and practical aspects of implementation within this study. After reviewing relevant theories and conceptual models, the analysis integrates insights from the social sciences to examine diverse stakeholder dynamics. By combining these perspectives with the structured, logical methodologies of computer science, the study addresses complex questions in ways that uphold academic rigor while remaining practically relevant across disciplinary boundaries. In addition to the theoretical foundations, the anticipated practical implications of this study include the following:
- Enhanced urban sustainability: Entrepreneurial strategies for space allocation and optimization can lead to more sustainable urban development practices, benefiting both the environment and the community;
- Policy development: Insights from research can inform policy-making, helping to create supportive environments for sustainable urban development;
- Community benefits: The research will highlight the social benefits of space sharing, such as improved quality of life and community building, thereby encouraging more inclusive urban development;
- Investment attraction: By proposing strategies to attract investment in sustainable urban initiatives, this research contributes to the evaluation of funding mechanisms and support structures for entrepreneurial projects aimed at advancing urban sustainability;
- Knowledge advancement: Advancing academic knowledge in urban planning, sustainability, and entrepreneurship provides a foundation for future research and innovation.
4.3. Limitation
Despite the strengths of the research design and outcomes, several limitations must be considered to contextualize the results. The data collection process was selectively carried out by the researchers, which naturally brings certain limitations in knowledge and perspective. As such, it does not fully or entirely capture the complete essence of the study's content. Additionally, the limited number of survey participants may have impacted the quality of the data available for analysis. Moreover, as qualitative analysis served as the primary method in this study, we acknowledge the potential for errors in the research findings. While the results and evaluations presented here are intended for reference purposes only, we hope they offer fresh perspectives and contribute to new insights within the field.
4.4. Recommendations
The findings of this study offer valuable recommendations for addressing challenges in sustainable urban development, particularly where entrepreneurial initiatives have yet to fulfill their full potential. Notably, the study encourages efforts to implement data-driven and smart solutions by first highlighting urban residents’ expectations and the challenges faced by entrepreneurs. It also reveals how differing priorities among stakeholders—such as policymakers and investors—can hinder collaboration and innovation. In response, the study proposes a strategic framework and a set of actionable co-creation strategies to guide implementation. To conclude, both short-term and long-term recommendations are categorized as follows:
In the short term, stakeholders should not only emphasize but also work together to focus on:
- Democratic entrepreneurial initiatives;
- Data-driven solution adoption;
-
Sustainable urban services and community-centric.Along with that, in the long term, decision-makers and entrepreneurs should work together:
- De-risk sustainable urban investment;
- Create a livable urban framework;
- Expand impact elements;
- Establish an ideal and effective pattern for their smart city model.
5. Conclusion
This study, grounded in a practical project, addresses a pressing real-world challenge. Although this issue has been repeatedly recognized and debated within entrepreneurial ecosystems, it remains fundamentally unresolved. Indeed, within sophisticated urban social networks, stakeholders continue to focus on managing immediate challenges and navigating established systems, yet often hesitate to take meaningful action or engage in collaborative efforts to address deeper, systemic problems. Using an interdisciplinary approach for this study, we applied a logical approach to substantiate bold assertions and provide clarity on the matter. The study begins with the review and integration of multiple academic theories and conceptual models, exploring societal phenomena to identify urgent and actionable directions. The data was collected from multiple sources and stakeholders to ensure clarity and confidence in the finding. The analysis of the collected data was carried out through rigorous testing and repeated cross-referencing. Traditional approaches, such as thematic analysis, were integrated with advanced computational techniques to mine and interpret a large dataset effectively. The descriptive statistics highlight a critical need for a bottom-up approach to foster greater engagement of urban communities and residents in entrepreneurial activities—an element that plays a vital role in urban planning and environmental sustainability. Meanwhile, the inferential statistics suggest that urban innovation may be more associated with infrastructure, accessibility, education, and economic factors than by environmental factors. Following the quantitative findings, qualitative findings highlight three key objectives as follows:
Firstly, the study conducted an in-depth analysis of the entrepreneurial adoption of data-driven approaches, with a particular focus on the key factors influencing this trend. The survey and interview data also revealed relevant insights, offering compelling perspectives through convincing and sharp opinions from multi-level stakeholders within their cities. These factors and shared insights complement each other, providing this study with a comprehensive and extensive perspective on the research objectives.
Secondly, the study examined how urban services—especially the way urban space is allocated—affect governance, influence the daily lives of city residents, and shape the implementation of Smart City initiatives. The analysis addressed all aspects of the objective and provided a comprehensive answer, which was further supported by case studies such as the 15-Minute City and the SLink service. By analyzing these case studies, we gained deeper insights into how practical services impact the real world, marketing strategies, and people's lives.
Lastly, the strategies to attract investment in sustainable urban development were analyzed through two key patterns: Entrepreneurial strategies emphasize innovative business models and creative approaches that entrepreneurs employ to attract investment in urban services and optimize space allocation. On the other hand, policymaker strategies refer to the regulatory frameworks and policy tools designed to encourage and support sustainable investment in urban development. The co-creation of these strategies by entrepreneurs and policymakers is important for fostering sustainable investment in urban cities.
Despite the valuable insights drawn from the conclusions, certain methodological constraints warrant consideration. Notably, this study does not explore in-depth factors such as technological determinism, cultural needs, or the influence of local context. Future research could expand the scope by investigating the long-term effects of digital nomadism on urban development—particularly in relation to human, societal, and cultural dimensions within a data-driven society and governance framework. Additionally, while the findings highlight the importance of quadruple helix partnerships and stakeholder co-creation in attracting investment, they also point to a critical gap: the lack of a robust framework to align investor interests with those of other stakeholders. This gap highlights an opportunity for future research to develop strategies that foster balanced collaboration and mutual benefit.
Author Contributions
Conceptualization, D.P.N.; methodology, D.P.N.; software, D.P.N.; validation, D.P.N. and S.M.G; formal analysis, D.P.N.; investigation, D.P.N.; resources, D.P.N.; data curation, D.P.N.; writing—original draft preparation, D.P.N.; writing—review and editing, D.P.N. and S.M.G; visualization, D.P.N.; supervision, S.M.G; project administration, D.P.N. All authors have read and agreed to the published version of the manuscript.
Funding
This research received no external funding
Institutional Review Board Statement
Ethical review and approval were waived for this study due to the use of anonymized survey data with no personally identifiable information retained.
Informed Consent Statement
Informed consent was obtained from all subjects involved in the study. Written informed consent has been obtained from the patient(s) to publish this paper.
Data Availability Statement
The dataset used in this study was retrieved from OpenStreetMap using Python-based tools. Data were accessed via the OSM public API using the osmnx library (version 2.0.4). The queries were executed in March 2025, and the data reflect the status of OpenStreetMap at that time. OpenStreetMap data is freely available at https://www.openstreetmap.org.
Acknowledgments
The authors gratefully acknowledge the support of all those who contributed to data collection, including assistance with interviews and survey distribution, especially Ms. Minh Uyen Nguyen Nho for her technical support with the survey. The authors would like to express our heartfelt gratitude to the Academic Team at the Swiss Information and Management Institute for their invaluable support throughout this research. The authors also acknowledge the generous allocation of time and resources by Salalabs Vietnam, which made this study possible. Moreover, during the preparation of this study, the authors used Python (version 3.13) and Microsoft Office Forms for data collection and analysis, and NVivo (version 14) for thematic analysis. The authors have reviewed and validated all outputs and take full responsibility for the accuracy and integrity of the results presented in this publication. Additionally, during the preparation of this manuscript, the authors used M365 Copilot to assist with language refinement and formatting. The authors have reviewed, edited, and verified the output to ensure accuracy and originality and take full responsibility for the content of this publication.
Conflicts of Interest
The authors declare no conflicts of interest.
Abbreviations
The following abbreviations are used in this manuscript:
| GII | Global Innovation Index |
| DOI | Diffusion of Innovation |
| TBL | Triple Bottom Line |
| QDA | Qualitative Data Analysis |
| IT | Information Technology |
| EV | Electric Vehicles |
| TOD | Transit Oriented Development |
| IoT | Internet of Things |
| AI | Artificial Intelligence |
| ICT | Information and Communication Technology |
References
- Soussan, J.; McGrath, T. Report on Sustainable Urbanization in Viet Nam: Recommendations to Improve the Legal Framework. Deutsche Gesellschaft für Internationale Zusammenarbeit (GIZ) GmbH, 2019.
- Schumpeter, J.A. The Theory of Economic Development; Transaction Publishers: New Brunswick, NJ, USA, 1934; reprinted 2008. [Google Scholar]
- Rogers, E.M. Diffusion of Innovations, 5th ed.; Simon and Schuster: New York, NY, USA, 2003. [Google Scholar]
- Dearing, J.W. Applying Diffusion of Innovation Theory to Intervention Development. Res. Soc. Work Pract. 2009, 19, 503–518. [Google Scholar] [CrossRef] [PubMed]
- Majeed, A.; Rauf, I. Graph Theory: A Comprehensive Survey about Graph Theory Applications in Computer Science and Social Networks. Inventions 2020, 5, 10. [Google Scholar] [CrossRef]
- Phillips, J.D.; Schwanghart, W.; Heckmann, T. Graph Theory in the Geosciences. Earth-Sci. Rev. 2015, 143, 147–160. [Google Scholar] [CrossRef]
- Combe, C. Introduction to Global Sustainable Management, 1st ed.; SAGE Publications Ltd: London, UK, 2022. [Google Scholar]
- Shi, F.; Shi, W. A Critical Review of Smart City Frameworks: New Criteria to Consider When Building Smart City Framework. ISPRS Int. J. Geo-Inf. 2023, 12, 364. [Google Scholar] [CrossRef]
- Project Jupyter. Jupyter. Available online: https://jupyter.org/ (accessed on 22 April 2025).
- Microsoft Tech Community. Three New Intelligence and Insights Features from Microsoft Forms – April 2021. Available online: https://techcommunity.microsoft.com/blog/microsoftformsblog/three-new-intelligence-and-insights-features-from-microsoft-forms--april-2021/2280828 (accessed on 12 March 2025).
- Dhakal, K. NVivo. Journal of the Medical Library Association. 2022, 110, 270–272. [Google Scholar] [CrossRef] [PubMed]
- General Statistics Office of Vietnam. Area statistics of Vietnamese cities 2024. Available online: https://www.gis.gso.gov.vn/ (accessed on 30 June 2025).
- Boyatzis, R. Transforming Qualitative Information: Thematic Analysis and Code Development; Sage: Thousand Oaks, CA, USA, 1998. [Google Scholar]
- Naeem, M., Ozuem, W., Howell, K., & Ranfagni, S. A Step-by-Step Process of Thematic Analysis to Develop a Conceptual Model in Qualitative Research. International Journal of Qualitative Methods, 2023. [CrossRef]
- 2thinknow. Innovation Cities™ Index 2022–2023: World's Most Innovative Cities. Innovation Cities™ Index. Available online: https://innovation-cities.com/worlds-most-innovative-cities-2022-2023-city-rankings/26453/ (accessed on 10 July 2025).
- Boeing, G. Modeling and Analyzing Urban Networks and Amenities With OSMnx. Geographical Analysis. 2025. [CrossRef]
- Boeing, G. Urban spatial order: street network orientation, configuration, and entropy. Applied Network Science. 2019, 4, 67. [Google Scholar] [CrossRef]
- User Reference – OSMnx 2.0.4 Documentation. 2025. Available online: https://osmnx.readthedocs.io/en/stable/user-reference.html (accessed on 12 April 2025).
- Grinberg, D. An Introduction to Graph Theory; Text for Math 530, Spring 2022, Drexel University; Spring 2025 edition.; 7 June 2025.
- Kong, X.; Shi, Y.; Yu, S.; Liu, J.; Xia, F. Academic social networks: Modeling, analysis, mining and applications. J. Network and Computer Application 2019, 132, 86–103. [Google Scholar] [CrossRef]
- Stulz, R.; Tanner, S.; Sigg, R. Swiss 2000-Watt Society: A Sustainable Energy Vision for the Future. In Energy, Sustainability and the Environment: Technology, Incentives, Behavior; Elsevier: Amsterdam, The Netherlands, 2011; pp. 477–496. [Google Scholar] [CrossRef]
- Valença, G.; Moura, F.; Morais de Sá, A. Where is it complex to reallocate road space? Environ. Plan. B Urban Anal. City Sci. 2023, 51, 1290–1307. [Google Scholar] [CrossRef]
- Ollivier, G.; Ghate, A.; Bankim, K.; Mehta, P. Transit-Oriented Development Implementation Resources and Tools, 2nd ed.; World Bank: Washington, DC, USA, 2021. [Google Scholar] [CrossRef]
- Moreno, C.; Allam, Z.; Chabaud, D.; Gall, C.; Pratlong, F. Introducing the “15-Minute City”: Sustainability, Resilience and Place Identity in Future Post-Pandemic Cities. Smart Cities . 2021, 4, 93–111. [Google Scholar] [CrossRef]
- Khavarian-Garmsir, A.R.; Sharifi, A.; Sadeghi, A. The 15-Minute City: Urban Planning and Design Efforts toward Creating Sustainable Neighborhoods. Cities . 2023, 132, 104101. [Google Scholar] [CrossRef]
- Salalabs. Salalabs Proudly Introduces SLink. Published online 30 December 2024. Available online: https://salalabs.com/news/Salalabs-proudly-introduces-sLink/ (accessed on 15 January 2025).
- Salalabs. Ecosystem of SLink. Published online 15 March 2025. Available online: https://slink.salalabs.com/ (accessed on 20 March 2025).
Figure 2.
Bar chart illustrating the distribution of open-ended and closed-ended questions used in this study.
Figure 2.
Bar chart illustrating the distribution of open-ended and closed-ended questions used in this study.
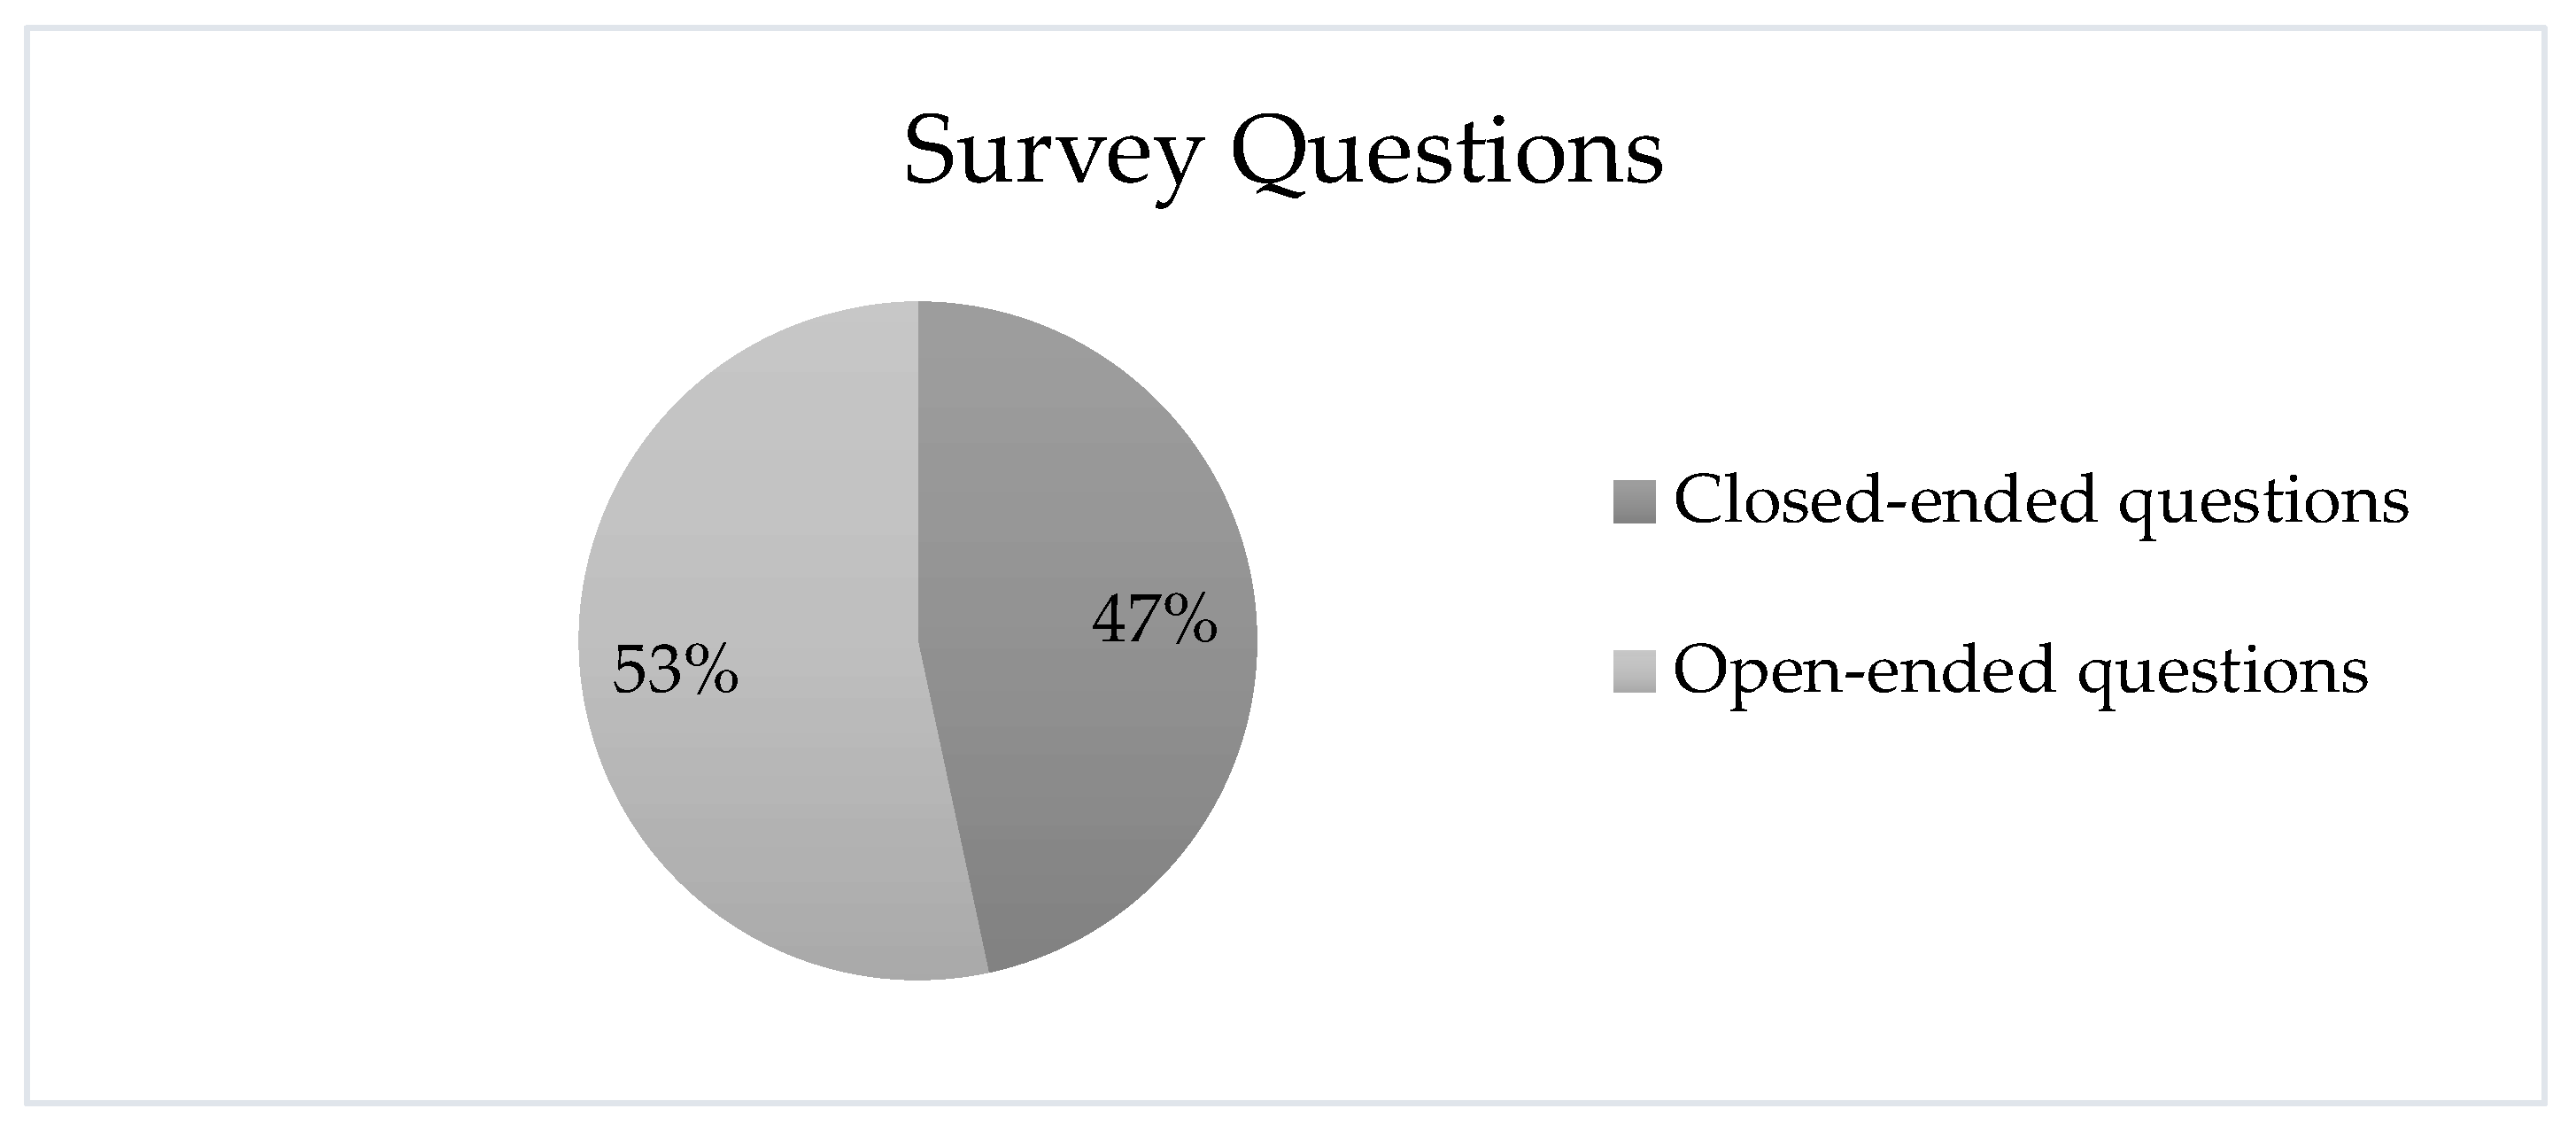
Figure 4.
Bar chart illustrating survey respondents' demographics.
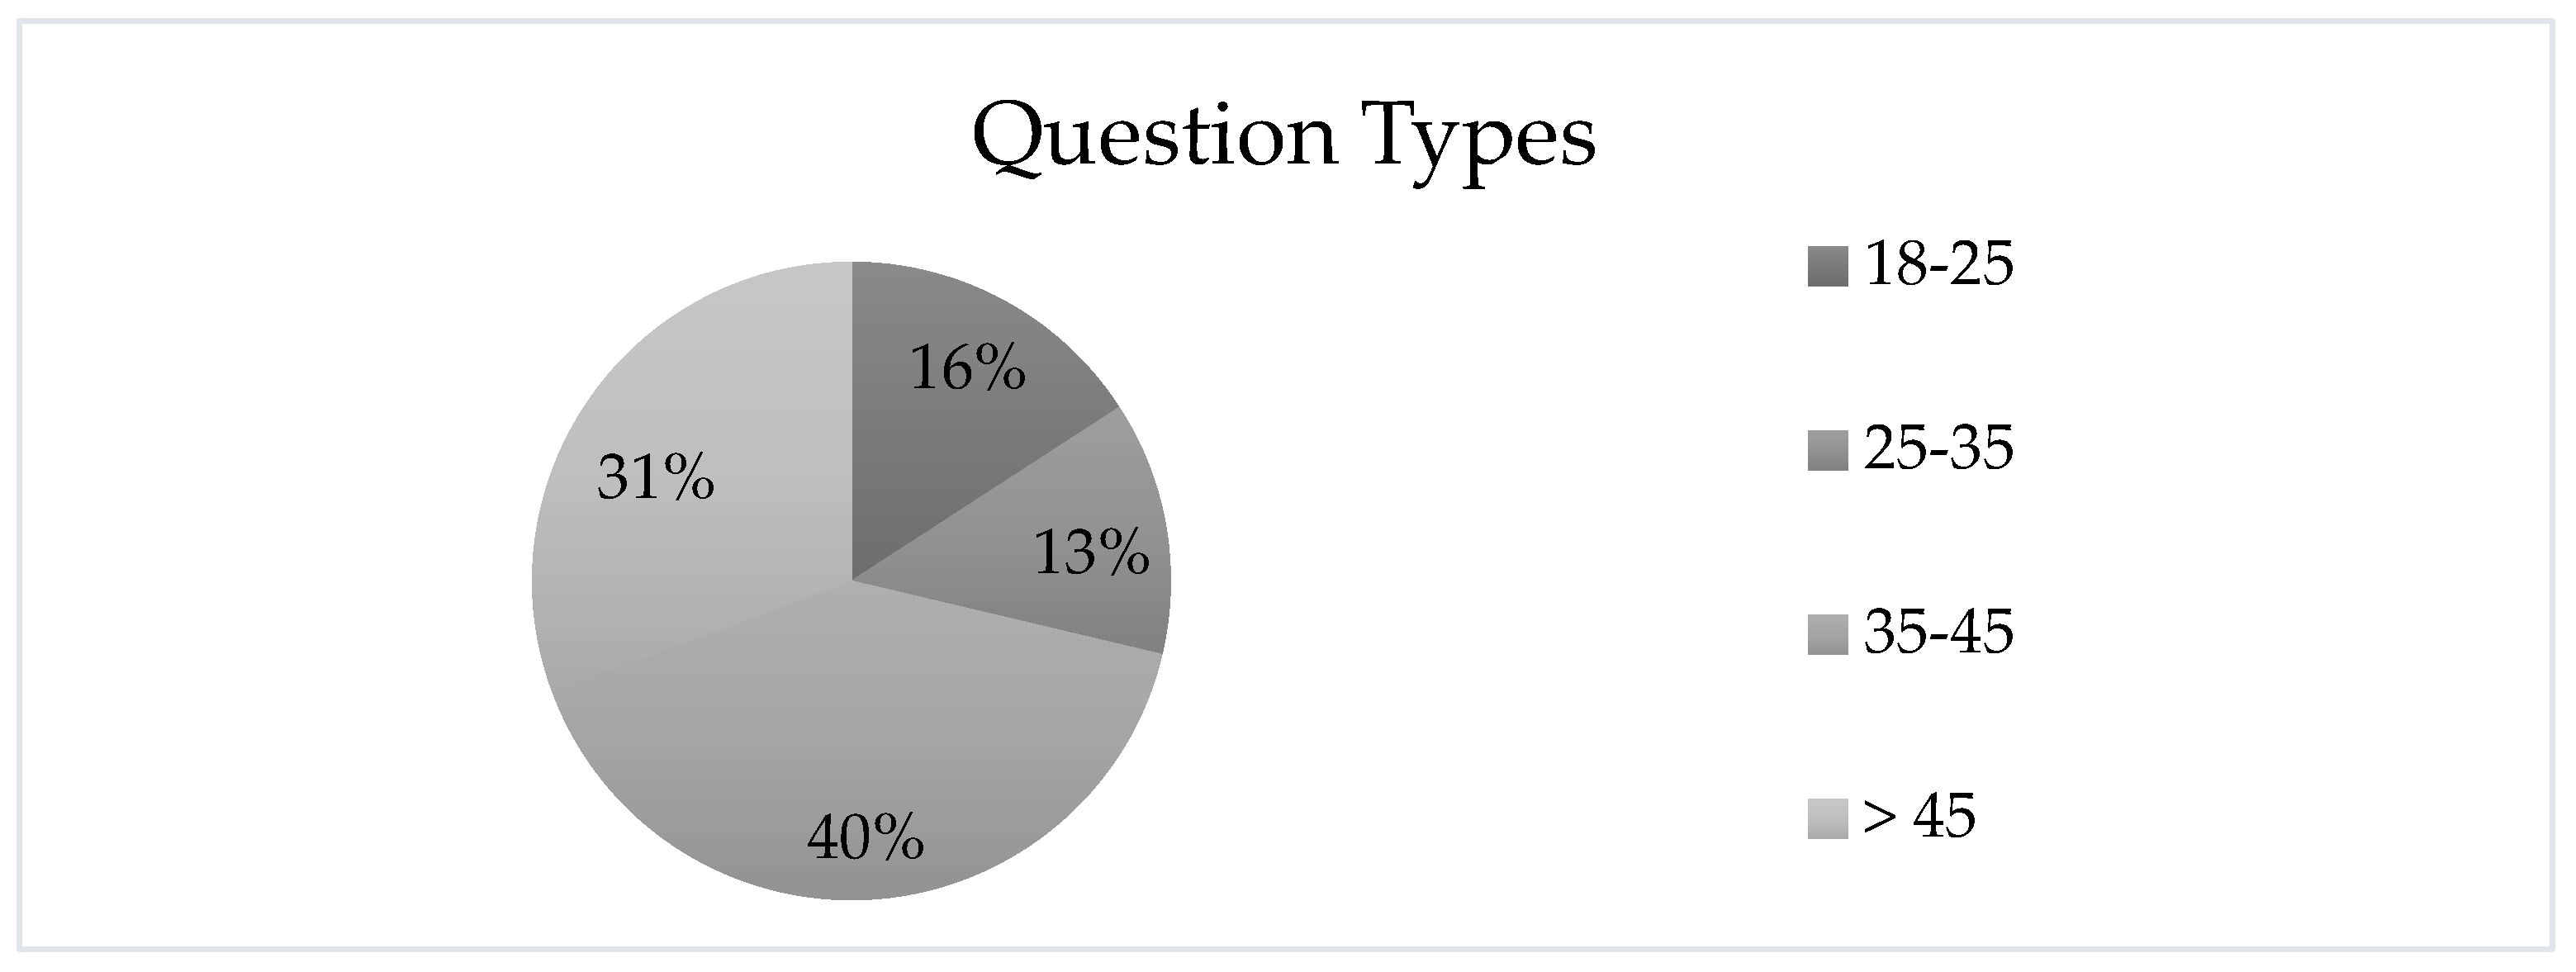
Figure 5.
Scatter Plot with Regression Line Illustrating the Association Between GII Scores and Average Degree Across 77 Cities Worldwide.
Figure 5.
Scatter Plot with Regression Line Illustrating the Association Between GII Scores and Average Degree Across 77 Cities Worldwide.
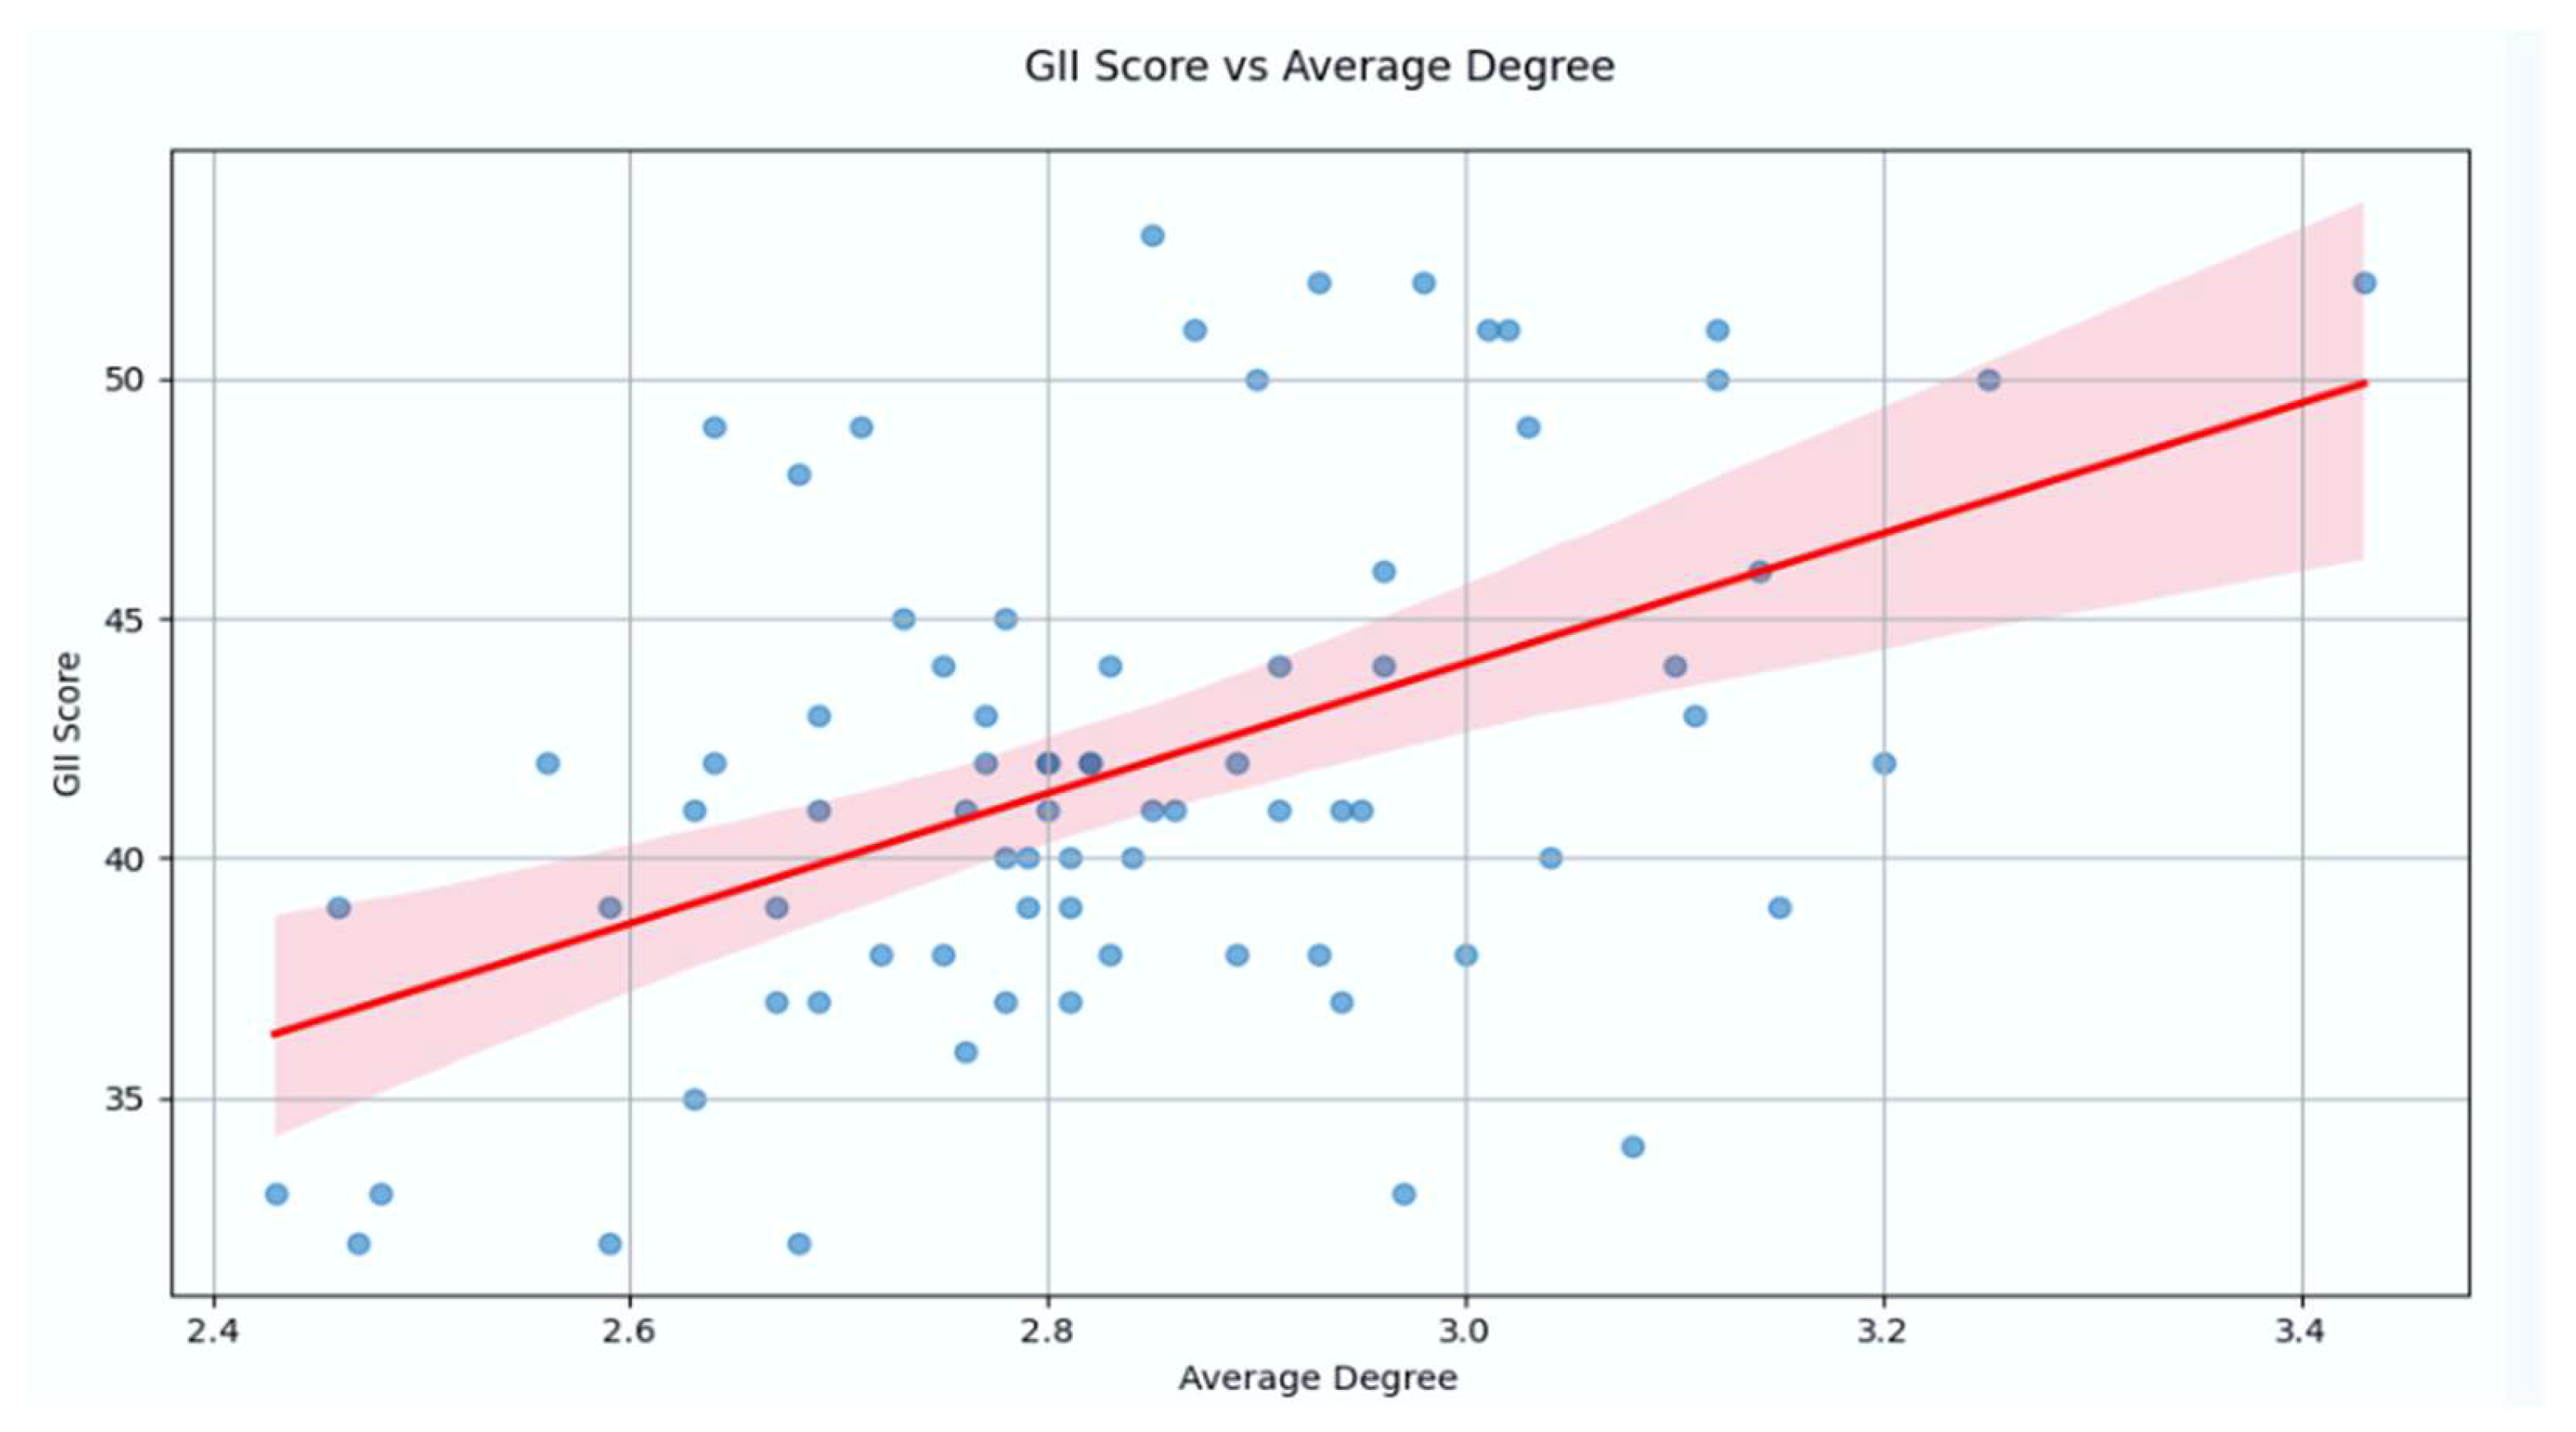
Figure 7.
Hierarchy Chart of Key Factors Driving Entrepreneurial Adoption of Data-Driven Approaches
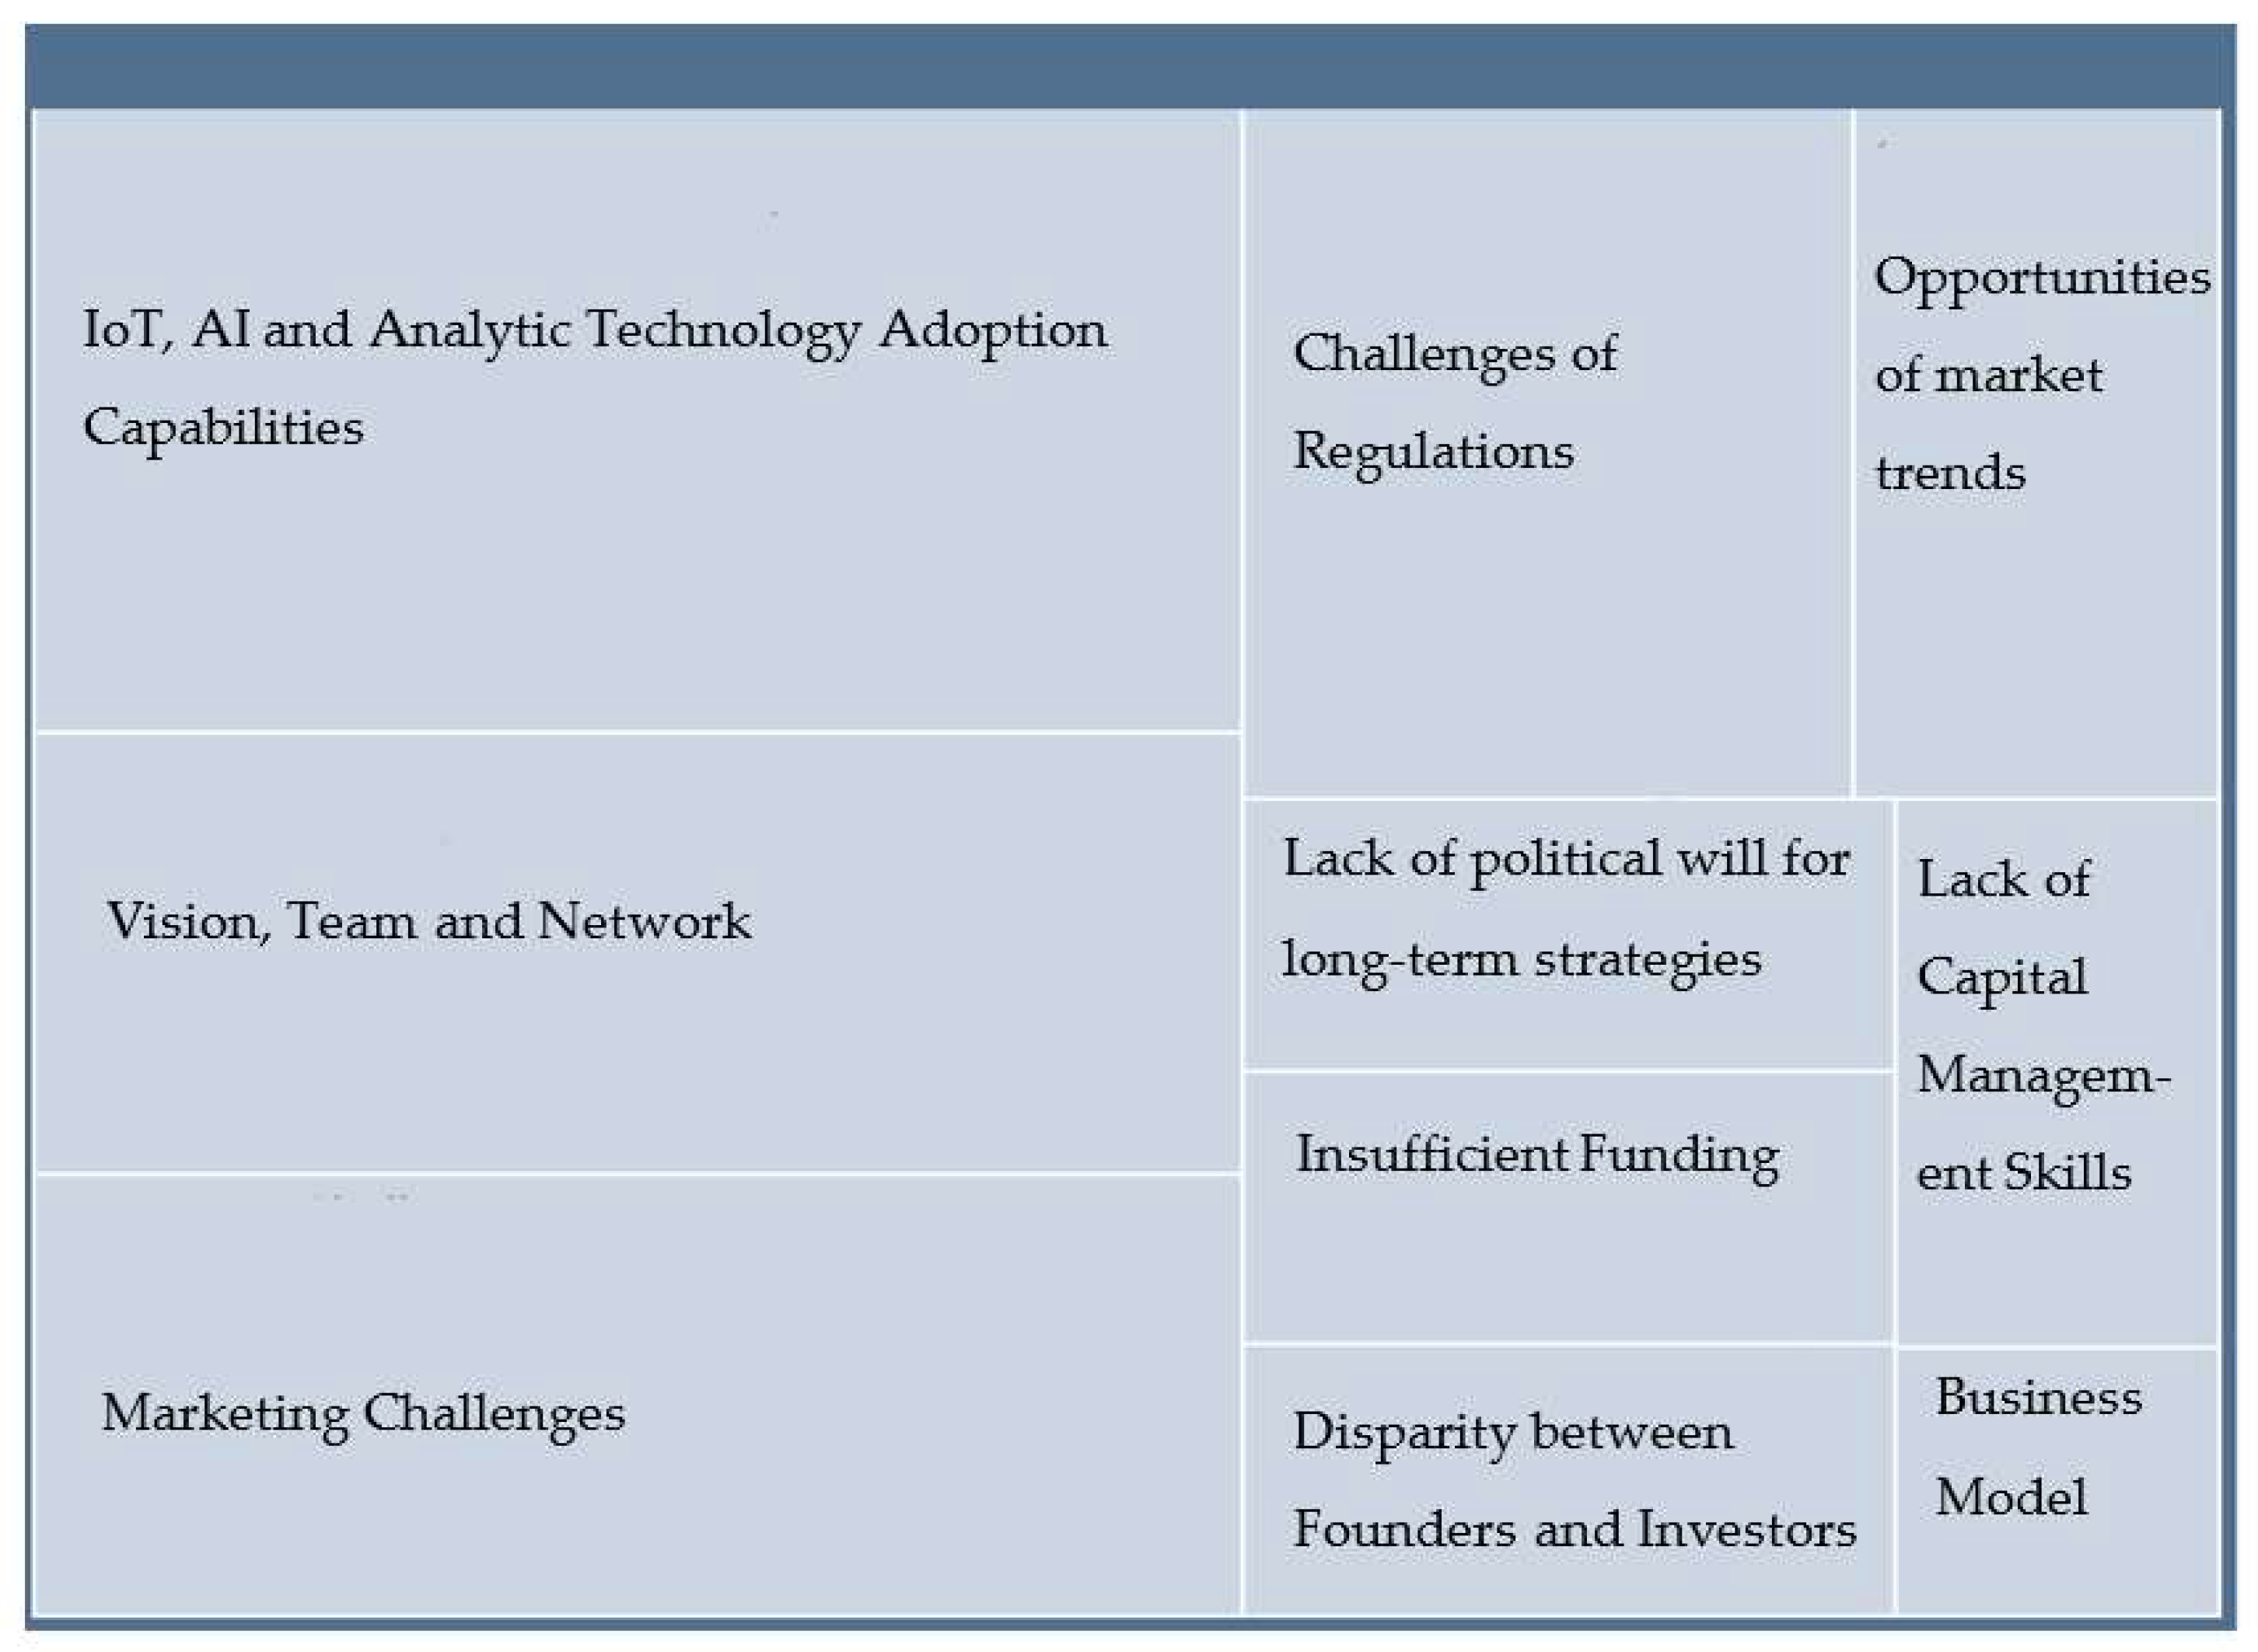
Figure 8.
Key Elements of Entrepreneurial Initiatives in Space Allocation for Urban Development.
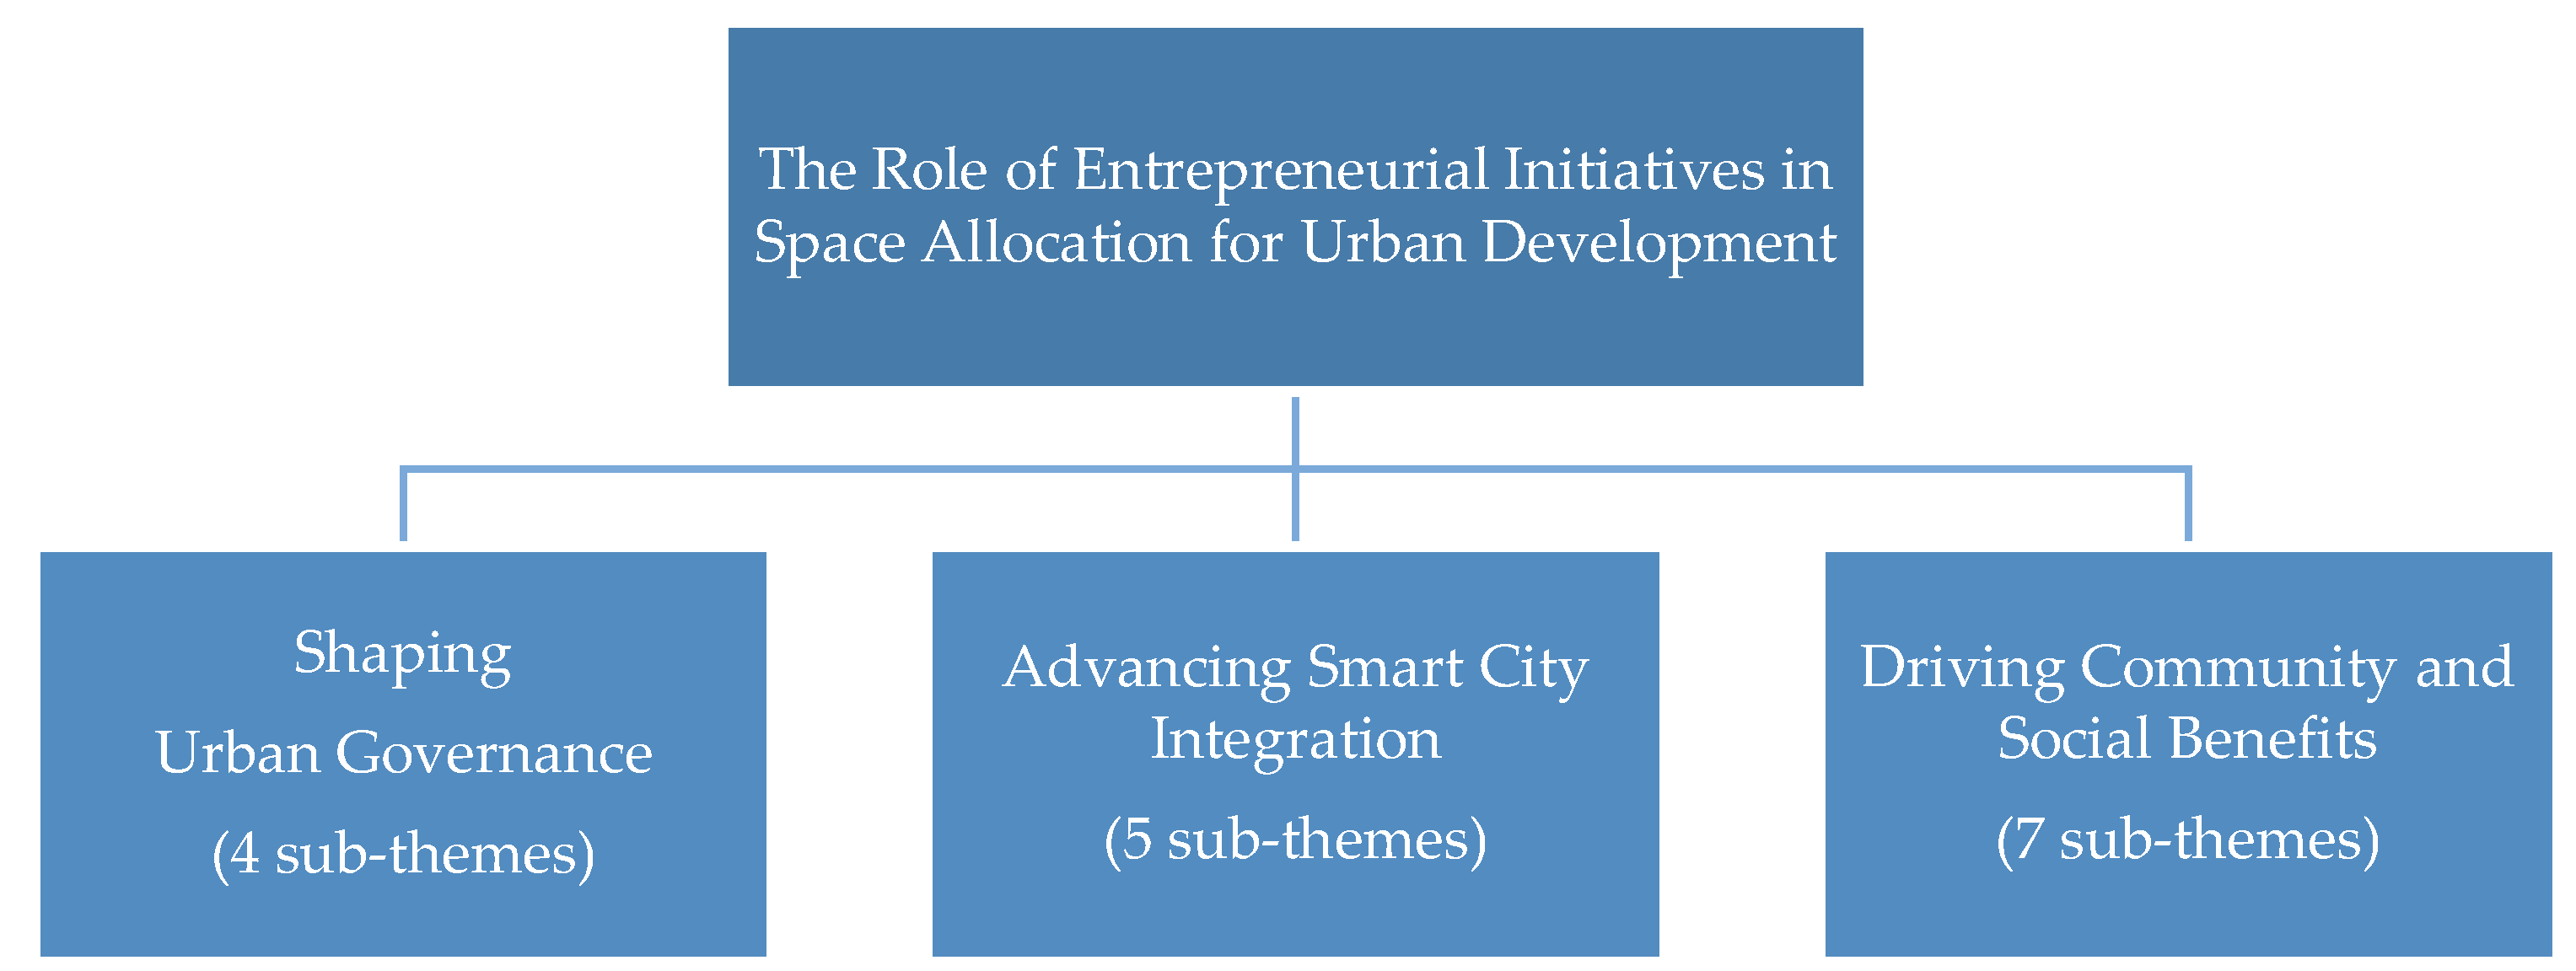
Figure 9.
Hierarchical Chart Illustrating the Influence of Entrepreneurial Initiatives in Urban Space Services on Urban Governance.
Figure 9.
Hierarchical Chart Illustrating the Influence of Entrepreneurial Initiatives in Urban Space Services on Urban Governance.
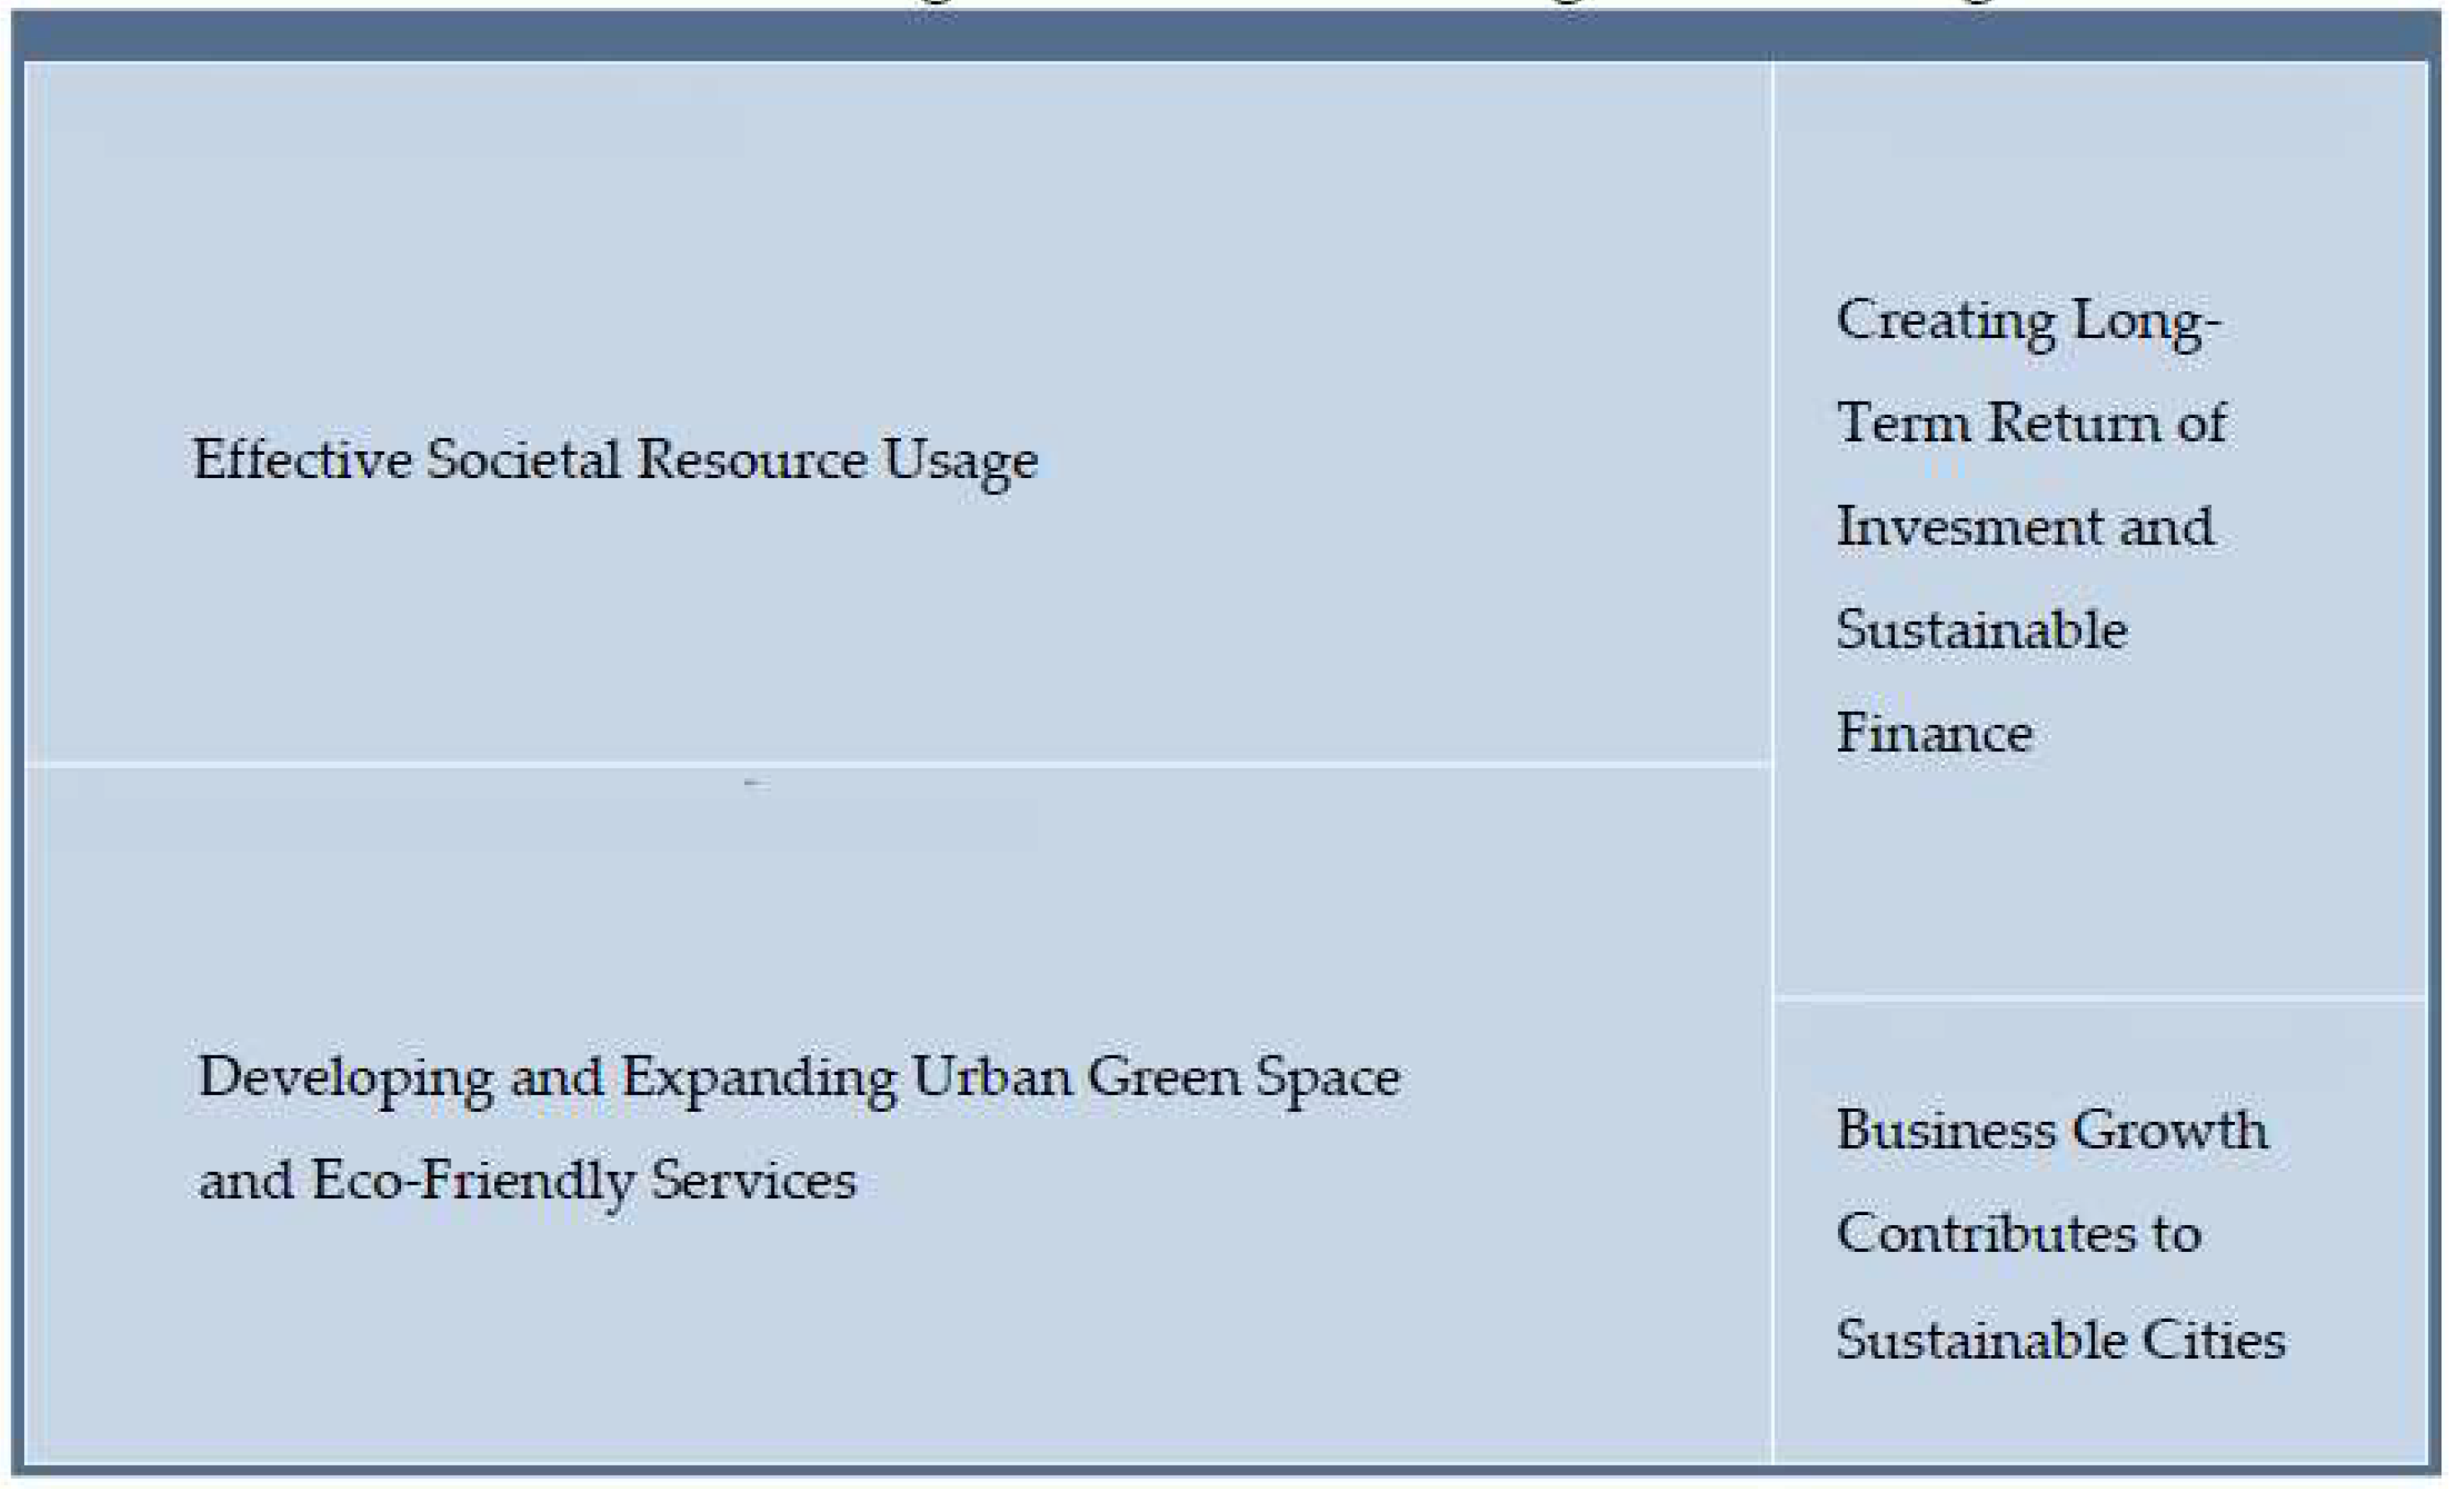
Figure 10.
Hierarchical Chart Illustrating the Influence of Entrepreneurial Initiatives in Urban Space Services on Advancing Smart City Integration.
Figure 10.
Hierarchical Chart Illustrating the Influence of Entrepreneurial Initiatives in Urban Space Services on Advancing Smart City Integration.
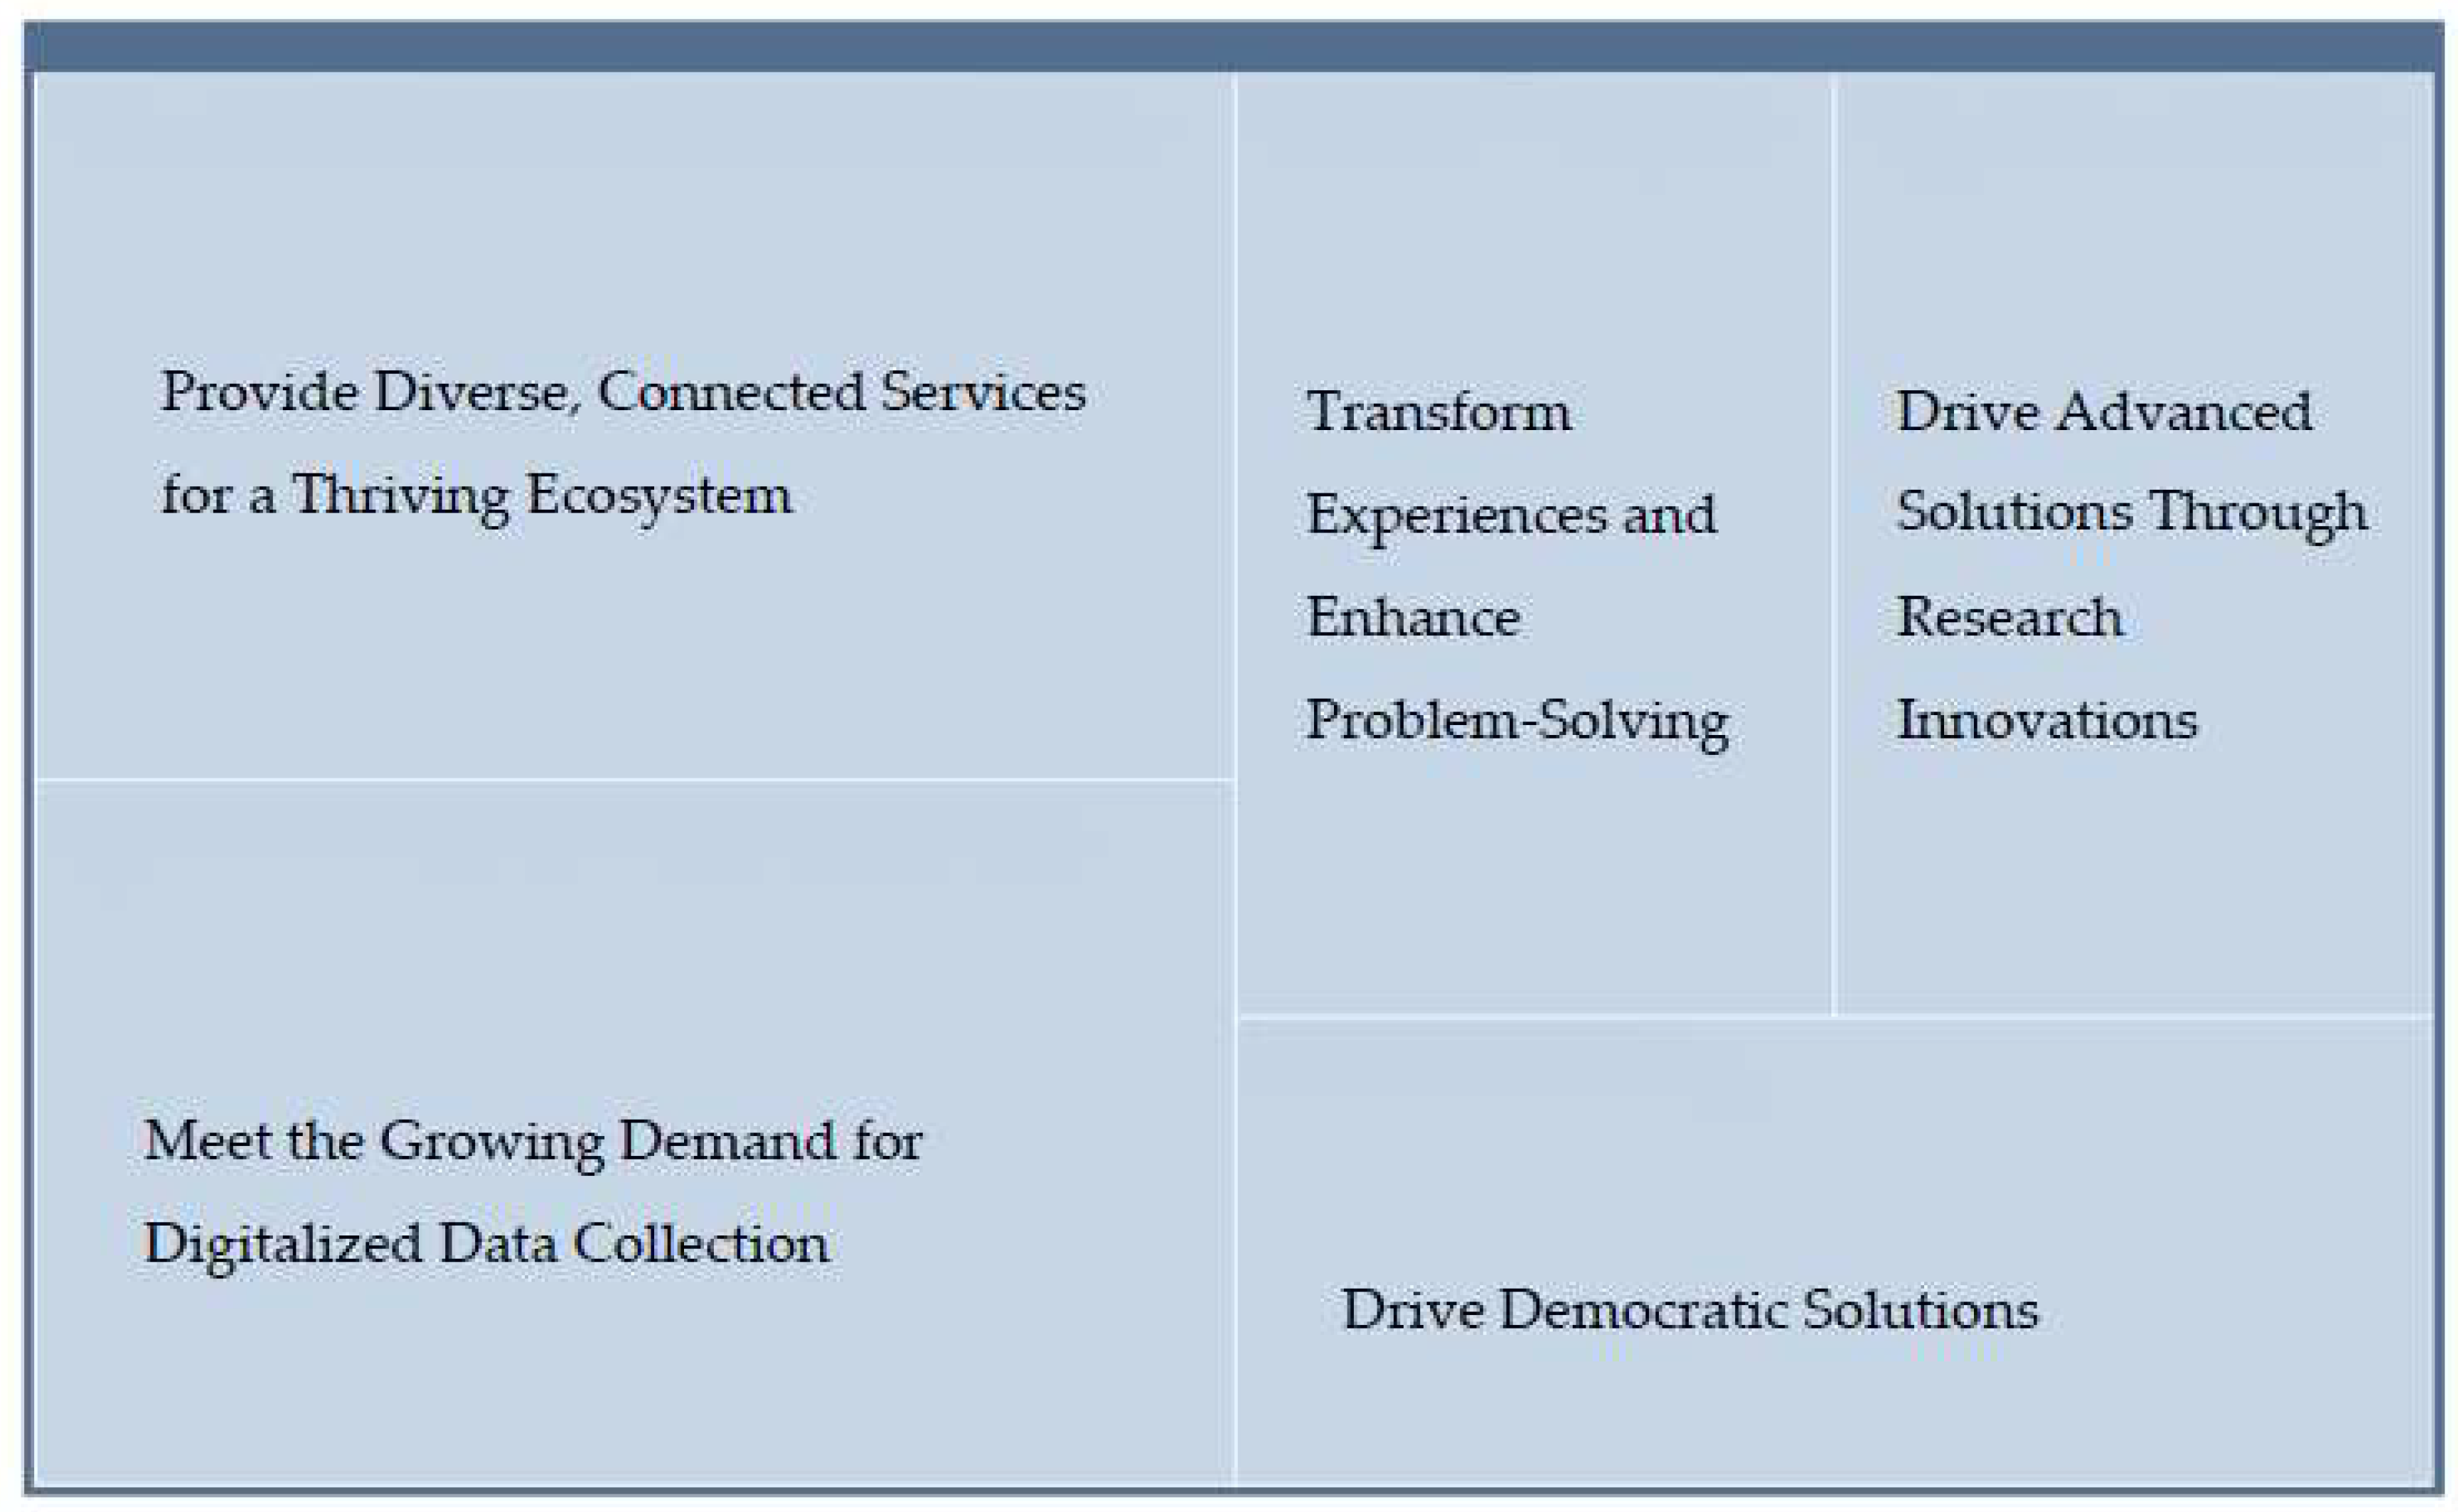
Figure 11.
Hierarchical Chart Illustrating the Influence of Entrepreneurial Initiatives in Urban Space Services on Driving Community and Social Benefits.
Figure 11.
Hierarchical Chart Illustrating the Influence of Entrepreneurial Initiatives in Urban Space Services on Driving Community and Social Benefits.
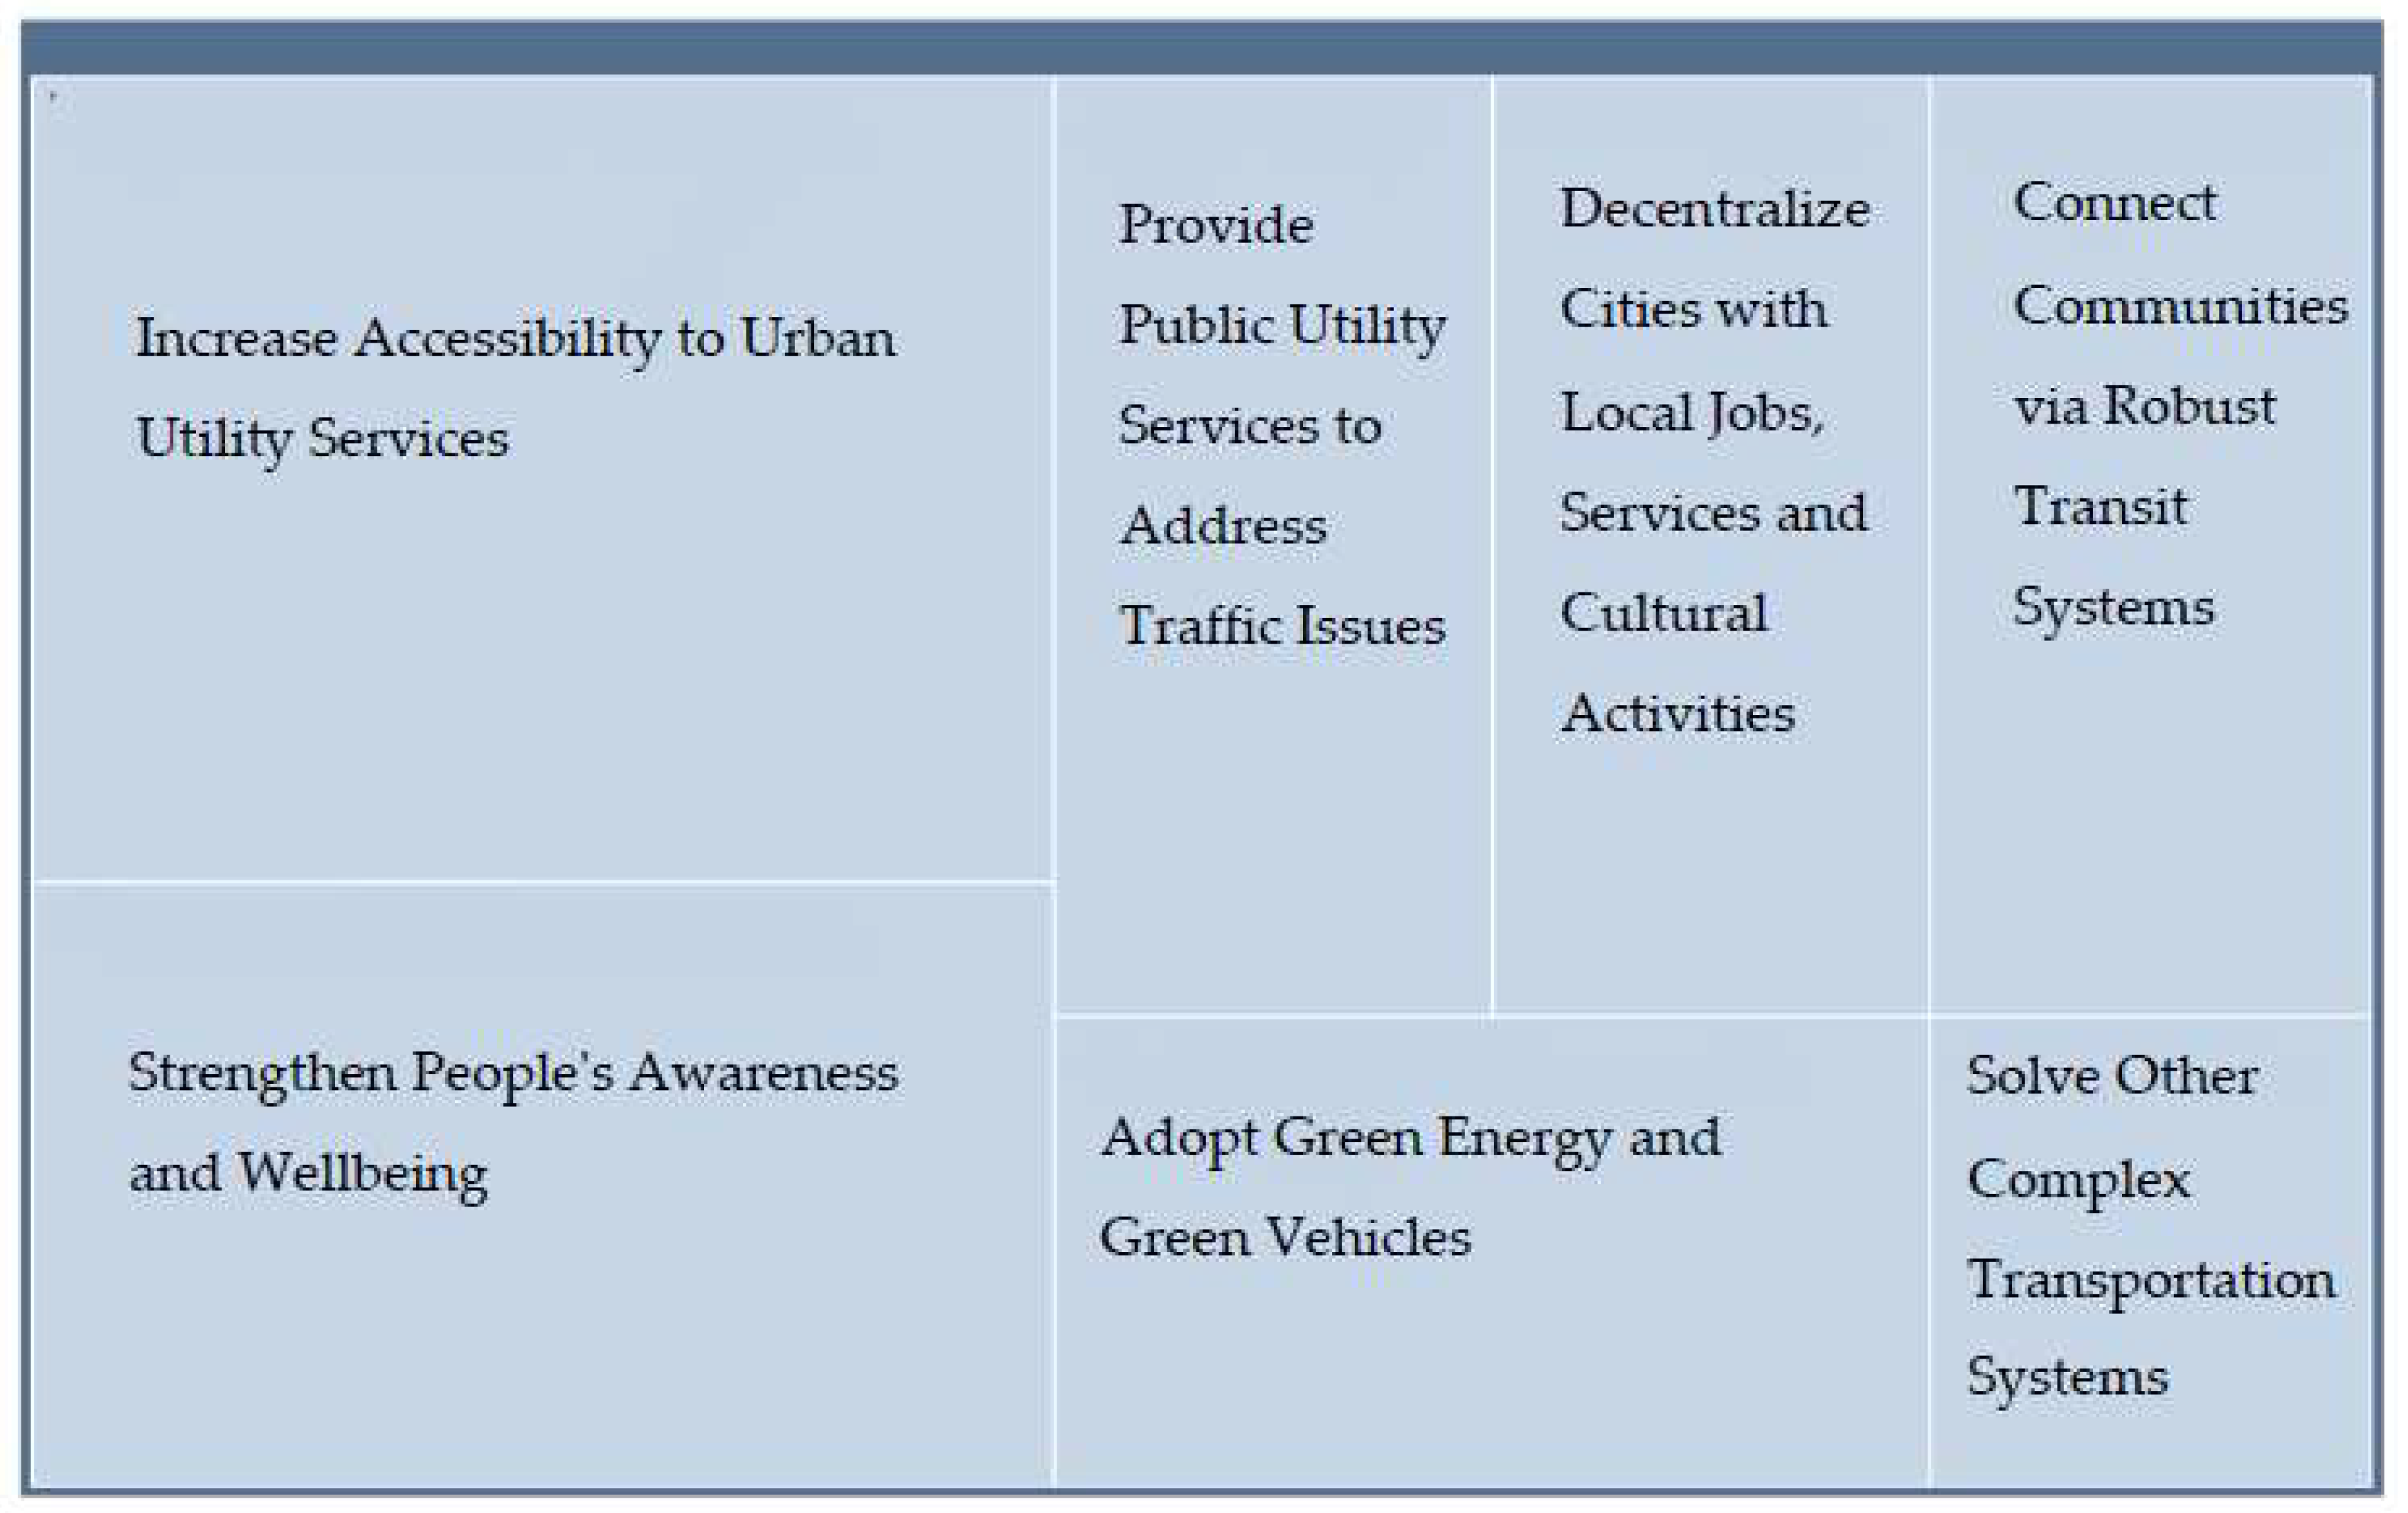
Figure 12.
Hierarchy Chart of Entrepreneurial Strategies to Attract Investment in Projects Aimed at Urban Services.
Figure 12.
Hierarchy Chart of Entrepreneurial Strategies to Attract Investment in Projects Aimed at Urban Services.
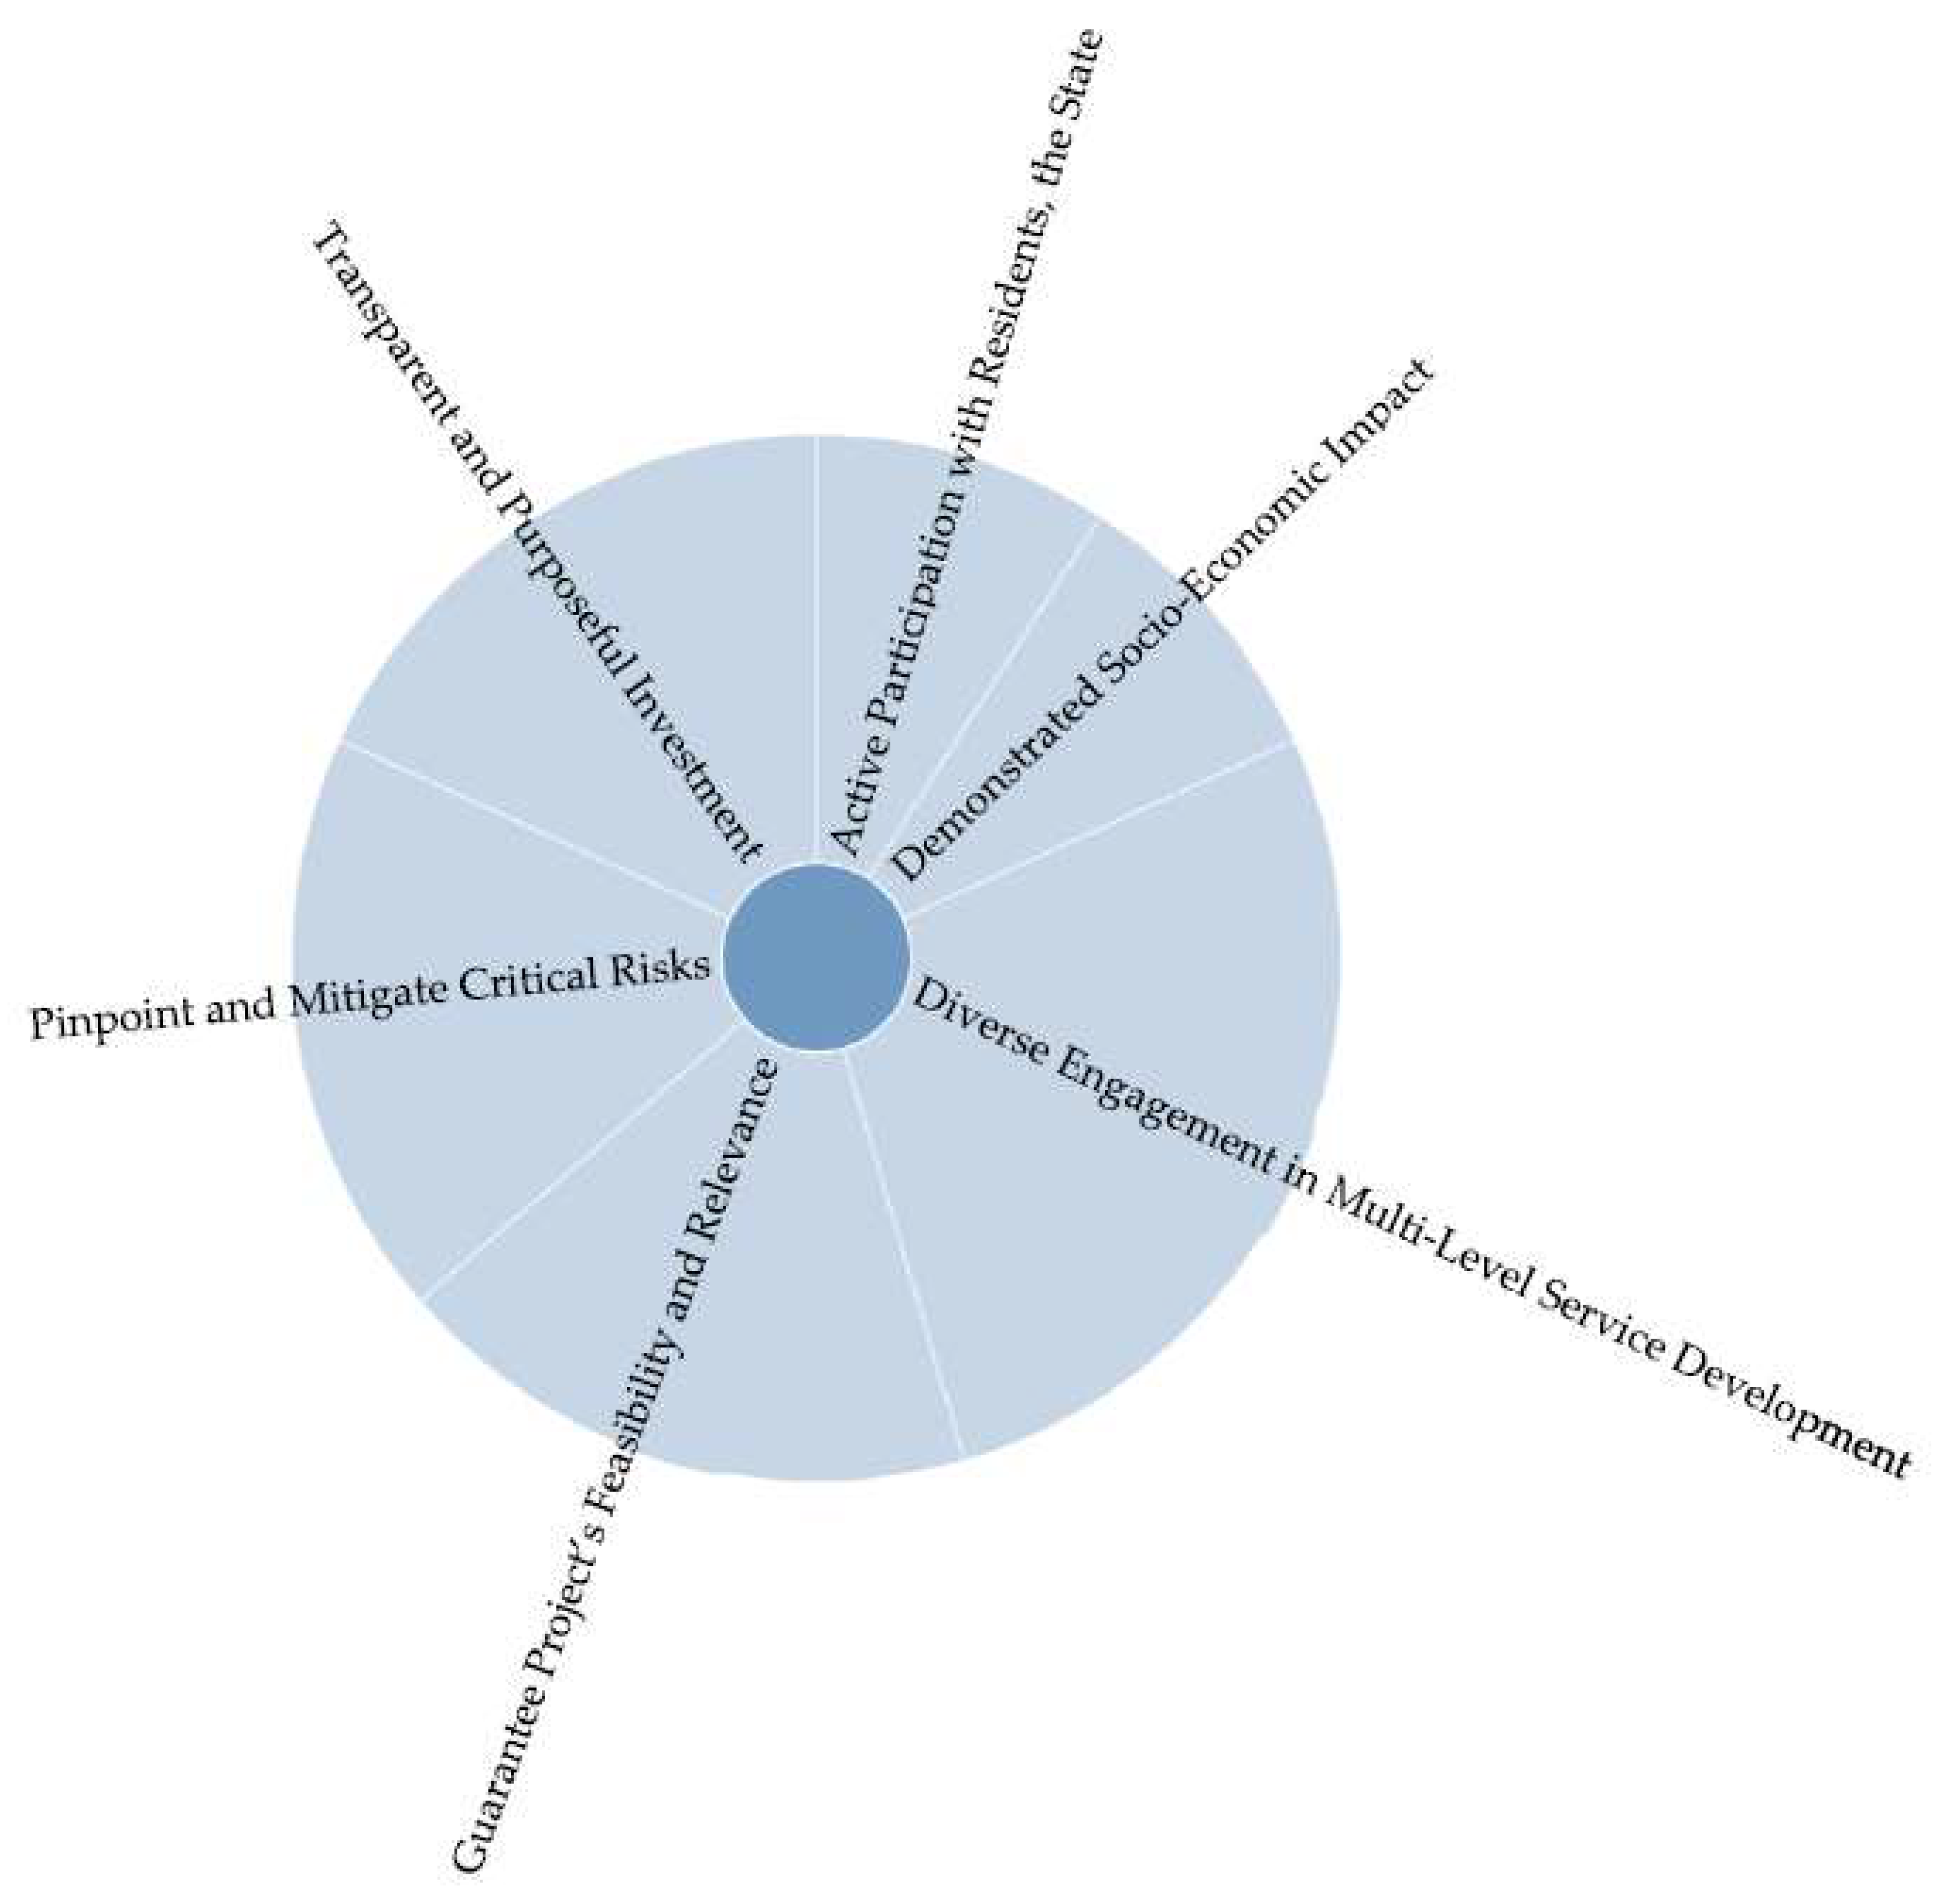
Figure 13.
Hierarchy Chart of Policymaker Strategies to Attract Investment.
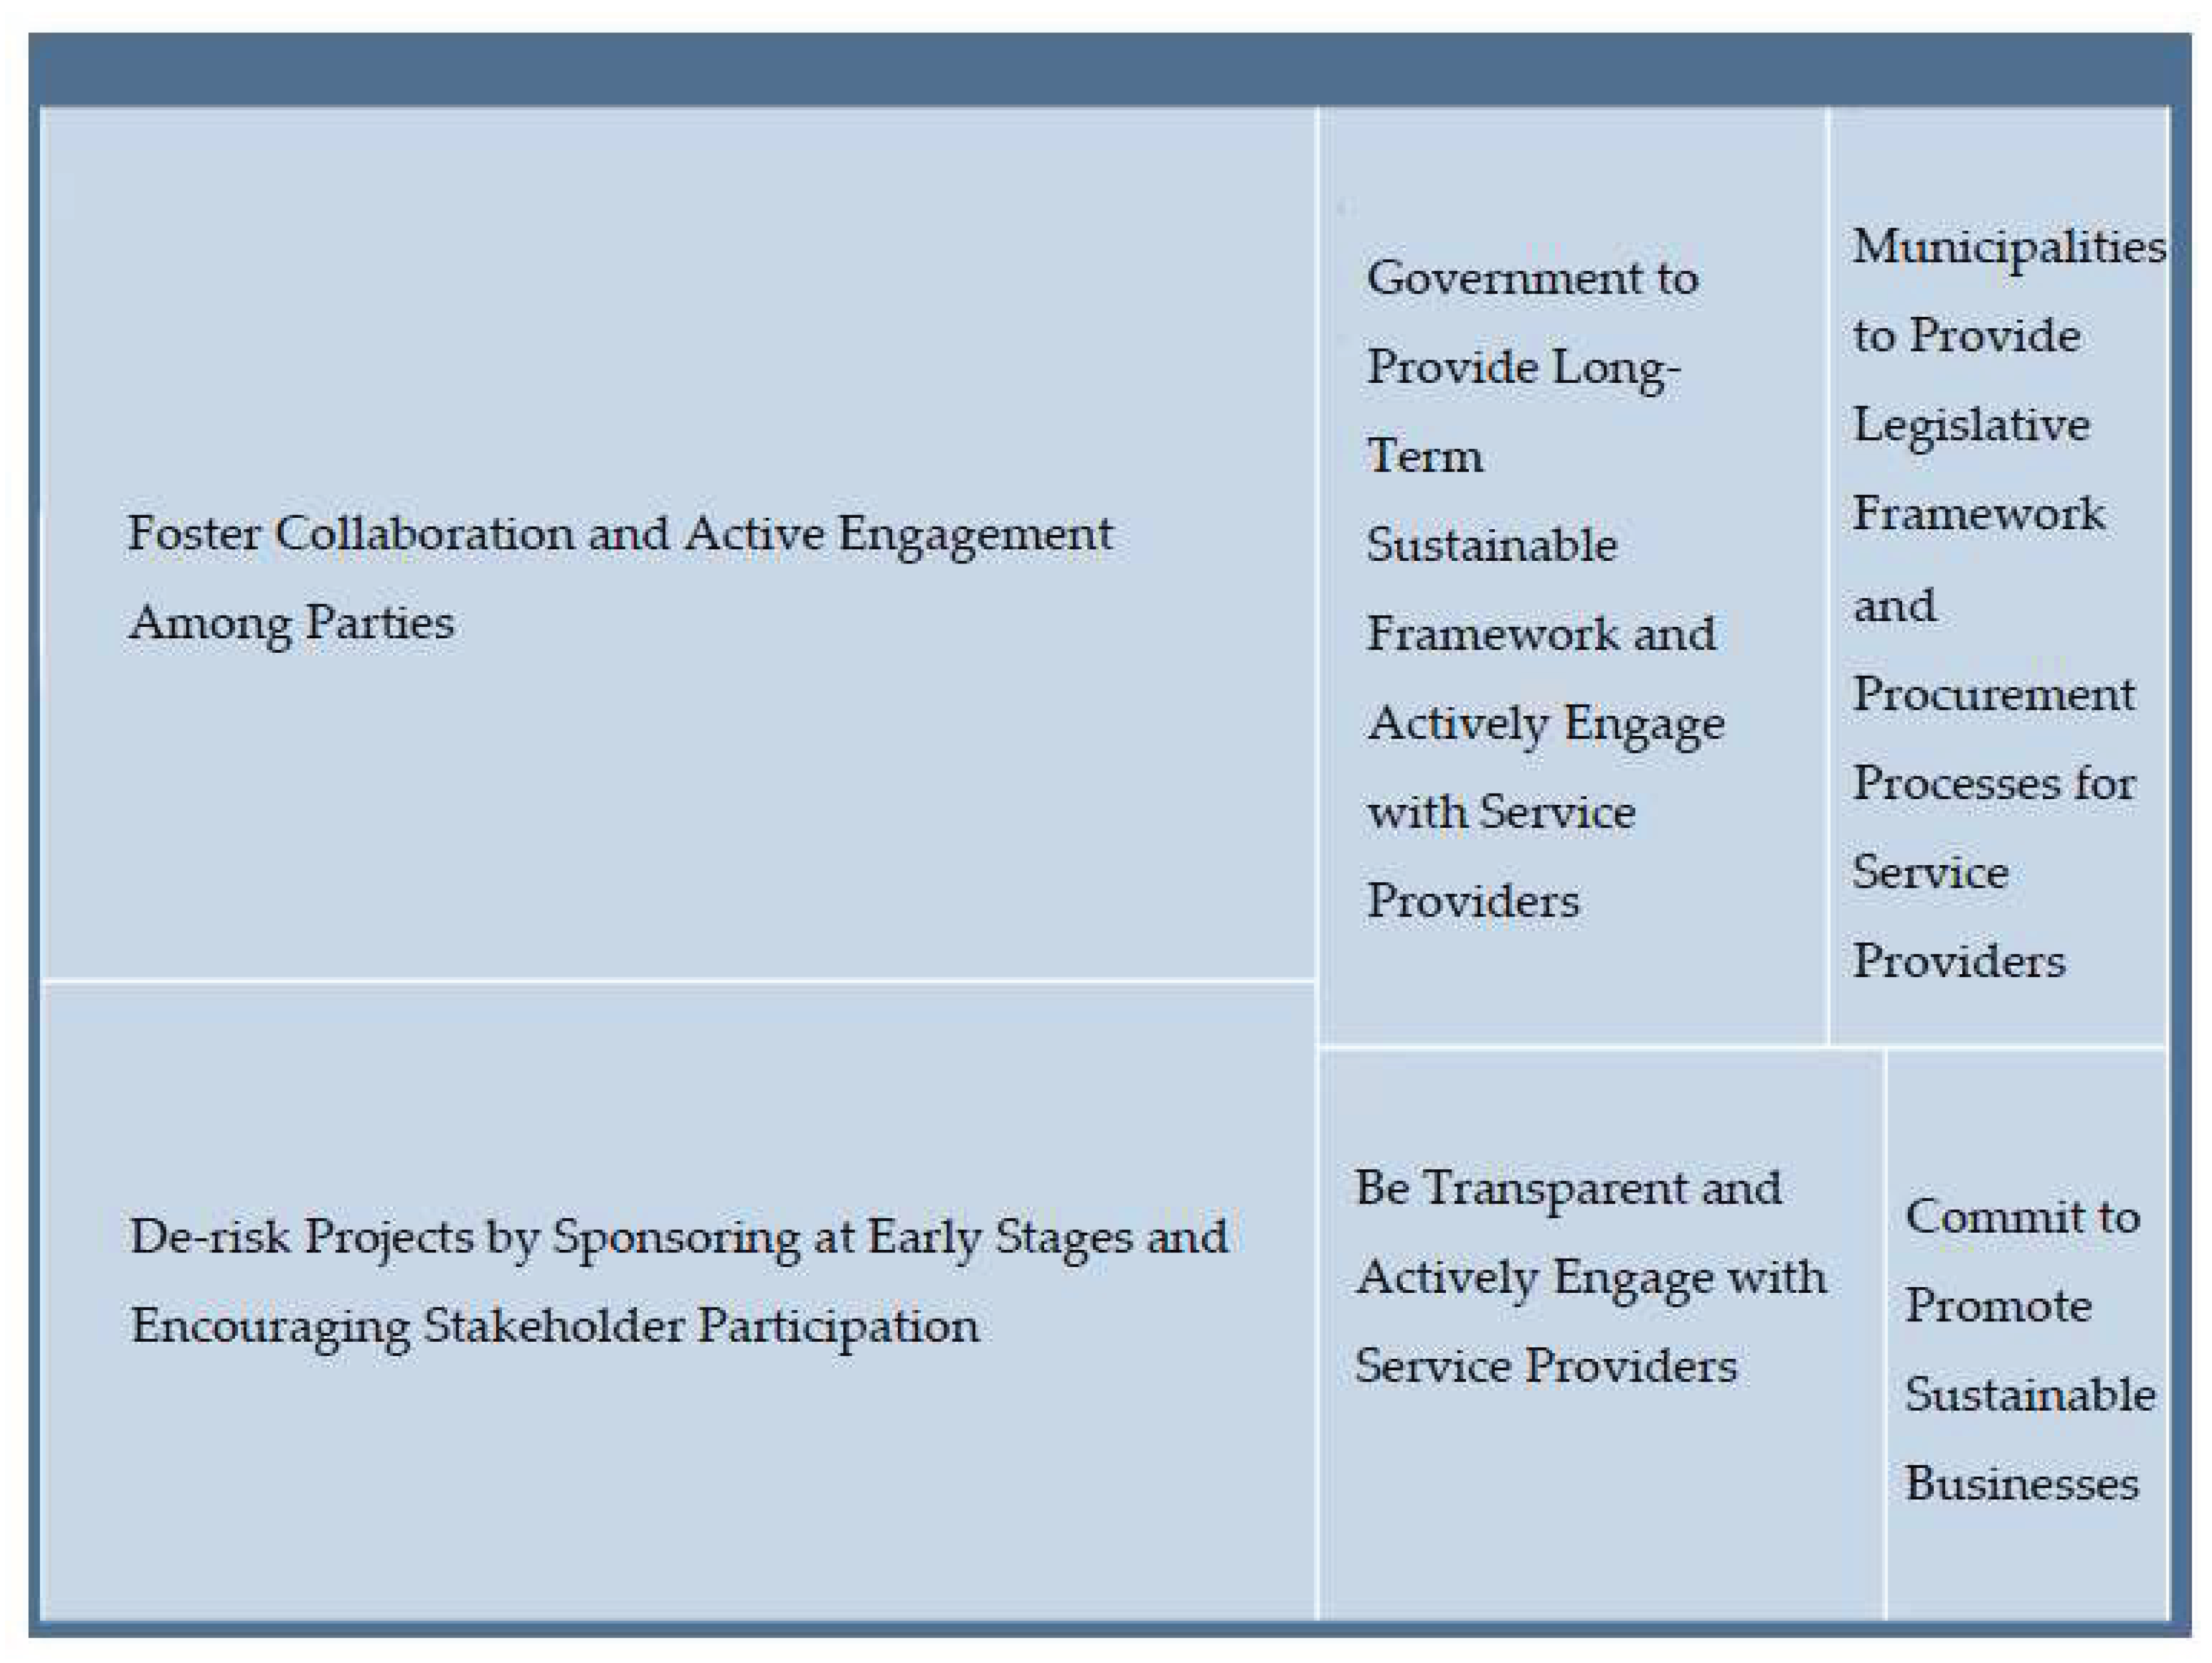
Table 1.
Overview of data collection methods, sample size, and analytical tools used in this study.
| Data Collection Method | Sample Size | Analytic Tools |
|---|---|---|
| Survey | 50 | Office Form, NVivo (version 14) |
| Interview | 10 | NVivo (version 14) |
| Writing diary | N/A1 | NVivo (version 14) |
| Public conversation | 9 | NVivo (version 14) |
| Urban Spatial Data Mining | 684,000 (km2)2 | OSMnx, Jupyter-Lab |
1 N/A = Not Applicable. 2 Source: General Statistics Office of Vietnam, 2023 [12].
Table 4.
Examples of street nodes and edges in multi-graph for quantitative analysis of urban performance metrics (May, 2025).
Table 4.
Examples of street nodes and edges in multi-graph for quantitative analysis of urban performance metrics (May, 2025).
| Cities | Street Nodes | Street Edge |
|---|---|---|
| Ha Noi City | 291,295 | 729,723 |
| Da Nang City | 40,499 | 10,3911 |
| Ho Chi Minh City | 204,143 | 477,174 |
Table 6.
Key themes identified through thematic analysis of the collected data.
| No. | Themes |
|---|---|
| 1 | Key Factors Driving Entrepreneurial Adoption of Data-Driven Approaches |
| 2 | Roles of Entrepreneurial Initiatives in Space Allocation and Urban Development |
| 3 | Entrepreneurial Strategies to Attract Investment in Projects Aimed at Urban Services |
| 4 | Strategic Policy Approaches to Attract Investment in Sustainable Initiatives |
| 5 | Barriers to Investment in Sustainable Entrepreneurship |
| 6 | Vital Roles of Stakeholder Collaboration in Driving Success |
Disclaimer/Publisher’s Note: The statements, opinions and data contained in all publications are solely those of the individual author(s) and contributor(s) and not of MDPI and/or the editor(s). MDPI and/or the editor(s) disclaim responsibility for any injury to people or property resulting from any ideas, methods, instructions or products referred to in the content. |
© 2025 by the authors. Licensee MDPI, Basel, Switzerland. This article is an open access article distributed under the terms and conditions of the Creative Commons Attribution (CC BY) license (http://creativecommons.org/licenses/by/4.0/).
Copyright: This open access article is published under a Creative Commons CC BY 4.0 license, which permit the free download, distribution, and reuse, provided that the author and preprint are cited in any reuse.


