Submitted:
21 July 2025
Posted:
22 July 2025
You are already at the latest version
Abstract
Eelgrass (Zostera marina) is a native perennial marine angiosperm found in shallow bays and estuaries. Eelgrass beds are considered essential fish habitat and provide an important food source for marine organisms and waterfowl. This study examines changes in extent of the eelgrass beds in the southern portion of the Little Narragansett Bay Estuary, Rhode Island/Connecticut, USA between 2019 and 2022. The primary dataset used to delineate eelgrass beds was side-scan sonar coupled with underwater video imagery. Previous studies showed a decline in the extent of eelgrass here between 2012 and 2016. Our results show an increase in eelgrass coverage from 0.52 km2 in 2019 to 0.75 km2 in 2022. This increase in the extent of eelgrass occurred against the trends of declining eelgrass coverage both globally and regionally.
Keywords:
eelgrass
; side-scan sonar
; submerged aquatic vegetation
; underwater video imagery
1. Introduction
Eelgrass (Zostera marina) is a native perennial marine angiosperm that grows in shallow bays and estuaries as shoots, or bundles of blades [1] and is an essential habitat for fish, epifauna, phytoplankton, and infauna, as well as a foraging habitat for migratory waterfowl [2]. Dense Z. marina beds and meadows also provide breeding habitat for species such as pipefish and Atlantic Cod [3,4,5]. Eelgrass produces large quantities of oxygen through photosynthesis [6], and utilizes nitrogen thus removing it from the water column and sediment [7]. Eelgrass is designated as Essential Fish Habitat (EFH), and a Habitat of Particular Concern under the Magnuson-Stevens Fishery Conservation and Management Act reauthorization in 1996 (16 U.S.C. §§ 1801 et seq). Seine surveys have identified dozens of fish species within Little Narragansett Bay, including recreationally and commercially important fin fish such as Winter Founder (Pseudopleuronectes americanus) and Tautog (Tautoga onitis) [8,9] that utilize eelgrass habitat as juveniles [10,11]. Eelgrass is recognized as a critical marine resource and is protected by both Federal (Clean Water Act 33 U.S.C. § 1321) and state regulations (Section 300.18 of the RI Coastal Resources Management Program [12]). Anthropogenic and environmental stressors, including boat traffic (via propellor scarring), hurricane damage due to wave drag, changes in bed elevation due to sediment transport from storms, and degradation in water quality from high nutrient and pollution influx have led to eelgrass declines (e.g., [13,14,15]).
Eelgrass habitat in RI coastal waters declined between 1930 and 1955 due to a wasting disease caused by the Labyrinthula zosterae fungus [16,17]. Water quality issues, primarily nutrient loading and rising water temperatures further contributed to eelgrass decline [18,19,20]. Eelgrass beds in Rhode Island have been mapped and monitored using aerial photography [21,22,23,24,25], side-scan sonar [26,27], and underwater video with direct observation for ground-truthing. This study focuses on mapping the eelgrass beds in the Little Narragansett Bay Estuary (LNB) at the southern border of Rhode Island and Connecticut (Figure 1) using side-scan sonar, underwater video, and direct (diver) observation.
1.1. Study Area
Little Narragansett Bay (LNB) is the seaward-most part of the Pawcatuck River estuary in southwestern Rhode Island, partially enclosed by the Napatree Point and Sandy Point Barriers (Figure 1). LNB is a microtidal estuary with a great diurnal tidal range of ~0.9 m based on water levels recorded since 2015 [28] and covers approximately 5 km2 with an average depth of 2 m [29]. The eelgrass beds in LNB are situated on and near the former back barrier overwash deposits of the Sandy Point barrier, which was separated from Napatree Point during the 1938 Hurricane [30]. The southern and northern beds are divided by a tidal inlet known locally as ‘The Cut’ (Figure 1). Significant reductions in eelgrass extent in LNB began in the 1990s due to macroalgae mats [19], with some areas of the estuary observed to be fully covered with filamentous macroalgae [31]. Spring tidal currents in LNB range from approximately 30 to > 70 cm s-1 [32].
1.2. Previous Work
The extent of LNB eelgrass was previously mapped using digital four-band true color and infrared aerial photographs field checked with underwater video imagery and site visits in 2012, 2016, 2017 and 2021 (Figure 2) [21,22,23,24,25]. This method is intended for regional studies of eelgrass presence or absence [35]. The total acreage of eelgrass mapped in these surveys is reported in Table 1. The general extent of the beds as mapped via aerial imagery was similar between 2012 and 2021, particularly beds north of The Cut (Figure 1). The beds are more dynamic and saw a marked decrease in eelgrass coverage between 2012 and 2016 south of The Cut, followed by an increase between 2016 and 2021 [21,23,24,25]. One 0.24 km2 (60 acre) bed mapped in 2012 contained no eelgrass in either 2016 or 2019-2022 (Figure 2). Upon further analysis this area was likely a mat of macroalgae mistaken for eelgrass (Michael Bradley, Personal Observation). Such extensive mats of macroalgae are common in LNB [36]. This bed was not included in the eelgrass coverage reported in Table 1 and is shown in a stippled pattern in Figure 2.
2. Materials and Methods
Side-scan sonar, underwater video imagery and field-measured transects were used to map the extent of eelgrass beds in portions of LNB between 2019 and 2022.
2.1. Side-Scan Sonar Collection and Interpretation
Side-scan sonar, a remote sensing tool [37] utilizing soundwaves to image the seafloor, was the primary dataset used in this project. Side-scan imagery was collected using an EdgeTech 4125 dual frequency sonar at frequencies of 400 and 900 kHz, on parallel track lines spaced 50 m apart, with a sonar swath range of 75 m for sufficient overlap. Only the 900 kHz data was processed, as it provides more detailed seafloor images. Spatial positioning was done using a Trimble R10 RTK GPS with < 5 cm accuracy. Survey speeds were < 6.5 km h−1. Data were processed using SonarWiz v.6 software, adjusting for variations in contrast, time-varied gain, and applying a slant range correction. Mosaics were created for each study region with an 0.3 m pixel size and exported as a GeoTIFF for analysis in ESRI ArcMap v. 10.6. Individual georeferenced side-scan files were exported as a 0.1 m pixel size GeoTIFF’s, providing detailed views useful in sparse eelgrass areas. Side-scan sonar records are interpreted based on the texture and intensity of the returning acoustic energy, identifying spatially recognizable areas with different backscatter patterns. Eelgrass beds have a distinct side-scan signature, and these areas were identified and manually digitized onto the GeoTiffs at a 1:300 scale in ESRI ArcMap v. 10.6 GIS software. The total area of eelgrass polygons was calculated for each survey. Polygons from 2019 to 2022 were converted to a raster format in ESRI ArcMap, with values of 1 indicating presence and 0 indicating absence. Raster surfaces were summed using the Raster Calculator to assess bed persistence over time.
Underwater video and static imagery collected with GoPro cameras either mounted on a small PVC sled or by diver-collected imagery within a 10 m radius of a fixed position was used to supply ground truth on the presence/absence of eelgrass and verify side-scan sonar interpretation. Video imagery provides qualitative details on density of the patches. Imagery in 2019 was collected by two divers drifting with the tidal current recording time-lapse images of the seafloor every 10 seconds. The position of the divers was recorded using a Bad Elf GNSS Surveyor GPS mounted to the dive flag in a float trailing < 3 m behind the diver, and the spatial information was added to the imagery using ROBOGEO software. The 2020 survey consisted of time-lapse static images, collected at 10 second intervals using a handheld GoPro Hero 5. A Sofar Ocean Trident Underwater drone system provided additional ground-truth at the 8 sites examined in 2020. This system provided comparable results to the diver-filmed GoPro imagery [38].
3. Results
The full extent of the LNB eelgrass beds were surveyed using side-scan sonar in August 2019, 2020, and 2022. Partial coverage was collected in August 2021. (Figure 3). Underwater video or static imagery at set (anchored) positions was collected in 2020, 2021, 2022 and 2023 (Figure 4). The 2019 diver drift time-lapse imagery was collected along four drifts resulting in a total of 208 images, and each drift was 8 to 10 minutes in length and covered ~200 to 300 m. Surveys in 2020 collected images at eight survey stations, with underwater videos collected at three of these stations. An additional 10 videos were collected as part of a comparison study using a Sofar Ocean Trident underwater drone system. The 2021 survey collected videos at 14 stations, and eight of those sites were surveyed again in 2022. Figure 5 shows example images collected from August 2022.
The extent of the beds measured using side-scan sonar increased 45% between 2019 (0.52 km2 (128 Acres)) and 2022 (0.75 km2 (185 acres)) (Table 2; Figure 6). The northern beds fluctuated slightly between 2019 and 2022, with more appreciable growth along the western edge (Figure 6). The southern beds expanded laterally, infilling the scattered polygons mapped in 2019. While not quantified, density of the beds also increased, particularly in the southern part of the study area. Figure 7 shows this variation in density, with dense eelgrass (contiguous patches up to ~1,000 m2) with visible bare sand intermixed. This region was mapped as a continuous bed, as the acoustic shadow limited the penetration of the side-scan sonar signal to delineate the ratio of bare sand/eelgrass. Figure 7C shows eelgrass of moderate and low density south of The Cut; individual clumps of eelgrass here range from 10’s of m2 to < 5m2.
The persistence of eelgrass beds was examined by summing the raster surfaces created from the polygon coverages for 2019, 2020, and 2022 (Figure 8); 2021 was omitted because the side-scan survey only covered the southern half of the study area. This provides a visual assessment of where the eelgrass beds are persistent and where they have changed over time. A value of 1 represents areas where eelgrass was only visible in one survey; a value of 3 had eelgrass in all three surveys. The large swath of area mapped as ‘1’ south of The Cut largely represents expansion of eelgrass into these areas in the 2022 survey. Areas where eelgrass was only present in one survey also show the expansion of the northern bed (Figure 8). The underwater video imagery and aerial imagery show bare sand in these areas prior to 2022.
4. Discussion
Eelgrass beds in Little Narragansett Bay were mapped effectively using a combination of side-scan sonar and underwater video imagery. The mapping conducted between 2019 and 2022 found comparable eelgrass coverage to previous Tier I mapping [21]. The general (independent) agreement of the aerial imagery-based mapping [21,25] and side-scan sonar mapping (Figure 9) suggests that both techniques are producing reasonable maps of eelgrass extents, with some expected differences based on water depth and the time of year the imagery was collected. Differences in individual interpretations is also to be expected as both datasets require expert interpretation and require judgement calls on the continuity of individual beds. Total eelgrass coverage increased between 2019 and 2022, suggesting that despite overall declines in eelgrass abundance globally and regionally [6,22,39,40,41], there has been a recent expansion of eelgrass beds within the Little Narragansett Bay Estuary. Submerged aquatic vegetation decreased 28% in Rhode Island between 2012 and 2021, with most of the losses occurring in the coastal lagoons along the Rhode Island south shore [21]. The lack of side-scan sonar data from before 2019 limits our temporal interpretation of patch expansion, however, the aerial imagery suggests that the coverage decreased between 2012 and 2017 and then increased in 2021 (Table 1). Other local areas, including the West Passage of Narragansett Bay [21] and portions of eastern Long Island Sound [22,42] saw increased eelgrass coverage in recent years as well.
Various causes have been attributed to the loss of eelgrass. Nitrogen loading in LNB is 10 to 20 times higher than levels considered amenable to creating sustainably healthy eelgrass populations [36]. Despite the reported heavy nitrogen load to LNB, we have recorded expansion of eelgrass extent in the study area. Others have suggested that meteorologic conditions, including annual average water temperatures may explain eelgrass variability [43], and these factors may also contribute here. We also hypothesize that the proximity of the LNB eelgrass beds to Block Island Sound (and ostensibly the open Atlantic Ocean) increases tidal flushing which may also mitigate the impact of nutrient loading on eelgrass. The size of the estuary may also reduce the impact of higher nitrogen loads [44], and the strong tidal currents in the area may limit accumulation of macroalgae mats and their negative effect on eelgrass growth, although these hypotheses remain at present untested.
Four months after the June 2012 aerial eelgrass survey [22,23] (Table 1) Hurricane Sandy made landfall in New Jersey in October 2012. Given the geographic size of the storm, impacts in southern New England were comparable to a Category 1 hurricane [45]. Peak water levels reached a maximum elevation of 1.8 m NAVD88, which coincide with approximately a 25-year return period storm at both the Newport, RI and New London, CT tide gauges [46,47]. Offshore significant wave heights recorded at a buoy 75 km SE of the study area exceeded 9 m [48]. The potential influence of storms on eelgrass meadows is apparent, particularly in shallow, dynamic areas like the areas where eelgrass occurs in LNB. Changes in bed elevation can have negative impacts on Z. marina growth, so deposition following a storm could reduce the extent and density of eelgrass. Burial of Z. marina plants with > 8 cm of sediment can reduce photosynthetic ability and disrupt respiratory processes in the buried portions of the above ground biomass [49]. A similar experiment noted that sediment burial above 5 cm led to mortality in shoots [50]. Erosion of the eelgrass beds by natural events and human-induced changes reduces the anchoring capacity of the shoots and makes detachment of plants easier [51]. Waves from larger coastal storms can uproot seagrasses and influence burial and erosion of sediments within seagrass beds [52]. Taken together, Hurricane Sandy was likely the cause of the LNB bed decrease in 2012.The authors have observed breaking waves across this area during more recent storm events, however, the driving factor (deposition/burial or bed erosion) cannot be discerned. We attempted to address this hypothesis by analyzing changes in the elevation of the area around the eelgrass beds in LNB using topobathymetric LiDAR collected in 2010, 2014 and 2018. However, few discernable changes could be detected that exceeded the vertical uncertainty of the LiDAR data (0.12 to 0.2 m) [33,53,54].
The beds were not resurveyed using side-scan sonar following winter storms that occurred in December 2023 and January 2024; these events which had offshore wave heights of up to 9 m, and water levels exceeding 1.3 m above NAVD88 [28,48]. Qualitative analysis using underwater video imagery collected in June 2025 and orthophotographs and vertical aerial imagery from 2024 and 2025 [55,56,57] suggest these storms did not negatively impact the extent of eelgrass in LNB, and that the southern beds had increased in density since 2022. Future work here examining the extent and density of eelgrass before and after storm events, coupled with detailed mapping on changes in bed elevation would help constrain the role these processes play in the variability of eelgrass at this site. This work also provides baseline conditions that could be used to assess the impacts on LNB eelgrass following planned upgrades to the wastewater treatment facility that discharges into the Pawcatuck River.
Author Contributions
The following statements should be used Conceptualization, BAO and PVA; methodology, BAO, PVA, MB; software, BAO; formal analysis, BAO, EW, NM; investigation, BAO, PVA, EW, NM; data curation, BAO; writing—original draft preparation, BAO, EW; writing—review and editing, BAO, EW, PVA, AD, MB; visualization, BAO, EW; project administration, BAO, PVA, DC; funding acquisition, PVA, BAO, DC. All authors have read and agreed to the published version of the manuscript.
Funding
This project was supported by the University of Rhode Island Coastal Institute, Rhode Island Sea Grant, The Watch Hill Conservancy, The Eastern Connecticut State University Foundation, The Eastern Connecticut State University Department of Environmental Earth Science, The University of Rhode Island Environmental Data Center, and The Alfred M. Roberts, Jr. Charitable Foundation.
Data Availability Statement
Data are available upon request.
Acknowledgments
Fieldwork was assisted by Grant Simmons, Caitlin Chaffee, Braden Fleming, Melissa Cote, and Janice Sassi with the Napatree Point Conservation Area, The Watch Hill Conservancy; and Chuck LaBash, Beck LaBash and Christopher Damon with the Environmental Data Center, Department of Natural Resources Science, University of Rhode Island.
Conflicts of Interest
The authors declare no conflicts of interest.
References
- Thayer, G.W.; Kenworthy, W.J.; Fonseca, M.S. The ecology of eelgrass meadows of the Atlantic coast: a community profile; Fish and Wildlife Service, US Department of the Interior: 1984.
- Leblanc, M.-L. Eelgrass (Zostera marina) ecosystems in eastern Canada and their importance to migratory waterfowl; McGill University (Canada): 2021.
- Lilley, R.J.; Unsworth, R.K. Atlantic Cod (Gadus morhua) benefits from the availability of seagrass (Zostera marina) nursery habitat. Global Ecology and Conservation 2014, 2, 367–377. [Google Scholar] [CrossRef]
- Nelson, W.G.; Sullivan, G. Effects of microtopographic variation and macroalgal cover on morphometrics and survival of the annual form of eelgrass (Zostera marina). Aquatic botany 2018, 145, 37–44. [Google Scholar] [CrossRef] [PubMed]
- Vincent, A.C.; Berglund, A.; Ahnesjö, I. Reproductive ecology of five pipefish species in one eelgrass meadow. Environmental biology of fishes 1995, 44, 347–361. [Google Scholar] [CrossRef]
- Burdick, D.M.; Edwardson, K.J.; Gregory, T.; Matso, K.; Mattera, T.; Paly, M.; Peter, C.; Short, F.; Torio, D.D. A case for restoration and recovery of zostera marina l. in the great bay estuary. 2020. [Google Scholar]
- Sandoval-Gil, J.; Alexandre, A.; Santos, R.; Camacho-Ibar, V.F. Nitrogen uptake and internal recycling in Zostera marina exposed to oyster farming: Eelgrass potential as a natural biofilter. Estuaries and Coasts 2016, 39, 1694–1708. [Google Scholar] [CrossRef]
- RIDEM. Coastal pond seine survey, 2022.
- The juvenile fish assemblage of Little Narragansett Bay Rodrigue, K.; McManus, C.M.; August, P.V.; Desbonnet, A.; Sassi, J., Eds.; BRG Scientific: Washington, DC, 2024; p 352.
- Dorf, B.A.; Powell, J.C. Distribution, abundance, and habitat characteristics of juvenile tautog (Tautoga onitis, Family Labridae) in Narragansett Bay, Rhode Island, 1988–1992. Estuaries 1997, 20, 589–600. [Google Scholar] [CrossRef]
- Goldberg, R.; Phelan, B.; Pereira, J.; Hagan, S.; Clark, P.; Bejda, A.; Calabrese, A.; Studholme, A.; Able, K.W. Variability in habitat use by young-of-the-year winter flounder, Pseudopleuronectes americanus, in three northeastern US estuaries. Estuaries 2002, 25, 215–226. [Google Scholar] [CrossRef]
- RICRMC. Rhode Island Coastal Resources Management Program: Rhode Island Coastal Resources Management Council. 1995, as amended.
- Duarte, C.M. The future of seagrass meadows. Environmental conservation 2002, 29, 192–206. [Google Scholar] [CrossRef]
- Orth, R.J.; Carruthers, T.J.; Dennison, W.C.; Duarte, C.M.; Fourqurean, J.W.; Heck, K.L.; Hughes, A.R.; Kendrick, G.A.; Kenworthy, W.J.; Olyarnik, S. A global crisis for seagrass ecosystems. Bioscience 2006, 56, 987–996. [Google Scholar] [CrossRef]
- Unsworth, R.K.; McKenzie, L.J.; Collier, C.J.; Cullen-Unsworth, L.C.; Duarte, C.M.; Eklöf, J.S.; Jarvis, J.C.; Jones, B.L.; Nordlund, L.M. Global challenges for seagrass conservation. Ambio 2019, 48, 801–815. [Google Scholar] [CrossRef] [PubMed]
- Cotton, A. Disappearance of Zostera marina. Nature 1933, 132, 277–277. [Google Scholar] [CrossRef]
- Short, F.T.; Ibelings, B.; Den Hartog, C. Comparison of a current eelgrass disease to the wasting disease in the 1930s. Aquatic Botany 1988, 30, 295–304. [Google Scholar] [CrossRef]
- Fulweiler, R.W.; Nixon, S.W. Export of nitrogen, phosphorus, and suspended solids from a southern New England watershed to Little Narragansett Bay. Biogeochemistry 2005, 76, 567–593. [Google Scholar] [CrossRef]
- Rollinson, V.R.; Granger, J.; Clark, S.C.; Blanusa, M.L.; Koerting, C.P.; Vaudrey, J.M.; Treibergs, L.A.; Westbrook, H.C.; Matassa, C.M.; Hastings, M.G. Seasonality of nitrogen sources, cycling, and loading in a New England river discerned from nitrate isotope ratios. Biogeosciences 2021, 18, 3421–3444. [Google Scholar] [CrossRef]
- Short, F.T.; Neckles, H.A. The effects of global climate change on seagrasses. Aquatic Botany 1999, 63, 169–196. [Google Scholar] [CrossRef]
- Bradley, M.; Boyd, J.; Goetsch, B.; Goulet, D.; Mitchel, J.; LaBash, B. 2021 Tier 1 Mapping of Submerged Aquatic Vegetation (SAV) in Rhode Island and Change Analysis; 2022.
- Bradley, M.; Paton, S. Tier 1 2017 Mapping of Zostera marina in Long Island Sound and Change Analysis. 2018.
- RIGIS. Submerged Aquatic Vegetation (SAV) in Rhode Island Coastal Waters (2012). Center, U.o.R.I.-E.D., Ed. Rhode Island Geographic Information System (RIGIS) Data Distribution System: Kingston, RI, 2013.
- RIGIS. Submerged Aquatic Vegetation (SAV) in RI Coastal Waters (2016). center, U.o.R.I.-E.D., Ed. Rhode Island Geographic Information System (RIGIS) Data Distribution System: Kingston, RI, 2017.
- RIGIS. Submerged Aquatic Vegetation (SAV) in RI Coastal Waters (2021). center, U.o.R.I.-E.D., Ed. Rhode Island Geographic Information System (RIGIS) Data Distribution System: Kingston, RI, 2023.
- Oakley, B.; Alvarez, J.; Boothroyd, J. Benthic Geologic Habitats of Shallow Estuarine Environments: Greenwich Bay and Wickford Harbor, Narragansett Bay, Rhode Island, USA. Journal of Coastal Research 2012, 28, 760–773. [Google Scholar] [CrossRef]
- Stolt, M.; Bradley, M.; Turenne, J.; Payne, M.; Scherer, E.; Cicchetti, G.; King, J.; Shumchenia, E.; Guarinello, M.; Boothroyd, J.C., et al. Mapping Shallow Coastal Ecosystems. Journal of Coastal Research 2011, In Prep.
- USGS. USGS Current Conditions for Rhode Island: 411838071513000 WATCH HILL COVE TIDE GAGE WESTERLY, RI. Availabe online: https://waterdata.usgs.gov/ri/nwis/uv/?site_no=411838071513000&PARAmeter_cd=00065,00060 (accessed on 10/10/2024).
- Ehinger, R.; Folit, R.; Zeitlin-Hale, L. The Pawcatuck River Estuary and Little Narragansett Bay: A Compilation Of Available Information: URI Coastal Resources Center Marine Technical Report 66; 1978.
- Nichols, R.L.; Marston, A.F. Shoreline changes in Rhode Island produced by hurricane of September 21, 1938. Bulletin of the Geological Society of America 1939, 50, 1357–1370. [Google Scholar] [CrossRef]
- Cashel, F.S.; Knightes, C.D.; Lupo, C.; Iott, T.; Streich, K.; Conville, C.J.; Bridges, T.W.; Dombroski, I. Using monitoring and mechanistic modeling to improve understanding of eutrophication in a shallow New England estuary. Journal of Environmental Management 2024, 355, 120478. [Google Scholar] [CrossRef] [PubMed]
- MARACOOS. Oceansmap.. Availabe online: https://maracoos.org/oceansmap/. (accessed on 10/10/2024).
- USACE. 2018 USACE NCMP Topobathy Lidar: East Coast 2020.
- RIGIS. June 2021 Orthophotographs. Rhode Island Coastal Resources Management Council, U.o.R.I.E.D.C., United States Geological Survey,, Ed. Rhode Island Geographic Information System: Kingston, RI, 2023.
- Neckles, H.A.; Kopp, B.S.; Peterson, B.J.; Pooler, P.S. Integrating Scales of Seagrass Monitoring to Meet Conservation Needs. Estuaries and Coasts 2012, 35, 23–46. [Google Scholar] [CrossRef]
- Rollinson, V.R.; Granger, J.; Clark, S.C.; Blanusa, M.L.; Koerting, C.P.; Vaudrey, J.M.P.; Treibergs, L.A.; Westbrook, H.C.; Matassa, C.M.; Hastings, M.G. , et al. Seasonality of nitrogen sources, cycling, and loading in a New England river discerned from nitrate isotope ratios. Biogeosciences 2021, 18, 3421–3444. [Google Scholar] [CrossRef]
- Fish, J.P.; Carr, H.A. Sound underwater images: A guide to the generation and interpretation of side-scan sonar data; American Underwater Search and Survey, Ltd.: Cataumet, MA, 1990. [Google Scholar]
- Assessing seagrass field-mapping techniques in the Napatree/Sandy Point eelgrass meadow. . August, P.V.; Bradley, M.; Oakley, B.A.; LaBash, C.; LaBash, B.; Damon, C.; Simmons, G.; Fleming, B.; Sassi, J., Eds.; BRG Scientific: Washington, D.C., 2024; p 352.
- Costello, C.T.; Kenworthy, W.J. Twelve-year mapping and change analysis of eelgrass (Zostera marina) areal abundance in Massachusetts (USA) identifies statewide declines. Estuaries and Coasts 2011, 34, 232–242. [Google Scholar] [CrossRef]
- Keser, M.; Swenarton, J.T.; Vozarik, J.M.; Foertch, J.F. Decline in eelgrass (Zostera marina L.) in Long Island Sound near Millstone Point, Connecticut (USA) unrelated to thermal input. Journal of Sea Research 2003, 49, 11–26. [Google Scholar] [CrossRef]
- Koch, E.; Beer, S. Tides, light and the distribution of Zostera marina in Long Island Sound, USA. Aquatic botany 1996, 53, 97–107. [Google Scholar] [CrossRef]
- Bradley, M. Tier 1 2024 Mapping of Submerged Aquatic Vegetation in Long Island Sound and the Peconic Estuary; University of Rhode Island – Environmental Data Center, 2025.
- Vaudrey, J.M.P.; Krumholz., J.; Calabretta, C. Eelgrass success in Niantic River Estuary, CT, quantifying factors influencing interannual variability of eelgrass (Zostera marina) using a 30-year dataset; 2019.
- Vaudrey, J.M. Establishing Restoration Objectives for Eelgrass in Long Island Sound Part II: Case Studies. University of Connecticut, Department of Marine Sciences, Groton, CT 2008.
- Blake, E.S.; Kimberlain, T.B.; Berg, R.J.; Cangialosi, J.P.; Beven II, J.L. Tropical Cyclone Report Hurricane Sandy (AL182012) 22 – 29 October 2012 National Hurricane Center: 2013.
- NOS. Extreme Water Levels 8461490 New London, Thames River, CT. Availabe online: https://tidesandcurrents.noaa.gov/est/est_station.shtml?stnid=8461490 (accessed on 10/10/2024).
- NOS. Extreme Water Levels 8452660 Newport, RI. Availabe online: https://tidesandcurrents.noaa.gov/est/est_station.shtml?stnid=8452660 (accessed on 10/10/2024).
- NDBC. Station 44097 - Block Island, RI: Historical Data & Climatic Summaries: https://www.ndbc.noaa.gov/station_page.php?station=44097. Availabe online: (accessed on 10/10/2024).
- Mills, K.E.; Fonseca, M.S. Mortality and productivity of eelgrass Zostera marina under conditions of experimental burial with two sediment types. Marine Ecology Progress Series 2003, 255, 127–134. [Google Scholar] [CrossRef]
- Munkes, B.; Schubert, P.R.; Karez, R.; Reusch, T.B. Experimental assessment of critical anthropogenic sediment burial in eelgrass Zostera marina. Marine Pollution Bulletin 2015, 100, 144–153. [Google Scholar] [CrossRef] [PubMed]
- Cabaço, S.; Santos, R.; Duarte, C.M. The impact of sediment burial and erosion on seagrasses: a review. Estuarine, Coastal and Shelf Science 2008, 79, 354–366. [Google Scholar] [CrossRef]
- Oprandi, A.; Mucerino, L.; De Leo, F.; Bianchi, C.; Morri, C.; Azzola, A.; Benelli, F.; Besio, G.; Ferrari, M.; Montefalcone, M. Effects of a severe storm on seagrass meadows. Science of the Total Environment 2020, 748, 141373. [Google Scholar] [CrossRef] [PubMed]
- NOAA. 2014 NOAA NGS Topobathy Lidar: Connecticut 2014.
- USACE. 2010 USACE NCMP Topobathy Lidar: Northeast Atlantic Coast (CT, MA, ME, NH, RI) 2010.
- RIGIS. 2024 March Rhode Island Digital Aerial Photographs. Technologies, R.I.D.o.T.E.V., Ed. RIGIS: Kingston, RI, 2025.
- RIGIS. 2024 2025 Winter Rhode Island Digital Aerial Photographs. Technologies, R.I.D.o.T.E.V., Ed. RIGIS: Kingston, RI, 2025.
- NV5Geospatial. New York Eelgrass Orthoimagery Project Report. NV5 Geospatial, Inc., Lexington, KY. 2024.
Figure 1.
A. Location map showing the study area in southwestern Rhode Island/southeastern Connecticut. B. Key geographic features around the study area mentioned in the report. Long Island Sound (LIS), Block Island Sound (BIS), Napatree Point (NP), Sandy Point (SP) and the Pawcatuck River (PR). C. 2018 USACE topobathy LiDAR digital elevation model [33]of the study area showing the water depth below NAVD88. D. June 2021 digital orthoimagery [34] showing key geographic features discussed in the text. The yellow outline in both panels C and D shows the mapped extent of the eelgrass beds in 2022.
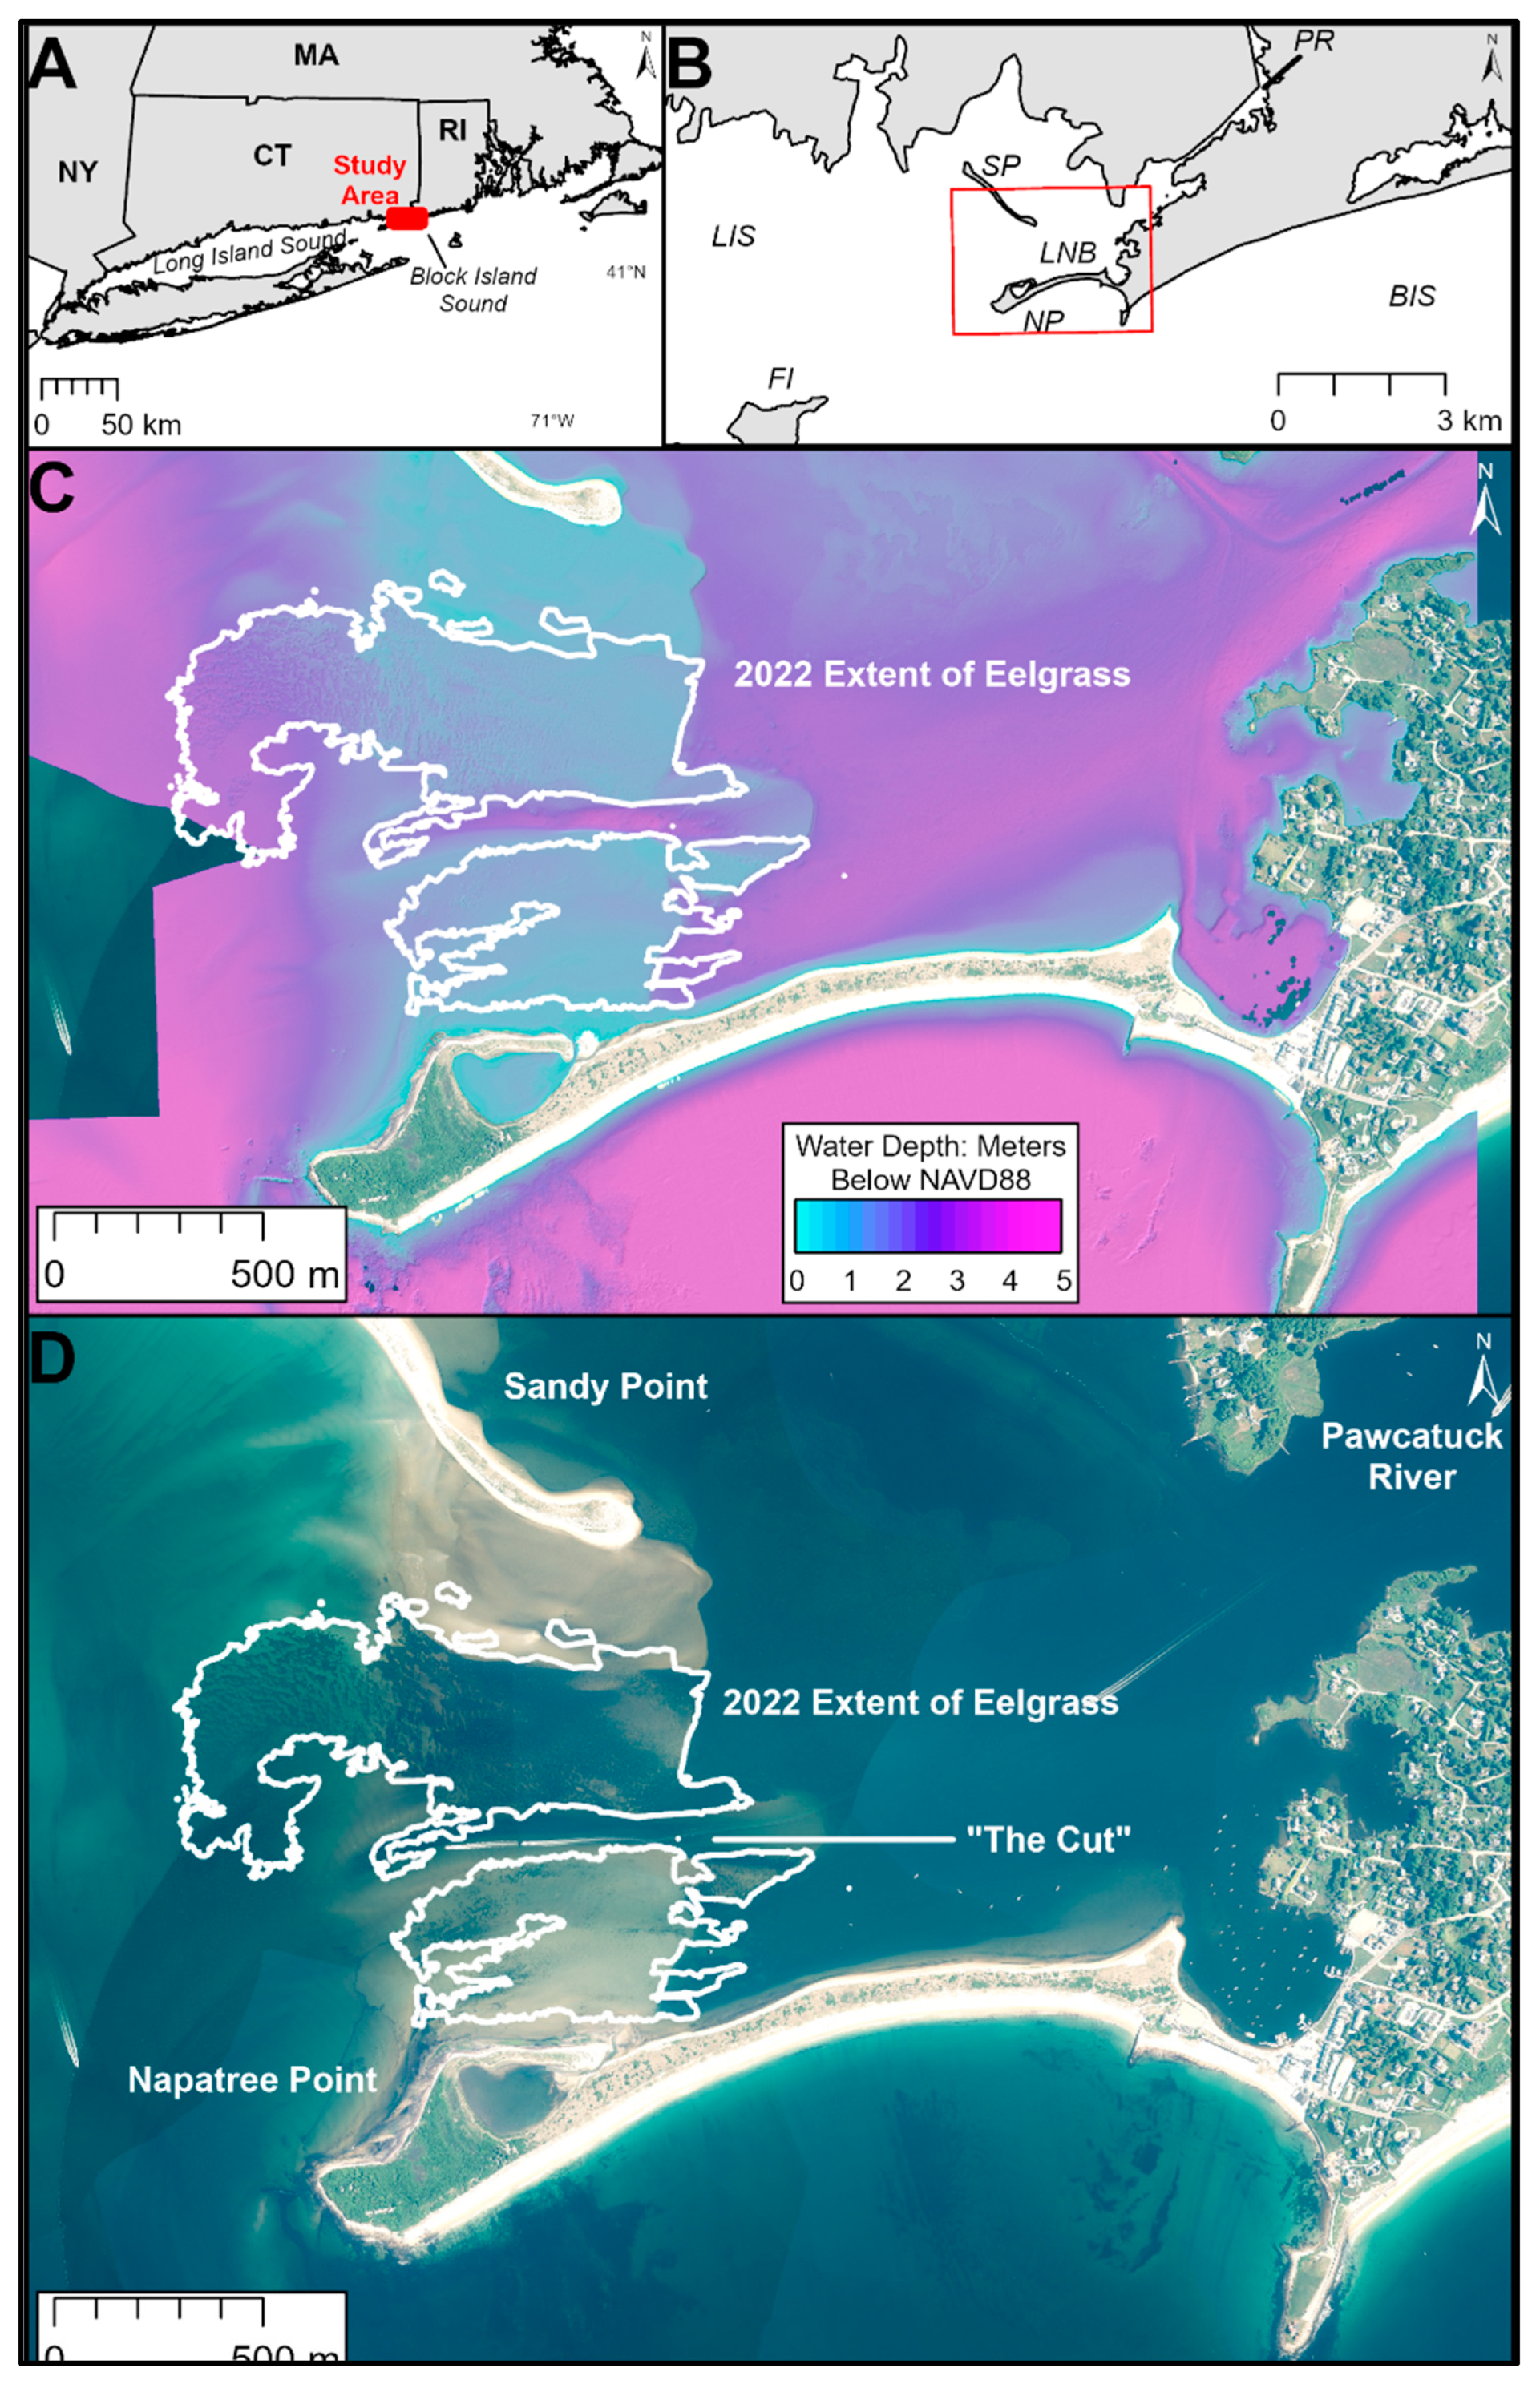
Figure 2.
Mapped extent of eelgrass from previous Tier 1 projects ([23,24,25]). The stippled polygon in the June 2012 coverage has been reinterpreted to be a mapping error (Michael Bradley, Personal Observation) and was likely a macroalgal mat. June 2021 digital orthophotography basemap [34].
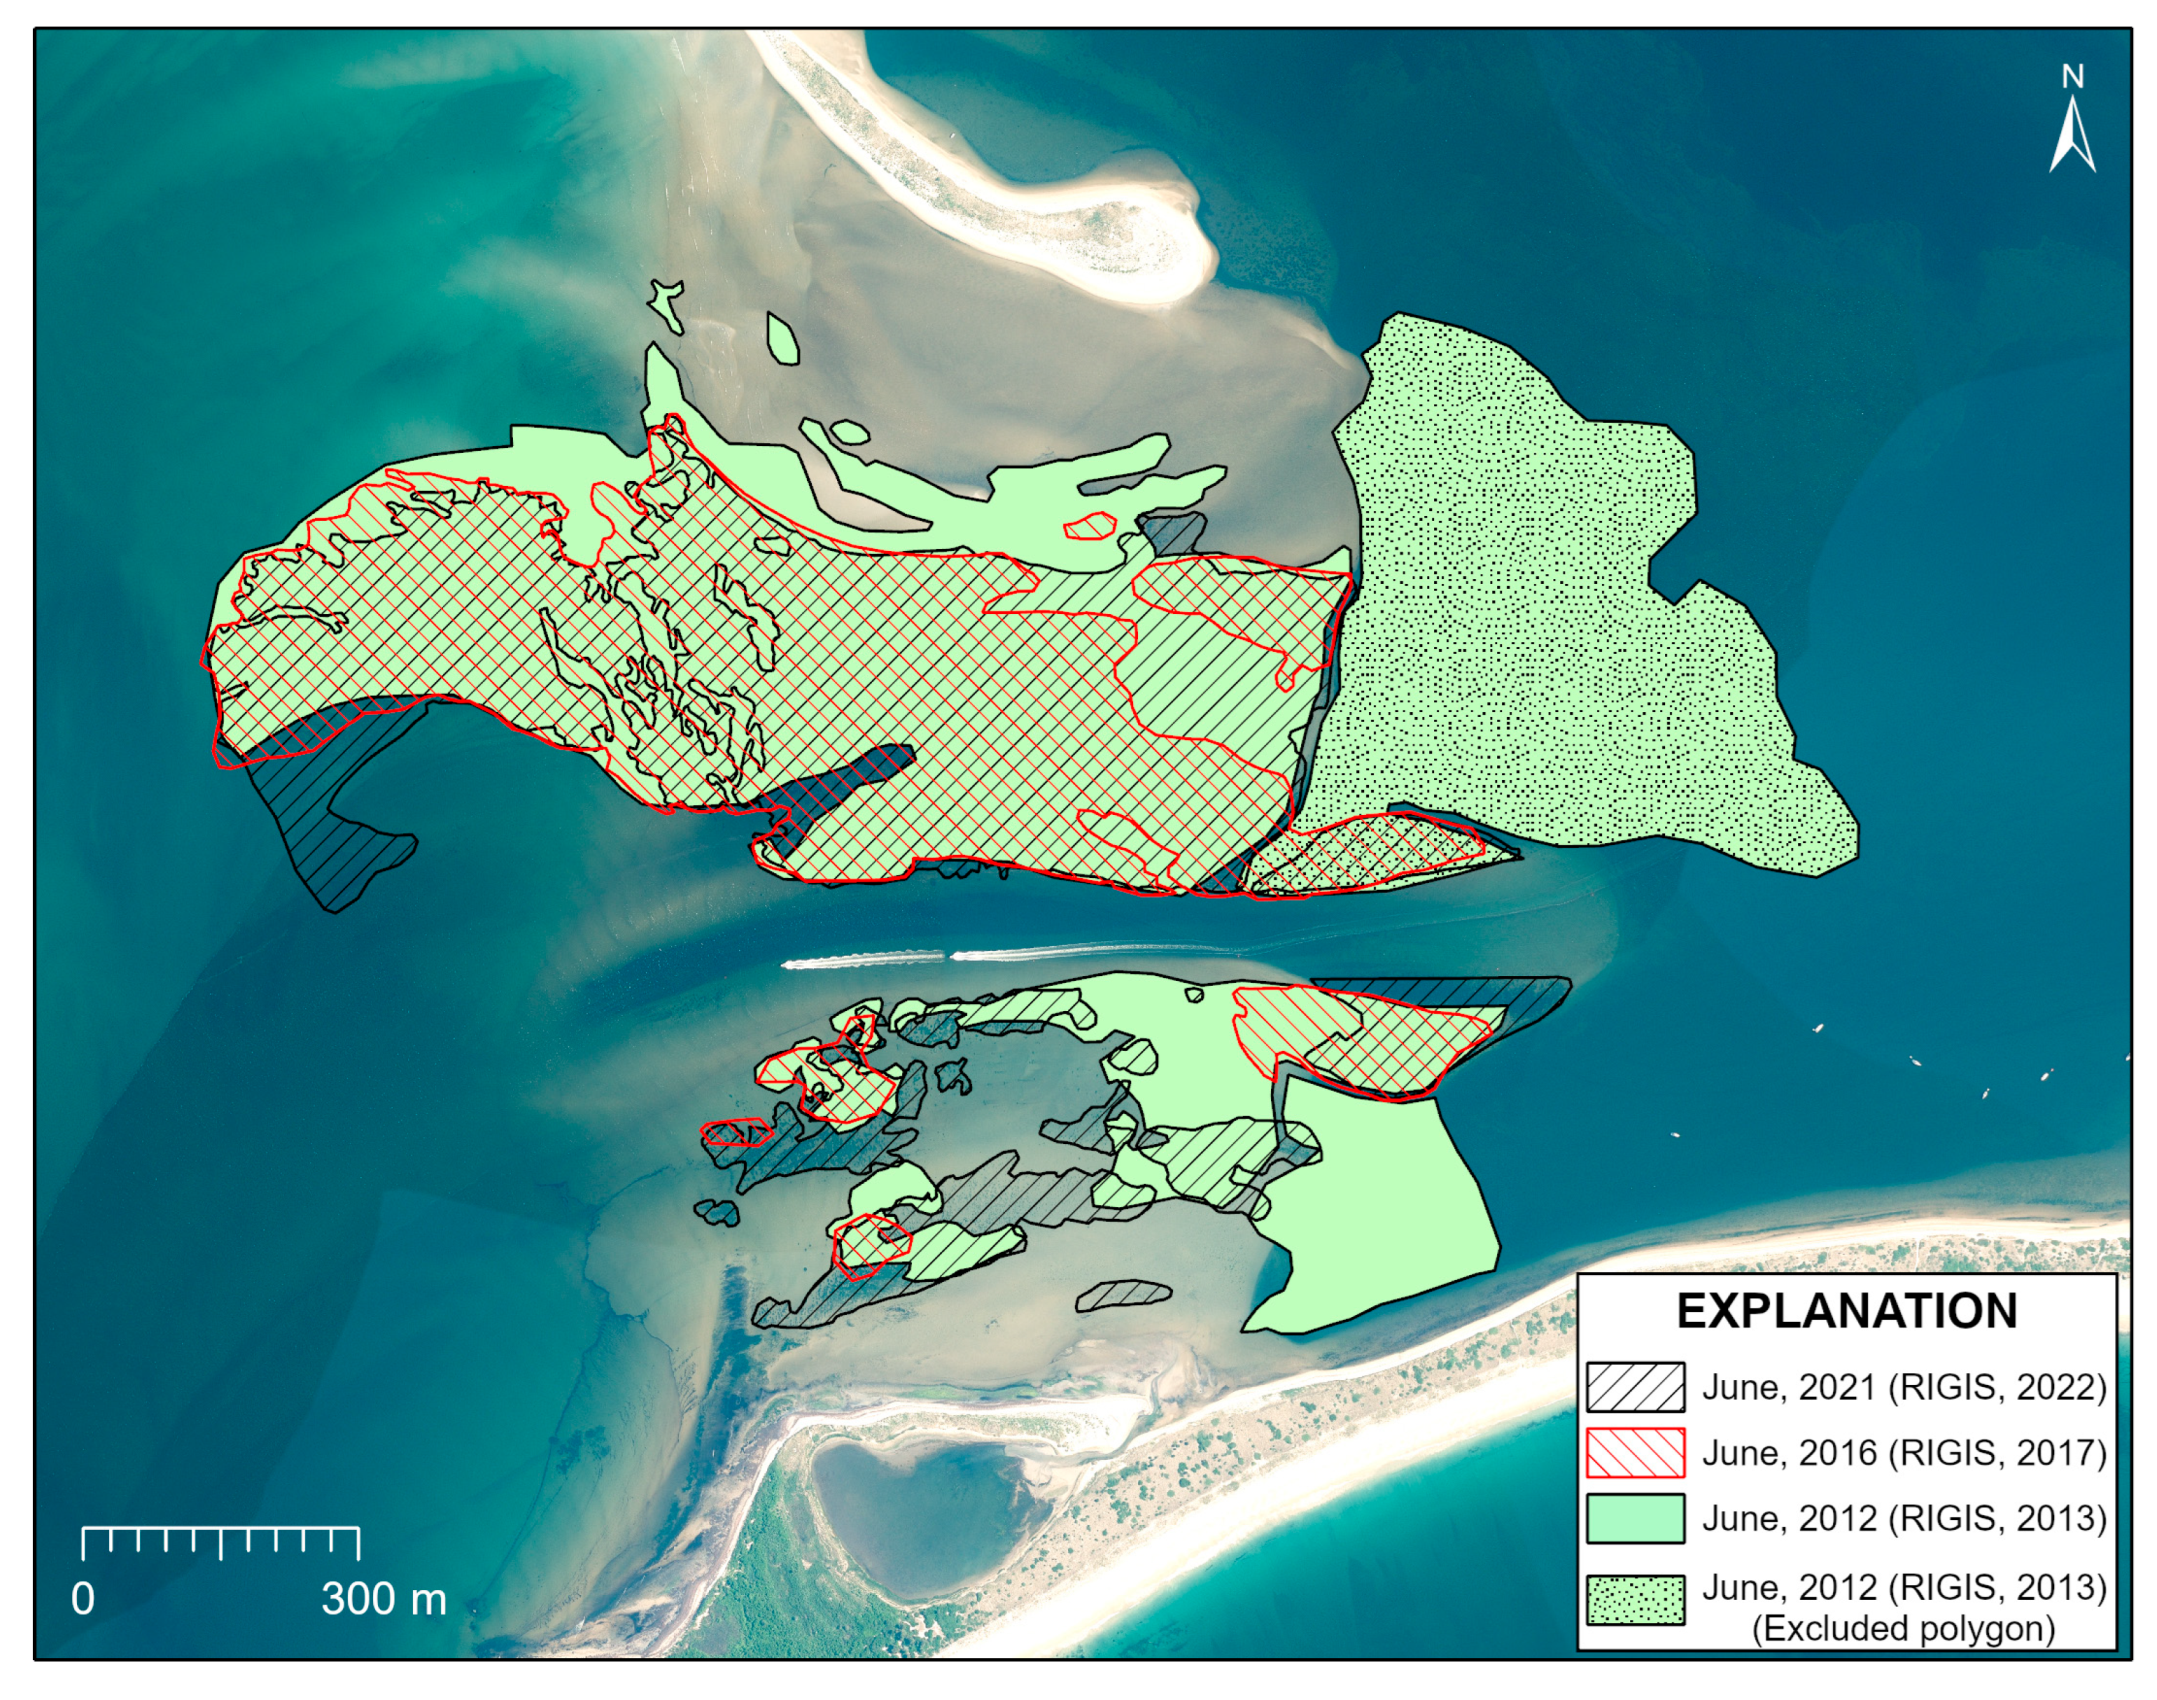
Figure 3.
Side-scan sonar mosaics collected in 2019, 2020, 2021 (partial coverage) and 2022. Basemap is a June 2021 digital orthophotograph [34].
Figure 3.
Side-scan sonar mosaics collected in 2019, 2020, 2021 (partial coverage) and 2022. Basemap is a June 2021 digital orthophotograph [34].
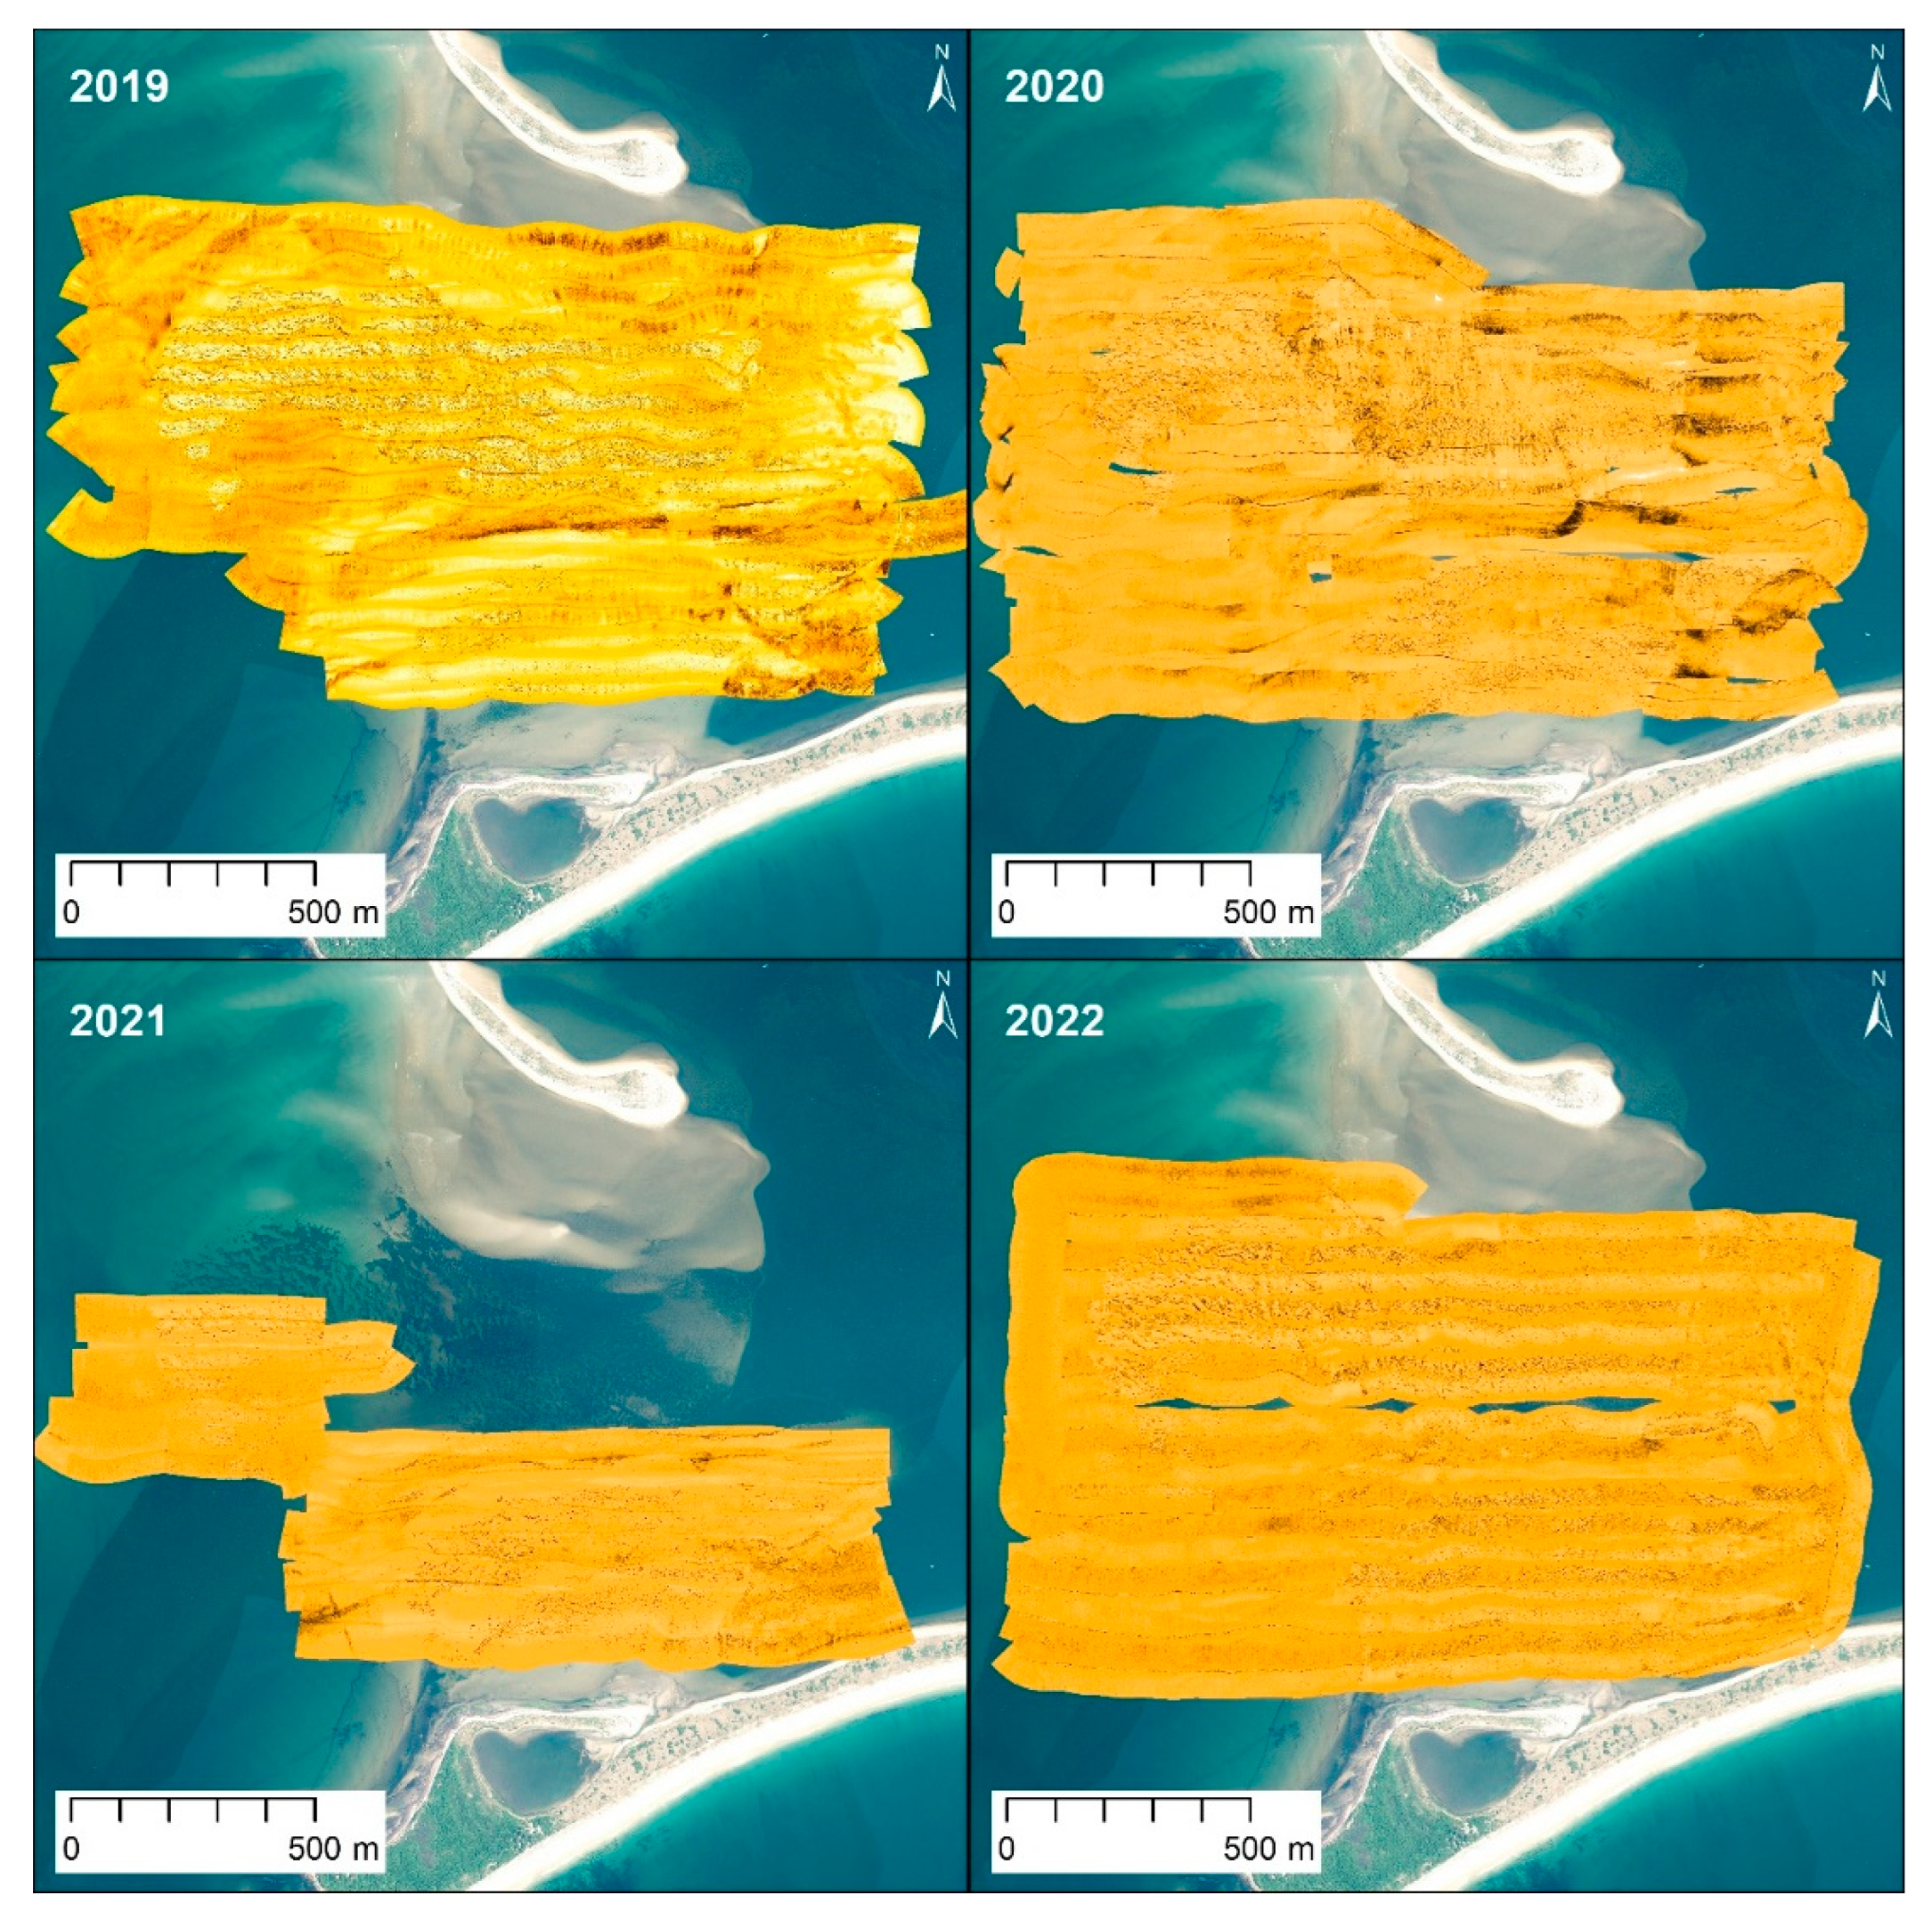
Figure 4.
Locations of underwater imagery collected 2019-2022. Note, stations in 2022 occupied the same locations as some of the 2021 surveys. Basemap is a June 2021 digital orthophotograph [34]. Numbers and letters are station ID codes.
Figure 4.
Locations of underwater imagery collected 2019-2022. Note, stations in 2022 occupied the same locations as some of the 2021 surveys. Basemap is a June 2021 digital orthophotograph [34]. Numbers and letters are station ID codes.
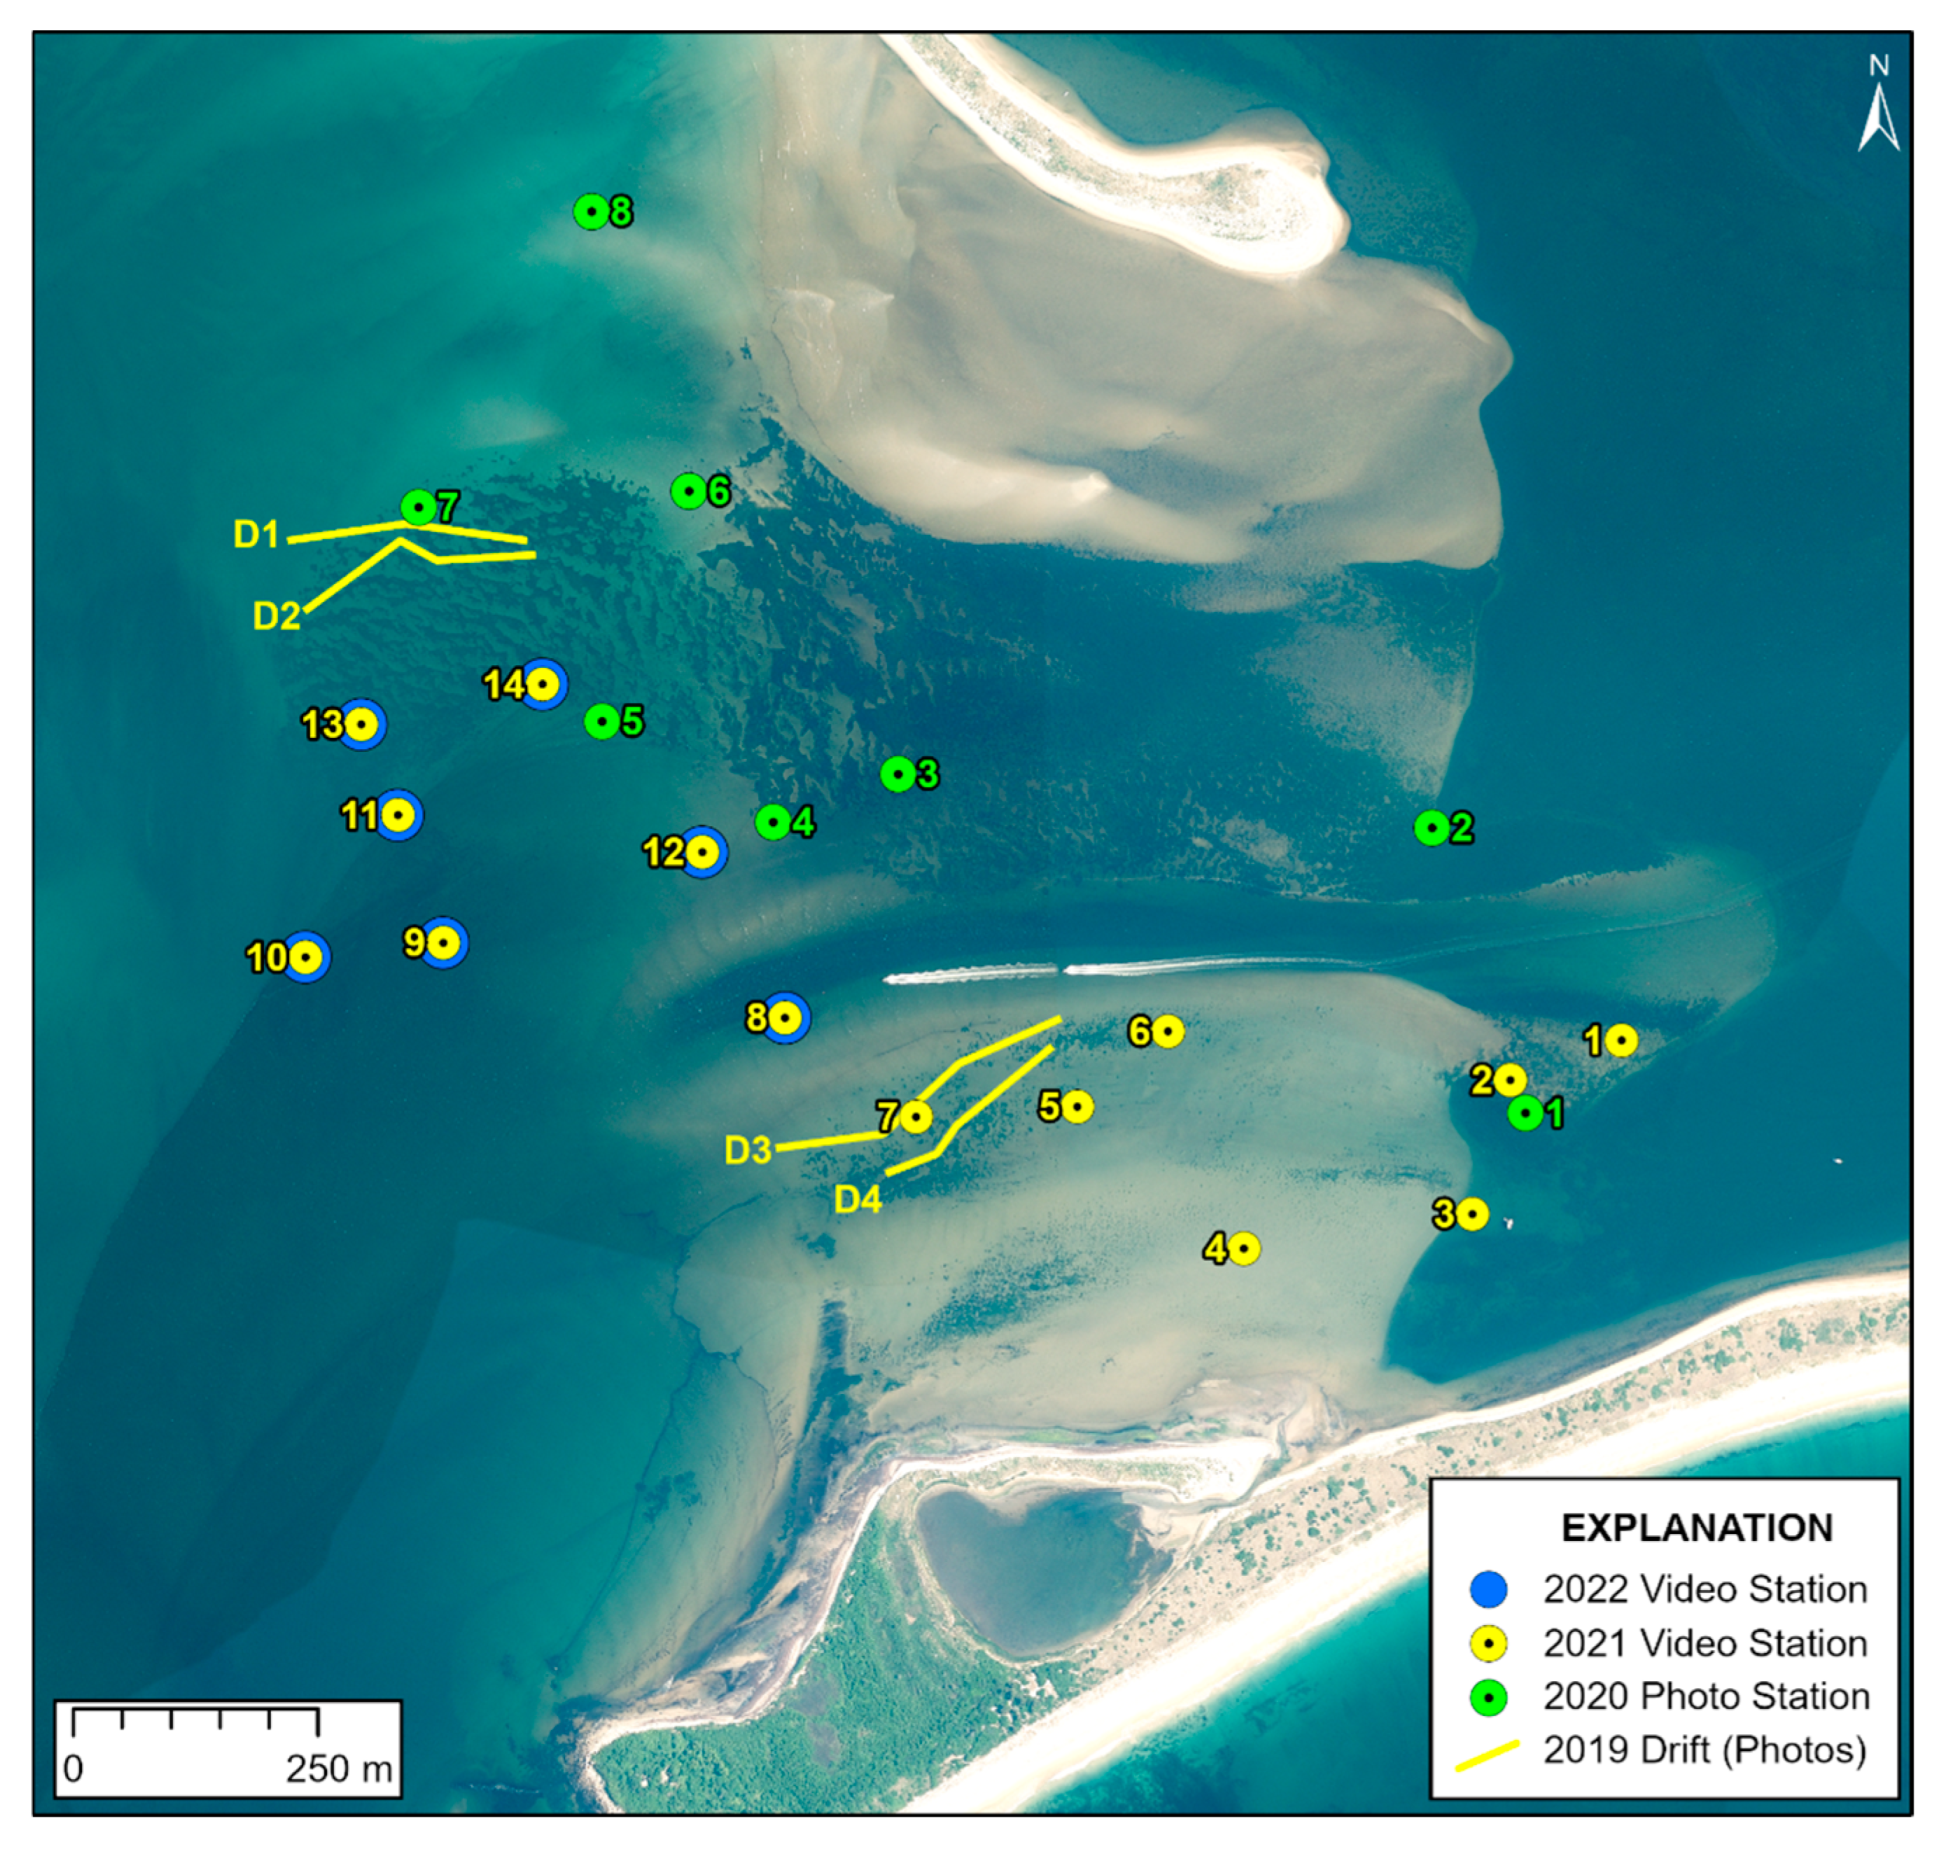
Figure 5.
Examples from underwater video collected in August 2022. A. 50m south of station 4, B. Station 9, C. Station 14 and D. Station 8. See Figure 4 for the location of each station.
Figure 5.
Examples from underwater video collected in August 2022. A. 50m south of station 4, B. Station 9, C. Station 14 and D. Station 8. See Figure 4 for the location of each station.
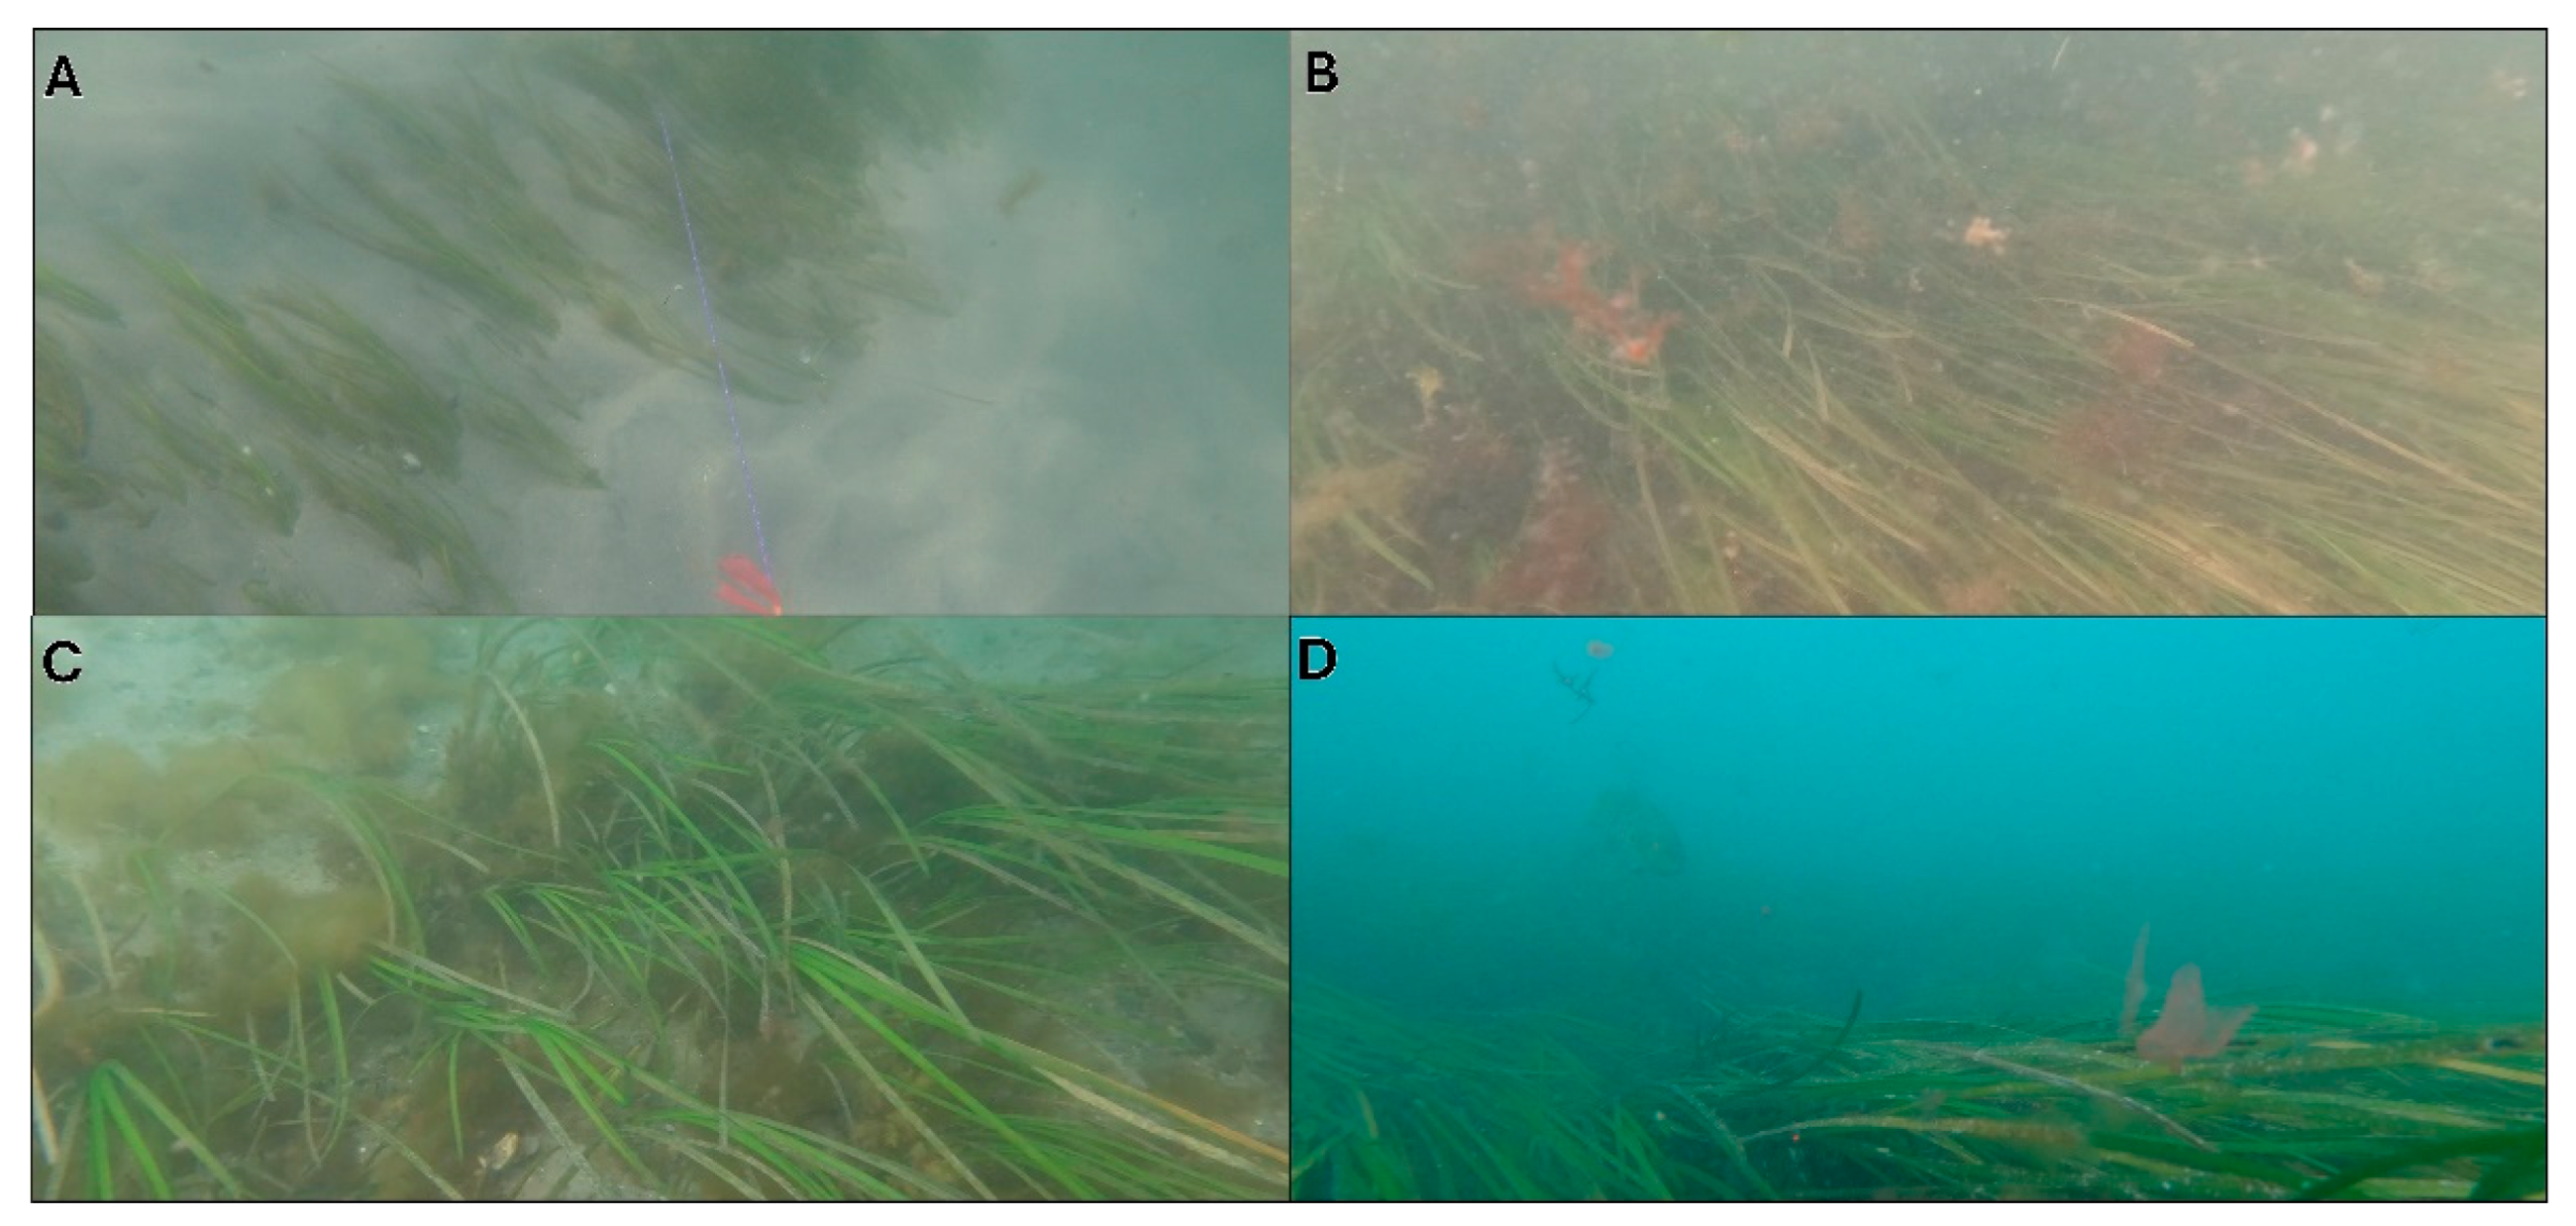
Figure 6.
Mapped extent of eelgrass beds between 2019 and 2022 using side-scan sonar (note the partial coverage of mapping in 2021). Basemap is a June 2021 digital orthophotograph [34].
Figure 6.
Mapped extent of eelgrass beds between 2019 and 2022 using side-scan sonar (note the partial coverage of mapping in 2021). Basemap is a June 2021 digital orthophotograph [34].
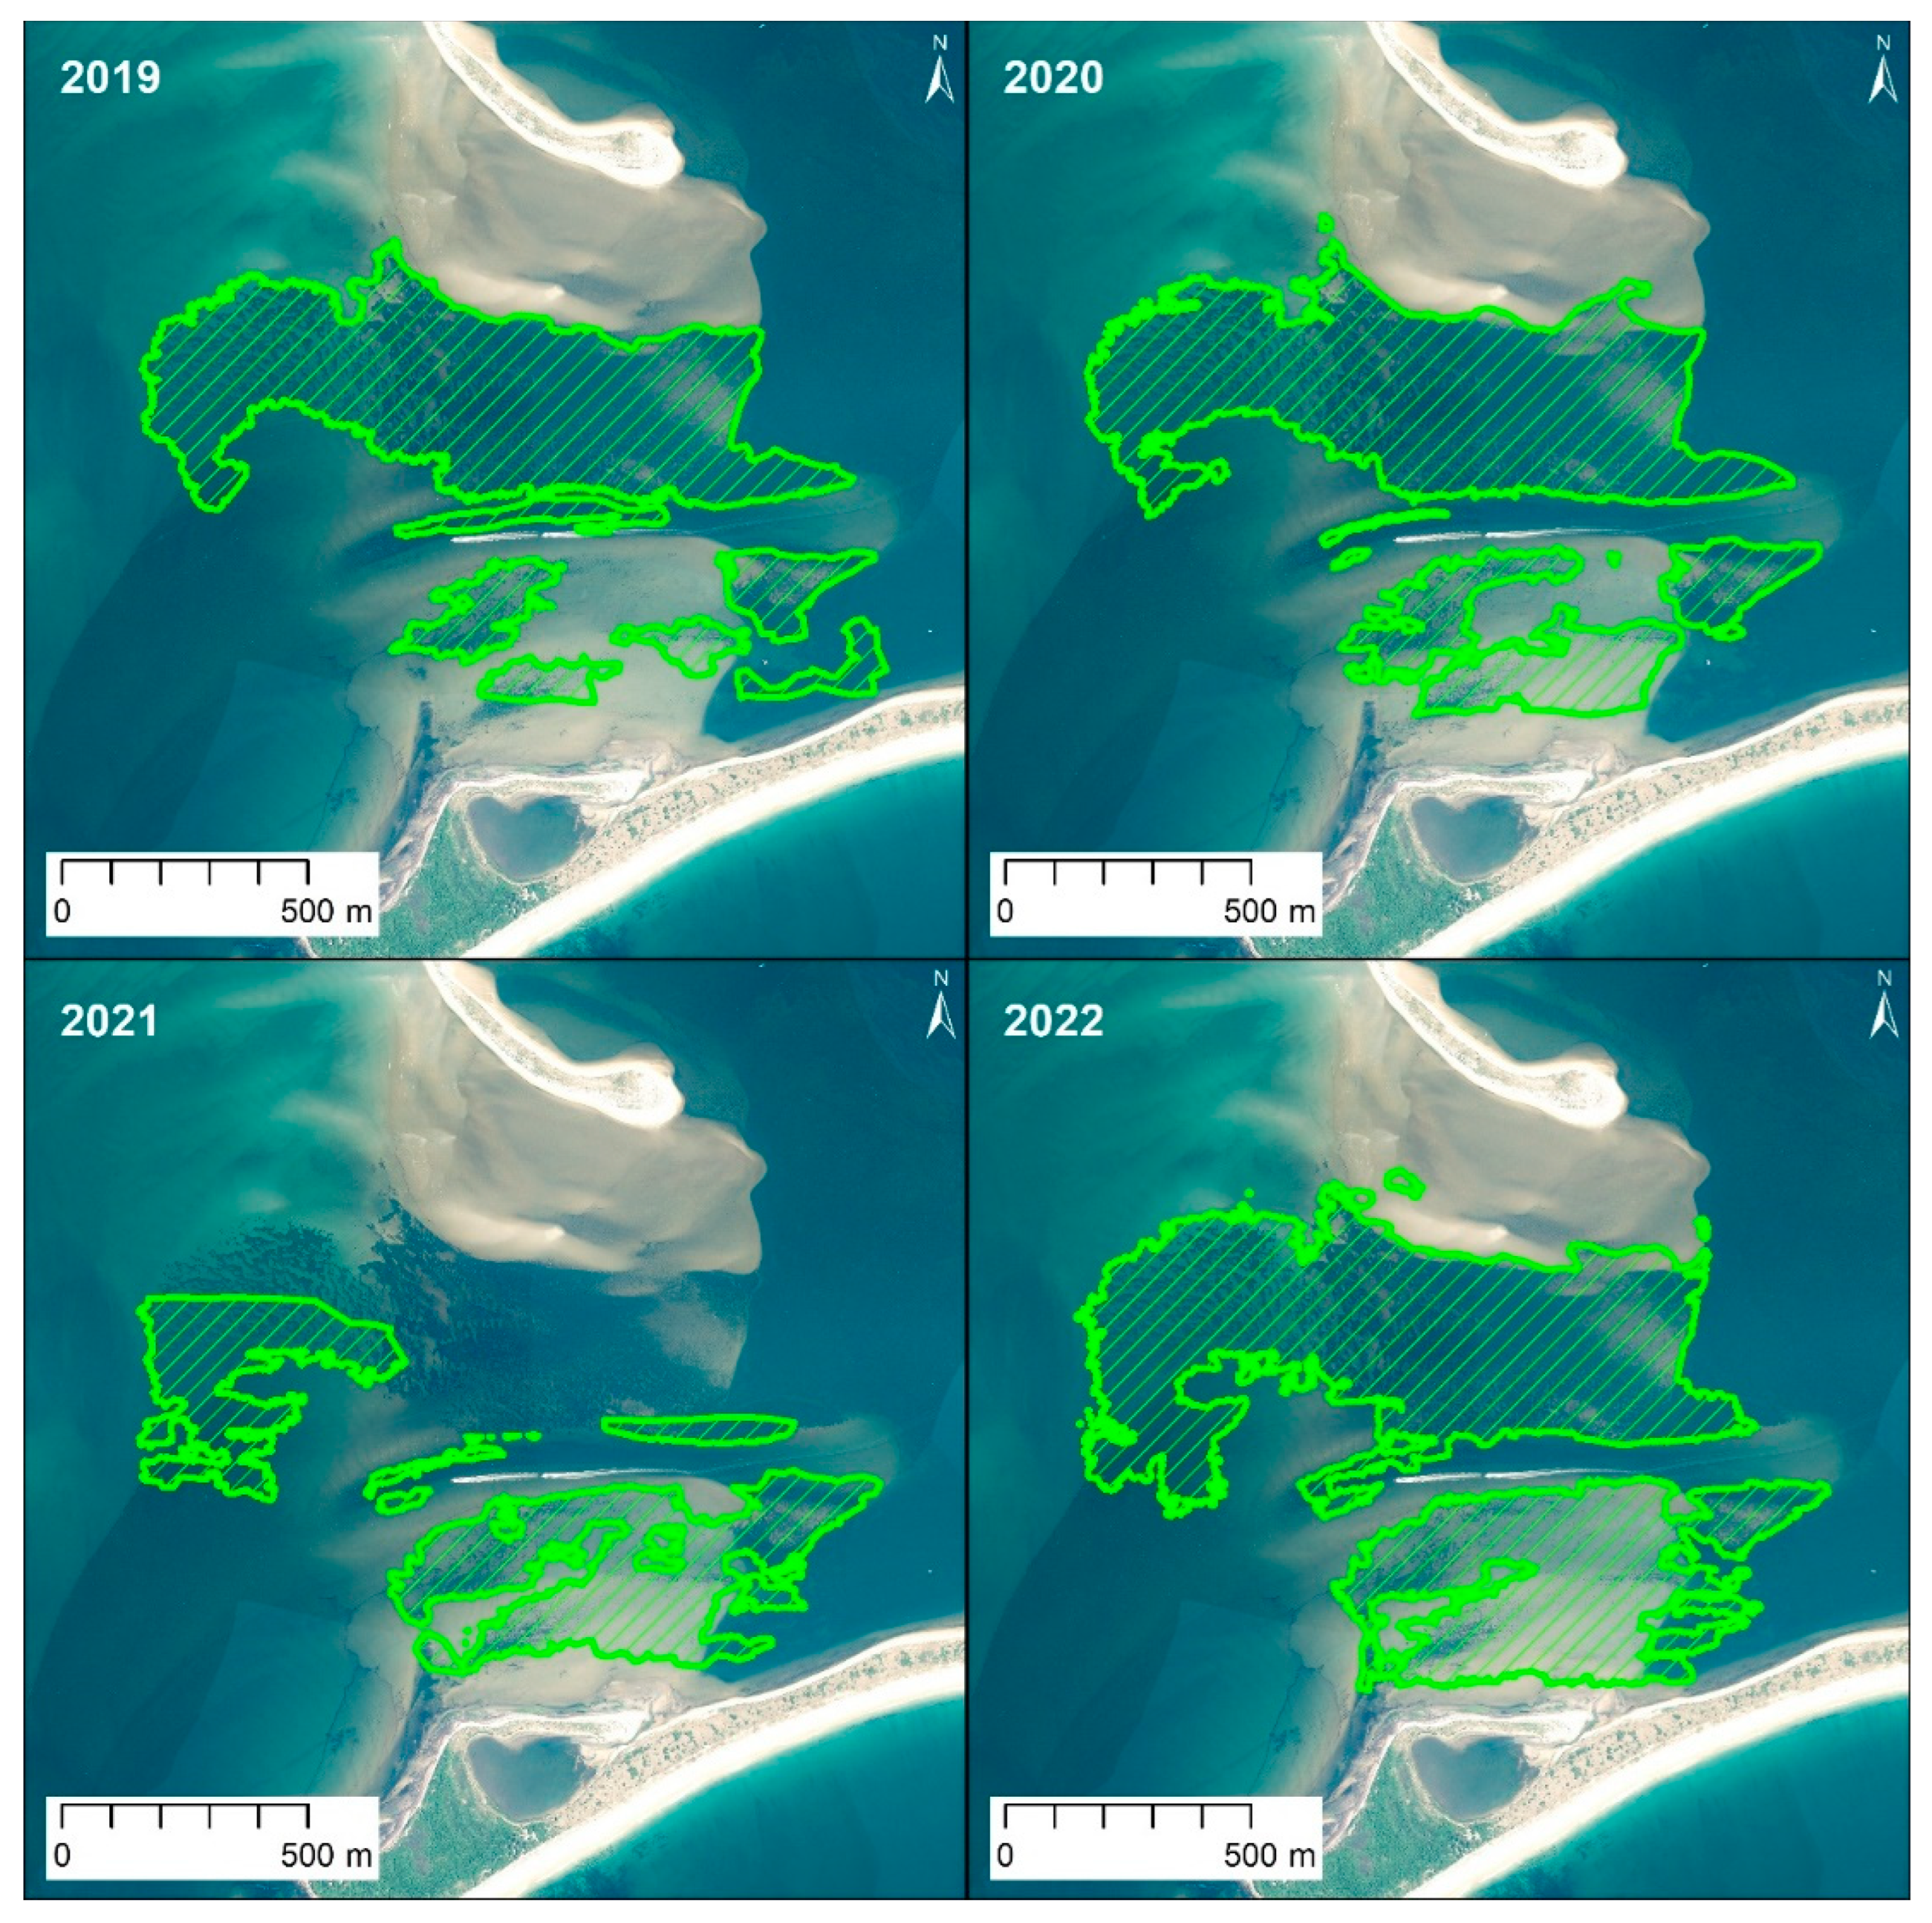
Figure 7.
A. June 2021 orthophoto [34] showing the location of panels 7B and 7C. B. August 2022 side-scan sonar record showing dense eelgrass in the northern bed; note the large clumps and visible bare patches within the denser parts of the bed. The very light streaks in the data are acoustic shadows where the sonar signal was blocked by eelgrass blades. C. August 2022 side-scan sonar record from the southern bed showing a general decrease in density of eelgrass from west to east (left to right).
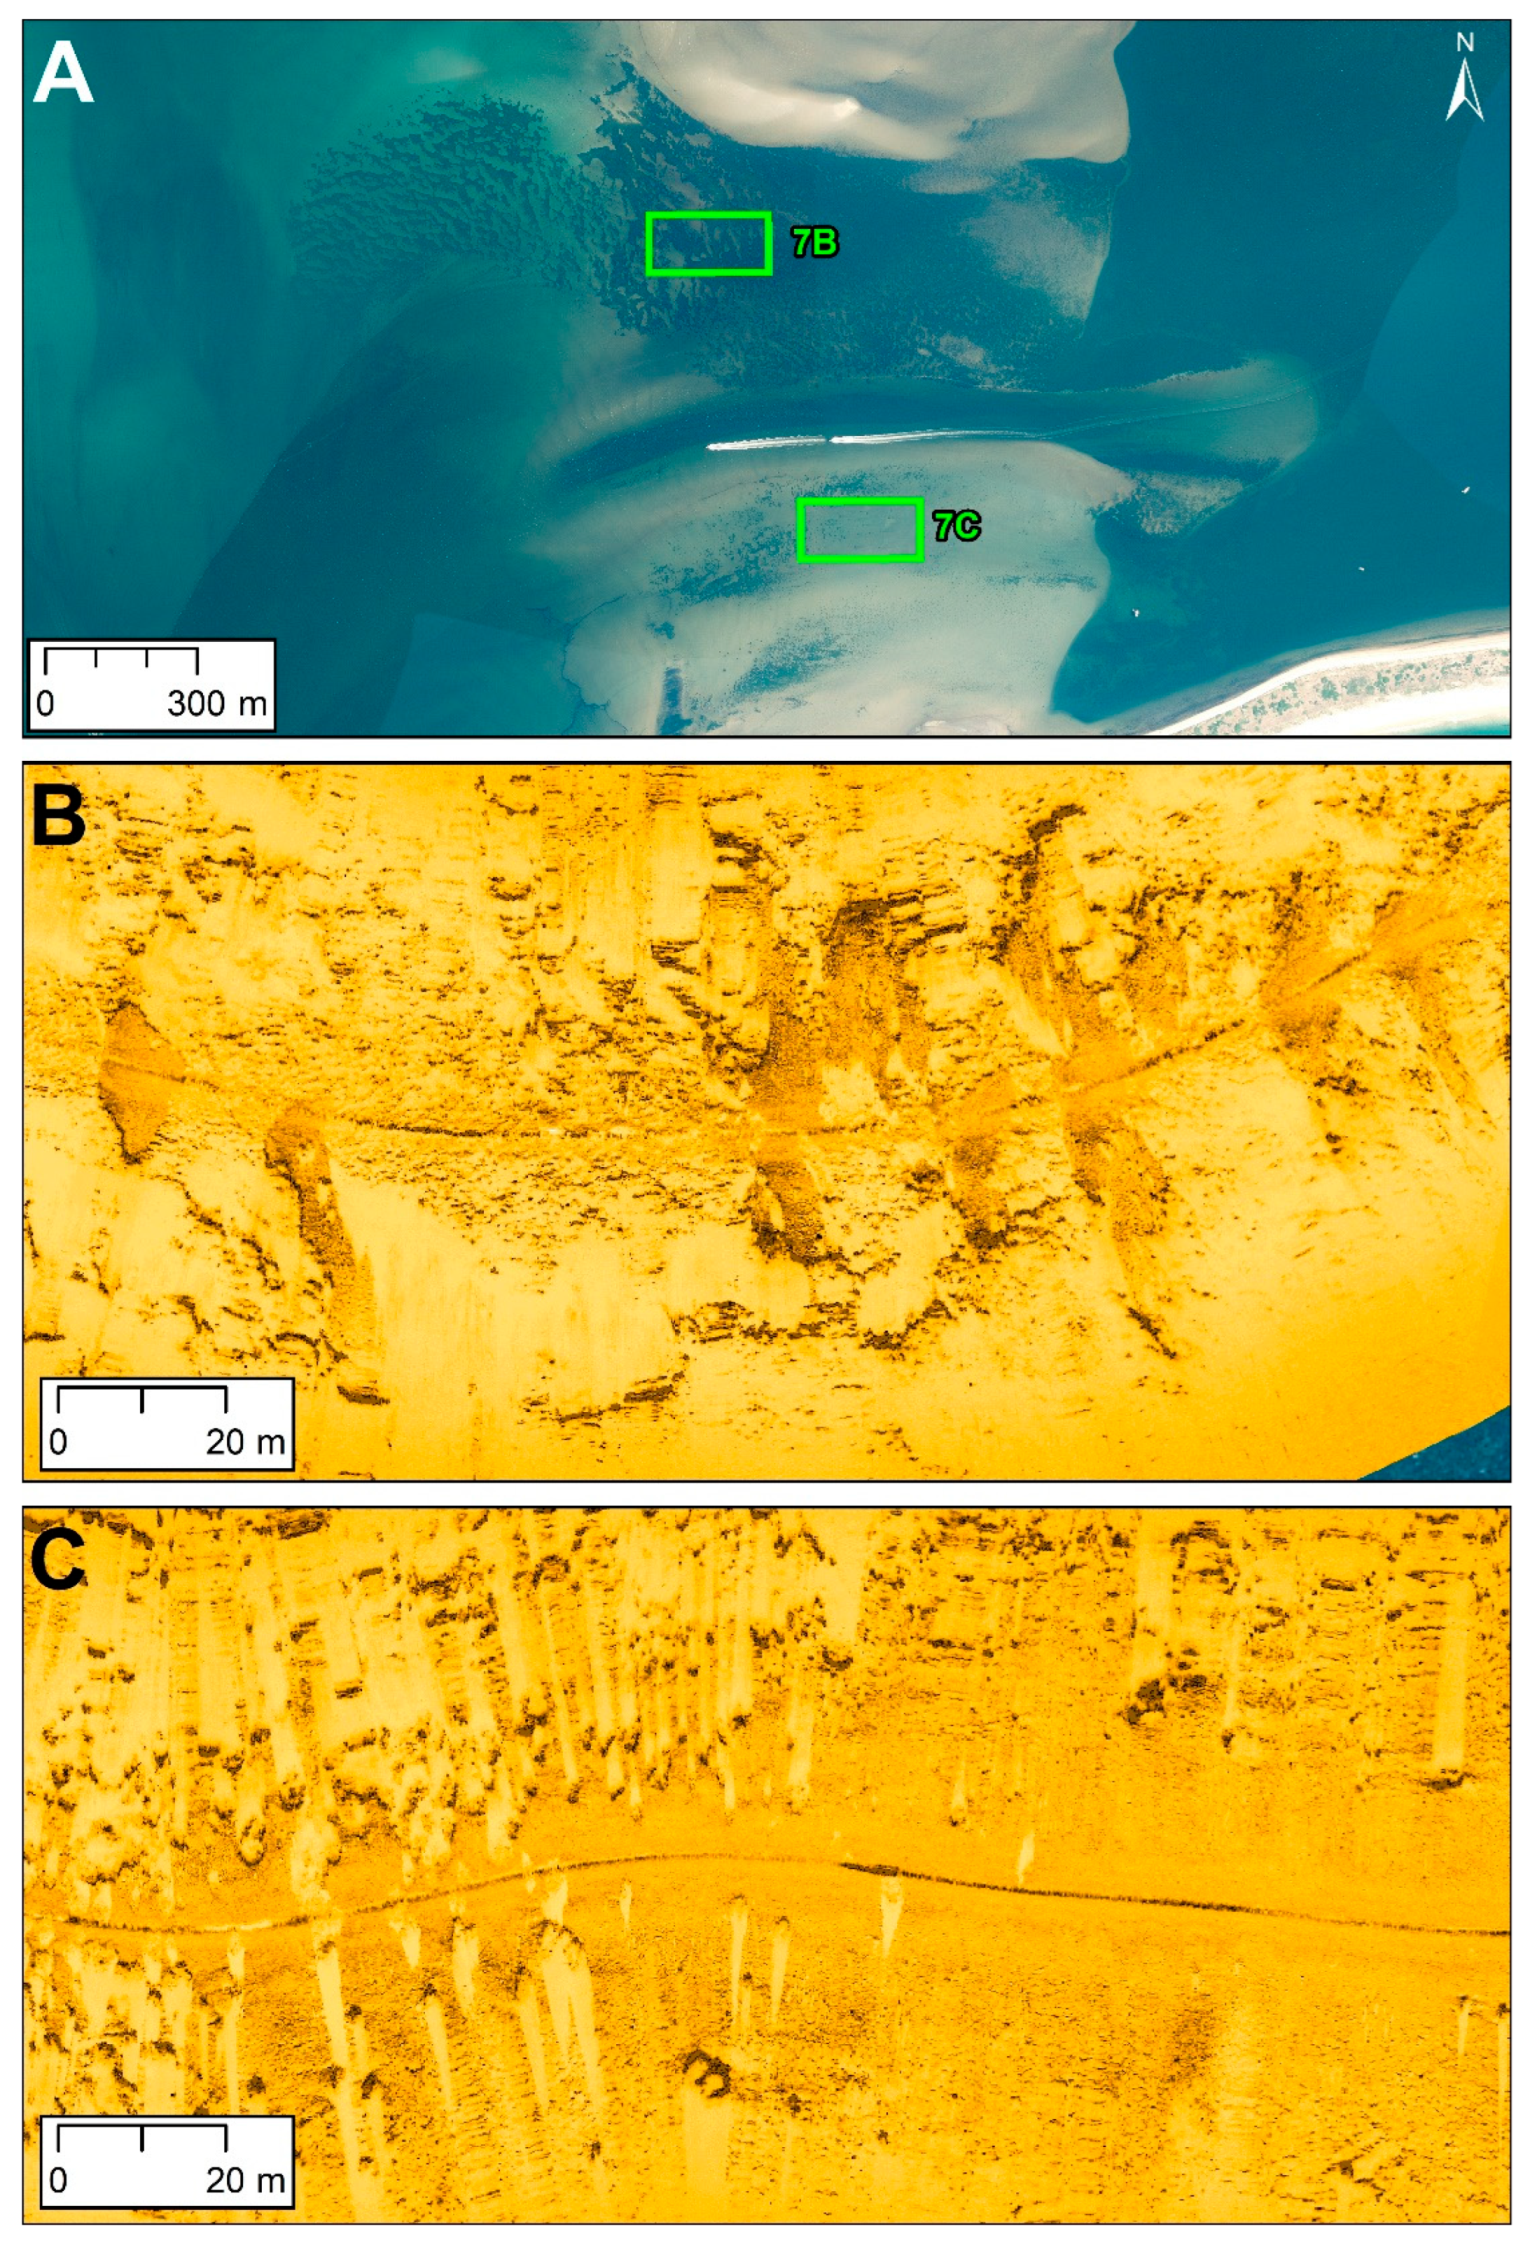
Figure 8.
The result of the raster-based analysis of the eelgrass coverage in 2019, 2020 and 2022. Note, 2021 was omitted because the side-scan sonar coverage was limited to the southern half of the study area. Areas of dark green correspond to a value of 3, e.g., eelgrass was present at that site in all three years.
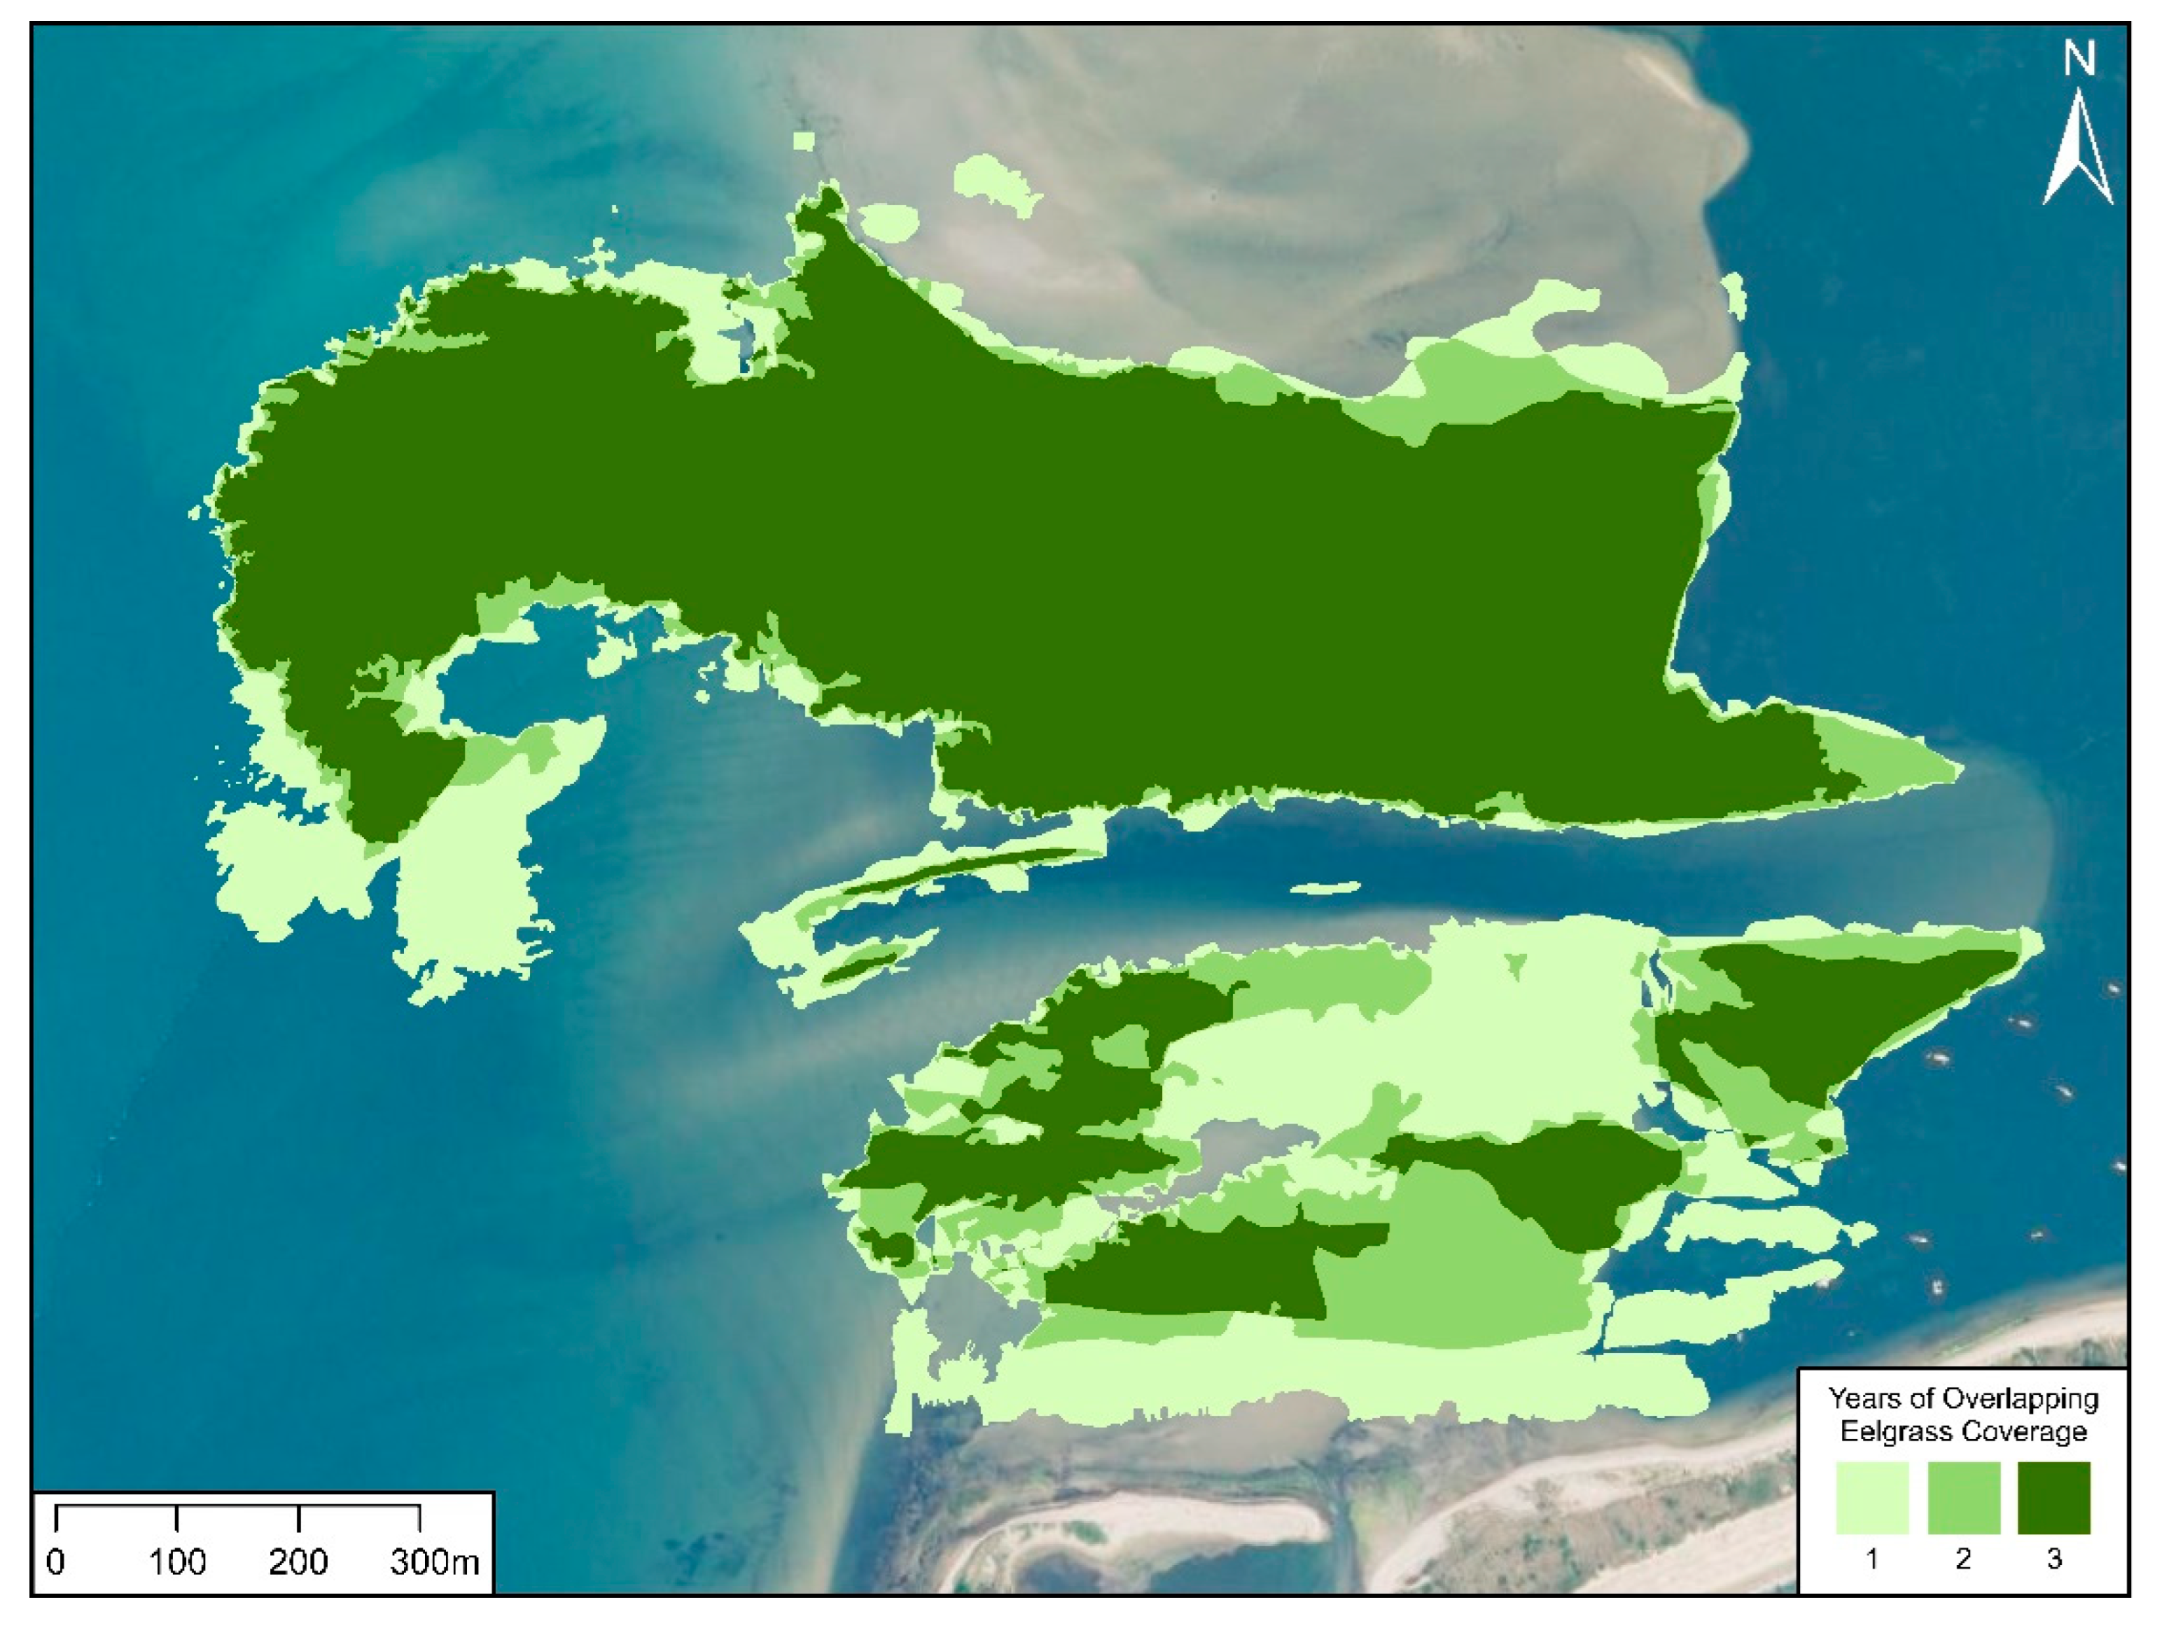
Figure 9.
Comparison of side-scan sonar mapped extent of eelgrass (2021, 2022, hatched polygons) and aerial imagery (June 2021, green polygon) [25]. Note the overall similarity in the extent of the bed, with the exception being the deeper western part of the northern bed and the shallow area south of the channel. June 2021 orthoimagery basemap [34].
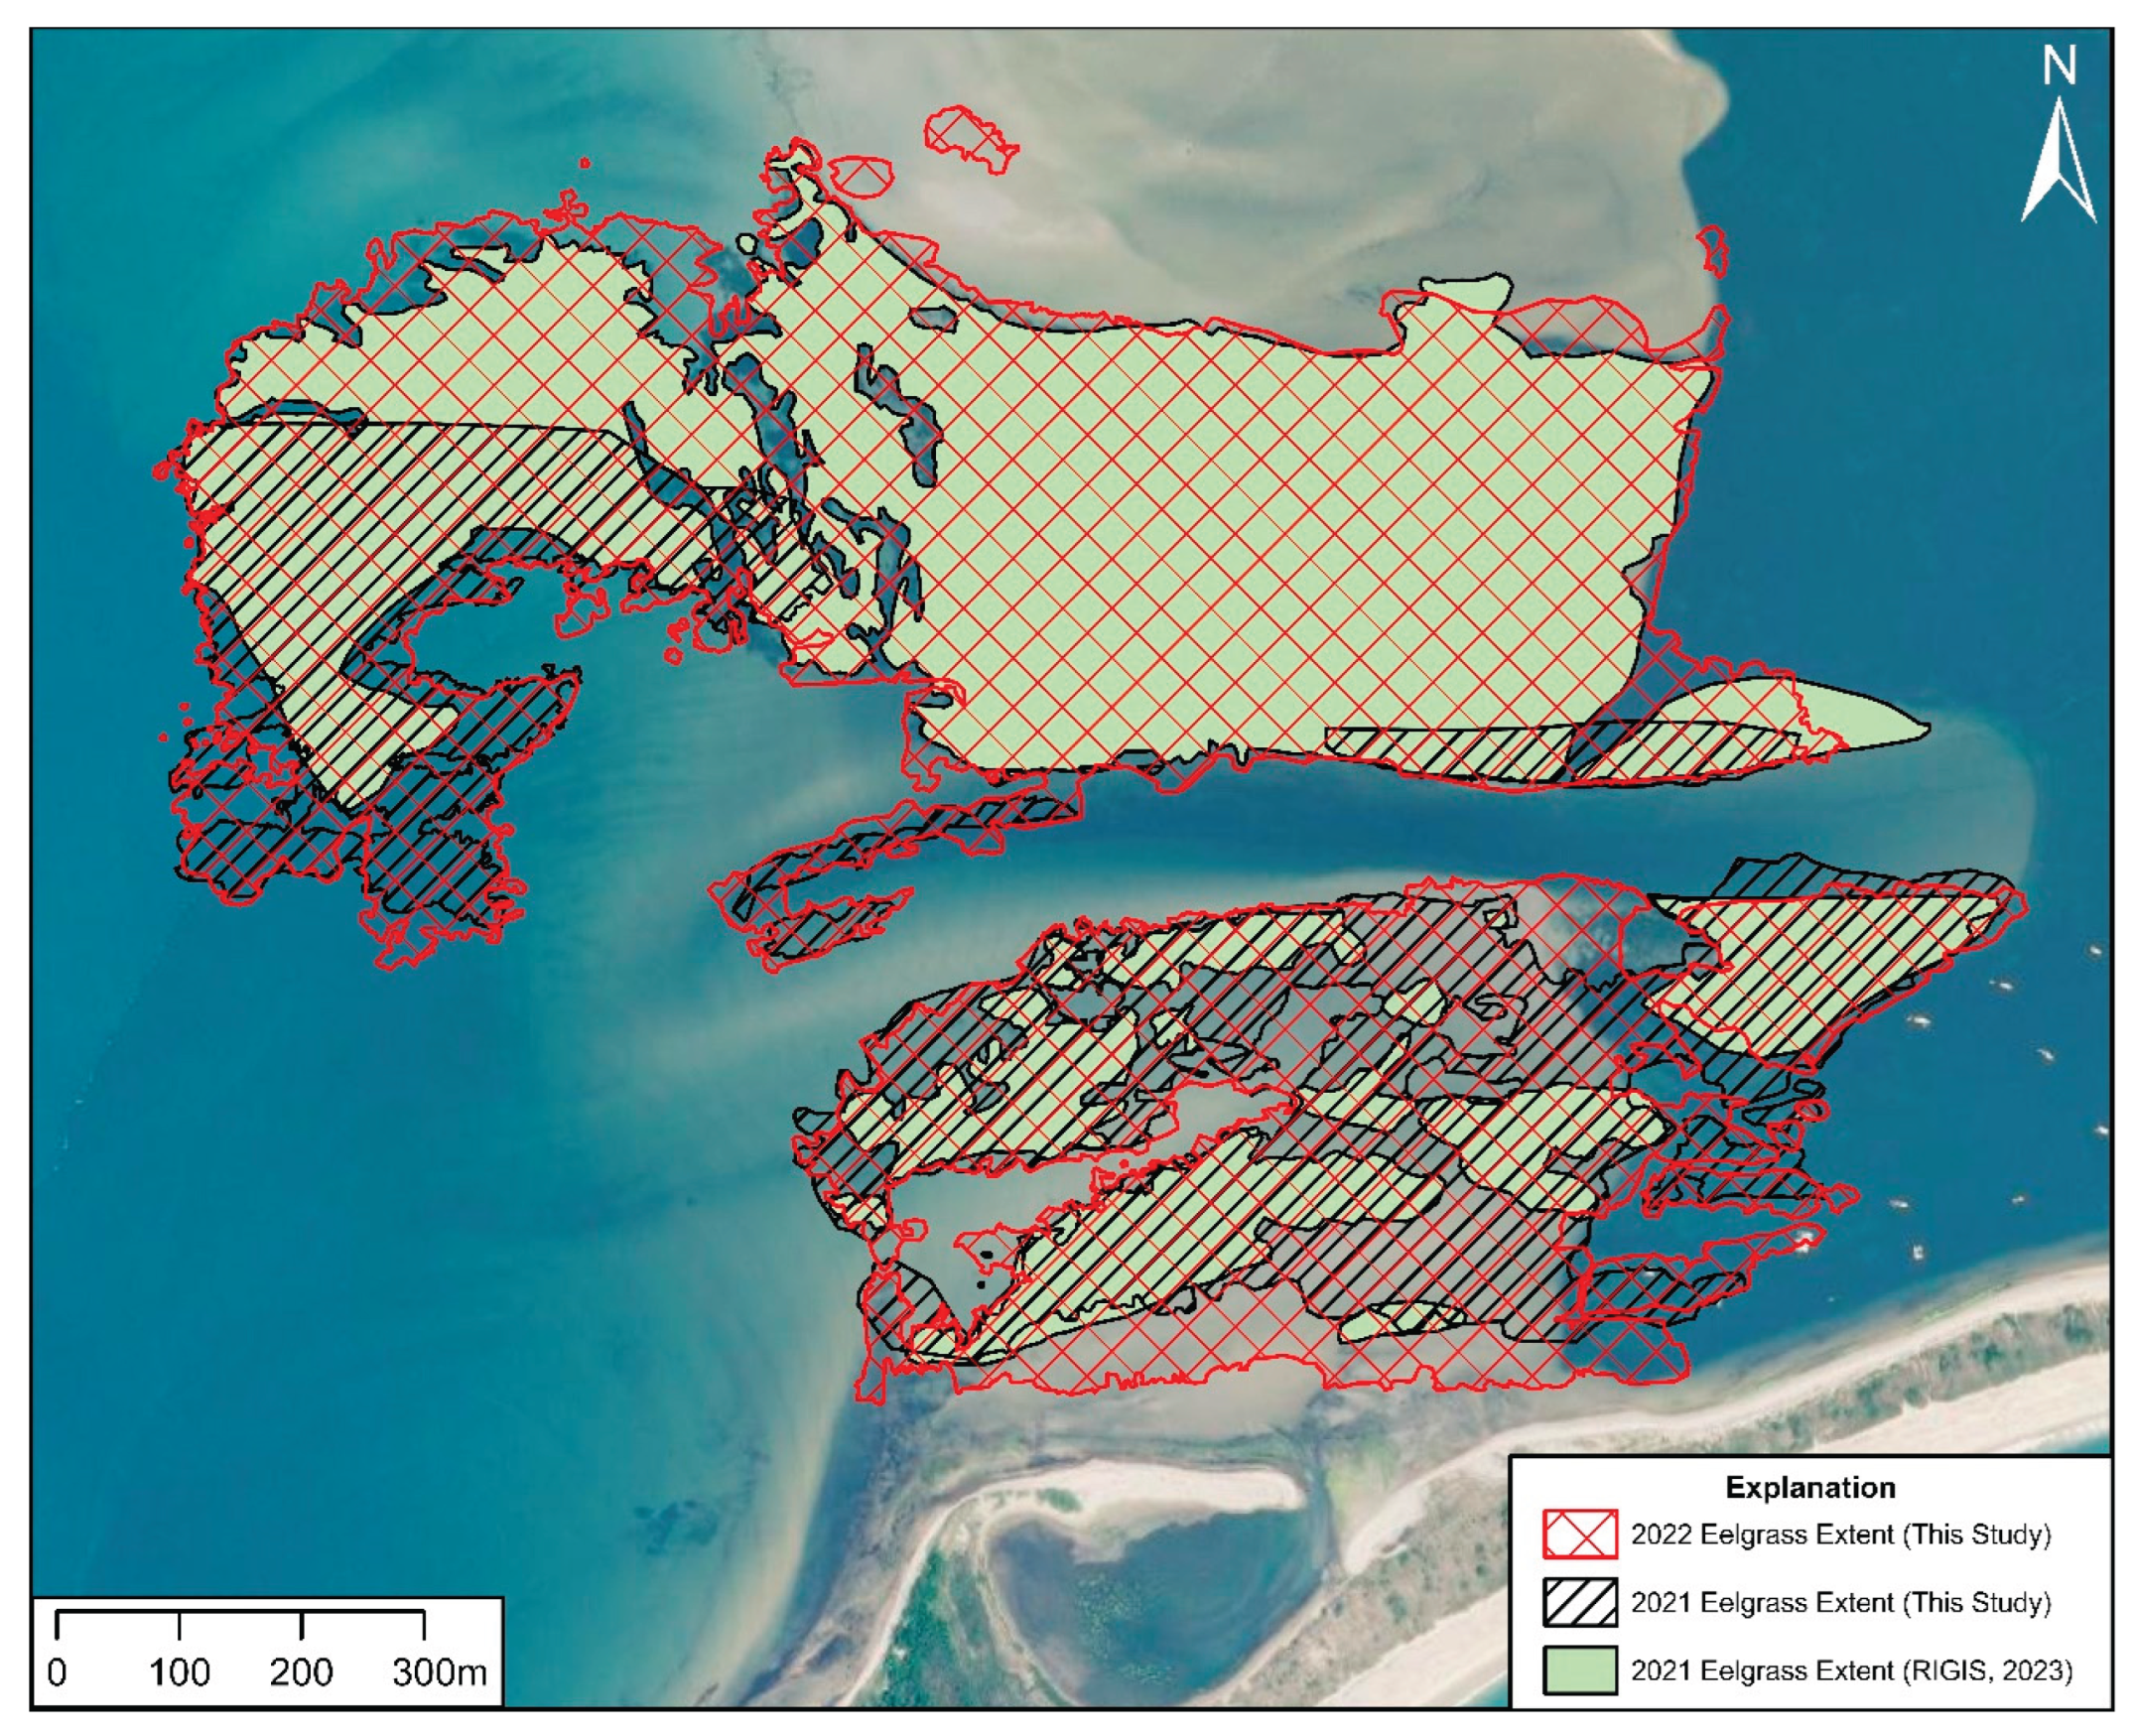

Table 1.
Total eelgrass mapped in LNB using aerial imagery from June 2012 [23], June 2016 [24], and June 2022 [25].
| Year | Acres | Km2 |
| 2012 | 141 | 0.57 |
| 2016 | 96 | 0.39 |
| 2021 | 117 | 0.47 |
Table 2.
Total side-scan sonar coverage, mapped extent of eelgrass and percent of eelgrass change (relative to the 2019 side-scan sonar survey). The partial mapping in 2021 is excluded from the total coverage and percent change calculation.
Table 2.
Total side-scan sonar coverage, mapped extent of eelgrass and percent of eelgrass change (relative to the 2019 side-scan sonar survey). The partial mapping in 2021 is excluded from the total coverage and percent change calculation.
| Year | Side-scan sonar coverage: km2 (acres) | Total eelgrass coverage: acres (km2) | Percent change (Relative to 2019) |
| 2019 | 1.56 (385) | 0.52 (128) | N/A |
| 2020 | 1.64 (405) | 0.57 (142) | +11% |
| 2021 | 0.81 (200) | N/A | N/A |
| 2022 | 1.74 (430) | 0.75 (185) | +45% |
Disclaimer/Publisher’s Note: The statements, opinions and data contained in all publications are solely those of the individual author(s) and contributor(s) and not of MDPI and/or the editor(s). MDPI and/or the editor(s) disclaim responsibility for any injury to people or property resulting from any ideas, methods, instructions or products referred to in the content. |
© 2025 by the authors. Licensee MDPI, Basel, Switzerland. This article is an open access article distributed under the terms and conditions of the Creative Commons Attribution (CC BY) license (http://creativecommons.org/licenses/by/4.0/).
Copyright: This open access article is published under a Creative Commons CC BY 4.0 license, which permit the free download, distribution, and reuse, provided that the author and preprint are cited in any reuse.


