
Submitted:
19 July 2025
Posted:
22 July 2025
You are already at the latest version
Abstract
The increasing therapeutic use of vitamin D3 requires new approaches to protect it against the adverse conditions of stomach acid and digestive enzymes. Practical applications of vitamin D3 against infectious diseases can benefit from the protective effects of a delivery system comprised of soy protein isolate and stachyose in emulsion gel. The prebiotic oligosaccharide stachyose, has shown to have a great potential as a substrate for beneficial intestinal bacteria, which are thought to modulate the immune system. Cellular and humoral immunity are both impaired in dairy animals under heat stress. The delivery of vitamin D3 embedded within soy protein isolate-stachyose emulsion gel resulted in a marked increase in 25-hydroxyvitamin D3 [25-(OH)-D3] concentration in blood serum. Chicken egg albumin (OVA)-immunized goats produced low anti-OVA immunoglobulin G (IgG) responses. In contrast, OVA-immunized goats fed vitamin D3 within soy protein isolate-stachyose emulsion gel diet strongly stimulated antibody production. These results show that anti-OVA IgG responses can be modulated in dairy goats using vitamin D3, in particular if this vitamin is delivered in the form of emulsion gel. The results seem to depend on the highly hydrated gel matrix of soy protein isolate-stachyose at the low pH of the stomach as monitored by oxygen-17 (17O) and proton (1H) nuclear magnetic resonance (NMR). In addition, the prebiotic nature of stachyose may boost beneficial gut bacteria, most notably for immune health and reducing the risk of infectious diseases.
Keywords:
vitamin D3
; delivery system
; NMR
; hydron
; prebiotics
; heat stress
; immune response
; dairy goats
1. Introduction
Deficiency of cholecalciferol (vitamin D3) has been shown to increase susceptibility to infections, and vitamin D3 administration has resulted in a significant decrease in the incidence of infections [1]. Cholecalciferol hydroxylation in the liver produces 25-hydroxy cholecalciferol [25-OH-D3], which may be transformed further in the kidney to other derivates of vitamin D3. Serum concentrations of 25-hydroxyvitamin D3 indicate whether vitamin D3 status is adequate. Currently, there is a great deal of interest within the animal feed industry concerning the potential utilization of 25-hydroxyvitamin D3 as an alternative to cholecalciferol [2]. High serum concentrations of 25-hydroxyvitamin D3 positively affect animal performance and their health status [3]. Produced by white blood cells, various types of immunoglobulins, also known as antibodies, have important contributions to immunity. Of these immunoglobulins, IgA has a primary defense role against pathogens and activates mucosal immunity [4]. Dairy herds with low serum IgA levels are readily exposed to diseases, such as mastitis [5]. Complex coacervates of sulfur lactoferrin and sodium alginate crosslinked with microbial transglutaminase followed by spray drying were shown to be a good vitamin D3 supplement in dairy goats’ feed. They increased the immune response of late-lactating dairy goats [6].
Soy protein isolates are derived from defatted soy flakes, using a minimum heat process. Soy protein isolate contains 90% protein, and since it is carbohydrate- and fat-free, does not retain a ‘beany’ flavor. Isolated soy protein is usually used in many infant formula and medical nutritional products due to its bland flavor and high-quality protein [7,8]. Moreover, stachyose is a prebiotic oligosaccharide with biological activities such as regulating intestinal microflora and alleviating inflammatory response and oxidative stress when used in combination with Lactobacillus rhamnosus GG [9]. It is generally accepted that prebiotic oligosaccharides such as inulin and oligofructose modulate immunological processes at the level of the gut-associated lymphoid tissue (GALT) [10]. The intestinal bacteria are present mainly in the large intestine. Therefore, in order to increase the quantity of beneficial intestinal microflora by the ingestion of prebiotic oligosaccharides, these compounds must escape the digestion and the absorption processes of the small intestine and to reach the large intestine. Similar to the other prebiotics, stachyose has these properties. The intestinal bacteria metabolize prebiotic oligosaccharides readily and produce large amounts of short-chain fatty acids. As a result, the pH in the lumen of the large intestine decreases to an acidic pH value (1.5 to 3.5 ). At the same time, the total number of the intestinal microbes increases and enhances the fecal volume. The beneficial bacteria such as Bifidobacterium spp. and Lactobacillus spp. are resistant to the acidic environment, whereas the harmful bacteria such as Clostridium spp. are sensitive to the acidic conditions [11]. The increase in the growth of Bifidobacterium spp. is accompanied by the production of nitrogen derivatives such as ammonia, indole, phenol, and skatole, and by the elimination of carcinogenic substances during the fermentation [12].
The underlying physicochemical properties of soy protein isolate-stachyose emulsion gel have been outlined elsewhere [13]. Enteral (orally consumed) vitamin D3 embedded within the soy protein isolate-stachyose emulsion gel to rats affected the 25-(OH)-D3 plasma levels (the main circulating form of vitamin D3) with larger area under concentration-time curve at 0 and 24 h (AUC0-24h) and higher maximum concentration (Cmax) [13]. The soy protein isolate-stachyose emulsion gel should in theory serve as a substrate to Bifidobacterium spp. and other useful bacteria, facilitating their growth in the large intestine. The supplementation of vitamin D3 embedded within the soy protein isolate-stachyose emulsion gel may contribute to the protection of dairy goats against mastitis, since dietary vitamin D3 is associated with immunomodulatory properties [14]. There is also enough evidence to suggest that prebiotic formulated diets have beneficial effects for gut microbiota, metabolic activity, stool consistency and frequency, and the development of some immune markers [15].
Heat stress constitutes a significant cost for the dairy industry [16]. Studies in animal models have demonstrated that heat stress decreases immune function and resistance to infection [17,18,19]. In this context, heat stress impacts both cell-mediated (T-lymphocytes) and humoral (B-lymphocytes) responses. Vitamin D3 can modulate these responses, thereby maintaining immune homeostasis during heat stress [20]. This study is aimed to evaluate the effects of soy protein isolate-stachyose emulsion gel as a delivery system for vitamin D3 in healthy dairy goats under heat stress. We hypothesized that the inclusion of a low dose of vitamin D3 embedded within the soy protein isolate-stachyose emulsion gel in the diet of healthy dairy goats can modulate the humoral immune response under heat stress.
2. Materials and Methods
2.1. Materials
Cholecalciferol (vitamin D3), deuterium oxide (99.8%; D2O), monobasic potassium phosphate, calcium chloride, sodium chloride, stachyose, microbial transglutaminase, and ovalbumin were purchased from Sigma-Aldrich (St. Louis, MO, USA). Soy protein isolate was a gift of Cargill (Wayzata, MN, USA). Medium-chain triglycerides (MCT) oil (Neobee M-5, ≥ 66% C8:0 and ≥ 32% C10:0 content) was kindly donated by Stepan Company (Northfield, IL, USA). The solvents used for the extraction and analysis of samples were HPLC-grade and purchased from Sigma-Aldrich. All other chemicals and reagents were of analytical-grade (Sigma-Aldrich). Deionized water, prepared by passing distilled water over a mixed bed cation-anion exchanger, was used throughout this study.
2.2. Preparation of Emulsion Gel
Soy protein isolate (final concentration 10%) and stachyose (final concentration 4%) were dispersed in deionized water, respectively. The solution was continuously stirred for 3 h at room temperature. The final pH of the emulsion was adjusted to 6.0 using 0.5 M HCl. Next, 15% (v/v) MCT oil with 0.2% (w/w) vitamin D3 (cholecalciferol) were added and pre-emulsified with a hand-held homogenizer (Biospec Products Inc., Bartlesville, OK, USA) at low speed for 2 min at 21 °C. The coarse gel emulsion was homogenized twice at 20 MPa (12,000 psi) through a high-pressure TC5 homogenizer (Stansted Fluid Power, Harlow, U.K). Calcium (10 mM) and microbial transglutaminase (30 U/g of soy protein isolate) were added to the gelled emulsion and then incubated in a water bath at 50 °C for 2 h. Subsequently, the microbial transglutaminase was inactivated by holding the gelled emulsion samples at 85 °C for 15 min and then cooled in an ice bath immediately. The emulsion gel was molded into small disks and sealed in alumina blister trays. The blister trays were stored under nitrogen atmosphere at 4 °C.
2.3.17. O NMR Measurements
The hydration properties of the soy protein isolate alone and in combination with stachyose were determined by 17O NMR according to the method described by Mora-Gutierrez et al. [21]. To study their interactions, soy protein isolate at a fixed concentration of 2% w/w and stachyose at different concentrations (0, 0.1, 0.2, 0.4, 0.8%, w/v) were mixed in deuterated phosphate-buffered saline (PBS) at pH/pD values of 2.4, 6.5 and 7.6 at 21 °C in the presence of 0.4 M NaCl under constant magnetic stirring. Conversion to pD values was made according to the relation pD = pH + 0.4, where pH is the pH-meter reading for a solution in D2O with the electrode calibrated in standard H2O buffers [22]. The ionic strength of 0.4 M simulates the gastrointestinal (GI) tract [23]. Samples were transferred to 10-mm high resolution NMR tubes (Sigma-Aldrich). 17O NMR experiments were performed at 21.1 T using a Bruker Avance II 300 MHz spectrometer (Bruker Corporation, Billerica, MA, USA). A recycle delay of 0.5 s was used. The number of scans required for a good signal-to-noise ratio in the 17O NMR spectra of the samples was about 2000. A spinning frequency of 23 kHz was utilized. Single radiofrequency pulses of 27 μs pulsewidth (90° flip angle) in the presence of broadband decoupling at 300 MHZ were used.
2.4.1. H NMR Measurements
1H NMR relaxation times (T1 and T2) were performed at 21 °C on a Bruker Avance II 300 MHz spectrometer (Bruker Corporation) according to the method described by Mora-Gutierrez and Baianu [24]. T1 was derived from a series of spectra collected using a standard inversion-recovery pulse sequence (180-ι-90-delay), in which the variable delay, ι, was varied from 100 ms to 40 s. T2 was measured using the standard Carr-Purcell-Meiboom-Gill (CPMG) pulse sequence, (90-ι-1800n-delay), in which n was varied from 2 to 256 for the 2.5% stachyose gel, decreasing to a range of 2 to 128 for the 12.5% stachyose gel (ι = 1 ms for all measurements). Relaxation rates, R1 and R2, were calculated as the reciprocal value of relaxation times, T1 and T2, respectively. Relaxation times (T1 and T2) were derived from fitting the series of integrated peaks to standard exponential functions using Origin 7 (Originlab Corporation, USA). Six measurements were performed on each sample to determine an average value and associated uncertainty for T1 and T2. All quoted uncertainties are repeatability standard deviations multiplied by a factor of 2.36 to give the 95% confidence interval.
The hydrogen spectra of the soy protein isolate-stachyose gelled emulsion samples at concentrations of 2.5% w/w and 0.3% w/w, respectively, and pH/pD 2.4 and 7.6 in D2O were determined by 1H NMR using a 400 MHz Bruker instrument (Bruker Corporation). The soy protein isolate-stachyose gelled emulsion samples were cut into a 1 cm3 and placed in the sample tube. The sample tube was placed in the radiofrequency (RF) coil. A pulse width of 30 μs (77 °C mutation angle) and a spectral width of 6 kHz were used; and the acquisition time and the recycle time were 1.4 and 3.4 s, respectively. Data were stored in a 16 K memory block. Approx. 30 min were allowed for each sample to reach thermal equilibrium in the magnet before data acquisition.
2.5. Determination of embedding rate
The aqueous suspension of vitamin D3 emulsion gel prepared in section 2.2 was mixed with anhydrous ethanol and centrifuged at low speed for 5 min at 21 °C to separate free vitamin D3. The supernatant after centrifugation was collected and diluted with anhydrous ethanol. The quantitative determination of vitamin D3 was performed using HPLC-UV [25]. The embedding rate (ER) was calculated as follows:
2.6. Animals, Diets, Facilities and Experimental Design
In a 56-day feeding trial, eighteen Alpine dairy goats (mean age 2.5 years, mean BW 114.2 kg) were selected from the milking herd of the International Goat Research Center (IGRC) at Prairie View A&M University, Prairie View, TX, USA. All experimental procedures with the goats were in strict compliance with the current guidelines and legal requirements established in the United States for the proper use and care of animals and approved by the Institutional Animal Care and Use Committee at Prairie View A&M University (Protocol # 2023-051). A total of six goats per experimental group (n = 18) were used. Our sample size also follows the recommendations of the Institutional Animal Care and Use Committee at Prairie View A&M University for discovery experiments where at least 4 biological replicates are needed. Udders were confirmed to be healthy by culturing udder half milk onto 5% blood agar plates and assessing over 48 h.
All dairy goats were housed indoors at the IGRC, where the temperature and the humidity of the housing were approximately 31 °C and 46%. Air temperature and relative humidity were monitored daily [12-h day (from 08:00 to 20:00), and 12-h night (from 20:00 to 08:00)] using a relative humidity/temperature meter (Fisher Scientific, Waltham, MA, USA). The 56-day feeding trial was performed from May-July of 2025. The selected dairy goats were randomly assigned to three experimental groups: control (n = 6), vitamin D3 supplementation (1 mg vitamin D3/day) dispersed in MCT oil (n = 6), and vitamin D3 supplementation (1 mg vitamin D3/day) embedded in the emulsion gel (n = 6). After the initial 14 days of adaptation period, the experiment continued for 56 days. All goats were at midlactation (162 days in milking; 864 mL milk/day) and were randomly assigned to an individual feeding gate on the day of enrollment.
The two treatments of dairy goats that were given the two delivery forms of vitamin D3 consisted of 1 mg of vitamin D3/day in addition to the base ration that provided 0.05 mg of vitamin D3 daily. A top-dress supplement for the treatment with vitamin D3 was prepared by mixing 0.6 g of the vitamin D3 emulsion gel with cornmeal to provide 1 mg of vitamin D3 in 100 g of total mixture. A top-dress supplement for the treatment with vitamin D3 dispersed in MCT oil was prepared by combining vitamin D3 in MCT oil (1 mg vitamin D3/5 mL of MCT oil) and homogenized for adequate dispersal, and mixed with cornmeal to provide 1 mg of vitamin D3 in 100 g of total mixture. The two top-dress supplements were not mixed into the ration and were consumed readily by all goats upon delivery.
The control animals (CON) received the basal diet without supplementation of vitamin D3. The basal diet was composed of 69.3% oats, 1.35% soybean meal, 2.05% corn, 26.04% alfalfa meal, 0.93% cottonseed hulls, 0.31% dicalcium phosphate, and 0.06% vitamin A, D3, and E supplement. The control and experimental animals were given 2.07 kg of the basal diet twice a day, in the morning and evening and the leftovers were measured. The diets supplemented with the two deliverable forms of vitamin D3 were only added to the morning feeding as a top-dress. Hay and water were available to animals ad libitum.
2.7. Sample Collection and Analysis of 25-(OH)-D3
Blood samples (5 mL) were collected by puncture of the jugular vein using siliconized needles (21 G x 1”) with a vacuum system. The blood samples taken at days 0 and 42 were transferred into 10-mLvacuum tubes (serum separator tube) (Becton Dickinson Vacutainer Systems, Franklin Lakes, NJ, USA) for 25-25-(OH)-D3 measurements. Tubes were centrifuged at 3,500xg for 5 min in a refrigerated centrifuge (4 °C) for serum separation within 30 min of sample collection. Serum samples were transferred into microtubes using Pasteur pipettes. The samples were maintained at 2-8 °C and immediately analyzed, avoiding freeze-thaw cycles because that are detrimental to many serum components. Serum analyses were performed in triplicate. Blood serum 25-(OH)-D3 concentrations were quantified using a CDC-certified LC-MS method [26].
2.8. Establishment of Humoral Response to a Nominal Antigen Chicken Egg Albumin (OVA)
At the start of the experiment (0 day), 2 mg of chicken egg albumin (OVA) (Sigma-Aldrich) dissolved in 1 mL of sterile saline solution and 1 mL of Freund’s adjuvant (Sigma-Aldrich) were injected subcutaneously into both shoulders of each goat [27]. A subsequent injection of 2 mg OVA in saline without adjuvant was administered 15 days later.
Blood was taken from the caudal vein from each goat at 0, 14, 28, 42, and 56 days of the experiment. Samples from each animal were collected into duplicate heparinized vacuum tubes (Becton Dickinson Vacutainer Systems) for each animal. Blood samples were centrifuged at 1200xg for 15 min at 25 °C to separate the plasma fraction. Plasma samples were collected and aliquoted in 6 replicates for each animal, and then stored at -80 °C to perform ELISAs to evaluate the anti-OVA IgG titers.
2.9. Anti-OVA Specific IgG by ELISA
The anti-OVA antibody titer in blood plasma samples was evaluated by an ELISA test [27] performed in 96-well U-bottomed microtiter plates. Wells were coated with 100 μL of antigen (10 mg of OVA/mL of phosphate-buffered saline (PBS) at 4 °C for 12 h, washed and incubated with 1% skimmed milk (200 μL) at 37 °C for 1 h to reduce non-specific binding. After washing, the plasma (1:5000 dilution in PBS; 100 μL per well) was added and incubated at 37 °C. The extent of antibody binding was detected using a horseradish peroxidase-conjugated donkey anti-bovine IgG (Sigma-Aldrich) (1:20,0000 dilution in PBS; 100 μL per well). Optical density was measured at a wavelength of 450 nm. Plasma samples were read against a standard curve obtained using scalar dilution of goat-specific IgG (ZeptoMetrix, Corporation, Franklin, MA, USA). Data were expressed as mg of anti-OVA IgG/mL.
2.10. Statistical Analysis
Quantitative data for the combination of response and treatment variables are summarized with mean ± standard error. All tests were under 5% significance level. The data from hydration estimates of soy protein isolate with added stachyose (Table 1) and anti-OVA IgG concentrations in dairy goats fed with experimental diets under heat stress (Table 3) were analyzed by two-way ANOVA with Tukey test. A paired t test under pre-post-test design was performed to compare the difference between before supplementation (day 0) and after supplementation (day 42) with animals assigned to different dietary groups (Table 2). Experimental data were analyzed using SAS software (version 9.4, SAS Institute, Cary, NC, USA).

Table 1.
Hydration nH1 estimates (g of water/g of protein) of soy protein isolate with added stachyose 2.
Table 1.
Hydration nH1 estimates (g of water/g of protein) of soy protein isolate with added stachyose 2.
| pH/pD1 | |||
|---|---|---|---|
| Stachyose (%) | 2.4 | 6.5 | 7.6 |
| 0 | 0.00458 ± 0.000349 c | 0.00335 ± 0.000306 c | 0.00687 ± 0.000090 b |
| 0.1 | 0.00691 ± 0.000037 b | 0.00349 ± 0.000112 c | 0.00730 ± 0.000642 ab |
| 0.2 | 0.00721 ± 0.000408 b | 0.00382 ± 0.000066 c | 0.00746 ± 0.000277 ab |
| 0.3 | 0.00829 ± 0.000197 b | 0.00405 ± 0.000160 c | 0.00861 ± 0.000160 a |
1 From 17O NMR data (at 21 ± 1 °C) and at pH/pD 2.4, 6.5, and 7.6 in 0.4 M NaCl according to a two-state isotropic model [28]. 2 Data are presented as means ± SE. a-c Means in the same column with different superscripts are significantly different (P < 0.05).
Table 2.
Serum concentrations (ng/mL) of 25-hydroxyvitamin D3 [25-(OH)-D3] at baseline (0 d) and at feeding period (56 d) among dietary groups1.
Table 2.
Serum concentrations (ng/mL) of 25-hydroxyvitamin D3 [25-(OH)-D3] at baseline (0 d) and at feeding period (56 d) among dietary groups1.
| Diet2 | Baseline (0 d) 2 | Feeding period (42 d) | P-value |
|---|---|---|---|
| Control 1 | 21.71 ± 0.644 | 23.71 ± 0.647 | 0.229 |
| Diet 1 | 21.41 ± 1.470 | 27.24 ± 0.813 | 0.001 |
| Diet 2 | 21.75 ± 0.462 | 34.29 ± 1.550 | <0.0001 |
1 Dairy goats in midlactation under heat stress fed a basal diet (control), vitamin D3 supplementation dispersed in MCT oil (Diet 1), and vitamin D3 embedded within the emulsion gel (Diet 2).2 Data are presented as means ± SE; n = 18.
Table 3.
Anti-OVA IgG concentrations (mg/mL) in dairy goats under heat stress by interactions of experimental diet x sampling time1.
Table 3.
Anti-OVA IgG concentrations (mg/mL) in dairy goats under heat stress by interactions of experimental diet x sampling time1.
| Sampling time (days) | Experimental Diets2 | ||
|---|---|---|---|
| Control (n = 6) | Diet 1 (n = 6) | Diet 2 (n = 6) | |
| 0 1 | 1.90 ± 0.213 c C | 1.87 ± 0.184 c C | 1.93 ± 0.080 c D |
| 14 | 1.93 ± 0.180 c C | 1.90 ± 0.103 c C | 1.98 ± 0.217 c D |
| 28 | 6.20 ± 1.168 c A | 11.67 ± 2.106 b A | 17.57 ± 2.635 a C |
| 42 | 3.22 ± 0.796 c B | 13.83 ± 1.376 b A | 23.83 ± 1.487 a B |
| 56 | 2.57 ± 0.403 c C | 8.37 ± 2.345 b B | 30.08 ± 1.101 a A |
2 Dairy goats in midlactation under heat stress fed a basal diet (control), vitamin D3 supplementation dispersed in MCT oil (Diet 1), and vitamin D3 embedded within the emulsion gel (Diet 2).2 Data are presented as means ± SE; n = 18.a-c Means in the same row within each sampling time with different lowercase superscripts differ (P ˂ 0.05).A-D Means in the same column within each experimental diet with different uppercase superscripts differ (P ˂ 0.05).
3. Results and Discussion
It has been shown that soy protein isolate-stachyose emulsion gels have emerged as a suitable delivery system for vitamin D3 [13]. The addition of stachyose to soy protein isolate had a major impact on their pharmacokinetic parameters, which have been ascribed to a better protection of the bioactive compound from gastrointestinal (GI) degradation and the controlled release of such bioactive compound [13]. The water-binding property of soy protein isolate-stachyose emulsion gels is of great interest because the quantity of water associated with the polymer chains create a unique environment that facilitates biological interactions. According to the hydration data measured by 17O NMR (Table 1), the addition of stachyose significantly (P < 0.05) improved the hydration properties of soy protein isolate in deuterated phosphate buffer solutions at pH/pD value of 2.4 (at 21 °C) in the presence of 0.4 M NaCl. However, at pH/pD value of 7.6 (at 21 °C) the hydration properties of soy protein isolate differed (P < 0.05) only at stachyose concentration of 0.3%. These 17O NMR results may be due to the shorter chain length and more hydroxyl groups of stachyose at lower pH/pD, which lead to better hydration. The number of water molecules interacting with the hydroxyl groups, through mechanisms including hydrogen bonding and chemical exchanges of protons, depends on the concentration of the stachyose polymer.
It was observed by high-field 1H NMR that the longitudinal and transverse relaxation rates (R1 and R2) of water protons decreased as the stachyose concentration increased at pH/pD 6.5 (Figure 1 and Figure 2, respectively). Both R1 and R2 exhibit a linear correlation with the concentration of stachyose as shown in Figure 1 and Figure 2. The slope of the line of best fit for the plot of R2 against stachyose concentration was almost 1000 times deeper than that of R1 against stachyose concentration.
Translational relaxation of a nucleus is contributed by both slow and fast motions of that nucleus while the longitudinal relaxation is affected by fast motions only. R2 would be equal to R1 if the water molecules only exhibited fast motions. The fact that the value of R2 is greater than that of R1 for a given concentration of stachyose indicates that the water molecules also exhibit slow motions, which is consistent with the interaction of water protons with the hydroxyl groups of stachyose macromolecules. Moreover, Li et al. [13] noted that the addition of stachyose reduces the particle size of the soy protein isolate emulsion, thereby inducing the emulsion gel network to capture more water.
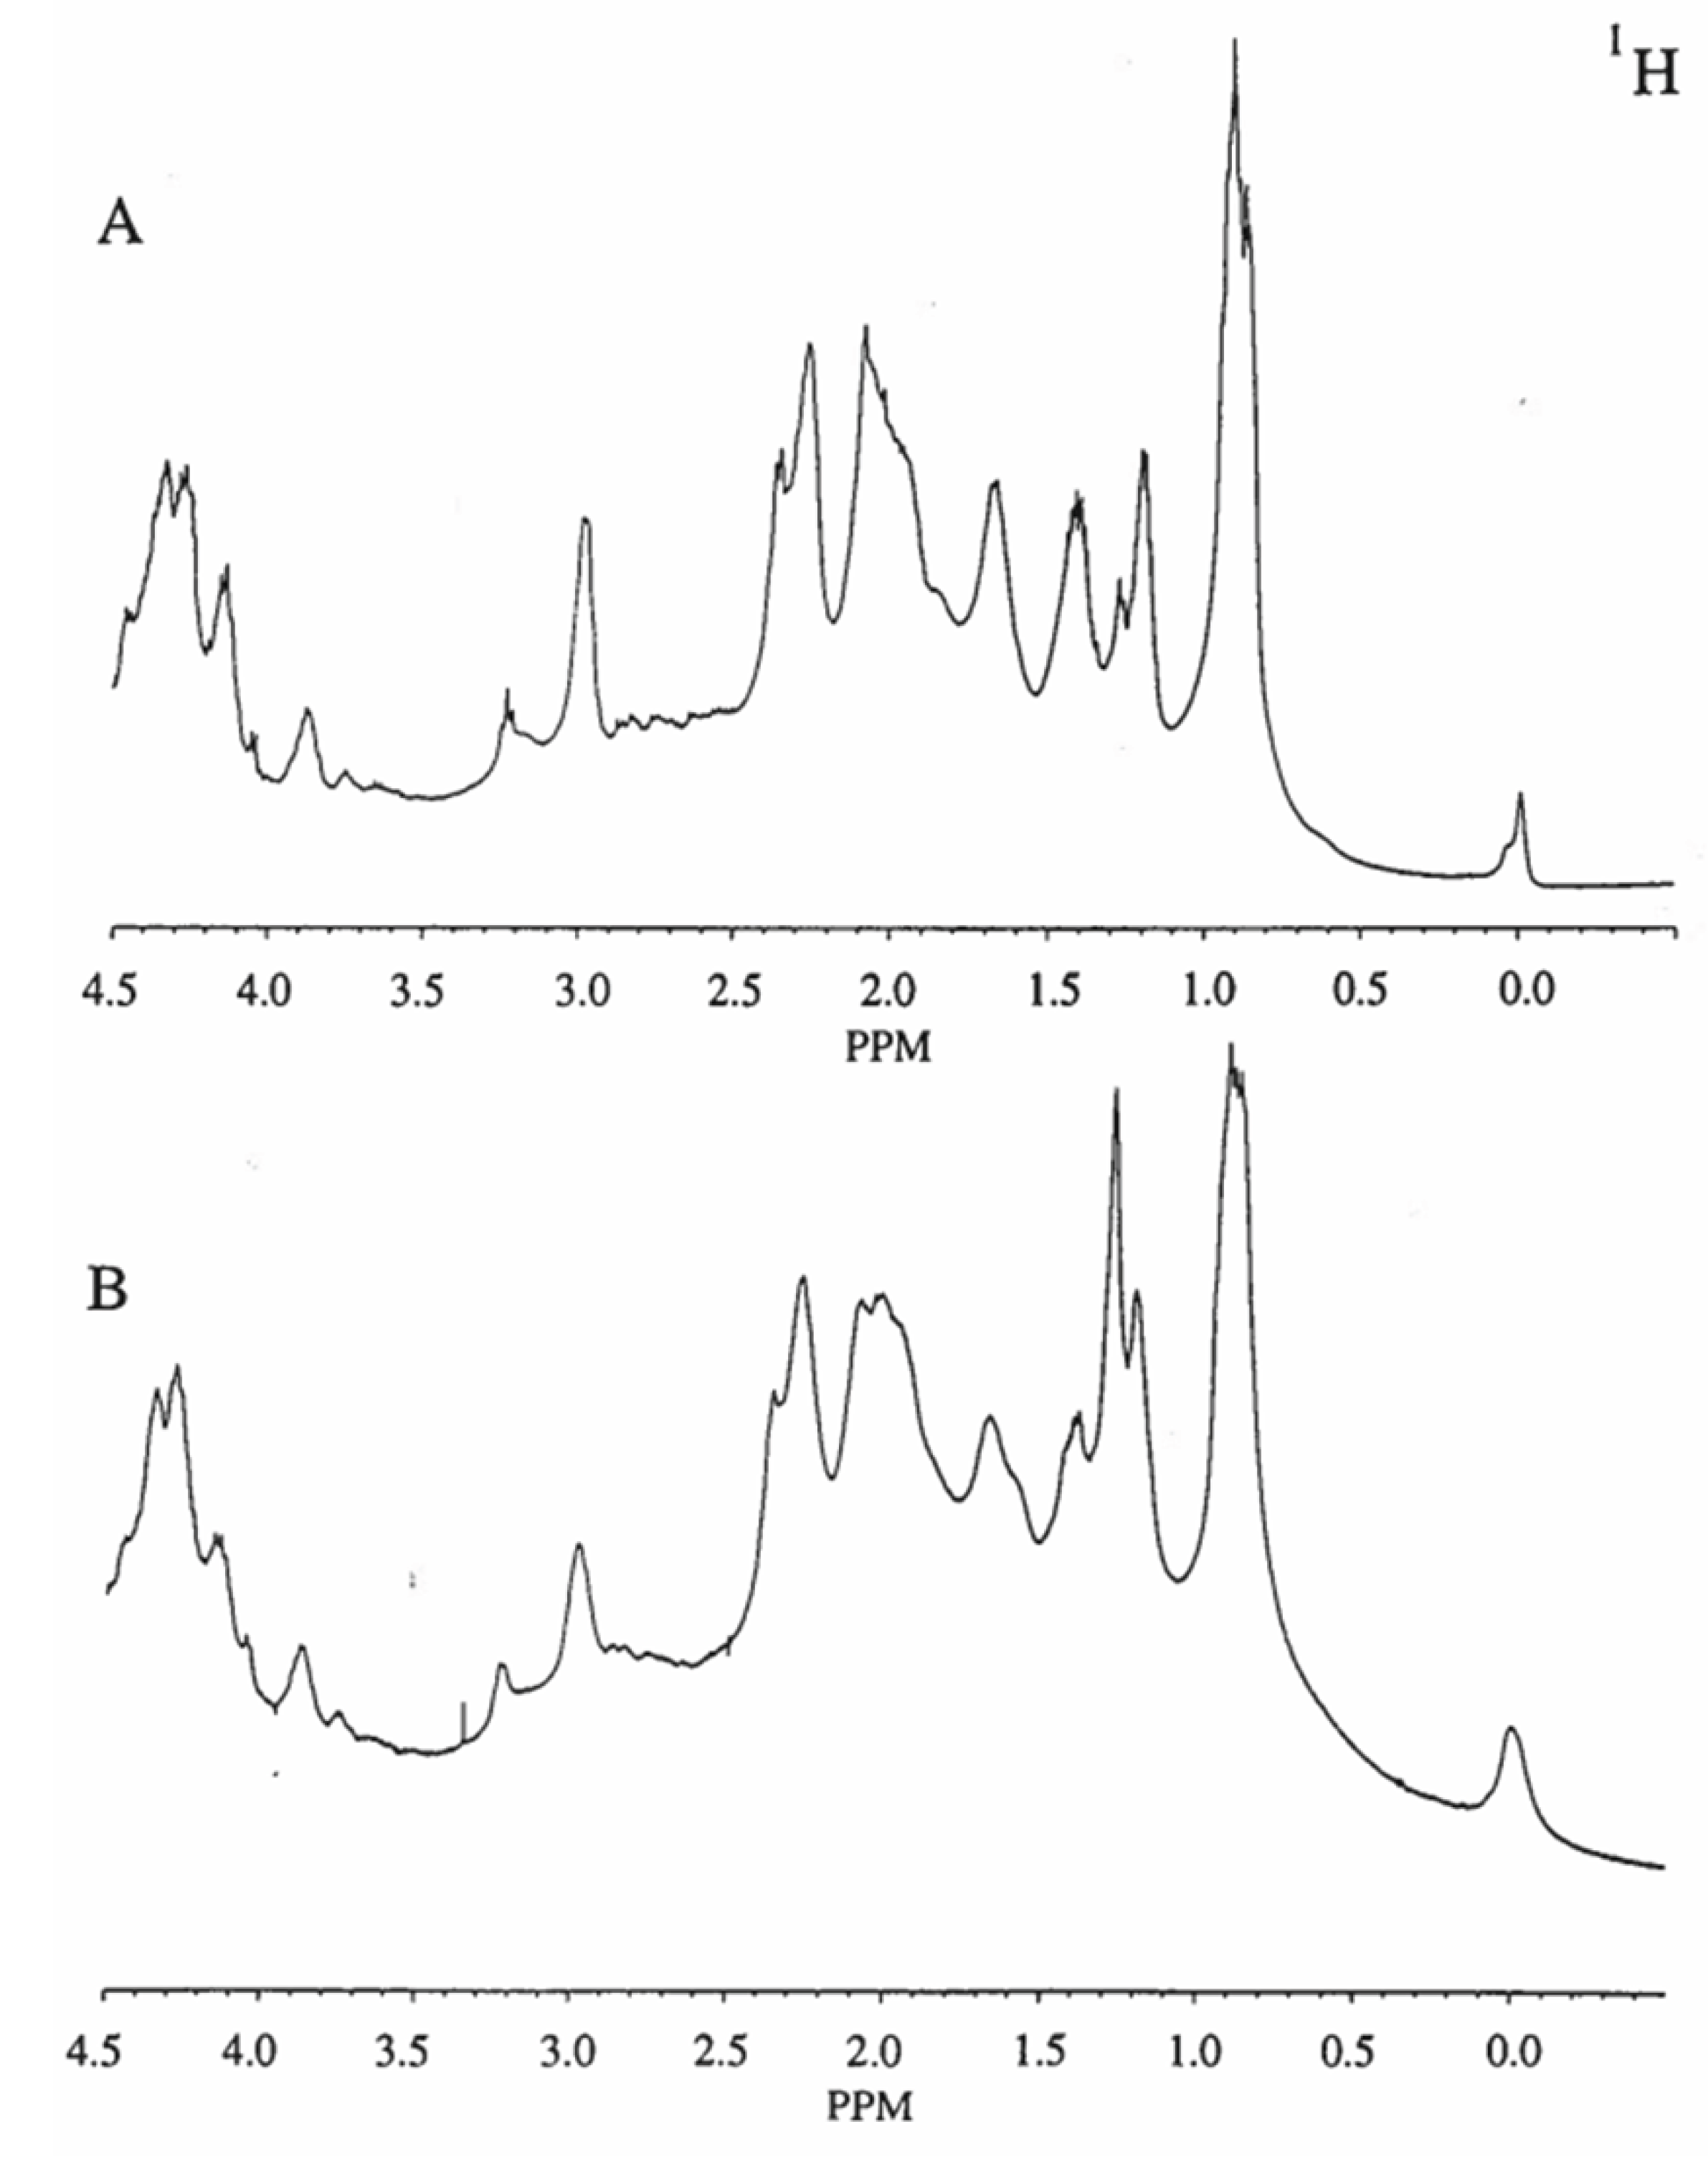
Our results indicate that water protons interact through chemical exchange processes with stachyose, and do so differently according to pH/pD as evidenced by 17O NMR (Table 1). These results provide a basis for understanding how water is bound by stachyose. The upfield region of the 1H NMR spectra (400 MHz) of the soy protein isolate-stachyose gelled emulsion sample at pH/pD 2.4 (Figure 3A) and 7.6 (Figure 3B) at 37 °C are almost identical. The absorbance changes were small as no major rearrangement of protein conformation as the result of pH/pD could be detected.
The embedding of vitamin D3 within the soy protein isolate-stachyose emulsion gel attained a high embedding efficiency of 81.2%. The soy protein isolate-stachyose emulsion gel contained vitamin D3 at a concentration of 0.16% as determined by HPLC-UV [25]. Formation of the emulsion gel matrix is a complex event generally understood to be affected by protein concentration, quantity and state of water, ionic type and strength, heating/time temperature, pH, and interactions with other components such as the oligosaccharide stachyose [21,28].
Vitamin D3 refers to two biologically inactive precursors: D3, also known as cholecalciferol, and D2, also known as ergocalciferol. The former produced in the skin on exposure to UVB radiation (290 to 320 nm) is known to be more bioactive. The latter is derived from plants and only enters the body via the diet. Both D3 and D2 precursors are hydrolyzed in the liver and kidneys to form 25-hydroxyvitamin D, the non-active storage form, and 1,25-dihydroxyvitamin D, the biologically active form that is controlled by the body. In the present study, blood serum 25-hydroxyvitamin D3 [25-(OH)-D3] concentrations across the three diets at 56 d was 23.71 ng/mL for the basal diet, 27.23 ng/mL for the basal diet supplemented with vitamin D3 dispersed in MCT oil, and 34.29 ng/mL for the basal diet supplemented with vitamin D3 embedded within soy protein isolate-stachyose emulsion gel (Table 2).
Heat stress is one of the main limiting factors of sustainable production in small ruminants, especially in hot and humid climates [29] Heat stress occurs when animals are exposed to environmental conditions that exceed their ability to regulate body temperature effectively [29,30]. When temperatures exceed 30 °C, small ruminants begin to feel stressed, and above 35 °C, their ability to cool down through evaporative mechanisms becomes less effective. Body temperature and respiration rate signal when animals are under stress [30]. In our study, rectal temperature and respiration rate were evaluated from day 1 to 56 (data not shown). Heat stress acts in goats’ homeostasis. Due to the prevalence of infectious diseases in goats under heat stress, there has been growing interest in immunity support as well as demand for immune-enhancing functional materials. Vitamin D3 administration in the diet of goats could have a role in the enhancement of cell-mediated and humoral immune responses, when goats are subjected to immune depression induced by heat stress. Thus, we sought to determine if OVA-immunized goats increased anti-OVA IgG responses between the two vitamin D3 dietary groups under heat stress.
When goats were fed the diet supplemented with vitamin D3 embedded within the soy protein isolate-stachyose emulsion gel for 56 days, a corresponding significant increase (P < 0.05) in anti-OVA IgG production was obtained. The humoral antibody response appears responsible for this activity. These studies show that specific IgG responses can be observed in cows and goats using OVA from chicken egg as previously indicated [17,27]. Our data indicates the role of vitamin D3 in the induction of IgG responses in healthy dairy goats under heat stress using OVA from chicken egg (Table 3). Particularly, the diet with vitamin D3 embedded within the emulsion gel (Diet 2) had significantly higher (P < 0.05) anti-OVA IgG concentrations after 14 days of feeding trial.
Additionally, the exposure of the intestinal lining to the beneficial bacteria (e.g., Bifidobacterium spp.) may be able to induce a local immunomodulation [31]. Intestinal flora antigens prime the immunological tissues of the host so that a degree of nonspecific resistance toward infection is produced. Any protective effect, however, can be overcome by the entry of large numbers of pathogens [32].
The hydration results presented in Table 1 show that the soy protein isolate per se is much less “hydrated” (nH = 0.00335 g of water/g of protein) than the soy protein isolate with added 0.3% stachyose (nH = 0.00405 g of water/g of protein) at pH/pD 6.5 (at 21 °C) in deuterated phosphate-buffered saline (PBS) in the presence of 0.4 M NaCl. Interestingly, the addition of stachyose at 0.3% increases the degree of hydration of the soy protein isolate irrespective of the pH/pD in deuterated PBS (pH/pD 2.4, pH/pD 7.6) and ionic strength 0.4 M (NaCl) resulting in almost the same degree of hydration at both pH’s/pD’s (Table 1). Such hydration properties are expected to influence considerably the release behavior of vitamin D3 embedded within the soy protein isolate-stachyose emulsion gel. The hydration experiments also show that the biopolymers stabilizing the emulsion gel (e.g., soy protein isolate, stachyose) tolerate low pH/pD and ionic strength comparable to GI conditions.
4. Conclusions
The results suggest that high blood serum levels of 25-(OH)-D3 may be achieved by incorporating cholecalciferol (vitamin D3) in an emulsion gel comprised of the biopolymers soy protein isolate and stachyose prior to oral ingestion. The low dose of vitamin D3 present in the deliverable form of soy protein isolate-stachyose emulsion gel had a beneficial effect on the humoral immune response in OVA-immunized dairy goats under heat stress. The apparent high degree of hydration observed in the soy protein isolate-stachyose gel matrix at low pH and the prebiotic nature of stachyose are important in facilitating vitamin D3 interaction and modulating the composition of the microbiota, increasing in particular bacterial strains from the genus Bifidobacterium, which are health-promoting bacteria. Extended period of studies in larger numbers of dairy goats under heat stress is needed to confirm these initial observations.
Author Contributions
Conceptualization, A.M.-G.; methodology, A.M.-G.; formal analysis, A.M.-G.; statistical analysis, Y.J.; investigation, A.M.-G.; data curation, A.M.-G.; writing—original draft preparation, A.M.-G.; writing—review and editing, A.M.-G., M.T.N.d.G., and R.A.; visualization, M.T.N.d.G.; supervision, A.M.-G.; project administration, A.M.-G.; funding acquisition, A.M.-G. All authors have read and agreed to the published version of the manuscript.
Funding
This research was funded by the U.S. Department of Agriculture’s National Institute of Food and Agriculture (NIFA) competitive grant (Grant No. 2023-67018-39181, Funding Program: Food Safety and Defense, A1332), and by Evans-Allen, the intramural research program.
Institutional Review Board Statement
The study was conducted in strict compliance with the current guidelines and legal requirements established in the United States for the proper use and care of animals and approved by the Institutional Animal Care and Use Committee of Prairie View A&M University (Protocol # 2023-051).
Informed Consent Statement
Not applicable.
Data Availability Statement
The data presented in this study are available on request from the corresponding author.
Conflicts of Interest
The authors declare no conflicts of interest
References
- Ismailova, A. , White, J.H. Vitamin D, infections and immunity. Rev. Endocr. Metab. Disord. 2022, 23, 265–277. [Google Scholar] [CrossRef]
- Hodnik, J.J.; Ježek, J.; Starič, J. A review of vitamin D and its importance to the health of dairy cattle. J. Dairy Res. 2020, 87, 84–87. [Google Scholar] [CrossRef]
- Xu, H.J.; Jiang, X.; Zhang, C.R.; Ma, G.M.; Wang, L.H.; Zhang, Q.Y.; Zhang, Y.G. Effects of dietary 25-hydroxyvitamin D3 on the lactation performance, blood metabolites, antioxidant and immune function in dairy cows. Livest. Sci. 2021, 248, 104497. [Google Scholar] [CrossRef]
- Carsetti, R.; Quinti, I. Editorial: IgA and mucosal immunity in vaccinology and in protection from infection. Front. Cell. Infect. Microbiol. 2024, 14, 1409111. [Google Scholar] [CrossRef]
- Katsafadou, A.I.; Politis, A.P.; Mavrogianni, V.S.; Barbagianni, M.S.; Vasileiou, N.G.C.; Fthenakis, G.C.; Fragkou, I.A. Mammary defences and immunity against mastitis in sheep. Animals 2019, 9, 726. [Google Scholar] [CrossRef]
- Mora-Gutierrez, A.; Núñez de González, M.T.; Woldesenbet, S.; Attaie, R.; Jung, Y. Influence of deliverable form of dietary vitamin D3 on the immune response in late-lactating dairy goats. Dairy 2024, 5, 308–315. [Google Scholar] [CrossRef]
- Bhatia, J.; Greer, F. Use of soy protein-based formulas in infant feeding. Pediatrics 2008, 121, 1062–1068. [Google Scholar] [CrossRef]
- Xiao, C.W. ; Health effects of soy protein and isoflavones in humans. J. Nutr. 2008, 138, 12445–12495. [Google Scholar] [CrossRef] [PubMed]
- Ren, D.; Ding, M.; Su, J.; Ye, J.; He, X.; Zhang, Y.; Shang, X. Stachyose in combination with L. rhamnosus GG ameliorates acute hypobaric hypoxia-induced intestinal barrier dysfunction through alleviating inflammatory response and oxidative stress. Free Radic. Bio. Med. 2024, 212, 505–519. [Google Scholar] [CrossRef]
- Bodera, P. Influence of Prebiotics on the Human Immune System (GALT). Recent Pat. Inflamm. Allergy Drug Discov. 2008, 2, 149–153. [Google Scholar] [CrossRef] [PubMed]
- Cheong, K-L. ; Chen, S.; Teng, B.; Veeraperumal, S.; Zhong, S.; Tan, K. Oligosaccharides as potential regulators of gut microbiota and intestinal health in post-COVID-19 management. Pharmaceuticals 2023, 16, 860. [Google Scholar] [CrossRef]
- Kailasapathy, K; Chin, J. Survival and therapeutic potential of probiotic organisms with reference to Lactobacillus acidophilus and Bifidobacterium spp. Immunol. Cell Biol. 2000, 78, 80–88.
- Li, B.; Luan, H.; Qin, J.; Zong, A.; Liu, L.; Xu, Z.; Du, F.; Xu, T. Effect of soluble dietary fiber on soy protein isolate emulsion gel properties, stability and delivery of vitamin D3. Int. J. Biol. Macromol. 2024, 262, 129806. [Google Scholar] [CrossRef]
- Athanassiou, P.; Mavragani, C.; Athanassiou, L.; Kostoglou-Athanassiou, I.; Koutsilieris, M. Vitamin D deficiency in primary Sjögren’s Syndrome: Association with clinical manifestations and immune activation markers. Mediterr. J. Rheumatol. 2022, 33, 106–108. [Google Scholar] [CrossRef] [PubMed]
- Yoo, S.; Jung, S-C. ; Kwak, K.; Kim, J-S. The Role of prebiotics in modulating gut microbiota: Implications for human health. Int. J. Mol. Sci. 2024, 25, 4834. [Google Scholar] [CrossRef] [PubMed]
- Gunn, K.M.; Holly, M.A.; Veith, T.L.; Buda, A.R.; Prasafd, R.; Rotz, C.A.; Soder, K.J.; Stoner, A.M.K. Projected heat stress challenges and abatement opportunities for U.S. milk production. PLoS One 2019, 14, e0214665. [Google Scholar] [CrossRef] [PubMed]
- Caroprese, M.; Marzano, A.; Marino, R.; Gliatta, G.; Muscio, A.; Sevi, A. Immune response of cows fed polyunsaturated fatty acids under high ambient temperatures. J. Dairy Sci. 2009, 92, 2796–2803. [Google Scholar] [CrossRef]
- Sun, Y.; Liu, J.; Ye, G.; Harnid, M.; Lia, S.; Huang, K. Protective effects of zymosan on heat stress-induced immunosuppression and apoptosis in dairy cows and peripheral blood mononuclear cells. Cell Stress Chaperones 2018, 23, 1069–1078. [Google Scholar] [CrossRef]
- Zmrhal, V.; Svodarova, A.; Venusova, E.; Slama, P. The influence of heat stress on chicken immune system and mitigation of negative impacts by baicalin and baicalein. Animals, 2023, 13, 2564. [Google Scholar] [CrossRef]
- Gupta, S.; Sharma, A.; Joy, A.; Dunshea, F.R.; Chauhan, S.S. Animals 2022, 13, 107. https://doi.org. /10.3390/ani13010107.
- Mora-Gutierrez, A.; Farrell, H.M.; Kumosinski, T.F. Comparison of hydration behavior of bovine and caprine caseins as determined by oxygen-17 nuclear magnetic resonance: pH/pD dependence. J. Agric. Food Chem. 1996, 44, 796–803. [Google Scholar] [CrossRef]
- Covington, A. K.; Paabo, M.; Robinson, R.A.; Bates, R.G. Use of the glass electrode in deuterium oxide and the relation between the standardized pD (pa0) scale and the operational pH in heavy water. Anal. Chem. 1968, 40, 700–706. [Google Scholar] [CrossRef]
- Asare-Addo, K.; Conway, B.R.; Larhrib, H.; Levina, M.; Rajabi-Siahboomi, A.R.; Tetteh, J. Boateng, J.; Nokhodchi, A. The effect of pH and ionic strength of dissolution media on in-vitro release of two model drugs of different solubilities from HPMC matrices. Colloids Surf. B: Biointerfaces 2013, 111, 384–391. [Google Scholar] [CrossRef] [PubMed]
- Mora-Gutierrez, A.; Baianu, I.C. 1H NMR relaxation and viscosity measurements in solutions and suspensions of carbohydrates and starch from corn: The investigation of carbohydrate hydration and stereochemical and aggregation effects in relation to 17O and 13C NMR data for carbohydrate solutions. J. Agric. Food Chem. 1989, 37, 1459–1465. [Google Scholar] [CrossRef]
- Temova, Ž.; Roškar, R. Stability-indicating HPLC-UV method for vitamin D3 determination in solutions, nutritional supplements and pharmaceuticals. J. Chromatogr. Sci. 2016, 54, 1180–6. [Google Scholar] [CrossRef] [PubMed]
- Kiely, M.E.; Zhang, J.Y.; Kinsella, M.; Khashan, A.S.; Kenny, L.C. Vitamin D status is associated with uteroplacental dysfunction indicated by pre-eclampsia and small-for-gestational-age birth in a large prospective pregnancy cohort in Ireland with low vitamin D status. Am. J. Clin. Nutr. 2016, 104, 354–361. [Google Scholar] [CrossRef] [PubMed]
- Caroprese, M.; Ciliberti, M.G.; Santillo, A.; Marino, R.; Sevi, A.; Albenzio, M. Immune response, productivity and quality of milk from grazing goats as affected by dietary polyunsaturated fatty acid supplementation. Res. Vet. Sci. 2016, 105, 229–235. [Google Scholar] [CrossRef]
- Mora-Gutierrez, A.; Kumosinski, T.F.; Farrell, Jr., H. M. ḱ-carrageenan interaction with bovine and caprine caseins as shown by sedimentation and NMR spectroscopy techniques. J. Agric. Food Chem. 1998, 46, 4987–4996. [Google Scholar] [CrossRef]
- Joy, A.; Dunshea, F.R.; Leury, Clarke, I. J.; DiGiacomo, K.; Chauhan, S.S.; Resilience of small ruminants to climate change and increased environmental temperature: A review. Animals 2020, 10, 867. [Google Scholar] [CrossRef]
- Ruiz-Gonzậlez, A.; Suissi, W.; Baumgard, L.H.; Martel-Kennes, Chouinard, P. Y.; Gervais, R.; Rico, D.E. Increased dietary vitamin D3 and calcium partially alleviate heat stress symptoms and inflammation in lactating Holstein cows independent of dietary concentrations of vitamin A and selenium. J. Dairy Sci. 2023, 106, 3984–4001. [Google Scholar] [CrossRef]
- El-Abbadi, N.H.; Dao, M.C.; Meydani, S.N. Yogurt: role in healthy and active aging. Am. J. Clin. Nutr. 2014, 99, 1263S–1270S. [Google Scholar] [CrossRef]
- Baȕmler, A. J.; Sperandio, V. Interactions between the microbiota and pathogenic bacteria in the gut. Nature 2016, 535, 85–93. [Google Scholar] [CrossRef] [PubMed]
Figure 1.
Correlation of the longitudinal relaxation rate (R1) of the water protons with increasing stachyose concentrations measured at 300 MHz, 20 °C, and pH/pD 6.5 in D2O. The straight line represents the least square line of the best fit.
Figure 1.
Correlation of the longitudinal relaxation rate (R1) of the water protons with increasing stachyose concentrations measured at 300 MHz, 20 °C, and pH/pD 6.5 in D2O. The straight line represents the least square line of the best fit.
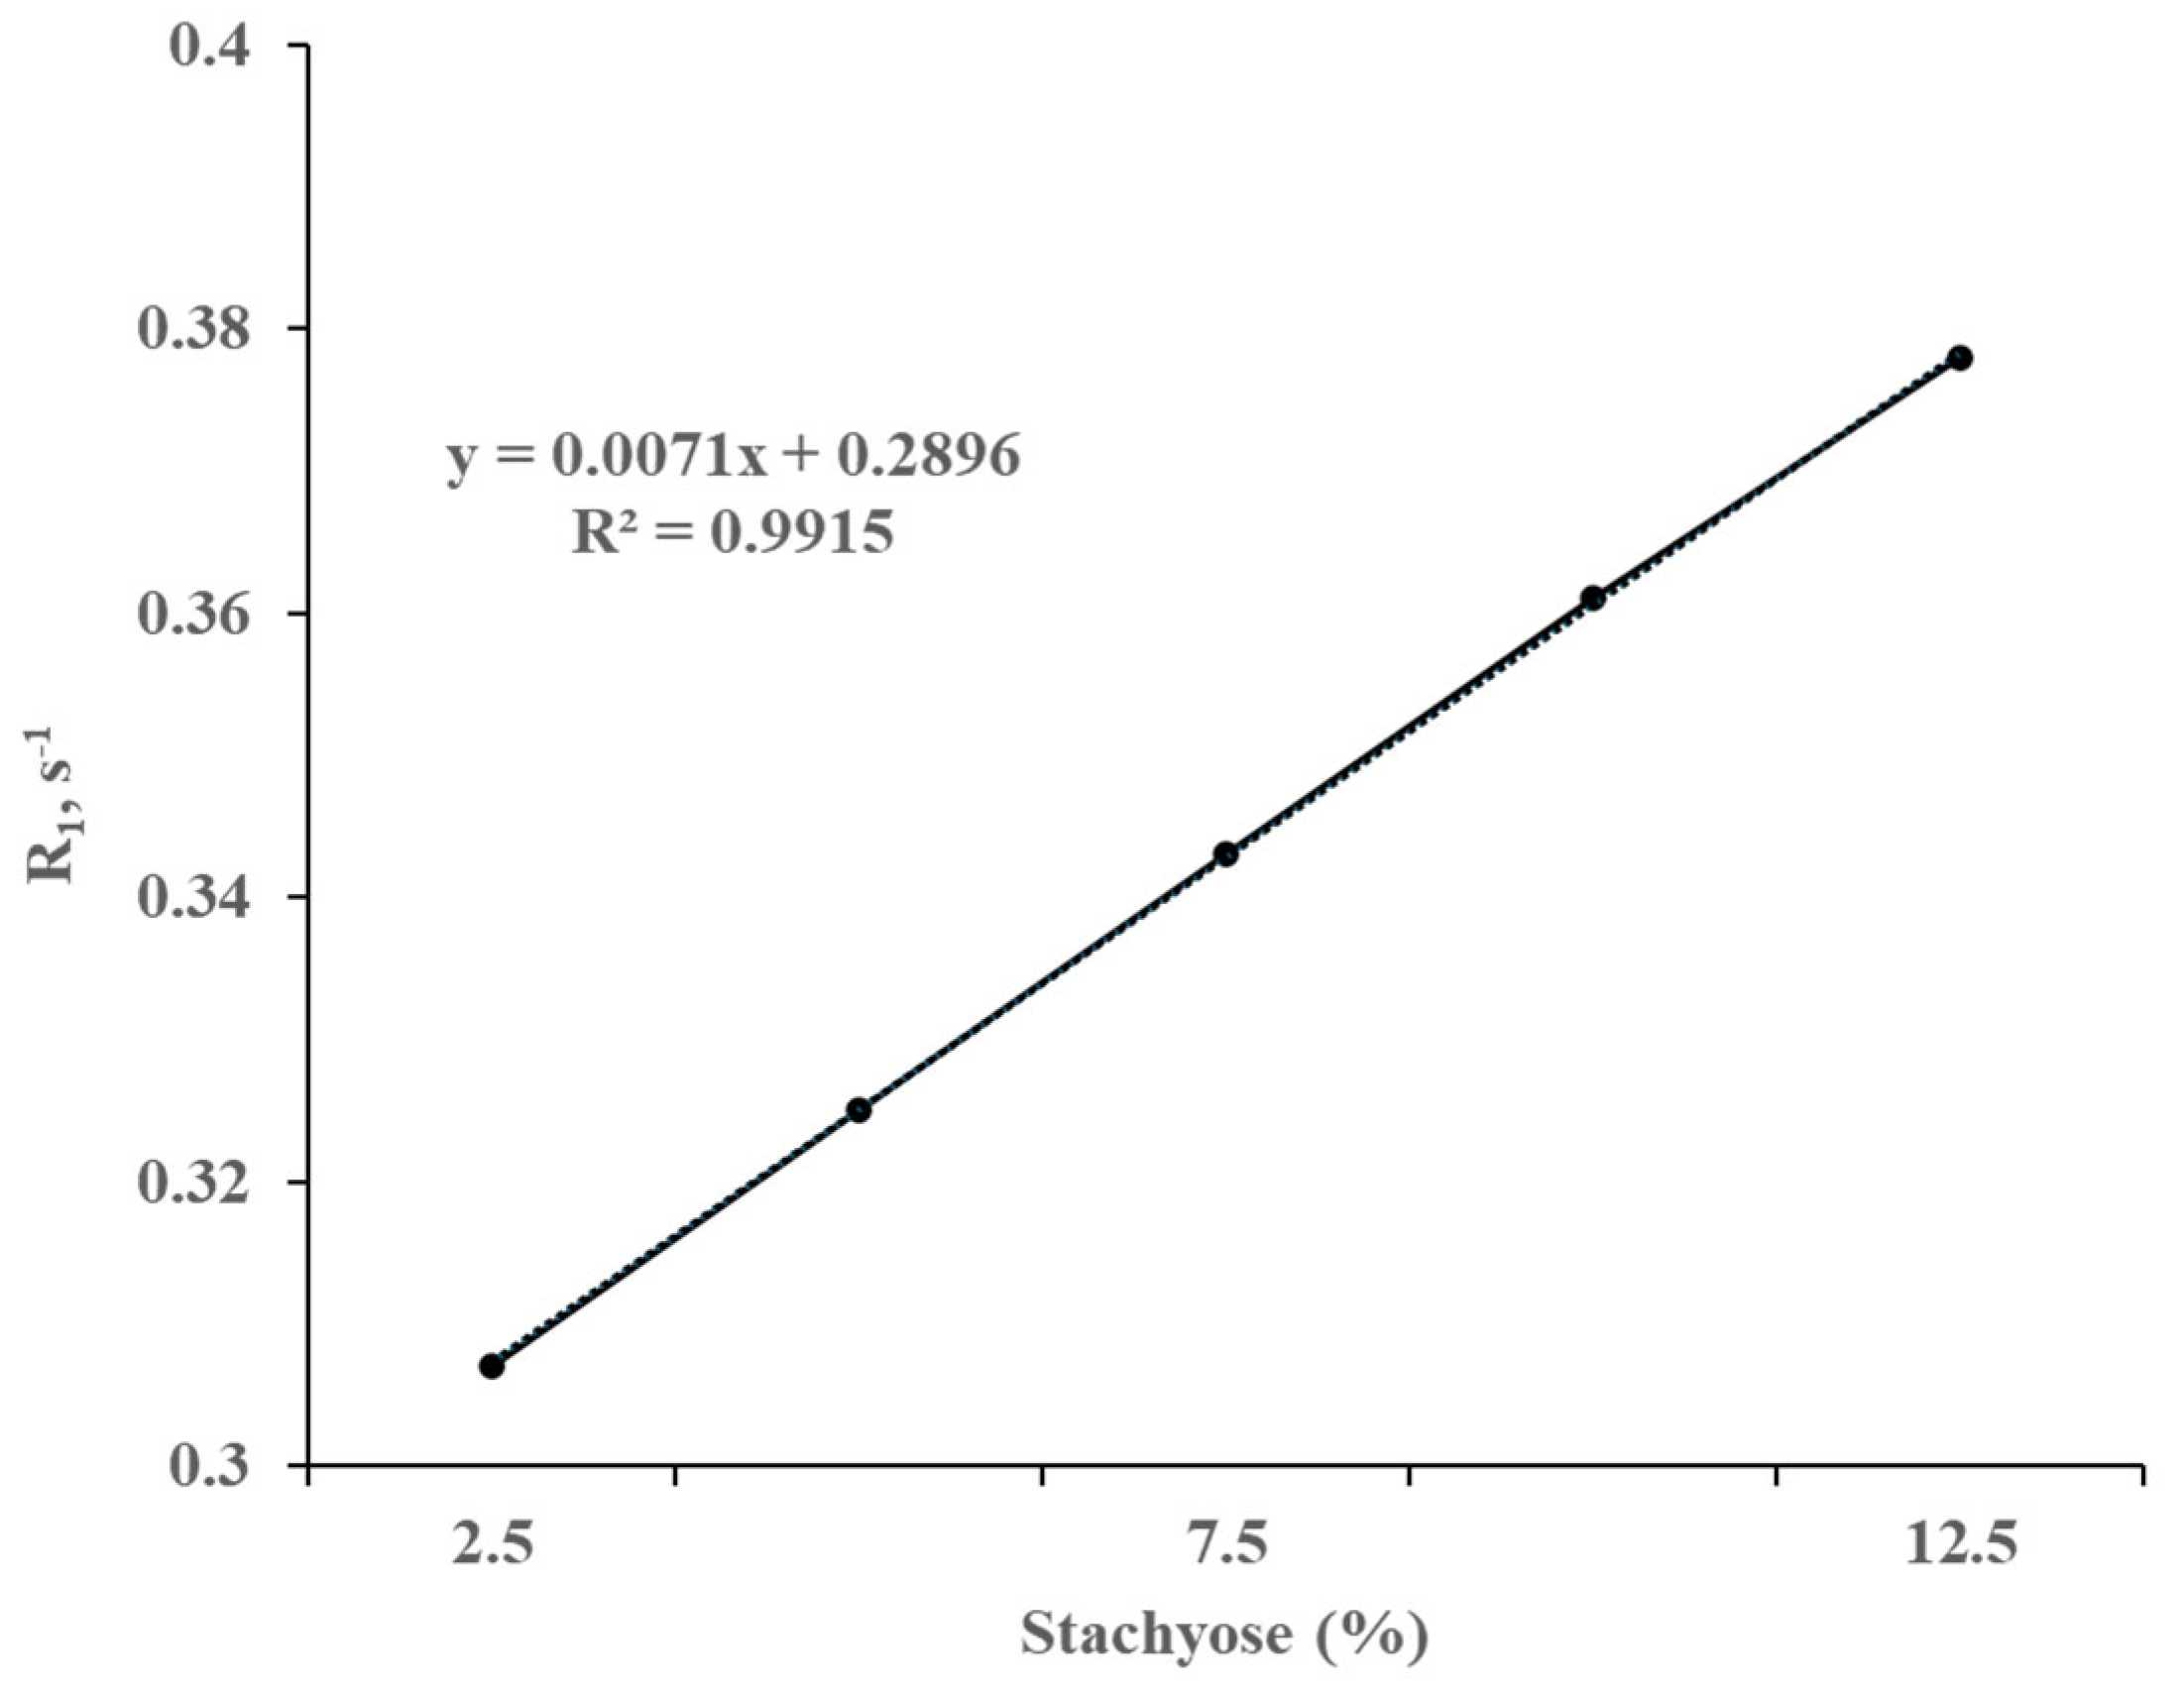
Figure 2.
Correlation of the transverse relaxation rate (R2) of the water protons with increasing stachyose concentrations measured at 300 MHz, 20 °C, and pH/pD 6.5 in D2O. The straight line represents the least square line of the best fit.
Figure 2.
Correlation of the transverse relaxation rate (R2) of the water protons with increasing stachyose concentrations measured at 300 MHz, 20 °C, and pH/pD 6.5 in D2O. The straight line represents the least square line of the best fit.
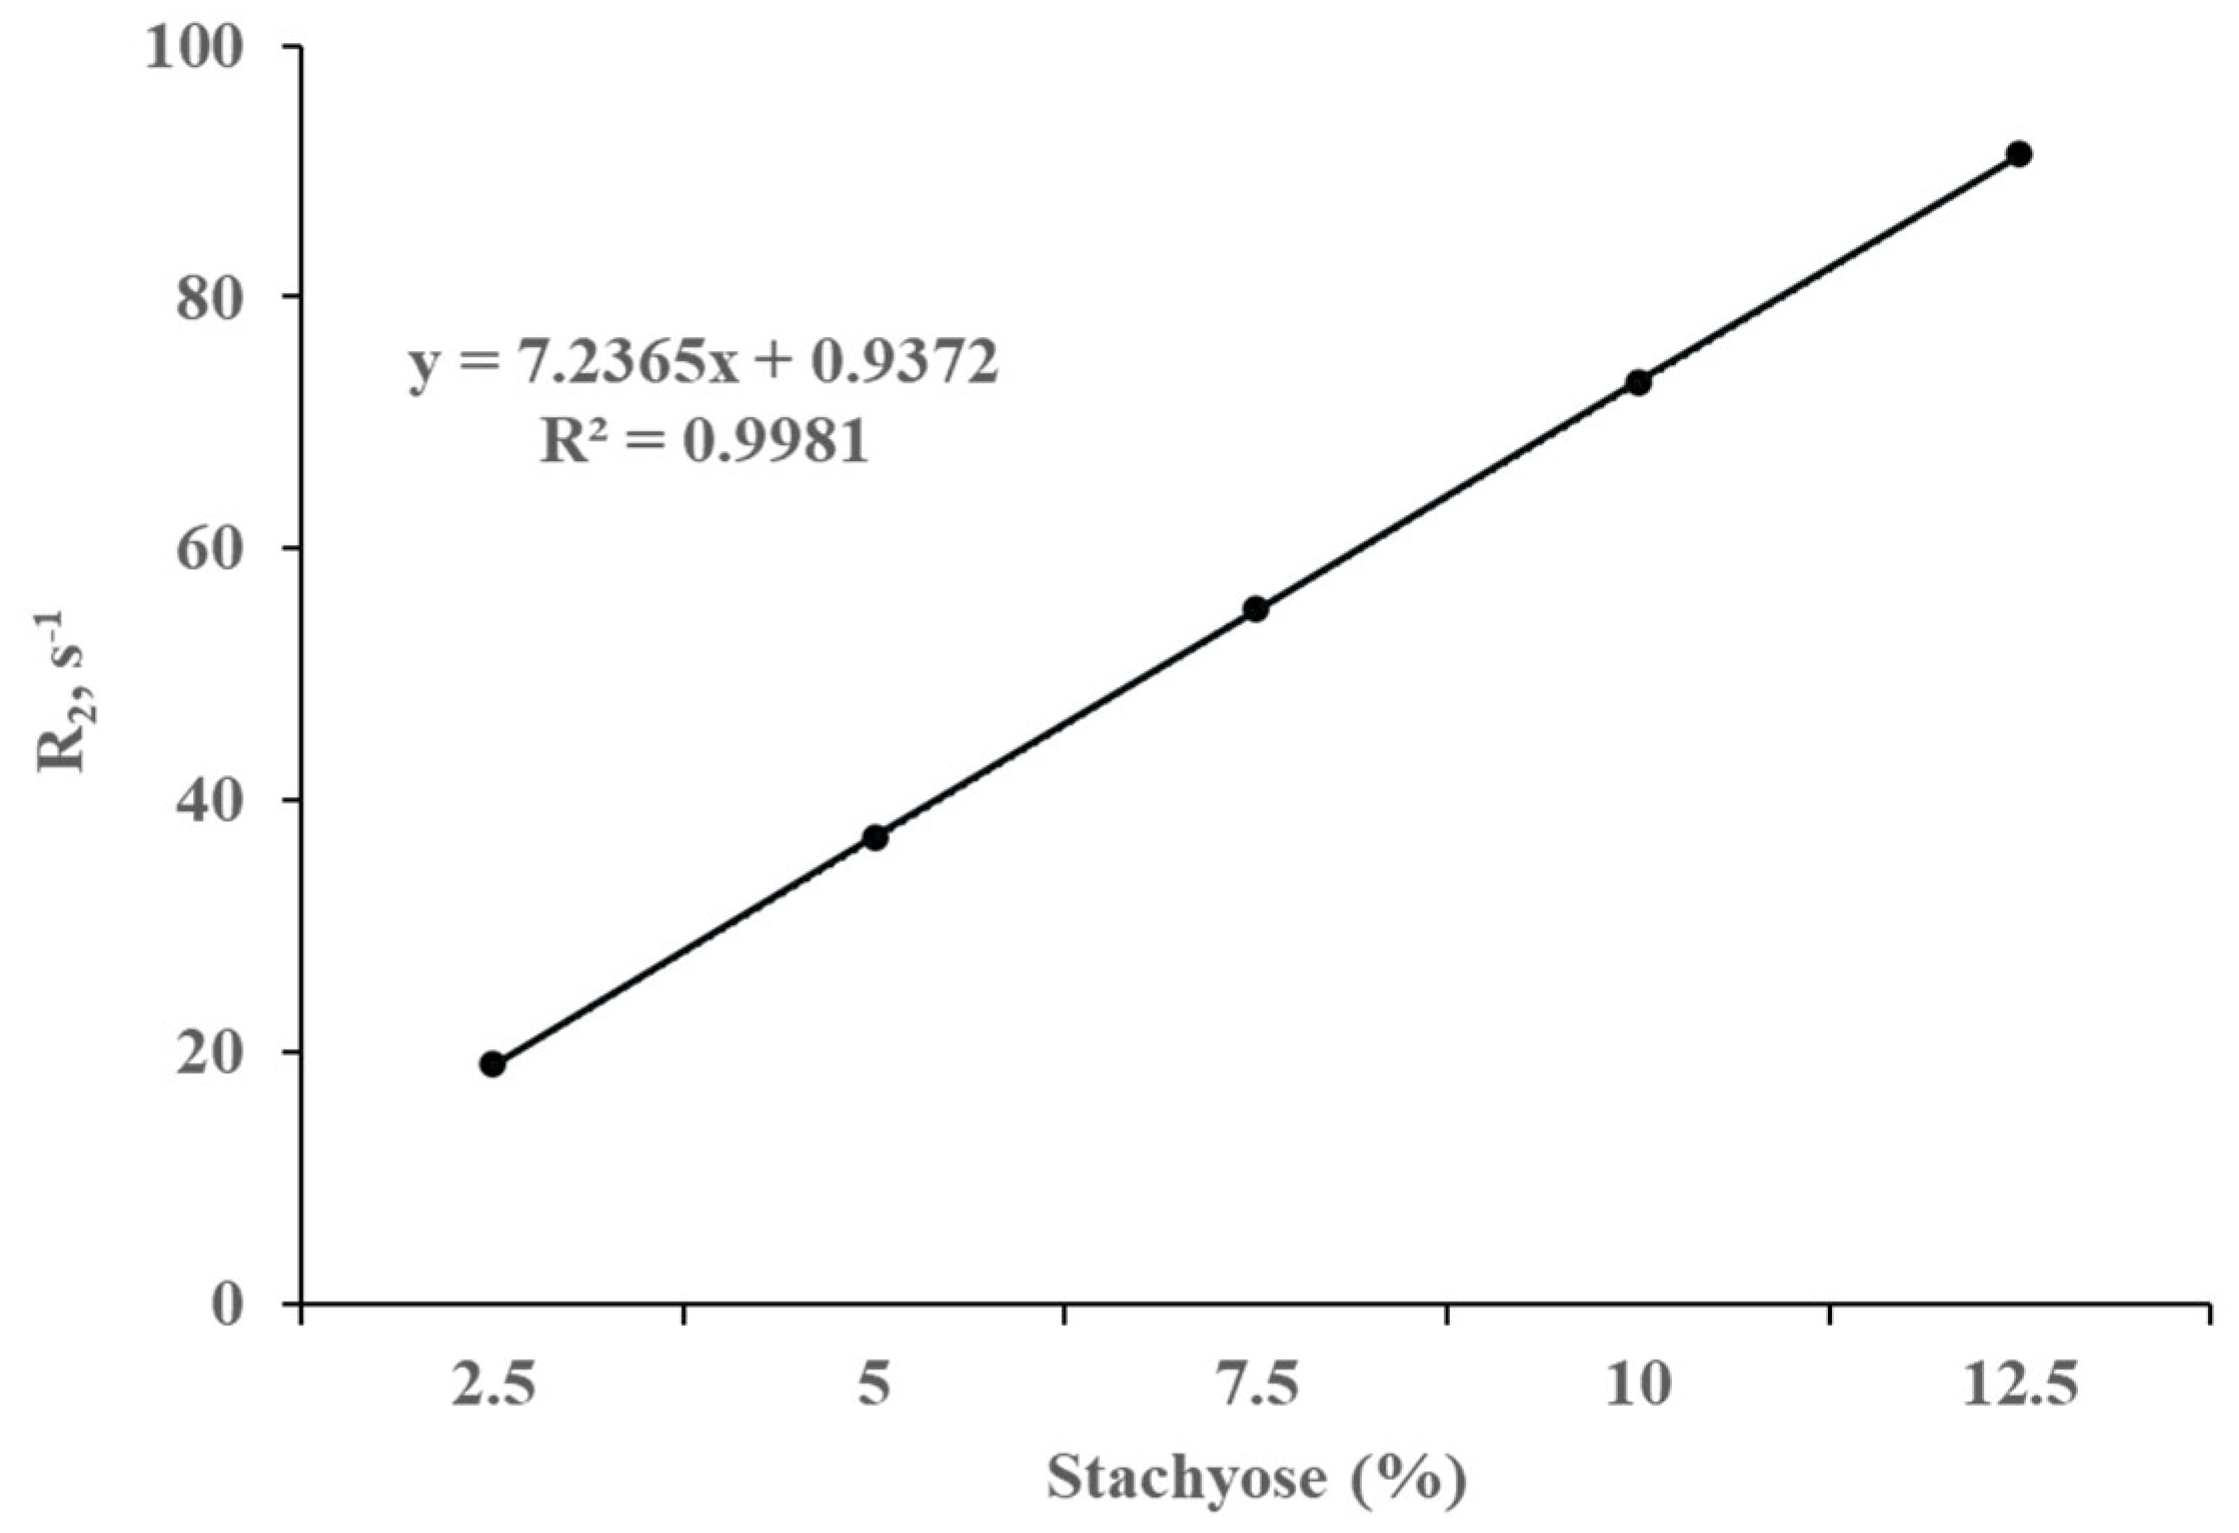
Figure 3.
The upfield region of the 1H NMR spectra (400 MHz) of the soy protein isolate -stachyose gelled emulsion at concentrations of 2.5% w/w and 0.3% w/w, respectively, in D2O at 37 °C. A) pH/pD at 2.4 and B) pH/pD at 7.6. Each spectrum is the result of 500 scans; the applied exponential broadening is 0.5 Hz. Other experimental details are given in section 2.
Disclaimer/Publisher’s Note: The statements, opinions and data contained in all publications are solely those of the individual author(s) and contributor(s) and not of MDPI and/or the editor(s). MDPI and/or the editor(s) disclaim responsibility for any injury to people or property resulting from any ideas, methods, instructions or products referred to in the content. |
© 2025 by the authors. Licensee MDPI, Basel, Switzerland. This article is an open access article distributed under the terms and conditions of the Creative Commons Attribution (CC BY) license (http://creativecommons.org/licenses/by/4.0/).
Copyright: This open access article is published under a Creative Commons CC BY 4.0 license, which permit the free download, distribution, and reuse, provided that the author and preprint are cited in any reuse.


