
Submitted:
21 July 2025
Posted:
22 July 2025
You are already at the latest version
Abstract
Mesenchymal stem cells (MSCs)-based therapy has received considerable research atten-tion for its anti-inflammatory properties in depressive-like behavior, but poor MSC sur-vival and immunogenicity after transplantation limit their therapeutic effectiveness. This study evaluated pretreated bone marrow-derived MSCs (BM-MSCs) with lactobacillus plantarum supernatant (L.PS) in an animal model of chronic restraint stress (CRS)-induced depressive-like behavior. BM-MSCs were pretreated with 15 μM of fluoxetine or 10 10 µl/ml of L.PS for 24 hours. Thirty-six adults male Wistar rats were divided into six groups: CTRL, CRS, CRS+PBS, CRS+MSCs, CRS+Flx/MSCs, and CRS+L.PS/MSCs groups. The open field test (OPT), Morris water maze (MWM), forced swimming test (FST), body weight, and blood glucose levels were measured. After sacri-fice, the hippocampal tissues underwent histopathological analysis. Additionally, hip-pocampal mRNA levels of NF-κB and pro-inflammatory cytokines (IL-1β, IL-6, IL-18, and TNF-α) were measured using real-time PCR, while ELISA measured protein levels of these cytokines and serum corticosterone. A bioinformatic analysis, including pro-tein-protein interaction (PPI) network, enrichment, and correlation analysis related to depression was performed. Pre-treatment of MSCs with L.PS significantly improved de-pressive-like behavior (p < 0.05) by enhancing MSCs neuroprotection via downregulating NF-κB and pro-inflammatory cytokines. An in-silico analysis also highlighted the im-portance of evaluating and targeting this pathway. In conclusion, we found that L.PS pretreated MSCs significantly improve CRS-induced depressive-like behavior, which can be partly attributed to the inhibition of NLRP3-mediated neuroinflammation.
Keywords:
stress
; depression
; Lactobacillus plantarum
; inflammation
; inflammasomes
; cytokines
1. Introduction
Depression is a common psychiatric disorder that affects millions of people worldwide. Symptoms of depression include persistent feelings of sadness, hopelessness, and anhedonia [1]. There are many therapeutic options, including antidepressants, psychotherapy, Electroconvulsive Therapy (ECT), deep brain stimulation (DBS), Vagus Nerve Stimulation (VNS), and esketamine therapy. However, many patients are still unresponsive to these treatments or experience negative side effects [2,3]. The overall number of cases of depression continued to increase from 1990 to 2023 (by about 62.79%) [4]. The stable or slightly higher prevalence concerning major service quality improvements in medical care suggests a low effectiveness in treatment or a rise in prevalence at the population level, which has been called the “treatment-prevalence paradox” (TPP) [5]. This may imply that the future of therapies for improving efficacy includes certain forms of alternative and combined therapies. Mesenchymal stem cells (MSCs) represent a form of adult stem cell that can easily be obtained and have the potential to differentiate into multiple cell types, including bone, cartilage, adipocytes, and neuron-like cells [6,7]. MSCs are emerging as a potential candidate for depression due to their anti-inflammatory and immunomodulatory properties [8]. It has been demonstrated that intracerebroventricularly delivered MSCs alleviated the symptoms of treatment-resistant depression in animal models [9]. It was also found that intrahippocampal injection of MSCs significantly improved depressive-like behavior in rats [10]. While the exact role of MSCs in depression is not fully understood, studies have unveiled multiple functions such as promoting neurogenesis [9,11], modulation of glutamatergic neurotransmission, neurotrophic factor secretion [12], and anti-inflammatory effects [13]. Researchers propose inflammation as a new pathway for the development and progression of depression [14,15]. One particular area of interest is the NLRP3 inflammasome, an intracellular complex protein essential in regulating inflammatory signaling [16]. The NLRP3 inflammasome has a two-step activation process (priming and protein complex formation). First, priming (Signal 1) involves Pattern recognition receptor signaling, such as tumor necrosis factor (TNF) signaling. Second, protein complex formation (Signal 2) consists of transcriptional activation of pro-IL-1β and pro-IL-18 through the stimulation of NF-κB (nuclear factor kappa light chain enhancer of activated B cells) [17]. Our previous studies highlighted the pivotal role of the NLRP3 inflammasome pathway in the pathogenesis and progression of various conditions, including spinal cord injury, COVID-19, and depressive-like behavior [18–20]. Several recent studies have revealed that stress activates the NLRP3 inflammasome and enhances susceptibility to depression. For example, serum levels of IL-1β and TNF-α were positively related to the severity of Major depressive disorder (MDD) [21]. Another study found that stress may lead to depressive-like behavior in mice, which is potentially attributable to elevated serum and hippocampal IL-1β levels upon NLRP3 inflammasome activation [22]. Several recent studies have revealed that MSCs have anti-inflammatory effects by targeting the NLRP3 inflammasome pathway to decrease depressive-like behavior [23]. However, the effectiveness of MSCs is limited by their low survival rate and poor integration into target tissues [24]. Consequently, understanding how MSCs can be employed therapeutically to treat depression is critical. According to recent studies, pretreating MSCs with probiotics can improve their survival rate and alter their immunomodulating characteristics, potentially increasing their therapeutic potential [25,26]. Prior research has also suggested that probiotics can be effective in alleviating symptoms of depression. A study found that participants who took a probiotic supplement containing Bifidobacterium lactis W52, Bifidobacterium bifidum W23, Lactobacillus brevis W63, Lactobacillus acidophilus W37, Lactobacillus casei W56, Lactococcus lactis (W19 and W58), and Lactobacillus salivarius W24 experienced significant improvements in their mood [27]. Another study discovered that taking a probiotic supplement comprising Bifidobacterium longum and Lactobacillus helveticus for eight weeks significantly reduced depressive symptoms [28]. Other studies found that Lactobacillus plantarum effectively reduced symptoms of depression in mice [29,30].
While these studies suggest that probiotics may be effective in managing depression, further research is warranted to fully understand how they work. In this sense, a combination of ex vivo, in vivo and in silico studies were conducted to examine how MSCs pretreated with Lactobacillus plantarum Supernatant (L.PS) could affect depressive-like behavior. Additionally, it may explore the impact of preconditioned MSCs on the inflammasome-related cytokines and inflammatory response associated with depression.
2. Materials and Methods
2.1. Animals and Experimental Grouping
Adult male Wistar rats (n = 36; 250–280 g; seven to eight weeks old) were obtained from Royan Institute, Tehran, Iran. Rats were housed in groups (n=6) in standard cages and allowed to acclimate for 7 days before the experiments. The rats were maintained on a 12 h:12 h cycle (lights on 07:00 to 19:00) in a temperature-controlled room at 23±2 °C with unrestricted access to food and water ad libitum, except during restraint stress sessions. Four male rats were housed in each cage, and the cage bedding was routinely changed every 3 days. Rats were randomly divided into six groups as follows: CTRL (unstressed), CRS (6 h/day, for 28 days), CRS+PBS (6 h/day, for 28 days, received i.c.v injection of 10 µl PBS), CRS+MSCs (6 h/day, for 28 days, received i.c.v injection of 1 × 10⁵ BM-MSCs in 10 µl PBS), CRS + Flx/MSCs (6 h/day, for 28 days, received i.c.v injection of 1 × 10⁵ fluoxetine pretreated BM-MSCs in 10 µl PBS), CRS+L.PS/MSCs (6 h/day, for 28 days, received i.c.v injection of 1 × 10⁵ L.PS pretreated BM-MSCs in 10 µl PBS). Rats received 1 injection every two weeks for 4 consecutive weeks, and interventions were injected into the left-brain ventricle. At the end of experimental procedures and behavioral tests, animals were deeply anesthetized with a combination of ketamine (90 mg/kg) and xylazine (10 mg/kg) by decapitation for brain dissection, and a blood sample was immediately collected from the animals' hearts. The Institutional Animal Care and Use Committee of Tehran University of Medical Sciences approved all procedures involving laboratory animals (Approval ID: IR.TUMS.AEC.1401.214). All attempts were taken to minimize the consumption and pain of the animals in the study (Figure 1).
2.2. Isolation and Expansion of BM-MSCs
Bone marrow was collected from the femur and tibia of euthanized male Wistar rats (n = 6, 220-250 g, Royan Institute, Tehran, Iran) using a high dose of ketamine by flushing with high Glucose Dulbecco’s modified Eagle medium (DMEM) (Biosera,France) supplemented with 10% fetal bovine serum (FBS) (Biosera,France). Total cells were isolated using gradient centrifugation (1500 rpm, 10 min) and cultured in Alpha-minimal essential medium (α-MEM) (Biosera,France) containing 15% FBS (Biosera) and 100 units/mL penicillin-streptomycin (BioIdea Co., Iran). After four days, the culture medium was discarded and replaced with pre-warmed fresh medium once a week. To subculture and expand the cells, a sufficient amount of 1X trypsin-EDTA solution was added to each culture flask after washing the adherent cells with warmed phosphate-buffered saline (PBS). The flasks were incubated in a Co2 incubator at 37 °C for 2-3 minutes. Expanded BM-MSCs were harvested at the third passage to determine the positive expression of CD44 and CD90 and the negative expression of CD34 and CD45 markers.
2.3. BM-MSCs Characterization
Flow cytometry was performed to characterize rat BM-MSCs. The cultured cells were harvested, washed, and suspended in PBS supplemented with 0.1% bovine serum albumin (BSA) (Sigma-Aldrich, Germany). 10 × 106 cells were stained with appropriate concentrations of fluorescein isothiocyanate (FITC)-or phycoerythrin (PE)-conjugated monoclonal antibodies (both from BioLegend, USA) against CD44 and CD90 (positive markers) and CD34 and CD45 (negative markers), incubated for 30-45 min at room temperature. In addition, matched isotype antibodies and Fluorescence minus one (FMO) were used as controls for accurate cell population gating. The cells were washed in PBS containing 0.1% (BSA) (Sigma-Aldrich), and counted using FACScalibur flow cytometry (BD Biosciences, USA). Data were analyzed using FlowJo V 10 software (FlowJo, LLC).
2.4. Chronic Restraint Stress (CRS) Induced Depressive-like Behavior
We used the exposure to CRS (6 h/day, for 28 days) to induce depressive-like behavior in rats. The validity of CRS as a model of depression in rats has been demonstrated previously [31]. Animals were placed in well-ventilated Plexiglas tubes for 28 consecutive days and exposed to CRS for 6 hours per day (from 09:00 to 15:00). After receiving restraint stress, they were returned to their home cages.
2.5. Assessment of Cytotoxic Effects of Fluoxetine and L.PS on the BM-MSCs
Fluoxetine was purchased from Jalinous Pharmaceutical Co., Tehran, Iran, and dissolved in sterilized PBS, with pH 7.2 for cell treatments. In addition, Lactobacillus plantarum bacterium (purchased from the National Center of Genetic and Biological Resources of Iran) was cultured under anaerobic conditions in MRS broth medium at 37 °C. To prepare the cell-free supernatant, cultured bacterial cells were centrifuged at 5,000 g for 15 minutes, and the supernatant was dried using a speed vacuum and stored at -20 °C until used.
The colorimetric MTT (3-(4, 5-dimethylthiazol-2-yl) - 2, 5-diphenyltetrazolium bromide) assay was performed to determine the cytotoxic effects of different concentrations of fluoxetine and Lactobacillus plantarum supernatant (L.PS) on the viability of rat BM-MSCs. Briefly, 5 × 10⁴ BM-MSCs were seeded in each well of 96-well tissue culture plates. The plates were incubated under standard incubation conditions until the cells reached an appropriate confluency. Then, adherent cells were exposed to different concentrations of fluoxetine (1, 2, 5, 10, 15, and 20 μM) and various volumes (0.5, 1, 2.5, 5, 10, 15, 20, and 30 µl) of L.PS for 24 and 48 hours. The culture media was replaced with a standard volume of MTT reagent (5 mg/ml) (Sigma Aldrich), and the plates were incubated for 4 hours at 37°C. The emerged purple formazan crystals were dissolved with 100 µl of dimethyl sulfoxide (DMSO, Merck, Germany). The optical density (OD) of each well was measured at a wavelength of 540 nm and a reference wavelength of 630 nm using a microplate reader. BM-MSCs without Fluoxetine or L.PS served as a negative control. Triplicate wells were used for each sample. The MTT test was also performed on cells treated with the same concentrations of MRS broth (bacteria-free) to eliminate interference from the components of bacterial culture media. The number of cells was also determined using a standard curve. The data obtained from each sample were normalized with those in the negative control, where the cell viability in the control sample was considered 100%.
2.6. Intracerebroventricular Injection of BM-MSCs
Adult male rats were implanted with a stainless-steel cannula. The cannula (0.4 mm diameter) was placed at P—0.8 mm, L—1.5 mm, D—3 mm and was drilled into the skull using a mini-drill (RWD Life Science). After recovery, rats were injected with BM-MSCs (1 × 10⁵ BM-MSCs per rat in 10 µl PBS (Thermo Fisher Scientific)) or vehicle (10 µl PBS) through the cannula with a Hamilton syringe (0.17 diameter) at a rate of 1 μl/min. Rats were treated with intracerebroventricular injections fortnightly for 4 weeks.
2.7. Behavioral Tests
Behavioral testing was conducted during the light phase, between 09:00 and 15:00, and a blind experimenter monitored all recordings.
2.7.1. Body Weight and Blood Glucose Monitoring
The body weight of each rat was measured weekly at 9 a.m. during the experiment. Weight gain was calculated using the following equation:
At the end of the experiment, blood samples were collected from the tip of the tail, and fasting blood glucose levels were determined by a digital glucometer (Glucocard-01, Arkray, Japan).
2.7.2. Open Field Test
The open field test was conducted to assess anxiety-like behavior. Briefly, it consisted of a plastic box measuring 40*40*30 cm (width*length*height). The rats were placed near the midpoint of the open field apparatus for 10 min, and the locomotion frequency, time in the central arena, Immobility time, and frequencies of rearing, grooming, and licking/cleaning were measured. The apparatus was cleaned with 5% ethanol to remove olfactory cues.
2.7.3. Morris Water Maze Test
Studies show that stress-induced depressive-like behavior impairs learning and memory in rats [32]. To evaluate this cognitive dysfunction, we used the Morris water maze (MWM) [33–36]. It consisted of a black open circular pool, 150 cm in diameter and 40 cm high, filled with 23 ± 2 °C water. During training trials, an escape platform with a diameter of 10 cm was placed 1 cm below the water surface. The pool was divided into four quadrants, with the platform being placed in the center of the fourth quadrant. Learning trials to test the rats' ability to navigate the maze were conducted over 2 days. During training, each rat was placed into the water and expected to find the hidden platform within 60 seconds. When a rat failed to recognize it within 60 seconds, it was guided gently onto the platform and made to stay on it for 15 seconds. Each animal underwent four training sessions per day, with each session originating from a different quadrant. Successive training sessions were conducted at 20-minute intervals to ensure consistency and adequate rest periods between trials. On day 3, the platform was removed, and each rat was put into the water on the side opposite the original platform quadrant for a free 60-second probe. The escape latency, defined as the time taken for the rat to find the platform, was recorded by a tracking system.
2.7.4. Forced Swimming Test
The forced swimming test (FST) was performed to gauge despair-like behavior as described previously [37]. Rats were individually subjected to forced swimming in glass cylinders (height: 40 cm; diameter: 28 cm; water depth: 30 cm; water temperature: 25 ± 1 °C). The animals were kept in the cylinders for 6 min, and the Immobility latency, Immobility time, swimming time, and Climbing time were recorded in the last 5 min.
2.8. Serum and Sample Collection
After all behavioral tests, rats were anesthetized with a combination of ketamine (90 mg/kg) and xylazine (10 mg/kg), followed by thoracic cavity dissection. Then the blood was taken from the heart with a syringe, and 1 hour later, the whole blood was centrifuged (3000 g, 10 min), the upper serum collected and stored at −80 °C. Half of the rats in each group were sacrificed by decapitation. The hippocampi were removed onto an ice tray and flash-frozen in liquid nitrogen immediately. Hippocampi were stored in a refrigerator at -80°C before being used for molecular analysis. In the remaining half of the rats in each group, tissues were obtained, post-fixed, and embedded in paraffin.
2.9. ELISA
Serum corticosterone level was tested using enzyme-linked immunosorbent assay (ELISA) kits (ZellBio, Germany). Hippocampal IL-1β, IL-6, IL-18, and TNF-α concentrations were also measured using ELISA kits (Karmania Pars Gene, Iran). The hippocampus tissue was weighed and homogenized with ice-cold PBS. The homogenates were centrifuged for 10 minutes (5000 rpm, 4 ◦C). Cytokine levels were measured in duplicate using 100 microliters of supernatant.
2.10. Real-Time PCR
Real-time PCR was performed to assess the mRNA levels of IL-1β, IL-6, IL-18, TNF-α, and NF-κB. Initially, the hippocampi were dissected and homogenized to extract total RNA. The extracted RNA was then converted into cDNA using reverse transcriptase (1 μg of RNA). Subsequently, specific primers were used for real-time PCR with GAPDH as a reference control. All steps were carried out following the instructions provided in the kit from Gene All in South Korea. The PCR cycles consisted of 10 minutes at 94 °C, followed by 30 seconds at 94 °C, 40 seconds at 58 °C, and 40 seconds at 72 °C for 35 cycles. Real-time PCR was conducted for 40 cycles. The primers used were commercially synthesized and are listed in Table 1.
2.11. Nissl Staining
The Nissl staining method was used to assess histological changes and neuronal loss in the hippocampus. Brain tissues were sliced into 7 μm-thick sections, with three sections prepared per animal. This was done using a sliding rotary microtome after fixation in a 4% formaldehyde solution. Samples were rehydrated and stained with 0.1% cresyl violet solution. The sections were examined under a light microscope equipped with a digital camera (Labomed, USA) for image capture. The number of pyknotic neurons in a 0.1 mm2 area of the central section of different hippocampal regions (at 400× magnification) was counted using the ImageJ program.
2.12. In Silico Study
2.12.1. Construction of PPI Network
To investigate the protein-protein interaction (PPI) network relevant to MDD pathogenesis, we initially selected a core set of inflammatory markers based on their established roles in the literature: NF-κB, IL-1β, IL-6, IL-18, and TNF-α [38,39]. These proteins were chosen due to their well-documented involvement in inflammatory pathways associated with MDD. The selected proteins were used as input for the STRING database (version 12.0) to construct an initial PPI network. To enhance the network's comprehensiveness, we expanded it to include additional interacting proteins, with a focus on incorporating the NLRP3 inflammasome, which emerged as a relevant node based on its interactions within the network. The STRING analysis was performed with a medium confidence threshold (score ≥ 0.4) to ensure reliable interactions. The resulting PPI network was imported into Cytoscape (Version: 3.10.2) for visualization and further analysis. To evaluate the topological properties of the network, we utilized the CytoNCA plugin to calculate key centrality measures, including degree, closeness, and betweenness centrality. These metrics were used to identify the most influential nodes within the network. Based on these analyses, a refined list of 11 genes, including NLRP3, was selected for further investigation due to their high centrality scores, indicating their potential significance in MDD-related inflammatory pathways.
2.12.2. GO and KEGG Enrichment Analysis
To investigate the functional roles of intersected gene targets, we utilized ShinyGO 0.82 (http://bioinformatics.sdstate.edu/go/), a robust web-based platform for gene enrichment analysis. This tool enabled the identification of enriched Kyoto Encyclopedia of Genes and Genomes (KEGG) pathways and Gene Ontology (GO) terms, encompassing molecular function (MF), cellular component (CC), and biological process (BP) categories. The analysis was configured with a false discovery rate (FDR) cutoff of 0.05 to ensure statistical rigor, displaying up to 20 pathways with a size range of 2 to 5,000 genes.
2.12.3. Correlations Between Inflammatory Biomarkers and Major MDD-Associated Genes
To explore the intricate relationships between inflammatory biomarkers and key genes associated with Major Depressive Disorder (MDD), we employed the Gene Expression Profiling Interactive Analysis (GEPIA) tool (http://gepia.cancer-pku.cn/detail.php) [40]. This study focused on evaluating the expression levels of a panel of inflammatory genes, including IL1A, IL1B, IL6, TNF, IL18, IL1R1, CASP1, IL33, IL1RN, NFKB1, and NLRP3, in relation to two pivotal MDD-related genes: SLC6A4 (Serotonin Transporter Gene) and FKBP5 (FK506 Binding Protein 5 Gene). Using the GTEx Brain-Hippocampus dataset, we computed Pearson’s correlation coefficients to quantitatively assess the associations between the expression profiles of these inflammatory biomarkers and the selected MDD genes. This analysis provides valuable insights into potential functional interactions and shared molecular pathways that may contribute to MDD pathogenesis. The results elucidate how inflammatory processes and genetic predispositions may converge to influence the neurobiological underpinnings of depression, paving the way for further mechanistic studies.
2.12.4. Expression of Inflammatory Genes in MDD
To elucidate the role of inflammation-related molecular mechanisms in MDD, we conducted a comprehensive analysis of gene expression profiles sourced from the Gene Expression Omnibus (GEO) repository. Specifically, we utilized the publicly accessible dataset GSE76826, which encompasses transcriptomic data from elderly individuals (aged ≥50 years) diagnosed with melancholic MDD per DSM-IV diagnostic criteria. This dataset comprises samples from 12 healthy controls (HC) and 10 MDD patients, including both outpatients and inpatients [41]. We curated a panel of inflammation-related genes, including IL1A, IL1B, IL6, TNF, IL18, IL1R1, CASP1, IL33, IL1RN, NFKB1, and NLRP3, selected for their established contributions to MDD pathophysiology. Data retrieval was facilitated through the 'GEOquery' package in R, while differential expression analysis was performed using the 'Limma' package. Genes with an adjusted p-value < 0.05 were deemed significantly differentially expressed. To enhance the interpretability of statistical significance, p-values were converted to a negative logarithmic scale (-log10 p-value). For visual representation, a volcano plot was generated using the 'ggplot2' package, plotting log2 fold change (log2FC) on the x-axis against -log10(p-value) on the y-axis to delineate genes with significant expression differences. Additionally, a heatmap was constructed to illustrate the expression profiles of the selected inflammation-associated genes across MDD and HC groups. To further compare gene expression levels between the two cohorts, boxplots were generated for key genes, providing a clear visualization of group-specific expression patterns.
2.13. Statistical Analysis
Statistical analysis was conducted using SPSS version 25.0 (IBM Corporation, NY, USA), with the Shapiro-Wilk test used to assess normality. Data from time-course experiments were analyzed using repeated-measures analysis of variance (ANOVA). One-way ANOVA was used for comparisons across groups with one factor, followed by post hoc pairwise Tukey's tests. GraphPad version 8.0 was used to draw statistical graphs, and data were reported as mean ± standard error. P-value≤ 0.05 was considered statistically significant.
3. Results
3.1. Cytotoxic Effects of Fluoxetine and L.PS on BM-MSCs
MTT assay revealed that treatment of BM-MSCs with Fluoxetine (1-15 µM) and L.PS (0.5-10 µl/ml) for 24 hours substantially increased the percentage of cell viability in a dose-dependent manner compared to control groups (Figure 2). In continuation, 5×10⁵ of BM-MSCs were treated with 15 µM of Fluoxetine or 10 µl/ml of L.PS for 24 hours and injected into the left-brain ventricle in the experimental groups. The control groups received an equal volume of PBS or nothing.
3.2. Physiological Parameters
3.2.1. Effect of Various Treatments on Corticosterone Level
As displayed in Figure 3 (A), the serum corticosterone level significantly increased (p < 0.05) in the CRS group compared with the control group. However, the administration of treatments significantly decreased (p < 0.05) the corticosterone level compared to the CRS group. Interestingly, pre-treatment of MSCs with L.PS was more effective in normalizing corticosterone levels than other treatment groups.
3.2.2. Serum Glucose Changes
The mean glucose levels were as follows: control rats, 94.3±3.9 mg/dL; CRS, 62.6±2.7 mg/dL; CRS+PBS, 73.5±3.08 mg/dL; CRS+MSCs, 94.8±3.5 mg/dL; CRS+Flux pretreated MSCs, 95±4.7 5 mg/dL; and CRS+L.PS pretreated MSCs, 97.5±3.07 mg/dL. Treatment of rats significantly increased blood glucose levels compared to control group (P < 0.05), and with no significant difference among treatment groups (Figure 3 (B)).
3.2.3. Body Weight Gain
Weekly body weight measurements were taken across all groups. There were no significant differences between the groups during the first three weeks. However, at weeks three and four, body weight in all groups except for CRS+L.PS pretreated MSCs group significantly decreased compared to the control group (P < 0.05). In week 4, CRS+L.PS pretreated MSCs group showed a significant increase in body weight compared to the CRS (P < 0.05) Figure 3 (C). Total body weight gain was obtained using the formula as mentioned earlier. Comparisons showed that all groups except for CRS+L.PS pretreated MSCs group, exhibited a decrease in total body weight gain compared to the control group (P < 0.05) Figure 3 (D)).
3.4. Effects of Different Treatments on Behavioral Tests
The CRS group showed reduced Immobility Latency, Swimming Time, and prolonged immobility time in FST (p < 0.05; Figure 4), and reduced total time in center, rearing, grooming, prolonged latency time in OFT (p < 0.05; Table 2) in comparison with the rats in the control group. Our MWM results showed that escape latency (time required to reach the platform) decreased in all groups during the training phase. Over 2 days, the mean escape latency for the treatment groups was significantly shorter than CRS group (p < 0.05; Figure 5 (A)). In addition, animals in the pretreated MSCs groups spent substantially more time in the target quadrant compared to animals in the CRS group (p < 0.05; Figure 5 (B)).
3.5. Effect of Various Treatments on NF-κB and Pro-Inflammatory Cytokine Gene Expression in Hippocampal Tissues
The mRNA levels of NF-κB and Pro-inflammatory cytokine genes, including IL-1β, IL-6, IL-18, and TNF-α in hippocampal tissues were analyzed using real-time PCR. There was a significant up-regulation of NF-κB and Pro-inflammatory cytokine gene expression in the CRS group, which was markedly reversed by various treatments. Our results showed that administration of pre-treated MSCs with L.PS supernatant was more effective than other treatment groups (p < 0.05; Figure 6).
3.6. Effect of Various Treatments on Pro-Inflammatory Cytokine Levels in Hippocampal Tissues
The hippocampal levels of Pro-inflammatory cytokines, including IL-1β, IL-6, IL-18, and TNF-α, were analyzed using ELISA. Figure 7 demonstrates that Pro-inflammatory cytokine levels were significantly increased in the hippocampal tissues of stressed rats compared with control group, while various treatments reversed cytokine levels, except for IL-6 in the CRS+MSCs group. Pre-treated MSCs with L.PS supernatant administration was more effective compared to other treatment groups (p < 0.05; Figure 7).
3.7. Histological Analysis
Dead cells were analyzed by Cresyl violet staining. Figure 8 indicates that in the CRS and CRS+PBS groups, the number of dead cells in the three areas of CA1 (A), CA2 (B), and CA3 (C) of the hippocampus increased significantly (p<0.01). Compared with the CRS and CRS+PBS groups, treatment groups showed a significant reduction in dead cells in DG and CA3 (p<0.01). The highest injury and decrease in dead cells were related to the DG of the hippocampus (Figure 10). Cresyl violet staining in the three areas of CA1, CA2, and CA3 of the hippocampus sections revealed severe damage after 28 days of CRS. All hippocampal areas exhibited nuclear pyknosis, shrunken neurons and disorganization of the pyramidal cell layer, mostly in CA2 and CA3. The hippocampal tissue of rats treated with L.PS showed fewer neurons with altered morphology and pyramidal organized cell layers compared with other groups (Figure 8 (D)).
3.8. In Silico
3.8.1. PPI Network Analysis
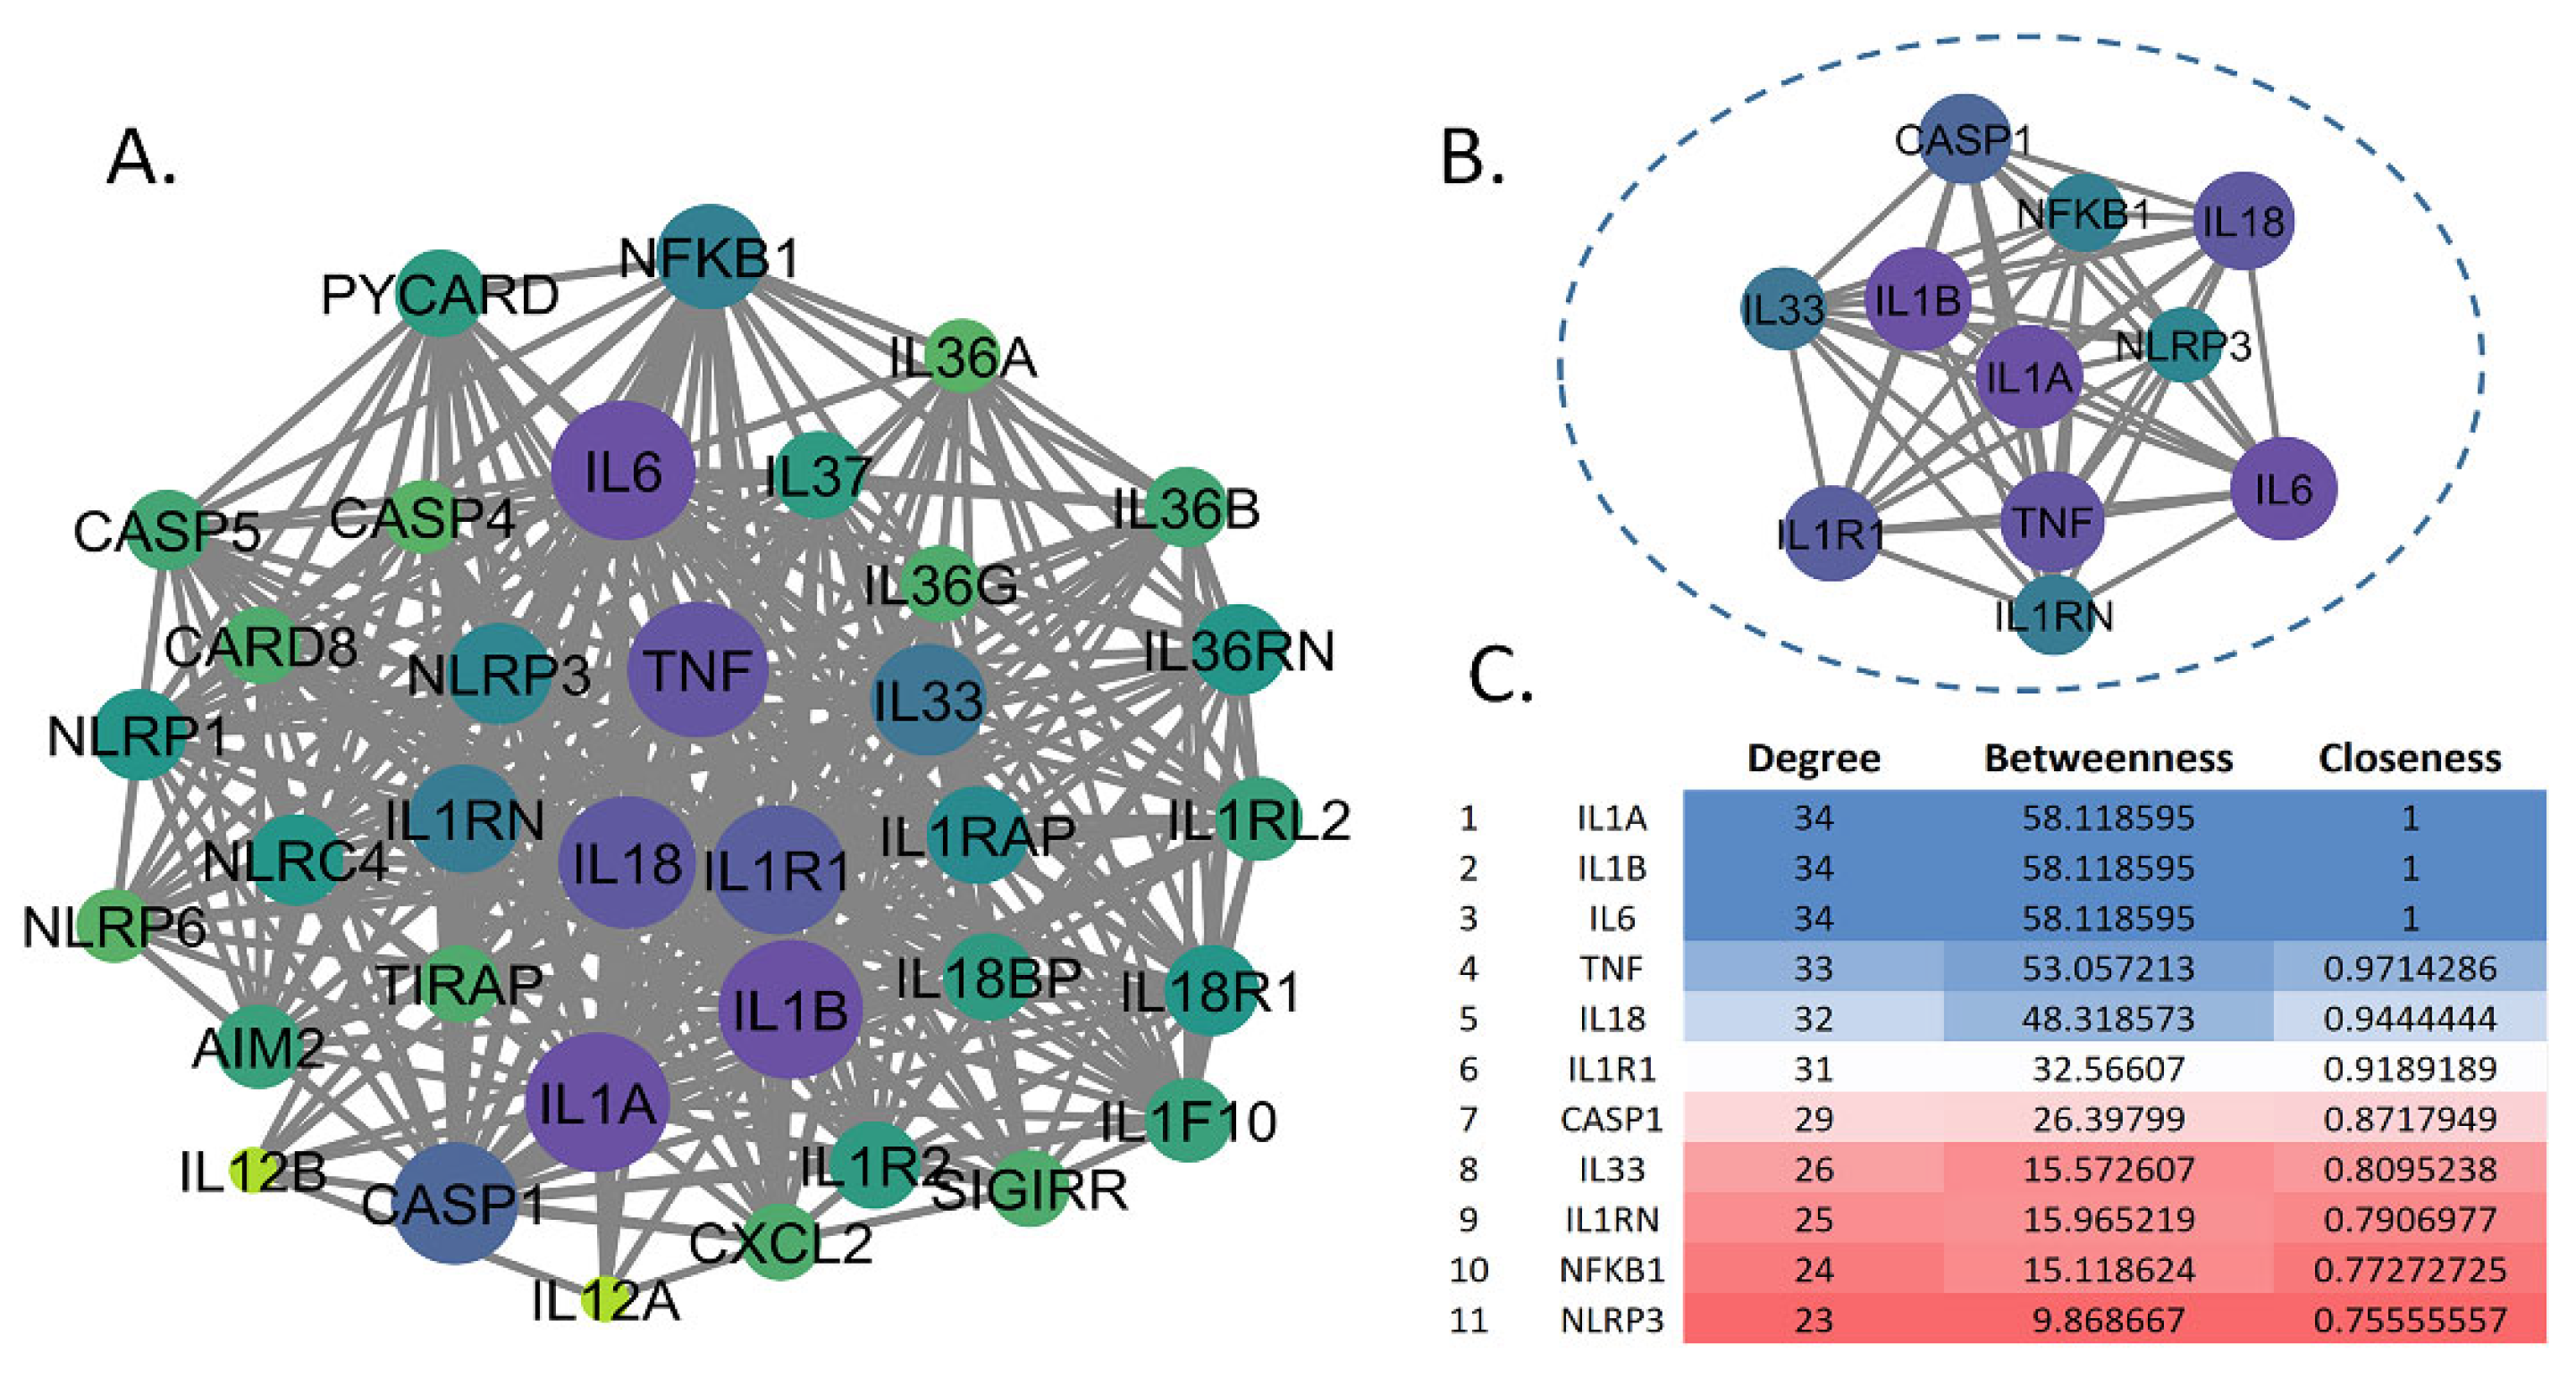
The construction of the PPI network revealed a complex interplay of inflammation-related proteins pertinent to MDD pathogenesis. Initiating with a core set of inflammatory markers—NF-κB, IL-1β, IL-6, IL-18, and TNF-α—the network was expanded using the STRING database. This expansion incorporated the NLRP3 inflammasome as a critical node, resulting in a network with 37 nodes and 136 edges, as visualized in Cytoscape (Version 3.10.2). Topological analysis via the CytoNCA plugin identified 11 highly central genes—IL1A, IL1B, IL6, TNF, IL18, IL1R1, CASP1, IL33, IL1RN, NFKB1, and NLRP3—based on degree centrality. These genes exhibited degree values ranging from 34 (IL1A and IL1B) to 23 (NLRP3), with IL1A and IL1B also displaying the highest betweenness (58.118595) and closeness [1] centrality, underscoring their pivotal roles as network hubs.
Figure 9.
Protein-Protein Interaction (PPI) Network of Inflammation-Related Genes in MDD. (A) Comprehensive PPI network in Cytoscape, illustrating the broad connectivity of inflammatory-related proteins. (B) Subnetwork highlighting the 11 top-ranked genes, IL1A, IL1B, IL6, TNF, IL18, IL1R1, CASP1, IL33, IL1RN, NFKB1, and NLRP3, selected based on degree centrality, enclosed within a dashed oval. (C) Table of centrality metrics (degree, betweenness, and closeness) for the top 11 genes, ranked by degree, with a color gradient from blue (highest degree) to red (lowest among the top 11), emphasizing the centrality of IL1A and IL1B.
3.8.2. KEGG and GO Analysis
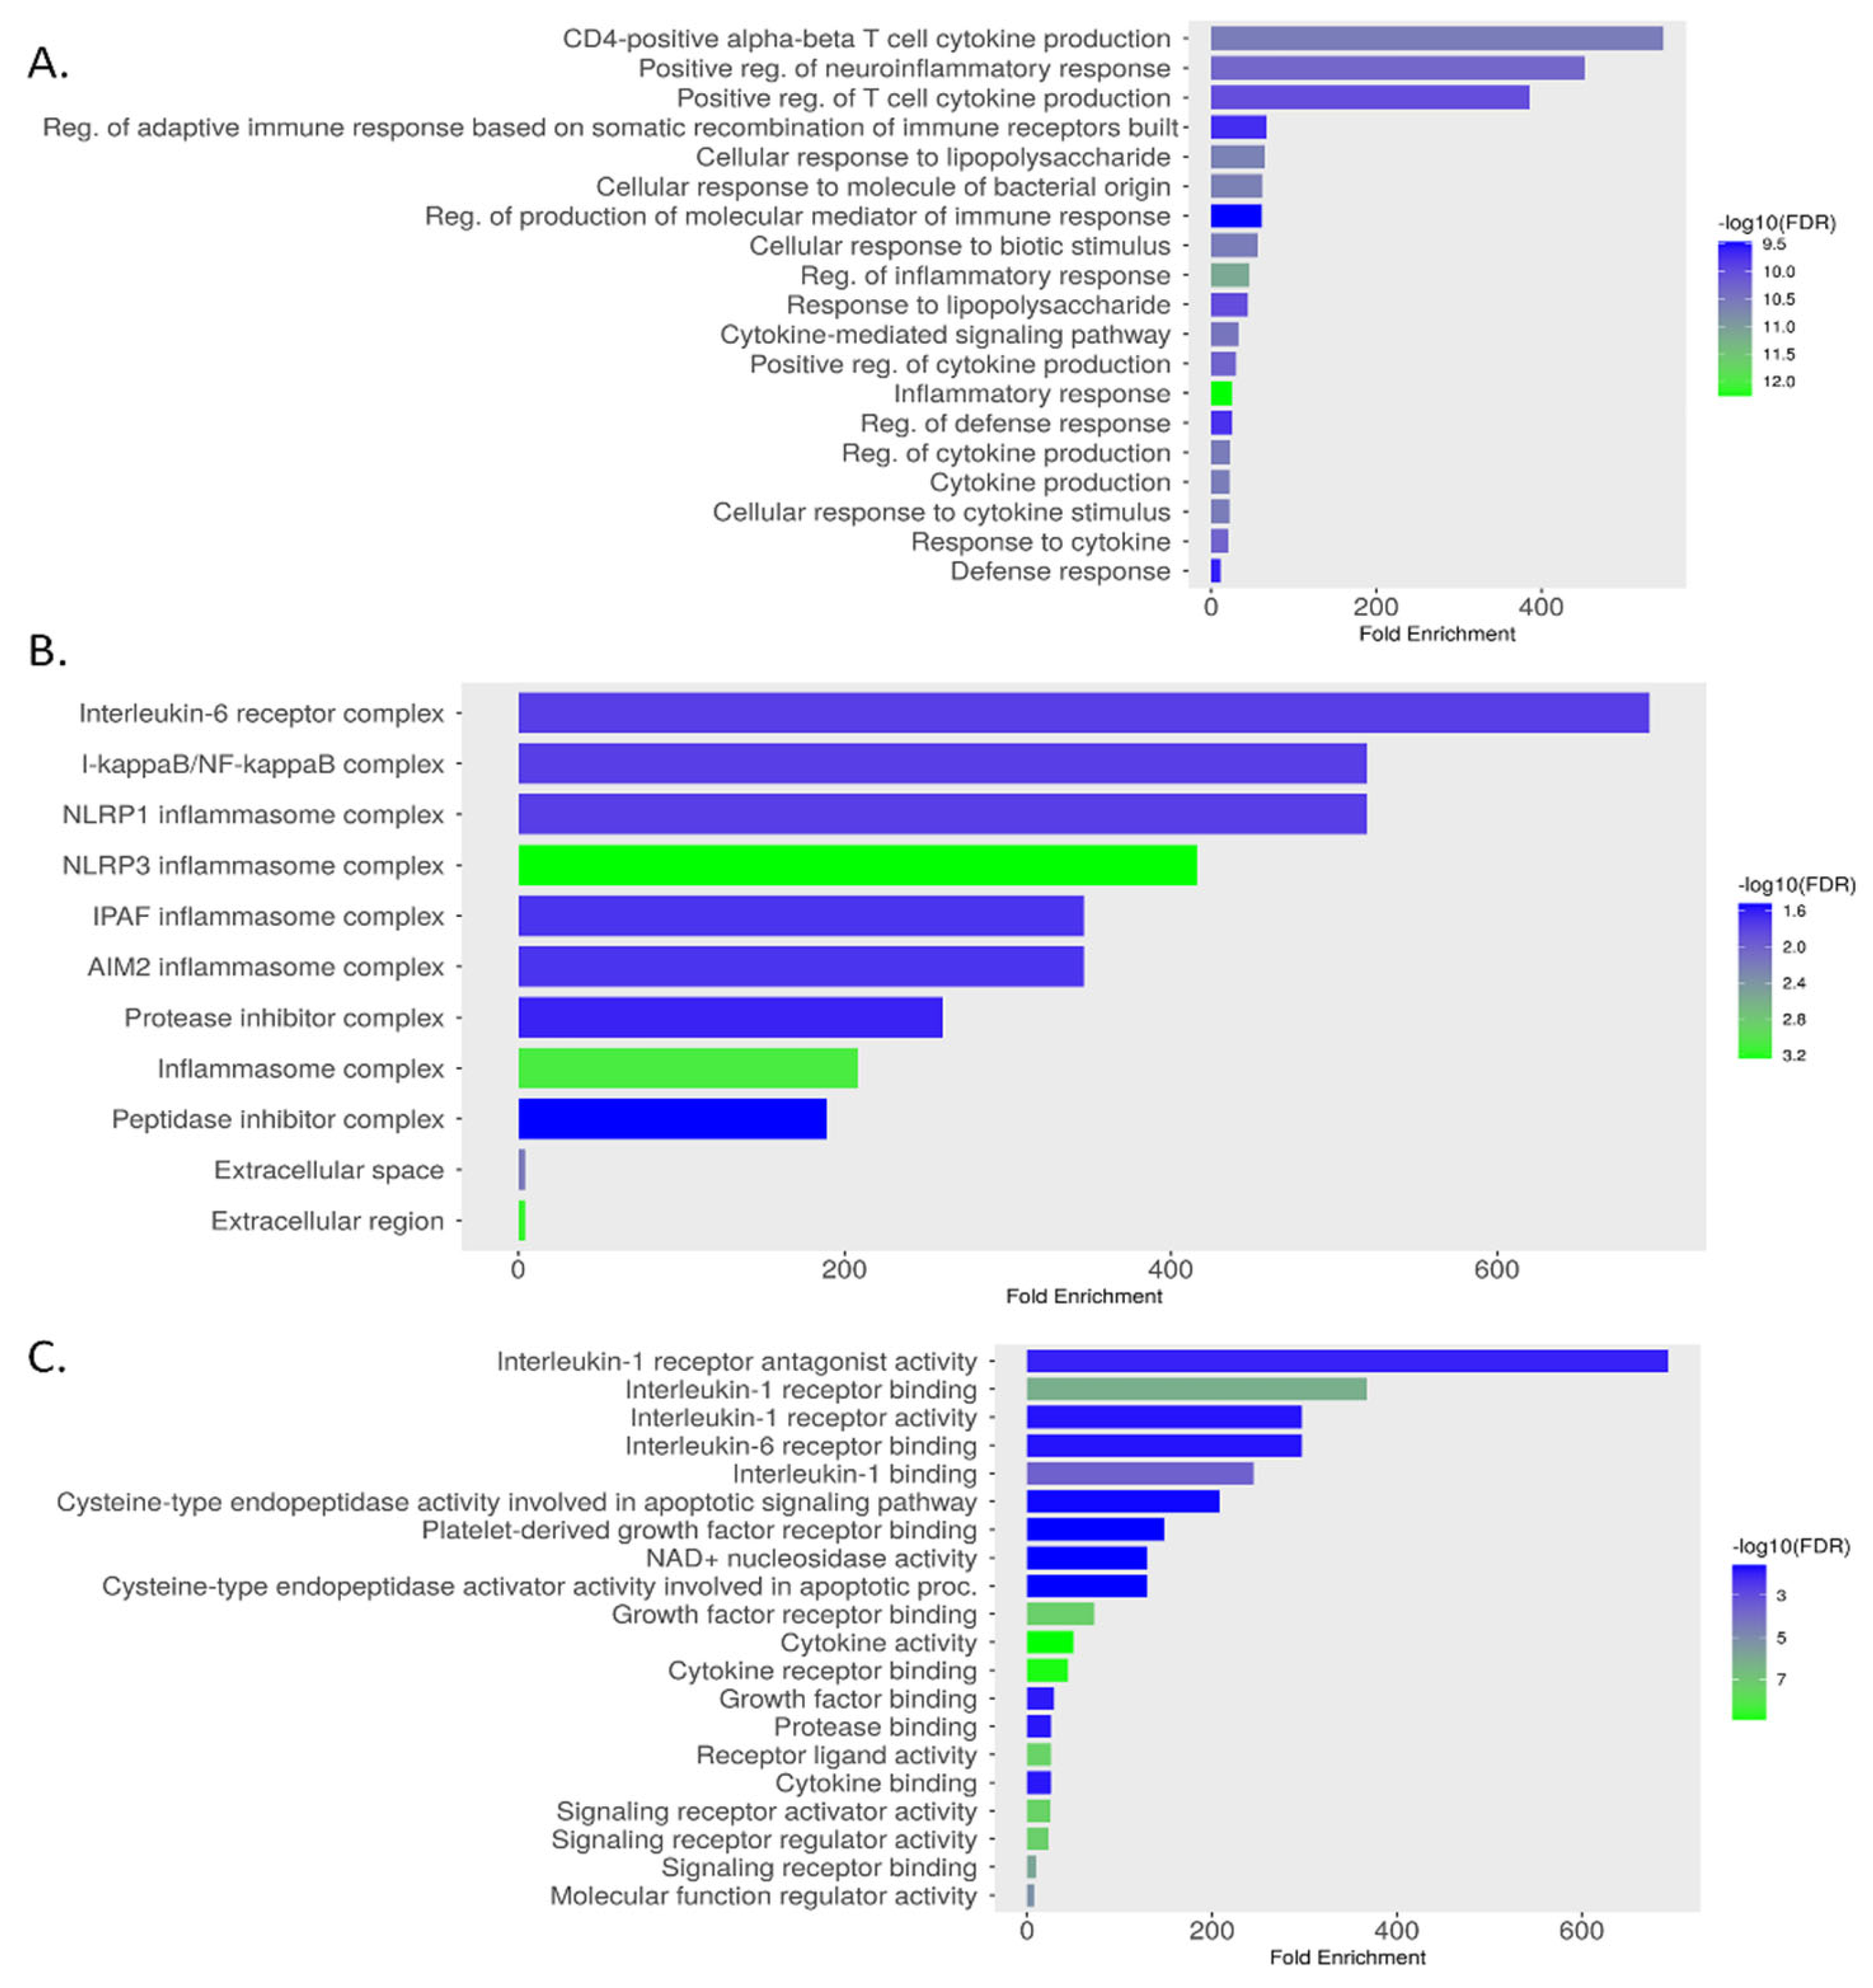
The KEGG pathway analysis identified 93 enriched pathways among intersecting gene targets. The top 20 pathways included significant pathways such as the "Cytosolic DNA-sensing pathway," "Legionellosis," and notably, the "NOD-like receptor signaling pathway," which exhibited a fold enrichment of approximately 150 and a -log10(FDR) of ~12 (Figure 10 (A)). This pathway, detailed in Figure 10 (B), is critical for innate immune responses, involving NOD1, NOD2, and NLRP3 receptors that trigger inflammasome formation and cytokine production (e.g., IL-1β, IL-18). Genes highlighted in red in Figure 10 (B) indicate differential expression, suggesting their role in MSC-mediated modulation of inflammation in MDD. The GO analysis identified 1,000 BP, 22 CC, and 44 MF terms. The top enriched terms for each category are presented in Figure 11 (A), (B), and (C), respectively, with a false discovery rate (FDR) cutoff of 0.05. The bar graphs display fold enrichment on the x-axis, with -log10(FDR) indicated by color intensity. BP enrichment terms highlight the gene set’s involvement in adaptive immune responses, inflammatory regulation, and responses to bacterial stimuli, which are relevant to understanding how MSCs may influence immune dysregulation in MDD. The CC findings indicate that these genes are integral to key signaling complexes involved in cytokine signaling and innate immune responses, providing a cellular context for their roles in inflammation and immunity. MF terms reveal the involvement of these genes in modulating cytokine activities.
Figure 10.
KEGG Pathway Enrichment. (A) Top 20 enriched KEGG pathways identified from the analysis of intersected gene targets. (B) A detailed schematic of the NOD-like receptor signaling pathway. Genes highlighted in red indicate those that are differentially expressed or significant in the context of MSC treatment for MDD, suggesting their involvement in the therapeutic mechanism.
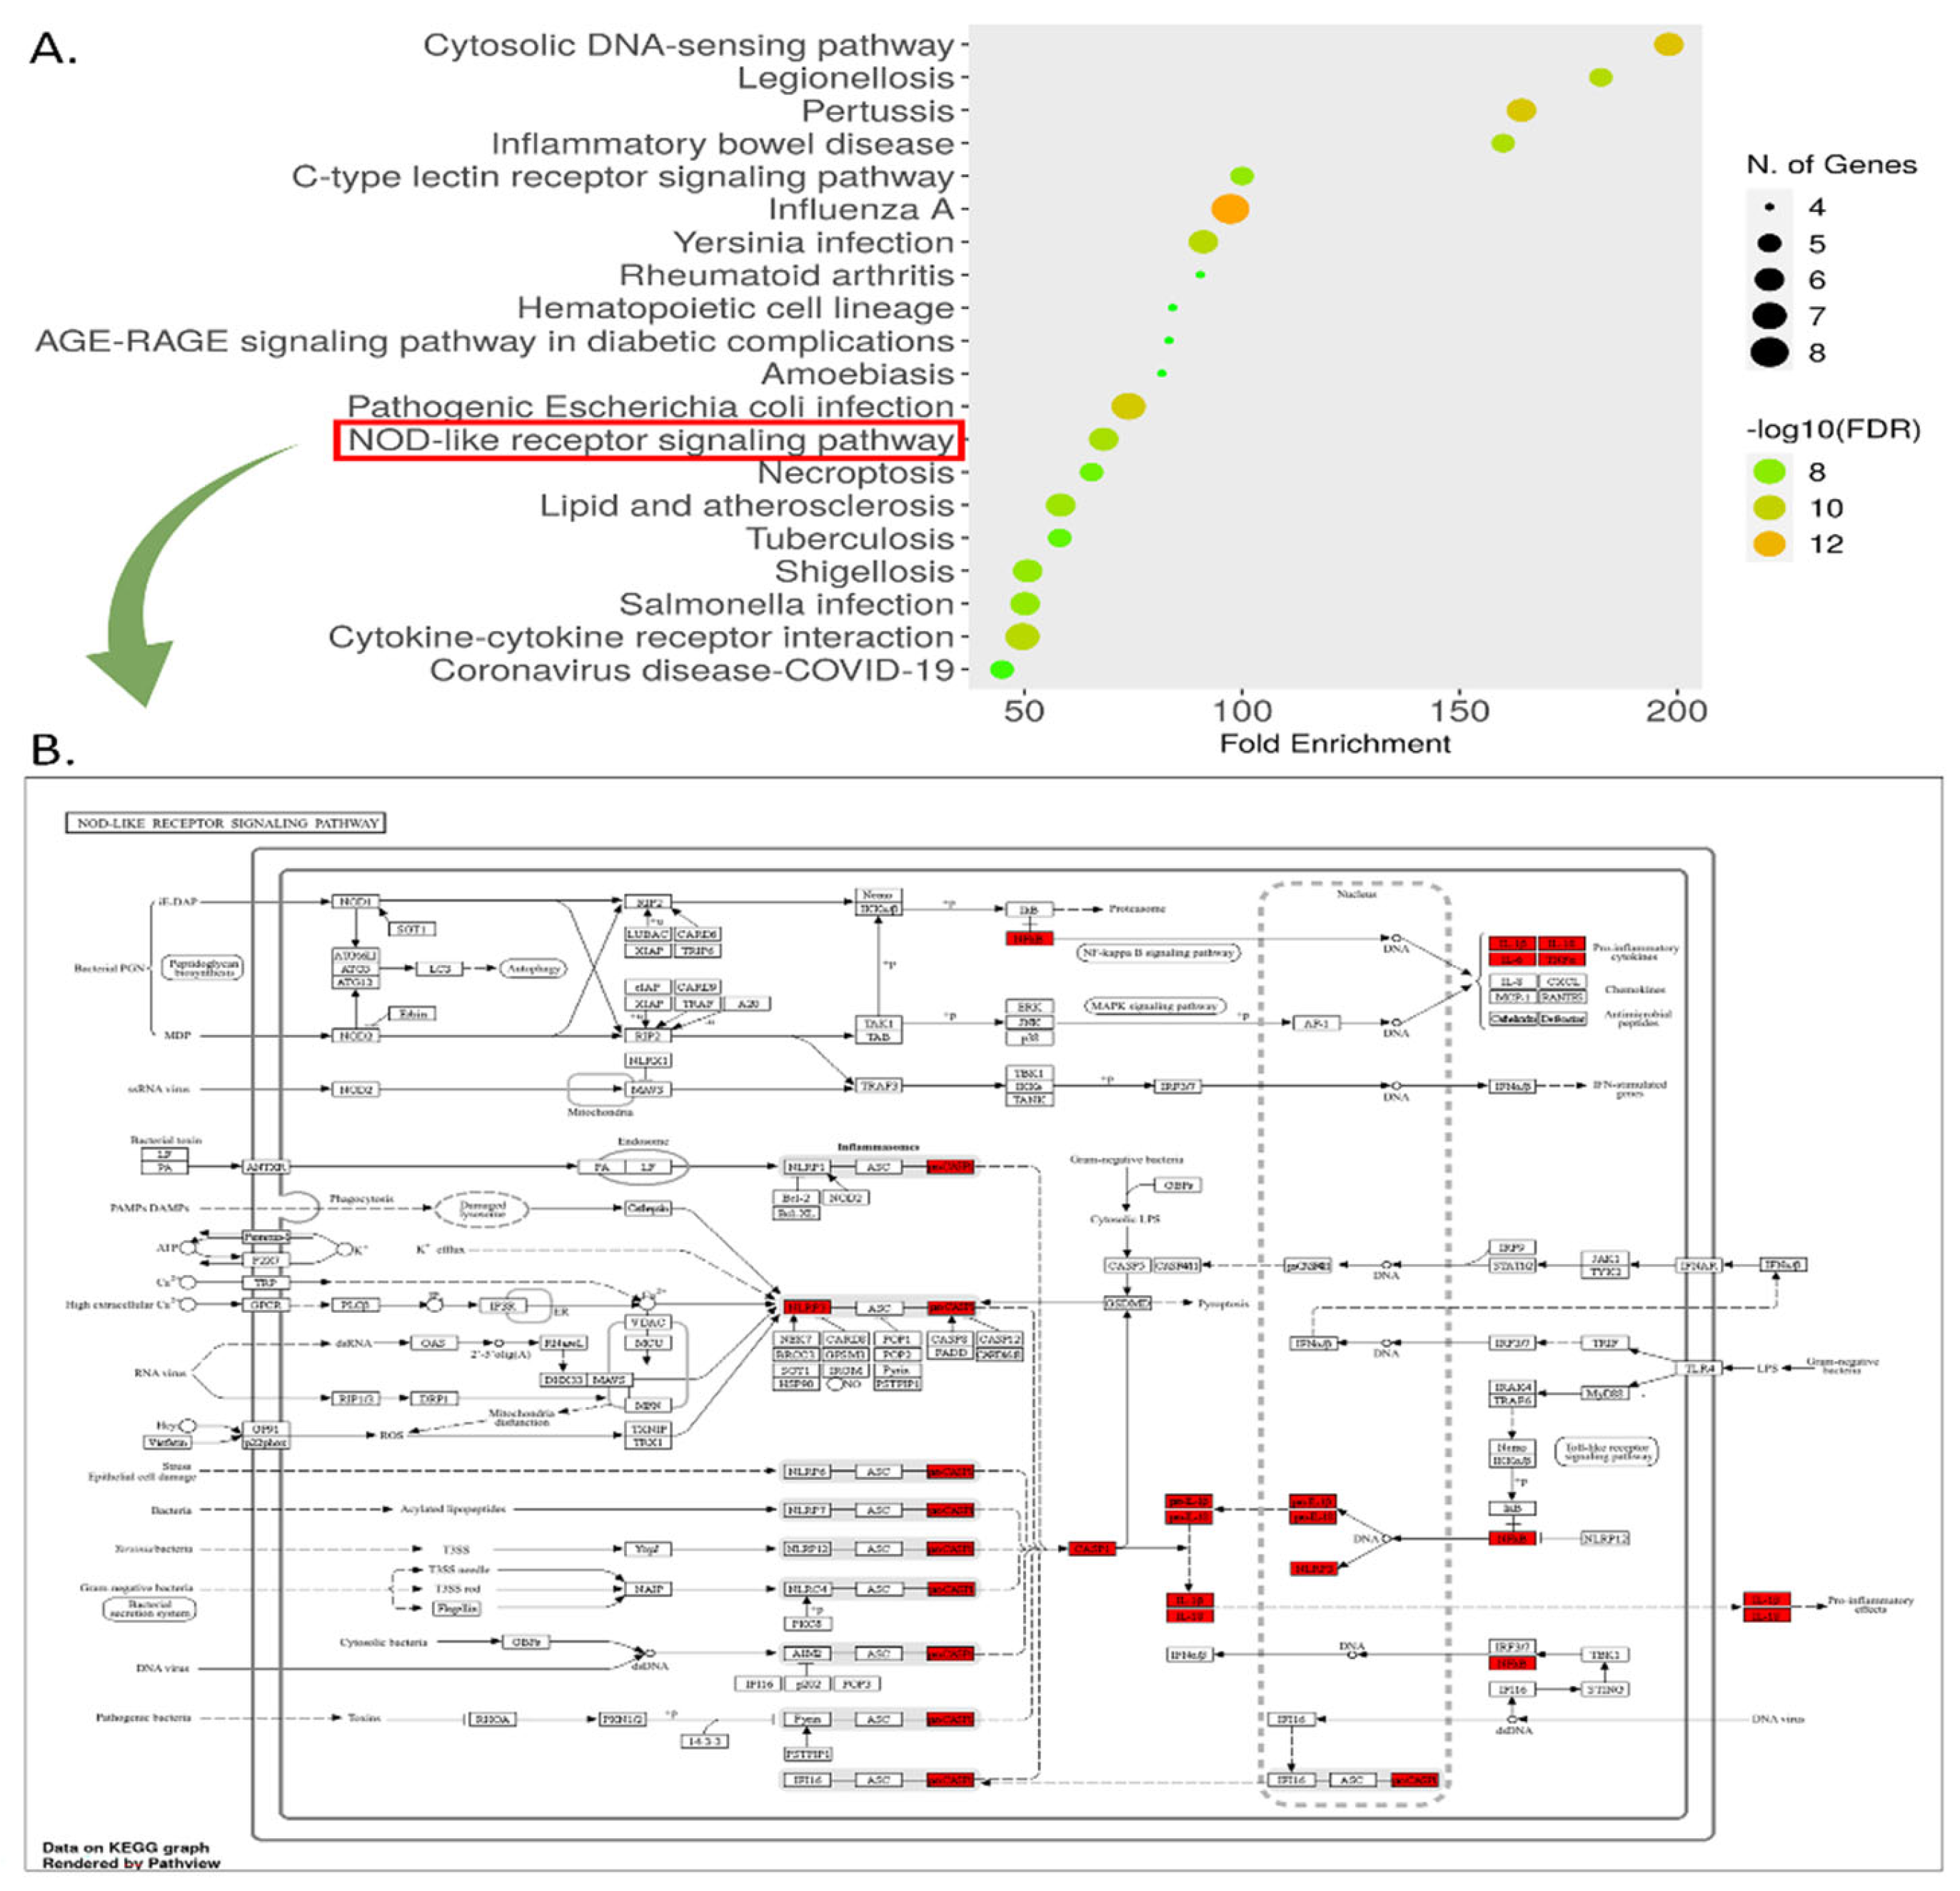
Figure 11.
GO enrichment for key genes: (A) Biological Process, (B) Cellular Component, and (C) Molecular Function.
Figure 11.
GO enrichment for key genes: (A) Biological Process, (B) Cellular Component, and (C) Molecular Function.
3.8.3. Correlation Analysis of Inflammatory Biomarkers with MDD-Associated Genes
The correlation analysis, conducted using the GEPIA tool and the GTEx Brain-Hippocampus dataset, revealed significant associations between inflammatory biomarkers and MDD-related genes. For SLC6A4, notable correlations were observed with IL1A, IL6, TNF, IL18, IL1R1, CASP1, IL1RN, NFKB1, and NLRP3, with the strongest correlations observed for CASP1 (r = 0.70) and IL1RN (r = 0.75). For FKBP5, significant correlations were found with IL1A, IL6, IL18, TNF, IL1R1, CASP1, IL33, IL1RN, NFKB1, and NLRP3, with the strongest correlation observed for NFKB1 (r = 0.62), (Figure 12).
3.8.4. Expression Analysis of Inflammation Genes in MDD.
The analysis of GSE76826 dataset from the GEO repository, comprising 12 healthy controls (HC) and 10 MDD patients, revealed significant differential expression of inflammation-related genes. Using the 'Limma' package, genes with an adjusted p-value < 0.05 were identified as significantly differentially expressed. The volcano plot highlighted upregulated genes (IL1RN, IL1B, CASP1) with log2 fold change > 0 and -log10(p-value) > 1.6, and downregulated genes with log2 fold change < 0. The heatmap illustrated distinct expression patterns, with MDD samples showing higher expression (yellow) of TNF, IL18, and NLRP3 compared to HC (green). Boxplots for IL1RN, IL1B, and CASP1 confirmed significant differences, with MDD exhibiting elevated expression levels (Figure 13).
4. Discussion
This study investigated the effects of BM-MSCs preconditioning with L.PS in an animal model of chronic restraint stress (CRS)-induced depressive-like behavior. The CRS paradigm, previously validated for modelling depressive like behavior. We applied a four-week CRS because the duration of CRS is important; for example, a one-week CRS led to anxiety, whereas a four-week CRS induced depressive like behavior [42]. In the current study, L.PS preconditioning enhanced the neuroprotective effects of MSCs in the hippocampus by decreasing the NLRP3 inflammasome-related pathway, which in turn attenuated depressive like behavior. Additionally, in-silico analysis revealed the pivotal role of the NLRP3 inflammasome signaling pathway in the pathophysiology of depression. Current studies show that chronic stress increases the risk of neuroinflammation, a significant contributor to the initiation and development of depression [43–45]. Consequently, anti-inflammatory agents play a major role in alleviating MDD [38,46,47]. We found that MSCs alone or pretreated MSCs can alleviate depressive-like behavior and neuroinflammation induced by chronic stress. These results are in line with those of previous studies [13,46,48–51]. Another finding that stands out from the results reported earlier is that pretreatment of MSCs with L.PS was more effective in mitigating depressive-like behavior compared to other treatment groups. We confirmed that rats exposed to CRS for 28 days became more immobile and struggled less during the FST, exhibited a decline in total time in the center, rearing, grooming, prolonged latency time during the OFT, a decline in escape latency, and spent less time in the target quadrant during the MWM test. These characteristics are consistent with previous reports [52,53]. These behavioral and cognitive deficits were reversed following treatment, suggesting that preconditioning MSCs with L.PS may enhance their ability to modulate stress-induced cognitive and behavioral impairments. Stressors, through activation of inflammatory pathways, play a key role in the development of depression [15,54–56]. In the brain, activation of the NLRP3 inflammasome-driven inflammatory response plays an important role in the onset of depression [57,58]. The current study confirms that CRS provokes depressive-like behavior through the hippocampal downregulation of NF-κB and upregulation of key pro-inflammatory cytokines (IL-1β, IL-6, IL-18, and TNF-α). Treatment with MSCs mitigated depressive-like behavior through modulating the NLRP3-related pathway, and MSCs pretreated with L.PS were more efficient than MSCs alone or MSCs pretreated with fluoxetine. These results accord with recent studies indicating that these cells have potent positive properties, while preconditioning with probiotics, in particular, improved this effect [25,26]. Similarly, all treatments reduced corticosterone levels, with the L.PS-pretreated MSCs demonstrating the most significant effect. Dysregulation of the hypothalamus-pituitary-adrenal (HPA) axis often explains the initial mechanism linking chronic stress, inflammation, and depression, and the male behavioral response is more evident and more closely associated with variations of corticosterone than in females [59,60]. L.PS-pretreated MSCs may help restore normal HPA axis function, and their strongest effect may be related to the previous findings that probiotics can modulate stress responses via the gut-brain axis. Another possible explanation could be the potential synergistic effects of combining probiotics with stem cell therapy [26,61,62].
Chronic stress does not necessarily cause behavioral alterations. It changes physiological parameters, which may lead to stress-related health issues. As a result, in the present study, we assessed physiological parameters such as body weight variations and blood glucose levels [63].
The impact of depression on body weight changes has been a controversial topic with conflicting evidence [64]. While anorexia and subsequent weight loss were formerly thought to be a key symptom of depression, current evidence increasingly indicates that depression predicts hyperphagia and subsequent weight gain more frequently than weight loss [65]. The surprising finding of our study was that stress-exposed rats experienced significant weight loss, while weight recovery in the L.PS-pretreated MSCs group was better than in other treatment groups. This finding contradicts previous studies suggesting that oral administration of L.PS can reduce body weight [66,67]. One possible explanation for this can be attributed to the route of administration, which can significantly change the effects of an intervention and dramatically influence the pharmacokinetic properties of the drug [68]. Another possibility is that we did not apply food control in this study, which may have affected the outcome.
Depression significantly increases the risk of hypoglycemia and hyperglycemia. There is also a reciprocal relationship between depression and hypoglycemia/hyperglycemia [69]. The current investigation found that CRS-induced depressive like behavior significantly decreases blood glucose levels, which were significantly reversed in the treated groups. Reduced blood glucose levels may be linked to chronic inflammation, which disrupts hormonal balance and central glucose sensing and exacerbates depressive-like behavior. Our therapies with anti-inflammatory properties reduce inflammation, restore neuroendocrine and metabolic functioning, and increase blood glucose recovery. These findings are consistent with existing research on the bidirectional link between depression, inflammation, and glucose metabolism [69–71].
The present study found that pretreatment of MSCs with L.PS reduced histological damage and neuronal loss in the hippocampus. This therapeutic response was associated with improved inflammation and spatial memory performance. An important finding of the current study was that most hippocampal damage occurred in the CA2 and CA3 regions, which a recent study has supported [72]. The observed regional differences in histological analysis may be related to the finding that stress stimulates the HPA axis, leading to increased secretion of corticosterone, the primary glucocorticoid in rodents. It acts through two types of receptors: the mineralocorticoid (MR) and glucocorticoid receptor (GR). Each receptor has a different distribution and affinity in specific areas of the hippocampus; therefore, each of these regions may be affected differently [73].
We performed bioinformatic analysis, and PPI network analysis revealed the top-ranked genes associated with depression, including IL1A, IL1B, IL6, TNF, IL18, IL1R1, CASP1, IL33, IL1RN, NFKB1, and NLRP3. Previous studies have implicated these genes in the onset, progression, and remission of depression [74,75]. Our results revealed a complex interplay of inflammation-related proteins pertinent to MDD pathogenesis. This complexity reflects the multifactorial connection between depression and inflammation, highlighting the importance of exploring novel and combinational therapies in addition to classical treatments [76]. Following that, GO analysis focused mostly on inflammation-related components, while KEGG analysis revealed that the majority of genes were enriched in the NOD-like receptor signaling pathway. Furthermore, the correlation analysis found significant associations between inflammatory biomarkers and MDD-related genes, including SLC6A4 and FKBP5. SLC6A4 encodes an important membrane protein that transports the neurotransmitter serotonin. This gene is not only involved in modulating antidepressant response but has also been associated with inflammatory processes [77]. Our findings may provide additional support for the anti-inflammatory properties of antidepressants through these complicated processes [78]. FKBP5 influences glucocorticoid receptor (GR) sensitivity, playing a key role in systemic inflammation-induced neuroinflammation and GR activation within the hippocampus [79]. These findings suggest that both SLC6A4 and FKBP5 are promising targets for evaluating the preconditioning of MSCs in depression for future exploration of the exact mechanisms involved. The examination of the GSE76826 dataset from the GEO collection indicated significant upregulation of inflammation-related genes, particularly TNF, IL18, and NLRP3. we previously showed the pivotal role of NLRP3 inflammasome upstream in depression. in the current study, we evaluated its downstream, including NF-κB, IL-1β, IL-6, IL-18, and TNF-α. Finally, the in-silico analysis approved our work and highlighted the importance of evaluating and targeting this pathway in the context of depression.
5. Conclusions
In conclusion, this research provides evidence supporting the benefits of using cell-based therapies to reduce depressive-like behavior, and therefore we recommend their use in future preclinical studies. Specifically, we found that MSCs pretreated with L.PS significantly alleviated CRS-induced depressive-like behavior, which may be partly due to the suppression of NLRP3-mediated neuroinflammation. Finally, although inflammation and pro-inflammatory mediators play a crucial role in the pathophysiology of depression, other contributing mechanisms such as autophagy, oxidative stress, altered monoaminergic systems, vascular changes, and decreased neurogenesis and neuroplasticity were not examined in this study. Additional research should be conducted to explore these pathways.
Supplementary Materials
The following supporting information can be downloaded at the website of this paper posted on Preprints.org, Figure S: BM-MSCs morphology (A) and BM-MSCs Characterization (B). The expression of CD45, CD44, CD34, and CD90 in isolated Bone marrow-derived MSCs.
Author Contributions
M. Amini: Writing – original draft, Visualization, Project administration, Methodology, Investigation, Formal analysis, Data curation, Conceptualization. E. Motavasseli: Project administration, Investigation, Data curation. M. Zahmatkesh: Investigation, Data curation. Z. Yosefi: Methodology, Investigation, Data curation. E. Jamaat: Methodology, Investigation. Gh. Hassanzadeh: Writing – review & editing, Supervision, Resources, Funding acquisition, Conceptualization.
Funding
This work was supported by grants from Tehran University of Medical Sciences, and Cognitive Sciences and Technologies Council of Iran, grant (project) number: CT1402112483. Also, Mr. Mohammad Amini carried out this work in partial project fulfillment of the requirements to obtain a PhD degree in neuroscience.
Institutional Review Board Statement
The animal study protocol was approved by the Ethics Committee of Tehran University of Medical Sciences (Approval ID: IR.TUMS.AEC.1401.214). All attempts were taken to minimize the consumption and pain of the animals in the study. for studies involving animals. All procedures performed in studies involving animal subjects were in accordance with the ethical standards of the institutional and/or national research committee and with the 1964 Helsinki declaration and its later amendments or comparable ethical standards.
Informed Consent Statement
Not applicable.
Data Availability Statement
The original contributions presented in this study are included in the article or Supplementary Material. Further inquiries can be directed to the corresponding author.
Acknowledgments
Nothing
Conflicts of Interest
The authors declare no conflicts of interest.
Abbreviations
The following abbreviations are used in this manuscript:
| α-MEM | Alpha-minimal essential medium |
| BM-MSCs | Bone marrow-derived mesenchymal stem cells |
| BP | Biological Process |
| BSA | Bovine Serum Albumin |
| CASP1 | Caspase 1 |
| CC | Cellular Component |
| CRS | Chronic Restraint Stress |
| DBS | Deep Brain Stimulation |
| DMEM | Dulbecco’s Modified Eagle Medium |
| DMSO | Dimethyl Sulfoxide |
| DSM-IV | Diagnostic and Statistical Manual of Mental Disorders, Fourth Edition |
| ECT | Electroconvulsive Therapy |
| FDR | False Discovery Rate |
| FBS | Fetal Bovine Serum |
| FITC | Fluorescein Isothiocyanate |
| FKBP5 | FK506 Binding Protein 5 Gene |
| FMO | Fluorescence Minus One |
| FST | Forced Swim Test |
| GEO | Gene Expression Omnibus |
| GEPIA | Gene Expression Profiling Interactive Analysis |
| GO | Gene Ontology |
| GR | Glucocorticoid Receptor |
| GTEx | Genotype-Tissue Expression |
| HC | Healthy Controls |
| HPA | Hypothalamus-Pituitary-Adrenal |
| i.c.v | Intracerebroventricularly |
| IL-1β | Interleukin-1 beta |
| IL-1R1 | Interleukin-1 Receptor Type 1 |
| IL1A | Interleukin 1 Alpha |
| IL18 | Interleukin 18 |
| IL1B | Interleukin 1 Beta |
| IL1RN | Interleukin 1 Receptor Antagonist |
| IL33 | Interleukin 33 |
| IL6 | Interleukin 6 |
| KEGG | Kyoto Encyclopedia of Genes and Genomes |
| L.PS | Lactobacillus plantarum Supernatant |
| Log2FC | Log2 Fold Change |
| MDD | Major Depressive Disorder |
| MF | Molecular Function |
| MR | Mineralocorticoid Receptor |
| MRS | Man Rogosa Sharpe |
| MSCs | Mesenchymal Stem Cells |
| MTT | 3-(4, 5-dimethylthiazol-2-yl)-2, 5-diphenyltetrazolium bromide |
| MWM | Morris Water Maze |
| NF-κB | Nuclear factor kappa-light-chain-enhancer of activated B cells |
| NLRP3 | NOD-, LRR- and pyrin domain-containing protein 3 |
| OD | Optical Density |
| OFT | Open Field Test |
| PBS | Phosphate-buffered saline |
| PE | Phycoerythrin |
| PPI | Protein-Protein Interaction |
| rpm | Revolutions per minute |
| SLC6A4 | Serotonin Transporter Gene |
| TNF | Tumor Necrosis Factor |
| TNF-α | Tumor Necrosis Factor-alpha |
| TPP | Treatment-Prevalence Paradox |
| VNS | Vagus Nerve Stimulation |
References
- Ghafori, S.S.; Yousefi, Z.; Bakhtiari, E.; Hassanzadeh, G. Neutrophil-to-lymphocyte ratio as a predictive biomarker for early diagnosis of depression: A narrative review. Brain, Behavior, & Immunity-Health 2024, 100734. [Google Scholar] [CrossRef]
- Karrouri, R.; Hammani, Z.; Benjelloun, R.; Otheman, Y. Major depressive disorder: Validated treatments and future challenges. World journal of clinical cases 2021, 9, 9350. [Google Scholar] [CrossRef]
- Marwaha, S.; Palmer, E.; Suppes, T.; Cons, E.; Young, A.H.; Upthegrove, R. Novel and emerging treatments for major depression. The Lancet 2023, 401, 141–153. [Google Scholar] [CrossRef] [PubMed]
- Chen, S.; Sun, H.; Song, Y.; Zhang, M.; Huang, W.; Zhao, C.; et al. Transition and trend analysis of the burden of depression in China and different income countries: Based on GBD database and joinpoint regression model. Journal of Affective Disorders 2024. [Google Scholar] [CrossRef]
- Ezawa, I.D.; Robinson, N.; Hollon, S.D. Prevalence Increases as Treatments Improve: An Evolutionary Perspective on the Treatment-Prevalence Paradox in Depression. Annual Review of Clinical Psychology 2024, 20, 201–228. [Google Scholar] [CrossRef]
- Pharoun, J.; Berro, J.; Sobh, J.; Abou-Younes, M.-M.; Nasr, L.; Majed, A.; et al. Mesenchymal stem cells biological and biotechnological advances: Implications for clinical applications. European Journal of Pharmacology 2024, 977, 176719. [Google Scholar] [CrossRef]
- Asgari Taei, A.; Nasoohi, S.; Hassanzadeh, G.; Kadivar, M.; Dargahi, L.; Farahmandfar, M. Enhancement of angiogenesis and neurogenesis by intracerebroventricular injection of secretome from human embryonic stem cell-derived mesenchymal stem cells in ischemic stroke model. Biomedicine & Pharmacotherapy 2021, 140, 111709. [Google Scholar] [CrossRef]
- Sadr, S.; Ahmadi Simab, P.; Niazi, M.; Yousefsani, Z.; Lotfalizadeh, N.; Hajjafari, A.; et al. Anti-inflammatory and immunomodulatory effects of mesenchymal stem cell therapy on parasitic drug resistance. Expert Review of Anti-infective Therapy 2024. [Google Scholar] [CrossRef]
- Kin, K.; Yasuhara, T.; Borlongan, C.V.; Date, I. Encapsulated stem cells ameliorate depressive-like behavior via growth factor secretion. Brain Circ 2018, 4, 128–132. [Google Scholar] [CrossRef]
- Tfilin, M.; Sudai, E.; Merenlender, A.; Gispan, I.; Yadid, G.; Turgeman, G. Mesenchymal stem cells increase hippocampal neurogenesis and counteract depressive-like behavior. Molecular psychiatry 2010, 15, 1164–1175. [Google Scholar] [CrossRef] [PubMed]
- Huang, J.; Huang, W.; Yi, J.; Deng, Y.; Li, R.; Chen, J.; et al. Mesenchymal stromal cells alleviate depressive and anxiety-like behaviors via a lung vagal-to-brain axis in male mice. Nat Commun 2023, 14, 7406. [Google Scholar] [CrossRef]
- Shwartz, A.; Betzer, O.; Kronfeld, N.; Kazimirsky, G.; Cazacu, S.; Finniss, S.; et al. Therapeutic Effect of Astroglia-like Mesenchymal Stem Cells Expressing Glutamate Transporter in a Genetic Rat Model of Depression. Theranostics 2017, 7, 2690–2703. [Google Scholar] [CrossRef]
- Wang, P.; Li, Y.; Song, Y.; Gao, Y.; Hao, C.; Zhou, Y.; et al. Human umbilical cord mesenchymal stem cells reverse depression in rats induced by chronic unpredictable mild stress combined with lipopolysaccharide. CNS Neuroscience & Therapeutics 2024, 30, e14644. [Google Scholar] [CrossRef]
- Cui, L.; Li, S.; Wang, S.; Wu, X.; Liu, Y.; Yu, W.; et al. Major depressive disorder: hypothesis, mechanism, prevention and treatment. Signal Transduction and Targeted Therapy 2024, 9, 30. [Google Scholar] [CrossRef] [PubMed]
- Poletti, S.; Mazza, M.G.; Benedetti, F. Inflammatory mediators in major depression and bipolar disorder. Translational Psychiatry 2024, 14, 247. [Google Scholar] [CrossRef] [PubMed]
- Blevins, H.M.; Xu, Y.; Biby, S.; Zhang, S. The NLRP3 Inflammasome Pathway: A Review of Mechanisms and Inhibitors for the Treatment of Inflammatory Diseases. Front Aging Neurosci 2022, 14, 879021. [Google Scholar] [CrossRef]
- Amini, M.; Yousefi, Z.; Ghafori, S.S.; Hassanzadeh, G. Sleep deprivation and NLRP3 inflammasome: Is there a causal relationship? Front Neurosci 2022, 16, 1018628. [Google Scholar] [CrossRef]
- Gholaminejhad, M.; Jameie, S.B.; Abdi, M.; Abolhassani, F.; Mohammed, I.; Hassanzadeh, G. All-Trans Retinoic Acid-Preconditioned Mesenchymal Stem Cells Improve Motor Function and Alleviate Tissue Damage After Spinal Cord Injury by Inhibition of HMGB1/NF-κB/NLRP3 Pathway Through Autophagy Activation. J Mol Neurosci 2022, 72, 947–962. [Google Scholar] [CrossRef]
- Gholaminejhad, M.; Forouzesh, M.; Ebrahimi, B.; Mahdavi, S.A.; Mirtorabi, S.D.; Liaghat, A.; et al. Formation and activity of NLRP3 inflammasome and histopathological changes in the lung of corpses with COVID-19. Journal of Molecular Histology 2022, 53, 883–890. [Google Scholar] [CrossRef]
- Yarahmadi, A.; Malek, F.; Poorhassan, M.; Ghaffari, N.; Ebrahimi, B.; Bazrafkan, M.; et al. Curcumin Attenuates Development of Depressive-Like Behavior in Male Rats after Spinal Cord Injury: Involvement of NLRP3 Inflammasome. Journal of Contemporary Medical Sciences 2022, 8. [Google Scholar] [CrossRef]
- Das, R.; Emon, M.P.Z.; Shahriar, M.; Nahar, Z.; Islam, S.M.A.; Bhuiyan, M.A.; et al. Higher levels of serum IL-1β and TNF-α are associated with an increased probability of major depressive disorder. Psychiatry Research 2021, 295, 113568. [Google Scholar] [CrossRef] [PubMed]
- Zhang, Y.; Liu, L.; Liu, Y.-Z.; Shen, X.-L.; Wu, T.-Y.; Zhang, T.; et al. NLRP3 inflammasome mediates chronic mild stress-induced depression in mice via neuroinflammation. International Journal of Neuropsychopharmacology 2015, 18, pyv006. [Google Scholar] [CrossRef]
- Li, J.; Tian, S.; Wang, H.; Du, C.; Fang, J.; Wang, X.; et al. Protection of hUC-MSCs against neuronal complement C3a receptor-mediated NLRP3 activation in CUMS-induced mice. Neuroscience Letters 2021, 741, 135485. [Google Scholar] [CrossRef] [PubMed]
- Ju, R.; Gao, X.; Zhang, C.; Tang, W.; Tian, W.; He, M. Exogenous MSCs based tissue regeneration: a review of immuno-protection strategies from biomaterial scaffolds. Journal of Materials Chemistry B 2024. [CrossRef] [PubMed]
- Kazemi, A.; Eshkoor, P.A.; Saeedi, P.; Halabian, R. Evaluation of antioxidant and antibacterial effects of lactobacilli metabolites-preconditioned bone marrow mesenchymal stem cells in skin lesions amelioration. Bioorganic Chemistry 2022, 124, 105797. [Google Scholar] [CrossRef] [PubMed]
- Mendi, A.; Aktaş, B.; Aslım, B. Mesenchymal stem cell-probiotic communication: beneficial bacteria in preconditioning. In Handbook of Stem Cell Therapy; Springer, 2022; pp. 1–20. [Google Scholar] [CrossRef]
- Li, J.; Wang, J.; Wang, M.; Zheng, L.; Cen, Q.; Wang, F.; et al. Bifidobacterium: a probiotic for the prevention and treatment of depression. Front Microbiol 2023, 14, 1174800. [Google Scholar] [CrossRef]
- Romijn, A.R.; Rucklidge, J.J.; Kuijer, R.G.; Frampton, C. A double-blind, randomized, placebo-controlled trial of Lactobacillus helveticus and Bifidobacterium longum for the symptoms of depression. Aust N Z J Psychiatry 2017, 51, 810–821. [Google Scholar] [CrossRef]
- Ma, J.; Chen, Y.; Wang, Z.; Wang, R.; Dong, Y. Lactiplantibacillus plantarum CR12 attenuates chronic unforeseeable mild stress induced anxiety and depression-like behaviors by modulating the gut microbiota-brain axis. Journal of Functional Foods 2023, 107, 105710. [Google Scholar] [CrossRef]
- Sun, X.; Zhang, H.F.; Ma, C.L.; Wei, H.; Li, B.M.; Luo, J. Alleviation of Anxiety/Depressive-Like Behaviors and Improvement of Cognitive Functions by Lactobacillus plantarum WLPL04 in Chronically Stressed Mice. Can J Infect Dis Med Microbiol 2021, 2021, 6613903. [Google Scholar] [CrossRef]
- Seewoo, B.J.; Hennessy, L.A.; Feindel, K.W.; Etherington, S.J.; Croarkin, P.E.; Rodger, J. Validation of chronic restraint stress model in young adult rats for the study of depression using longitudinal multimodal MR imaging. Eneuro 2020. [Google Scholar] [CrossRef]
- Alkanat, M.; Alkanat, H. D-Limonene reduces depression-like behaviour and enhances learning and memory through an anti-neuroinflammatory mechanism in male rats subjected to chronic restraint stress. Eur J Neurosci 2024, 60, 4491–4502. [Google Scholar] [CrossRef]
- Vaseghi, S.; Babapour, V.; Nasehi, M.; Zarrindast, M.R. The role of CA1 CB1 receptors on lithium-induced spatial memory impairment in rats. Excli j 2018, 17, 916–934. [Google Scholar] [PubMed]
- Hernández, V.S.; Luquín, S.; Jáuregui-Huerta, F.; Corona-Morales, A.A.; Medina, M.P.; Ruíz-Velasco, S.; et al. Dopamine receptor dysregulation in hippocampus of aged rats underlies chronic pulsatile l-Dopa treatment induced cognitive and emotional alterations. Neuropharmacology 2014, 82, 88–100. [Google Scholar] [CrossRef] [PubMed]
- Duan, T.-T.; Tan, J.-W.; Yuan, Q.; Cao, J.; Zhou, Q.-X.; Xu, L. Acute ketamine induces hippocampal synaptic depression and spatial memory impairment through dopamine D1/D5 receptors. Psychopharmacology 2013, 228, 451–461. [Google Scholar] [CrossRef]
- Nissen, I.; Estrada, F.S.; Nava-Kopp, A.T.; Irles, C.; de-la-Peña-Diaz, A.; Fernandez, G.J.; et al. Prolame ameliorates anxiety and spatial learning and memory impairment induced by ovariectomy in rats. Physiol Behav 2012, 106, 278–284. [Google Scholar] [CrossRef] [PubMed]
- Hu, C.; Luo, Y.; Wang, H.; Kuang, S.; Liang, G.; Yang, Y.; et al. Re-evaluation of the interrelationships among the behavioral tests in rats exposed to chronic unpredictable mild stress. PLoS One 2017, 12, e0185129. [Google Scholar] [CrossRef] [PubMed]
- Kouba, B.R.; de Araujo Borba, L.; Borges de Souza, P.; Gil-Mohapel, J.; Rodrigues, A.L.S. Role of Inflammatory Mechanisms in Major Depressive Disorder: From Etiology to Potential Pharmacological Targets. Cells 2024. [Google Scholar] [CrossRef]
- Zhang, W.; Wang, T.; Li, L.; Xu, J.; Wang, J.; Wang, G.; et al. The Role of Mitochondrial Dysfunction-Mediated Changes in Immune Cytokine Expression in the Pathophysiology and Treatment of Major Depressive Disorder. Molecular Neurobiology 2025, 1–12. [Google Scholar] [CrossRef]
- Zhou, F.; Luo, Y.; Xiong, H.; Zhang, G. Carcinogenic effect of adenosine deaminase(ADA) in human tumors. Research Square 2023. [Google Scholar] [CrossRef]
- Miyata, S.; Kurachi, M.; Okano, Y.; Sakurai, N.; Kobayashi, A.; Harada, K.; et al. Blood Transcriptomic Markers in Patients with Late-Onset Major Depressive Disorder. PLoS One 2016, 11, e0150262. [Google Scholar] [CrossRef]
- Ye, F.; Dong, M.-C.; Xu, C.-X.; Jiang, N.; Chang, Q.; Liu, X.-M.; et al. Effects of different chronic restraint stress periods on anxiety- and depression-like behaviors and tryptophan-kynurenine metabolism along the brain-gut axis in C57BL/6N mice. European Journal of Pharmacology 2024, 965, 176301. [Google Scholar] [CrossRef]
- Hassamal, S. Chronic stress, neuroinflammation, and depression: an overview of pathophysiological mechanisms and emerging anti-inflammatories. Frontiers in Psychiatry 2023, 14, 1130989. [Google Scholar] [CrossRef] [PubMed]
- White, A.G.; Elias, E.; Orozco, A.; Robinson, S.A.; Manners, M.T. Chronic Stress-Induced Neuroinflammation: Relevance of Rodent Models to Human Disease. International Journal of Molecular Sciences 2024, 25, 5085. [Google Scholar] [CrossRef]
- Lei, A.A.; Phang, V.W.X.; Lee, Y.Z.; Kow, A.S.F.; Tham, C.L.; Ho, Y.-C.; et al. Chronic Stress-Associated Depressive Disorders: The Impact of HPA Axis Dysregulation and Neuroinflammation on the Hippocampus-A Mini Review. International Journal of Molecular Sciences 2025, 26, 2940. [Google Scholar] [CrossRef] [PubMed]
- Jia, Z.; Yu, W.; Li, X.; Dong, T.; Wang, X.; Li, J.; et al. Du-moxibustion ameliorates depression-like behavior and neuroinflammation in chronic unpredictable mild stress-induced mice. Journal of Affective Disorders 2024, 358, 211–221. [Google Scholar] [CrossRef] [PubMed]
- Du, Y.; Dou, Y.; Wang, M.; Wang, Y.; Yan, Y.; Fan, H.; et al. Efficacy and acceptability of anti-inflammatory agents in major depressive disorder: a systematic review and meta-analysis. Frontiers in Psychiatry 2024, 15, 1407529. [Google Scholar] [CrossRef]
- Gao, Z.; Luo, K.; Hu, Y.; Niu, Y.; Zhu, X.; Li, S.; et al. Melatonin alleviates chronic stress-induced hippocampal microglia pyroptosis and subsequent depression-like behaviors by inhibiting Cathepsin B/NLRP3 signaling pathway in rats. Translational Psychiatry 2024, 14, 166. [Google Scholar] [CrossRef]
- Tan, X.; Wang, D.; Lu, P.; Guan, S.; Zheng, Q.; Du, X.; et al. Bone marrow mesenchymal stem cells alleviate stress-induced hyperalgesia via restoring gut microbiota and inhibiting neuroinflammation in the spinal cord by targeting the AMPK/NF-κB signaling pathway. Life Sciences 2023, 314, 121318. [Google Scholar] [CrossRef]
- Wang, Q.; Xu, Y.; Zhu, S.; Jiang, L.; Yao, L.; Yu, X.; et al. Mesenchymal stem cells improve depressive disorder via inhibiting the inflammatory polarization of microglia. Journal of Psychiatric Research 2024, 179, 105–116. [Google Scholar] [CrossRef]
- Zhang, L.-w.; Cui, C.-a.; Liu, C.; Sun, L.-p.; Ouyang, Y.-n.; Li, L.-f.; et al. Auraptene-ameliorating depressive-like behaviors induced by lipopolysaccharide combined with chronic unpredictable mild stress in mice mitigate hippocampal neuroinflammation mediated by microglia. International Immunopharmacology 2024, 136, 112330. [Google Scholar] [CrossRef] [PubMed]
- Jangra, A.; Dwivedi, S.; Sriram, C.S.; Gurjar, S.S.; Kwatra, M.; Sulakhiya, K.; et al. Honokiol abrogates chronic restraint stress-induced cognitive impairment and depressive-like behaviour by blocking endoplasmic reticulum stress in the hippocampus of mice. European Journal of Pharmacology 2016, 770, 25–32. [Google Scholar] [CrossRef] [PubMed]
- Adachi, N.; Sakhri, F.Z.; Ikemoto, H.; Ohashi, Y.; Kato, M.; Inoue, T.; et al. Kamikihito rescued depressive-like behaviors and hippocampus neurogenesis in chronic restraint stress rats. Journal of Traditional and Complementary Medicine 2022, 12, 172–179. [Google Scholar] [CrossRef]
- Berk, M.; Williams, L.J.; Jacka, F.N.; O'Neil, A.; Pasco, J.A.; Moylan, S.; et al. So depression is an inflammatory disease, but where does the inflammation come from? BMC Medicine 2013, 11, 200. [Google Scholar] [CrossRef]
- Grygiel-Górniak, B.; Limphaibool, N.; Puszczewicz, M. Cytokine secretion and the risk of depression development in patients with connective tissue diseases. Psychiatry and Clinical Neurosciences 2019, 73, 302–316. [Google Scholar] [CrossRef]
- Chang, J.; Jiang, T.; Shan, X.; Zhang, M.; Li, Y.; Qi, X.; et al. Pro-inflammatory cytokines in stress-induced depression: Novel insights into mechanisms and promising therapeutic strategies. Progress in Neuro-Psychopharmacology and Biological Psychiatry 2024, 131, 110931. [Google Scholar] [CrossRef]
- Kaufmann, F.N.; Costa, A.P.; Ghisleni, G.; Diaz, A.P.; Rodrigues, A.L.S.; Peluffo, H.; et al. NLRP3 inflammasome-driven pathways in depression: Clinical and preclinical findings. Brain Behav Immun 2017, 64, 367–383. [Google Scholar] [CrossRef] [PubMed]
- Xia, C.-Y.; Guo, Y.-X.; Lian, W.-W.; Yan, Y.; Ma, B.-Z.; Cheng, Y.-C.; et al. The NLRP3 inflammasome in depression: Potential mechanisms and therapies. Pharmacological Research 2023, 187, 106625. [Google Scholar] [CrossRef] [PubMed]
- Hassamal, S. Chronic stress, neuroinflammation, and depression: an overview of pathophysiological mechanisms and emerging anti-inflammatories. Front Psychiatry 2023, 14, 1130989. [Google Scholar] [CrossRef] [PubMed]
- Hodes, G.; Bangasser, D.; Sotiropoulos, I.; Kokras, N.; Dalla, C. Sex Differences in Stress Response: Classical Mechanisms and Beyond. Current Neuropharmacology 2023, 22. [Google Scholar] [CrossRef] [PubMed]
- Misiak, B.; Łoniewski, I.; Marlicz, W.; Frydecka, D.; Szulc, A.; Rudzki, L.; et al. The HPA axis dysregulation in severe mental illness: Can we shift the blame to gut microbiota? Progress in Neuro-Psychopharmacology and Biological Psychiatry 2020, 102, 109951. [Google Scholar] [CrossRef] [PubMed]
- Foster, J.A.; Rinaman, L.; Cryan, J.F. Stress & the gut-brain axis: Regulation by the microbiome. Neurobiology of Stress 2017, 7, 124–136. [Google Scholar] [CrossRef]
- El Marzouki, H.; Aboussaleh, Y.; Najimi, M.; Chigr, F.; Ahami, A. Effect of Cold Stress on Neurobehavioral and Physiological Parameters in Rats. Frontiers in Physiology 2021, 12, 660124. [Google Scholar] [CrossRef]
- Vittengl, J.R. Are body weight changes depressogenic? Even intentional weight loss correlates with increased depressive symptomatology among overweight or obese adults in the United States. Journal of Affective Disorders Reports 2022, 10, 100441. [Google Scholar] [CrossRef]
- Werner, A.M.; Ernst, M.; Brähler, E.; Tibubos, A.N.; Otten, D.; Reiner, I.; et al. The association of depressive symptoms and body weight change in midlife - Results from the Gutenberg Health Study in Germany. Journal of Affective Disorders 2023, 332, 115–124. [Google Scholar] [CrossRef]
- Ma, Y.; Fei, Y.; Han, X.; Liu, G.; Fang, J. Lactobacillus plantarum Alleviates Obesity by Altering the Composition of the Gut Microbiota in High-Fat Diet-Fed Mice. Front Nutr 2022, 9, 947367. [Google Scholar] [CrossRef] [PubMed]
- Rahayu, E.S.; Mariyatun, M.; Putri Manurung, N.E.; Hasan, P.N.; Therdtatha, P.; Mishima, R.; et al. Effect of probiotic Lactobacillus plantarum Dad-13 powder consumption on the gut microbiota and intestinal health of overweight adults. World J Gastroenterol 2021, 27, 107–128. [Google Scholar] [CrossRef]
- Rousseaux, C.G.; Bracken, W.M.; Guionaud, S. Chapter 1 - Overview of Drug Development. In Haschek and Rousseaux' s Handbook of Toxicologic Pathology (Fourth Edition); Haschek, W.M., Rousseaux, C.G., Wallig, M.A., Bolon, B., Bolon, B., Heinz-Taheny, K.M., et al., Eds.; Academic Press, 2023; pp. 3–48. [Google Scholar] [CrossRef]
- Gilsanz, P.; Karter, A.J.; Beeri, M.S.; Quesenberry, C.P.; Jr Whitmer, R.A. The Bidirectional Association Between Depression and Severe Hypoglycemic and Hyperglycemic Events in Type 1 Diabetes. Diabetes Care 2018, 41, 446–452. [Google Scholar] [CrossRef]
- Iqbal, A.; Prince, L.R.; Novodvorsky, P.; Bernjak, A.; Thomas, M.R.; Birch, L.; et al. Effect of Hypoglycemia on Inflammatory Responses and the Response to Low-Dose Endotoxemia in Humans. J Clin Endocrinol Metab 2019, 104, 1187–1199. [Google Scholar] [CrossRef]
- Yohei, K.; Masanori, I.; Hiroki, F.; Toshiaki, O.; Shinako, K.; Hitoshi, I.; et al. Association of severe hypoglycemia with depressive symptoms in patients with type 2 diabetes: the Fukuoka Diabetes Registry. BMJ Open Diabetes Research & Care 2015, 3, e000063. [Google Scholar] [CrossRef] [PubMed]
- Györfi, O.; Nagy, H.; Bokor, M.; Moustafa, A.A.; Rosenzweig, I.; Kelemen, O.; et al. Reduced CA2-CA3 Hippocampal Subfield Volume Is Related to Depression and Normalized by l-DOPA in Newly Diagnosed Parkinson's Disease. Frontiers in Neurology 2017, 8, 84. [Google Scholar] [CrossRef] [PubMed]
- van Gemert, N.G.; Carvalho, D.M.M.; Karst, H.; van der Laan, S.; Zhang, M.; Meijer, O.C.; et al. Dissociation between Rat Hippocampal CA1 and Dentate Gyrus Cells in Their Response to Corticosterone: Effects on Calcium Channel Protein and Current. Endocrinology 2009, 150, 4615–4624. [Google Scholar] [CrossRef] [PubMed]
- Inserra, A.; Mastronardi, C.; Rogers, G.; Licinio, J.; Wong, M.-L. Neuroimmunomodulation in Major Depressive Disorder: Focus on Caspase 1, Inducible Nitric Oxide Synthase, and Interferon-Gamma. Molecular Neurobiology 2019, 56. [Google Scholar] [CrossRef] [PubMed]
- Hu, X.; Pang, H.; Liu, J.; Wang, Y.; Lou, Y.; Zhao, Y. A network medicine-based approach to explore the relationship between depression and inflammation. Frontiers in Psychiatry 2023, 14, 1184188. [Google Scholar] [CrossRef] [PubMed]
- Amodeo, G.; Trusso, M.A.; Fagiolini, A. Depression and inflammation: Disentangling a clear yet complex and multifaceted link. Neuropsychiatry 2017, 7, 448–457. [Google Scholar] [CrossRef]
- Moon, Y.K.; Kim, H.; Kim, S.; Lim, S.W.; Kim, D.K. Influence of antidepressant treatment on SLC6A4 methylation in Korean patients with major depression. Am J Med Genet B Neuropsychiatr Genet 2023, 192, 28–37. [Google Scholar] [CrossRef] [PubMed]
- Eslami, M.; Monemi, M.; Nazari, M.A.; Azami, M.H.; Shariat Rad, P.; Oksenych, V.; et al. The Anti-Inflammatory Potential of Tricyclic Antidepressants (TCAs): A Novel Therapeutic Approach to Atherosclerosis Pathophysiology. Pharmaceuticals 2025, 18, 197. [Google Scholar] [CrossRef] [PubMed]
- Gan, Y.L.; Wang, C.Y.; He, R.H.; Hsu, P.C.; Yeh, H.H.; Hsieh, T.H.; et al. FKBP51 mediates resilience to inflammation-induced anxiety through regulation of glutamic acid decarboxylase 65 expression in mouse hippocampus. J Neuroinflammation 2022, 19, 152. [Google Scholar] [CrossRef] [PubMed]
Figure 1.
Experimental design and timeline.
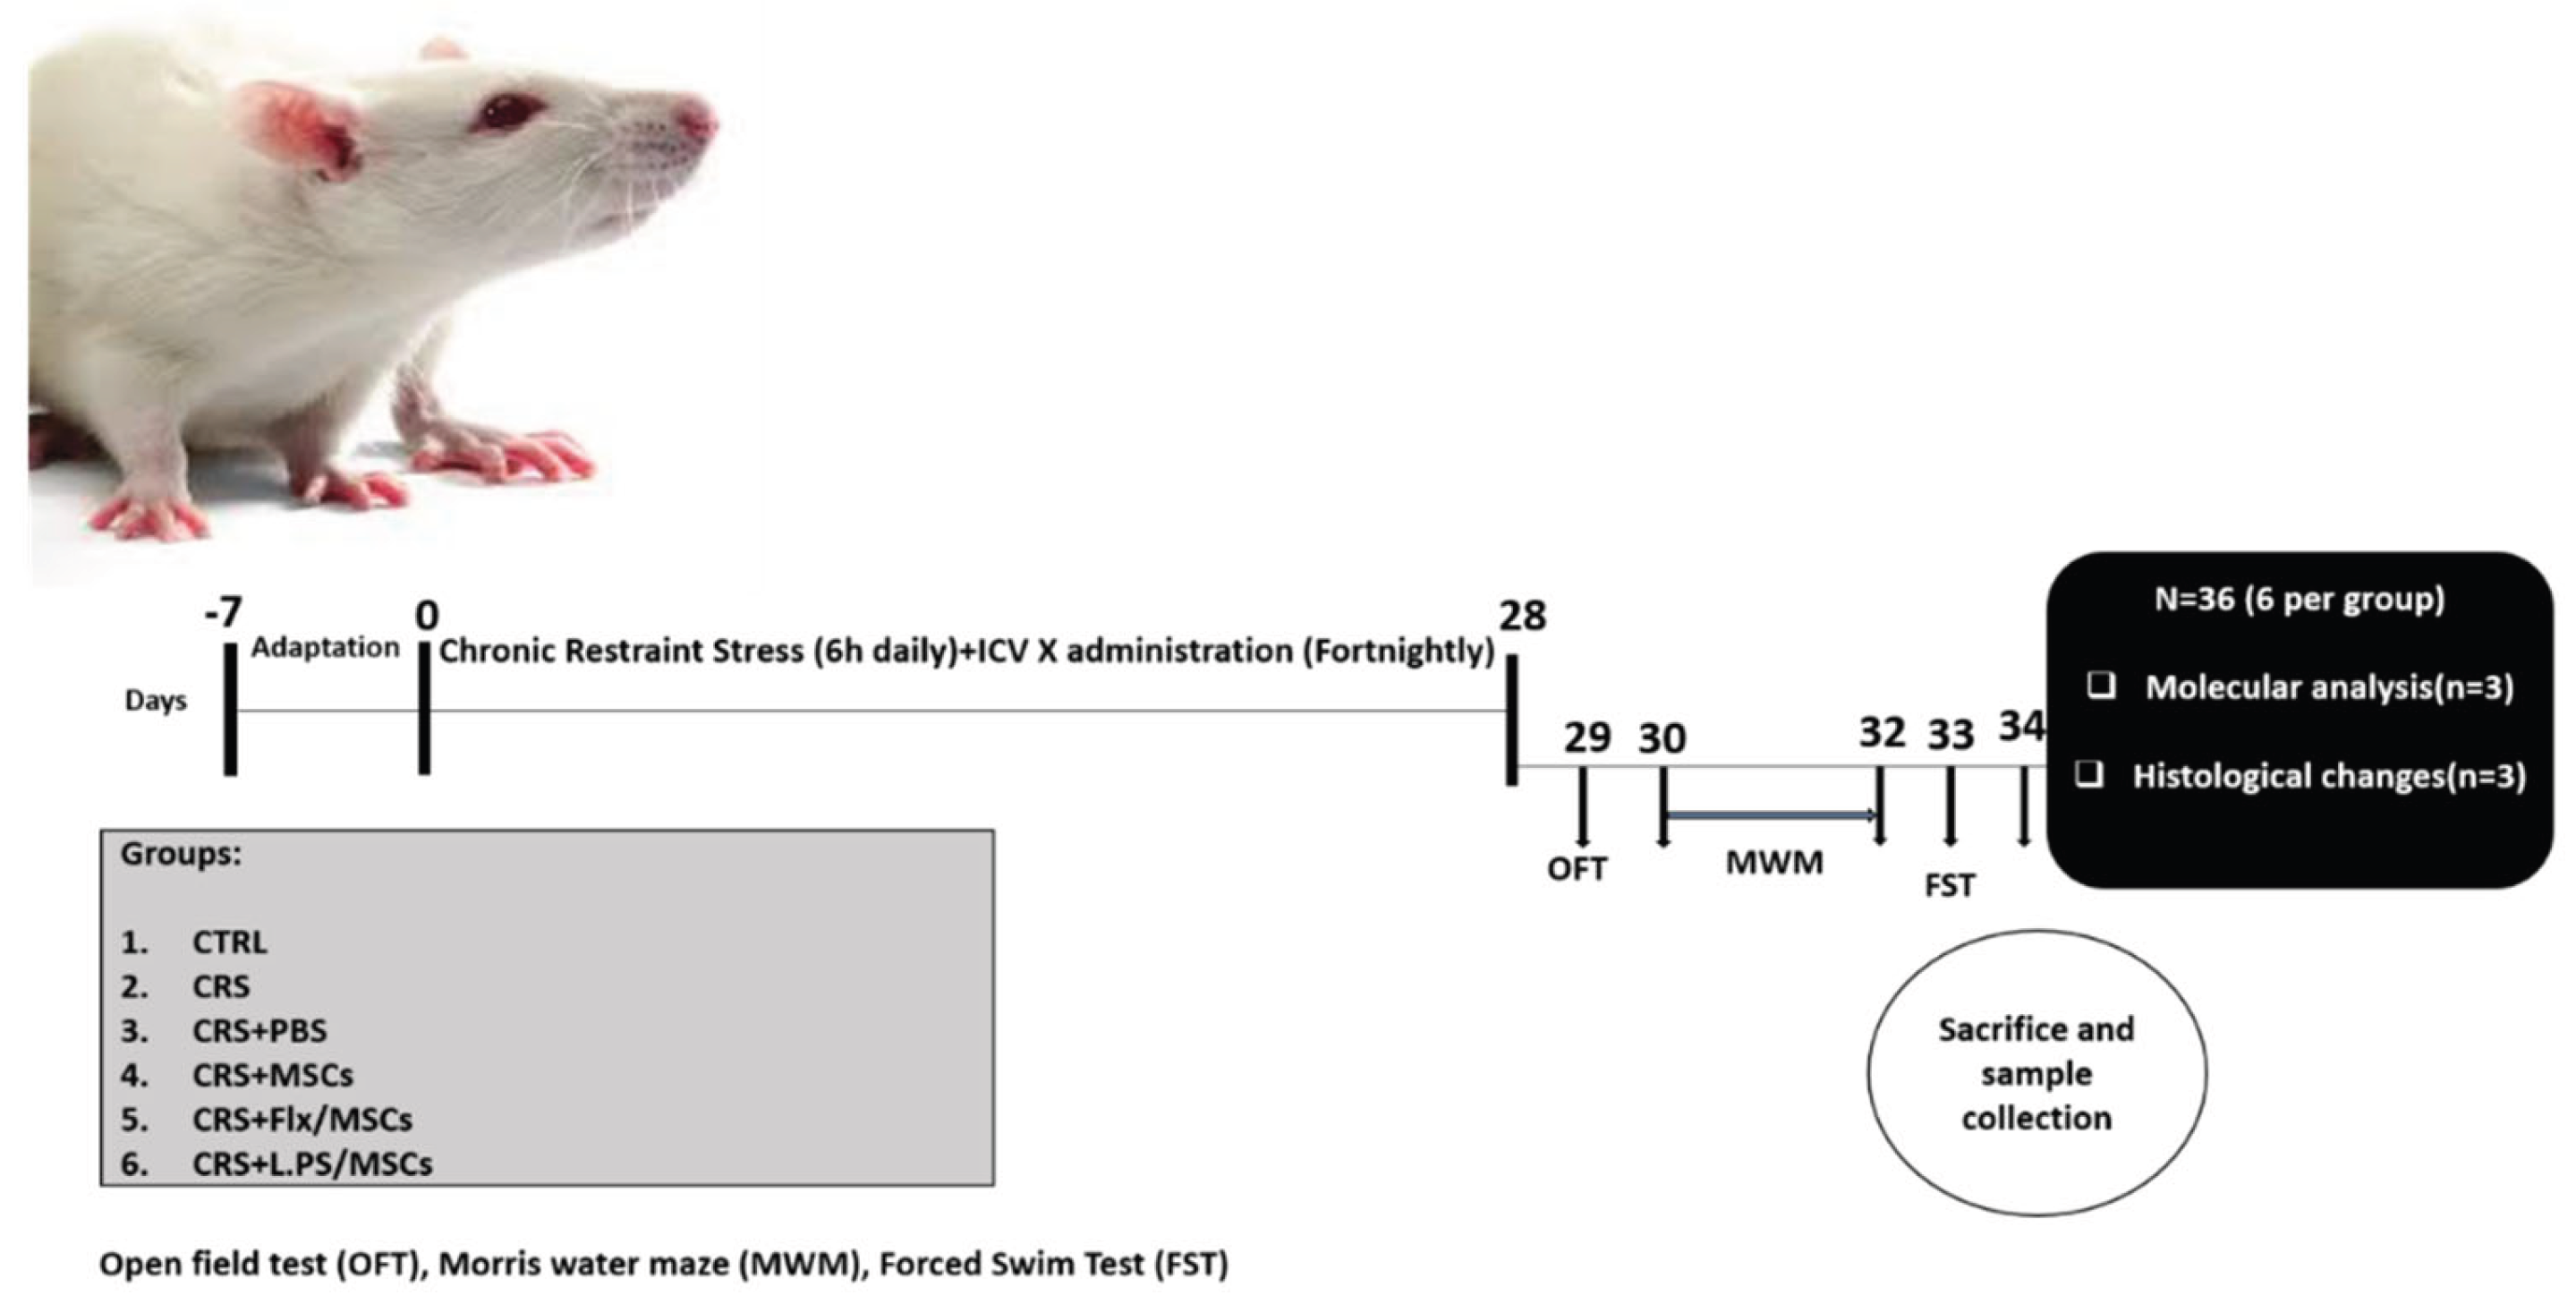
Figure 2.
The survival rate of BM-MSCs by MTT assay. The viability percentages of BM-MSCs after (A, B) 24 and (C, D) 48 hours of treatment with Fluoxetine and L.PS, respectively. Appropriate doses were 15 µM for Fluoxetine and 10 µl/ml for L.PS after 24 hours of BM-MSCs treatment (p < 0.05). After 48 hours, a significant decrease was identified in the cells' survival rate in all concentrations. Data are expressed as the mean ± SEM. BM-MSCs: Bone marrow mesenchymal stem cells, L.PS: Lactobacillus plantarum supernatant.
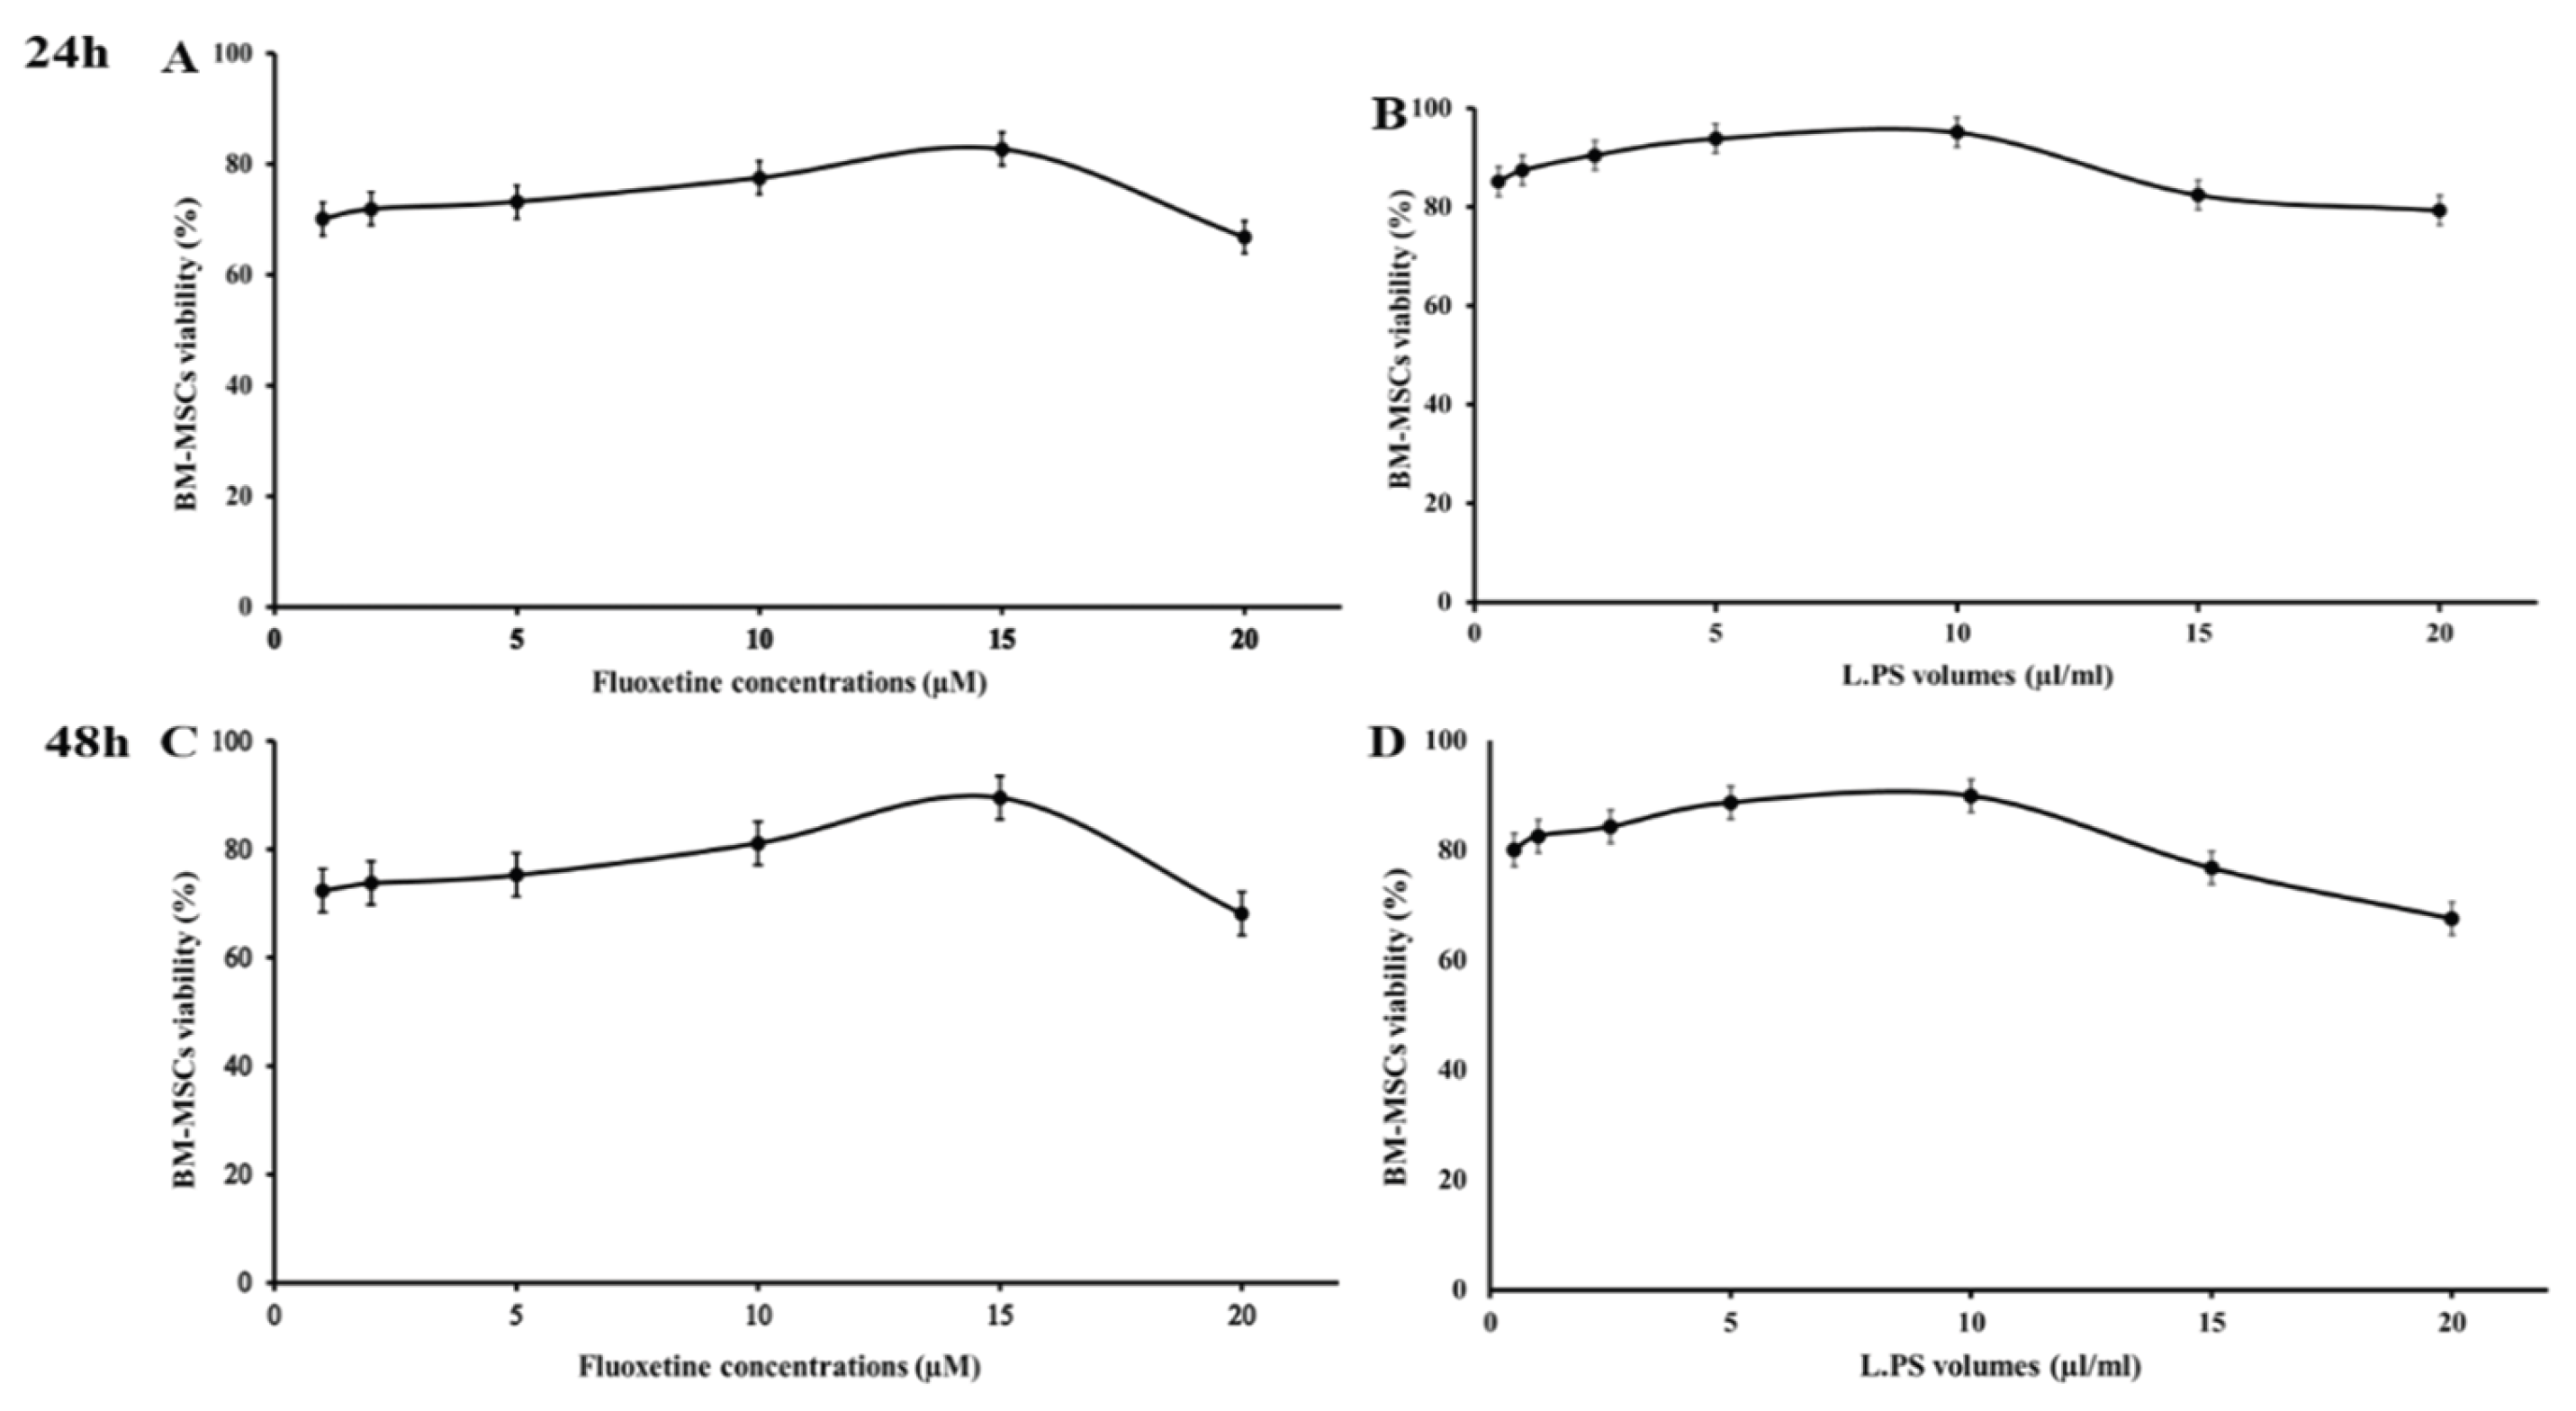
Figure 3.
Effect of various treatments on physiological parameters, including serum corticosterone (A), blood glucose levels (B), body weight changes (C), and weight gain (D) in different groups of rats. All values are represented as mean ± SEM, * p < 0.05 vs. control, and # p < 0.05 vs. CRS.
Figure 3.
Effect of various treatments on physiological parameters, including serum corticosterone (A), blood glucose levels (B), body weight changes (C), and weight gain (D) in different groups of rats. All values are represented as mean ± SEM, * p < 0.05 vs. control, and # p < 0.05 vs. CRS.
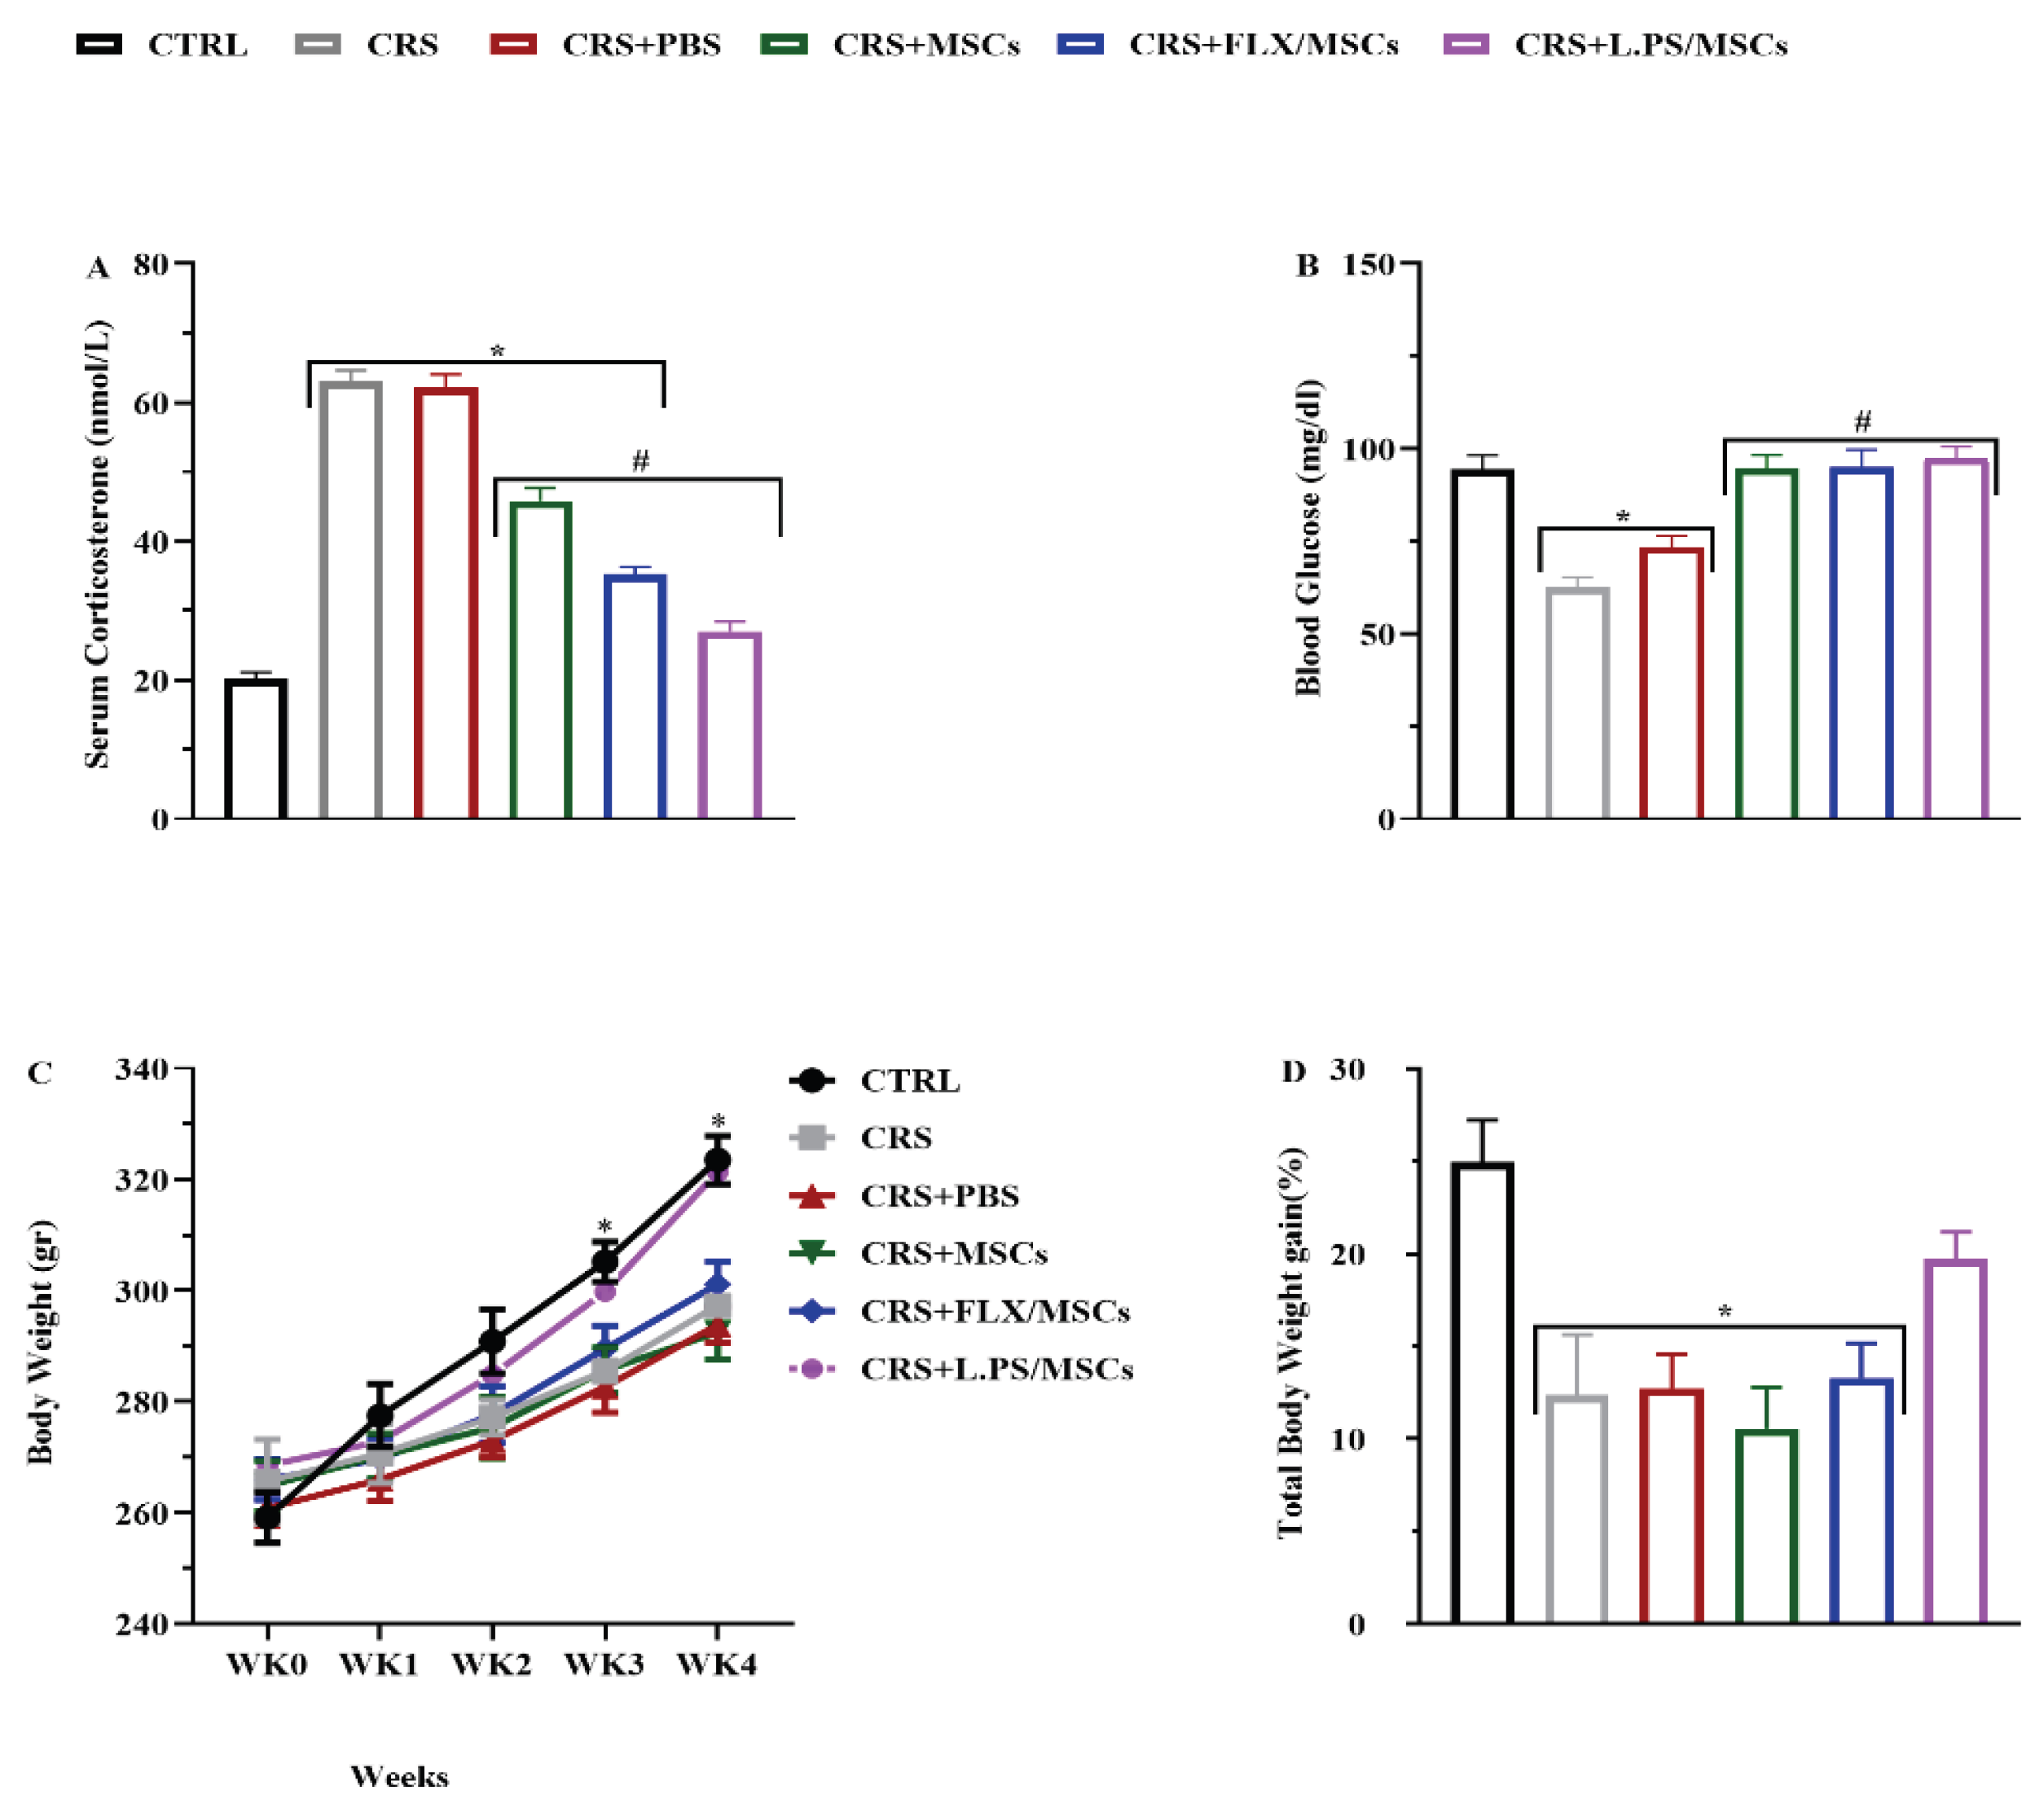
Figure 4.
Antidepressant-like effects of treatment with L.PS pretreated MSCs on depressive behavior in response to the FST. Immobility Latency (A), swimming Time (B), Immobility Duration (C), and Climbing Time (D) were recorded during FST. Columns show the means ± SEM. * p < 0.05 vs. the CTRL group, # p < 0.05 vs. the CRS group; and & p < 0.05 vs. other treatment groups.
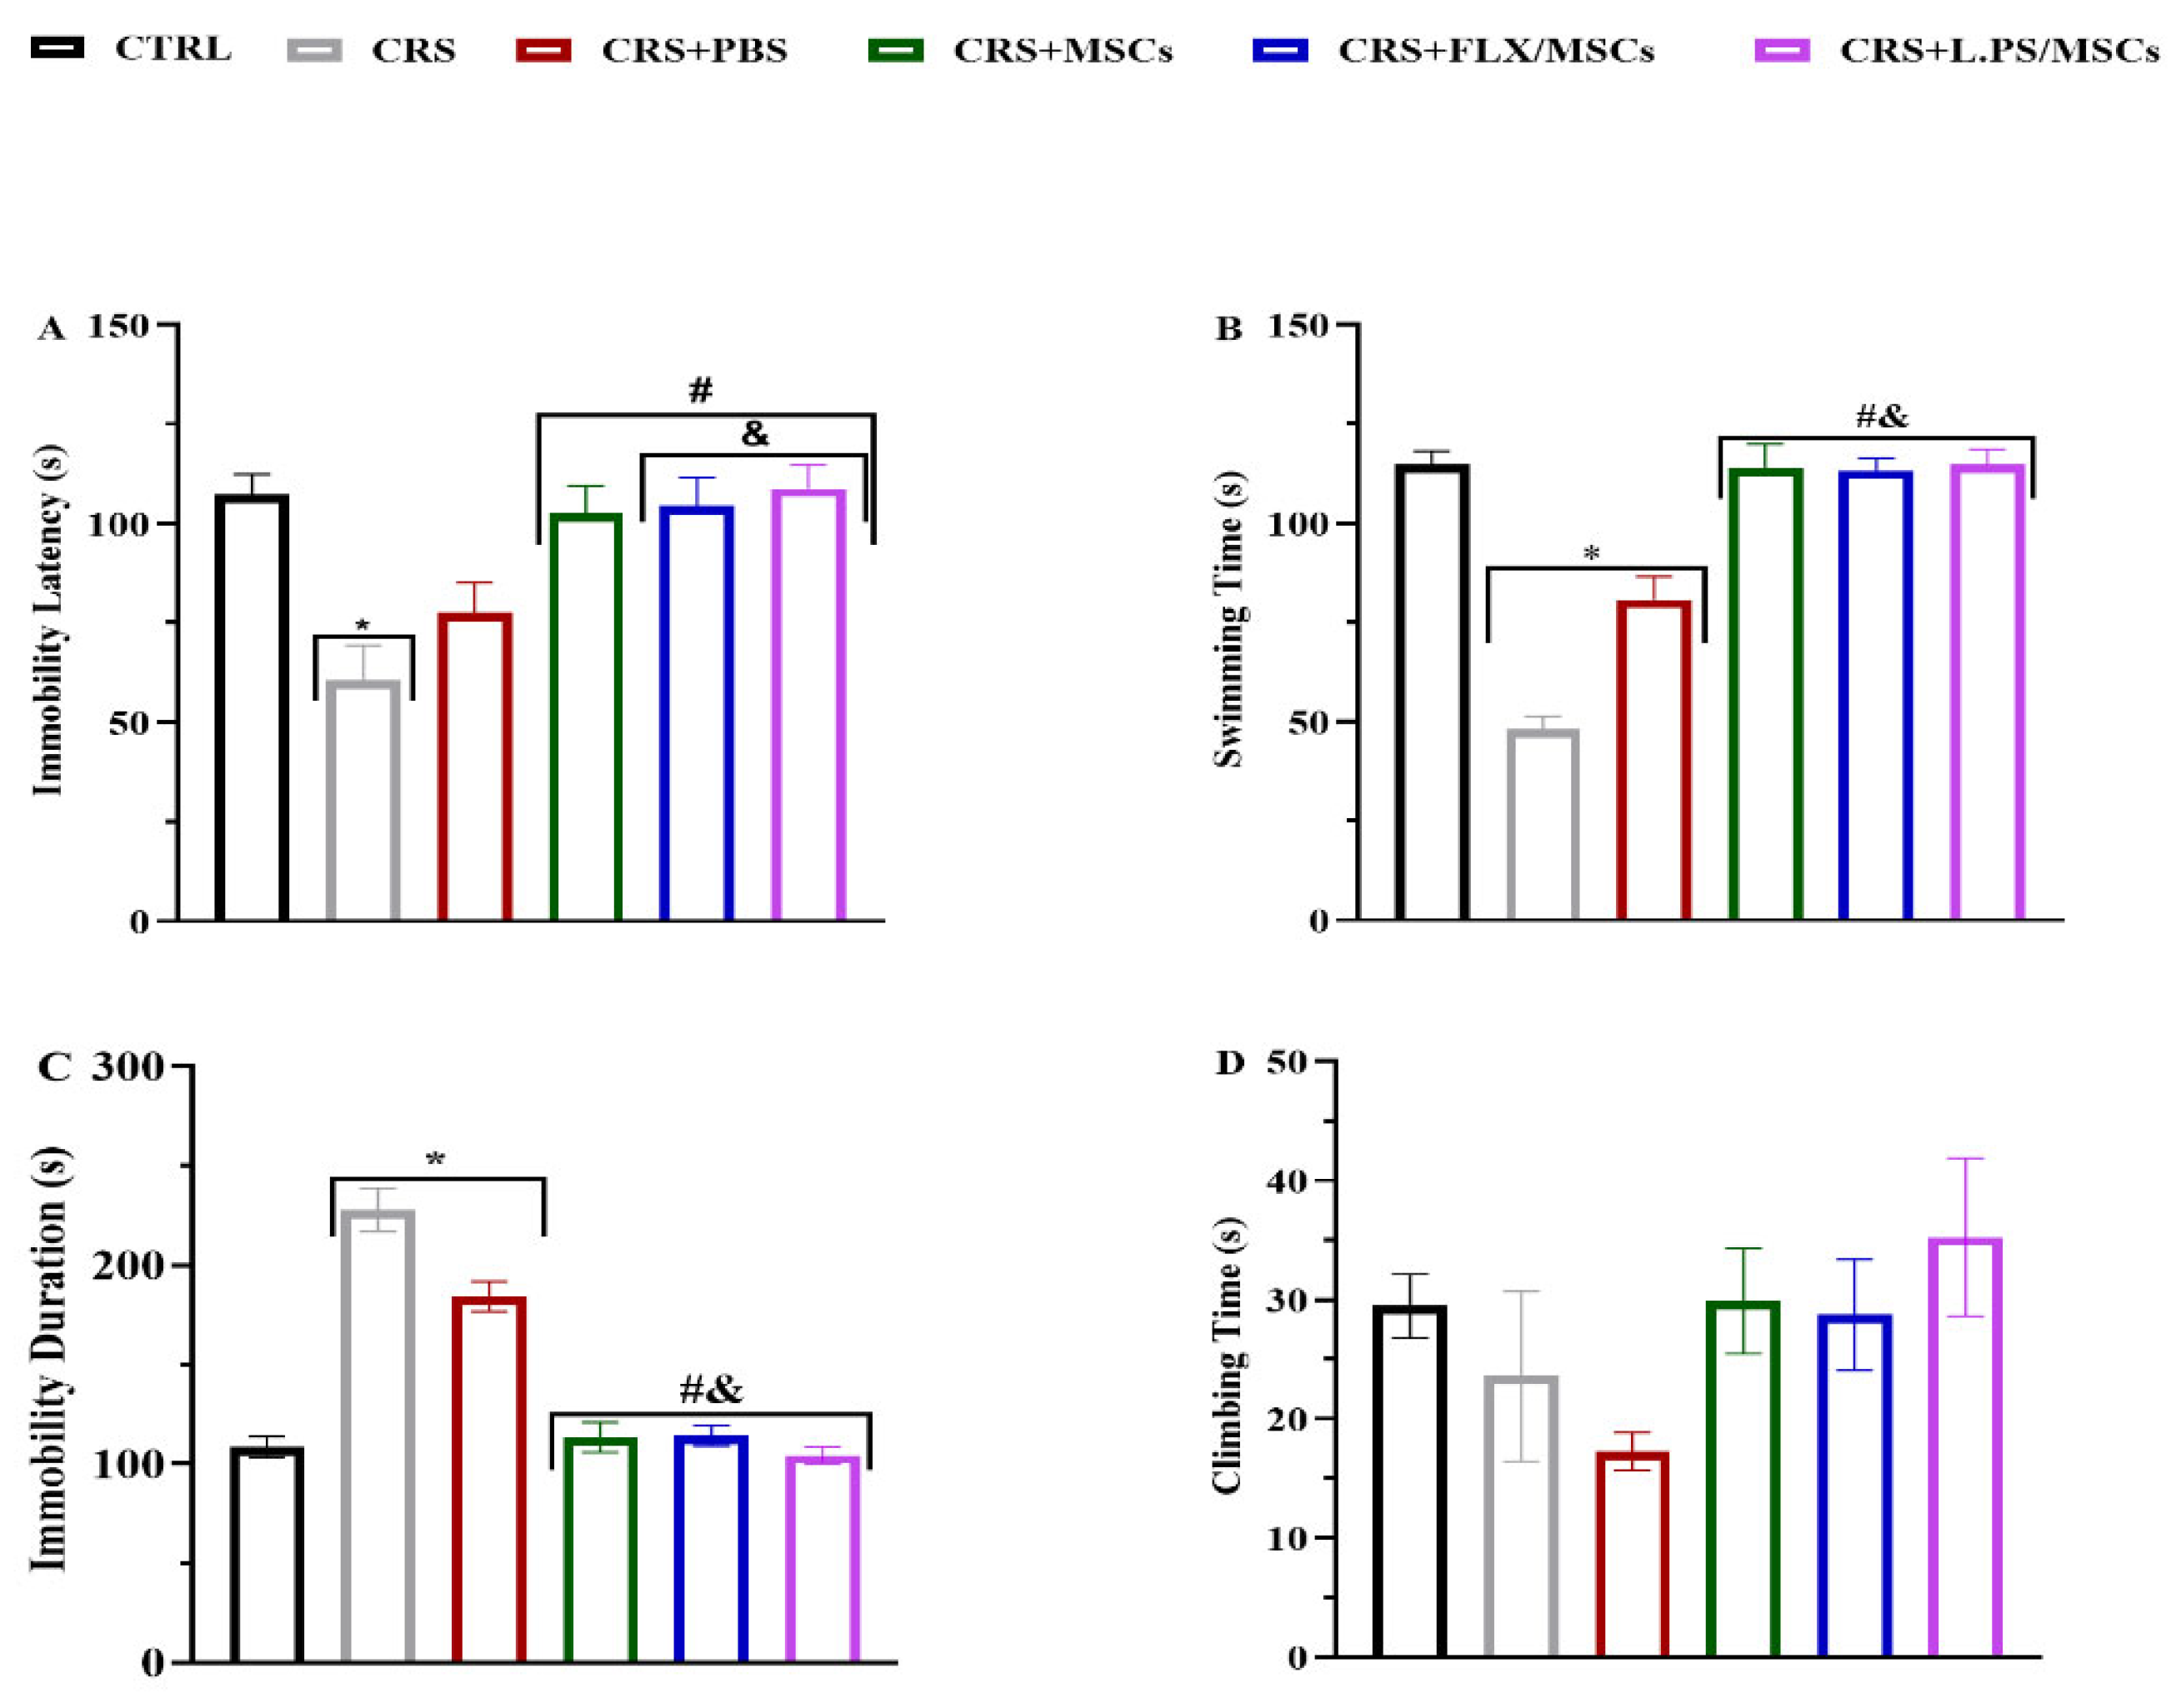
Figure 6.
Effect of various treatments on the NF-κB (A) and Pro-inflammatory cytokines gene expression, including IL-1β (B), IL-6 (C), IL-18 (D) and TNF-α (E) in hippocampal tissues. Data are expressed as the mean ± SEM, * p < 0.05 vs. control, # p < 0.05 vs. CRS, and & p < 0.05 vs. other treatment groups.
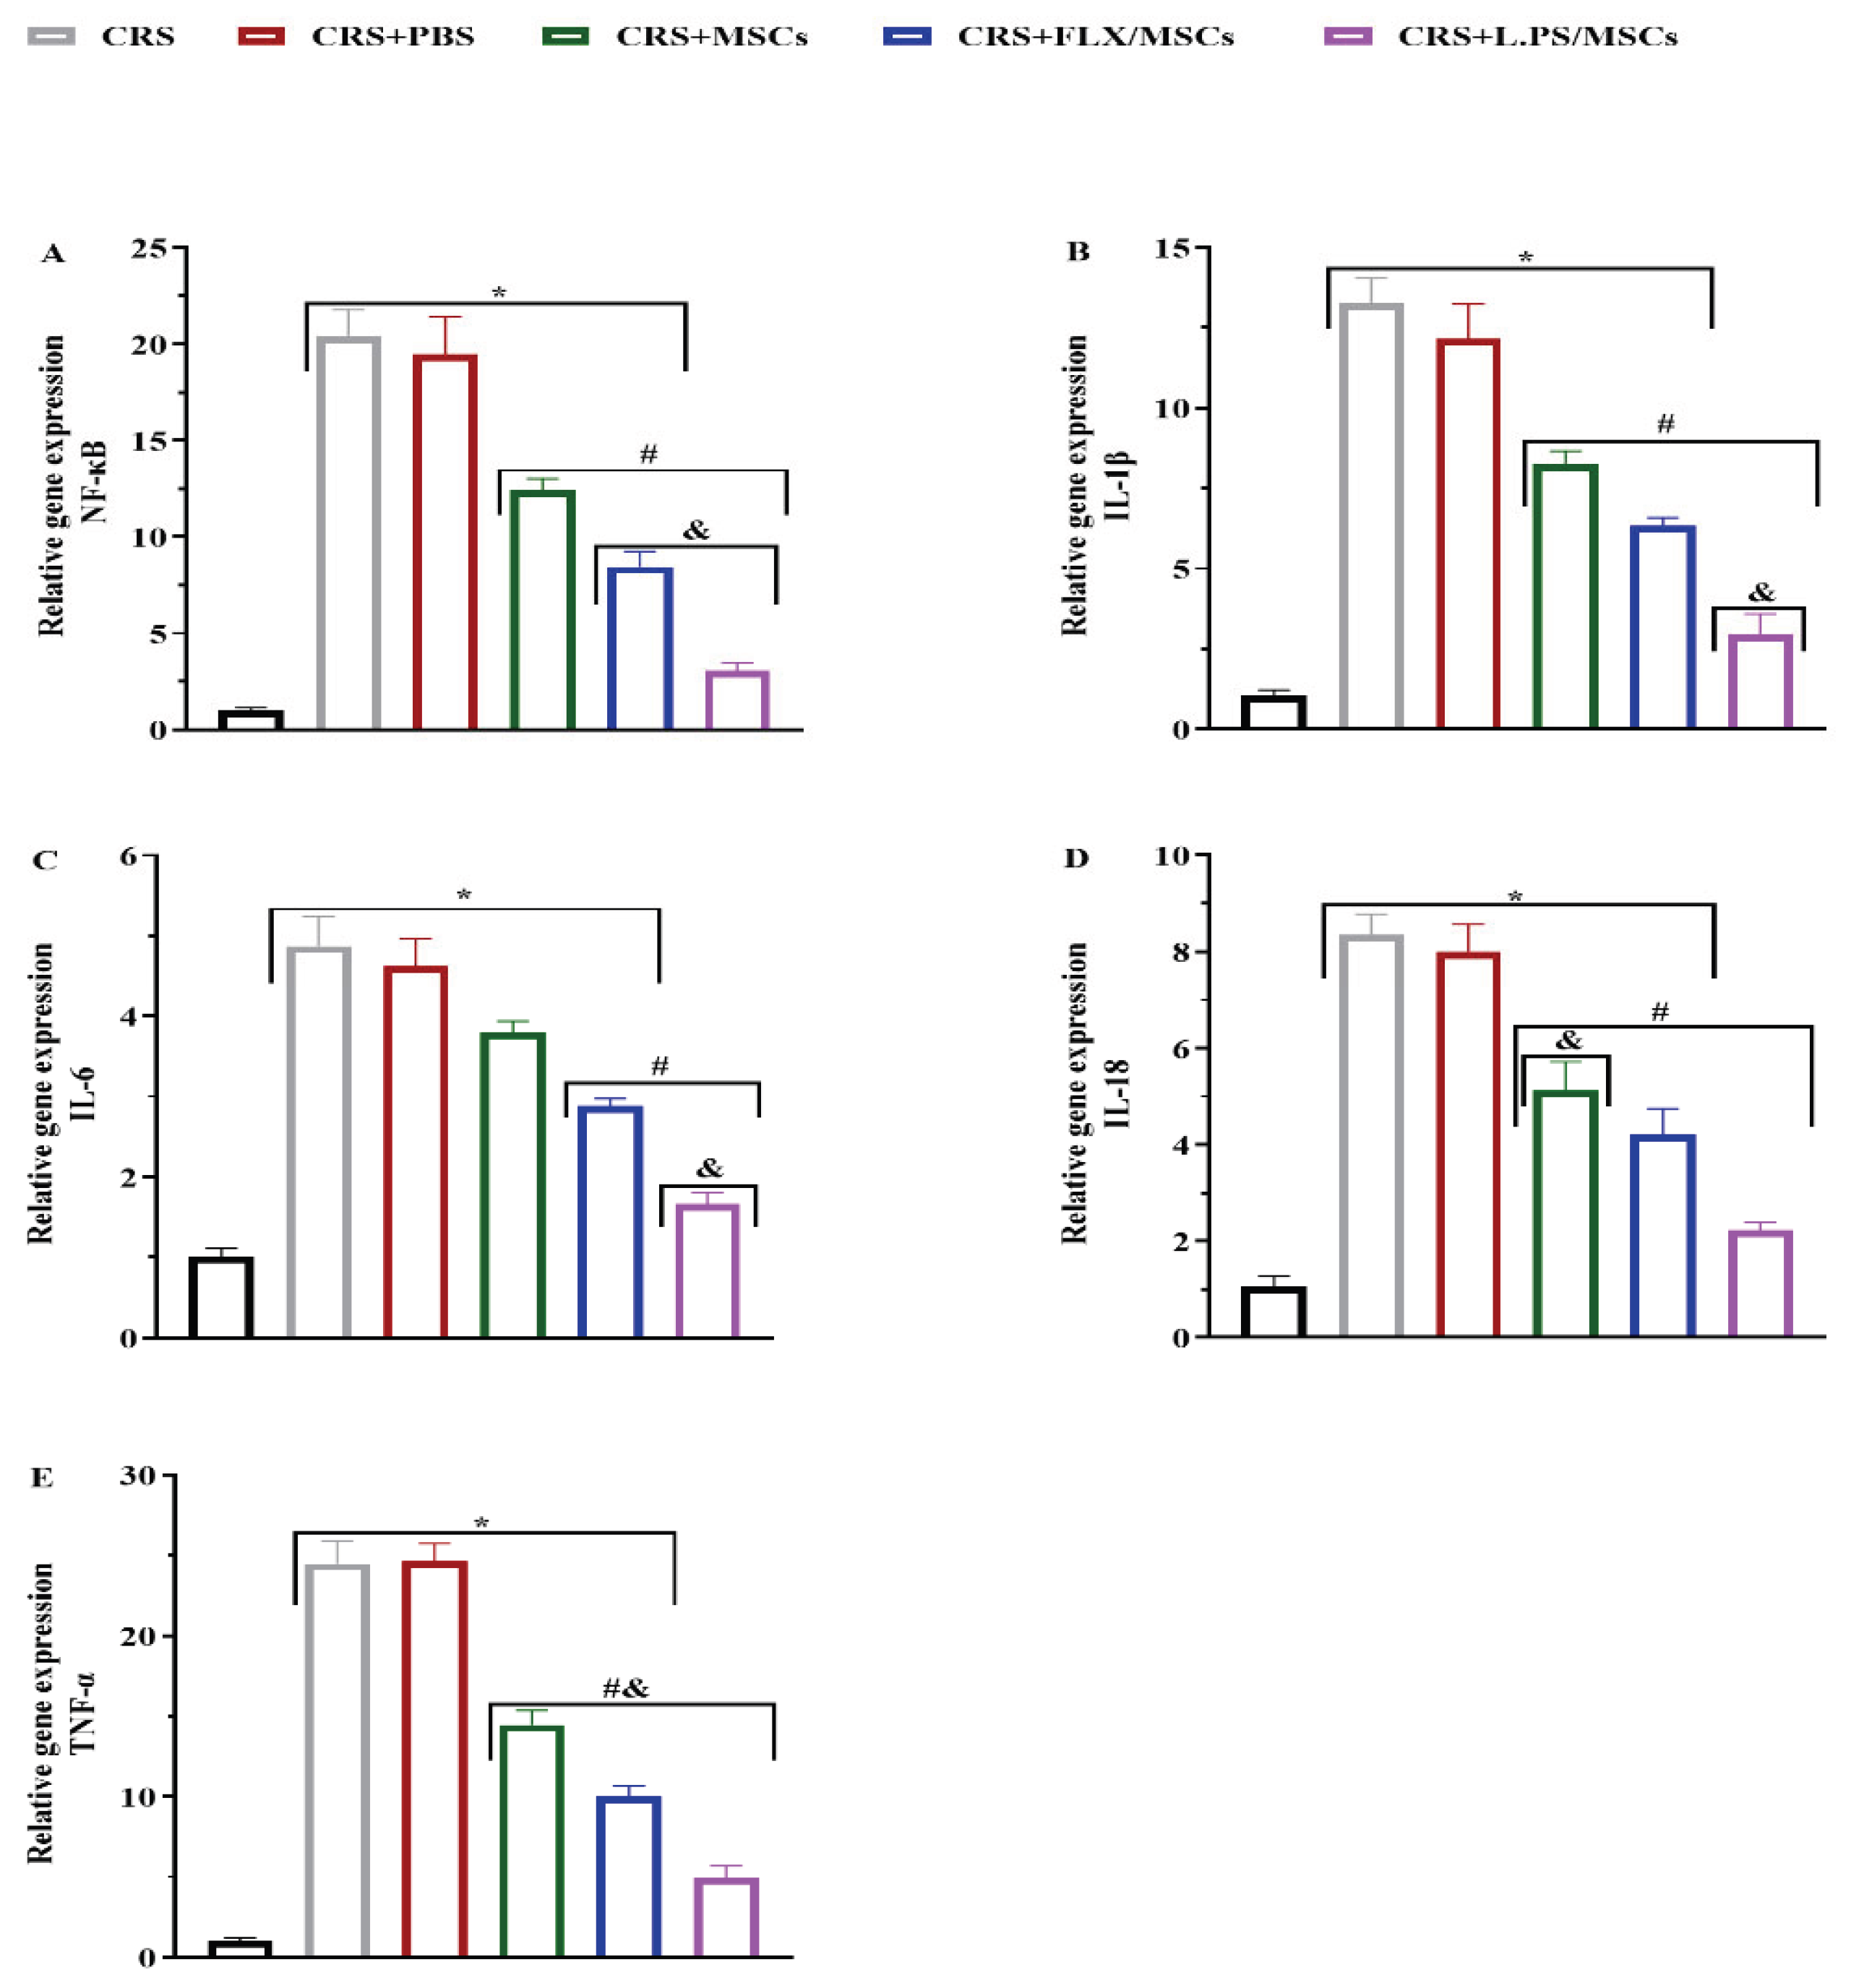
Figure 7.
Effect of various treatments on the Pro-inflammatory cytokines level, including IL-1β (A), IL-6 (B), IL-18 (C) and TNF-α (D) in hippocampal tissues. Data are expressed as the mean ± SEM, * p < 0.05 vs. control, # p < 0.05 vs. CRS, and & p < 0.05 vs. other treatment groups.
Figure 7.
Effect of various treatments on the Pro-inflammatory cytokines level, including IL-1β (A), IL-6 (B), IL-18 (C) and TNF-α (D) in hippocampal tissues. Data are expressed as the mean ± SEM, * p < 0.05 vs. control, # p < 0.05 vs. CRS, and & p < 0.05 vs. other treatment groups.
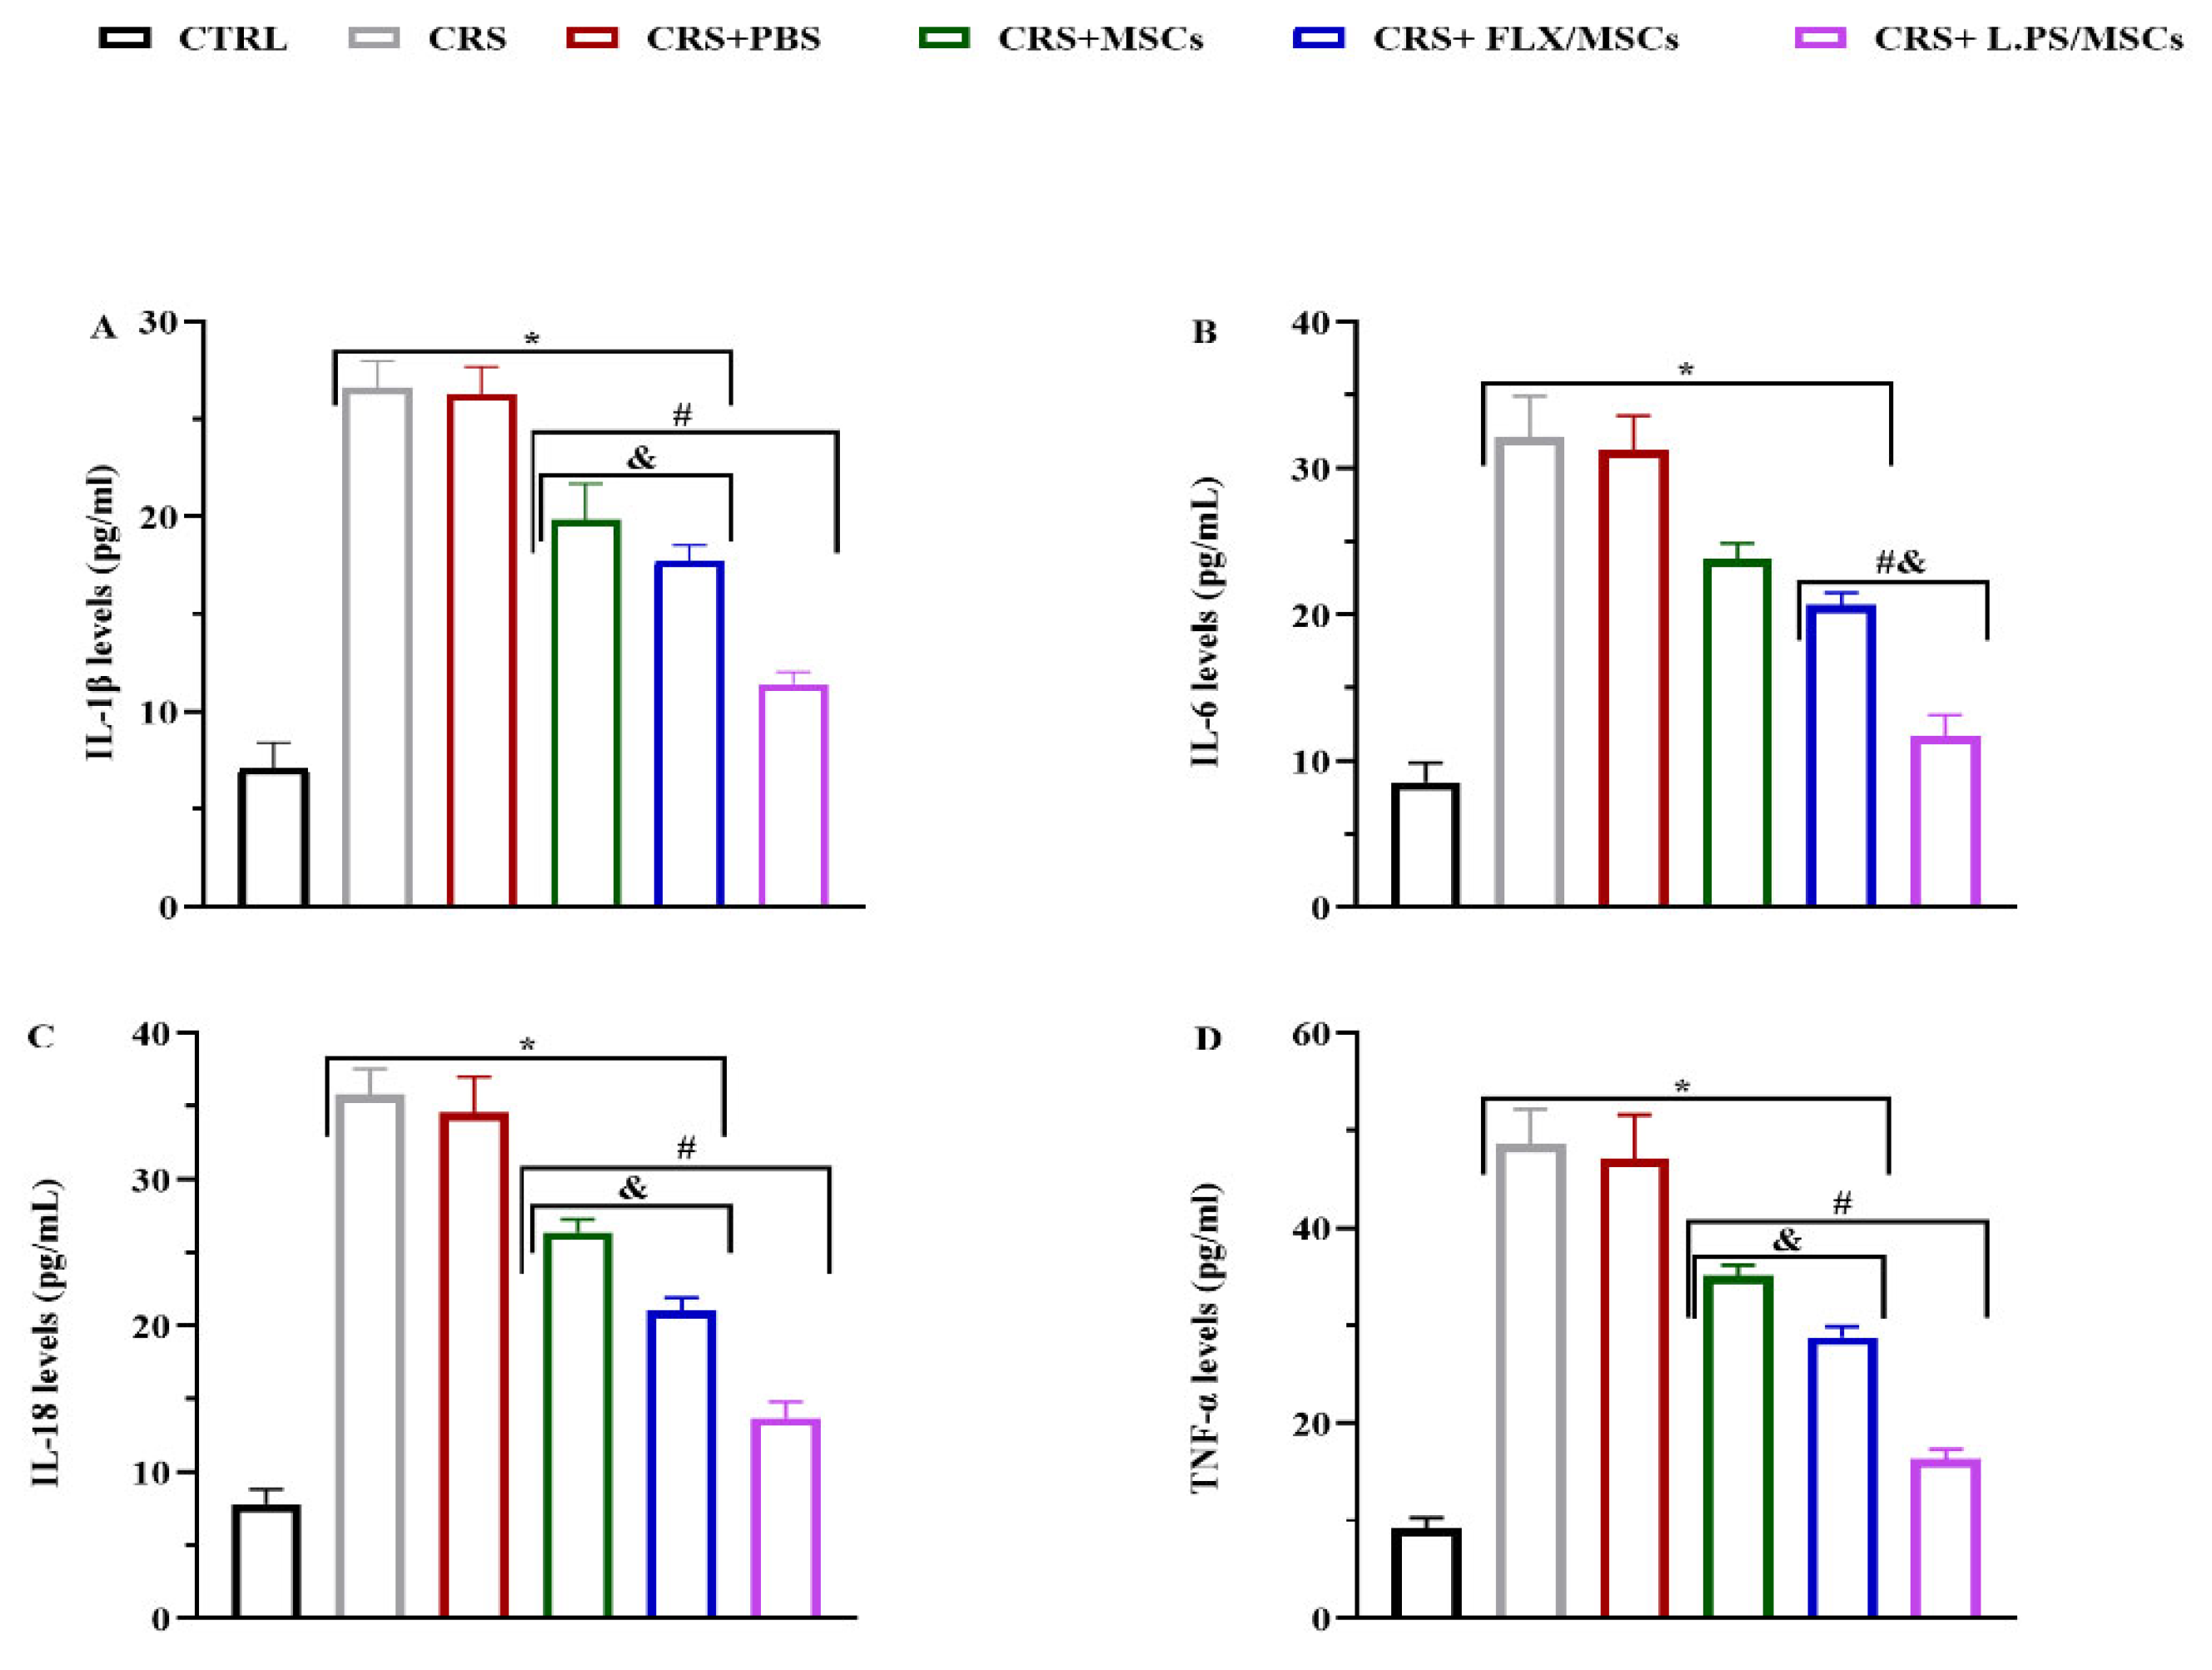
Figure 8.
Percent of dead cells in areas CA1 (A), CA2 (B), and CA3 (C), and cresyl violet staining illustration (D) of the hippocampus. Green arrows point to pyknotic nuclei. Data were shown as mean±SEM. * p < 0.05 vs. control and # p < 0.05 vs. CRS, and & p < 0.05 vs. other treatment groups. ×400 magnification, Scale bars, 100 μm.
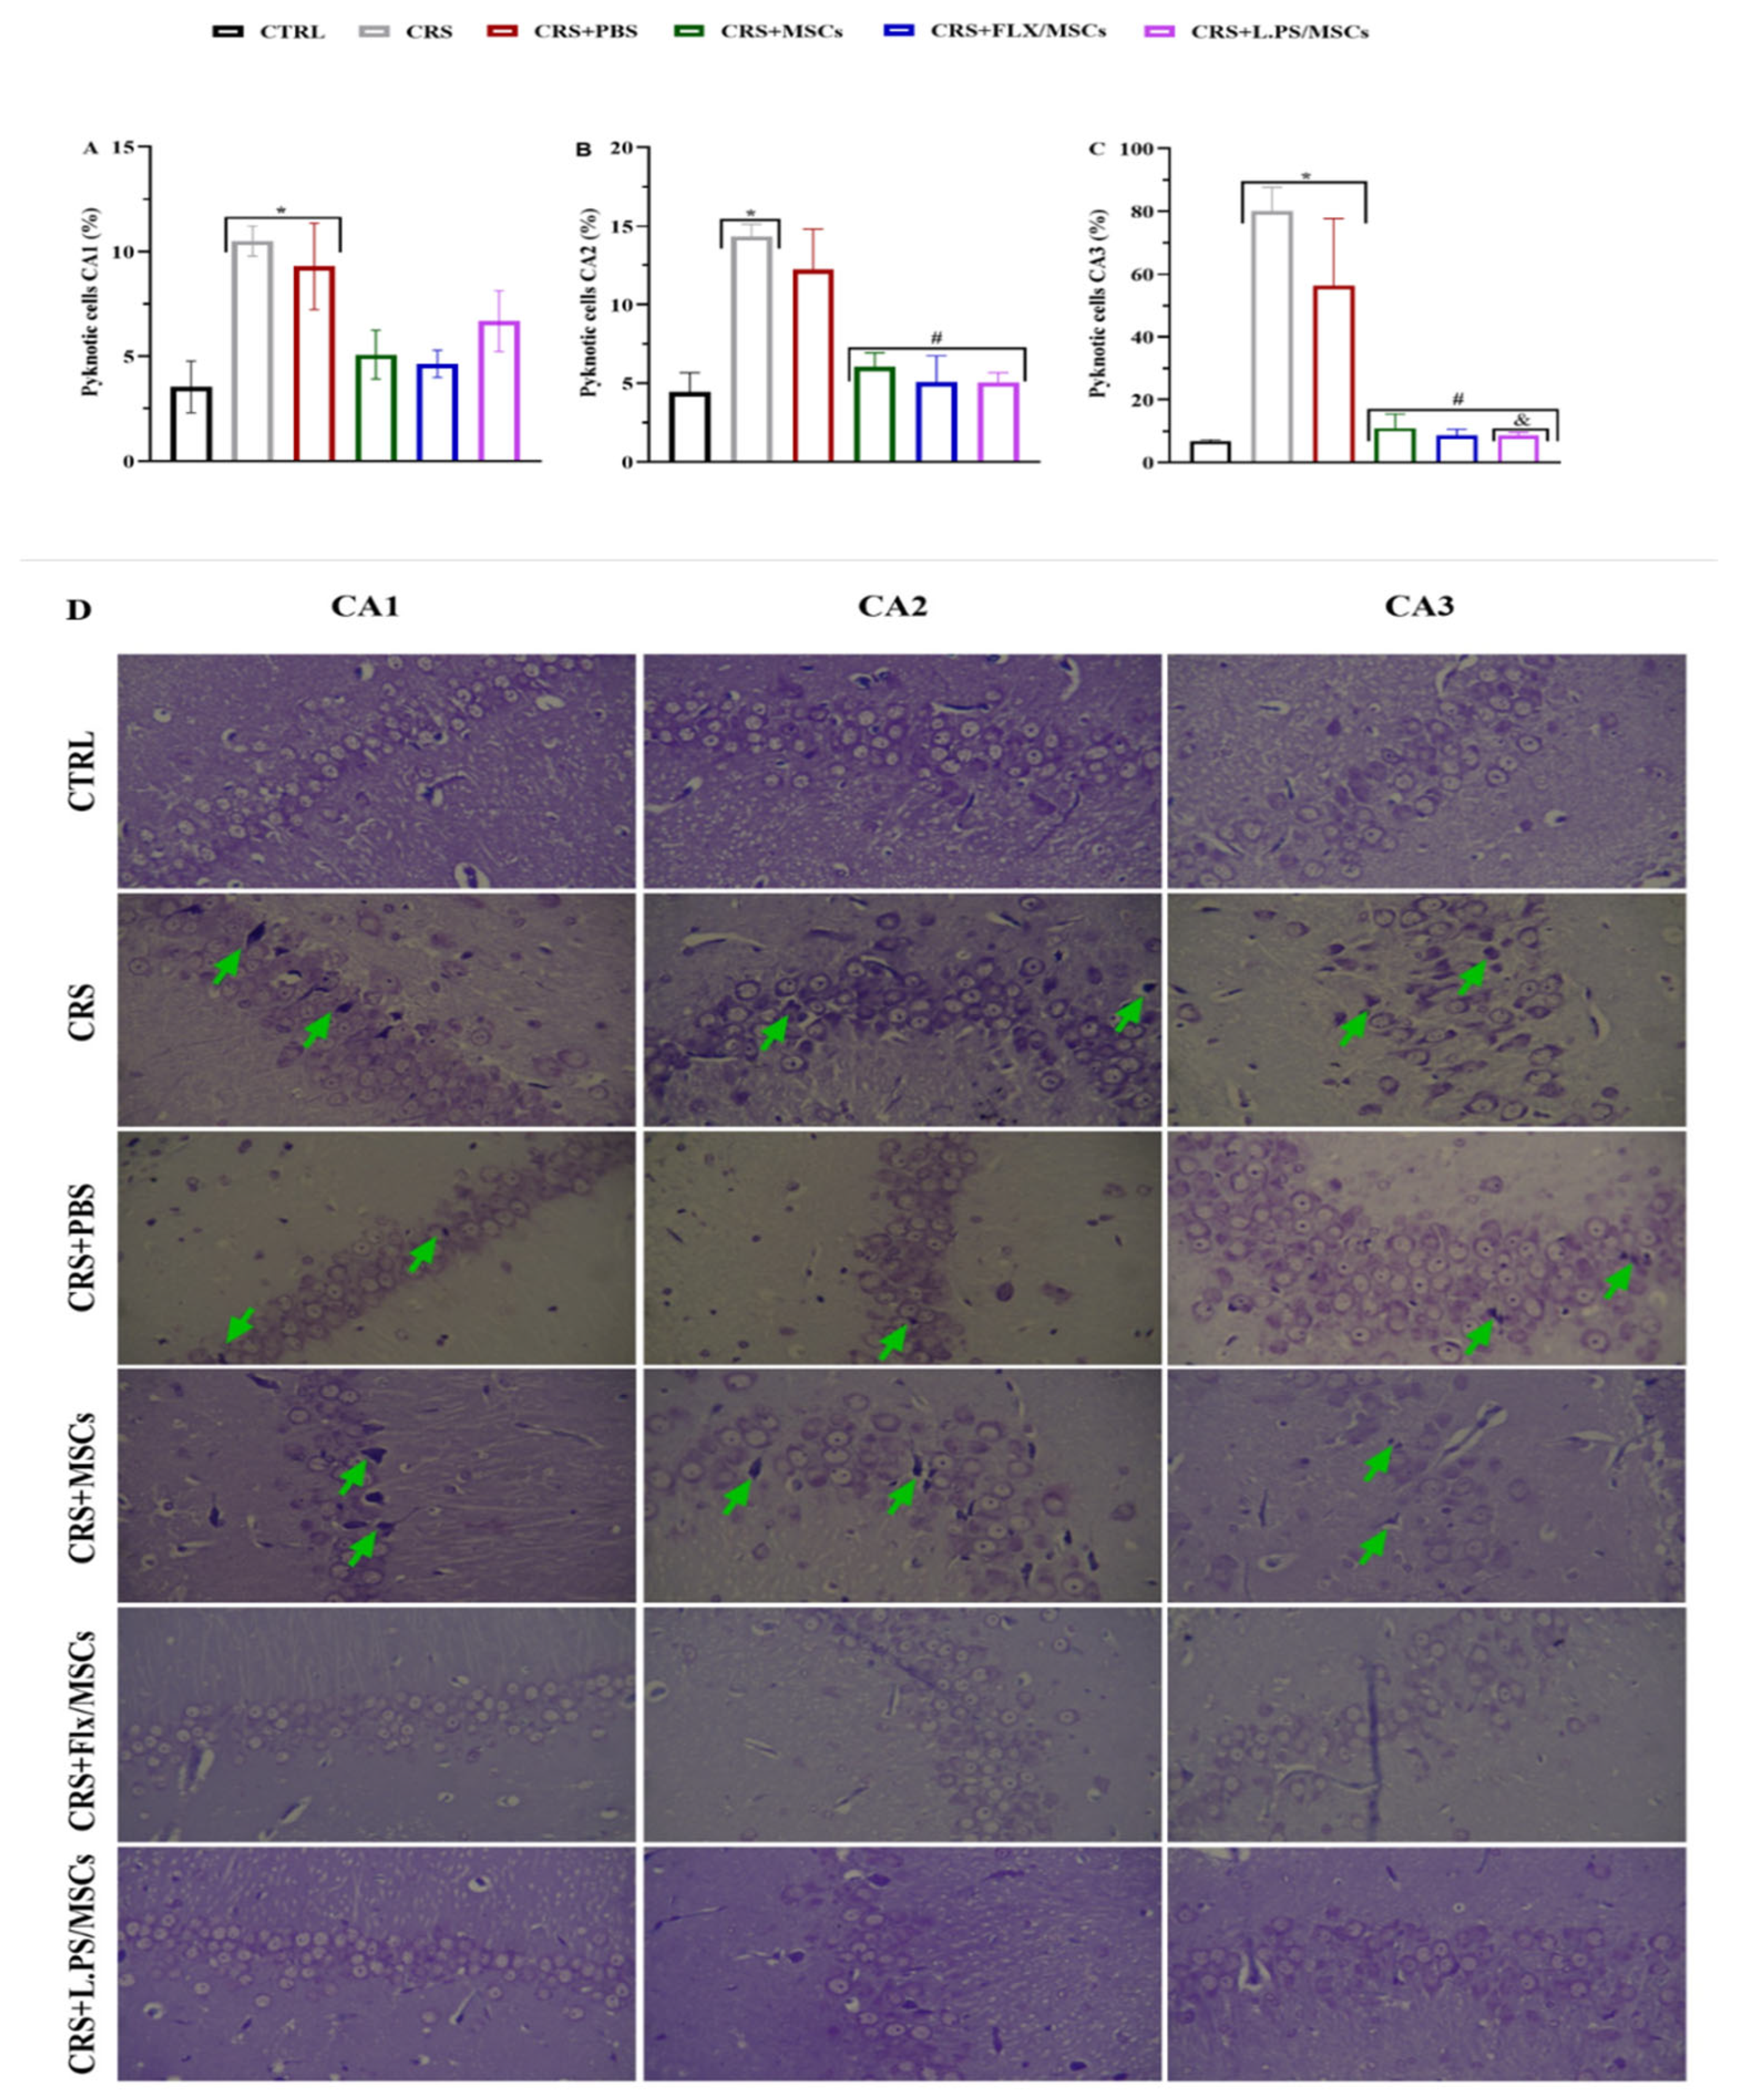
Figure 12.
Correlation Scatter Plots of Inflammatory Biomarkers with SLC6A4 and FKBP5 in MDD. A series of scatter plots generated using GEPIA and GTEx Brain-Hippocampus data, depicting Pearson’s correlation coefficients (R) and p-values between the expression of inflammatory genes and MDD-related genes SLC6A4 and FKBP5. Each plot includes regression lines and R² values, with significant correlations (p < 0.05) highlighted, illustrating potential molecular interactions underlying MDD pathogenesis.
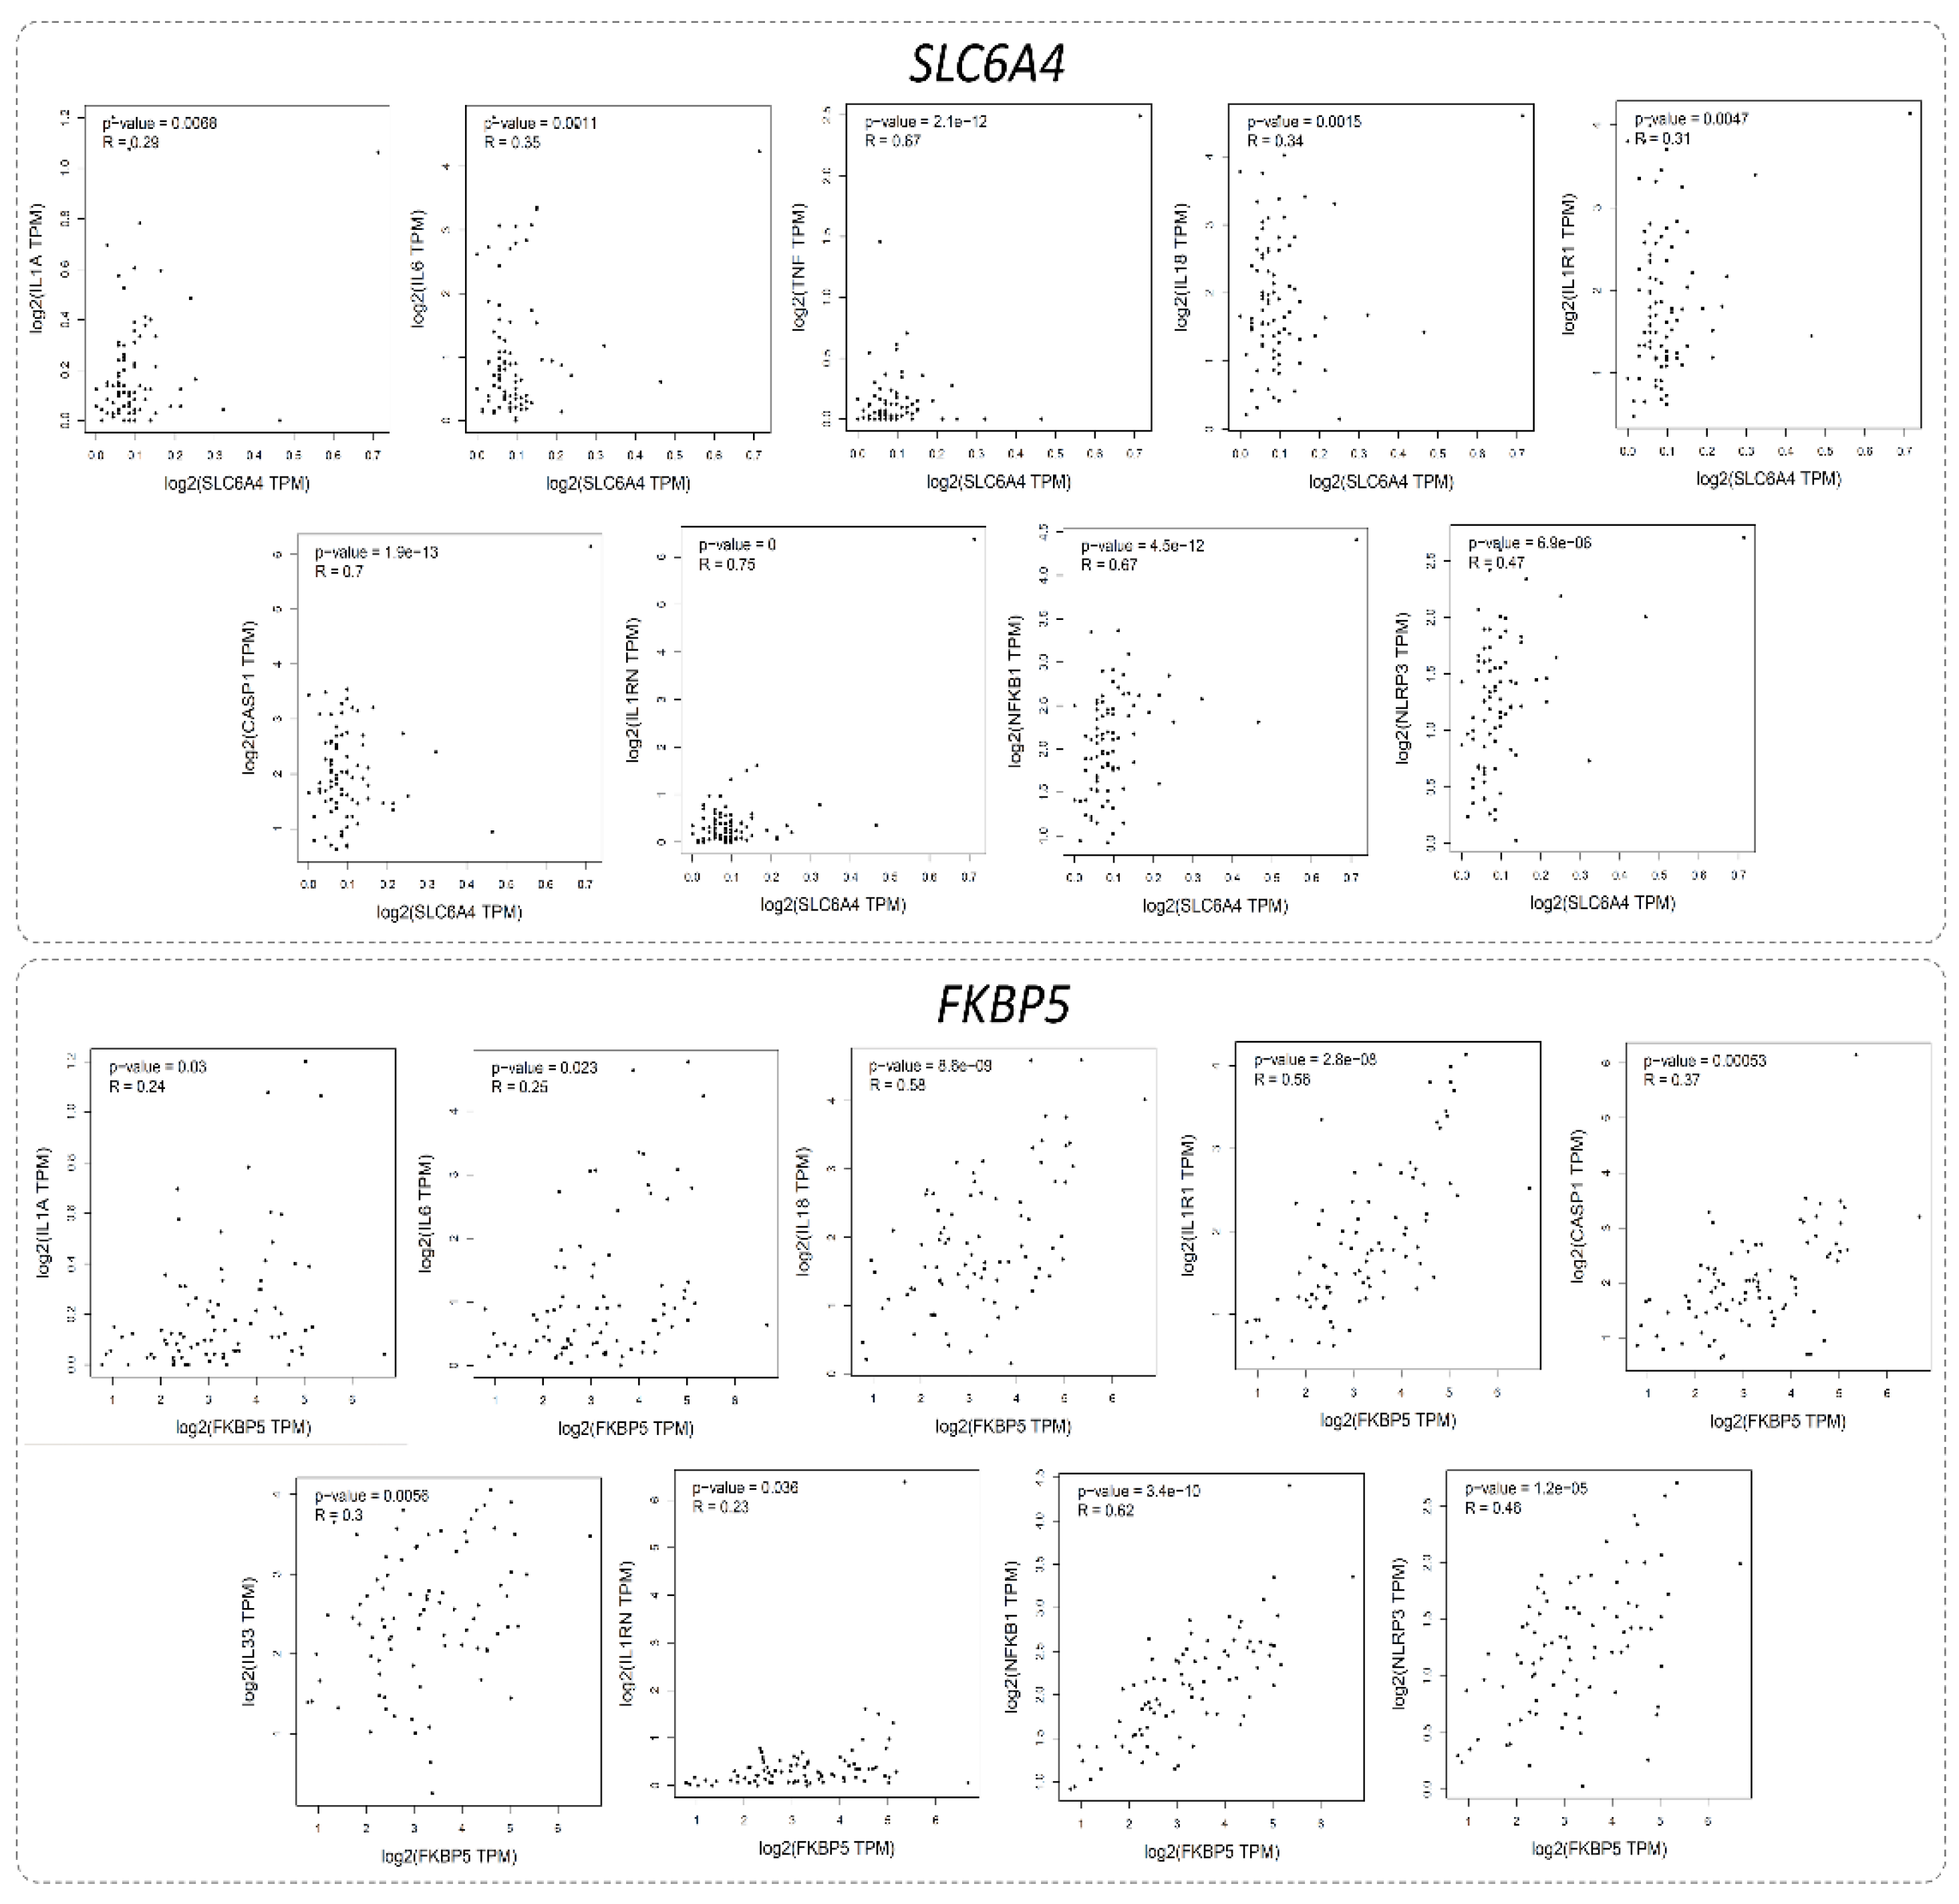
Figure 13.
Differential Expression of Inflammation Genes in MDD vs. HC. (A) Volcano plot with points colored by regulation (green: downregulated, yellow: upregulated, gray: not significant), highlighting key differentially expressed genes. (B) Heatmap of selected genes (TNF, IL18, NLRP3, NFKB1, IL1RN, IL1B, CASP1) across MDD (yellow) and HC (green) samples, showing expression intensity. (C) Boxplots comparing expression levels of IL1RN, IL1B, and CASP1 between HC (green) and MDD (yellow), indicating significant upregulation in MDD.
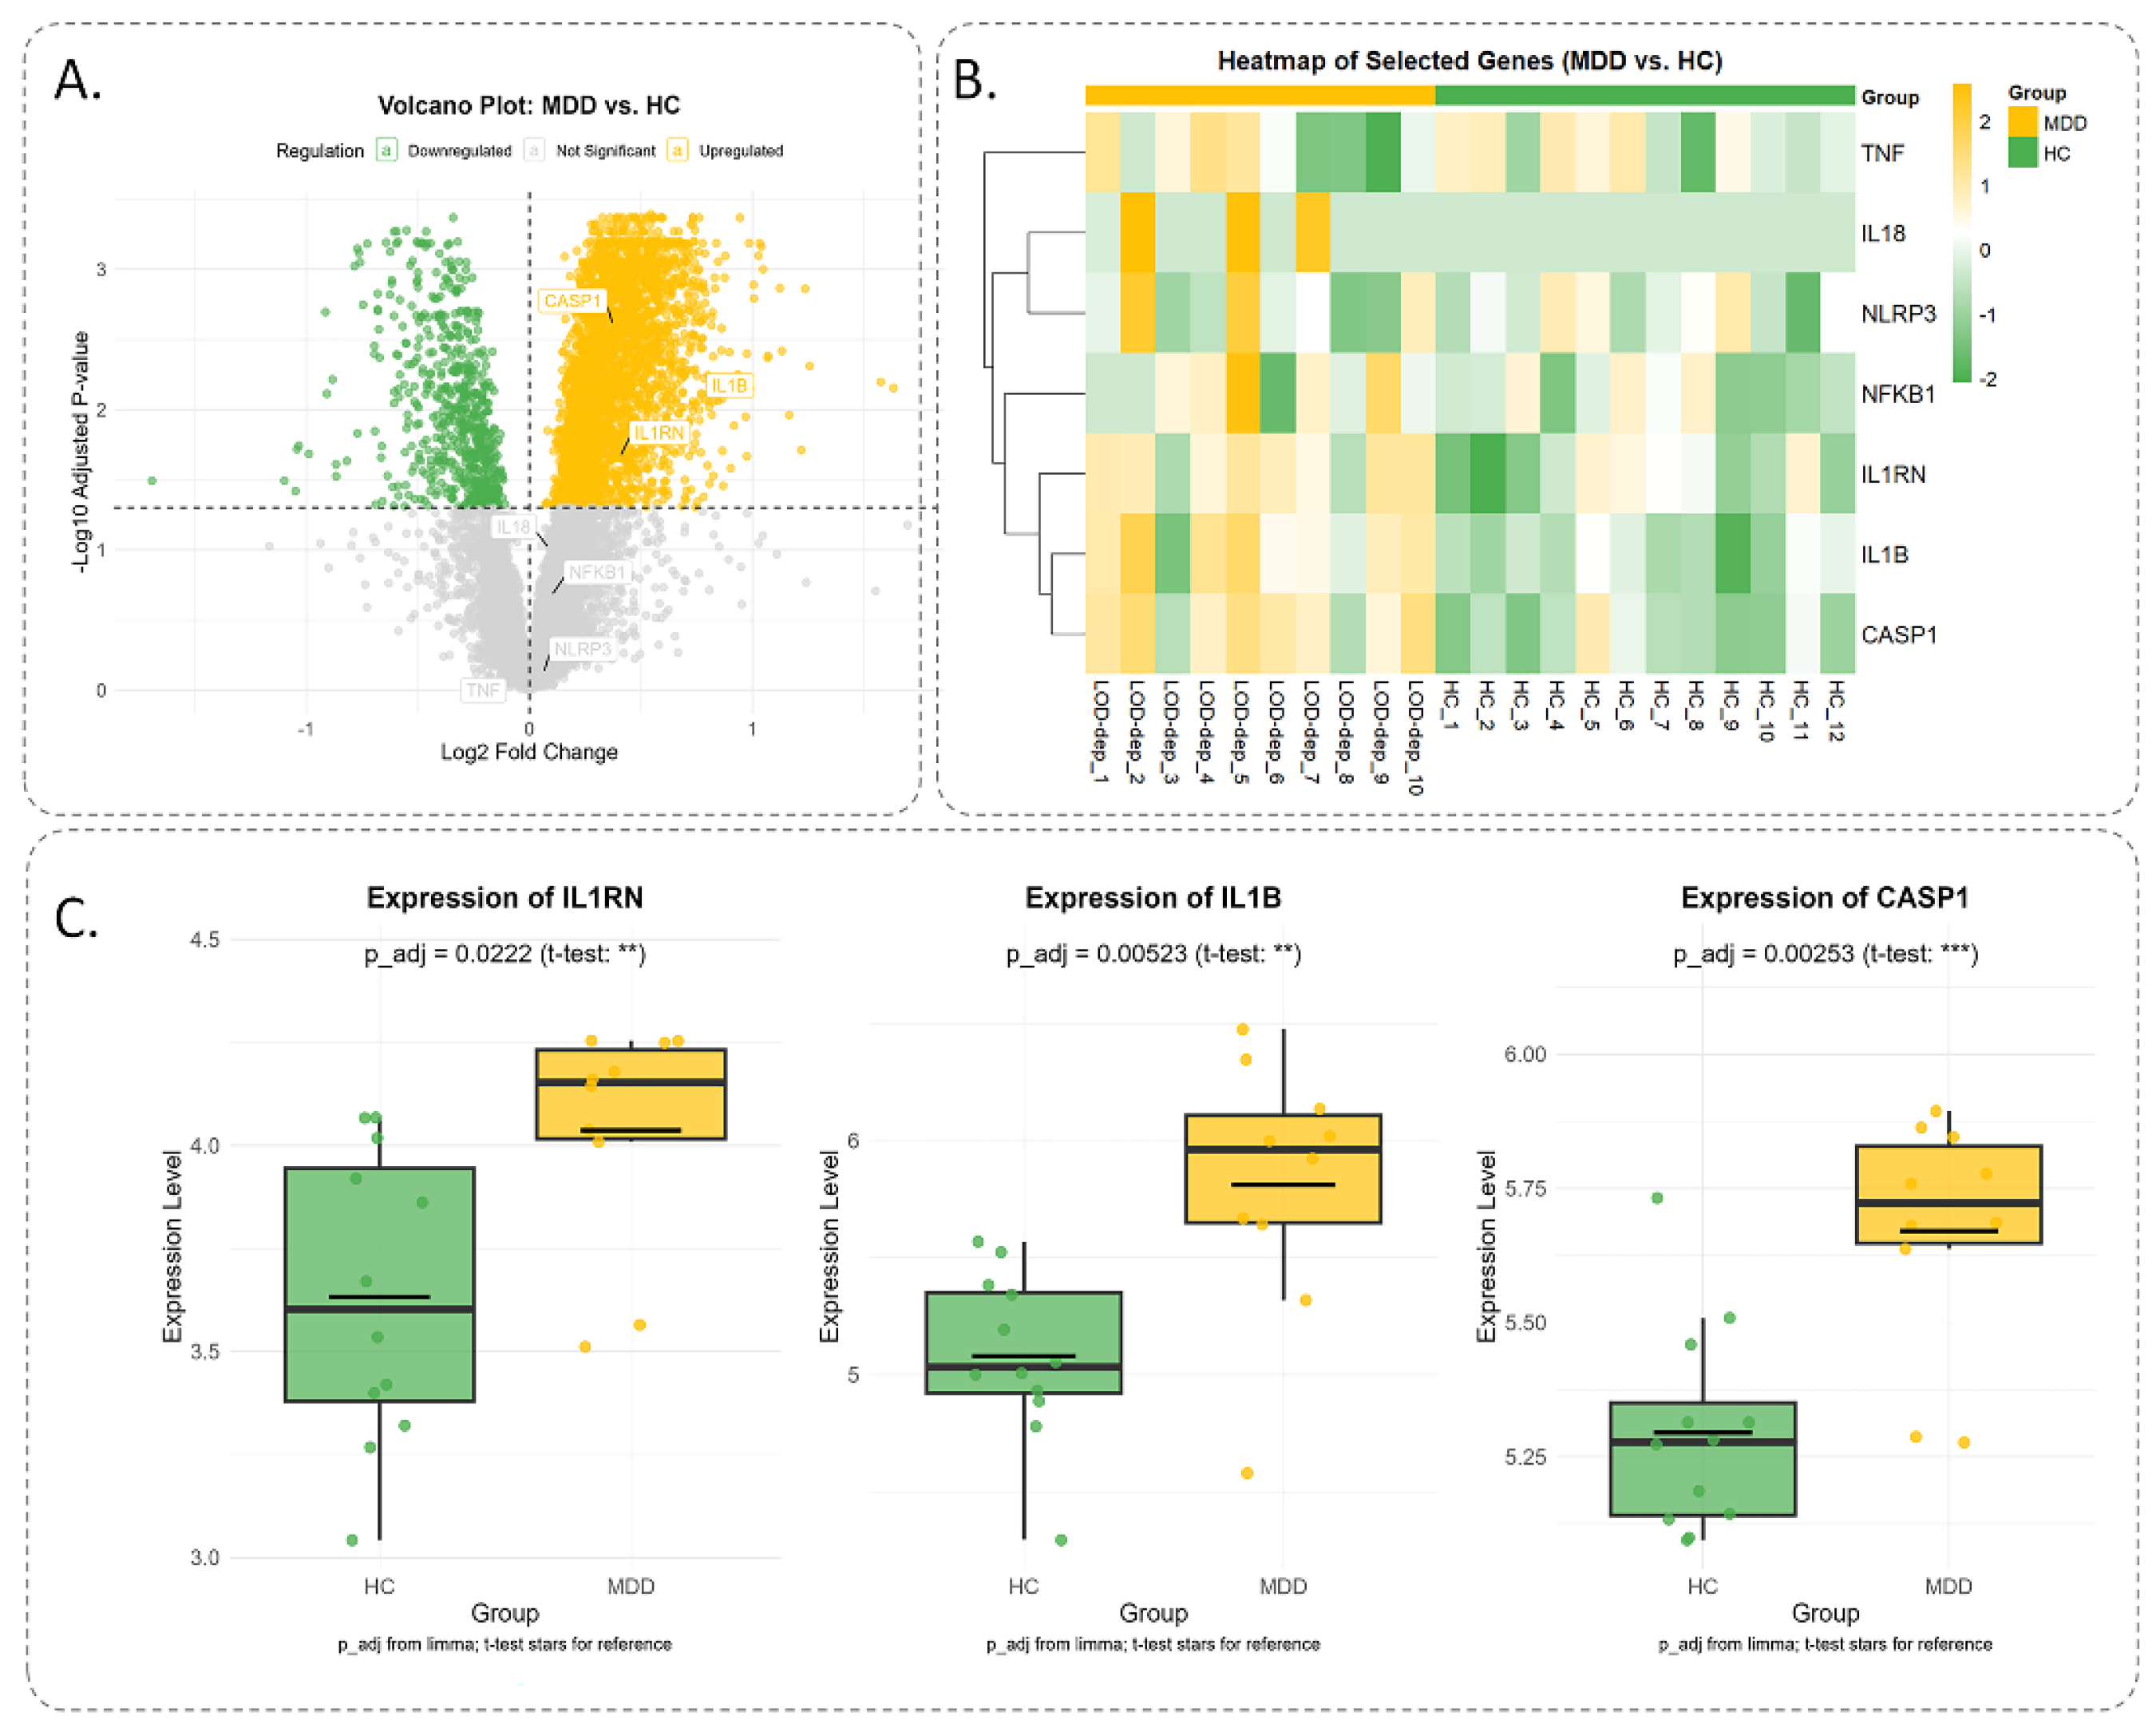

Table 1.
Primers used in quantitative real-time PCR.
| Gene | Forward primer (5′-3′) | Reverse primer (5′-3′) | Product Size |
| IL-1β | TGGCTGTGGAGAAGCTGTGG | GCAGTGCAGCTGTCTAATGG | 170 |
| IL-6 | CCACTGCCTTCCCTACTTCAC | CAGTGCATCATCGCTGTTC | 185 |
| IL-18 | CCGAACAGCCAACGAATCC | GACATCCTTCCATCCTTCAC | 105 |
| TNF-α | CCCTCACACTCAGATCATCTTCTC | TCAGCCACTCCAGCTGCTCCTC | 96 |
| NF-kB | GGATGACAGAGGCGTGTATAAGG | GAGGAAGGCTGTGAACATGAGG | 194 |
| GAPDH | CTTTCTACATCCTGGCTCACAC | GTCCAGATGATTCAGAGCTCC | 151 |
Table 2.
Parameters obtained in the open field test: Locomotion Frequency, Total Time in Center (seconds), Rearing (Frequency), Grooming (Frequency), Licking/Cleaning (Frequency), Immobility Time (seconds); and Fecal (Frequency). The values are mean ± standard error of the mean (SEM).
Table 2.
Parameters obtained in the open field test: Locomotion Frequency, Total Time in Center (seconds), Rearing (Frequency), Grooming (Frequency), Licking/Cleaning (Frequency), Immobility Time (seconds); and Fecal (Frequency). The values are mean ± standard error of the mean (SEM).
| Groups Variables |
CTRL | CRS | CRS+PBS | CRS+MSCs | CRS+Flux pretreated MSCs | CRS+L.PS pretreated MSCs | Title 1 | Title 2 | Title 3 | Title 4 |
| Locomotion Frequency | 380.83±9.14 | 242.83±27.87*, .0001 | 266.16±14.23*, .003 | 387.83±14.5#&, .0001, .002 | 377.16±15.22#&, .0001, .004 | 412.16±27.8#&, .0001, .0001 | entry 1 * | data | data | data |
| Total Time in Center | 39.56±4.89 |
11.68±3.95*, .0001 | 11.28±3.45*, .0001 |
28.58±4.13#&, .043, .037 |
33.73±3.49#&, .004, .003 |
37.21±2.84#&, .001, .001 |
data | data | data | |
| Rearing | 30.83±2.52 |
13.83±1.44*, .0001 |
16.83±1.70*, .0001 | 22.16±2.18 |
23.33±2.53#, .029 |
29.16±1.66#&, .0001, .002 |
data | data | data | |
| Grooming | 9.33±0.84 | 3±0.57*, .0001 |
1.83±0.9*, .0001 | 6.16±0.87 | 5.5±0.61*&, .024, .034 | 6.83±0.94#&, .024, .002 | entry 2 | data | data | data |
| Licking/Cleaning | 5±1.12 | 2±0.73 | 3.33±0.95 | 2.16±0.87 | 3.33±1.05 | 4±0.85 | data | data | data | |
| Immobility Time | 66.59±11.17 |
105.45±4.76 | 101.42±4.11 | 83.61±16.76 | 75.17±12.5 | 69.64±11.23 | entry 3 | data | data | data |
| data | data | data | ||||||||
| data | data | data | ||||||||
| data | data | data | ||||||||
| entry 4 | data | data | data | |||||||
| data | data | data |
* p < 0.05 vs. the CTRL group, # p < 0.05 vs. the CRS group; and & p < 0.05 vs. other treatment groups.
Disclaimer/Publisher’s Note: The statements, opinions and data contained in all publications are solely those of the individual author(s) and contributor(s) and not of MDPI and/or the editor(s). MDPI and/or the editor(s) disclaim responsibility for any injury to people or property resulting from any ideas, methods, instructions or products referred to in the content. |
© 2025 by the authors. Licensee MDPI, Basel, Switzerland. This article is an open access article distributed under the terms and conditions of the Creative Commons Attribution (CC BY) license (http://creativecommons.org/licenses/by/4.0/).
Copyright: This open access article is published under a Creative Commons CC BY 4.0 license, which permit the free download, distribution, and reuse, provided that the author and preprint are cited in any reuse.


