
Submitted:
19 July 2025
Posted:
21 July 2025
You are already at the latest version
Preprints on COVID-19 and SARS-CoV-2
Abstract
This study investigates the impact of home confinement on the mental health of Dominican children and adolescents during the COVID-19 pandemic. An analytical cross-sectional study was conducted with a convenience sample of 988 participants aged 3 to 17 years, whose parents or legal guardians completed a digital survey that included the Pediatric Symptoms Checklist-35 (PSC-35). Inclusion criteria required consent from guardians, while children with prior mental health diagnoses were ex-cluded. Data analysis employed Pearson's Chi-Square test, Fisher's Exact Test, Cramer's V Coefficient, and multiple response analysis. The findings revealed that 17.5% of children were at risk for cognitive, emotional, and/or behavioral disorders, with specific risk percentages of 15.7% for attention issues, 13.2% for depression/anxiety, and 11% for behavioral problems. Statistically significant associations (p < 0.05) were found be-tween the global PSC-35 score and factors such as sleep difficulties, COVID-19-related dreams, and boredom during confinement. These re-sults indicate a notable prevalence of mental health issues among minors in the Dominican Republic, highlighting excessive boredom, persistent fear, and sleep disturbances as critical indicators of potential mental de-terioration.
Keywords:
COVID-19
; Mental Health
; Pediatric Symptoms Checklist
1. Introduction
The World Health Organization (WHO) has emphasized the profound psychological impacts of the Coronavirus Disease 2019 (COVID-19) pandemic on the pediatric population [1]. As the world faced this unprecedented crisis, children experienced a range of emotional disturbances, including increased anxiety, fear, depression, disrupted sleep patterns, anger, and post-traumatic stress. These mental health challenges not only affect emotional well-being but can also lead to physical manifestations, such as weakened immune systems and deterioration of cardiorespiratory health [2,3]. Reports from parents in countries severely affected by COVID-19 reveal alarming emotional and behavioral changes in their children and adolescents, highlighting the urgent need for attention to this vulnerable demographic [3,4].
In response to the pandemic, governments worldwide implemented home isolation as a primary control measure. Historical evidence from previous epidemics indicates that such measures can precipitate feelings of boredom, stress from separation from loved ones, and uncertainty about ongoing health crises. Therefore, assessing the psychological consequences of prolonged quarantine on children and adolescents is imperative [5]. Despite the critical nature of this issue, there is a notable gap in research investigating the effects of home confinement during COVID-19 on the mental health of children and adolescents in the Dominican Republic and the broader Caribbean region. This lack of localized data highlights the importance of the present study, which aims to elucidate the impact of home confinement on the mental health of the Dominican pediatric population during the COVID-19 pandemic. By addressing this gap, the study seeks to inform public health strategies and interventions that can better support the mental well-being of children in similar contexts, ultimately contributing to the global discourse on pediatric mental health in times of crisis. The findings are expected to reveal significant insights into the mental health challenges faced by this population, guiding future research and policy efforts.
2. Materials and Methods
2.1. Study Design
This article is based on a cross-sectional analytical study utilizing primary sources, targeting children and adolescents aged 3 to 17 years residing in the Dominican Republic. Data collection commenced on April 27, 2020, and concluded on May 27, 2020, during a state of emergency and curfew declared by the President of the Dominican Republic, necessitating a non-probabilistic convenience sampling approach.
2.2. Participants
The study included participants who were fathers, mothers, or legal guardians of children and/or adolescents aged 3 to 17 years. Inclusion criteria required participants to consent to the study after reading the informed consent section. Exclusion criteria included children and/or adolescents already diagnosed with a mental disorder and/or cognitive deficit by a psychiatrist or psychologist. Out of 1,079 responses collected, 988 individuals met the inclusion criteria.
2.3. Data Collection
A digital survey was created using the Google Form application, beginning with an explanatory text outlining the study's key details and an informed consent section. The survey comprised three sections with a total of 61 mandatory questions, designed to be completed individually for each child in the household. The Google Form was disseminated through various social media platforms with the assistance of influential Dominican individuals and high-ranking Dominican committees and associations. The survey was closed once the country resumed normal labor activities.
The first section included demographic and general questions with multiple-choice responses. The second section utilized the original Spanish version of the Pediatric Symptoms Checklist-35 (PSC-35), a validated questionnaire with a reliability range of r = 0.84 to 0.91 for identifying children with mental impairments. The third section organized questions related to specific mental health signs and symptoms identified as significant by the World Health Organization (WHO) and other organizations [6,7,8].
2.4. Ethical Considerations
Due to the COVID-19 pandemic, obtaining formal approval from an ethical committee was not feasible. However, the researchers engaged in oral discussions with representatives from the ethical committee of the Pontificia Universidad Católica Madre y Maestra (PUCMM) to ensure compliance with ethical standards and prioritize participant welfare. This limitation may affect the generalizability of the findings, as formal oversight was not established.
2.5. Data Analysis
Data analysis was performed using the Statistical Package for the Social Sciences (SPSS) version 25. A descriptive analysis of the variables was conducted using frequencies and percentages. For qualitative variables, an inferential analysis was performed using Pearson's Chi-Square test, with a confidence level of 95%, an alpha error of 5%, and a statistical power of 80%. Fisher's Exact Test was employed for variables with five or fewer responses. Additionally, Cramer's V test was used to assess the level of association between variables that showed significant relationships according to the Pearson’s Chi-Square test. Variables that allowed for multiple responses were analyzed using Multiple Response Analysis.
3. Results
3.1. Demographic and Contextual Factors
Prior to the onset of the pandemic, 4% of heads of households were unemployed. During the quarantine, 20% were suspended from work, and 10% were unemployed. Additionally, 7% of young people had to be separated from their parents or guardians as a protective measure. Notably, 45% of minors did not have access to a patio or terrace at home, and 34% did not have siblings living with them. At the time of the survey, 8% reported having a family member diagnosed with COVID-19, 2% indicated the death of a loved one due to COVID-19, and less than 1% of children and/or adolescents were diagnosed with the disease (see Table 1).
3.2. Mental Health Outcomes
Regarding mental health, 28% of parents/guardians reported that their children experienced difficulty sleeping, while 10% expressed that their children had dreams related to COVID-19. Furthermore, 42% of children reported fears that a loved one would contract COVID-19, and 36% expressed concerns about developing the illness themselves. Parents observed that 57% of their children became more attached to them following the implementation of home confinement, and 74% of children reported feeling bored during this period (see Chart 1).
3.3. Behavioral Changes
Since the onset of home confinement, 44% of children exhibited tantrums and rebellious behaviors, 32% showed difficulties with attention and concentration, 31% developed unhealthy sleep habits, and 27% reported poor eating habits. Conversely, 23% of children did not exhibit any behavioral changes. The most common recreational activities among children and adolescents included using a cell phone or tablet (85%), watching television (77%), dancing or singing (54%), and listening to music (50%) (see Table 2).
3.4. Pediatric Symptoms Checklist-35 Results
The Pediatric Symptoms Checklist-35 (PSC-35) indicated a 17.5% prevalence of children with an overall risk score for cognitive, emotional, and/or behavioral disorders. Specifically, 15.7%, 13.2%, and 11% of children showed risk scores for attention disorders, depression/anxiety disorders, and behavioral disorders, respectively (see Chart 2).
Among children expressing excessive worry or sadness, 54% obtained a global risk score for mental disorders. Notably, the only adolescent (100%) who began using drugs and/or alcohol during isolation also received a global risk score. In contrast, 100% of minors who did not exhibit any behavioral changes obtained a final score indicating the absence of global risk for cognitive, emotional, and/or behavioral disorders. Additionally, 34% of those who resumed previously overcome behaviors, 60% of those expressing excessive worry or sadness, and 35% of those with unhealthy eating habits reached risk scores for the subscales of attention, depression/anxiety, and behavior, respectively (see Table 3).
3.5. Associations
Statistical analysis revealed significant associations between age range and risk for the attention and depression/anxiety subscales. The presence of siblings in the household was significantly related to the global score of the PSC-35, as well as the depression/anxiety and behavior subscales. Additionally, fears regarding a loved one developing the disease were significantly associated with the overall PSC-35 results and the depression/anxiety subscale. Similarly, the child's fear of contracting the disease was significantly associated with the global score of the PSC-35, the depression/anxiety subscale, and the behavior subscale. Finally, variables such as difficulty sleeping, dreaming about COVID-19, and feelings of boredom during home confinement showed statistical significance with the overall PSC-35 scores (global score and subscales) (see Table 4).
4. Discussion
In this study, 7% of the sample experienced separation from their parents or guardians during the pandemic as a protective measure. However, the literature suggests that remaining with caregivers can mitigate the development of negative psychological effects. Research indicates that children who experience separation from their parents during quarantine are at a greater risk of developing emotional disorders and suicidal tendencies in adulthood [9,10].
The current research found that 74% of children reported feeling bored, 28% had trouble sleeping, and 57% became more attached to their caregivers. These findings align with studies conducted in Spain and Italy, where 52% of parents perceived that their children felt more bored than usual, 39% reported increased fatigue, and 28% noted greater dependency on them [4]. In contrast, a lower percentage was observed in China, where only 25% of caregivers reported changes in their children's sleep patterns, and 37% of children expressed fears of contracting SARS-CoV-2 [11]. In the present study, 31%, 36%, and 42% of children exhibited unhealthy sleep habits, fears of developing the disease, and fears of a loved one being infected, respectively.
Several behavioral changes reported by parents were noteworthy, including tantrums and rebellious behavior (44%), difficulties with attention and concentration (32%), unhealthy sleep habits (31%), poor eating habits (27%), and excessive crying or irritability (25%). Similar findings were reported in China, where attention difficulties and irritability were the most common behavioral and emotional symptoms across all age groups evaluated [12]. Even higher percentages were observed in children from the Basque Country, where 55% cried more during confinement, 75% exhibited increased anger, and only 52% maintained healthy sleep habits, with more than half showing an increase in daily food consumption [13].
The most common recreational activities among Dominican children and adolescents included using a cell phone or tablet (85%), watching television (77%), dancing or singing (54%), listening to music (50%), and engaging in crafts (44%). In the Basque Country, 90% of parents reported increased use of electronic devices among their children [13]. Previous research has shown that when children are out of school (during weekends or vacations), they tend to decrease physical activity, increase screen time, and develop irregular sleep habits, all of which can lead to weight gain and negatively impact physical health, thereby increasing susceptibility to mental health issues [2]. Despite these concerns, it is possible that the mindful use of smart devices can positively contribute to the mental health of young individuals. A preliminary study conducted in China by Jiao et al. [12] indicated that digital entertainment helped mitigate the negative experiences associated with home confinement.
Regarding the Pediatric Symptoms Checklist-35 (PSC-35), the global score indicated an 18% prevalence of symptoms related to emotional, cognitive, and/or behavioral disorders, with 16%, 13%, and 11% of children showing positive risk results for attention, depression/anxiety, and behavioral subscales, respectively. Xie et al. [11] reported even higher prevalence rates, with 23% of their sample exhibiting symptoms of depression and 19% showing symptoms of anxiety. Similarly, Jiao et al. [12] observed increased anxiety among children living in areas with high contagion rates.
In a study conducted in China during the early stages of the COVID-19 pandemic, children aged 6 to 18 years were more likely to exhibit attention problems and a heightened interest in researching the disease [12]. In the present investigation, children who were more curious about COVID-19 were at a significantly greater risk of developing global behavioral, cognitive, and/or emotional problems, particularly depression/anxiety, with higher prevalence among those who discussed or researched the disease excessively. Comparably, a study on school students in China concluded that those less concerned about COVID-19 had significantly lower anxiety and depression scores than those who were more concerned [11].
The Co-SPACE project, which collects mental health data from individuals aged 4 to 16 during the COVID-19 crisis, reported no differences in mental symptoms based on parents' employment status [14]. However, the current research revealed a significant association between parents' employment status and the global PSC-35 score, with higher prevalence rates of behavioral problems among children whose parents were unemployed during the pandemic. Additionally, the employment status of the head of the household prior to the state of emergency was significantly related to the global results, attention subscale, and behavioral subscale, with the highest prevalence observed in children with unemployed parents. Children are adept at interpreting adult emotions; thus, when a parent expresses negative emotions related to economic stress, it can adversely affect the mental health of their children in the short term [5].
According to the data analyzed in this study, having access to a patio or terrace at home was associated with fewer mental health problems overall and in the behavior subscale. Children without such outdoor spaces exhibited the highest prevalence of the dependent variables studied. This finding aligns with recommendations made during the pandemic, which encouraged finding safe spaces for fresh air and sunlight [13]. Furthermore, a study comparing the situations of children in Italy and Spain found that households in Italy were more likely to have patios, resulting in a significant decrease in behavioral problems compared to those in Spain [4].
Children in this study who reported increased attachment to their parents after home confinement were significantly associated with higher risk scores for behavioral, cognitive, and/or emotional disorders, particularly in the attention subscale. Similarly, children aged 3 to 6 years in China exhibited symptoms of attachment to their parents and fears regarding the potential contraction of COVID-19 [12].
Children who had trouble sleeping, dreamed of COVID-19, or expressed boredom during home confinement were significantly more likely to exhibit emotional, cognitive, and/or behavioral disorders, particularly related to attention, depression/anxiety, and behavior. While boredom can sometimes lead to positive outcomes such as creativity and social behavior, it is well-established that it is also associated with negative consequences, including attention problems, feelings of depression, counterproductive behaviors, and poor dietary habits [15,16]. Additionally, sleep disturbances have been linked to psychiatric disorders in the pediatric population, including attention, anxiety, depressive, and behavioral disorders across various age groups [17].
The strengths of this research include its low-cost implementation during the peak of home isolation in the country, the use of a digital platform that ensured reproducibility of data collection while minimizing contagion risk for researchers and respondents, and the involvement of expert advisors in mental health and research methodology. Furthermore, the study utilized a standardized questionnaire commonly employed in pediatric research, specifically the Pediatric Symptoms Checklist-35 (PSC-35), which adds credibility to the findings and allows for meaningful comparisons with other studies. The engagement of influential Dominican individuals and health associations in disseminating the survey likely increased participation rates and ensured that the study reached a broader audience, enhancing its ecological validity. Additionally, the research addresses a critical and timely issue-the mental health impact of home confinement during the COVID-19 pandemic on children and adolescents-filling a significant gap in the literature regarding this demographic and geographic context. However, limitations include the fact that responses were primarily obtained from a specific geographical area, which may reduce the variability of participants. Additionally, the researchers faced challenges in reaching individuals considered illiterate and those lacking access to adequate internet connectivity. Furthermore, due to the COVID-19 pandemic, formal approval from an ethical committee was not obtained, which may limit the generalizability of the findings.
5. Conclusions
The results of this study indicate that the Pediatric Symptoms Checklist-35 (PSC-35) is an effective screening tool for identifying mental health issues in children and adolescents. Given the observed prevalence of emotional, cognitive, and behavioral disorders during the COVID-19 pandemic, early identification and intervention are essential to mitigate long-term adverse effects on mental health.
This publication encourages researchers and healthcare professionals to assess the long-term consequences of home confinement on children's mental health. Understanding these effects is crucial for developing targeted interventions and support systems. Additionally, the findings underscore the importance of considering environmental factors, such as access to outdoor spaces and parental employment status, in mental health assessments.
Ultimately, this study provides valuable insights that can inform future research, guide clinical practice, and shape public health policies aimed at promoting the mental health of children and adolescents during and after public health emergencies. By prioritizing mental health in pediatric care and policymaking, we can better support the well-being of our youngest populations in times of crisis and beyond.
Author Contributions
Conceptualization, Christy Capestany and Nelson Martinez; Methodology, Christy Capestany and Nelson Martinez; Formal Analysis, Christy Capestany and Priscilla Fiallo; Investigation, Christy Capestany, Priscilla Fiallo, and Paloma Bencosme; Data Curation, Priscilla Fiallo and Kimberly Baez; Writing—Original Draft Preparation, Christy Capestany; Writing—Review and Editing, Christy Capestany, Priscilla Fiallo, Kimberly Baez, Paloma Bencosme, and Nelson Martinez; Supervision, Nelson Martinez; Funding Acquisition, none. All authors have read and agreed to the published version of the manuscript.
Funding
This research received no external funding. The Article Processing Charge (APC) was also funded by the authors.
Institutional Review Board Statement
This study was conducted in accordance with the Declaration of Helsinki. Due to quarantine restrictions, formal ethical committee access was unavailable; however, an informal review was conducted. Ethical approval was waived given the minimal risk and urgent need for data on the mental health impact of COVID-19 on children and adolescents.
Informed Consent Statement
Informed consent was obtained from all subjects involved in the study.
Data Availability Statement
The data supporting the findings of this study are available from the corresponding author, Christy Capestany, upon reasonable request.
Acknowledgments
The authors would like to express their sincere gratitude to the community of Dominican influencers, educational institutions, and health associations for their invaluable support in disseminating the Google Form related to this research study. Their contributions were essential in facilitating participant engagement and data collection.
Conflicts of Interest
The authors declare no conflicts of interest.
References
- World Health Organization. (2020). Policy brief on COVID-19 impact on children https://www.who.int/docs/default-source/mca-documents/mca-covid/policy-brief-on-covid-impact-on- children-16-april-20.
- Wang, G. , Zhang, Y., Zhao, J., Zhang, J., & Jiang, F. (2020). Mitigate the effects of home confinement on children during the COVID-19 outbreak. The Lancet, 395(10228), 945-947. [CrossRef]
- Bai, R. , Wang, Z., Liang, J., Qi, J., & He, X. (2020). The effect of the COVID-19 outbreak on children’s behavior and parents’ mental health in China: A research study. Research Square. [CrossRef]
- Orgilés, M. , Morales, A., Delvecchio, E., Mazzeschi, C., & Espada, J. P. (2020). Immediate psychological effects of the COVID-19 quarantine in youth from Italy and Spain. OSF Preprints. [CrossRef]
- Brooks, S. K. , Webster, R. K., Smith, L. E., et al. (2020). The psychological impact of quarantine and how to reduce it: Rapid review of the evidence. The Lancet, 395(10227), 912-920. [CrossRef]
- Massachusetts General Hospital. (2020). Pediatric symptom checklist https://www.massgeneral.org/psychiatry/treatments-and-services/pediatric-symptom-checklist.
- TNAAP. (n.d.). Pediatric symptom checklist scoring. https://www.tnaap.org/documents/psc-35-scoring- instructions.pdf.
- Jellinek, M. S. , Murphy, J. M., Little, M., Pagano, M. E., Comer, D. M., & Kelleher, K. J. (1999). Use of the Pediatric Symptom Checklist to screen for psychosocial problems in pediatric primary care. Archives of Pediatrics & Adolescent Medicine, 153(3), 254-260. [CrossRef]
- Liu, J. J. , Bao, Y., Huang, X., Shi, J., & Lu, L. (2020). Mental health considerations for children quarantined because of COVID-19. The Lancet Child & Adolescent Health, 4(5), 347-349. [CrossRef]
- Ghosh, R. , Dubey, M. J., Chatterjee, S., & Dubey, S. (2020). Impact of COVID-19 on children: Special focus on the psychosocial aspect. Minerva Pediatrica, 72(3), 226-235. [CrossRef]
- Xie, X. , Xue, Q., Zhou, Y., et al. (2020). Mental health status among children in home confinement during the coronavirus disease 2019 outbreak in Hubei Province, China. JAMA Pediatrics 174(9), 898–900. [CrossRef] [PubMed]
- Jiao, W. Y. , Wang, L. N., Liu, J., et al. (2020). Behavioral and emotional disorders in children during the COVID-19 epidemic. The Journal of Pediatrics, 221, 264-266. [CrossRef]
- Meade, J. (2021). Mental health effects of the COVID-19 pandemic on children and adolescents: A review of the current research. Pediatric Clinics of North America, 68(5), 2020341184016192020. [CrossRef]
- Pearcey, S. , Shum, A., Waite, P., Patalay, P., & Creswell, C. (2020). Changes in children and young people’s emotional and behavioral difficulties through lockdown 2020. Emerging Minds.
- Hooft, E. A. J. V. , & Hooff, M. L. M. V. (2018). The state of boredom: Frustrating or depressing? Motivation and Emotion, 42(6), 931-946. [CrossRef]
- Hunter, A. , & Eastwood, J. D. (2016). Does state boredom cause failures of attention? Examining the relations between trait boredom, state boredom, and sustained attention. Experimental Brain Research, 236(8), 2483-2492. [CrossRef]
- Armstrong, J. M. , Ruttle, P. L., Klein, M. H., Essex, M. J., & Benca, R. M. (2014). Associations of child insomnia, sleep movement, and their persistence with mental health symptoms in childhood and adolescence. Sleep 37(6), 901–909. [CrossRef]
Chart 1.
Specific Pediatrics Symptoms.
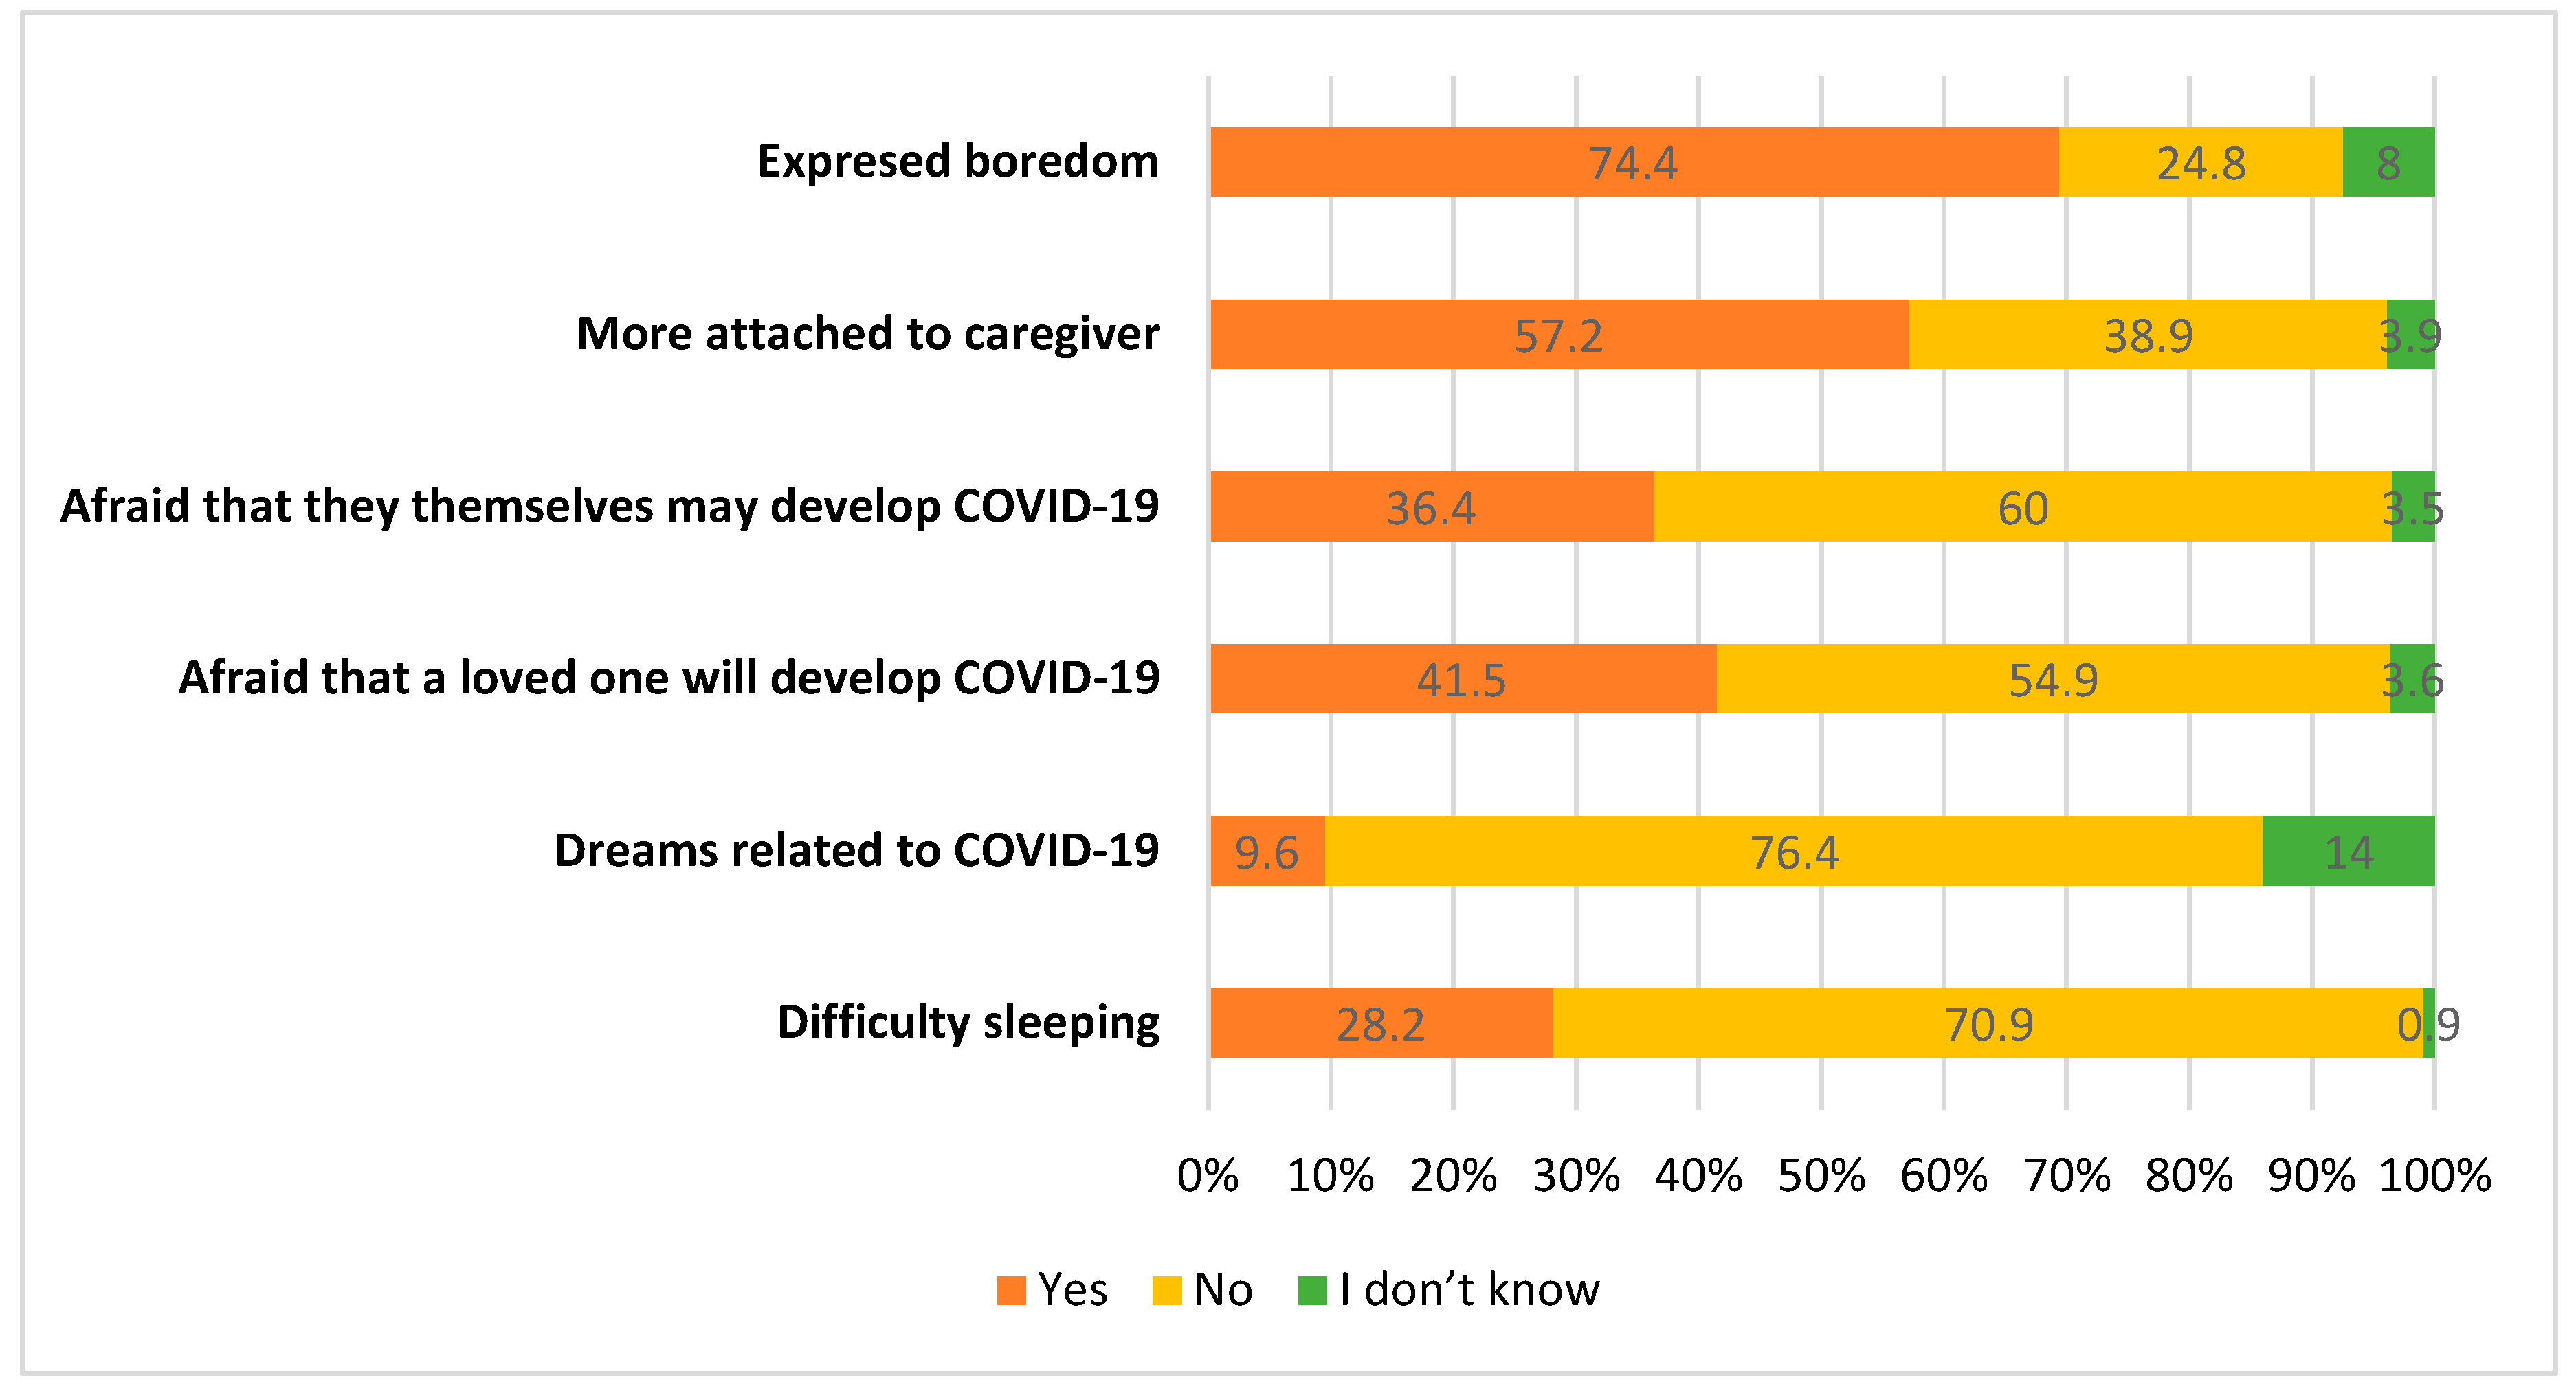
Chart 2.
Pediatric Symptoms Checklist-35 Scores.
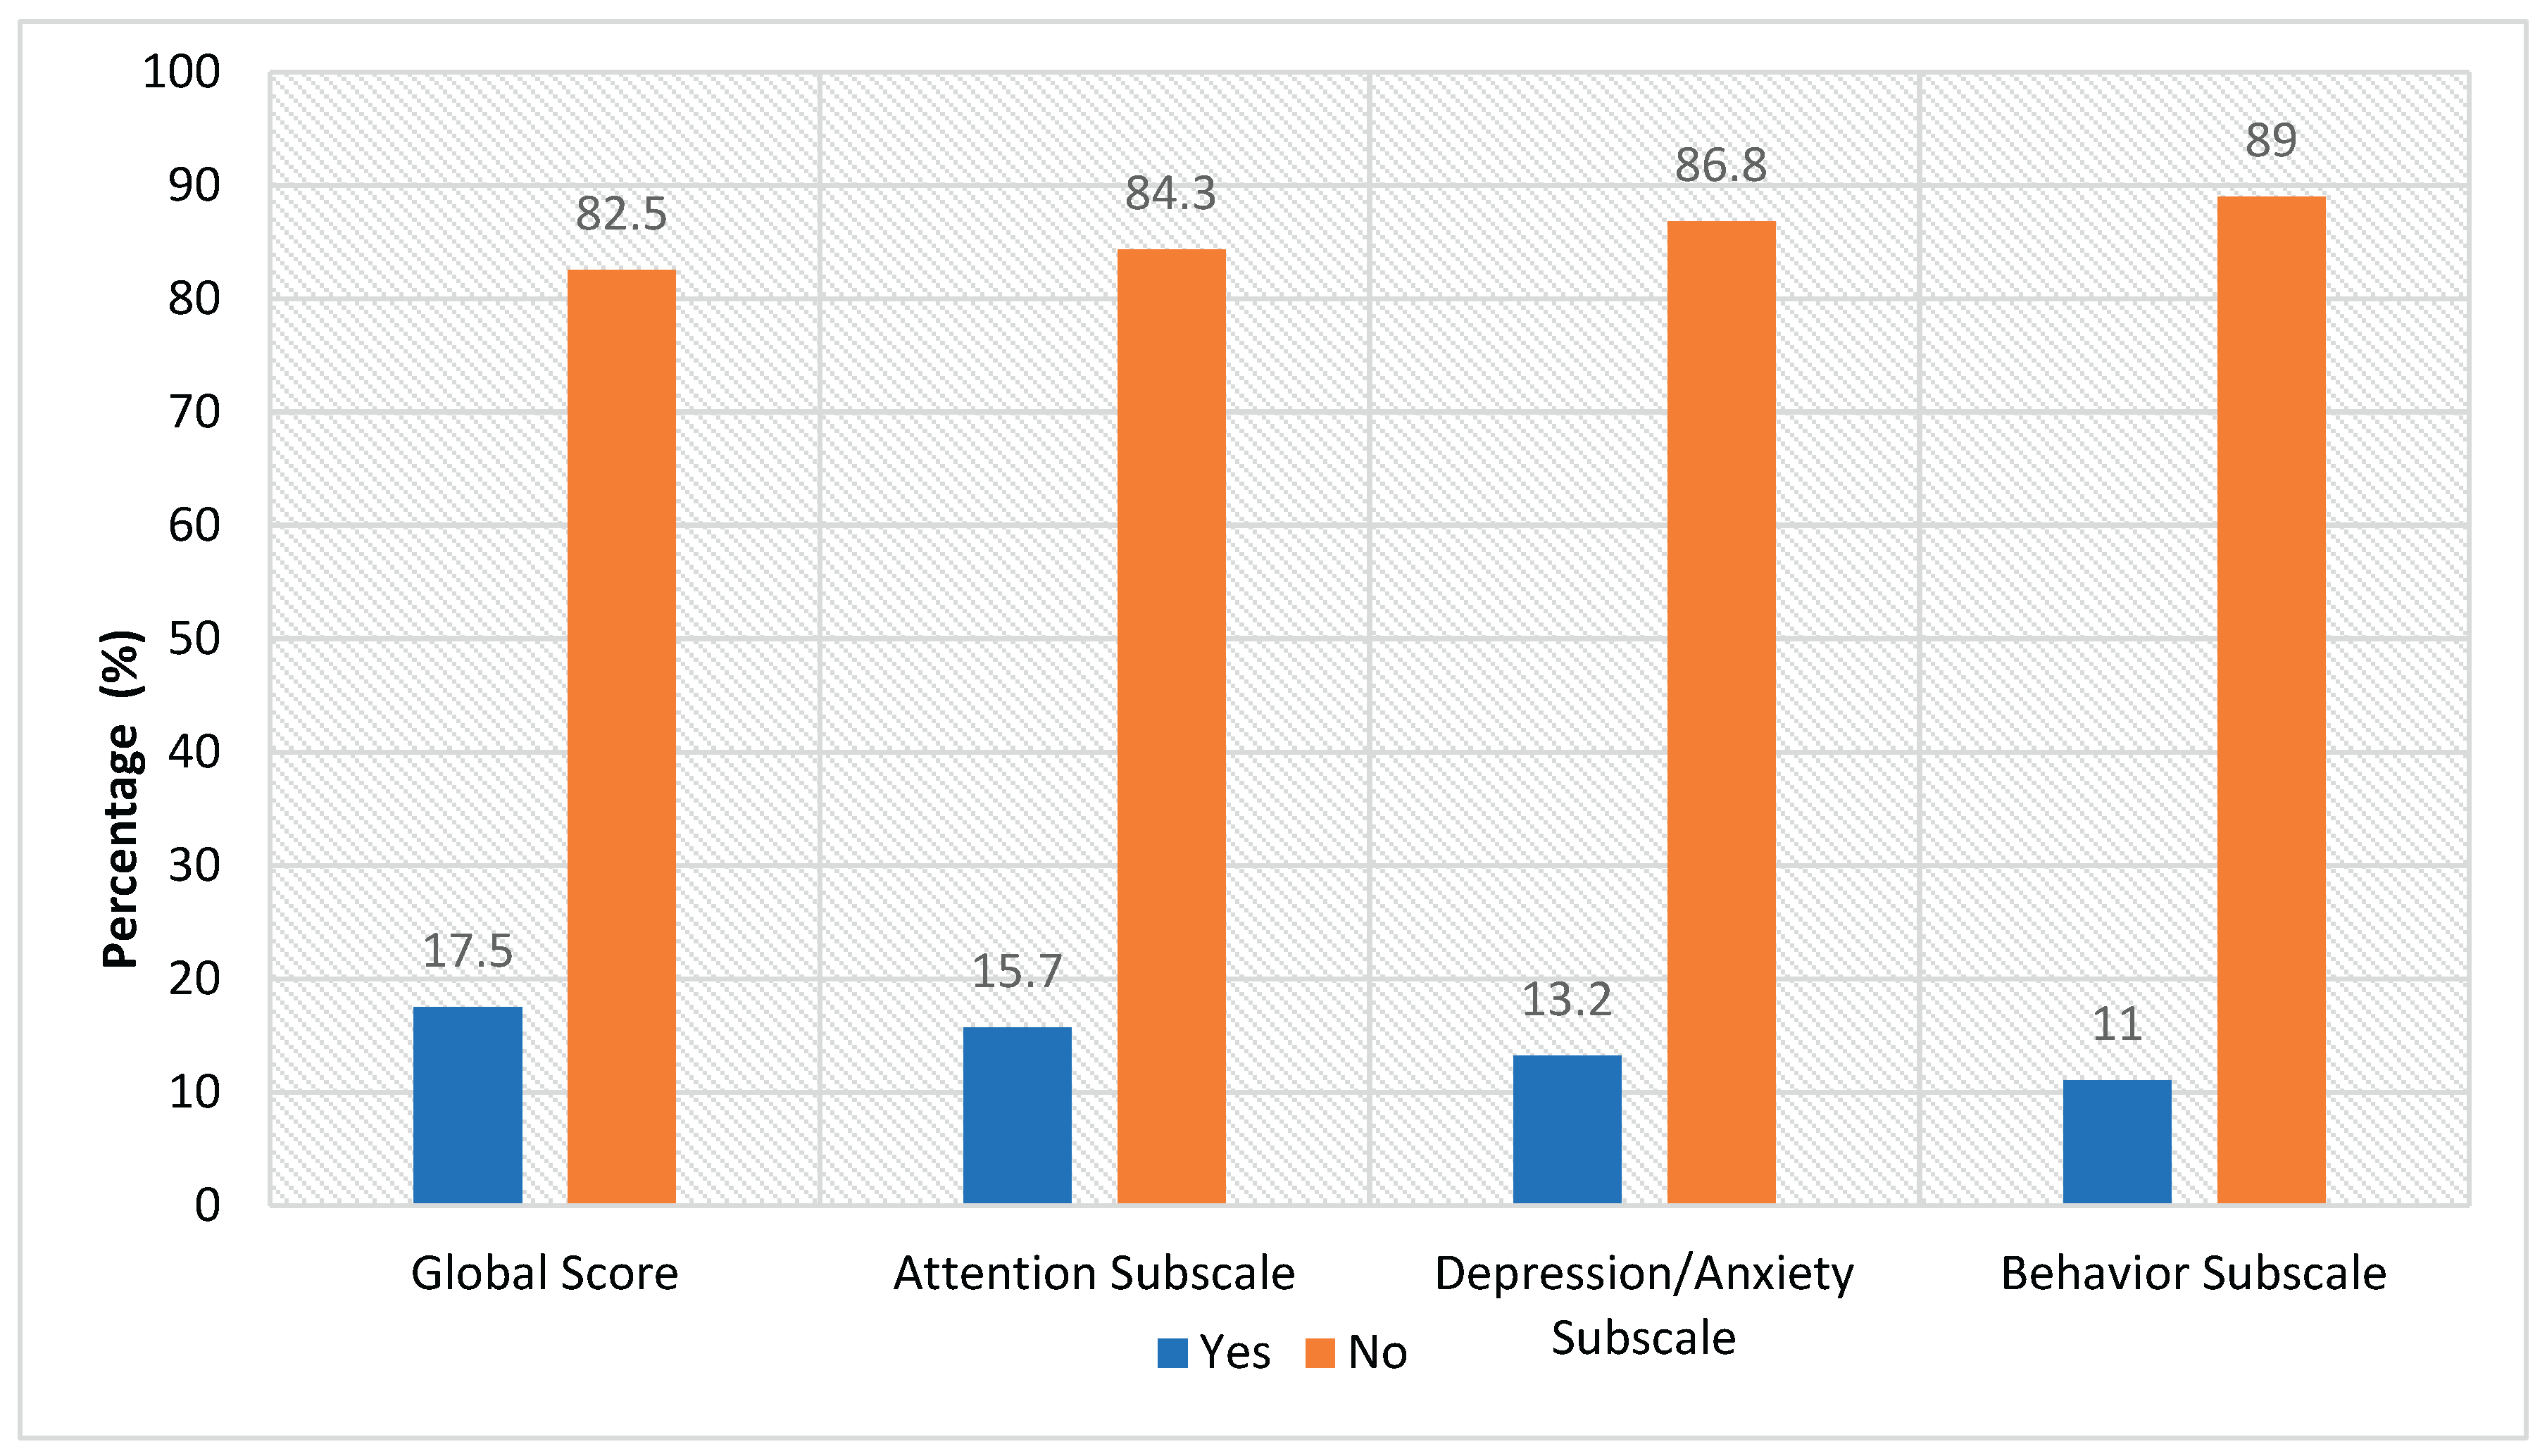

Table 1.
Sociodemographic and Contextual Factors.
| Frequency (n) | Percentage (%) | |||
|---|---|---|---|---|
| Age range | 3-5 years old | 346 | 35 | |
| 6-9 years old | 278 | 28.1 | ||
| 10-13 years old | 222 | 22.5 | ||
| 14-17 years old | 142 | 14.4 | ||
| Sex | Female | 468 | 47.4 | |
| Male | 518 | 52.4 | ||
| Prefer not to answer | 2 | 0.2 | ||
| Labor status of the head of the household, prior to the state of emergency | Self Employed / Independent | 307 | 31.1 | |
| Unemployed | 35 | 3.5 | ||
| Formal employee | 614 | 62.1 | ||
| Informal employee | 32 | 3.2 | ||
| Current employment status of the head of the household | Unemployed | 95 | 9.6 | |
| Employee | 691 | 69.9 | ||
| Suspended | 202 | 20.4 | ||
| Presence of patio or terrace in the home | No | 444 | 44.9 | |
| I don’t know | 1 | 0.1 | ||
| Yes | 543 | 55 | ||
| Presence of siblings in the home | No | 340 | 34.4 | |
| Yes | 648 | 65.6 | ||
| Number of people living in the home | 5 or more people | 299 | 30.3 | |
| 4 people | 354 | 35.8 | ||
| 3 people | 265 | 26.8 | ||
| 2 people | 70 | 7.1 | ||
| Separation from mother, father, or legal guardian during the pandemic | No | 916 | 92.7 | |
| I don’t know | 1 | 0.1 | ||
| Yes | 71 | 7.2 | ||
| Close family member diagnosed with COVID-19 | No | 896 | 90.7 | |
| I don’t know | 9 | 0.9 | ||
| Prefer not to answer | 2 | 0.2 | ||
| Yes | 81 | 8.2 | ||
| Child or adolescent diagnosed with COVID-19 | No | 985 | 99.7 | |
| Prefer not to answer | 1 | 0.1 | ||
| Yes | 2 | 0.2 | ||
| Time without leaving home | Less than 1 week | 103 | 10.4 | |
| 1 week | 50 | 5.1 | ||
| 2 weeks | 33 | 3.3 | ||
| 3 weeks | 26 | 2.6 | ||
| 4 weeks | 32 | 3.2 | ||
| More than 1 month | 744 | 75.3 | ||
| Death of a close loved one | No | 969 | 98.1 | |
| I don’t know | 2 | 0.2 | ||
| Yes | 17 | 1.7 | ||
| Desire for information about COVID-19 | Talk or do enough investigation | 339 | 34.3 | |
| Talk or do a lot of investigation | 84 | 8.5 | ||
| Try not to talk or do a lot of investigation | 565 | 57.2 |
Table 2.
Change in Behavior and Recreational Activities.
| Frequency (n) | Percentage (%) | ||
|---|---|---|---|
|
Behavioral changes |
Excessive crying or constant irritation | 248 | 25.1 |
| Returning to behaviors that had been overcome (for example, bathroom accidents or bed-wetting) | 83 | 8.4 | |
| Excessive worry or sadness | 85 | 8.6 | |
| Unhealthy eating habits | 267 | 27.0 | |
| Unhealthy sleeping habits | 302 | 30.6 | |
| Tantrums and rebellious behavior | 436 | 44.1 | |
| Difficulty in attention and concentration | 319 | 32.3 | |
| Avoid activities you enjoyed in the past | 69 | 7.0 | |
| Unexplained headaches or body pain | 151 | 15.3 | |
| Use of drugs and / or alcohol | 1 | 0.1 | |
| None of the above | 224 | 22.7 | |
| Recreation activities | Read a book | 263 | 26.6 |
| Dance or sing | 535 | 54.1 | |
| Make crafts | 432 | 43.7 | |
| Watch TV | 765 | 77.4 | |
| Use social networks | 301 | 30.5 | |
| Listen to music | 492 | 49.8 | |
| Exercise or yoga | 261 | 26.4 | |
| Cook | 313 | 31.7 | |
| Play an instrument | 92 | 9.3 | |
| Playing video games | 413 | 41.8 | |
| Using the cell phone or tablet | 840 | 85.0 | |
| Play (alone or accompanied) | 90 | 9.1 | |
| Paint and / or draw | 20 | 2.0 | |
| Use the pool | 15 | 1.5 | |
| Others | 41 | 4.1 |
Table 3.
Association Between Behavioral Changes, Recreational Activities, and PSC-35 Scores.
| Global score | Attention subscale | Depression/anxiety subscale | Behavior subscale | ||||||
|---|---|---|---|---|---|---|---|---|---|
| No Risk (n)(%) | Risk (n)(%) | No Risk (n)(%) | Risk (n)(%) | No Risk (n)(%) | Risk (n)(%) | No Risk (n)(%) | Risk (n)(%) | ||
| Behavioral changes | Excessive crying or constant irritation | 153(61.7) | 95(38.3) | 172(69.4) | 76(30.6) | 192(77.4) | 56(22.6) | 188(75.8) | 60(24.2) |
| Returning to behaviors that had been overcome (for example, bathroom accidents or bed-wetting) |
53(63.9) |
30(36.1) |
55(66.3) |
28(33.7) |
73(88.0) |
10(12.0) |
67(80.7) |
16(19.3) |
|
| Excessive worry or sadness | 39(45.9) | 46(54.1) | 61(71.8) | 24 (28.2) | 34(40.0) | 51(60.0) | 70(82.4) | 15(17.6) | |
| Unhealthy eating habits | 194(72.7) | 73(27.3) | 210(78.7) | 57 (21.3) | 210(78.7) | 57(21.3) | 229(26.1) | 38(34.9) | |
| Unhealthy sleeping habits | 222(73.5) | 80(26.5) | 244(80.8) | 58(19.2) | 233(77.2) | 69(22.8) | 264(85.8) | 38(14.2) | |
| Tantrums and rebellious behavior | 305(70.0) | 131(30.0) | 319(73.2) | 117(26.8) | 371(85.1) | 65(14.9) | 352(80.7) | 84(19.3) | |
| Difficulty in attention and concentration | 220(69.0) | 99(31.0) | 217(68.0) | 102(32.0) | 256(80.3) | 63(19.7) | 261(81.8) | 58(18.2) | |
| Avoid activities that you enjoyed in the past | 47(68.1) | 22(31.9) | 55(79.7) | 14(20.3) | 47(68.1) | 22(31.9) | 59(85.5) | 10(14.5) | |
| Unexplained headaches or body pain | 91(60.3) | 60(39.7) | 114(75.5) | 37(24.5) | 102(67.5) | 49(32.5) | 126(83.4) | 23(16.6) | |
| Use of drugs and/or alcohol | 0(0.0) | 1(100.0) | 1(100.0) | 0(0.0) | 0(0.0) | 1(100) | 1(100.0) | 0(0.0) | |
| None of the above | 224(100) | 0(0.0) | 217(96.9) | 7(3.1) | 219(97.8) | 5(2.2) | 216(96.4) | 8(3.6) | |
| Recreational activities | Read a book | 228(86.7) | 35(13.3) | 229(87.1) | 34(12.9) | 231(87.8) | 32(12.2) | 239(90.9) | 24(9.1) |
| Dance or sing | 445(83.2) | 90(16.8) | 442(82.6) | 93(17.4) | 475(88.8) | 60(11.2) | 477(89.2) | 58(10.8) | |
| Make crafts | 370(85.6) | 62(35.8) | 340(78.7) | 92(21.3) | 390(90.3) | 42(9.7) | 391(90.5) | 41(9.5) | |
| Watch TV | 627(76.9) | 138(14.4) | 639(83.5) | 126(16.5) | 671(87.7) | 94(12.3) | 681(89.0) | 84(11.0) | |
| Use social networks | 252(83.7) | 49(16.3) | 266(88.4) | 35(11.6) | 245(81.4) | 56(18.6) | 270(89.7) | 31(10.3) | |
| Listen to music | 413(83.9) | 79(16.1) | 426(86.6) | 66(13.4) | 421(85.6) | 71(14.4) | 444(90.2) | 48(9.8) | |
| Exercise or yoga | 227(87.0) | 34(13.0) | 225(86.2) | 36(13.8) | 238(91.2) | 23(8.8) | 238(91.2) | 23(8.8) | |
| Cook | 262(83.7) | 51(16.3) | 267(85.3) | 46(14.7) | 265(84.7) | 48(15.3) | 281(89.8) | 32(10.2) | |
| Play an instrument | 73(79.3) | 19(20.7) | 71(77.2) | 21(22.8) | 79(85.9) | 13(14.1) | 78(84.8) | 14(15.2) | |
| Playing video games | 333(80.6) | 80(19.4) | 344(83.3) | 69(16.7) | 348(84.3) | 65(15.7) | 364(88.1) | 49(11.9) | |
| Using the cell phone or tablet | 691(82.3) | 149(17.7) | 710(84.5) | 130(15.5) | 731(87.0) | 109(13.0) | 744(86.6) | 96(11.4) | |
| Play (alone or accompanied) | 82(91.1) | 8(8.9) | 76(84.4) | 14(16.6) | 88(97.8) | 2(2.2) | 82(91.1) | 8(8.9) | |
| Paint and/or draw | 15(75.0) | 5(25.0) | 17(85.0) | 3(15.0) | 19(95.0) | 1(5.0) | 17(85.5) | 3(15.0) | |
| Use the pool | 11(73.3) | 4(26.7) | 10(66.7) | 5(33.3) | 13(86.7) | 2(13.3) | 12(80.0) | 3(20.0) | |
| Global score | Attention subscale | Depression/anxiety subscale | Behavior subscale | ||||||
|---|---|---|---|---|---|---|---|---|---|
| No Risk (n)(%) | Risk (n)(%) | No Risk (n)(%) | Risk (n)(%) | No Risk (n)(%) | Risk (n)(%) | No Risk (n)(%) | Risk (n)(%) | ||
|
Relationship with the child or adolescent |
Legal guardian | 32(76.2) | 10(23.8) | 31(73.8) | 11(26.2) | 36(85.7) | 6(14.3) | 37(88.1) | 5(11.9) |
| Father | 41(91.1) | 4(8.9) | 42(93.3) | 3(6.7) | 43(95.6) | 2(4.4) | 42(93.3) | 3(6.7) | |
| Mother | 742(82.4) | 159(17.6) | 760(84.4) | 141(15.6) | 779(86.5) | 122(13.5) | 800(88.8) | 101(11.2) | |
| Chi-Squared | 0.175 | 0.043* | 0.207 | 0.626 | |||||
| Cramer’s V | - | 0.080 | - | - | |||||
|
Age range |
3-5 years old | 282(81.5) | 64(18.5) | 278(80.3) | 68(19.7) | 333(96.2) | 13(3.8) | 302(87.3) | 44(12.7) |
| 6-9 years old | 229(82.4) | 49(17.6) | 220(79.1) | 58(20.9) | 235(84.5) | 43(15.5) | 248(89.2) | 30(10.8) | |
| 10-13 years old | 183(82.4) | 39(17.6) | 198(89.2) | 24(10.8) | 184(82.9) | 38(17.1) | 200(90.1) | 22(9.9) | |
| 14-17 years old | 121(85.2) | 21(14.8) | 137(96.5) | 5(3.5) | 106(74.6) | 36(25.4) | 129(90.8) | 13(9.2) | |
| Chi-Squared | 0.810 | 0.000* | 0.000* | 0.612 | |||||
| Cramer’s V | - | 0.173 | 0.224 | - | |||||
|
Labor status of the head of the household, prior to the state of emergency |
Informal employee | 25(78.1) | 7(21.9) | 30(93.8) | 2(6.3) | 26(81.3) | 6(18.8) | 27(84.4) | 5(15.6) |
| Formal employee | 514(83.7) | 100(16.3) | 517(84.2) | 97(15.8) | 539(87.8) | 75(12.2) | 560(91.2) | 54(8.8) | |
| Unemployed | 23(65.7) | 12(34.3) | 25(71.4) | 10(28.6) | 27(77.1) | 8(22.9) | 28(80.0) | 7(20.0) | |
| Self Employed / Independent | 253(82.4) | 54(17.6) | 261(85.0) | 46(15.0) | 266(86.6) | 41(13.4) | 264(86.0) | 43(14.0) | |
| Chi-Squared | 0.049* | 0.083* | 0.236 | 0.024* | |||||
| Cramer’s V | 0.089 | 0.082 | - | 0.098 | |||||
|
Current employment status of the head of the household |
Suspended | 164(81.2) | 38(18.8) | 167(82.7) | 35(17.3) | 176(87.1) | 26(12.9) | 174(86.1) | 28(13.9) |
| Employee | 581(84.1) | 110(15.9) | 593(85.8) | 98(14.2) | 606(87.7) | 85(12.3) | 626(90.6) | 65(9.4) | |
| Unemployed | 70(73.7) | 25(26.3) | 73(76.8) | 22(23.2) | 76(80.0) | 19(20.0) | 79(83.2) | 16(16.8) | |
| Chi-Squared | 0.038* | 0.061 | 0.114 | 0.034* | |||||
| Cramer’s V | 0.081 | - | - | 0.083 | |||||
|
Presence of patio or terrace in the home |
Yes | 467(86.0) | 76(14.0) | 474(87.3) | 69(12.7) | 474(87.3) | 68(12.7) | 490(90.2) | 53(9.8) |
| I don’t know | 1(100.0) | 0(0) | 1(100.0) | 0(0) | 1(100.0) | 0(0) | 1(100.0) | 0(0) | |
| No | 347(78.2) | 97(21.8) | 358(80.6) | 86(19.4) | 383(86.3) | 61(13.7) | 388(89.0) | 56(11.0) | |
| Chi-Squared | 0.005* | 0.015* | 0.827 | 0.342 | |||||
| Cramer’s V | 0.104 | 0.092 | - | - | |||||
|
Presence of siblings in the home |
Yes | 520(80.2) | 128(19.8) | 548(84.6) | 100(15.4) | 546(84.3) | 102(15.7) | 563(86.9) | 85(13.1) |
| No | 295(86.8) | 45(13.2) | 285(83.8) | 55(16.2) | 312(91.8) | 28(8.2) | 316(92.9) | 24(7.1) | |
| Chi-Squared | 0.010* | 0.760 | 0.001* | 0.004* | |||||
| Cramer’s V | 0.081 | - | 0.105 | 0.092 | |||||
|
Number of people living in the home |
5 or more people | 236(78.9) | 63(21.1) | 253(84.6) | 46(15.4) | 253(84.6) | 46(15.4) | 252(84.3) | 47(15.7) |
| 4 people | 299(84.5) | 55(15.5) | 296(83.6) | 58(16.4) | 308(87.0) | 46(13.0) | 321(90.7) | 33(9.3) | |
| 3 people | 219(82.6) | 46(17.4) | 225(84.9) | 40(15.1) | 233(87.9) | 32(12.1) | 241(90.9) | 24(9.1) | |
| 2 people | 61(87.1) | 9(12.9) | 59(84.3) | 11(15.7) | 64(91.4) | 6(8.6) | 65(92.9) | 5(7.1) | |
| Chi-Squared | 0.201 | 0.974 | 0.413 | 0.020* | |||||
| Cramer’s V | - | - | - | 0.100 | |||||
|
Difficulty sleeping |
Yes | 194(69.5) | 85(30.5) | 209(74.9) | 70(25.1) | 213(76.3) | 66(23.7) | 235(84.2) | 44(15.8) |
| I don’t know | 8(88.9) | 1(11.1) | 9(100.0) | 0(0) | 7(77.8) | 2(22.2) | 8(88.9) | 1(11.1) | |
| No | 613(87.6) | 87(12.4) | 615(87.9) | 85(12.1) | 638(91.1) | 62(8.9) | 636(90.9) | 64(9.1) | |
| Chi-Squared | 0.000* | 0.000* | 0.000* | 0.012* | |||||
| Cramer’s V | 0.214 | 0.165 | 0.198 | 0.950 | |||||
|
Dreams related to COVID-19 |
Yes | 61(64.2) | 34(35.8) | 73(76.8) | 22(23.2) | 64(67.4) | 31(32.6) | 84(88.4) | 11(11.6) |
| I don’t know | 98(71.0) | 40(29.0) | 108(78.3) | 30(21.7) | 111(80.4) | 27(19.6) | 109(79.0) | 29(21.0) | |
| No | 656(86.9) | 99(13.1) | 652(86.4) | 103(13.6) | 683(90.5) | 72(9.5) | 686(90.9) | 69(9.1) | |
| Chi-Squared | 0.000* | 0.006* | 0.000* | 0.000* | |||||
| Cramer’s V | 0.213 | 0.102 | 0.214 | 0.130 | |||||
|
Afraid that a loved one will develop COVID-19 |
Yes | 319(77.8) | 91(22.2) | 337(82.2) | 73(17.8) | 326(79.5) | 84(20.5) | 366(89.3) | 44(10.7) |
| I don’t know | 28(77.8) | 8(22.2) | 30(83.3) | 6(16.7) | 29(80.6) | 7(19.4) | 30(83.3) | 6(16.7) | |
| No | 468(86.3) | 74(13.7) | 466(86.6) | 76(14.0) | 503(92.8) | 39(7.2) | 483(89.1) | 59(10.9) | |
| Chi-Squared | 0.002* | 0.279 | 0.000* | 0.545 | |||||
| Cramer’s V | 0.112 | - | 0.195 | - | |||||
|
Afraid that they themselves will develop COVID-19 |
Yes | 282(78.3) | 78(21.7) | 298(82.8) | 62(17.2) | 289(80.3) | 71(19.7) | 326(90.6) | 34(9.4) |
| I don’t know | 24(68.6) | 11(31.4) | 30(85.7) | 5(14.3) | 25(71.4) | 10(28.6) | 26(74.3) | 9(25.7) | |
| No | 509(85.8) | 84(14.2) | 505(85.2) | 88(14.8) | 544(91.7) | 49(8.3) | 527(88.9) | 66(11.1) | |
| Chi-Squared | 0.001* | 0.602 | 0.000* | 0.013* | |||||
| Cramer’s V | 0.117 | - | 0.184 | 0.093 | |||||
| More attached to caregiver | Yes | 437(77.3) | 128(22.7) | 450(79.6) | 115(20.4) | 483(85.5) | 82(14.5) | 493(87.3) | 72(12.7) |
| I don’t know | 32(82.1) | 7(17.9) | 31(79.5) | 8(20.5) | 34(87.2) | 5(12.8) | 33(84.6) | 6(15.4) | |
| No | 346(90.1) | 38(9.9) | 352(91.7) | 32(8.3) | 341(88.8) | 43(11.2) | 353(91.9) | 31(8.1) | |
| Chi-Squared | 0.000* | 0.000* | 0.332 | 0.053 | |||||
| Cramer’s V | 0.162 | 0.161 | - | - | |||||
|
Expressed boredom |
Yes | 578(78.6) | 157(21.4) | 601(81.8) | 134(18.2) | 612(83.3) | 123(16.7) | 638(86.8) | 97(13.2) |
| I don’t know | 8(100.0) | 0(0) | 7(87.5) | 1(12.5) | 7(87.5) | 1(12.5) | 7(87.5) | 1(12.5) | |
| No | 229(93.5) | 16(6.5) | 225(91.8) | 20(8.2) | 239(97.6) | 6(2.4) | 234(95.5) | 11(4.5) | |
| Chi-Squared | 0.000* | 0.001* | 0.000* | 0.001* | |||||
| Cramer’s V | 0.173 | 0.120 | 0.182 | 0.120 | |||||
| Desire for information about COVID-19 | Try not to talk or do a lot of investigation | 475(84.1) | 90(15.9) | 477(84.4) | 88(15.6) | 502(88.8) | 63(11.2) | 501(88.7) | 64(11.3) |
| Talk or do a lot of investigation | 57(67.9) | 27(32.1) | 69(82.1) | 15(17.9) | 65(77.4) | 19(22.6) | 70(83.3) | 14(16.7) | |
| Talk or do enough investigation | 283(83.5) | 56(16.5) | 287(84.7) | 52(15.3) | 291(85.8) | 48(14.2) | 308(90.9) | 31(9.1) | |
| Chi-Squared | 0.001* | 0.846 | 0.012* | 0.135 | |||||
| Cramer’s V | 0.118 | - | 0.095 | - | |||||
*Indicates statistical significance at p < 0.05 (Chi-square test).
Disclaimer/Publisher’s Note: The statements, opinions and data contained in all publications are solely those of the individual author(s) and contributor(s) and not of MDPI and/or the editor(s). MDPI and/or the editor(s) disclaim responsibility for any injury to people or property resulting from any ideas, methods, instructions or products referred to in the content. |
© 2025 by the authors. Licensee MDPI, Basel, Switzerland. This article is an open access article distributed under the terms and conditions of the Creative Commons Attribution (CC BY) license (http://creativecommons.org/licenses/by/4.0/).
Copyright: This open access article is published under a Creative Commons CC BY 4.0 license, which permit the free download, distribution, and reuse, provided that the author and preprint are cited in any reuse.


