
Submitted:
18 July 2025
Posted:
21 July 2025
You are already at the latest version
Abstract
The PA Licensure Compact (PALC) is an optional agreement between states that aims to increase healthcare services for patients by allowing PA’s with a license in a compact member state to practice in any other member state. Currently eighteen states have enacted the PALC. A study was conducted assessing factors that impact a states decision to join the PALC. State population density, number of PA programs, number of medical schools, rural population, rural land area, rural population density, number of PA’s in each state, percentage of PA’s in each state, PA’s that participate in telemedicine, and number of physicians in each state with stratification into neonatal, cardiovascular, critical care, endocrinology, oncology, gastroenterology, and emergency medicine were analyzed in a logistic regression design. The number of PA Programs and PA’s in each state, number of physicians practicing in the US, cardiovascular, gastroenterology, and emergency medicine were found to be statistically significant (P
Keywords:
PA Compact
; interstate
; healthcare access
Introduction
An interstate compact is a legally binding agreement between two or more states that embodies a mutual recognition model of interstate practice. It establishes a formal, legal relationship among states to address a common problem. The PA Licensure Compact (PALC) can be described as an interstate occupational licensure compact for physician assistants/associates designed to improve access to healthcare for patients and in addition enhance public protection. It is the result of collaboration among the Federation of State Medical Boards (FSMB), the American Academy of Physician Associates (AAPA), the National Commission on Certification of Physician Assistants (NCCPA), and the Council of State Governments (CSG). The PALC received funding from the Health Resources and Services Administration of the US Department of Health and Human Services (H1MRH24097). This accomplishment demonstrates the power of partnerships and support in improving access to healthcare for all.[1] The four entities drafted a model legislation and disseminated it to state medical boards and interested parties in April 2021. Comments and recommendations from stakeholders were incorporated into the final PALC document in November 2022. The first states to enact the PALC were Utah, Delaware, and Wisconsin near the end of 2023. Key points of the legislation include: 1) states joining the compact agree to recognize a valid, unencumbered license issued by another compact member state via a compact privilege, 2) Licensed PA’s utilizing the compact can obtain a privilege in each compact member state where they intend to practice, 3) PA’s that choose to utilize a compact privilege must adhere to the laws and regulations of the state in which they are practicing, 4) eligibility of the PALC is predicated on having an active license from a compact license state, have graduated from an accredited PA Program, have current NCCPA certification, and are devoid of any felonies or misdemeanor convictions.[2] Adoption of the PALC by states serves to promote workforce development, expands patient access to highly qualified clinicians, reduces application processing time for PA’s wanting to practice in another state compared to applying for an individual license for state(s), preserves state sovereignty, increases collaboration among states, engenders clinician mobility during public health emergencies, and accommodates PA’s whose spouses are in the military. Moreover, a practicing PA can maintain licensure and avoid licensing-related downtime between employers as long as relevant states are PALC members[1].
There are 19 states that have enacted legislation to join the PALC. They include Arkansas, Colorado, Connecticut, Delaware, Iowa, Kansas, Maine, Minnesota, Montana, Nebraska, North Carolina, Ohio, Oklahoma, Tennessee, Utah, Virginia, Washington, West Virginia, and Wisconsin (Figure 1). States that are in the process of filing legislation comprise Illinois, Massachusetts, New Jersey, New York, Nevada, Texas, and Oregon. Activation of the PALC is predicated on at least 7 states enacting legislation; this threshold was achieved on April 4, 2024 when the Governor of Virginia signed the bill. A study was done to assess national factors that may have influenced enactment of the PALC. A logistic regression analysis was conducted evaluating 17 variables that relate to a state’s rural metrics, number of PA schools and medical schools in the US, number of PA’s that are active in telemedicine, number of PA’s and MD’s across the US, and the number of MD’s that practice in select specialties. The heterogenous nature of variables selected will provide insight into the posture of state legislatures decision to join the PALC.
Methods
Binary logistic regression was employed in this study using state as the unit of analysis. The dependent variable was coded 1 for a state that has enacted the PALC, and coded 0 if they have not enacted legislation. The independent variables were state population density, number of PA programs, number of medical schools, rural population, rural land area, rural population density, number of PA’s in each state, percentage of PA’s in each state, PA’s that participate in telemedicine, and number of physicians in each state with stratification into neonatal, cardiovascular, critical care, endocrinology, oncology, gastroenterology, and emergency medicine. All of the independent variables were continuous or scale variables. Data for state population density was accessed from worldpopulationreview.com for 2025. The number of PA programs by state was accessed from the ARC-PA (Accreditation Review Commission for PA). The number of medical schools in the US was accessed from the Liaison Committee on Medical Education (LCME). Rural population, rural land area, and rural population density was accessed by worldpopulationreview.com for 2023, 2010, and 2010, respectively. The number of PA’s in each state, percent of total PA’s in the US, and number PA’s that participated in telemedicine was accessed by data provided in the NCCPA Statistical Profile of Board Certified PA’s for 2023. Data for active physicians in the US and specialties was accessed by the 2023 US Physician Workforce Data Dashboard AAMC (Association of American Medical Colleges). The binary logistic regression analysis was done using SPSS (v29) employing the Backward Wald method. Goodness of fit model design was assessed using the Hosmer and Lemeshow Test. Statistical significance was defined as P<.05.
Results
Variables found to be statistically significant (P<.05) were the number of PA Programs and PA’s in the US, number of physicians in the US, number of physicians practicing in cardiovascular, gastroenterology, and emergency medicine. Using the beta coefficient in the logistic regression analysis, the number of PA Programs, PA’s, and overall number of physicians practicing in the US represented a direct relationship denoted by a positive Beta coefficient, where the number of physicians practicing in cardiovascular, gastroenterology, and emergency departments represented an inverse relationship denoted by a negative beta coefficient (Table 1). The Hosmer and Lemeshow Test yielded values >.05 indicating a favorable goodness of fit for the regression model employed.
Discussion
This study found six variables to be statistically significant using binary logistic regression. The number of PA programs, PA’s in each state, and number of MD’s practicing in the US were direct relationships, and physicians working in cardiovascular, gastroenterology, and emergency medicine were inverse relationships. This can be interpreted as a state is more likely to enact the PALC as the number of PA’s and PA programs increase, and the number of MD’s increase; and, low numbers of physicians working in cardiovascular, gastroenterology, and emergency medicine may favor a state enacting the PALC. Interestingly, variables related to rural metrics and telemedicine were not found to be statistically significant. Currently there are 311 accredited PA Programs[3]. The range of PA Programs in states that are members of the PALC ranged from 1 (Delaware, Maine, Montana) to 17 (Oklahoma). The range of PA Programs in states not members of the PALC ranged from 0 (Alaska, Vermont) to 31 (Pennsylvania). The rationale for the significant finding regarding the PA’s and PA Programs variable could be that the more PA Programs, the more students that graduate and go onto practice medicine opting for being licensed in more than one state.
The other variable that yielded a direct relationship was the number of practicing physicians in the US across all specialties. The range for the number of physicians in member states ranged from 2947 (Montana) to 36757 (Ohio). The range for non-member states is 2152 (Alaska) to 118491 (California). Of the 7 specialties selected for inclusion, only cardiology, gastroenterology, and emergency medicine were found to be statistically significant and each exhibited an inverse relationship. The range for MD’s in cardiology among member states was 48 (Montana) to 841 (Ohio); the range for non-member states was 25 (Wyoming) to 2324 (California). The range for MD’s in gastroenterology in member states was 32 (Montana) to 576 (Ohio); non-member states ranged from 12 (Wyoming) to 1857 (California); for emergency medicine the ranges were 155 (Delaware) to 2011 (Ohio), and 93 (North Dakota) to 6155 (California), respectively. Decreased numbers of physician’s in the cardiovascular, gastroenterology, and emergency medicine departments compared to all departments and specialties invite a conversation there is a need for PA’s in these areas garnering support for the PALC. In support of this assertion, in the sphere of emergency medicine, a study was done assessing attrition of physicians in the ER from 2013 to 2019. Researchers found a decrease in men and women from 3.3 percent to 7.4 percent, and 2.8 percent to 8.2%, respectively.[4] A total of 25,839 males and 10,954 women were included in the study. They also noted female gender was significantly associated with attrition at 12 years younger than their male counterpart. In regard to the cardiovascular variable, with heart disease as the number one cause of death in the US, nearly half of all US counties lack a practicing cardiologist which translates to a 31 percent higher risk of heart disease and related complications in these areas. Moreover, sixty percent of cardiologists are older than 55 years.[5] These statistics tip the pendulum in favor of the PALC expanding access of medical care.
Architects of the PALC had a plethora of compact agreements to reference in crafting their document. The Nurse Licensure Compact[6] was established in 1999 by the National Council of State Board of Nursing allowing nurses to work in other states. Other health related compacts include the Interstate Medical Licensure Compact[7], Physical Therapy Compact[8], Psychology Interjurisdictional Compact[9], Emergency Medical Services Compact[10], Audiology & Speech-language Pathology Interstate Compact[11], Dentist and Dental Hygienist Compact[12], Occupational Therapy Licensure Compact[13], Social Work Licensure Compact[14], and Dietitian Licensure Compact[15] to name a few. All of these compacts share a common thread that healthcare licensure portability is a salient issue for healthcare professionals traversing state lines. In addition, a provision for telehealth services allows for flexibility and greater access to healthcare services particularly in rural areas; this was especially evident during the COVID-19 pandemic when many patients were told early on not to come to their doctor’s office to curtail the spread of the virus; predictably, telemedicine activities continued to rise after the pandemic exceeding pre-pandemic levels.[16,17] The percentage of PA’s that practice telemedicine in member states was 34 (Connecticut) to 53.4 (Utah); in non-members it was 32 (New York) to 62 (Alaska). Lack of statistical significance for this variable may be the result of the normalization of telemedicine from the pandemic across all states. Rural parameters analyzed in this study such as rural population, rural land area, and rural population density also did not yield statistical significance. There are no other studies that included these parameters in a regression design to offer a comparison of findings.
A poll was conducted in 2024, assessing the percentage of PA’s that favored the PALC. The sample consisted of 454 PA’s from Barton Associates (Peabody, Mass). Ninety-nine percent of respondents agreed that the PALC should be implemented. The majority of PAs surveyed articulated they would be more likely to consider working in a different state if there was a compact; in addition, they stated the compact will increase patient access to highquality healthcare; 99.5% of respondents agree that every state should implement the PALC.[18]
There is a paucity of papers in the literature covering the PALC given it is still in its infancy. This study represents the first paper analyzing 17 factors toward the enactment of the PALC. Limitations of the study involved lack of data in the state of Alaska for the Neonatal specialty, lack of data in Alaska and North Dakota for the Endocrinology specialty, and lack of data in Wyoming for Neonatal, Endocrinology, and Critical Care.
Conclusions
This study identified factors that were found to be statistically significant toward states enacting the PALC. The number of PA Programs and physicians practicing in the US across all specialties and departments were found to be direct relationships, where physicians working in cardiovascular and emergency medicine yielded indirect relationships. The PALC aims to increase the ability for PA’s to travel to a new state to provide essential healthcare services to patients in need, inclusive of telemedicine provisions. To date, 19 states have enacted the PALC. It will be informative to track outcomes and metrics at regular intervals of the PALC as well as hear from PA’s on their experiences.
Appendix A. Raw Data
| State | PALC | PDen | PAPGM | MED | RP | RLA | RPD | #PA | %PA | #MD | TM | NN | CV | CC | EN | ON | GE | EM |
| AL | No | 103 | 4 | 2 | 42 | 95.6 | 40.4 | 1312 | 0.7 | 11387 | 33.5 | 68 | 275 | 173 | 74 | 196 | 194 | 460 |
| AK | No | 1 | 0 | 0 | 35 | 100 | 0.4 | 690 | 0.4 | 2152 | 62 | * | 26 | 18 | * | 20 | 13 | 161 |
| AZ | No | 68 | 5 | 2 | 11.5 | 98.1 | 5.8 | 3947 | 2.2 | 18942 | 47.1 | 81 | 399 | 294 | 121 | 306 | 312 | 1045 |
| AR | Yes | 60 | 2 | 2 | 43.9 | 97.9 | 25.1 | 685 | 0.4 | 6842 | 42.4 | 50 | 152 | 81 | 45 | 104 | 97 | 310 |
| CA | No | 255 | 20 | 13 | 5.8 | 94.7 | 12.7 | 14023 | 7.9 | 118491 | 54.3 | 770 | 2324 | 1757 | 992 | 1998 | 1857 | 6155 |
| CO | Yes | 58 | 4 | 1 | 14.4 | 98.5 | 6.8 | 4860 | 2.7 | 17896 | 51 | 101 | 286 | 303 | 114 | 240 | 246 | 1176 |
| CT | Yes | 766 | 6 | 3 | 13.8 | 62.3 | 142 | 3198 | 1.8 | 13728 | 34 | 88 | 395 | 232 | 176 | 285 | 292 | 574 |
| DE | Yes | 548 | 1 | 0 | 17.9 | 79.1 | 97.3 | 523 | 0.3 | 3049 | 38.9 | 31 | 65 | 38 | 21 | 42 | 48 | 155 |
| FL | No | 445 | 16 | 8 | 9.1 | 86.2 | 35.9 | 11821 | 6.6 | 62202 | 39.4 | 390 | 1681 | 1026 | 531 | 1121 | 1221 | 3238 |
| GA | No | 196 | 7 | 4 | 26.6 | 91.7 | 45.8 | 5087 | 2.9 | 26315 | 37.3 | 161 | 632 | 430 | 212 | 403 | 444 | 1322 |
| HI | No | 226 | 1 | 1 | 14 | 93.9 | 18.2 | 502 | 0.3 | 4592 | 58.2 | 25 | 67 | 57 | 21 | 43 | 54 | 302 |
| ID | No | 25 | 1 | 0 | 30.8 | 99.4 | 5.6 | 1548 | 0.9 | 3723 | 49.1 | 27 | 74 | 32 | 14 | 36 | 60 | 258 |
| IL | No | 230 | 9 | 8 | 13.2 | 92.9 | 28.6 | 4738 | 2.7 | 38252 | 43.7 | 329 | 917 | 654 | 383 | 704 | 673 | 1985 |
| IN | No | 195 | 8 | 1 | 28.9 | 93 | 53.7 | 2392 | 1.3 | 16406 | 32.5 | 120 | 386 | 266 | 147 | 265 | 237 | 851 |
| IA | Yes | 58 | 5 | 1 | 37.3 | 98.3 | 20 | 1455 | 0.9 | 7280 | 44.2 | 50 | 161 | 123 | 49 | 109 | 93 | 271 |
| KS | Yes | 37 | 2 | 1 | 28.2 | 98.8 | 9.1 | 1409 | 0.8 | 7073 | 42.7 | 37 | 161 | 115 | 49 | 110 | 91 | 301 |
| KY | No | 117 | 4 | 2 | 41.6 | 96.4 | 47.4 | 1899 | 1.1 | 10945 | 41.4 | 83 | 258 | 190 | 68 | 189 | 194 | 583 |
| LA | No | 107 | 4 | 3 | 29.1 | 95.4 | 29.5 | 1678 | 0.9 | 13036 | 37.8 | 87 | 309 | 211 | 110 | 199 | 226 | 728 |
| ME | Yes | 46 | 1 | 0 | 61.5 | 98.8 | 26.7 | 1098 | 0.6 | 4581 | 40.9 | 13 | 114 | 64 | 30 | 66 | 59 | 301 |
| MD | No | 650 | 5 | 3 | 14.7 | 79.4 | 96 | 3769 | 2.1 | 24517 | 37.8 | 141 | 549 | 471 | 315 | 604 | 431 | 999 |
| MA | No | 924 | 9 | 4 | 8.9 | 61.7 | 109 | 4867 | 2.7 | 33530 | 40.9 | 208 | 899 | 687 | 487 | 906 | 618 | 1382 |
| MI | No | 180 | 10 | 6 | 27.1 | 93.6 | 47.5 | 6983 | 3.9 | 30888 | 43.8 | 146 | 631 | 516 | 258 | 507 | 429 | 2033 |
| MN | Yes | 73 | 5 | 2 | 28.9 | 97.9 | 18.2 | 3818 | 2.1 | 18476 | 50.7 | 89 | 449 | 352 | 177 | 387 | 316 | 865 |
| MS | No | 63 | 2 | 1 | 54.4 | 97.6 | 32.8 | 424 | 0.2 | 5990 | 37.4 | 46 | 132 | 80 | 57 | 92 | 107 | 347 |
| MO | No | 91 | 5 | 4 | 30.8 | 97 | 26.6 | 1739 | 1 | 19228 | 39.1 | 170 | 443 | 450 | 190 | 308 | 318 | 889 |
| MT | Yes | 8 | 1 | 0 | 47.1 | 99.8 | 3 | 949 | 0.5 | 2947 | 47.6 | 14 | 48 | 39 | 16 | 41 | 32 | 210 |
| NE | Yes | 26 | 4 | 2 | 28.1 | 99.3 | 6.4 | 1542 | 0.9 | 4994 | 43.8 | 25 | 112 | 100 | 46 | 84 | 78 | 182 |
| NV | No | 30 | 2 | 3 | 6.2 | 99.3 | 1.4 | 1287 | 0.7 | 6921 | 46 | 41 | 132 | 90 | 61 | 86 | 95 | 438 |
| NH | No | 158 | 2 | 1 | 42.4 | 92.8 | 62.9 | 1117 | 0.6 | 4522 | 43.4 | 15 | 112 | 102 | 32 | 89 | 85 | 281 |
| NJ | No | 1308 | 6 | 4 | 6.3 | 60.3 | 106 | 4664 | 2.6 | 28299 | 34.1 | 201 | 930 | 435 | 341 | 569 | 624 | 1183 |
| NM | No | 18 | 1 | 1 | 24.7 | 99.3 | 3.9 | 966 | 0.5 | 5432 | 49.8 | 35 | 94 | 81 | 40 | 81 | 78 | 371 |
| NY | No | 424 | 29 | 15 | 12.9 | 91.3 | 54.6 | 16168 | 9.1 | 78362 | 32 | 531 | 2304 | 1457 | 906 | 1801 | 1625 | 3360 |
| NC | Yes | 231 | 12 | 4 | 33.3 | 90.5 | 73.5 | 9115 | 5.1 | 29042 | 43.1 | 192 | 677 | 480 | 252 | 599 | 519 | 1557 |
| ND | No | 12 | 1 | 1 | 39.3 | 99.7 | 3.9 | 408 | 0.2 | 1921 | 50 | 18 | 24 | 28 | * | 29 | 25 | 93 |
| OH | Yes | 292 | 17 | 6 | 24 | 89.2 | 69.9 | 5264 | 3 | 36757 | 36.4 | 279 | 841 | 732 | 292 | 630 | 576 | 2011 |
| OK | Yes | 60 | 5 | 1 | 35.8 | 98.1 | 18.8 | 2019 | 1.1 | 8456 | 40.3 | 62 | 176 | 104 | 52 | 120 | 123 | 433 |
| OR | No | 45 | 3 | 1 | 19.7 | 98.9 | 7.7 | 2521 | 1.4 | 13420 | 57 | 62 | 212 | 220 | 94 | 226 | 183 | 851 |
| PA | No | 294 | 31 | 7 | 23.6 | 89.5 | 67.7 | 11471 | 6.4 | 43739 | 41.7 | 348 | 1234 | 849 | 417 | 929 | 855 | 2098 |
| RI | No | 1084 | 2 | 1 | 9.7 | 61.3 | 154 | 618 | 0.3 | 4103 | 42.6 | 25 | 108 | 80 | 36 | 89 | 81 | 244 |
| SC | No | 185 | 5 | 3 | 31.8 | 92.1 | 56.3 | 2730 | 1.5 | 12918 | 39.2 | 70 | 276 | 190 | 92 | 192 | 209 | 888 |
| SD | No | 12 | 1 | 1 | 42.3 | 99.7 | 4.7 | 723 | 0.4 | 2288 | 44.4 | 22 | 38 | 29 | 16 | 33 | 32 | 103 |
| TN | Yes | 177 | 12 | 5 | 34.7 | 93 | 55.6 | 3202 | 1.8 | 18414 | 38.8 | 138 | 447 | 340 | 136 | 337 | 311 | 818 |
| TX | No | 122 | 14 | 13 | 17 | 96.7 | 15.2 | 11687 | 6.6 | 70589 | 47.7 | 579 | 1435 | 1088 | 603 | 1287 | 1195 | 3829 |
| UT | Yes | 43 | 4 | 1 | 10.8 | 98.9 | 3.2 | 2211 | 1.2 | 7812 | 53.4 | 67 | 125 | 120 | 44 | 123 | 117 | 516 |
| VT | No | 70 | 0 | 1 | 66.1 | 98.3 | 42.2 | 478 | 0.3 | 2523 | 45.6 | 13 | 43 | 49 | 19 | 46 | 26 | 147 |
| VA | Yes | 225 | 9 | 4 | 24.9 | 93.3 | 53.3 | 4812 | 2.7 | 23917 | 39.6 | 155 | 507 | 392 | 238 | 376 | 394 | 1292 |
| WA | Yes | 121 | 2 | 2 | 16.6 | 96.4 | 16.7 | 4160 | 2.3 | 22772 | 49.1 | 92 | 359 | 343 | 161 | 438 | 376 | 1238 |
| WV | Yes | 74 | 5 | 2 | 55.2 | 97.3 | 40.6 | 1150 | 0.6 | 5090 | 43.4 | 20 | 110 | 80 | 55 | 72 | 70 | 240 |
| WI | Yes | 111 | 5 | 2 | 33.6 | 96.5 | 32.5 | 3673 | 2.1 | 16759 | 43.9 | 103 | 323 | 256 | 132 | 291 | 248 | 921 |
| WY | No | 6 | 0 | 0 | 37.4 | 99.8 | 2 | 310 | 0.2 | 1265 | 51.7 | * | 25 | * | * | 15 | 12 | 94 |
References
- Ogunfiditimi, F. The PA Licensure Compact: a commonsense step. JAAPA 2024; 37(3):16.
- https://www.pacompact.org/about-pa-licensure-compact/.
- https://www.arc-pa.org.
- Gettel CJ, Courtney DM, Agrawl P, et al. Emergency medicine physician workforce attrition differences by age and gender. Acad Emerg Med 2023; 30(11):1092-1100. [CrossRef]
- https://medicushcs.com/resources/an-inside-look-at-the-cardiology-workforce-shortages-demand-and-strategic-responses.
- Evans S. The Nurse Licensure Compact. A historical perspective. J Nurs Regul 2015; 6(3):11-16.
- Federation of State Medical Boards. Report of the Special Committee on License Portability 2002https://www.fsmb.org/siteasets/advocacy/policies/grpol-license-portability.pdf.
- Adrian L. The Physical Therapy Compact: from development to implementation. Int J Telerehabilitation. 2017; 9(2):59-62. [CrossRef]
- Psychology Interjurisdictional Compact. History-Psychology Interjurisdictional Compact (PSYPACT). https://psypact.site-ym.com.
- Interstate Commission for EMS Personnel Practice. Compact History.2023 https://www.emscompact.gov/the-compct/compact-history.
- American Speech-Language-Hearing Association. Audiology and Speech-Language Pathology Interstate Compact (ASLP-IC): Partners and updates.2022 https://www.asha.org/advocacy/state/audiology-and-speech-language-pathology-interstate-compact-partners-and-upates/.
- Dentist and Dental Hygienist Compact. National Center for Interstate Compacts. The Council of State Governments. https://ddhcompact.org/2023/03/15/dentist-and-dental-hygienist-compact-finalized/.
- Occupational therapy Licensure Compact. OT Compact legislation finalized 2020. https://otcompact.gov/legislation.
- National Center for Interstate Compacts, The Council of State Governments. Social Worker Licensure Compact.2022 https://naswcanews.org/wp-content/uploads/2022/06/CSG-Social-Worker-Licensure-Compact-Update_June-2022/pdf.
- Academy of Nutrition and Dietetics. Academy to explore RDN licensure compact 2022. https://www.eatrightpro.org/neews-center/public-policy-news/academy-to-explore-rdn-licensure-compact.
- Bogulski CA, Allison K, Hayes CJ et al. Trends in US State and Territory Participation in Interstate Healthcare Licensure Compacts (2015-2024). J Med Reg 2025; 111(1):8-25.
- Shaver J. The State of Telehealth Before and After the COVID-19 Pandemic. Prim Care 2022; 49(4):517-530. [CrossRef]
- https://www.abc27.com/business/press-releases/cision/20240509NE0975...-pas-say-the-pa-licensure-compact-is-taking-t00-long-to-implement.
Figure 1.
Map of states that have enacted the PALC are depicted in yellow.
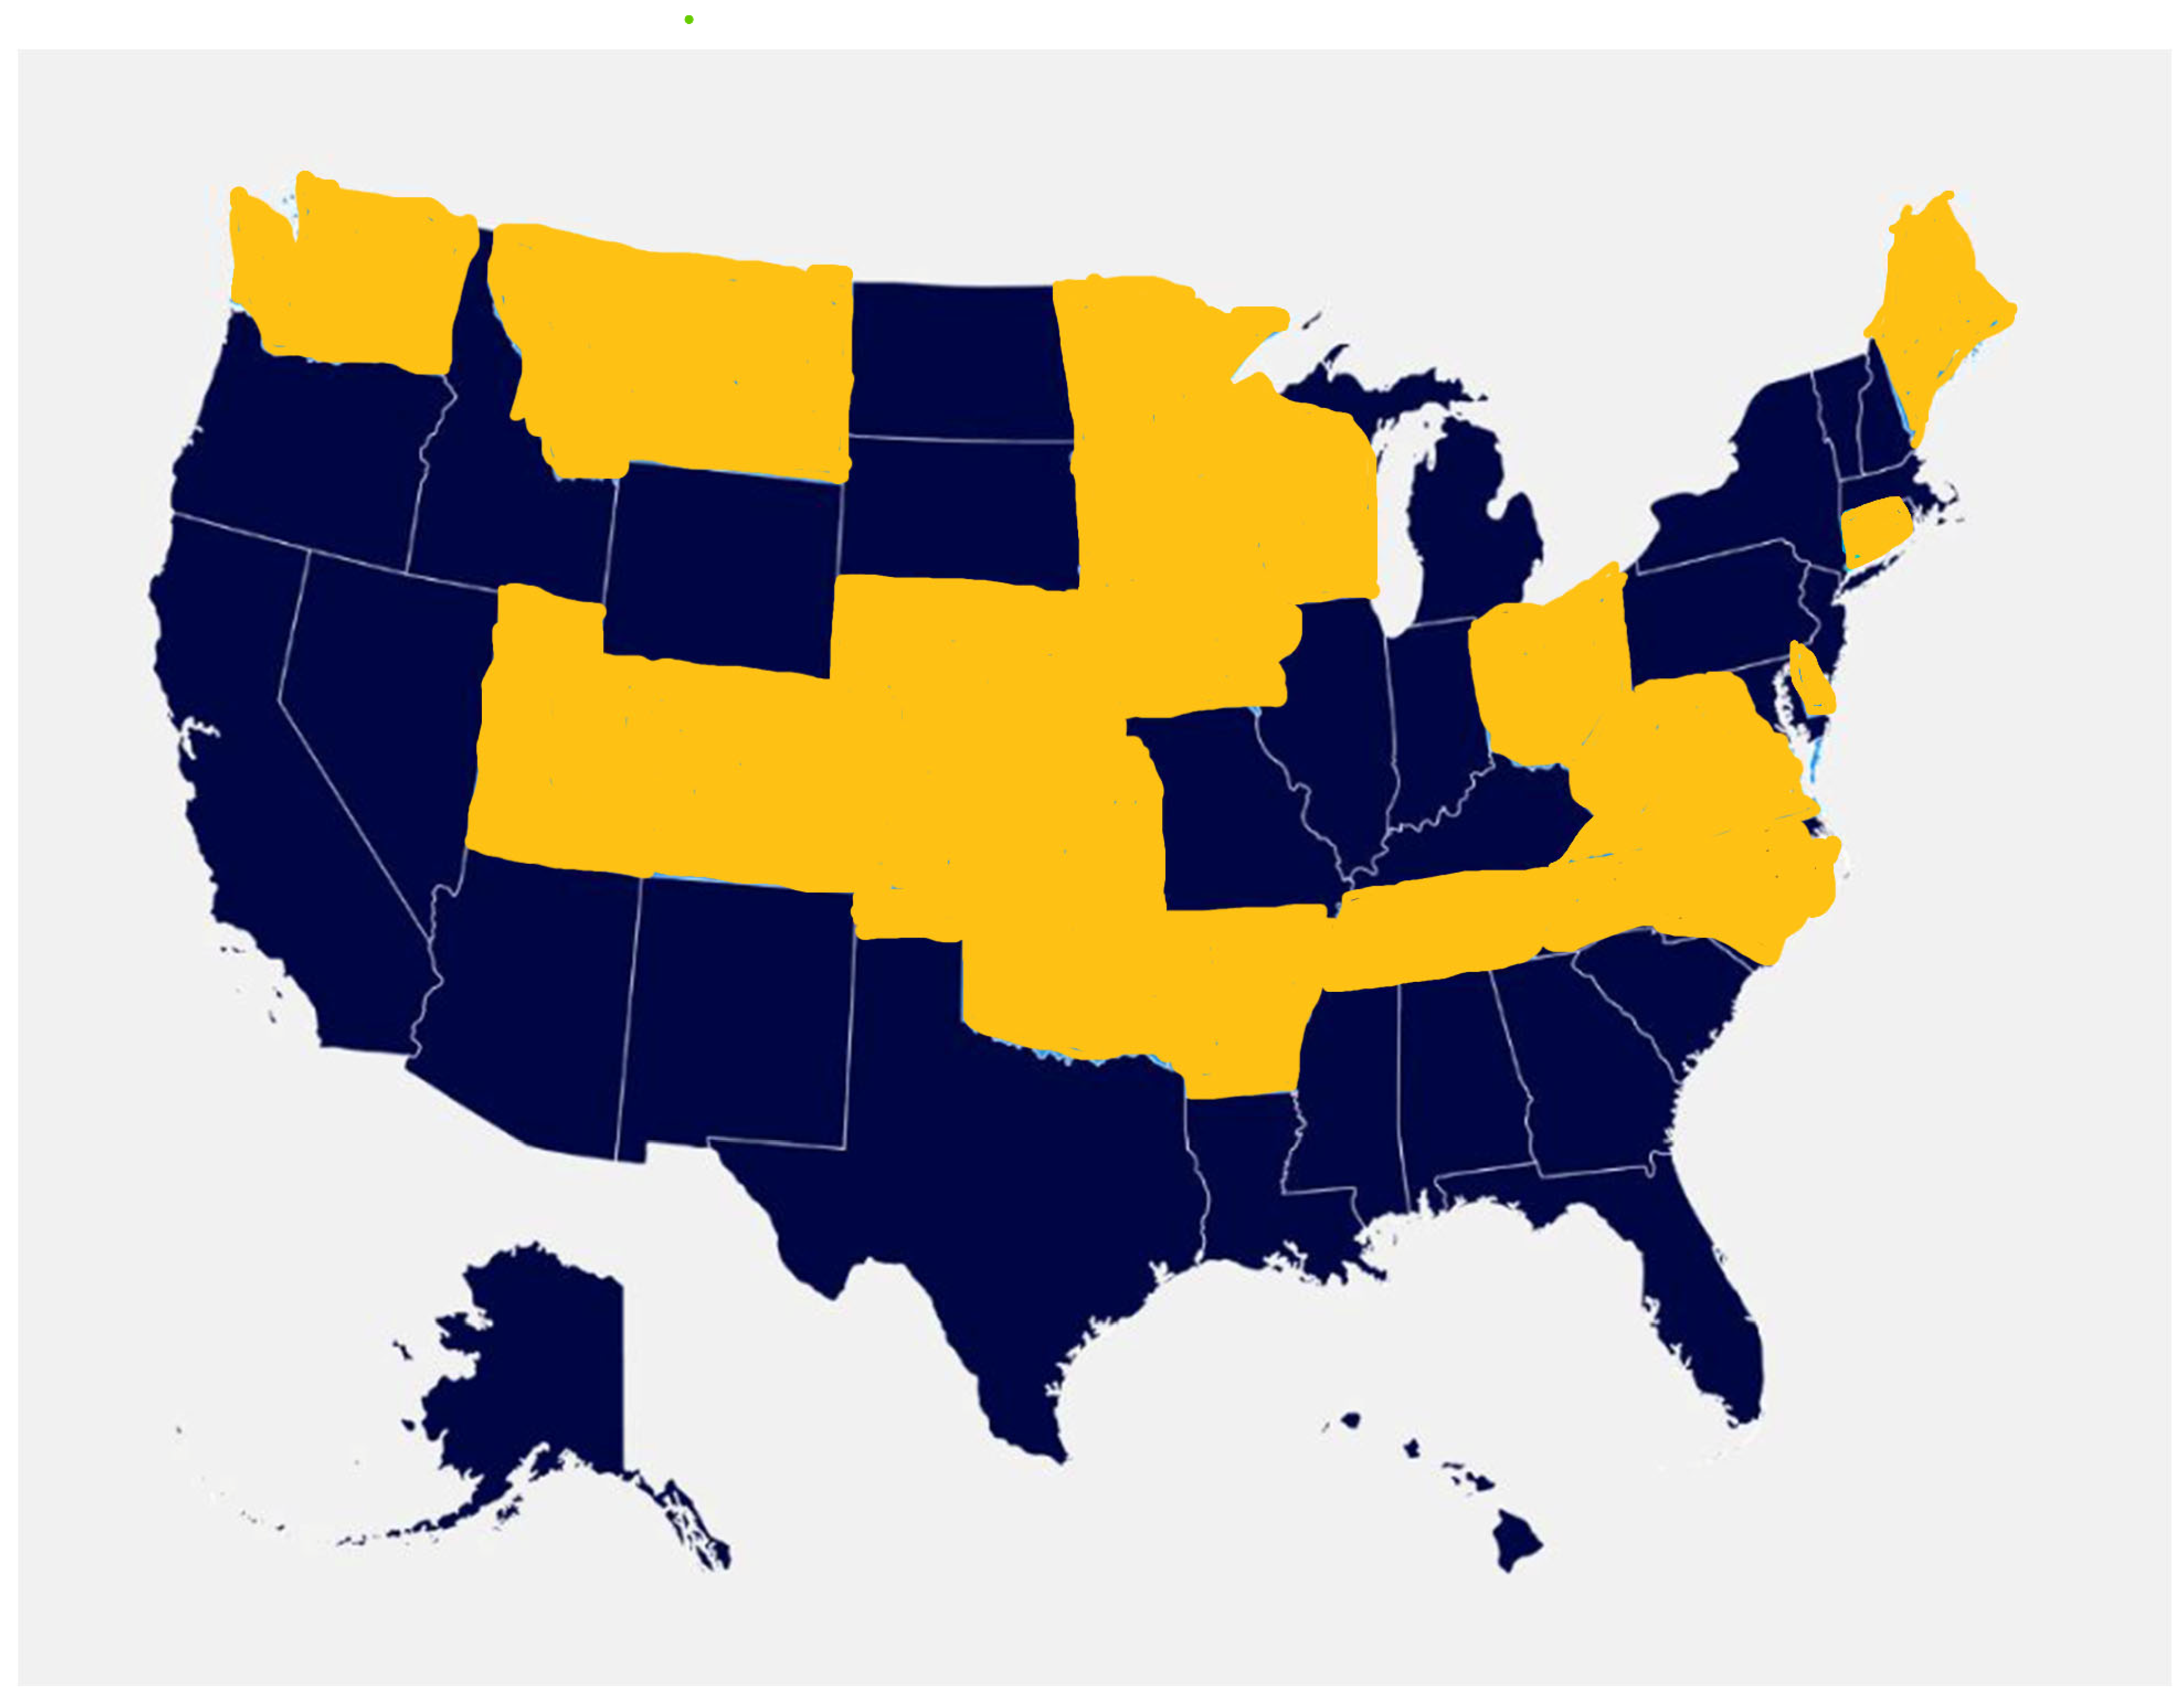

Table 1.
SPSS Table of Significant Variables.
| Variable | Beta Coefficient | P value | Odds Ratio |
|---|---|---|---|
| Number of PA Programs | 0.595 | 0.028 | 1.8 |
| Number of PA’s | 0.002 | 0.03 | 1.002 |
| Number of MDs | 0.003 | 0.003 | 1.003 |
| Cardiovascular | -0.046 | 0.011 | 0.955 |
| Gastroenterology | -0.065 | 0.045 | 0.937 |
| Emergency Med | -0.024 | 0.006 | 0.977 |
Disclaimer/Publisher’s Note: The statements, opinions and data contained in all publications are solely those of the individual author(s) and contributor(s) and not of MDPI and/or the editor(s). MDPI and/or the editor(s) disclaim responsibility for any injury to people or property resulting from any ideas, methods, instructions or products referred to in the content. |
© 2025 by the authors. Licensee MDPI, Basel, Switzerland. This article is an open access article distributed under the terms and conditions of the Creative Commons Attribution (CC BY) license (http://creativecommons.org/licenses/by/4.0/).
Copyright: This open access article is published under a Creative Commons CC BY 4.0 license, which permit the free download, distribution, and reuse, provided that the author and preprint are cited in any reuse.


