Submitted:
18 July 2025
Posted:
21 July 2025
You are already at the latest version
Abstract
The increased presence of harmful algal blooms (HABs) is a concern for many aquatic environments, especially with the increasing effects of climate change. Members of the dinoflagellate genus Dinophysis have been shown to produce toxins that can cause Diarrheic Shellfish Poisoning (DSP) in humans who consume infected shellfish. The advancing oyster aquaculture industry in Delaware will require the development of management practices and monitoring HABs species to protect environmental and human health. Temperature, nutrients, and prey abundance can be drivers of Dinophysis blooms. D. acuminata has been historically identified at high concentrations (>200,000 cells∙ L-1) in water samples from Rehoboth Bay, DE, USA. However, the reach of spring blooms and how far they extend to aquaculture sites have not been determined. This study monitored an emergent HABs threat of a toxin-producing dinoflagellate, Dinophysis acuminata by assessing a transect during an unexpected winter bloom and analyzing concentrations of chemical nutrients of combined nitrate and nitrite, and orthophosphate. Pearson correlation coefficient analysis between cell density (cells ∙ L-1) and environmental variables across all sites was conducted to determine significant relationships between water temperature, Chl-a concentration, conductivity, dissolved oxygen (DO), combined nitrate and nitrite concentrations (NOx), and orthophosphate concentrations (PO43-). Genetic techniques and PCR were utilized to determine the presence of Dinophysis using genus-specific primers to monitor cell density or abundance within the sediments during winter months. There were no significant correlations between environmental variables; and nutrient concentrations did not exceed EPA regulations. Molecular analyses of benthic sediments detected Dinophysis spp., offering insight into potential bloom origins. Overall, there is limited ecological data on Dinophysis acuminata in Rehoboth Bay, DE, USA and the results of this study will help strengthen resources for monitoring HABs species and understanding potential risks to oyster aquaculture in Delaware.
Keywords:
HAB
; Dinophysis acuminata
; shellfish aquaculture
; restoration
; water quality
; oysters
1. Introduction
Toxic harmful algal blooms (HABs) of phytoplankton can experience periods of seasonal biomass fluctuations in both marine and freshwater ecosystems worldwide [1,2,3]. HABs occur when biomass accumulation of the phytoplankton community results in negative environmental or organismal health impacts. An example of a common HAB-causing organism are dinoflagellates, eukaryotic protists that use two flagella for locomotion. Some species of dinoflagellates can cause significant harm through various mechanisms, including oxygen depletion leading to hypoxia and fish kills, water discoloration, toxin production, and aesthetic degradation of water bodies [4].
Toxic HABs pose a severe threat to ecosystems and human health. Algal toxins can enter the food chain through contaminated shellfish, drinking water, or aerosol inhalation, leading to poisoning in humans and animals [5]. The severity of these effects varies by species and toxin type. Several species within the Dinophysis genus produce harmful toxins, including okadaic acid (OA), Dinophysis toxins (DTX-1 and DTX-2), and pectenotoxins [6,7,8]. OA and DTXs are primarily responsible for Diarrheic Shellfish Poisoning (DSP) in humans and are produced by the dinoflagellate genera Dinophysis and Prorocentrum [5].
The first recorded DSP cases linked to Dinophysis fortii occurred in Japan [9], while Prorocentrum lima was identified as the cause of the first confirmed DSP case in North America (Nova Scotia, Canada) in 1990 [10]. DSP symptoms include gastrointestinal distress, abdominal pain, cramping, vomiting, and diarrhea after consuming contaminated shellfish, such as mussels, clams, and oysters [11,12,13]. Even at low environmental cell densities of toxigenic Dinophysis spp. (<1,000 cells·L−1), DSP outbreaks have led to shellfish harvest closures in Northern Japan, Chile, Europe, and the United States [6,14]. In 2000, the first Dinophysis bloom in Greece resulted in a DSP outbreak that caused a revenue loss of 5 million euros from shellfish harvesting closure in Thermaikos Gulf [15]. The first U.S. shellfish harvest closure due to OA occurred along the Texas Gulf Coast in 2008, following blooms of Dinophysis cf. ovum, with OA levels exceeding the FDA regulatory limit of 20 µg/100 g tissue [6]. Subsequent closures occurred in Puget Sound, Washington [8] and Long Island Sound, New York [16] in 2011. Investigations in Maryland Coastal Bays detected multiple OA toxin forms during Dinophysis spp. blooms, with variability in toxin production depending on strain, location, and prey availability [7]. Additionally, pectenotoxins, specifically PTX2, has been linked to acute toxicity in larval oysters which can cause mortality [17]. In a study where larval oysters were exposed to three pure toxins (STX, OA, and PTX2), a 100% mortality was observed in oyster larvae exposed to PTX2 [17].
The Delaware Department of Natural Resources (DNREC) and the University of Delaware Citizen Monitoring Program (UDCMP) actively monitor HAB species in Delaware. D. acuminata has been identified in the Torquay Canal since its first observation in 2003 at the mouth of Love Creek in northwest Rehoboth Bay, an approved commercial shellfish harvest area [18]. Its presence has increased in the Delaware Inland Bays (DIB), with bloom densities exceeding 1.4 million cells·L−1 at the Torquay Canal in 2016 [18] and 10,000 cells·L−1 in 2019. UDCMP considers 10,000-20,000 cells·L−1 as the threshold of concern for this species, with shellfish meat testing recommended for blooms exceeding 10,000 cells·L−1 in harvesting areas. In one study, the Torquay Canal exceeded the US FDA exposure level for DSP toxins in shellfish tissue [18]. Oysters tested from Torquay Canal in 2015 and 2016, contained maximum toxin concentrations of 0.35 and 0.33 ppm, respectively. Toxin composition was also analyzed and OA, DTX-1 and DTX-2 was detected. Despite these high densities and toxin concentrations, no confirmed DSP cases have been reported in the Mid-Atlantic [18]. Although no summer bloom occurred, a significant winter bloom was recorded, marking the highest winter bloom density observed at that time. Dinoflagellates can overwinter either as resting cysts within benthic sediments or persist in the water column until favorable conditions trigger a bloom. The exact source of Torquay Canal's recurring blooms remains unknown. This residential dead-end canal experiences seasonal anoxia and nutrient influx, conditions that can promote HAB development [19]. Poor flushing and mixing, combined with elevated summer temperatures, likely contribute to low dissolved oxygen levels. Additionally, nutrient enrichment from fertilization may increase orthophosphate concentrations, fueling bloom growth. Climate change can further increase HAB events by altering freshwater inputs into estuarine and coastal systems [20]. Storm events also increase nutrient inputs into waterways and changing wind patterns and upwelling in some areas may increase bloom prevalence as shown in Scotland with D. acuminata [21].
This study focused on the first recorded winter bloom of D. acuminata in Delaware. A transect monitored through the winter bloom provided crucial data on cell densities, bloom reach and duration, water quality parameters, weather patterns, and nutrient concentrations. The objectives of this study were to 1) determine the origin of these blooms—whether seeded by transported cells or a resident population overwintering in benthic sediments using molecular methods, 2) determine whether D. acuminata blooms in Torquay Canal extend beyond the TQB bulkhead site, and 3) assess any potential relationships between D. acuminata presence and nutrient concentrations. The data obtained through this project will add to the limited knowledge of D. acuminata in Delaware and enhance our understanding of D. acuminata dynamics, informing environmental management, human health risk assessments, and aquaculture policies.
2. Materials and Methods
2.1. Sampling Sites
Rehoboth Bay and Indian River Bay are two of the three systems that make up the Delaware Inland Bays and are popular residential and recreational areas. The Inland Bays generate billions of dollars in state revenue and the commercial shellfish hatcheries contribute significantly to this annual income [22]. To determine the extent of a Dinophysis acuminata bloom and its proximity to oyster aquaculture sites, a transect through Torquay Canal and Bald Eagle Creek were sampled by kayak during a winter 2020 bloom event (Table 1). The transect started at point TQB (DNREC RB64) at the bulkhead on Lands’ End Road in Torquay Canal and ended at point TQBay in north Rehoboth Bay at the mouth of Bald Eagle Creek (Figure 1). The total distance between TQB and TQBay was divided into 200-m sections, and a sampling point was randomly selected within each section. The points were evenly measured and divided along the full length of the bulkhead on the west side of Lands’ End Road. The bulkhead measured approximately 12 meters, and each point is a 4-meter section. In addition, benthic surface sediment and surface water samples were collected at two sites in Rehoboth Bay, DE, USA (Torquay Canal and Camp Arrowhead) and one site in the Indian River Bay, DE, USA (James Farm). Torquay Canal is a dead-end residential canal with a history of high-density spring/summer blooms. Camp Arrowhead is a lightly developed wooded marsh area, that has seasonal recreational activity and is close in proximity to an oyster aquaculture lease site. Lastly, James Farm is an ecological preserve site.
2.2. Dinophysis Acuminata Winter 2020 Bloom Analysis at Torquay Canal, Rehoboth Beach, DE
2.2.1. Field Collection
Triplicate surface water samples were collected at point TQB every other week from June to October 2018 and once a month from November 2018 to February 2020 for the sediment study. These samples (50 mL) were preserved in diluted Lugol’s iodine and were used to determine the approximate start of the winter 2020 bloom event. At each transect point, a YSI 556 Multiprobe Sensor (Xylem Analytics, Yellow Springs, OH) was used to measure temperature, conductivity, salinity, pH, and dissolved oxygen. Turbidity was measured using a Secchi disc. Water samples (1 L) were collected below the surface and filtered (102 µm) in the field to remove larger debris and were stored in a cooler with the bottom half submerged in site water.
2.2.2. Laboratory Sample Processing2.2.2. a. Microscopy
Field samples were brought to the Coyne Lab at the University of Delaware for processing within five hours of collection. The outside of the sample bottles was rinsed with distilled water and dried. Thirty microliters of well-mixed water sample (3 drops, 10 µL each) from each transect point were viewed under a compound light microscope (Olympus BH-2, Washington DC), and the general plankton community was observed. Initial D. acuminata absence or presence was recorded. Sample water (50 mL) from each transect point, preserved with diluted Lugol’s iodine was used to determine D. acuminata microscopic cell counts (cells ∙ L-1) using a Sedgewick rafter counting cell.
2.2.2. b. Chlorophyll-a
Water samples (5 mL) from each transect point were filtered onto Grade GF/F glass microfiber filters (Whatman). Each filter was placed into a glass vial and stored at -20°C until processing time. When extracting chlorophyll-a, 10 mL of 90% acetone was added to each glass vial in the dark and incubated at -20°C for 24 hours. In vitro, direct concentration (µg -1L) of chlorophyll-a was measured using a Turner 10 AU Fluorometer (Turner Designs, San Jose, California) according to the standard protocol [23].
2.2.3. Transect DNA Processing, Preservation, and Analysis
Water samples (150-300 mL) were filtered in triplicate for DNA on a 3.0 µm polycarbonate membrane (47 mm, Whatman) and submerged in CTAB extraction buffer (100 mM Tris-HCl (pH 8), 1.4 M NaCl, 2% (w/v) cetyltrimethylammonium bromide (CTAB), 0.4% (v/v) β-mercaptoethanol, 1% (w/v) polyvinylpyrrolidone) [24,25] with pGEM as an internal standard at a concentration of 20 ng μL-1 and stored at -80°C [24,26]. Water that passed through the 3-μm filters were then filtered through a 0.2-μm polycarbonate membrane filter in duplicate for dissolved nutrient analysis. DNA was amplified by Polymerase Chain Reaction (PCR) assays alongside microscopy to determine D. acuminata presence along the transect and at Torquay Canal before and during the winter 2020 bloom event.
The Dinophysis genus-specific primers used in this study were Dino F 5’ GCACGCATCCAAYTATCCATAAC 3’ and Dino R 5’ CATACAGACACCAACGCAGG 3’ [27]. The Dino F and Dino R primers were selected for genetic analysis based on prior research studies [27]. The primers target the ITS1-5.8S rDNA region, and the product size is 360 base pairs. The PCR reactions (50 µL) included 1.0 µL diluted DNA template, 0.2 mM dNTPs, 2.5 mM MgCl2, 1 x Taq polymerase buffer (Sigma Chem. Co., St. Louis, MO, USA), 0.25 units Jump-Start Taq polymerase (Sigma Chem Co.), and 0.2µM of primers Dino F and Dino R. The PCR temperature cycling parameters consisted of 38 cycles of 45 s at 95°C, 30 s at 95°C, 30 s at 55.6°C, and 1 min at 72°C, followed by a 2-min extension at 72°C [28]. PCR products were visualized using gel electrophoresis to determine the presence of Dinophysis sp. within samples. Cloned PCR product using primers Dino F and Dino R were sequenced through Sanger sequencing at the Institute of Marine and Environmental Technology (IMET, Baltimore, MD). The sequence matched 100% to sequence ID MK860903.1 D. acuminata isolate [18] in the U.S. National Library of Medicine Basic Local Alignment Search Tool (BLAST) sequence database [29].
2.2.4. Dissolved Chemical Nutrient Analysis
Water from each transect point sample (150 mL), filtered through a 0.2-μm polycarbonate membrane filter, was stored at -20°C for dissolved nutrient analysis of combined nitrite and nitrate (NOx-), ammonia (NH4+), and orthophosphate (PO43-). Samples were analyzed by DNREC with a Seal AA3 Autoanalyzer (SEAL Analytical Inc., Mequon, WI) according to the standard USEPA methods (nitrite and nitrate 353.2, ammonia 350.1, orthophosphate 365.1).
2.2.5. Statistical Analysis
Observational data include numerical (D. acuminata cells ∙ L-1, dissolved nutrients, physical water variables) and categorical (date, site) data. When determining whether some environmental variables had significant relationships to cell density during the winter 2020 bloom, a Pearson Correlation test was used to measure the association between D. acuminata cells ∙ L-1 versus site, date, physical water variables, and dissolved nutrients. A relationship between two variables is considered strong when an R-value is larger than 0.7 [30]. A 95% confidence level, P ≤ 0.05 is considered significant. A Pearson Correlation test was also used to measure association between Chl-a and pH. A Principal Component Analysis (PCA) was used to decrease dimensionality among the variables to look for any drivers that may not appear in the Pearson Correlation Analysis (MATLAB version R2020b).
2.3. Benthic Marine Sediment Monitoring for Dinophysis acuminata Using Molecular Methods
2.3.1. Field Sample and Data Collection
Torquay Canal was sampled every month from June to December 2018 and January 2019 to February 2020, except August and November 2019. Camp Arrowhead and James Farm were sampled in July, August, September 2018, and August 2019. Water samples (1 L) were located at each point (A, B, and C) for a total volume of 3 L water from each site. Five sediment core samples were collected at each point within each site for a composite sediment sample of 15 cores. Sediment cores were taken on average from the top 2 cm of benthic sediment in replicate (N=5) using a sediment push coring device built from PVC pipe and a check valve with a 60 mL plastic syringe attachment mechanism [31]. All syringes and stoppers were cleaned and autoclaved between samples to avoid cross-contamination. YSI multi-variable data collection sondes (EXO2 and 6 Series) (Xylem Analytics, Yellow Springs, Ohio) were deployed at each site and set to record physical water quality variables (temperature, dissolved oxygen, salinity, conductivity, and pH) every 30 minutes.
2.3.2. Dissolved Chemical Nutrient Analysis
Each surface water sample was filtered and stored as described in section 3.2.3. Dissolved nutrients of nitrate (NO3- as mg L-1 N), nitrite (NO2- as mg L-1 NO2- ), orthophosphate (PO43- as mg L-1 PO43-), alkalinity (CaCO3 as mg L-1 CaCO3), and ammonia (NH3 as mg L-1 N) were measured using a YSI 9300 Photometer following the standard YSI protocol. Nitrate is tested by adding 20 mL of sample into a Nitratest tube, followed by one spoonful of Nitratest Powder and one Nitratest tablet. The sample is shaken until dissolved, and rests for one minute before it was inverted 3-4 times. The sample was then transferred to a 10 mL test tube and one Nitricol tablet was added and crushed until dissolved. The solution rested for 10 minutes before analyzing. Nitrite was tested by adding 10 mL of sample to a test tube and crushing in one Nitricol tablet until dissolved. The solution rested for 10 minutes before analyzing. To test for orthophosphate, 10 mL of sample is added to a test tube and one Phosphate No 1 LR tablet is added and crushed until dissolved. Then a Phosphate No 2 LR tablet is added and crushed until dissolved. The solution rested for 10 minutes before analyzing. To test for Alkalinity, 10 mL of sample is added to a test tube and one Alkaphot tablet is added and mixed until dissolved. The solution only sat for one minute before analyzing. Lastly for Ammonia, one Ammonia No 1 tablet and one Ammonia No 2 tablet is added to 10 mL of sample and crushed until dissolved. The solution rested for 10 minutes before analyzing.
2.3.3. Molecular Methods to Determine D. acuminata Presence in Sediment Samples
After removing the surface layer of water from each core, a composite sample was created for each sample by combining the first 2 cm of sediment from all five cores. Sediment from composites (2 g) was preserved in 10 mL of RNALater (700 g ammonium sulfate, 40 mL 0.5 M EDTA, 25 mL 1 M sodium citrate dissolved in 800 mL QH20) and stored at -20°C. Sediment DNA was extracted using a MOBIO PowerSoil Kit (QIAGEN, Germantown, Maryland) [32]. A NanoDrop 2000c micro-volume spectrophotometer (Thermo Fisher Scientific Inc., Waltham, MA) was used to determine the concentration of DNA obtained from extractions. Universal primers and Dinophysis acuminata clade-specific primers targeting regions on the large subunit (LSU) ribosomal RNA (rRNA) gene [33,34] were used to amplify DNA from water samples and sediment samples in a nested PCR [33]. The first PCR primer set targeting regions on the large subunit (LSU) ribosomal RNA (rRNA) gene used in the nested PCR method was universal forward primer DIR-F (5’ACC CGC TGA ATT TAA GCA TA 3’) and reverse primer D2C-R (5’ CCT TGG TCC GTG TTT CAA GA 3’) [34]. The PCR reactions (50 µL) included 1.0 µL diluted DNA template, 0.2 mM dNTPs, 2.5 mM MgCl2, 1 x Taq polymerase buffer (Sigma Chem. Co., St Louis, MO, USA), 0.25 units Jump-Start Taq polymerase (Sigma Chem Co.), and 0.2µM of primers DIR-F and D2C-R. The PCR cycling parameters were modified from [33] and consisted of 20 cycles of 30 s at 67°C with a decrease of 0.5°C each cycle, 2 min at 72°C, followed by 10 cycles of 10 s at 94°C, 30 s at 57°C, and 2 min at 72°C.
The products from the first PCR (PCR-1) were used as the template in the second PCR (PCR-2) with a Dinophysis genus-specific forward primer Dinophy-F (5’ RCA AGG ATT GGT TGC TGC C 3’) and a Dinophysis clade-specific reverse primer for D. acuminata, D. norvegica, and D. dens Dasd-R2 (5’ TCA TCG CAA CCA CAG CAA A 3’) [33]. The same PCR reagent volumes and cycling parameters were used for the PCR-1 protocol using primers Dinophy-F and Dasd-R2. The PCR product was 230-232 bp. When preparing for sequencing, positive PCR products were cleaned using a QIAquick PCR cleaning kit by Qiagen (QIAGEN, Sollentuna, Sweden 2013-2020) according to the manufacturer’s instructions. The cleaned products were then cloned using a TOPO TA Cloning Kit #K4500-01 with PCR 2.1-TOPO Vector according to the manufacturer’s instructions (Invitrogen ThermoFisher Scientific, Waltham, MA, USA). Cloned products were sent to GENEWIZ (Plainefield, NJ, USA) for Sanger sequencing to verify that target sequences were amplified. Sequences were then analyzed through FinchTV (FinchTV Version 1.5.0, Geospiza Inc. 2004-2012) and matched to the U.S. National Library of Medicine Basic Local Alignment Search Tool (BLAST) sequence database (https://blast.ncbi.nlm.nih.gov/Blast.cgi) [29].
The nested PCR protocol was not consistently free from contamination in the second stage, so Dinophysis genus-specific primers Dino F 5’ GCACGCATCCAAYTATCCATAAC 3’ and Dino R 5’ CATACAGACACCAACGCAGG 3’ [27] were additionally used for all sediment samples. The PCR reactions (50 µL) included 1.0 µL diluted DNA template, 0.2 mM dNTPs, 2.5 mM MgCl2, 1 x Taq polymerase buffer (Sigma Chem. Co., St Louis, MO, USA), 0.25 units Jump-Start Taq polymerase (Sigma Chem Co.), and 0.2 µM of primers Dino F and Dino R [27]. The PCR cycling parameters consisted of 38 cycles of 45 s at 95°C, 30 s at 95°C, 30 s at 55.6°C, and 1 min at 72°C, followed by a 2-min extension at 72 °C [28]. PCR products were visualized using gel electrophoresis to determine the presence of Dinophysis sp. within samples.
PCR products from two samples (081618TQ-2 and 090318_CA-3) from the nested PCR method with positive results for D. acuminata were cloned while optimizing molecular methods. The PCR products were obtained using the primers Dino F 5’ GCACGCATCCAAYTATCCATAAC 3’ and Dino R 5’ CATACAGACACCAACGCAGG 3’ [27] but were not cloned or sequenced in this study due to time restraints.
2.3.4. Statistical Analysis
Observational data include numerical (D. acuminata cells ∙ L-1) and categorical (date, site, D. acuminata DNA absence vs. presence) data. A logistic regression measured the relationship between D. acuminata absence or presence, date, dissolved nutrients, and physical water observations. With a 95% confidence level, P ≤ 0.05 is considered significant. A logistic regression analysis was used to determine if significant linear relationships exist between the presence or absence observation of Dinophysis and predictor variables of date sampled, site sampled, or point sampled (A, B, C). The relationships between date, dissolved nutrients, and physical water observations were analyzed against each other first. Each predictor variable (date, site, point) was analyzed with presence or absence observation as the dependent variable.
3. Results
3.1. Dinophysis Acuminata Winter 2020 Bloom Analysis at Torquay Canal, Rehoboth Beach, DE
The seasonal bloom of Dinophysis acuminata at Torquay Canal observed every year in May or June since 2003 was not witnessed in 2019 through this study or during the University of Delaware Citizen Monitoring Program. However, a winter bloom of D. acuminata in 2020 was identified under microscopy in the water samples taken from Torquay Canal at site TQB on January 3rd, 2020 (Figure 2) and was confirmed through PCR, with a mean cell density of 19,000 cells ∙ L-1 .
Microscopic analysis of preserved samples from site TQB on December 23rd, 2019, determined the bloom had begun sometime between October 7th, 2019, when no D. acuminata was observed, and December 23rd, 2019, when D. acuminata was present at 29,000 cells∙ L-1. D. acuminata cell densities peaked on January 6th, 2020, at site TQB at 191,000 cells∙ L-1 (Figure 3). This study was conducted to determine whether regular blooms of D. acuminata at Torquay Canal were isolated to site TQB, but our results showed that the winter 2020 bloom was present at additional sites.
To determine whether some environmental variables had significant relationships to cell density during the winter 2020 bloom event at Torquay Canal, a Pearson correlation coefficient analysis of cell density (cells ∙ L-1) versus water temperature (°C), chlorophyll-a (µg L-1), conductivity (mS/cm), dissolved oxygen (mg∙ L-1), combined nitrate and nitrite (mg N ∙ L-1), orthophosphate (mg P ∙ L-1) and pH across all sites was conducted. The pH and cell density show a moderate negative correlation (r=-0.404) that is significant (p=0.0132). However, there were no strong relationships or significant relationships between cell density and water temperature, Chl-a concentration, conductivity, dissolved oxygen (DO), combined nitrate and nitrite concentrations (NOx), or orthophosphate concentrations (OP) during the winter 2020 bloom event (Table 2).
On January 14th, 2020, cell density at site TQB fell to 4,000 cells∙ L-1 but were at bloom levels (10,000-20,000 cells∙ L-1) at site TQ12 (15,666 cells∙ L-1) and site TQ11 (11,666 cells∙ L-1). Beyond site TQ11 toward Bald Eagle Creek and northern Rehoboth Bay, D. acuminata cells were present but not at bloom density. The highest density at site TQBAY, furthest from site TQB, was 1,000 cells ∙ L-1. Ciliates were observed in some samples during the winter 2020 bloom transect. They were confirmed to be Mesodinium rubrum, D. acuminata’s known prey source. Ciliates were present in samples from January 3rd, 2020, at site TQB, samples from January 14th, 2020, at sites TQ10, TQ9, and TQ8, and samples from February 4th, 2020, at sites TQB, TQ11, and TQ9. “Small D. acuminata” cells were present in some samples during the winter 2020 bloom event at Torquay Canal. Interestingly, they were observed only in samples from site TQB.
Chemical nutrients of combined nitrate and nitrite were analyzed along with orthophosphate and compared with cell densities (Figure 4). The EPA maximum level for nitrite (NO2-) is 1.0 mg L-1 NO2- and nitrate is 10 mg L-1 [35,36]. The EPA recommends that the maximum limit for orthophosphate is 0.05 mg L-1 [37]. At site TQB during the winter 2020 bloom event, combined nitrate and nitrite levels did not approach the EPA limit. Orthophosphate remained low at site TQB during the bloom event but did show elevated levels.
The same environmental variables were analyzed using a Pearson correlation coefficient analysis at site TQB alone versus cell density (Table 3). There were no significant correlations between environmental variables at TQB. However, there were negative relationships between the date and cell density; cell density and water temperature; cell density and Chl-a; cell density and conductivity; cell density and dissolved oxygen; cell density and orthophosphate; cell density and pH; and Chl-a and pH. Also, there was a positive relationship between cell density and combined nitrate and nitrite.
The principal component analysis shows a 66% variation among samples taken during the winter bloom event at Torquay Canal (all sites included). Principle component 1 (PC 1) accounts for 45% of the variation, and principal component 2 (PC 2) accounts for 21% of the variation. Combined nitrate, nitrite (NOx), temperature, and orthophosphate drive high PC 1 scores. Samples with high PC 1 scores include January 7th and 14th, 2020. While dissolved oxygen drives high PC 2 scores. Samples with high PC 2 scores include January 24th, 2020. Cell density, Chl-a, and dissolved oxygen drive low PC 1 scores. The samples with low PC 1 scores include January 24th and 31st, 2020, and February 4th, 2020. In addition, combined nitrate and nitrite (NOx) drive low PC 2 scores. The samples with low PC 2 scores include January 17th, 2020.
3.2. Benthic Marine Sediment Monitoring for Dinophysis acuminata Using Molecular Methods
Fifty-one sediment samples were collected and analyzed through PCR in 2018: twenty-three from Torquay Canal, fourteen from Camp Arrowhead, and thirteen from James Farm. Forty-six sediment samples were analyzed through PCR in 2019: forty from Torquay Canal and three each from Camp Arrowhead and James Farm. Gel electrophoresis was used to visualize PCR products. In the total sediment samples from Torquay Canal, eight samples (12.6%) were positive for Dinophysis; from Camp Arrowhead, four samples (23.5%) were positive for Dinophysis; and three samples (18.7%) from James Farm were positive for Dinophysis (Figure 5).
The nested PCR method was used to determine Dinophysis presence in the following sediment samples: 081618TQ-2, 090318CA-3, 102918TQ_B-1, 113018TQ_B-1, and 123018TQ_B-3. The samples from Torquay Canal (August 16th, 2018) and Camp Arrowhead (September 3rd, 2018) were positive for D. acuminata. In addition, the five cloned PCR products, the two clones from the Torquay Canal sample labeled TQ2-M13R and TQ5-M13R, and the three clones from the Camp Arrowhead sample labeled CA7-M13R, CA8-MR13R, and CA11-M13R were sequenced with Sanger Sequencing at GENEWIZ (Plainfield, NJ). All sequences matched to the same D. ovum and D. acuminata sequences in the U.S. National Library of Medicine Basic Local Alignment Search Tool (BLAST) sequence database (https://blast.ncbi.nlm.nih.gov/Blast.cgi) [29].
Clone TQ2-M13R matched a Dinophysis ovum sequence (accession MN565962) with a 95% query coverage, a 99% identity and a D. acuminata sequence (accession MK860905) with a 95% query coverage and a 99% identity. Clone TQ5-M13R matched the same D. ovum sequence (accession MN565962) with a 58% query coverage and a 99% identity and the same D. acuminata sequence (accession MK860905). Clone CA7-M13R matched the same D. ovum sequence (accession MN565962) with a 97% query coverage and a 99% identity and the same D. acuminata sequence (accession MK860905). Clone CA8-M13R matched the same D. ovum sequence (accession MN565962) with a 95% query coverage and a 99% identity and the same D. acuminata sequence (accession MK860905). Clone CA11-M13R matched the same D. ovum sequence (accession MN565962) with a 95% query coverage and a 99% identity and the same D. acuminata sequence (accession MK860905) [18]. The rest of the sediment samples’ DNA was run using the second PCR method. Positive results for Dinophysis were found in the sediment samples at Torquay Canal, Camp Arrowhead, and James Farm.
A logistic regression analysis was used to determine if a significant linear relationship existed between the presence or absence of Dinophysis and the predictor variables of date sampled, site sampled, or point sampled (A, B, C). All variables were analyzed against each other first, then each predictor variable (date, site, point) was analyzed separately, with presence or absence observation as the dependent variable. There were no significant relationships between the predictor variables and the absence or presence of observations (Table S1). There was no significant linear relationship between the date and the presence or absence of observation (Table S2). A logistic regression analysis with the site as the predictor variable resulted in no significant relationship with absence or presence observation (Table S3). A logistic regression analysis with the point as the predictor variable showed no significant relationship with absence or presence observation (Table S4).
4. Discussion
This study concluded that there was Dinophysis DNA within sediments at Torquay Canal (TQB) during winter months and evidence of an overwintering population resides within the canal at the beginning of the bloom and during what appears to be the decline of the bloom based on UDCMP cell density observations. This pattern would be expected for cyst formation in dinoflagellates [38,39,40]. The samples collected during the summer from Torquay Canal were positive for Dinophysis in 2018 and reached bloom densities. However, none of the samples were positive for D. acuminata from the summer of 2019 and did not reach bloom densities. Although there were no significant linear relationships between the presence or absence of Dinophysis within the sediment samples and date sampled, site sampled, or point sampled throughout the project (date p value = 0.211, site p value = 0.646, point p value = 0.856), the patterns emerging from this study indicate that the Dinophysis DNA found within sediments at Torquay Canal are likely from a resident population. The summer sediments collected at Camp Arrowhead and James Farm were also positive for Dinophysis. The presence of Dinophysis within sediments at Camp Arrowhead may indicate a potential risk to aquaculture sites located just south of the sampling location. Dinophysis was not observed in the water column through PCR analysis at Camp Arrowhead during 2016-2018, nor was Dinophysis present in the water column through microscopy analysis during this study from June 2018 to August 2019 [28]. The Dinophysis DNA present within the sediments at Camp Arrowhead could indicate that cysts of D. acuminata may occur outside of Torquay Canal in other locations throughout Rehoboth Bay, where blooms of this species have yet to be observed. There was a sudden peak of D. acuminata cell density on January 6th, 2020, although there was no significant change in nutrient levels. The difference in cell densities between January 6th and January 7th could be attributable to temperature and light availability. The weather on January 6th was sunny and warmer, compared to the following day where there was precipitation.
Across all sites, pH and cell density show a significant negative correlation (r = -0.404, p = 0.0132). Generally, as pH increases, cell density decreases. Studies on the toxic dinoflagellate Alexandrium suggested that the dinoflagellate grows more rapidly and toxicity per cell increases under increased CO2 conditions where pH would be lower [41]. During an algal bloom, pH levels fluctuate depending on the algae’s physiological processes. If the algae are actively photosynthesizing, CO2 is removed from the water, and the pH will increase. The algae will respire when not actively photosynthesizing; thus, CO2 is released, leading to a pH decrease. The higher pH levels found in this study occurred during the natural fluctuations of CO2 during the algal bloom and not from pH changes within the system from other factors. Overall, there were no strong or significant relationships between cell density and water temperature, Chl-a concentration, conductivity, dissolved oxygen (DO), combined nitrate and nitrite concentrations (NOx), or orthophosphate concentrations (OP).
At the beginning of the winter bloom event (December 23rd, 2019), orthophosphate levels at site TQB were highest at 0.012 mg∙ L-1 P and 0.013 mg∙ L-1 P. This was a threefold increase over the next highest value monitored during the bloom event at the TQB site. The water samples were collected at the surface, so the contribution of phosphorous and ammonia from bottom water is unknown. The presence of adequate prey is significantly correlated with D. acuminata cell densities [42]. According to one study, D. acuminata does not directly uptake inorganic nitrogen or phosphorus [43]. D. acuminata’s growth relied on the presence of prey M. rubrum whose uptake of nitrate and orthophosphate is rapid. Prey may have a stronger influence than dissolved nutrients in regulating D. acuminata bloom dynamics at Torquay Canal [42]. With this information, it is not surprising to see no strong correlations between the nutrient data and D. acuminata cell density during the bloom event at Torquay Canal, even with the increase in orthophosphate prior to the bloom event. If D. acuminata requires its prey for nutrients, then prey growth and cell density would be necessary along with nutrients to understand the bloom dynamics of D. acuminata within this system. Also, a correlation between Chl-a and cell density was not observed, which is the opposite of what we would expect during an algal bloom. This may be contributed to excess nutrients which can disrupt cellular processes such as chlorophyll production, especially since Rehoboth Bay is characterized as an area with high nutrient inputs. There have also been studies that showed a decrease in chlorophyll content in Dinophysis during rapid cell division [44].
Data collected in this study showed a surface water temperature increase in January 2020 from the previous year’s observations. In laboratory experiments, temperature had a more significant contribution to increases in the growth rate of D. acuminata than prey [45]. However, the amount of prey available also influenced D. acuminata growth rates. Ciliate prey also responds to elevated orthophosphate, and the ciliates observed throughout the bloom event were confirmed to be Mesodinium. The increased orthophosphate prior to the bloom event may have stimulated Mesodinium growth, although this was not quantified in this study. The increase in available prey, and an almost two-fold increase in temperature over the previous year, stimulated the growth of D. acuminata to bloom-forming densities in this system during the winter of 2020. The cryptophyte prey of Mesodinium is also a limiting factor in the bloom dynamics of D. acuminata and should be considered in future studies of D. acuminata in Torquay Canal [43].
D. acuminata may employ another strategy for overwintering other than dormant cyst formation within sediments since a dormant cyst of Dinophysis has not been observed [46]. It has been observed that Dinophysis forms a smaller vegetative cell requiring less metabolic activity during periods between blooms, at the end of a bloom event, or as an overwintering strategy [14,18,47]. Small vegetative cells mate with larger vegetative cells, the small cell is consumed by the larger cell, and the planozygote is formed [48]. The planozygote either divides into two vegetative cells or produces a sexual cyst. Offshore surface water samples taken in the mid-Atlantic have shown a presence of Dinophysis “small cells” [18]. The observed small D. acuminata cells was a distinct morphospecies and genetically confirmed as D. acuminata [18]. The samples collected in 2015 at Torquay Canal during a Dinophysis bloom contained D. acuminata and a small cell of D. acuminata. The small cells were found only during the bloom peak and end of the bloom event [18]. In this study, small cells of D. acuminata were present in surface water samples from the winter 2020 bloom event only at site TQB. They were present at the beginning and around the peak bloom event (January 6th, 2020). Planozygotes observed from D. acuminata, D. acuta, and D. ovum divide to produce offspring, not producing resting cysts more typically seen prior to planozygote division in other dinoflagellates [48]. Dinophysis small cells may confirm a planozygote stage and temporary cyst phase at Torquay Canal (TQB) as a stage of sexual reproduction and bloom inoculum strategy [47,48]. The presence of small cells at site TQB alone suggests that sexual reproduction and inoculum for the bloom winter event in Torquay Canal originated at site TQB, the only site where small cells were observed during the winter 2020 bloom event.
4.1. Project Limitations and Future Recommendations
Based on the results, we believe that the DNA extracted from samples and found to be D. acuminata is the intracellular DNA of viable cells. Extracellular DNA could exist within the environment from past bloom die-offs and there is little information on degradation rates of the eDNA. Some eDNA can remain in the environment for years, and some last only a couple of days [49]. It was proposed that DNA obtained from sediment samples is from some form of a cyst [50] and not a mixture of extracellular DNA, vegetative cells, and cysts because the benthos of the DIB is mostly anoxic, conducive to cyst preservation for years [51,52,53,54]. Viable cysts of Pfiesteria piscicida were successfully determined by targeting specific mRNA transcripts, which degrade more quickly than DNA [55]. We initially planned to look for cysts in the sediments at our sites but there were project limitations. However, identifying cysts, and also finding a mix of extracellular DNA and vegetative cells within the sediment at Torquay Canal could provide beneficial foundation work for microbial nutrition studies and studies in historical phytoplankton community structure. Using surface water samples does not represent the entire water column, since Dinophysis spp. is known to show diurnal vertical migration [56,57] and information on what is occurring at various depths, or how bottom water may differ from surface water at given points and times is excluded. Dinophysis is known to form subsurface mats and move vertically within the water column toward prey, nutrients, and light [56,57]. We confirmed the presence of Mesodinium but samples were not quantified.
Isotope analysis could determine the point source of nutrients within the water column at Torquay Canal. The toxicity of D. acuminata is influenced by nutrient increases, especially nitrogen [42]. In 2015 and 2016 at Torquay Canal, okadaic acid (OA) levels within sampled eastern oyster (Crassostrea virginica) meats tested above the regulation guideline of 0.16 OA ppm equivalent [18]. Further research into toxicity per cell and what factors influence the toxicity of D. acuminata cells within Torquay Canal should be performed to determine this species’ potential risk to oyster aquaculture in the Delaware Inland Bays. Rainfall events, wind direction and speed, air temperature, tide, cloud cover, and solar radiation could all impact this species’ presence or absence of a bloom event. An analysis of these variables across ten years of bloom events along with 2019 with no bloom events would strengthen the knowledge of the bloom dynamics of D. acuminata within the Delaware Inland Bays. Also, the relationships among prey density, phosphorus, nitrogen, and Dinophysis are areas of great opportunity to explore further.
5. Conclusion
The lack of knowledge surrounding the bloom dynamics of Dinophysis within the Delaware Inland Bays provides ample opportunity for future studies, optimizing monitoring programs, and supporting scientific endeavors. The bloom densities of Dinophysis observed in this study during the winter months raises the awareness that HAB monitoring at shellfish aquaculture areas would add value to the current monitoring program. With the increase in nutrient input from the surrounding area stimulating prey growth and warming water temperatures, the potential exists that D. acuminata blooms will become increasingly prevalent and prolonged. Year-round monitoring would also add substantial data that may provide some of the missing links to understanding the bloom dynamics of this species and its potential risks to oyster aquaculture within the Delaware Inland Bays.
Supplementary Materials
The following supporting information can be downloaded at the website of this paper posted on Preprints.org. Table S1. Logistic regression analysis of all predictor variables; Table S2. Chi Square output for predictor variable: Date; Table S3. Chi Square output for predictor variable: Site; Table S4. Chi Square output for predictor variable: Point.
Author Contributions
Conceptualization, A.P. and G.O.; methodology, A.P.; software, A.P.; validation, A.P., formal analysis, A.P. ; investigation, A.P.; resources, G.O.; data curation, A.P.; writing—original draft preparation, A.P.; writing—review and editing, T.A. and G.O.; visualization, A.P. and T.A.; supervision, G.O.; project administration, G.O.; funding acquisition, G.O. All authors have read and agreed to the published version of the manuscript.
Funding
This research was funded by the NOAA LMRCSC National Oceanic and Atmospheric Administration Educational Partnership program with Minority Serving Institutions Award NA 16 SEC 4810007, USDA NIFA Capacity Building Grant Award 201606642, and Delaware Sea Grant Award R/HCE 32.
Data Availability Statement
The raw data supporting the conclusions of this article will be made available by the authors on request.
Acknowledgments
Special thanks to Coyne Lab at the University of Delaware, College of Earth, Ocean, and Environment and the ONE Health Lab at Delaware State University. Special thanks to the University of Delaware Citizen Monitoring Program.
Conflicts of Interest
The authors declare no conflicts of interest.
References
- Benedetti, F., Jalabert, L., Sourisseau, M., Becker, B., Cailliau, C., Desnos, C., Elineau, A., Irisson, J.O., Lombard, F., Picheral, M., Stemmann, L. & Pouline P. 2019.The seasonal and interannual fluctuations of plankton abundance and community structure in a North Atlantic Marine Protected Area. Front. Mar. Sci. 6:214. [CrossRef]
- Kimambo, O.N., Gumbo, J.R., & Chikoore, H. 2019. The occurrence of cyanobacteria blooms in freshwater ecosystems and their link with hydro-meterological and environmental variations in Tanzania. Heliyon 5(3): e01312. [CrossRef]
- Barton, A., Pershing, A.J., Litchman, E., Record, N., Edwards, K.F., Finkel, Z., Kiørboe, T. & Ward, B. 2013. The biogeography of marine plankton traits. Ecology Letters 16(4):522- 534. [CrossRef]
- Gallegos, C.L. & Bergstrom, P.W. 2005. Effects of a Prorocentrum minimum bloom on light availability for and potential impacts on submersed aquatic vegetation in upper Chesapeake Bay. Harmful Algae 4 (3):553-574. [CrossRef]
- Van Dolah, F.M. 2000. Marine algal toxins: origins, health effects, and their increased occurrence. Environmental Health Perspectives (108) Suppl 1: 133-41.
- Deeds, J.R., Wiles, K., Heideman, G.B., White, K.D. & Abraham, A. 2010. First US report of shellfish harvesting closures due to confirmed okadaic acid in Texas Gulf coast oysters. Toxicon 55: 1138-1146. [CrossRef]
- Garcia-Portela, M., Reguera, B., Sibat, M., Altenburger, A., Rodriguez, F., & Hess, P. 2018. Metabolomic Profiles of Dinophysis acuminata and Dinophysis acuta Using Non-Targeted High-Resolution Mass Spectrometry: Effect of Nutritional Status and Prey. Marine Drugs 16(143), 1–25. [CrossRef]
- Lloyd, J.K., Duchin, J.S., Borchert, J., Quintana, H.F. & Robertson, A. 2013. Diarrhetic Shellfish Poisoning, Washington, USA, 2011. Emerg. Infect. Dis. 19:. [CrossRef]
- Yasumoto, T., Oshima, Y., Sugawara, W., Fukuyo, Y., Oguri, H., Igarashi, T., Fujita, N. 1980. Identification of Dinophysis fortii as the causative organism of diarrhetic shellfish poisoning. Nippon Suisan Gakkaishi 46(11): 1405-1411. [CrossRef]
- Quilliam, M.A., Mojmir, J., Lawrence, J.F. 1993. Characterization of the oxidation products of paralytic shellfish poisoning toxins by liquid chromatography/mass spectrometry. Analytical Science Advances 7(6): e1290070616. [CrossRef]
- Hossen, V., Jourdan da Silva, N., Guillos-Becel, Y., Marchal, J. & Krys, S. 2011. Food poisoning outbreaks linked to mussels contaminated with okadaic acid and dinophystoxin-3 in France, June 2009 Eurosurveill 16(46):20020. [CrossRef]
- Reizopoulou, S., Strogyloudi, E., Giannakourou, A., Pagou, K., Hatzianestis, I., Pyrgaki, C. & Graneli, E. 2008. Okadaic acid accumulation in macrofilter feeders subjected to natural blooms of Dinophysis acuminata. Harm. Algae 7: 228-234. [CrossRef]
- Torgersen, T., Aasen, J., and Aune, T. 2005. Diarrhetic shellfish poisoning by okadaic acid esters from Brown crabs (Cancer pagurus) in Norway. Toxicon 46(5): 572-578. [CrossRef]
- Reguera, B., Riobo, P., Rodriguez, F., Diaz, P., Pizarro, G., Paz, B., Franco, J. M. &Blanco, J. 2014. Dinophysis Toxins: Causative Organisms, Distribution and Fate in Shellfish. Marine Drugs 12(1): 394-461.
- Koukaras, K. & Nikolaidis, G. 2004. Dinophysis blooms in Greek coastal waters (Thermaikos Gulf, NW Aegean Sea). J. Plankton Rs 26 (4):445-457. [CrossRef]
- Hattenrath-Lehmann, T.K., Marcoval, M.A., Berry, D.L., Fire, S., Wang, Z., Morton, S.L., & Gobler, C.J. 2013. The emergence of Dinophysis acuminata blooms and DSP toxins in shellfish in New York waters. Harmful Algae, 26: 33-44. [CrossRef]
- Pease, S. K. D., Brosnahan, M. L., Sanderson, M. P., & Smith, J. L. (2022). Effects of Two Toxin-Producing Harmful Algae, Alexandrium catenella and Dinophysis acuminata (Dinophyceae), on Activity and Mortality of Larval Shellfish. Toxins, 14(5), 335. [CrossRef]
- Wolny, J.L., Egerton, T.A., Handy, S.M., Stutts, W.L., Smith, J.L., Whereat, E.B., Bachvaroff, T.R., Henrichs, D.W., Campbell, L., Deeds, J.R. 2020. Characterization of Dinophysis spp. (Dinophyceae, Dinophysiales) from the mid-Atlantic region of the United States. Journal of Phycol. 56(2):. [CrossRef]
- Maso, M., and Garces, E. 2006. Harmful microalgae blooms (HAB); problematic and conditions that induce them. Marine Pollution Bulletin, 53(10-12), 620-630. [CrossRef]
- Paerl, H.W., Hall, N.S, Peierls, B.L. & Rossignol, K.L. 2014. Evolving paradigms and challenges in estuarine and coastal eutrophication dynamics in a culturally and climatically stressed world. Estuaries and Coasts 37(2):243–258. [CrossRef]
- Whyte, C., Swan, S., Davidson, K. 2014. Changing wind patterns linked to unusually high Dinophysis blooms around the Shetland Islands, Scotland. Harmful Algae 39: 365-373. [CrossRef]
- Hauser, C. A., & Bason, C. W. (2020). The Economic Value of the Delaware Inland Bays. DE.
- Title of Site. Available online: URL (accessed on Day Month Year).
- Title of Site. Available online: URL (accessed on Day Month Year).
- Welschmeyer N. A. 1994. Fluorometric analysis of chlorophyll a in the presence of chlorophyll b and pheopigments. Limnol Oceanogr 39(8): 1985-1992. [CrossRef]
- Coyne, K. J., Hutchins, D. A., Hare, C. E. & Cary, S. C. 2001. Assessing temporal and spatial variability in Pfiesteria piscicida distributions using molecular probing techniques. Aquatic Microbial Ecology, 24: 275-285. [CrossRef]
- Dempster, E.L., Pryor, K.V., Francis, D., Young, J.E., & Rogers, H.J. 1999. Rapid DNA extraction from ferns for PCR-based analyses. Biotechniques 27:66–68. [CrossRef]
- Coyne, K.J., Handy, S.M., Demir, E., Whereat, E.B., Hutchins, D.A., Portune, K.J., Doblin, M.A., & Cary, S.C. 2005. Improved quantitative real-time PCR assays for enumeration of harmful algal species in field samples using exogenous DNA reference standard. Limnology and Oceanography, 3(9): 381-391. [CrossRef]
- Galluzzi, L., Bertozzini, E., Penna, A., Perini, F., Pigalarga, A., Graneli, E. and Magnani, M. (2008), Detection and quantification of Prymnesium parvum (Haptophyceae) by real-time PCR. Letters in Applied Microbiology, 46: 261-266. [CrossRef]
- Rosales, D., Ellett, A., Jacobs, J., Ozbay, G., Parveen, S., Pitula, J. 2022. Investigating the Relationship between Nitrate, Total Dissolved Nitrogen, and Phosphate with Abundance of Pathogenic Vibrios and Harmful Algal Blooms in Rehoboth Bay, Delaware. Applied and Environmental Microbiology 88(16):1-14. [CrossRef]
- Altschul, S.F., Gish, W., Miller, W., Myers, E.W., Lipman, D.J. 1990. Basic local alignment search tool. J Mol Biol. 215(3):403-10. [CrossRef]
- Moore, D. S., Notz, W. I, & Flinger, M. A. (2013). The basic practice of statistics (6th ed.): Chapter 4. New York, NY: W. H. Freeman and Company.
- Piehler, Michael and Lindsay Dubbs, directors. Taking a Sediment Core. Youtube.com/Taking a Sediment Core, University of North Carolina Coastal Studies Institute, 15 Aug. 2015, www.youtube.com/watch?v=0DixyJZCvVQ.
- Portune, K.J., Coyne, K.J., Hutchins, D.A., Handy, S.M., Cary, C.S. 2009. Quantitative real-time PCR for detecting germination of Heterosigma akashiwo and Chattonella subsalsa cysts from Delaware’s Inland Bays, USA. Aquatic Microbial Ecology 55: 229-239. [CrossRef]
- Hart, M.C., Green, D. H., Bresnan, E., & Bolch, C.J. 2007. Large subunit ribosomal RNA gene variation and sequence heterogeneity of Dinophysis (Dinophyceae) species from Scottish coastal waters. Harmful Algae 6: 271-287. [CrossRef]
- Scholin, C.A., Herzog, M., Sogin, M., & Anderson, D.M., 1994. Identification of group-specific and train-specific genetic-markers for globally distributed Alexandrium (Dinophyceae). II. Sequence analysis of a fragment of the LSU rRNA gene. J. Phycol. 30, 999–1011.
- United States Environmental Protection Agency. 2016. Estimated nitrate concentrations in groundwater used for drinking. Retrieved December 2020, from https://www.epa.gov/nutrient-policy-data/estimated-nitrate-concentrations-groundwater-used-drinking.
- United States Environmental Protection Agency. Ground Water and Drinking Water. February 14, 2020. National Primary Drinking Water Regulations. Retrieved December 6, 2020, from https://www.epa.gov/ground-water-and-drinking-water/national-primary-drinking-water-regulations.
- Ozbay, G. 2016. Delaware Inland Bays Eastern Oyster (Crassostrea virginica) Quality for Consumption and Application of Non-Thermal, High Hydrostatic Pressure (HHP) to Extend Oyster Shelf Life. Master of Science Thesis in Food Science & Biotechnology. Delaware State University, Human Ecology, Dover, DE USA. 173p.
- Bravo, I., Fraga, S., Figueroa, R.I., Pazos, Y., Massanet, A. & Ramilo, I. 2010. Bloom dynamics and life cycle strategies of two toxic dinoflagellates in a coasting upwelling system (NW Iberian Penninsula). Deep-Sea Research II, 57:222-234.
- Kremp, A. & Heiskanen, A.S. 1999. Sexuality and cyst formation of the spring bloom dinoflagellate Scrippsiella hangoei in the coastal northern Baltic Sea. Mar. Biol 134:771–777. [CrossRef]
- Warns, A., Hense, I. & Kremp, A. 2012. Modelling the life cycle of dinoflagellates; a case study with Biecheleria baltica. Journal of Plankton Research 35(2):379-392. [CrossRef]
- Hattenrath-Lehmann, TK., Smith, JL., Wallace, RB., Merlo, L., Koch, F., Mittelsdorf, H., Goleski, JA., Anderson, DM., Gobler, CJ. 2015b. The effects of elevated CO2 on the growth and toxicity of field populations and cultures of the saxitoxin-producing dinoflagellates, Alexandrium fundyense. Limnol Oceanogr 60(1):198-214. [CrossRef]
- Hattenrath-Lehmann, TK., Marcoval, M.A., Mittlesdorf H., Goleski, J.A., Wang, Z., Haynes, B. 2015a. Nitrogenous Nutrients Promote the growth and toxicity of Dinophysis acuminata during estuarine bloom events. PLoS ONE 10 (4):e0124148.
- Tong, M., Smith, J., Kulis, D., Anderson, D. 2015. Role of dissolved nitrate and orthophosphate in isolates of Mesodinium rubrum and toxin-producing Dinophysis acuminata. Aquatic Microbial Ecology 75:169-185. [CrossRef]
- Setälä, O., Autio, R., Kuosa, H., Rintala, J., & Ylöstalo, P. (2005). Survival and photosynthetic activity of different dinophysis acuminata populations in the northern Baltic Sea. Harmful Algae, 4(2), 337–350. [CrossRef]
- Tong, M., Zhou, Q., David, K. M., Jiang, T., Qi, Y., & Donald, A. M. 2010. Culture techniques and growth characteristics of Dinophysis acuminata and its prey. Chinese Journal of Oceanology and Limnology 28(6):1230-1239. [CrossRef]
- Bravo, I., & Figueroa, R. I. 2014. Towards an ecological understanding of dinoflagellate cyst functions. Microorganisms, 2, 11-32. [CrossRef]
- Berland, B.R., Maestrini, S.Y. & Grzebyk, D. 1995. Observation on possible life cycle stages of the dinoflagellates Dinophysis cf. acuminata, Dinophysis acuta and Dinophysis pavillardi. Aquatic Microbial Ecology. 9: 183-189. [CrossRef]
- Escalera, L. & Reguera, B. 2008. Planozygote Division and Other Observations on the Sexual Cycle of Several Species of Dinophysis (Dinophyceae, Dinophysiales). Journal of Phycology. 44. 1425 - 1436. [CrossRef]
- Collins, R.A., Wangensteen, O.S., O’Gorman, E.J., Mariani, S., Sims, D.W., & Genner, M.J. 2018. Persistence of environmental DNA in marine systems. Commun Biol 1, 185. [CrossRef]
- Coyne, K.J., Hare, C.E., Popels, L.C., Hutchins, D.A. & Cary, S.C. 2006. Distributions of Pfisteria piscida cyst populations in sediments of the Delaware Inland Bays. Harmful Algae, 5 (4):363-373.
- Keafer, B.A., Buesseler, K.O. & Anderson, D.M. 1992. Burial of living dinoflagellate cysts in estuarine and nearshore sediments. Mar. Micropaleontol. 20, 147–161. [CrossRef]
- McQuoid, M.R., Godhe, A. & Nordberg, K. 2002. Viability of phytoplankton resting stages in the sediments of a coastal Swedish fjord. Eur. J. Phycol. 37: 191–201. [CrossRef]
- Rozan, T.F., Taillefert, M., Trouwborst, R.E., Glazer, B.T., Ma, S., Herszage, J., Valdes, L.M., Price, K.S. & Luther, G.W. 2002. Iron– sulfur–phosphorus cycling in the sediments of a shallow coastal bay: implications for sediment nutrient release and benthic macroalgal blooms. Limnol. Oceanogr. 47, 1346–1354. [CrossRef]
- Taillefert, M., Rozan, T.F., Glazer, B.T., Herszage, J., Trouwborst, R.E. & Luther, G.W. 2002. Seasonal variations of soluble organicFe(III) in sediment porewaters as revealed by voltammetric microelectrodes. In: Taillefert, M., Rozan, T.F. (Eds.), Analyses of Trace Elemental Biogeochemistry. American Chemical Society, pp. 247–264.
- Coyne, K.J. & Cary, S.C. 2005. Molecular approaches to the investigation of viable dinoflagellate cysts in natural sediments from estuarine environments. Eukaryotic Microbiology, 52 (2): 90-94. [CrossRef]
- Jephson, T. & Carlsson, P. 2009. Species and stratification dependent diel vertical migration behaviour of three dinoflagellate species in a laboratory study. Journal of Plankton Research 31(11): 1353-1362. [CrossRef]
- Lassus, P., Proniewski, F., Pigeon, C., Veret, L., Le Dean, L., Bardouil, M., & Truquet, P. 1990. The diurnal vertical migrations of Dinophysis acuminata in an outdoor tank at Antifer (Normandy, France). Aquatic Living Resources 3(2):143-145. [CrossRef]
Figure 1.
Location of monitoring sites for this study. (a) a map of Rehoboth Bay [23], Delaware, USA and (b) the locations of Torquay Canal Transect Points [24] for the field surveys and sample collections.
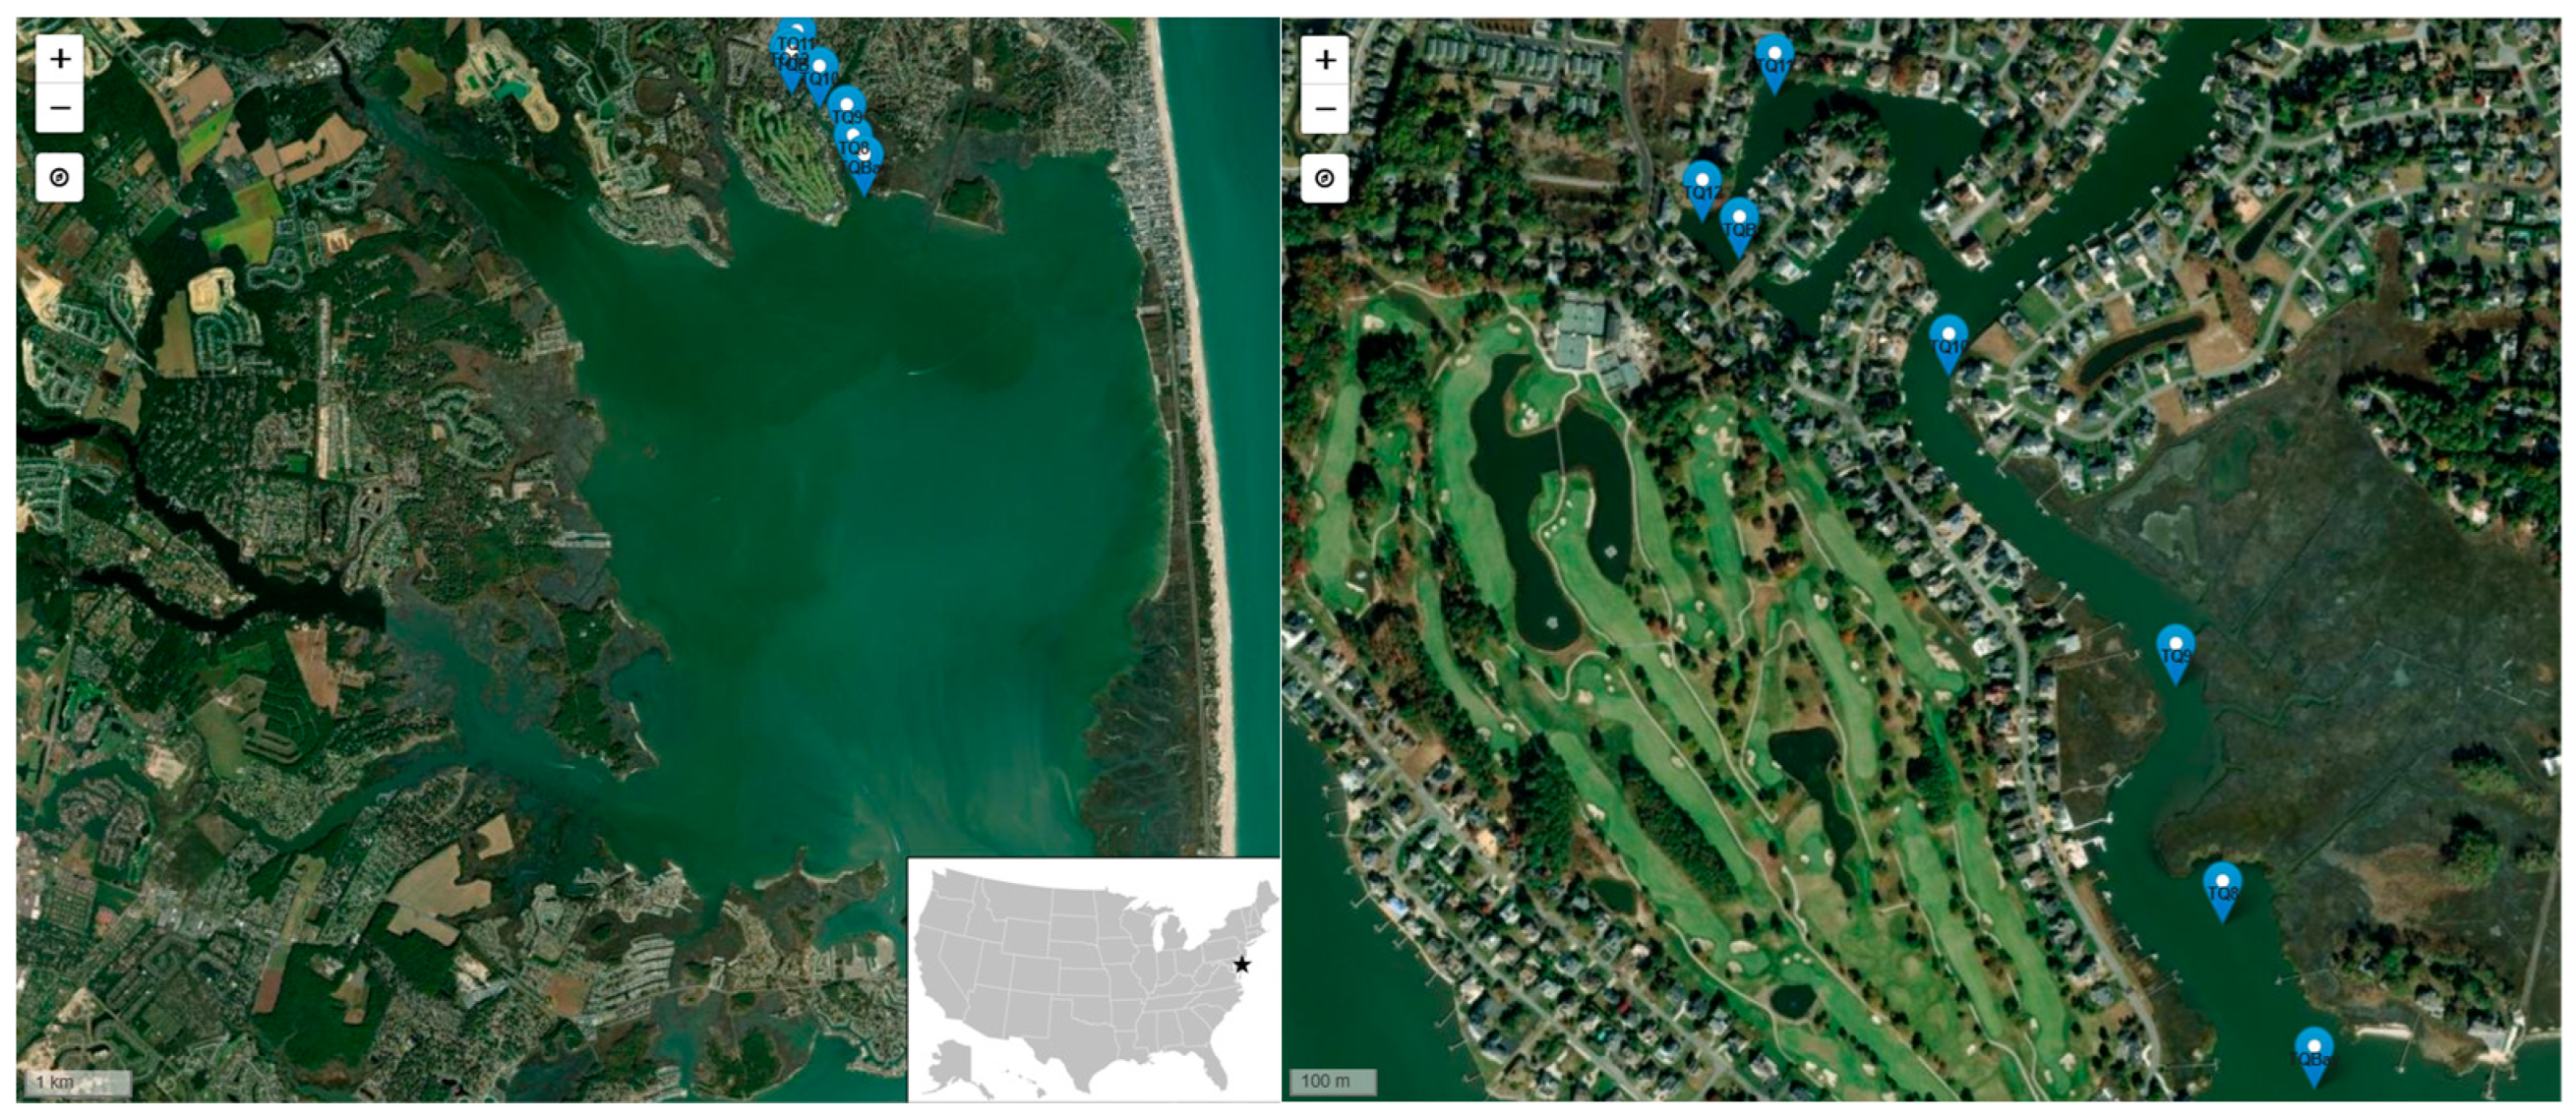
Figure 2.
Light micrograph of Dinophysis acuminata identified during the 2020 winter bloom at TQB.
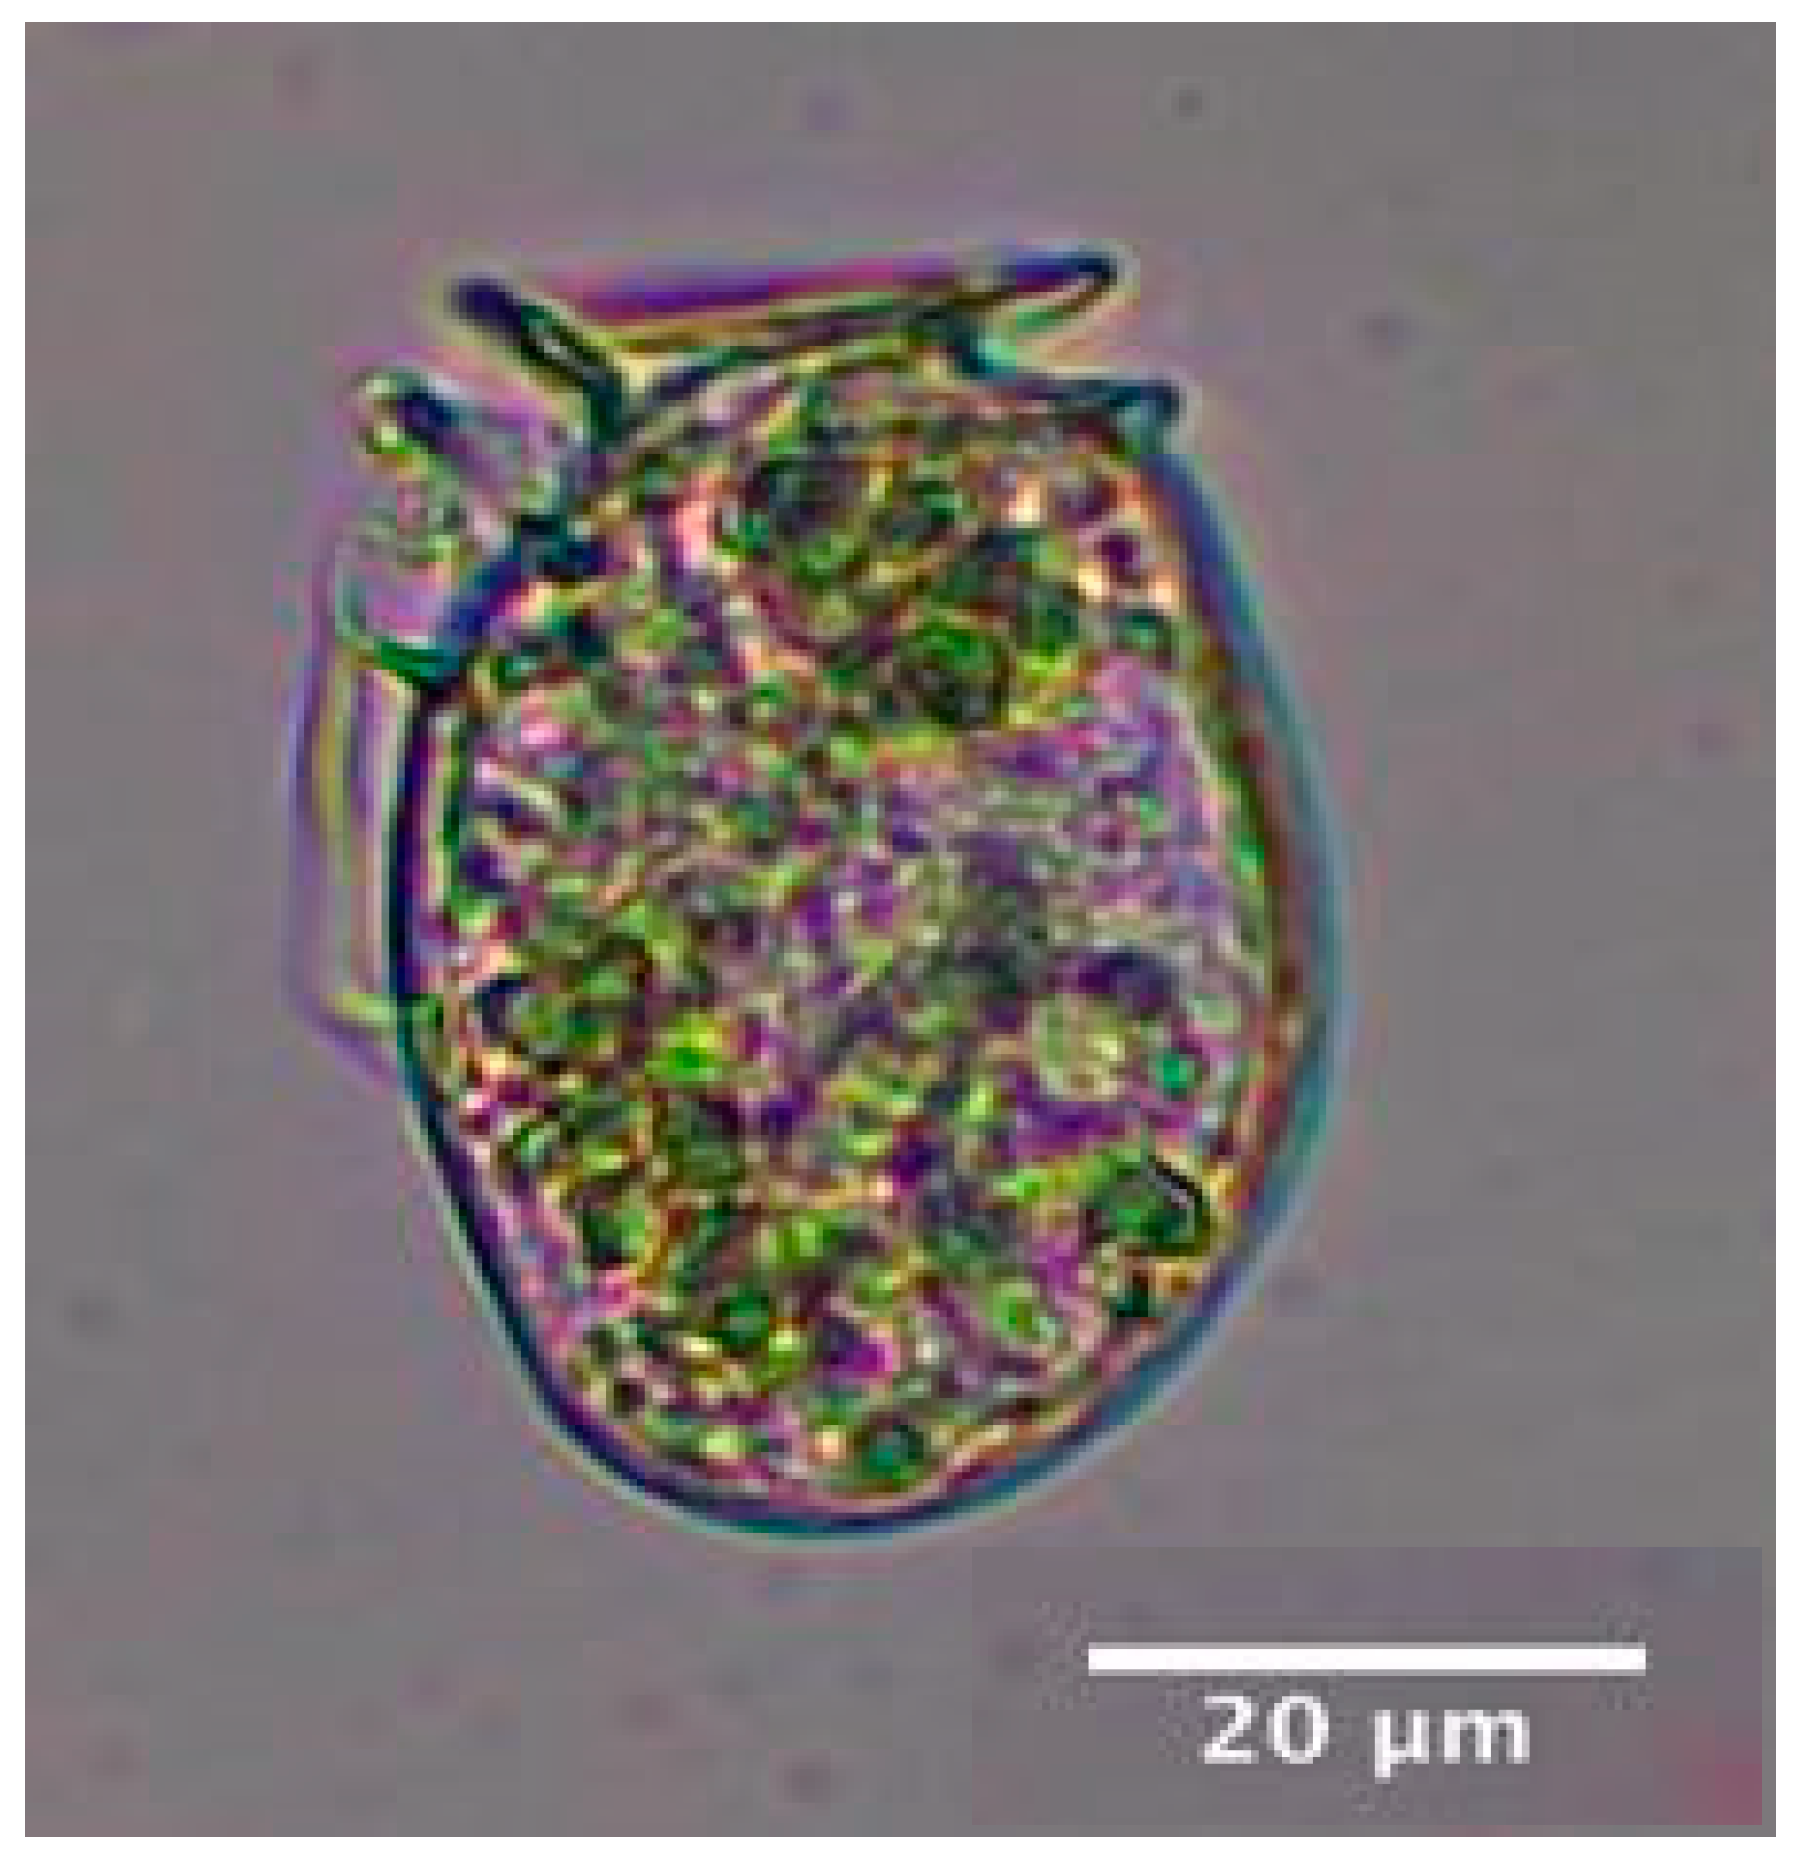
Figure 3.
D. acuminata mean cell density (cells ∙ L-1) at each site on full transect sampling dates. Note. Error bars represent the standard error of the mean.
Figure 3.
D. acuminata mean cell density (cells ∙ L-1) at each site on full transect sampling dates. Note. Error bars represent the standard error of the mean.
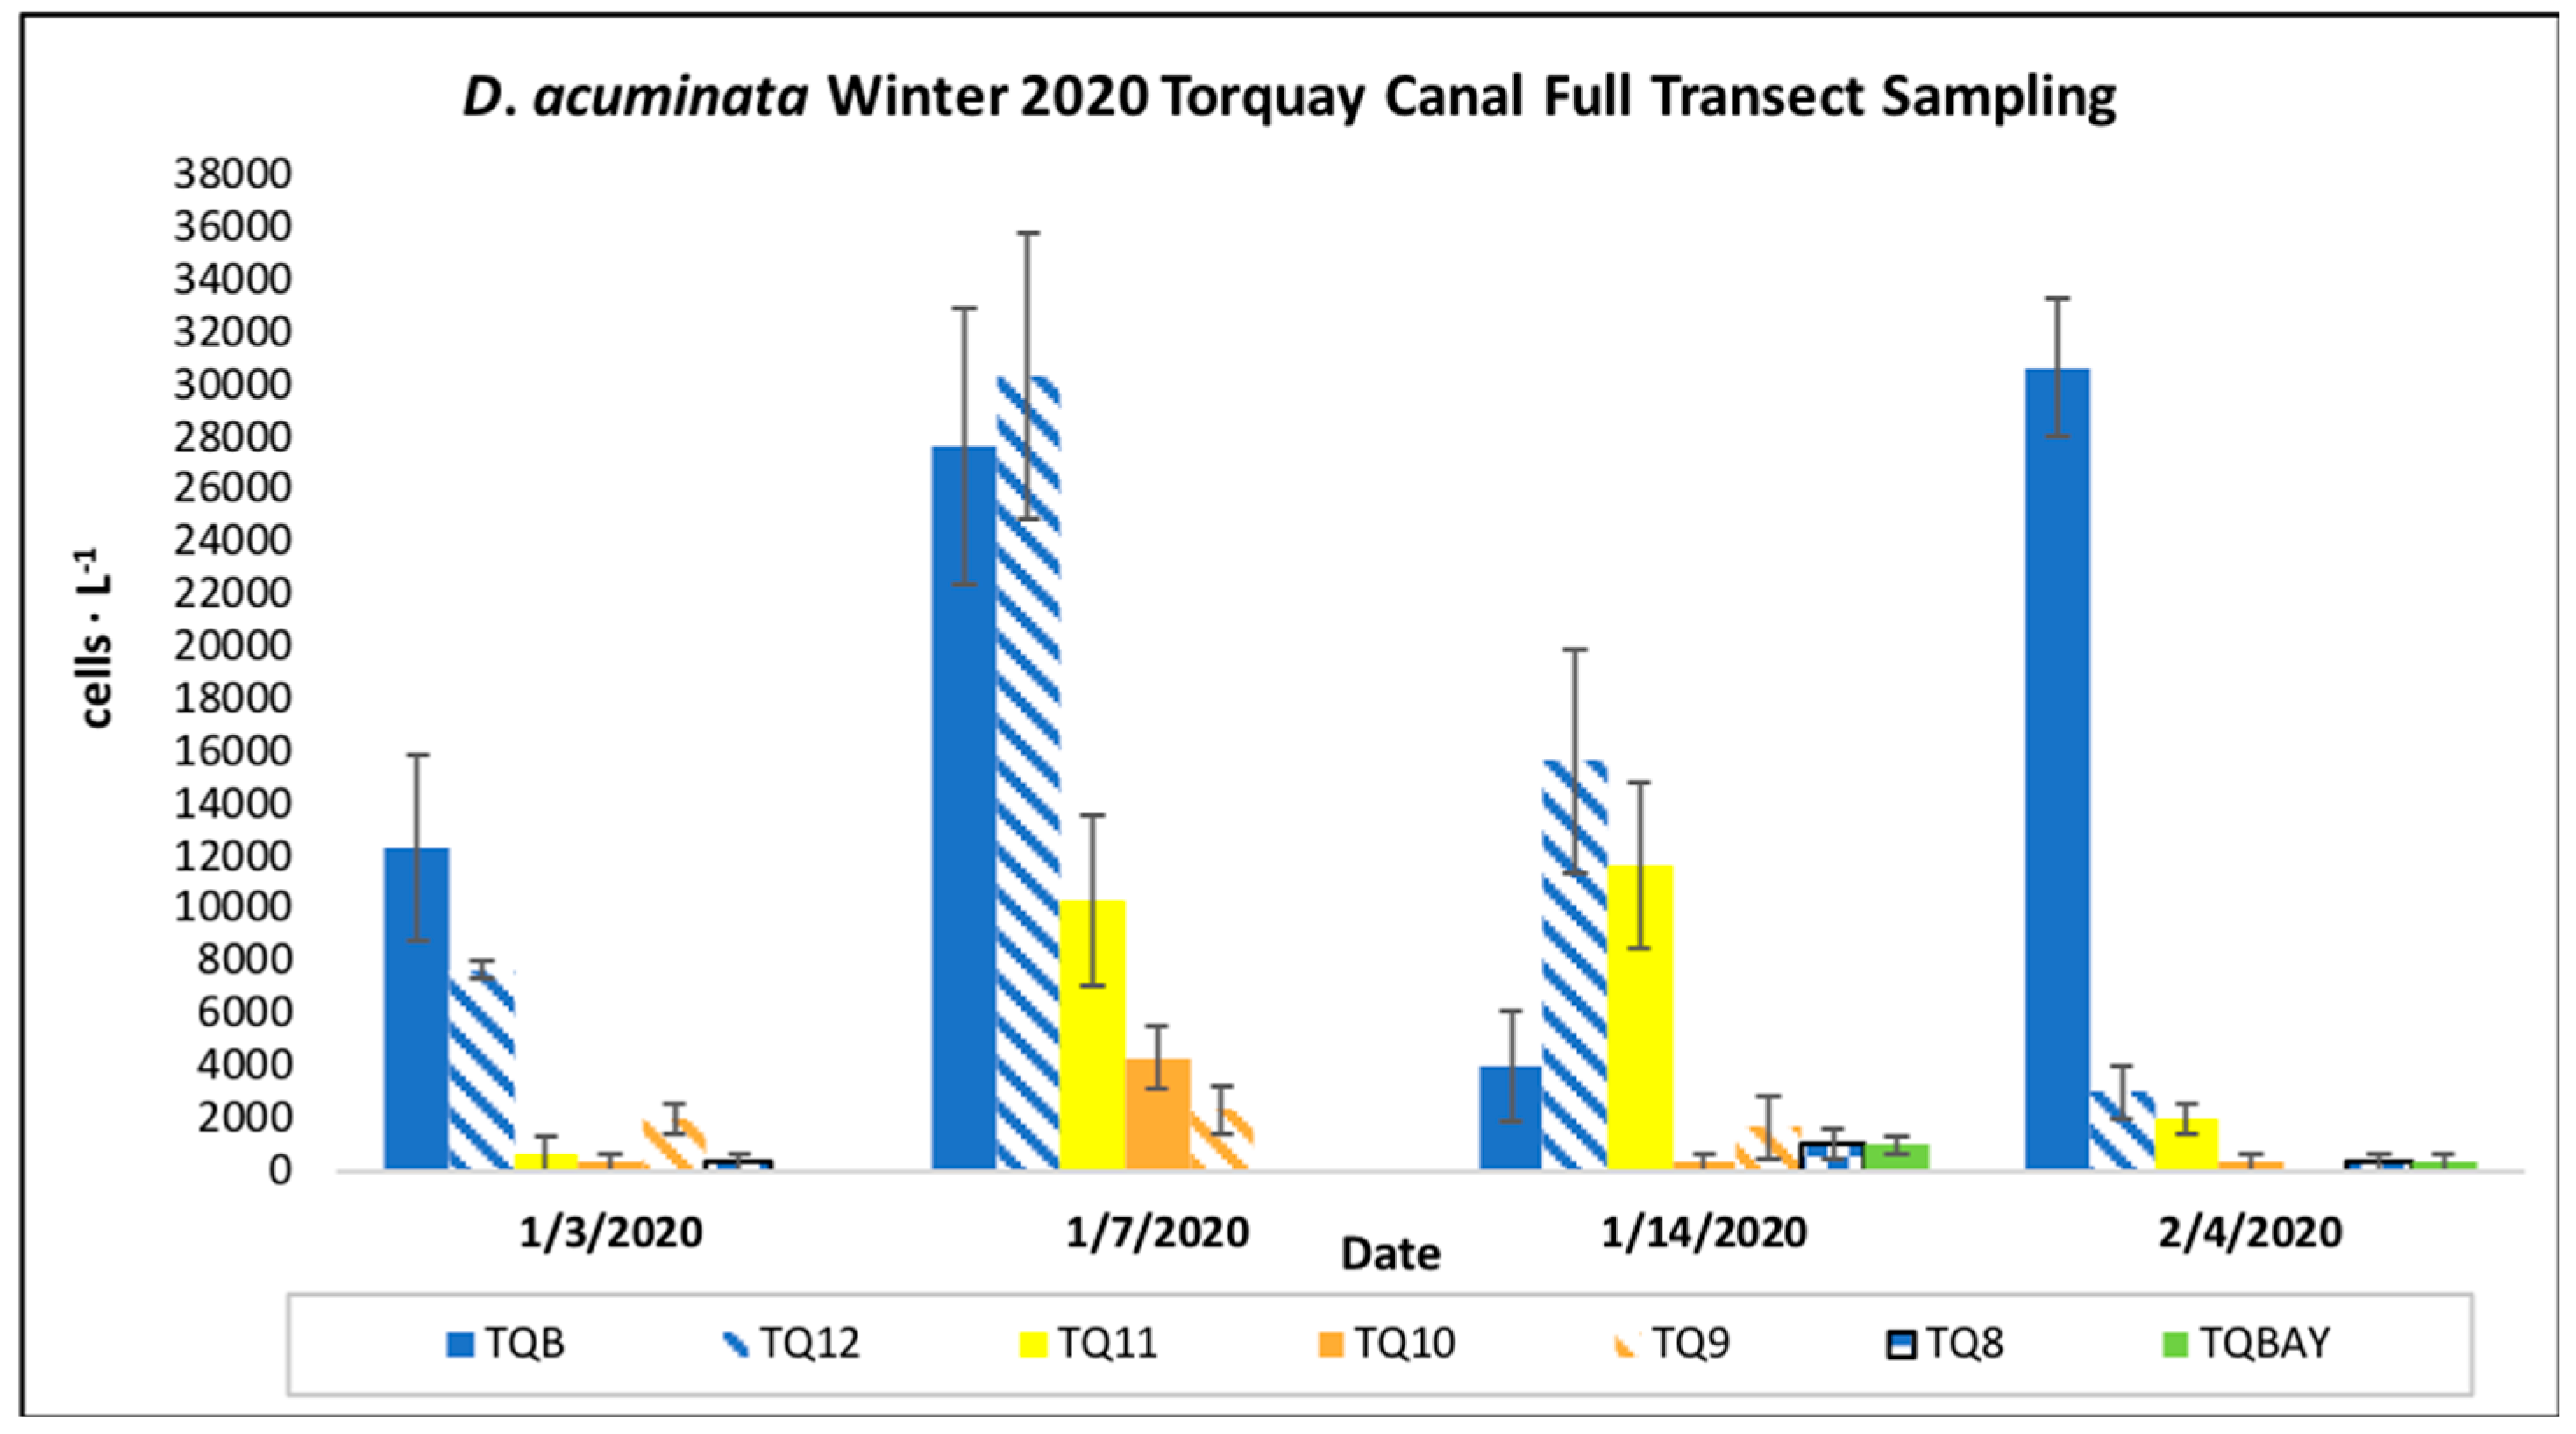
Figure 4.
Mean combined nitrate and nitrite (NO3) and orthophosphate (mg P ∙ L-1) for each sampling date at TQB, during the D. acuminata winter bloom event in 2020, compared with cell densities.
Figure 4.
Mean combined nitrate and nitrite (NO3) and orthophosphate (mg P ∙ L-1) for each sampling date at TQB, during the D. acuminata winter bloom event in 2020, compared with cell densities.
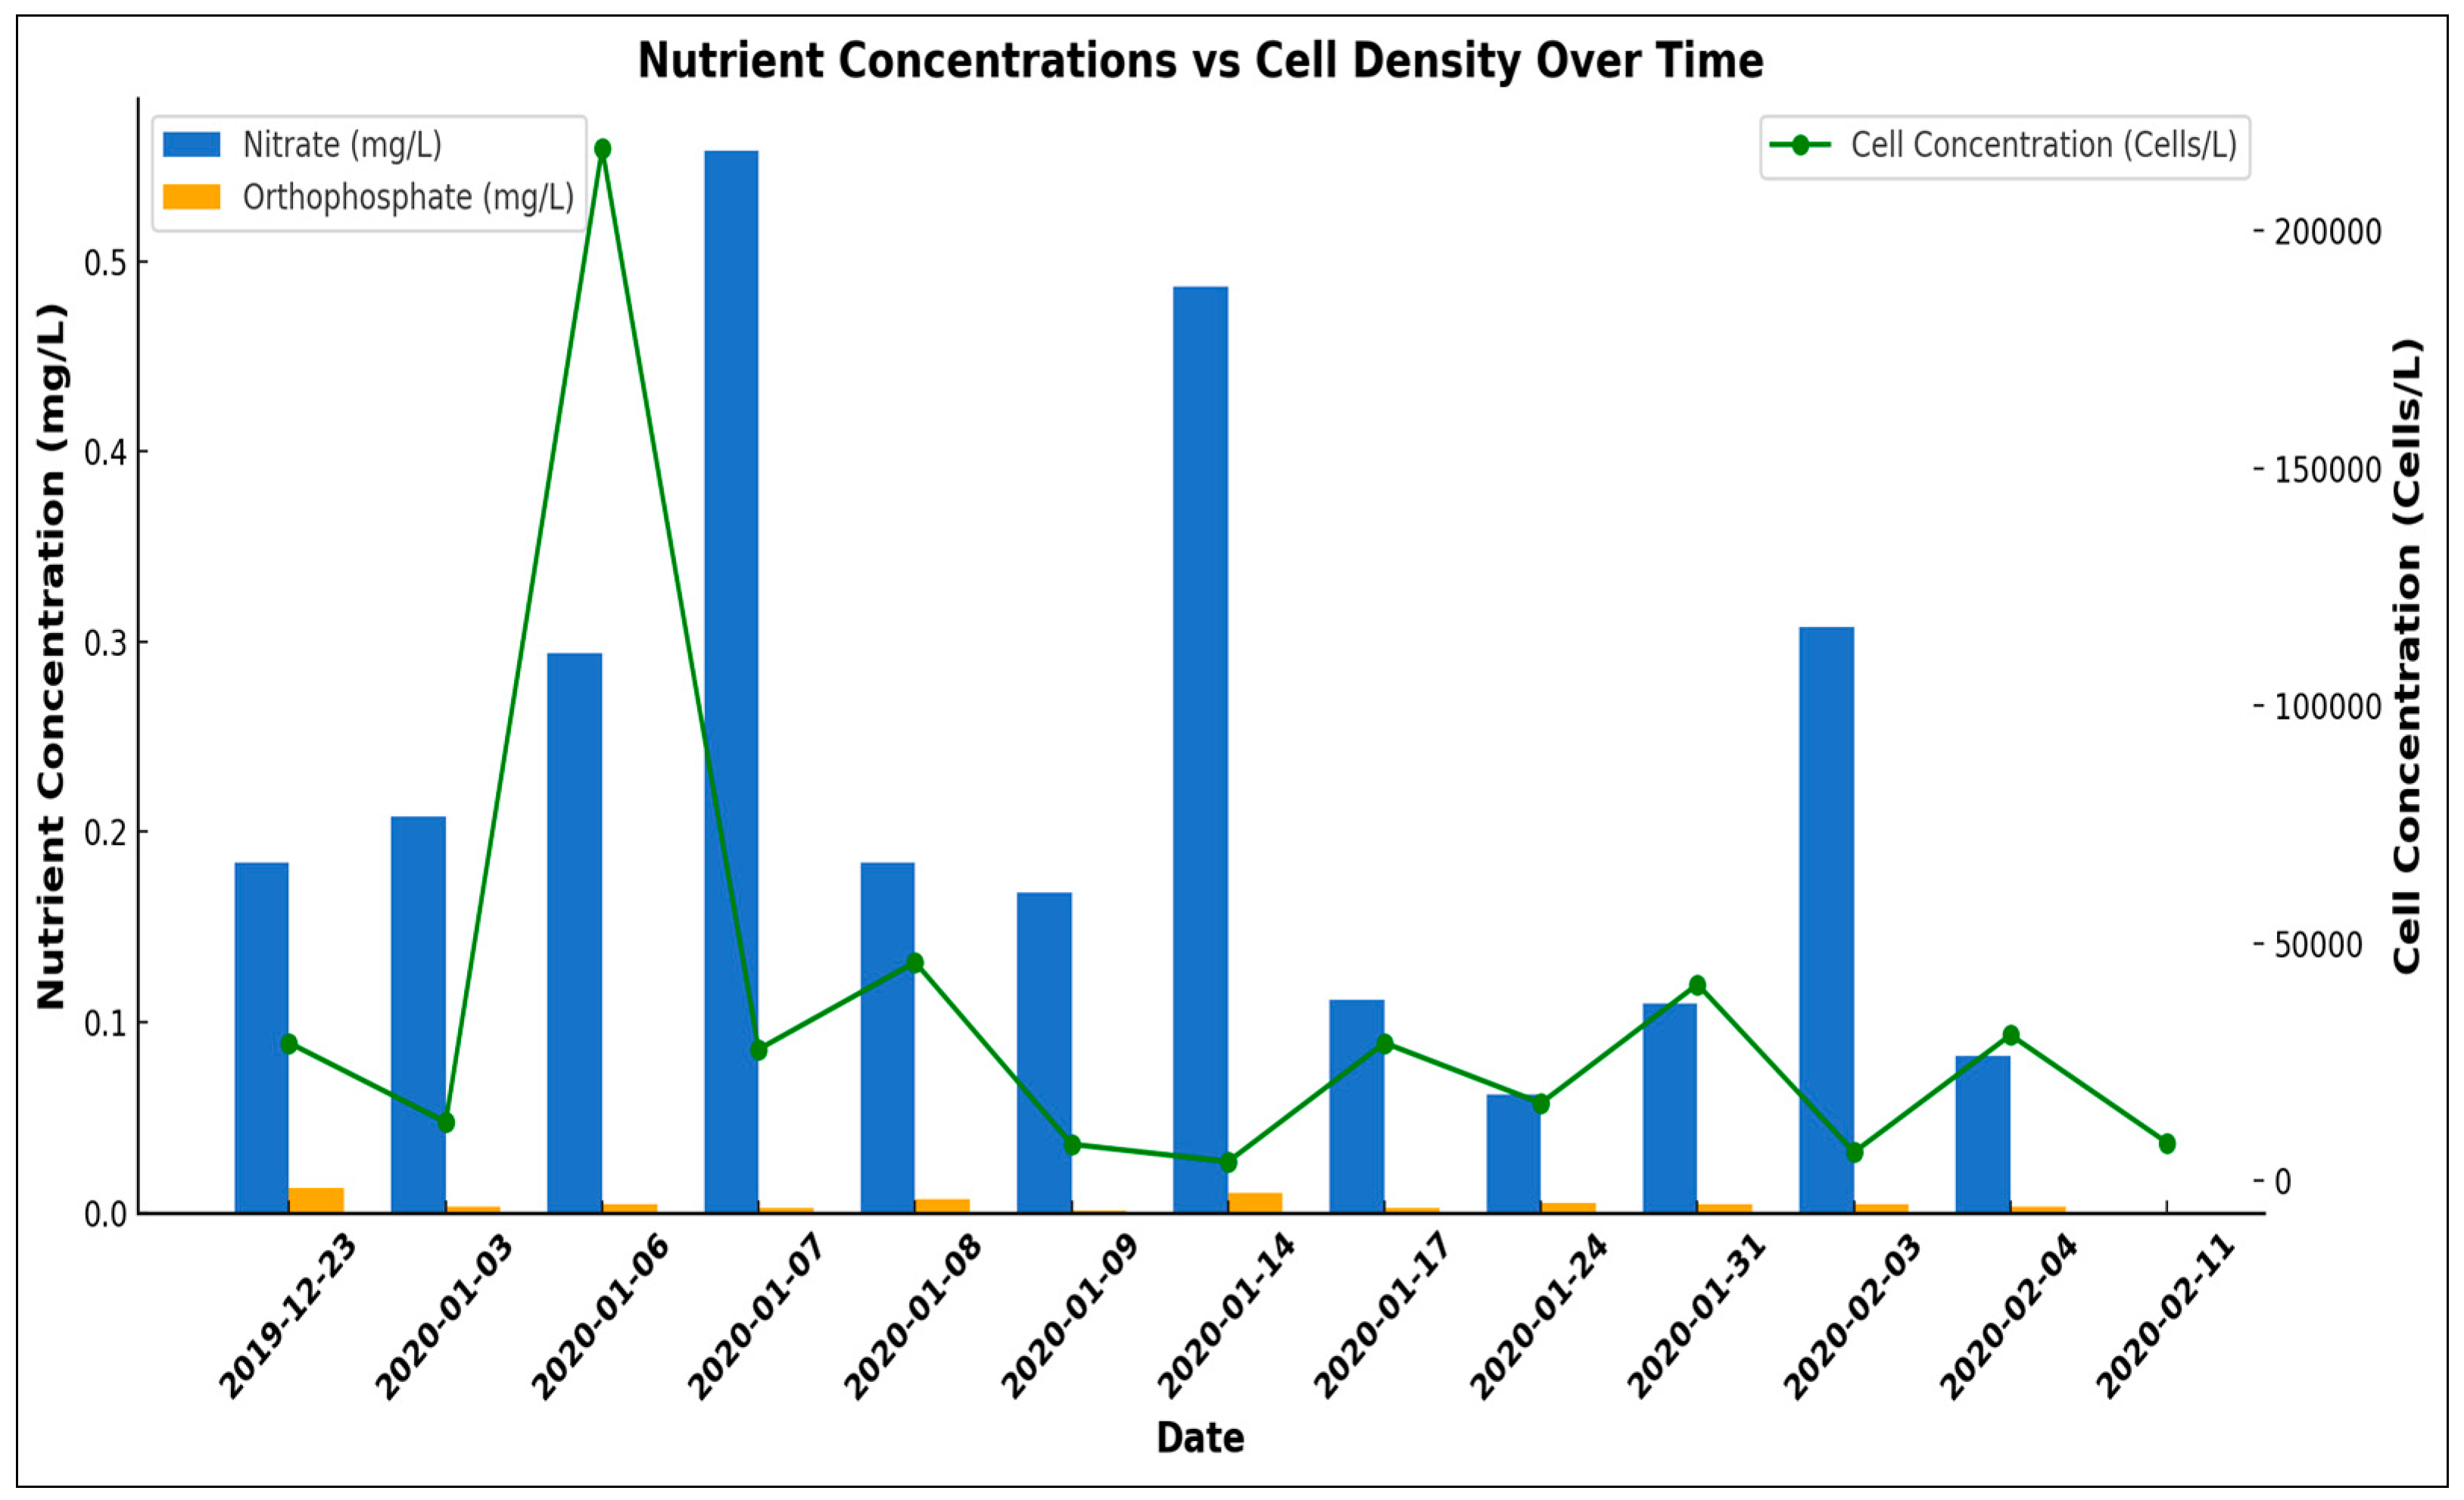
Figure 5.
(a-e). Positive amplification of Dinophysis using gel electrophoresis. Dinophysis positive samples: (a) February 11, 2020 TQ_A-1 (position 6), February 11, 2020 TQ_B-1 (position 7), (b) July 5, 2018 TQ_C-1(position 36), July 19, 2020 CA_C-1 (position 47), July 19, 2018 JF_A-1 (position 48), (c) December 30, 2018 TQ_A-1 (position 66), (d) August 2, 2018 CA_A-3 (position 83), December 23, 2019 TQ_B-1(position 91), March 28, 2019 TQ_B-1 (position 92), August 1, 2019 JF-2 (position 94), and (e) August 1, 2019 JF-5 (position 97), August 9, 2019 CA-1b (position 98), September 3, 2018 CA-2 (position 106).
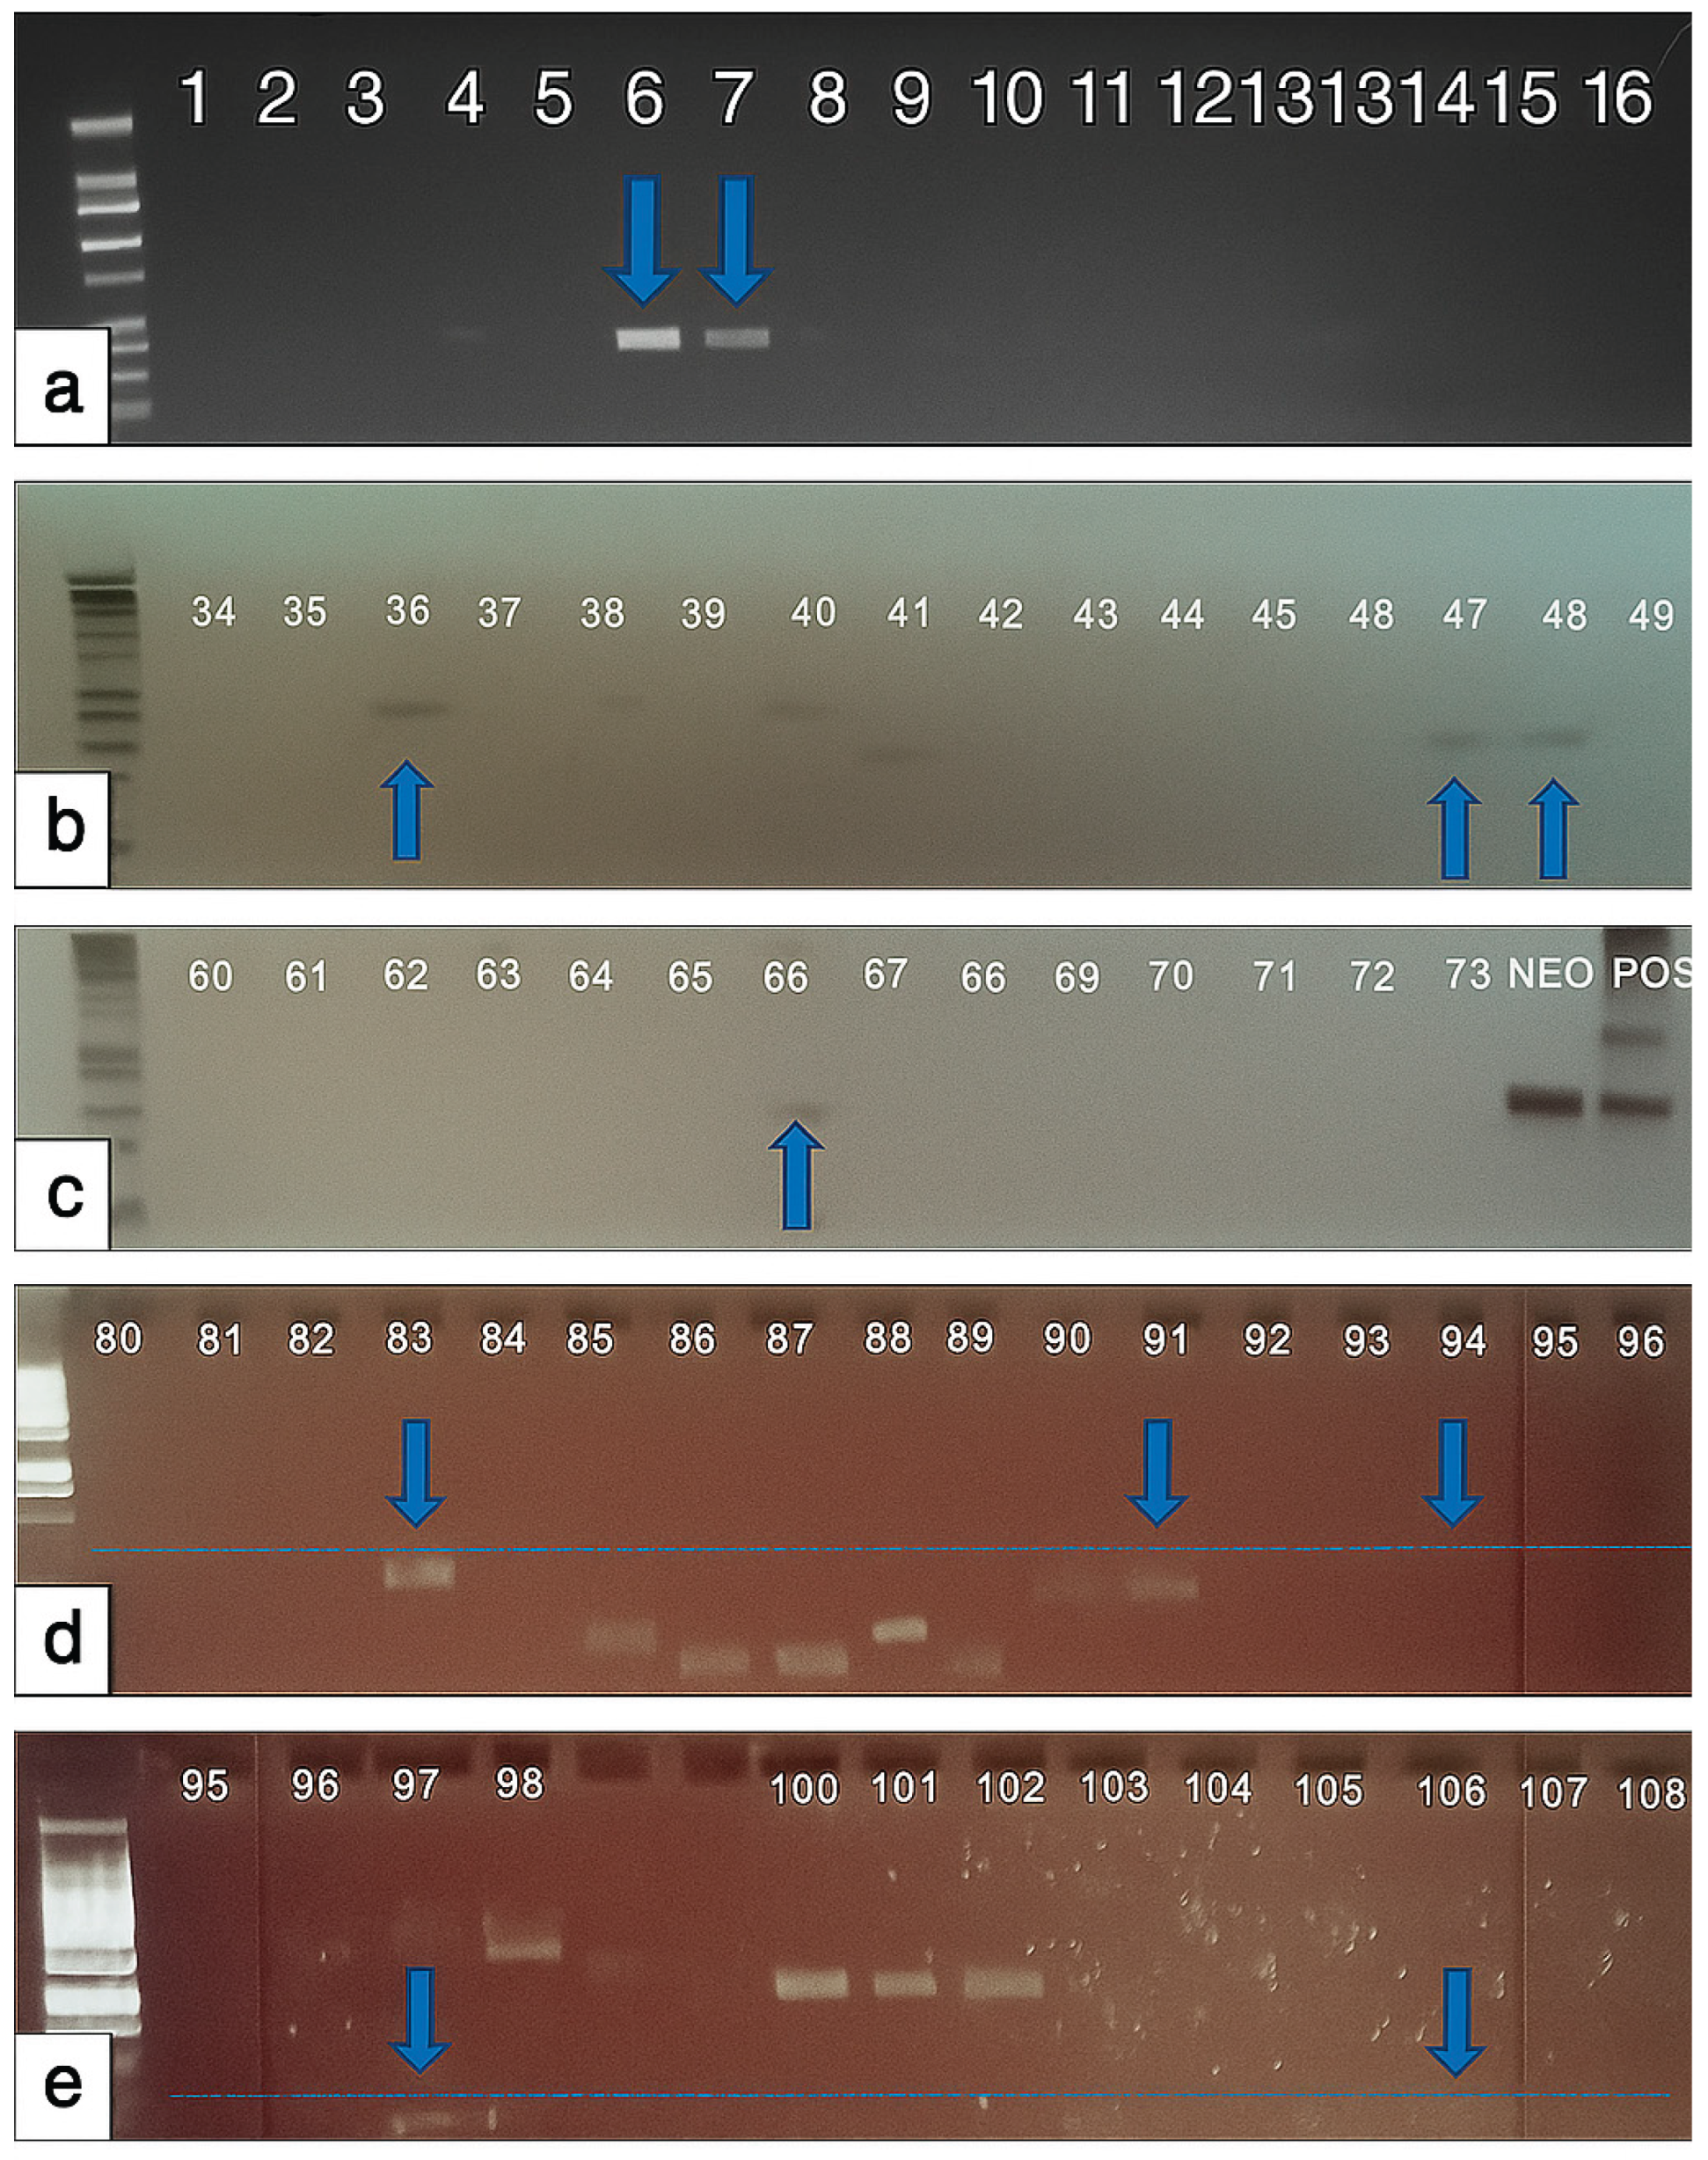

Table 1.
Site descriptions with side code and coordinates. Note. The sites at Torquay Canal (TQ) were used for transect sampling of D. acuminata, while benthic sediment samples and water quality for nutrient analysis were also collected from Camp Arrowhead and James Farm.
Table 1.
Site descriptions with side code and coordinates. Note. The sites at Torquay Canal (TQ) were used for transect sampling of D. acuminata, while benthic sediment samples and water quality for nutrient analysis were also collected from Camp Arrowhead and James Farm.
| Site Name | Description | Coordinates |
|---|---|---|
| TQB | Transect starting point | 38.699079, -75.112431 |
| TQBay | Transect ending point | 38.690418, -75.104775 |
| Torquay Canal (TQ) | Dead-end residential canal | TQ8: 38.692135, -75.105985 TQ9: 38.694625, -75.106608 TQ10: 38.697852, -75.109639 TQ11: 38.700784, -75.111952 TQ12: 38.699462, -75.112918 |
| Camp Arrowhead (CA) | Pilot artificial oyster reef | A: 38.656779, -75.130685 B: 38.656037, -75.130158 C: 38.655379, -75.129155 |
| James Farm (JF) | Ecological preserve | A: 38.574917, -75.079540 B: 38.575082, -75.079304 C: 38.575078, -75.079439 |
Table 2.
A Pearson Correlation Coefficient Analysis between cell density (cells ∙ L-1) and environmental variables across all sites during D. acuminata winter 2020 bloom event.
Table 2.
A Pearson Correlation Coefficient Analysis between cell density (cells ∙ L-1) and environmental variables across all sites during D. acuminata winter 2020 bloom event.
| Pearson Correlation |
Water Temp (°C) | Chl-a ∙ (µg L-1) | Conductivity (mS/cm) | DO (mg∙ L-1) |
NOx (mg N ∙ L-1) |
OP (mg P ∙ L-1) |
pH |
|---|---|---|---|---|---|---|---|
| Coefficient (r) | -0.156 | 0.055 | -0.258 | -0.087 | -0.098 | 0.0567 | -0.404 |
| N | 109 | 35 | 35 | 37 | 37 | 37 | 37 |
| T statistic | 1.635 | 0.318 | 1.580 | 0.518 | 0.598 | 0.334 | 2.611 |
| DF | 107 | 33 | 35 | 35 | 35 | 35 | 35 |
| p-value | 0.105 | 0.753 | 0.123 | 0.608 | 0.566 | 0.738 | 0.0132 |
Table 3.
Pearson Correlation Coefficient Analysis between cell density (cells ∙ L-1) and environmental variables at site TQB during the D. acuminata winter 2020 bloom event.
Table 3.
Pearson Correlation Coefficient Analysis between cell density (cells ∙ L-1) and environmental variables at site TQB during the D. acuminata winter 2020 bloom event.
| Pearson Correlation | Date | Water Temp (°C) | Chl-a (µg L-1) | Conductivity (mS/cm) | DO (mg∙ L-1) |
NOx (mg N ∙ L-1) |
OP (mg P ∙ L-1) |
pH |
|---|---|---|---|---|---|---|---|---|
| Coefficient (r) | -0.253 | -0.152 | -0.698 | -0.087 | -0.264 | 0.047 | -0.058 | -0.3869 |
| N | 13 | 13 | 12 | 13 | 13 | 12 | 12 | 13 |
| T statistic | 0.868 | 0.510 | 0.221 | 0.290 | 0.909 | 0.150 | 0.182 | 1.391 |
| DF | 11 | 11 | 10 | 11 | 11 | 10 | 10 | 11 |
| p value | 0.404 | 0.620 | 0.829 | 0.777 | 0.383 | 0.884 | 0.859 | 0.192 |
Disclaimer/Publisher’s Note: The statements, opinions and data contained in all publications are solely those of the individual author(s) and contributor(s) and not of MDPI and/or the editor(s). MDPI and/or the editor(s) disclaim responsibility for any injury to people or property resulting from any ideas, methods, instructions or products referred to in the content. |
© 2025 by the authors. Licensee MDPI, Basel, Switzerland. This article is an open access article distributed under the terms and conditions of the Creative Commons Attribution (CC BY) license (http://creativecommons.org/licenses/by/4.0/).
Copyright: This open access article is published under a Creative Commons CC BY 4.0 license, which permit the free download, distribution, and reuse, provided that the author and preprint are cited in any reuse.


