
Submitted:
16 July 2025
Posted:
18 July 2025
You are already at the latest version
Abstract
This study examined how drivers’ eye fixations change before, during, and after recognizing road markings, and how these changes relate to driving speed, visual complexity, cognitive functions, and demographics. 20 licensed drivers viewed on-board movies showing digit or letter road markings while their eye movements were tracked. Fixation positions and dispersions were analyzed. Results showed that, regardless of marking type, fixations were horizontally dispersed before and after recognition but became vertically concentrated during recognition, with fixation points shifting higher (p < 0.001) and horizontal dispersion decreasing (p = 0.01). During the recognition period, fixations moved upward and narrowed horizontally toward the final third (p = 0.034), suggesting increased focus. Longer fixations were linked to slower speeds for digits (p = 0.029) and more letters for letter markings (p < 0.001). No significant correlations were found with cognitive functions or demographics. These findings suggest that drivers first scan broadly, then concentrate on markings as they approach. For optimal recognition, simple or essential information should be placed centrally or lower, while detailed content should appear higher to align with natural gaze patterns. In high-speed environments, markings should prioritize clarity and brevity in central positions to ensure safe and rapid recognition.
Keywords:
driving
; road marking
; fixation
; driving speed
; visual recognition
; on-board movies
1. Introduction
Driving is a critical activity that supports daily living, employment [1], personal independence [2], and overall quality of life [3], making it socially essential. Simultaneously, driving is a complex task that demands continuous visual attention to detect and avoid potential hazards such as surrounding vehicles, road obstacles, and pedestrians [4], as well as to recognize traffic and guide signs accurately [5,6]. Inadequate visual recognition can significantly increase the risk of traffic accidents [7]. Therefore, accurate visual recognition of traffic signs, road markings, and other environmental cues is vital for safe driving.
Among these cues, road markings—such as digit-based indicators of speed limits and letter-based warnings of road conditions—play an essential role [8,9,10]. Because road markings occupy a substantial portion of the driver field of view, they serve as an effective medium for conveying important information [11]. They contribute to safer driving by encouraging speed reduction and hazard avoidance, particularly at intersections and on curves [12,13,14]. Consequently, road markings must be designed for quick and accurate recognition.
However, fundamental data on the fixation behavior of drivers when recognizing digit- and letter-based road markings remain lacking, and whether current road markings are consistently easy to recognize is unclear. Previous studies have shown that both the amount of information on signage and driving speed affect the recognition of roadside or overhead guide signs [5,6,15], suggesting that similar factors may influence the road marking recognition. Therefore, understanding fixation behavior during the recognition of these markings is essential to improving their design.
In this study, we used on-board video recordings and eye-tracking technology to examine how drivers recognize digit and letter road markings. We analyzed the differences in fixation behavior between these two types and investigated how fixation is influenced by driving speed and the number of stimuli.
Analysis 1 examined differences in the fixation position and dispersion before, during, and after the visual recognition of road markings.
Analysis 2 divided the recognition period into three phases (first, middle, and final thirds) to assess changes in fixation behavior over time.
Analysis 3 explored the correlations between the fixation duration and frequency with the driving speed and number of visual stimuli based on previous studies [5,15].
Analysis 4 investigated the associations among fixation behavior, cognitive functions, and basic demographics, referencing previous research on guide sign recognition [6,16].
Through these analyses, this study aimed to clarify how current road markings are visually processed and to offer insights for the development of safer, more effective road marking designs. Two types of road marking were used as stimuli: digit-based markings indicating speed limits and letter-based markings conveying warning messages to drivers. This study is positioned as preliminary work aimed at exploring fixation behaviors during the viewing of on-board movies, prior to conducting experiments using driving simulators or real vehicles.
2. Materials and Methods
2.1. Participants
This study is part of a broader research project investigating the relationship between cognitive functions and eye movements during the recognition of road markings while driving, with a particular focus on individuals with impaired driving abilities, including those with mental disabilities. In this paper, we report the exploratory and preliminary analysis that was conducted with a healthy control group. Some data analyzed in this study overlap with those from our previous research [6].
The required sample size was calculated using G*Power version 3.1.9.7 [17] for a repeated-measures ANOVA (within-subject factors), assuming an effect size of f = 0.3, power of 0.8, alpha of 0.05, two groups, and three measurements. This resulted in a target sample size of 20 participants.
The participants were selected from a previous study based on the following inclusion criteria: (1) aged 20 to 59 years and holding a valid driver’s license; (2) normal or corrected-to-normal visual acuity of 0.6 or higher; (3) no history of neurological or psychiatric disorders; (4) no history of epilepsy; and (5) no ophthalmologic conditions, including cataracts or glaucoma.
2.2. Apparatus
The visual stimuli were presented on a 24-inch monitor (iiyama ProLite B2480HS, resolution: 1920 × 1080, brightness: 300 cd/m²), and eye movements were recorded using a Tobii X60 eye tracker (sampling rate: 60 Hz). The eye-tracking data were analyzed using Tobii Studio version 3.1.6.
2.3. Stimuli
Two types of on-board movies were used as stimuli: movies containing digit-based road markings (“50” for speed limits) and movies containing letter-based road markings conveying warning messages to drivers (e.g., “Slow Down”). These movies were selected because digits and letters represent the standard formats for meaningful road markings [18,19]. Initially, 10 movies were prepared for each condition; however, owing to unsuitable fixation data in one movie from each condition, nine movies were ultimately analyzed.
All movies were filmed during daytime on straight roads in environments that were unfamiliar to the participants. The road markings were designed in accordance with Japanese regulations [7]: the digits measured 5000 mm in height and 1200 mm in width, whereas each letter measured 2400 mm in height and 800 mm in width.
The visual recognition time was defined as the period during which a road marking remained within a visual recognition distance of 70 m [7] divided by the driving speed shown in the on-board movie. For digit road markings, this time directly reflected the driving speed, whereas for letter markings, it varied depending on the number of letters.
Details of each movie type are provided in Table 1 and Table 2, and example images are shown in Figure 1.

Table 1.
Movie features for visual recognition of digit road markings.
| Presence of cars in front | Visual recognition time (seconds) | |
| Movie 1 | Present | 1.36 |
| Movie 2 | Absent | 1.37 |
| Movie 3 | Present | 1.34 |
| Movie 4 | Absent | 1.34 |
| Movie 5 | Absent | 1.25 |
| Movie 6 | Absent | 1.5 |
| Movie 7 | Absent | 1.21 |
| Movie 8 | Present | 1.21 |
| Movie 9 | Present | 1.35 |
Table 2.
Movie features for visual recognition of letter road markings.
| Presence of cars in front | The number of letters | Written Marking | Visual recognition time (seconds) | |
| Movie 1 | Absent | 5 | Intersection Warning | 1.52 |
| Movie 2 | Present | 9 | Nasushiobara Sakura Direction | 3.32 |
| Movie 3 | Present | 4 | Beware of Rear-end Collision | 1.45 |
| Movie 4 | Present | 5 | Slow Down | 1.74 |
| Movie 5 | Present | 4 | Beware of Rear-end Collision | 1.81 |
| Movie 6 | Present | 5 | Beware of Pedestrians | 1.47 |
| Movie 7 | Present | 5 | Curve Warning | 1.76 |
| Movie 8 | Absent | 4 | Beware of Rear-end Collision | 1.48 |
| Movie 9 | Present | 5 | Slow Down | 1.53 |
2.4. Fixation Behavior Assessment
The fixation behavior was evaluated based on previous research on driving and road marking recognition [20,21,22,23]. Two primary indices were analyzed: (1) the fixation duration (in milliseconds), which represented the time spent fixating on road markings—where longer durations suggest greater attentional allocation [24]; and (2) the number of fixations, which indicated the frequency of attention shifts [20]. Fixations were detected using Tobii Studio’s I-VT filter [25], with the minimum fixation threshold set to 60 ms, based on binocular eye-tracking data.
2.5. Cognitive Function Assessment
The following assessments were used to evaluate cognitive functions relevant to driving:
- The Trail Making Test – Japanese Edition (TMT-J) A and B was used to assess attention and processing speed [26].
- The Wechsler Memory Scale – Revised (WMS-R) was used to evaluate verbal and visual memory [27].
- The Zoo Map Test, from the Behavioral Assessment of the Dysexecutive Syndrome (BADS) was used for planning [28]. Previous studies have shown that performance on the Zoo Map Test is associated with driving skills [29,30]. The TMT-J scores were recorded as the completion time (in seconds), whereas the WMS-R and BADS were scored using standardized procedures.
2.6. Data Collection Procedure
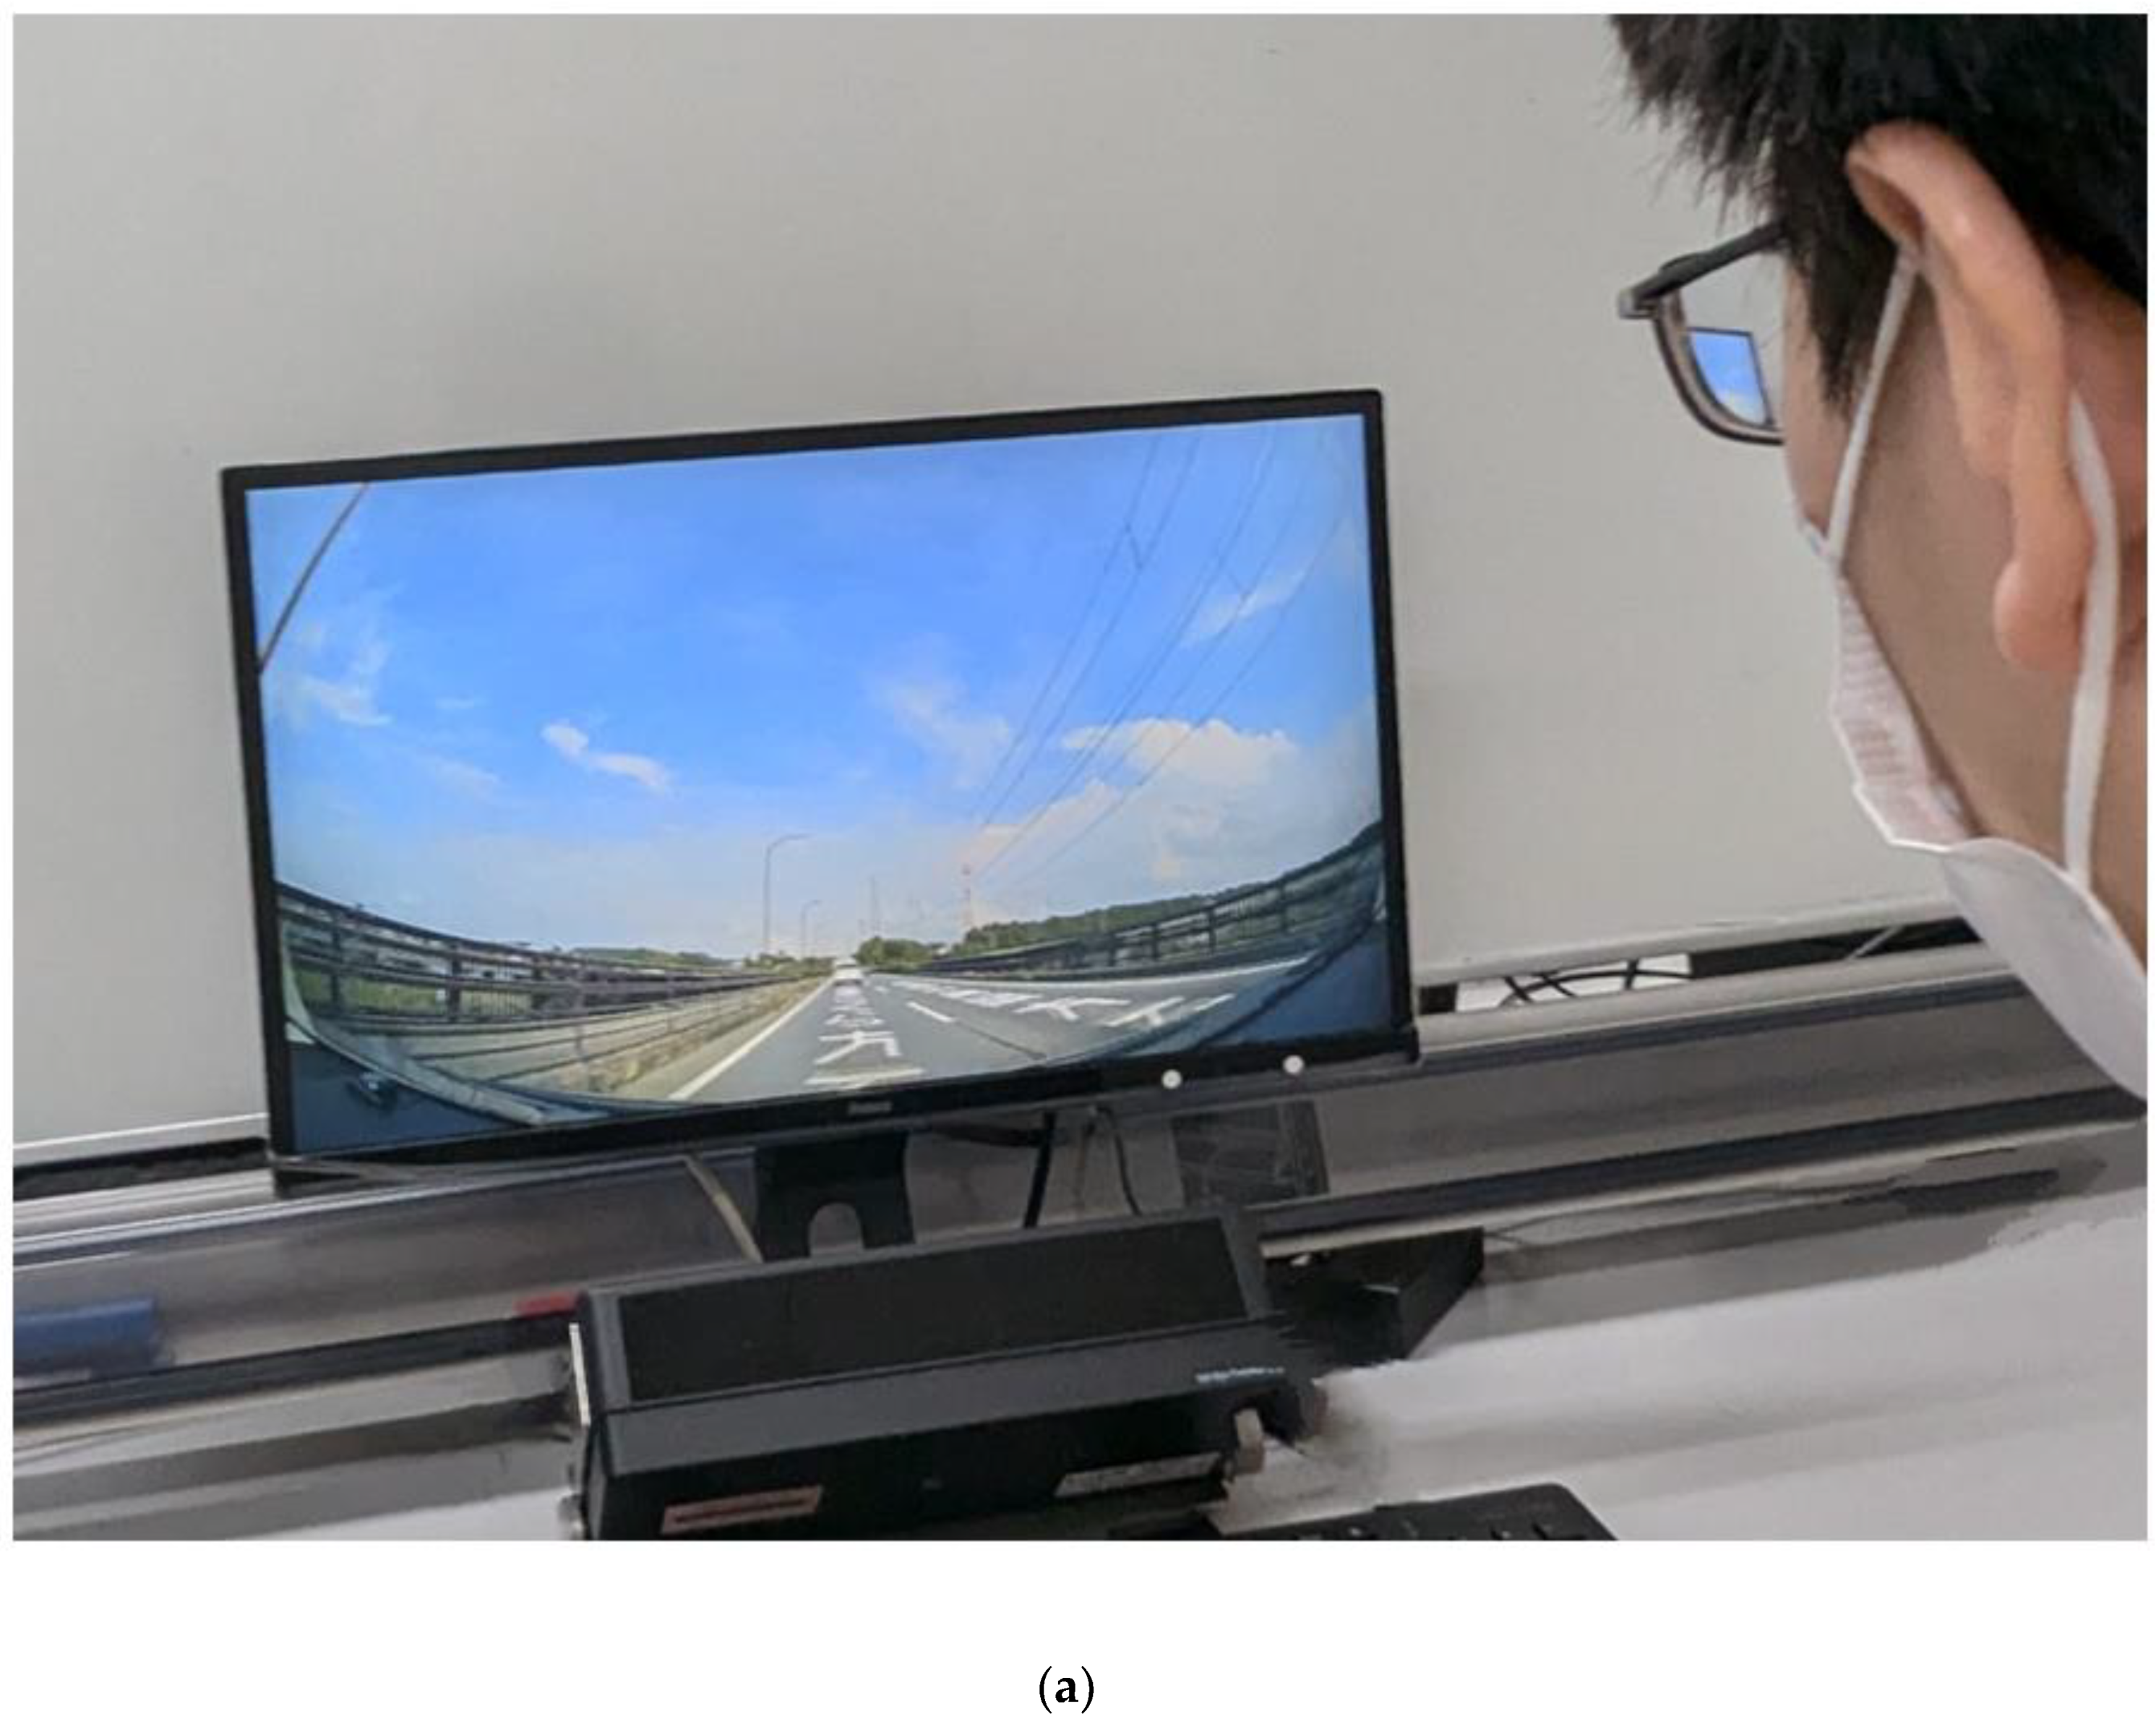
Participants were seated 57 cm from the monitor, and a five-point calibration was conducted prior to data collection. The participants were instructed to watch the road marking videos as if they were driving [5]. Each trial began with a 7-s explanatory text, followed by a 3-s fixation cross and then a 7-s on-board movie. The eye tracker recorded both the fixation duration and number of fixations. This sequence was repeated for each movie, with recalibration performed before each set. The data collection procedure is illustrated in Figure 2.
2.7. Statistical Analysis
Analysis 1: Fixation behavior before, during, and after visual recognition of road markings Repeated-measures ANOVAs were conducted on the means and standard deviations of the fixation points (x- and y-coordinates) to examine the fixation behavior before, during, and after the recognition of road markings, as well as to compare digit-based and letter-based markings. The analysis followed a 2 (type of road marking: digits vs. letters) × 3 (time: before, during, and after recognition) design, resulting in four separate analyses.
Because the “after” period was less than 1 s across all movies (mean: 0.82 s for digits and 0.63 s for letters), a consistent post-recognition window could not be uniformly applied. The mean fixation position was used as an index of the fixation location, while the standard deviation served as an index of the fixation dispersion. When no significant interaction was observed, the main effects for the marking type and time were examined separately. Bonferroni corrections were applied for multiple comparisons, and the Greenhouse–Geisser correction was used when the assumption of sphericity was violated.
Analysis 2: Fixation behavior during visual recognition time
The fixation data were divided into the first, middle, and final thirds of the visual recognition period to assess changes in fixation behavior during visual recognition and to examine differences between digit and letter road markings. A 2 (type: digits vs. letters) × 3 (time: first, middle, and final third) repeated-measures ANOVA was conducted on the means and standard deviations of the fixation points (x- and y-coordinates), resulting in four analyses. The mean duration of each segment was 327.25 ± 44.13 ms (range: 184.6–441.85 ms) for digits and 440.21 ± 121.89 ms (range: 149.01–584.33 ms) for letters. The mean fixation values were used to indicate the fixation position, whereas the standard deviations were used to assess the fixation dispersion. The main effects were analyzed when interactions were not significant.
Analysis 3: Relationship between driving speed, number of letters, and fixation behavior
Pearson’s correlation coefficients were used to examine the relationships between the fixation duration and number of fixations during visual recognition, and either the driving speed (for digit markings) or number of letters (for letter markings), as the driving speed was defined based on the visual recognition time.
Analysis 4: Relationship between fixation behavior, cognitive functions, and basic demographics Pearson’s correlation coefficients were calculated between the fixation duration and number of fixations, and the age, driving history, education, and cognitive function measures (attention and processing speed [TMT-J A and B], verbal and visual memory [WMS-R], planning ability [Zoo Map Test], and UFOV) of the participants to explore the influence of cognitive functions and basic demographics on fixation behavior. Spearman’s rank correlation was used for the Zoo Map Test owing to limited score variability. Analyses were conducted separately for the digit and letter road markings.
All statistical analyses were performed using EZR version 1.61 [34], with the significance level set to p < 0.05.
3. Results
The results from 20 participants (eight males and 12 females) were analyzed. The mean age was 36.7 ± 13.8 years (range: 21–59), the mean driving history was 16.6 ± 14.5 years (range: 0–40), and the mean educational history was 15.4 ± 1.8 years (range: 12–20). The cognitive function results are shown in Table 3. All variables satisfied normality assumptions (the Kolmogorov–Smirnov test).
Table 3.
Details of the cognitive functions of participants.
| Assessment measures | Score (mean ± standard deviation (range)) |
| TMT-J A (seconds) | 33.35 ± 11.88 (22.61–69.15) |
| TMT-J B (seconds) | 64.88 ± 48.08 (29.1–260) |
| WMS-R verbal memory | 23.05 ± 5.11 (10–30) |
| WMS-R visual memory | 37.35 ± 4.26 (27–41) |
| BADS Zoo Map Test | 15.5 ± 0.67 (14–16) |
| UFOV | 50 ± 2.95 (43–56) |
3.1. Fixation Behavior Before, During, and After Visual Recognition of Road Markings
No significant interaction was observed between the road marking type and time for either the fixation position or dispersion. A main effect of time was observed for the y-coordinate of the fixation position (F = 58.948, p < 0.001), with fixation points that were significantly higher during recognition compared with both before and after recognition (both p < 0.001). No main effect of time was found for the x-coordinate.
A main effect of time was observed for the x-coordinate of the fixation dispersion (F = 6.509, p = 0.01). Multiple comparisons revealed significantly reduced horizontal dispersion during recognition compared with both before (p = 0.03) and after (p < 0.001), suggesting more focused visual attention. No significant main effects of the road marking type or interactions were observed. The Greenhouse–Geisser correction was applied where necessary (see Table 4a for fixation position and Table 4b for fixation dispersion).
Table 4a.
Comparison of coordinates of road markings for fixation before, during, and after visual recognition.
Table 4a.
Comparison of coordinates of road markings for fixation before, during, and after visual recognition.
| Digit road markings | Letter road markings | Main effects | Interaction | ||||||
| Before 1 s | During | After | Before 1 s | During | After | Type | Time | ||
| x-coordinate | 900 | 915 | 907 | 919 | 919 | 916 |
F = 1.703 P = 0.21 |
F = 0.758 P = 0.477 |
F = 0.818 P = 0.45 |
| y-coordinate | 889 | 915 | 870 | 894 | 929 | 867 |
F = 1.016 P = 0.328 |
F = 58.948 P < 0.001 |
F = 1.397 P = 0.262 |
Table 4b.
Comparison of means of standard deviations of road markings for fixation before, during, and after visual recognition.
Table 4b.
Comparison of means of standard deviations of road markings for fixation before, during, and after visual recognition.
| Digit road markings | Letter road markings | Main effects | Interaction | ||||||
| Before 1 s | During | After | Before 1 s | During | After | Type | Time | ||
| x-coordinate | 50.44 | 27.56 | 51.14 | 51.67 | 26.79 | 48.38 |
F = 0.014 P = 0.908 |
F = 6.509 P = 0.01 |
F = 0.036 P = 0.926 |
| y-coordinate | 41.26 | 49.90 | 50.77 | 53.79 | 46.15 | 46.85 |
F = 0.074 P = 0.789 |
F = 0.026 P = 0.974 |
F = 1.38 P = 0.266 |
NOTE: Bolded sections indicate significant differences. The main effect of “Type” is the value when comparing types of road markings, that of “Time” is the value when comparing time axes, and “Interaction” means the interaction between “Type” and “Time.”.
3.2. Fixation Behavior During Visual Recognition Time
No significant interaction was observed between the road marking type and time for the fixation position or dispersion. However, main effects of both the type and time were observed for the y-coordinate of the fixation position. Participants fixated higher on letter markings than on digit markings (F = 7.507, p = 0.015), and the fixation height increased over time, with significantly higher fixations in the middle and final thirds compared with the first third (first vs. middle: p < 0.001; first vs. final: p = 0.028). A main effect of the time was observed for the x-coordinate of the fixation dispersion (F = 4.053, p = 0.034), with reduced horizontal dispersion in the final third compared with the first third (p = 0.034), suggesting increased visual focus towards the end of recognition. No other significant effects were observed. The Greenhouse–Geisser correction was applied where appropriate (see Tables 5a for fixation position and 5b for fixation dispersion).
Table 5a.
Comparison of coordinates of road markings in fixation during visual recognition time.
| Digit road markings | Letter road markings | Main effects | Interaction | |||||||
| First third | Middle third | Final third | First third | Middle third | Final third | Type | Time | |||
| x-coordinate | 912 | 917 | 917 | 917 | 918 | 921 |
F = 0.349 P = 0.563 |
F = 2.694 P = 0.668 |
F = 8.009 P = 0.012 |
|
| y-coordinate | 906 | 920 | 919 | 923 | 930 | 934 |
F = 8.009 P = 0.012 |
F = 7.806 P = 0.007 |
F = 0.616 P = 0.485 |
|
Table 5b.
Comparison of means of standard deviations of fixation points on road markings during the visual recognition time.
Table 5b.
Comparison of means of standard deviations of fixation points on road markings during the visual recognition time.
| Digit road markings | Letter road markings | Main effects | Interaction | ||||||
| First third | Middle third | Final third | First third | Middle third | Final third | Type | Time | ||
| x-coordinate | 39.63 | 25.71 | 17.75 | 32.06 | 24.95 | 23.35 |
F = 0.018 P = 0.895 |
F = 3.877 P = 0.031 |
F = 0.683 P = 0.512 |
| y-coordinate | 47.33 | 41.69 | 60.69 | 46.87 | 45.87 | 45.71 |
F = 0.277 P = 0.606 |
F = 0.574 P = 0.445 |
F = 0.574 P = 0.423 |
NOTE: Bolded sections indicate significant differences. The main effect of “Type” is the value when comparing types of road markings, that of “Time” is the value when comparing time axes, and “Interaction” means the interaction between “Type” and “Time.”
3.3. Relationship Between Driving Speed, Number of Letters, and Fixation Behavior
A significant positive correlation was observed between the fixation duration and visual recognition time for digit markings (r = 0.719, p = 0.029), indicating that longer recognition times were associated with longer fixations. No significant correlation was found for the number of fixations (Table 6a). A significant positive correlation was observed between the number of letters and the fixation duration (r = 0.911, p < 0.001), suggesting that longer texts required more sustained visual attention. No significant correlation was found for the number of fixations (Table 6b).
Table 6a.
Correlations between fixation and visual recognition time in recognizing digit road markings.
Table 6a.
Correlations between fixation and visual recognition time in recognizing digit road markings.
| Digit road markings | |
| Correlation between fixation duration and visual recognition time |
r= 0.719 P = 0.029 |
| Correlation between number of fixations and visual recognition time |
r = -0.25 P = 0.517 |
Table 6b.
Correlations between fixation and number of stimuli in recognizing letter road markings.
| Letter road markings | |
| Correlation between fixation duration and number of stimuli |
r= 0.911 P < 0.001 |
| Correlation between number of fixations and number of stimuli |
r = 0.059 P = 0.881 |
3.4. Relationship Between Fixation Behavior, Cognitive Functions, and Basic Demographics
No significant correlations were found between the fixation behavior (fixation duration and number of fixations) and cognitive functions or basic demographic variables for either the digit or letter markings. Spearman’s rank correlation for the Zoo Map Test also revealed no significant associations (Tables 7a for digit road markings and 7b for letter road markings).
Table 7a.
Correlation between basic demographics, cognitive functions necessary for driving, and fixation metrics of digit road markings.
Table 7a.
Correlation between basic demographics, cognitive functions necessary for driving, and fixation metrics of digit road markings.
| Age | Driving history | Education | TMT-J A | TMT-J B | WMS-R verbal memory | WMS-R visual memory | Zoo Map Test | UFOV score | |
| Fixation duration |
r = 0.122 P = 0.608 |
r = 0.106 P = 0.657 |
r = -0.239 P = 0.31 |
r = 0.055 P = 0.818 |
r = 0.119 P = 0.617 |
r = -0.309 P = 0.185 |
r = -0.314 P = 0.178 |
r = -0.383 P = 0.096 |
r = 0.027 P = 0.911 |
| Number of fixations |
r = 0.005 P = 0.984 |
r = 0.016 P = 0.948 |
r = 0.361 P = 0.118 |
r = -0.053 P = 0.825 |
r = -0.086 P = 0.719 |
r = 0.098 P = 0.681 |
r = 0.254 P = 0.28 |
r = 0.307 P = 0.188 |
r = -0.255 P = 0.278 |
Table 7b.
Correlation between basic demographics, cognitive functions necessary for driving, and fixation metrics of letter road markings.
Table 7b.
Correlation between basic demographics, cognitive functions necessary for driving, and fixation metrics of letter road markings.
| Age | Driving history | Education | TMT-J A | TMT-J B | WMS-R verbal memory | WMS-R visual memory | Zoo Map Test | UFOV score | |
| Fixation duration |
r = -0.292 P = 0.212 |
r = -0.302 P = 0.195 |
r = -0.241 P = 0.306 |
r = 0.183 P = 0.439 |
r = 0.29 P = 0.215 |
r = -0.094 P = 0.693 |
r = -0.165 P = 0.488 |
r = -0.18 P = 0.448 |
r = -0.071 P = 0.766 |
| Number of fixations |
r = 0.231 P = 0.326 |
r = 0.246 P = 0.296 |
r = 0.301 P = 0.198 |
r = -0.127 P = 0.592 |
r = -0.201 P = 0.397 |
r = -0.035 P = 0.883 |
r = 0.053 P = 0.824 |
r = 0.203 P = 0.391 |
r = 0.05 P = 0.834 |
4. Discussion
This study analyzed fixation behavior in response to road markings. The results revealed that: (1) there were no significant differences between digit and letter markings (type); (2) participants primarily recognized road markings during the latter phase of the visual recognition period; and (3) the fixation behavior was influenced by the driving speed and number of letters.
4.1. Fixation Behavior of Road Markings (Digits and Letters) Regardless of the Difference Between the Types
The analysis of the fixation behavior showed that fixations were more horizontally dispersed before and after visual recognition, whereas they were more vertically aligned, with reduced horizontal dispersion, during recognition. This suggests that while drivers temporarily focus their attention on the target when viewing road markings, they tend to distribute their fixations more broadly at other times to monitor their surroundings for safety (e.g., checking for vehicles or pedestrians) [35,36]. In addition, the central placement of road markings within the driver field of vision likely allows for simultaneous peripheral monitoring, thereby supporting situational awareness.
The similarity in eye movement patterns and fixation focus when recognizing digit and letter markings may be attributed to the use of high-brightness, high-chroma colors (e.g., white and yellow) [37]. These visual characteristics likely enhanced the visibility and contributed to the lack of significant differences in visual recognition between the two marking types.
4.2. Fixation Behavior of Road Markings over Time During Recognition
The analysis of the three visual recognition times showed that the fixation positions moved vertically during the latter phase of recognition and that the horizontal dispersion decreased. That is, we observed a process of gradually focusing the fixation on the markings over time. This is consistent with the “two-stage model” of visual information processing: locating the target in the initial stage, followed by focusing on that target in the second stage [38,39,40]. The mean recognition times for the three segments in this study (digits: 327 ms; letters: 449 ms) align with the processing time described in this model, suggesting a recognition process that starts with identifying the target location and then shifts to focused attention.
Participants also fixated on letter markings at a higher position than digit markings throughout the recognition period, likely because the letter markings were longer and contained more information. The letter markings ranged from four to nine characters and required more detailed visual recognition, whereas the digit markings consisted of only two digits.
4.3. Effects of Driving Speed and Amount of Information on Fixation Behavior
Furthermore, the results suggest that the driving speed and amount of information contained in the markings influence fixation behavior, particularly the fixation duration. Specifically, the longer the viewing time for digit markings, the longer the fixation duration. A greater number of letters (i.e., more information) was associated with longer fixation durations. This is consistent with previous studies that showed that faster driving speeds are linked to shorter fixation durations [41]. Furthermore, words with more letters require more complex visual processing, resulting in longer fixation durations [42,43], and the same tendency was observed in this study. These findings indicate that both the driving speed and amount of information in the markings should be considered when designing road markings. In particular, short and simple markings are likely to be more recognizable at higher speeds, whereas slightly more detailed markings may be effective in lower-speed situations.
4.4. Effects of Cognitive Functions and Basic Demographics on Road Marking Recognition
The results showed that neither the cognitive functions nor the basic demographics of the drivers were correlated with the recognition of road markings. This suggests that road markings can be recognized by drivers without requiring extensive driving experience or significant cognitive effort. One possible explanation is that all road markings in this study were presented on straight roads, which are known to impose lower cognitive demands [44]. In addition, the font size of the digit and letter road markings is large: 5000 mm in height and 1200 mm in width for digits, and 2400 mm in height and 800 mm in width for letters [11]. This means that they are easily recognizable even from a distance. These factors may have contributed to the ease of road marking recognition, regardless of the cognitive functions or basic demographics of the drivers.
4.5. Limitations
This study has several limitations. First, the stimuli used were on-board movies as opposed to real-world driving situations. As a result, factors that influence fixation behavior during actual driving, such as speedometers, mirrors, and in-vehicle visual fields [45], were not replicated. Therefore, this study should be regarded as a preliminary investigation. Future studies should examine fixation behavior under more realistic driving conditions.
Second, although the sample size was determined a priori using G*Power and data were collected from a comparable number of participants, the statistical power may have been insufficient to detect moderate or small effects. This limitation suggests that some meaningful relationships may have remained undetected. Therefore, future studies with larger sample sizes are warranted.
Third, the non-significant correlation between fixation behavior during road marking recognition and the cognitive functions or basic demographics of participants may indicate that the cognitive demands of the task were low, possibly because the markings were presented on straight roads. Yet this possibility could not be tested, as the cognitive load was not quantitatively assessed using tools such as the NASA-TLX [46]. This limitation reduces the interpretability of the findings. Future studies should incorporate quantitative assessments of the cognitive load in road marking recognition and other driving-related tasks.
Finally, although the road markings employed in this study included visual messages such as “Slow Down,” which is intended to encourage deceleration, their specific effects on fixation behavior were not assessed. Previous research has indicated that such markings may induce changes in pupil diameter [47], which suggests that they could influence visual attention through emotional or salience-based mechanisms. Therefore, future studies should distinguish between deceleration messages and neutral markings, and conduct comparative analyses to understand their differential impact on fixation behavior more effectively.
5. Conclusions
The results of this study indicate that drivers exhibit sequential visual behavior when recognizing road markings. During the early phase of visual recognition, they broadly scan both the markings and their surroundings, whereas in the latter phase, they focus more intently on the markings themselves. Marking design should align with the natural progression of visual attention based on this fixation pattern. When multiple pieces of information are included, simple keywords and symbols should be placed at the center or lower part of the markings for initial recognition, while detailed instructions should be positioned at the top, allowing drivers to process them as their fixation shifts and concentration increases.
As fixations tend to move slightly upwards during recognition, particularly critical information in letter markings (e.g., “STOP” or “CAUTION: INTERSECTION”) should be placed higher to guide the fixation naturally. Conversely, supplementary information (e.g., distance indications or explanatory text) should be positioned lower to align with eye movement patterns.
Author Contributions
Conceptualization, T.M. and H.O.; methodology, T.M. and H.O.; software, T.M. and H.O.; validation, T.M. and H.O.; formal analysis, T.M.; investigation, T.M. and H.O.; resources, T.M., H.O. and D.S.; data curation, T.M.; writing—original draft preparation, T.M. and H.O.; writing—review and editing, H.O.; visualization, T.M.; supervision, H.O. and D.S.; project administration, T.M., H.O. and D.S. All authors have read and agreed to the published version of the manuscript.
Funding
This research received no external funding.
Institutional Review Board Statement
The study was conducted in accordance with the Declaration of Helsinki, and approved by the Ethics Review Committee of the Graduate School of Health Sciences, Hokkaido University.
Informed Consent Statement
Written informed consent has been obtained from the participants to publish this paper.
Data Availability Statement
The datasets generated and analyzed during this study are not publicly available due to the inclusion of personally identifiable information. However, they may be made available from the corresponding author, Hiroki Okada (e-mail: h-okada@pop.med.hokudai.ac.jp) upon reasonable request and subject to ethical approval.
Acknowledgments
The authors sincerely thank all individuals who contributed to the data collection process and provided valuable support during the study.
Conflicts of Interest
The authors declare no conflicts of interest.
References
- Lipskaya-Velikovsky, L.; Kotler, M.; Weiss, P.; Kaspi, M.; Gamzo, S.; Ratzon, N. Car Driving in Schizophrenia: Can Visual Memory and Organization Make a Difference? Disabil. Rehabil. 2013, 35, 1734–1739. [Google Scholar] [CrossRef] [PubMed]
- Bottari, C.; Lamothe, M.P.; Gosselin, N.; Gélinas, I.; Ptito, A. Driving Difficulties and Adaptive Strategies: The Perception of Individuals Having Sustained a Mild Traumatic Brain Injury. Rehabil. Res. Pract. 2012, 2012. [Google Scholar] [CrossRef] [PubMed]
- Patterson, L.; Mullen, N.; Stinchcombe, A.; Weaver, B.; Bédard, M. Measuring the Impact of Driving Status: The Centre for Research on Safe Driving–Impact of Driving Status on Quality of Life (CRSD-IDSQOL) Tool. Can. J. Occup. Ther. 2019, 86, 30–39. [Google Scholar] [CrossRef]
- Mackenzie, A.K.; Harris, J.M. A Link Between Attentional Function, Effective Eye Movements, and Driving Ability. J. Exp. Psychol. Hum. Percept. Perform. 2017. [Google Scholar] [CrossRef]
- Huang, L.; Bian, Y.; Zhao, X.; Xu, Y.; Rong, J. Quantitatively Exploring the Relationship Between Eye Movement and Driving Behavior Under the Effect of Different Complex Diagrammatic Guide Signs. Cogn. Technol. Work 2020, 22, 373–388. [Google Scholar] [CrossRef]
- Maeyama, T. (Graduate School of Health Sciences, Hokkaido University); Okada, H. (Department of Rehabilitation Sciences, Hokkaido University); & Sawamura, D. (Department of Rehabilitation Sciences, Hokkaido University). (Manuscript submitted for publication). Characteristics of eye movements and correlation to cognitive functions in relation to the location of guide signs and driving speed. [CrossRef]
- Miyoshi, T.; Nakayasu, H. Analysis of Relationship Between Characteristics of Driver's Eye Movements and Visual Scene in Driving Events. In Proceedings of the 2011 IEEE International Conference on Fuzzy Systems (FUZZ-IEEE 2011); IEEE, 2011; pp. 2720–2727. [Google Scholar] [CrossRef]
- Babić, D.; Babić, D.; Cajner, H.; Sruk, A.; Fiolić, M. Effect of Road Markings and Traffic Signs Presence on Young Driver Stress Level, Eye Movement and Behaviour in Night-Time Conditions: A Driving Simulator Study. Safety 2020, 6. [Google Scholar] [CrossRef]
- Greenhalgh, J.; Mirmehdi, M. Detection and Recognition of Painted Road Surface Markings. In Proceedings of the International Conference on Pattern Recognition Applications and Methods (ICPRAM); 2015; 1; 130–138. [Google Scholar] [CrossRef]
- Marciano, H. The Effect of Lane Direction Pavement Markings on Driving Performance and Safety: A Driving Simulator Study. Hum. Factors 2024, 66, 562–573. [Google Scholar] [CrossRef]
- Nagami, Y.; Wu, B.; Furubayashi, T. Measurement Experiments on Recognition and Legibility Distance of Road Character Markings. J. Traffic Eng. 2023, 9, A_376–A_385. [Google Scholar] [CrossRef]
- Babić, D.; Brijs, T. Low-Cost Road Marking Measures for Increasing Safety in Horizontal Curves: A Driving Simulator Study. Accid. Anal. Prev. 2021, 153, 106013. [Google Scholar] [CrossRef]
- Garach, L.; Calvo, F.; De Oña, J. The Effect of Widening Longitudinal Road Markings on Driving Speed Perception. Transp. Res. Part F Traffic Psychol. Behav. 2022, 88, 141–154. [Google Scholar] [CrossRef]
- Havránek, P.; Zůvala, R.; Špaňhel, J.; Herout, A.; Valentová, V.; Ambros, J. How Does Road Marking in Horizontal Curves Influence Driving Behaviour? Eur. Transp. Res. Rev. 2020, 12, 1–11. [Google Scholar] [CrossRef]
- Cai, J.; Zeng, D.; Guo, F.; Zhang, R.; Li, G.; Wang, C. How Do Design Factors of Stacked Directional Signs Affect Their Visual Cognition? Transp. Res. Part F Traffic Psychol. Behav. 2024, 107, 760–774. [Google Scholar] [CrossRef]
- Feng, J.; Deng, Y.; Lau, M.Y.; Cauffman, S.J.; Johnson, E.; Cunningham, C.; Kaber, D.B. Age Differences in Driver Visual Behavior and Vehicle Control When Driving with In-Vehicle and On-Road Deliveries of Service Logo Signs. Int. J. Ind. Ergon. 2023, 93, 103386. [Google Scholar] [CrossRef]
- Faul, F.; Erdfelder, E.; Lang, A.G.; Buchner, A. G*Power 3: A Flexible Statistical Power Analysis Program for the Social, Behavioral, and Biomedical Sciences. Behav. Res. Methods 2007, 39, 175–191. [Google Scholar] [CrossRef] [PubMed]
- Greenhalgh, J.; Mirmehdi, M. Detection and Recognition of Painted Road Surface Markings. In Proc. ICPRAM 2015, 1, 130–138. [Google Scholar] [CrossRef]
- Nygårdhs, S.; Nilsson, G. Legibility of Road Marking Symbols in the Roadway. Statens Väg-och Transportforskningsinstitut 2015.
- Fiolić, M.; Babić, D.; Babić, D.; Tomasović, S. Effect of Road Markings and Road Signs Quality on Driving Behaviour, Driver’s Gaze Patterns and Driver’s Cognitive Load at Night-Time. Transp. Res. Part F Traffic Psychol. Behav. 2023, 99, 306–318. [Google Scholar] [CrossRef]
- Pashkevich, A.; Burghardt, T.E.; Shubenkova, K.; Makarova, I. Analysis of Drivers’ Eye Movements to Observe Horizontal Road Markings Ahead of Intersections. In Conf. Vision Zero for Sustainable Road Safety in Baltic Sea Region; Springer Int. Publ.: Cham, 2018; pp. 1–10. [Google Scholar] [CrossRef]
- Schmidtke, N.J. Schmidtke, N.J. A comparison between the responsiveness of selected physiological and subjective mental workload indicators during real-world driving scenarios. Master's thesis, Rhodes University, Grahamstown, 2019.
- Shinohara, Y.; Nishizaki, Y. Effects of Driving Situation and Driving Experience on Eye Movements. Inf. Eng. Express 2017, 3, 31–40. [Google Scholar] [CrossRef]
- Babić, D.; Babić, D.; Cajner, H.; Sruk, A.; Fiolić, M. Effect of Road Markings and Traffic Signs Presence on Young Driver Stress Level, Eye Movement and Behaviour in Night-Time Conditions: A Driving Simulator Study. Safety 2020, 6. [Google Scholar] [CrossRef]
- Olsen, A. The Tobii I-VT Fixation Filter. Tobii Technology 2012, 21(4–19), 5.
- Ishiai, S.; Umeda, S.; Funayama, M. Trail Making Test, Japanese Edition (TMT-J); Shinkoh Igaku Shuppan Co., Ltd.: Tokyo, 2019. [Google Scholar]
- Wechsler, D. WMS-R: Wechsler Memory Scale–Revised: Manual; Psychological Corporation: San Antonio, TX, 1987. [Google Scholar]
- Wilson, B.A.; Evans, J.J.; Alderman, N.; Burgess, P.W.; Emslie, H. Behavioural Assessment of the Dysexecutive Syndrome. In Methodology of Frontal and Executive Function; Routledge: New York, 2004; pp. 240–251. [Google Scholar]
- Nicholls, V.I.; Wiener, J.; Meso, A.I.; Miellet, S. The Impact of Perceptual Complexity on Road Crossing Decisions in Younger and Older Adults. Sci. Rep. 2024, 14. [Google Scholar] [CrossRef]
- Nihei, M.; Nagao, T.; Takagi, K.; Hayasaka, R.; Tamai, A.; Nakagawa, H.; Nagami, Y.; Shiota, Y.; Kamata, M. An Analysis of Factors Affecting Wrong-Way Driving at a Highway Entrance Using a Driving Simulator Among Older Drivers with Cognitive Decline. Transp. Res. Part F Traffic Psychol. Behav. 2022, 91, 58–72. [Google Scholar] [CrossRef]
- Eramudugolla, R.; Kiely, K.M.; Chopra, S.; Anstey, K.J. Effect of Speed of Processing Training on Older Driver Screening Measures. Front. Aging Neurosci. 2017, 9, 338. [Google Scholar] [CrossRef]
- Hardcastle, C.; Hausman, H.K.; Kraft, J.N.; Albizu, A.; Evangelista, N.D.; Boutzoukas, E.M.; O’Shea, A.; Langer, K.; Van Etten, E.V.; Bharadwaj, P.K.; Song, H.; Smith, S.G.; Porges, E.; DeKosky, S.T.; Hishaw, G.A.; Wu, S.S.; Marsiske, M.; Cohen, R.; Alexander, G.E.; Woods, A.J. Higher-Order Resting State Network Association with the Useful Field of View Task in Older Adults. GeroScience 2022, 44, 131–145. [Google Scholar] [CrossRef] [PubMed]
- Hudak, E.M.; Bell, K.L.; Hall, C.; Grismore, L.D.; LaVere, J.; Edwards, J.D. Dynamic Useful Field of View Training to Enhance Older Adults’ Cognitive and Motor Function: A Pilot Study. J. Cogn. Enhanc. 2021, 5, 411–419. [Google Scholar] [CrossRef] [PubMed]
- Kanda, Y. Investigation of the Freely Available Easy-to-Use Software ‘EZR’ for Medical Statistics. Bone Marrow Transplant. 2013, 48, 452–458. [Google Scholar] [CrossRef]
- Chapman, P.; Underwood, G.; Roberts, K. Visual Search Patterns in Trained and Untrained Novice Drivers. Transp. Res. Part F Traffic Psychol. Behav. 2002, 5, 157–167. [Google Scholar] [CrossRef]
- Underwood, G.; Chapman, P.; Bowden, K.; Crundall, D. Visual Search While Driving: Skill and Awareness During Inspection of the Scene. Transp. Res. Part F Traffic Psychol. Behav. 2002, 5, 87–97. [Google Scholar] [CrossRef]
- Takahashi, H.; Itoh, M. A Driving Simulation Study on Visual Cue Presented in the Peripheral Visual Field for Prompting Driver’s Attention. J. Robot. Mechatron. 2019, 31, 274–288. [Google Scholar] [CrossRef]
- Hoffman, J.E. Stages of Processing in Visual Search and Attention. In Stratification in Cognition and Consciousness; John Benjamins Publishing Company, 1999; pp. 43–72. [CrossRef]
- Pomplun, M. Analysis and Models of Eye Movements in Comparative Visual Search; Cuvillier: Göttingen, Germany, 1998. [Google Scholar]
- Velichkovsky, B.M.; Rothert, A.; Miniotas, D.; Dornhofer, S.M.; Joos, M.; Pannasch, S. Visual Fixations as a Rapid Indicator of Hazard Perception. NATO Sci. Ser. I Life Behav. Sci. 2003, 355, 313–322. [Google Scholar]
- Buzon, L.G.; Figueira, A.C.; Larocca, A.P.C.; Oliveira, P.T.M. Effect of Speed on Driver’s Visual Attention: A Study Using a Driving Simulator. Transp. Dev. Econ. 2021, 8, 1–11. [Google Scholar] [CrossRef]
- Hautala, J.; Hyönä, J.; Aro, M. Dissociating Spatial and Letter-Based Word Length Effects Observed in Readers’ Eye Movement Patterns. Vision Res. 2011, 51, 1719–1727. [Google Scholar] [CrossRef]
- McDonald, S.A. Effects of Number-of-Letters on Eye Movements During Reading Are Independent from Effects of Spatial Word Length. Vis. Cogn. 2006, 13, 89–98. [Google Scholar] [CrossRef]
- Nagy, V.; Kovács, G.; Földesi, P.; Kurhan, D.; Sysyn, M.; Szalai, S.; Fischer, S. Testing Road Vehicle User Interfaces Concerning the Driver’s Cognitive Load. Infrastructures 2023, 8. [Google Scholar] [CrossRef]
- Mackenzie, A.K.; Harris, J.M. Characterizing Visual Attention During Driving and Non-Driving Hazard Perception Tasks in a Simulated Environment. In Proc. Symp. Eye Track. Res. Appl. 2014; pp. 127–130. [CrossRef]
- Hart, S.G.; Staveland, L.E. Development of NASA-TLX (Task Load Index): Results of Empirical and Theoretical Research. In Advances in Psychology; Hancock, P.A., Meshkati, N., Eds.; North-Holland: Amsterdam, Netherlands, 1988; Vol. 52, pp. 139–183. [CrossRef]
- Yang, Y.; Easa, S.M.; Zheng, X.; Hu, A.; Liu, F.; Chen, M. Evaluation Effects of Two Types of Freeway Deceleration Markings in China. PLoS One 2019, 14. [Google Scholar] [CrossRef]
Figure 1.
Examples of road markings in the movie. (a) Digital road markings; “50” is written in yellow letters on the road surface. (b) Letter road markings; “Beware of rear-end collision” is written in Japanese vertically in white letters on the road.
Figure 1.
Examples of road markings in the movie. (a) Digital road markings; “50” is written in yellow letters on the road surface. (b) Letter road markings; “Beware of rear-end collision” is written in Japanese vertically in white letters on the road.
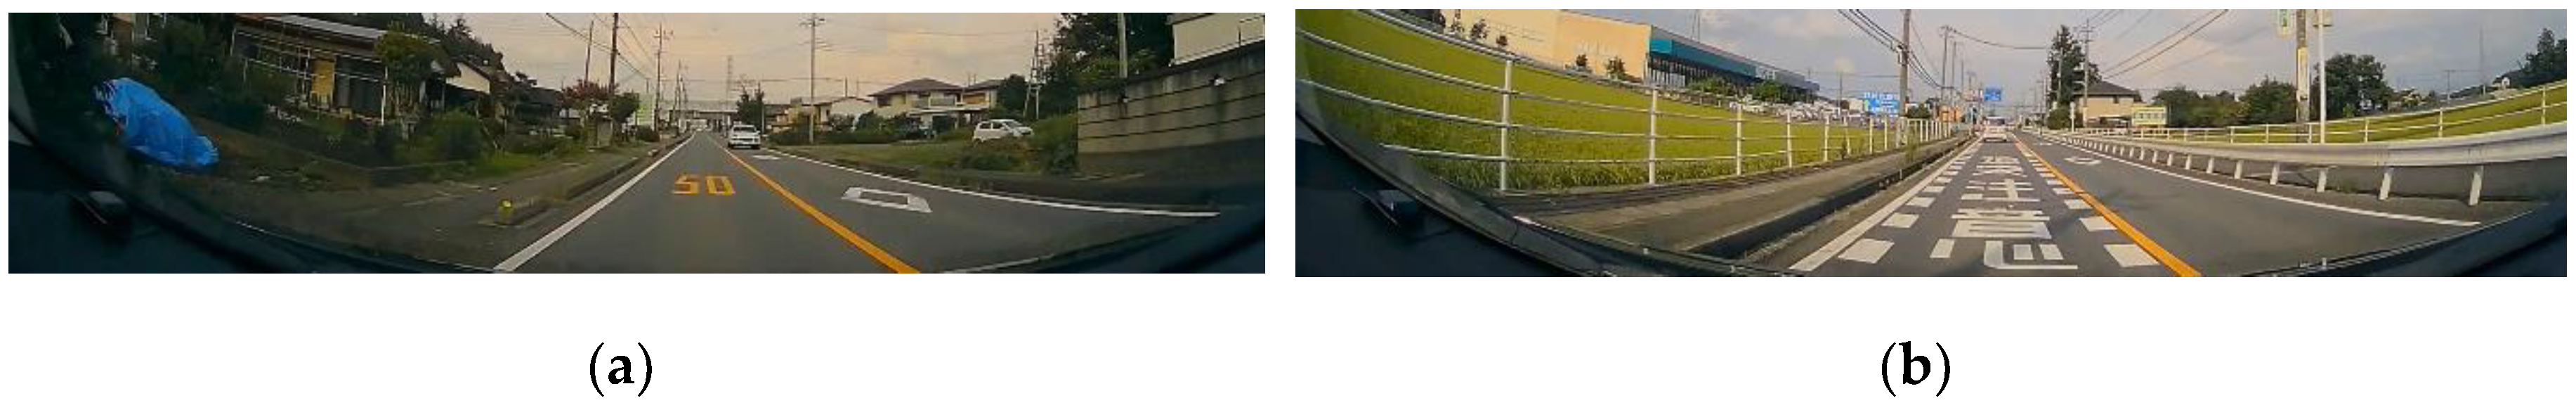
Figure 2.
Data collection environment and flow. (a) The actual data collection environment. (b) The schematic of the data collection flow. This flow is repeated nine times in one movie condition.
Figure 2.
Data collection environment and flow. (a) The actual data collection environment. (b) The schematic of the data collection flow. This flow is repeated nine times in one movie condition.
Disclaimer/Publisher’s Note: The statements, opinions and data contained in all publications are solely those of the individual author(s) and contributor(s) and not of MDPI and/or the editor(s). MDPI and/or the editor(s) disclaim responsibility for any injury to people or property resulting from any ideas, methods, instructions or products referred to in the content. |
© 2025 by the authors. Licensee MDPI, Basel, Switzerland. This article is an open access article distributed under the terms and conditions of the Creative Commons Attribution (CC BY) license (http://creativecommons.org/licenses/by/4.0/).
Copyright: This open access article is published under a Creative Commons CC BY 4.0 license, which permit the free download, distribution, and reuse, provided that the author and preprint are cited in any reuse.


