Submitted:
17 July 2025
Posted:
18 July 2025
You are already at the latest version
Abstract
Efficient delivery of biological material to the central nervous system (CNS) remains a key limitation of conventional gene therapies. Recently, we developed a novel strategy based on a secretable and cell-penetrating TATk-CDKL5 fused protein which enhances the brain biodistribution and the therapeutic efficiency of the gene therapy approach in a mouse model of CDKL5 Deficiency Disorder (CDD). Here, to compare the efficacy of the TATk-CDKL5 gene therapy with a conventional approach in correcting the CDD pathological phenotype, we employed cortical organoids generated from CDD patient-derived iPSCs as a human model of CDD. We found greater therapeutic efficacy of the recombinant TATk-CDKL5 protein compared to the CDKL5 protein alone in improving or ameliorating defects caused by the absence of CDKL5, such as abnormal hyperexcitability evaluated with microelectrode arrays (MEA). Interestingly, CDD cortical organoids exhibited reduced cell proliferation and increased neuronal cell death compared to control cortical organoids; defects that were only restored by the expression of the recombinant TATk-CDKL5 protein. These findings suggest the superior efficiency of a gene therapy based on a cross-correction approach for treating CDD.
Keywords:
gene therapy
; cross-correction
; CDKL5
; CNS disorders
; CDD
; cortical organoids
1. Introduction
CDKL5 Deficiency Disorder (CDD) is a severe neurodevelopmental condition caused by mutations in the CDKL5 gene, which encodes a serine-threonine kinase critical for brain development and function [1,2]. This rare disorder manifests as early-onset epileptic encephalopathy, severe intellectual disability, and impaired motor and visual functions [1,2,3,4,5]. Murine models of CDD, including Cdkl5-knockout (KO) mice, do not fully recapitulate the early-onset epilepsy but do exhibit several neurobehavioral phenotypes reminiscent of the human disease, including motor coordination deficits, hyperactivity, increased autism-like behaviors, and impaired learning and memory [6,7,8,9,10]. These models have been instrumental in characterizing the functions of the CDKL5 protein, revealing its pivotal role in neuronal proliferation, differentiation, and function to ensure proper brain development and the establishment of functional neural circuits [2,11,12,13,14,15,16]. Nevertheless, despite significant progress in understanding its molecular basis, no effective therapies are currently available, underscoring the urgent need for innovative approaches to mitigate the debilitating symptoms of CDD [17].
In the past decade, treatment approaches centered on complementing affected cells with a functional protein or gene copy have emerged as an encouraging therapeutic strategy for genetic pathologies, especially for monogenic disorders [18,19]. Over the past few years, several studies from our group and others have demonstrated that gene and protein replacement therapies are promising strategies to treat CDD at the pre-clinical level [20,21,22,23]. However, efficient delivery of biological material to the central nervous system (CNS) remains a significant challenge when developing effective therapeutic strategies for disorders with widespread neuropathology affecting multiple brain regions [24,25,26]. We have recently developed a novel gene therapy approach based on a secretable, cell-penetrating CDKL5 protein (Igk-TATk-CDKL5) [20]. This therapeutic strategy leverages the ability of the Igk-TATk fusion peptide to enable cellular cross-correction, thereby overcoming the challenges of limited biodistribution and neuronal uptake associated with conventional gene therapy. In a recent preclinical study in Cdkl5-KO mice, we have demonstrated that this innovative approach significantly improved the bioavailability and therapeutic efficacy of the CDKL5 protein in the brain, leading to an amplified rescue of pathological phenotypes [20].
Yet, it is crucial to evaluate the efficacy of this approach in humanized models that more accurately reflect the disease state to further prove the potential of this promising therapy. As a developmental epileptic encephalopathy, the most prominent and presenting feature of CDD is the early onset of seizures. As mentioned before, most Cdkl5-KO mice have shown a lack of spontaneous seizures during early development [27]. Therefore, while murine models have been invaluable for modeling CDD, studying disease mechanisms, and testing therapies, they do not fully replicate the human condition, representing a major limitation.
Advances in stem cell technology have revolutionized disease modeling, offering unprecedented opportunities to study human neurodevelopmental disorders in vitro. Human-induced pluripotent stem cells (iPSCs) can generate three-dimensional (3D) brain organoids that mimic the structural and functional complexity of the human brain [28,29]. These organoids replicate key aspects of normal brain development and recapitulate pathological features observed in patients. Organoids derived from CDD patients display multiple functional and structural derangements underlying CDD neuropathophysiology, including morphological changes and alterations in neuronal connectivity and excitability, thus offering a deeper insight into the disease pathophysiology [30,31]. Remarkably, CDD organoids exhibit neuronal network alterations, including signs of hyperexcitability and increased synchronization, which may be indicative of the epileptic-like activity characteristic of CDD. While these findings require further validation and characterization, they offer a valuable opportunity to explore seizure-related network dysfunction in a human-derived system, potentially overcoming the limitations of murine models that do not replicate early-onset seizures. By recapitulating multiple cellular and network-level alterations observed in patients, CDD organoids offer a 3D in vitro system that bridges the gap between preclinical animal studies and clinical applications, providing an ideal platform to further evaluate the therapeutic potential of novel treatments in a patient-specific context.
Therefore, in this study, we investigated the therapeutic potential of the TATk-CDKL5-based gene therapy in CDD patient-derived cortical organoids. Specifically, we compared the efficacy of the secretable TATk-CDKL5 fusion protein with that of the conventional CDKL5 protein. By leveraging the pathological relevance and human specificity of the organoid model, we aimed to provide compelling evidence for the clinical applicability of a gene therapy approach based on a cross-correction mechanism.
2. Results
To assess the therapeutic efficacy of a gene therapy approach in a human-based in-vitro CDD model, iPSCs generated from CDD patients (harboring a nonsense mutation introducing a stop codon at position 59 of the catalytic domain of CDKL5: c.175C>T; p.R59X) were used to obtain electrophysiologically-active CDD cortical organoids containing differentiated neurons, as previously described [30,32,33]. Sex-matched iPSCs derived from first-degree relatives of the patients were used to generate healthy control organoids.
To optimize transgene expression while maintaining the viability of cortical organoids, we first evaluated the appropriate dose of AAVPHP.B virus. Cortical organoids cultured on glass bottom dishes were infected with three different viral doses (7.2*109, 3.6*1010, 7.2*1010 viral genome (vg)/organoid (org); Figure 1A), guided by prior experiments using the same AAV serotype [36]. One-week post-infection, immunofluorescent staining of whole-mount organoids revealed robust CDKL5 expression predominantly localized to the outer layer of the organoids, with the number of CDKL5-positive cells increasing proportionally to the viral dose (Figure 1B,C). CDKL5-positive cells were present both within rosette-like structures (Figure 1B), in which progenitor cells are more abundant, and throughout the whole organoid tissue, where neurons are the predominant cell type (Supplementary Figure S1A,B), suggesting that multiple neural cell populations, including progenitors and neurons, were successfully transduced. Importantly, organoids subjected to infection, at all viral doses, retained their characteristic rounded morphology, with no signs of necrosis or disaggregation (Figure 1B,E). Quantification of DAPI-positive nuclei with morphological features consistent with cell death revealed no differences between untreated and AAVPHP.B virus-treated organoids (Figure 1D), indicating that neither viral infection nor TATk-CDKL5 expression compromised organoid viability. As expected due to the lack of vascularization, imaging of immunostained organoid sections showed a heterogeneous pattern of transgene expression, with stronger CDKL5 protein detection at the organoid periphery and a lower signal in the core region, consistent with limited viral diffusion, and resulting in partial recovery of CDKL5 expression in only a subset of cells (Figure 1B,E and Supplementary Figure S1A).
Given that high viral doses could lead to excessive infection and potentially mask the efficacy of the cross-correction mechanism, through which recombinant TATk-CDKL5 protein is distributed to non-infected cells, we selected the intermediate viral dose (3.6*1010 vg/org) for subsequent experiments to balance expression efficiency and cross-correction potential.
2.1. Effect of Gene Therapy with Igk-TATk-CDKL5 or CDKL5 Vector on CDKL5 Protein Replacement in CDD Patient-Derived Organoids
Previous findings indicate that increased spike frequency and network hypersynchrony in CDD organoids are confined to early development (12–16 weeks), after which activity gradually converges toward control-like levels [30]. Therefore, to compare the efficacy of a cross-correction gene therapy approach with that of a classical approach, a group of CDD organoids (11 weeks old) were infected with an AAVPHP.B viral vector delivering the genetic material for the expression of either the recombinant Igk-TATk-CDKL5 (CDD+TATk-CDKL5) or the native wild-type protein (CDD+CDKL5) at a dose of 3.6*1010 vg per organoid (Figure 2A). As a control, a group of CDD and healthy organoids were treated with vehicle.
We performed Western blot and immunohistochemical analyses to evaluate the extent of CDKL5 protein recovery in CDD organoids following viral treatment. As expected, CDKL5 was not detectable in CDD patient-derived cortical organoids (Figure 2B,C). Following viral treatment, CDKL5 protein was expressed at the same level as in controls in TATk-CDKL5-treated organoids or even at higher level in CDKL5-treated organoids (Figure 2B,C), suggesting a complete recovery of CDKL5 expression in CDD organoids. However, immunohistochemical analysis of organoid slices revealed again that only a subset of cells expressed the CDKL5 proteins at varying degrees, indicating limited protein replacement through infection (Supplementary Figure S1B).
To assess the molecular effects of CDKL5 protein re-expression, we examined the functional activation of cellular pathways in which CDKL5 is known to play a direct role. The microtubule end-binding protein EB2 is the most well-known direct CDKL5 phosphorylation target [37]. Accordingly, we found a significant reduction in EB2 phosphorylation levels in vehicle-treated CDD organoids compared to control organoids (Figure 2D,E). Organoids treated with viral vectors showed a slight, but non-significant, increase in EB2 phosphorylation levels in both TATk-CDKL5 and CDKL5 gene therapy-treated organoids (Figure 2D,E), suggesting that the levels of CDKL5 re-expression achieved through viral delivery were not sufficient to restore EB2 pathway re-activation.
2.2. Effect of Gene Therapy with Igk-TATk-CDKL5 or CDKL5 Vector on the Electrical Activity of CDD Patient-Derived Organoids
Cortical organoids exhibit spontaneous electrical activity that reflects the formation and maturation of functional neuronal networks [33,37,38]. As previously shown, analysis of the electrical activity of neural networks demonstrated that cortical organoids lacking CDKL5 functionality are more excitable than control organoids [30], suggesting that CDD neurons are characterized by hyperexcitability, which could underlie the seizures that characterize children with CDD. To evaluate the effect of treatment on the electrical activity of CDD and control organoids, 6-week-old organoids were plated onto a microelectrode array (MEA) plate and monitored weekly to track network activity development. At 11 weeks, organoids were infected, and electrophysiological activity was recorded two weeks post-infection (Figure 2A and Figure 3A).
Despite considerable variability in the electrical activity across organoids, which may have reduced the statistical strength of the observed differences, several electrical parameters related to single neurons or neuronal network activity, such as mean firing rate, number of bursts, spikes, and network bursts, significantly differed between control and CDD organoids (Figure 3 and Supplementary Figure S2), reaching values even higher than those previously reported in this model [30].
Interestingly, while treatment with the vector delivering native CDKL5 protein was not sufficient to improve or even ameliorate most of the recorded electrical features, treatment with the vector expressing the recombinant TATk-CDKL5 protein showed an increased, although modest, therapeutic effect (Figure 3C and Supplementary Figure S2). Even though the number of spikes and mean firing rate displayed a trend, albeit non-significant, toward improvement in CDD+TATk-CDKL5 organoids (Supplementary Figure S2), a significant amelioration in the number of burst and network bursts, and a more prominent rescue of the synchrony index was observed (Figure 3C).
2.3. Effect of Gene Therapy with Igk-TATk-CDKL5 or CDKL5 Vector on Cell Proliferation of CDD Patient-Derived Organoids
As an advanced three-dimensional in vitro model, brain organoids replicate key aspects of brain development, providing valuable insights into cellular processes such as proliferation, survival, and neuronal differentiation in healthy and pathological contexts. Given the critical role of CDKL5 in these processes [2,11,12,13,14,15,16], we first assessed whether cell proliferation is affected in CDD organoids by examining the number of cells positive for the proliferation markers Ki-67 and PCNA [39,40]. We found a lower Ki-67 signal intensity (Figure 4A–C) and fewer PCNA-positive cells (Figure 4D,E) in CDD organoids compared to controls, suggesting a reduced proliferation rate in the absence of CDKL5. Western blot analysis showed only a trend toward decreased PCNA protein levels in CDD organoids (Supplementary Figure S3A,B) that was not statistically significant, but that aligned with the more robust immunochemical findings. Interestingly, while infection with the vector delivering native CDKL5 resulted in only a marginal recovery of cell proliferation (Figure 4B,D), both Ki-67 signal intensity and PCNA-positive cell number were restored in CDD organoids infected with the TATk-CDKL5 vector (Figure 4B,D). Again, PCNA protein levels showed only a trend toward increase, still supporting the indication of proliferative recovery (Supplementary Figure S3A,B). Taken together, these findings indicate a more robust recovery of the proliferative phenotype in organoids treated with the TATk-CDKL5 vector compared to those treated with the native CDKL5 vector. Because of reduced cell proliferation, CDD organoids also showed reduced cell density (Figure 4F) that was recovered only by expression of the TATk-CDKL5 protein (Figure 4F).
2.4. Effect of Gene Therapy with Igk-TATk-CDKL5 or CDKL5 Vector on Neuronal Survival of CDD Patient-Derived Organoids
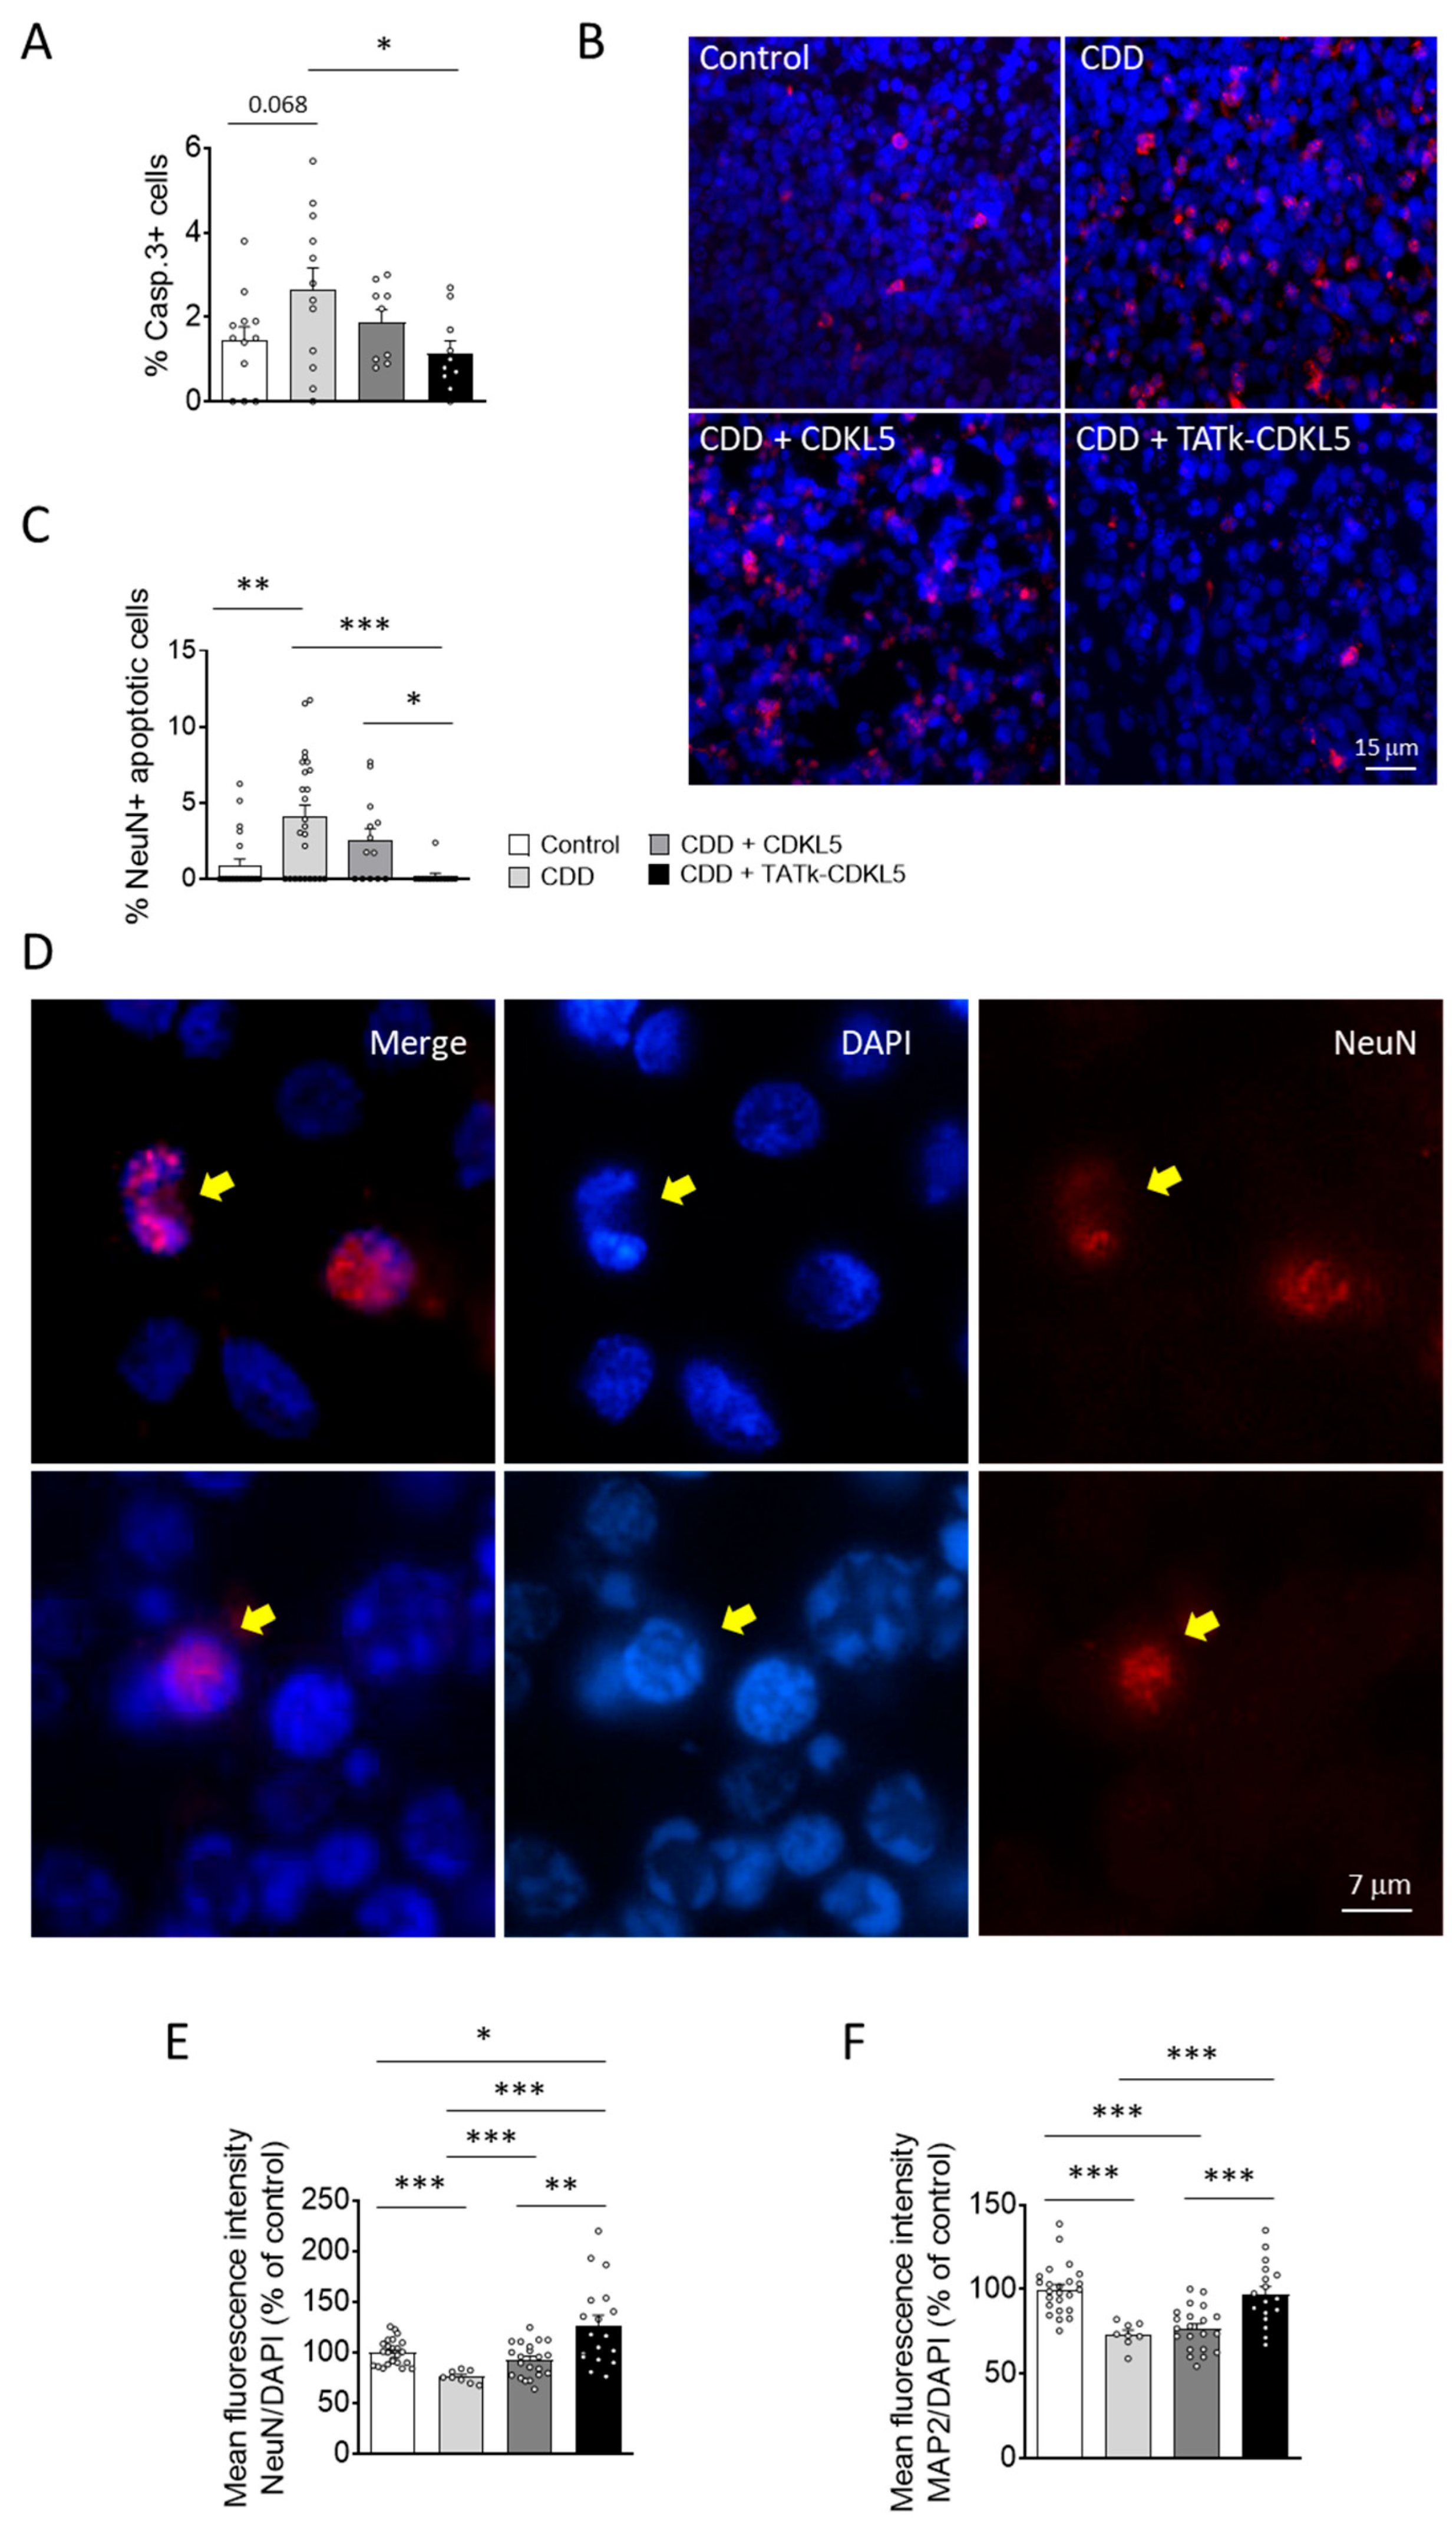
Previous studies have shown that CDKL5 deficiency reduces neuronal survival in in vitro and in vivo models of CDD [14,15,16]. Similarly, we found that cortical organoids from CDD patients are characterized by an increased number of cleaved caspase 3-positive cells, and pyknotic nuclei compared to control organoids (Figure 5A,B; Supplementary Figure S4A). Interestingly, while CDD organoids treated with a vector delivering native CDKL5 showed only a slight reduction in cell death, organoids infected with the TATk-CDKL5 vector showed a significant reduction in the number of caspase 3-positive cells and pyknotic nuclei, bringing them to levels similar to those observed in controls (Figure 5A,B and Supplementary Figure S4A).
Since active caspase-3 has been identified as a key mediator of apoptosis in neuronal cells [41], confirming that CDKL5 deficiency predisposes neurons to cell death [15], we observed a higher number of neuronal cells (NeuN-positive) with nuclei exhibiting consistent structural changes characteristic of apoptotic nuclear condensation [42] in CDD organoids compared with control organoids (Figure 5C,D). Notably, only CDD organoids infected with the TATk-CDKL5 vector showed a significant recovery of neuronal survival (Figure 5C,D). Conversely, we did not observe significant differences in the number of proliferating cells undergoing apoptosis (PCNA+ and Casp3+ cells; Supplementary Figure 4B,C) between CDD and control organoids, indicating that CDKL5 deficiency selectively predisposes mature neurons, rather than proliferating cells, to apoptosis. Furthermore, we did not observe a rescue effect following gene therapy in this specific population (Supplementary Figure S4B).
In accordance with the reduced neuronal survival, CDD organoids displayed a lower immunostaining signal intensity of two neuronal markers, NeuN and MAP2, compared with control organoids (Figure 5E,F and Supplementary Figure S5), suggesting a reduced number of neuronal cells in the absence of CDKL5. Once again, only treatment with the TATk-CDKL5 vector, which recovered neuronal survival (Figure 5C,D), also restored NeuN and MAP2 signal intensity in CDD organoids (Figure 5E,F and Supplementary Figure S5).
3. Discussion
Addressing key limitations of conventional gene therapies is essential to achieve efficient and widespread therapeutic delivery, particularly in disorders with complex and diffuse brain pathology, such as CDKL5 Deficiency Disorder (CDD). We developed a novel strategy based on a cross-correction mechanism that uses a secretable and cell-penetrating TATk-CDKL5 fused protein to enhance its distribution and functionality across the brain [20]. While this innovative therapy showed promising results in a preclinical murine model [20], here we validated its therapeutic potential in a human-relevant model, CDD patient-derived cortical organoids, leveraging their ability to replicate the human disease phenotypes. Our findings demonstrated that the gene therapy employing the recombinant TATk-CDKL5 protein is more effective than CDKL5 protein alone in ameliorating the pathological phenotype of CDKL5-deficient cortical organoids, highlighting its superior efficiency driven by the unique advantages of the Igk-TATk-CDKL5 transgene.
As previously demonstrated [36], we showed that the neurotropic AAV-PHP.B, which has widespread use for gene delivery in mouse models [20,43], is also suitable for gene delivery in human cortical organoids. The absence of proper vascularization limited the penetration of our treatment, preventing it from effectively reaching deeper regions and mostly confining its action to the outer layers. Failure to recover CDKL5 expression in many cells of cortical organoids after AAVPHP.B infection at the dose of 3.6*1010 vg/org allowed us to demonstrate the potential of the enhanced cellular bioavailability of the TATk-CDKL5 protein to provide a more robust restoration of the CDD pathological phenotype. As evidenced by immunohistochemical analysis, CDKL5 protein expression was limited to a small number of infected cells in CDD cortical organoids, consequently resulting in only a mild or absent recovery of the CDD pathological phenotype in the absence of increased biodistribution capability conferred by the recombinant fusion peptide Igk-TATk.
Interestingly, despite the increased expression of CDKL5, even though restricted to a few cells, the phosphorylation status of EB2, a direct target of CDKL5 [44], showed no corresponding improvement. While the precise role of CDKL5 in regulating EB2 phosphorylation remains to be fully clarified, this finding raises questions regarding the complexity of CDKL5 signalling and its involvement in cellular signalling, along with its potentially context-dependent effects on downstream targets. Further studies are needed to determine whether CDKL5's influence on EB2 phosphorylation requires specific timing in 3D cortical organoids or whether additional cellular conditions modulate this interaction. However, we cannot exclude the likelihood of this outcome being attributed to the spatially restricted expression of the transgene, predominantly limited to the outer layers of the organoids, failing to efficiently reach the deeper core regions, as shown in our images. Improving transgene distribution throughout the entire organoid structure will be crucial in order to achieve a more comprehensive therapeutic effect that extends beyond the outermost layers.
Notably, functional assessment of electrical activity of the organoids through planar MEAs, which primarily examine surface layers, showed evidence of phenotypic improvement. As reported in previous studies [30,31], we found electrophysiological properties to be significantly impaired in CDD organoids compared to controls. MEA recordings revealed increases in electrical activity in CDD cortical organoids compared to controls. Interestingly, we observed a slight, but promising amelioration of the phenotype in TATk-CDKL5 gene therapy-treated CDD organoids that was not detectable in those treated with the CDKL5 alone, especially regarding network hyper-synchronization and firing activity. The observed amelioration in electrical activity provides a promising initial indication of functional improvement, suggesting that the TATk-CDKL5 gene therapy may exert a stronger effect also on neuronal network activity compared to conventional CDKL5 delivery. Although encouraging, future investigations using additional functional assays and longitudinal studies will be essential to achieve a more comprehensive phenotypic assessment of CDD cortical organoids and, consequently, a more accurate evaluation of therapeutic efficacy.
Extensive work in CDD has provided fundamental characterization of CDKL5 functionality, revealing its critical role in neuronal proliferation, differentiation, and survival in in vitro and in vivo CDD models [2,11,12,13,14,15,16]. It has been reported that 2D cultures of neural progenitors generated from CDD-iPSCs have proliferation defects and increased cell death [30], while differentiated CDD neurons show cellular and morphological defects [30]. However, the impact of CDKL5 deficiency on cells organized in 3D cortical organoids has remained poorly understood. Here, we confirm the importance of CDKL5 in the correct developmental progression of cortical organoids. Our analysis revealed a significant reduction in cell proliferation within CDD organoids, as indicated by decreased Ki-67 signal intensity and fewer PCNA-positive cells than controls. The reduced proliferation corresponded with decreased overall cell density in CDD organoids. These findings suggest that CDKL5 deficiency impairs the proliferative capacity of progenitor cells, potentially contributing to abnormal organoid development. Since PCNA acts as a cofactor of DNA pol δ for DNA synthesis during not only DNA replication but also DNA repair [48], PCNA expression in cortical organoids may also indicate the activation of pro-survival repair mechanisms. Given the well-established link between apoptosis and unresolved DNA damage, the failure of PCNA recovery in CDD cortical organoids may reflect the inability of CDKL5 alone to rescue apoptosis, potentially explaining the different CDKL5 and TATk-CDKL5 treatment impact on the two proliferation markers, Ki-67 and PCNA. Further analyses using cell-type-specific proliferation markers could provide a more detailed understanding of which cell type, stem cells or neural progenitors, is more affected by CDKL5 loss.
CDKL5 deficiency is also known to impair neuronal survival, as evidenced by increased apoptosis in both in vitro and in vivo models of CDD [14,15,16]. For instance, Cdkl5 KO mice are characterized by an increased rate of apoptotic cell death in the hippocampal dentate gyrus that causes a reduction in the final number of granule neurons [14] and accelerated neuronal senescence/death during aging [49]. Consistent with these findings, CDD cortical organoids exhibited a significant increase in cleaved caspase-3-positive cells, a hallmark of apoptosis, compared to control organoids. In addition, structural features indicative of apoptotic nuclear condensation were more frequently observed in NeuN-positive neurons from CDD organoids. This enhanced apoptotic activity highlights the vulnerability of neuronal populations in the absence of functional CDKL5, further confirming the pro-survival role of CDKL5. Recent studies have demonstrated that neurons lacking CDKL5 accumulate increased DNA damage and display enhanced sensitivity to neurotoxic stress [15,16], implicating CDKL5 in the DNA damage response through the interaction with chromatin remodelling and transcriptional regulation factors [47]. Indeed, although CDD is considered a neurodevelopmental disorder and not a neurodegenerative pathology based on preclinical studies performed on mouse models of the disease [6,7,8,9,10], recent studies indicate a progression of brain atrophy in CDD patients that could be attributable to a neurodegenerative phenomenon [50]. Future studies aimed at assessing alterations in DNA repair processes in CDKL5-deficient cortical organoids could help confirm the involvement of CDKL5 in genome maintenance and clarify the consequences for post-mitotic neurons, thereby improving our current understanding of the molecular and cellular mechanisms underlying CDD pathogenesis.
Consistent with a diminished neuronal population due to increased apoptosis and impaired proliferation, we found that CDD organoids showed lower immunostaining intensity for the neuronal markers NeuN and MAP2. This reduction may also reflect a reduced neuronal complexity and maturation, due to the critical role of CDKL5 in neuronal development and differentiation, which has already been extensively highlighted in both in vitro and in vivo models of CDD [2,6,7,14,51,52,53,54,55,56,57]. In accordance with other results, the enhanced recovery of these structural deficits observed in CDD organoids expressing the recombinant TATk-CDKL5 protein further supports its increased therapeutic efficacy compared to CDKL5 alone.
Future analyses exploring the therapeutic efficacy of the cross-correction gene therapy approach on additional structural deficits, such as connectivity in CDD cortical organoids, could offer valuable insight into the broader impact of the TATk-CDKL5 gene therapy on CDKL5 deficiency, further enriching our knowledge to refine therapeutic approaches.
4. Materials and Methods
4.1. Generation of Cortical Organoids and Culture
CDD cortical organoids were generated from two patient-derived iPSC lines harboring the same CDKL5 mutation (R59X nonsense mutation) previously described in [30], following the same protocol as in previous studies [30,32,33]. Specifically, the patient-derived iPSC lines harboring the CDKL5 R59X nonsense mutation correspond to the CDD1 and CDD4 lines in [30], while the control iPSC lines, derived from first-degree sex-matched healthy relatives, correspond to Control1 and Control4 [30]. Briefly, iPSC colonies were dissociated using Accutase (Thermo Fisher Scientific; diluted 1:1 with 1X PBS), and plated into low-attachment 6-well plates at an optimized seeding density (~4 million cells per well) to promote the formation of uniform embryoid bodies (EBs) under continuous agitation on an orbital shaker. Neural induction was initiated by switching to M1 medium consisting of Neurobasal medium (Thermo Fisher Scientific) supplemented with GlutaMAX (Thermo Fisher Scientific), 1% Gem21 NeuroPlex (Gemini Bio-Products), 1% N2 NeuroPlex (Gemini Bio-Products), 1% NEAA (Thermo Fisher Scientific), 1% penicillin/streptomycin (Thermo Fisher Scientific), 10 µM SB431542, and 1 µM dorsomorphin. Key growth factors, including FGF, EGF, and neurotrophic factors (BDNF, GDNF, NT-3), were then added to promote cellular maturation and neural specification. After neural differentiation, cortical organoids were maintained in M2 medium (Neurobasal medium containing GlutaMAX, 1% Gem21, 1% NEAA), with media changes every 3-4 days.
4.2. AAV Infection
AAVPHP.B expressing the TATk-CDKL5 or the CDKL5 protein were produced by Innovavector srl (Pozzuoli (NA), Italy) using the pAAV_CBh-TATk-CDKL5-HA or pAAV_CBh-CDKL5-HA plasmid, as previously described [20].
For AAVPHP.B transduction efficiency analysis, 6-week-old control cortical organoids were plated onto a poly-L-ornithine/laminin-coated glass bottom dish or grown in suspension in a 6-well plate under continuous agitation. At 10 weeks old, cortical organoids were treated with AAVPHP.B virus carrying the Igk-TATk-CDKL5 vector at different doses (7.2*109, 3.6*1010, 7.2*1010 viral genome (vg)/organoid (org)) or with PBS as control. The medium was changed 48 hours post-infection and replaced with 1:1 mixture of fresh M2 media and previously collected conditioned media. Organoids were collected one week after infection for immunostaining analysis.
For electrophysiology recordings, 6-week-old CDD and control cortical organoids were plated onto polyethyleneimine (PEI)/laminin-coated 48-well micro electrode array (MEA) plates (three organoids per well). At 11 weeks old, cortical organoids were treated with AAVPHP.B virus carrying either the CDKL5 or the Igk-TATk-CDKL5 vector at the dose of 3.6*1010 vg/org, or with PBS as a control. Three weeks post infection, organoids were collected for Western blot analysis.
For immunofluorescence staining, 6-week-old CDD and control cortical organoids were grown in suspension in a 6-well plate under constant agitation. At 11 weeks old, cortical organoids were treated with AAVPHP.B virus carrying either the CDKL5 or the Igk-TATk-CDKL5 vector at the dose of 3.6*1010 vg/org, or with PBS. Organoids were collected three weeks post-infection for immunohistochemistry.
4.3. Electrophysiological Recordings
MEA recordings were conducted in complete BrainPhys medium (BrainPhys supplemented with SM1, StemCell Technologies), which was introduced one day before recordings. Following data acquisition, the medium was replaced with M2 medium for long-term maintenance on MEA plates, with half-medium changes performed twice per week. MEA electrophysiological recordings were performed once per week using the Maestro MEA system and the AxIS Software Spontaneous Neural Configuration (Axion Biosystems) with a band-pass filter of 200-Hz and 3-kHz cutoff frequencies. Briefly, spikes were detected with AxIS software using an adaptive threshold crossing set to 5.5 times the standard deviation of the estimated noise for each electrode (channel). Electrodes that detected at least 5 spikes/min were classified as active electrodes using Axion BioSystems’ Neural Metrics Tool. Bursts were identified in the data recorded from each individual electrode using an inter-spike interval (ISI) threshold that requires a minimum of five spikes with a maximum ISI of 100 ms. Network bursts in the well required at least ten spikes under the same ISI with a minimum of 25% active electrodes. The synchrony index was calculated using a cross-correlogram synchrony window of 20 ms.
MEA recordings were performed on intact organoids grown directly on MEA plates, thus primarily capturing electrophysiological activity from the outer, superficial layers of the organoids, which are more accessible and better transduced.
4.4. Western Blotting
Organoids grown on the MEA plate for electrophysiological recordings were briefly washed with PBS and detached from the plate using Accutase (Stemcell Technologies). Collected organoids were lysed in ice-cold RIPA buffer (50 mM Tris–HCl pH 7.4, 150 mM NaCl, 1% Triton-X100, 0.5% sodium deoxycholate, 0.1% SDS) supplemented with cOmplete ULTRA mini protease inhibitor (Roche) and PhosSTOP phosphatase inhibitor (Roche). Protein concentration was determined using BCA assay [34]. Equivalent amounts of protein (20 μg) were subjected to electrophoresis on a 4–12% Invitrogen™ Bolt™ Bis-Tris Gel (Invitrogen) and transferred onto nitrocellulose membrane using the iBlot2 dry blottin System (Thermo Fisher). After blocking with 1× TBS + 0.1% Tween-20 (TBS-T) containing 5% BSA for 1 h at room temperature, the membrane was probed with the primary antibody overnight at 4°C. Next, the membrane was washed 3 times (10 min each) with TBS-T and incubated with the secondary antibody for 2 h at room temperature, followed by 3 more washes in TBS-T. Odyssey CLx imaging system (LICORbio) was used for signal detection, and semi-quantitative analysis was performed using Odyssey Image Studio software (LICORbio). The primary and secondary antibodies used are listed in Supplementary Table S1.
4.5. Tissue Preparation and Immunostaining
Infected organoids grown on glass bottom dishes were washed with 1x PBS, fixed with a 4% paraformaldehyde (PFA) in 100 mM phosphate buffer (pH 7.4) solution for 20 minutes at RT, and subsequently washed in 1x PBS, before being processed for immunostaining as whole-mount organoids.
Infected organoids grown in suspension were washed with 1x PBS, fixed in a 4% PFA solution for 24h at 4°C, and subsequently submerged in a 30% sucrose solution for another 24h at 4°C, before being flash frozen in plastic molds containing Tissue-Tek® OCT and stored at -80°C. Frozen organoids were cut with a cryostat into 15-µm-thick sections that were mounted onto SuperFrost® Plus microscope slides, dried on the bench and stored at -20°C until being processed for immunostaining.
For immunofluorescence analyses, to avoid heterogeneity introduced by rosette structures predominantly found in outer layers, only sections from the inner core of the organoids were selected for staining and quantification. Outer superficial sections containing rosettes were intentionally discarded to allow more homogeneous fluorescence quantification across the entire analyzed section.
Immunostaining
Organoid slices were thawed and washed twice with 1x PBS to remove OCT. A hydrophobic barrier was drawn around the area with organoid slices. Organoid slices on glass-slide or whole-mount organoids were permeabilized in 1x PBS + 0.1% Triton X-100 (PBS-T) for 10 minutes and then blocked with PBS-T containing 3% BSA. Before permeabilization and blocking, for slides undergoing PCNA and Cleaved Caspase 3 staining, an additional step of Antigen Retrieval was performed by boiling samples for 10 minutes in preheated 10 mM Citrate Buffer, followed by extensive washes in 1x PBS. All samples were incubated overnight at 4 °C with primary antibodies diluted in PBS-T + 1% BSA. The following day, slides were washed 3 times in PBS-T and incubated for 2 h with secondary antibodies. After 3 additional washes in PBS-T, all samples were incubated with 4’,6-diamidino2-phenylindole,dihydrochloride (DAPI) for nuclei counterstaining. All samples were mounted using DAPI-fluoromount-g or ProLong Gold Antifade (Thermo Fisher Scientific) and air-dried on bench in the dark. The primary and secondary antibodies used can be found in Supplementary Table S1.
4.6. Image Acquisition and Measurements
Immunofluorescence images were taken with a Nikon Eclipse TE 2000-S inverted microscope equipped with a DS-Qi2 digital SLR camera (Nikon) or with a Zeiss fluorescence microscope equipped with Apotome (Axio Observer Apotome, Zeiss). All images were acquired using the same exposition and gain parameters. The organoid area was manually traced using NIS-Elements AR software (Nikon).
4.6.1. Intensity-Based Analysis
The fluorescence signal intensity of Ki67, NeuN, or Map2 staining in cortical organoids was quantified starting from 20x magnification images of organoid slices. For HA fluorescence signal intensity, quantification was performed on images of both whole-mount organoids and organoid sections. All images were acquired using the same exposition and gain parameters. The organoid area was manually traced using NIS-Elements AR software (Nikon). Signal intensity was quantified by determining the fluorescence intensity of all positive (bright) pixels within the traced area. The signal intensity of Ki67, NeuN or Map2 was normalized to DAPI signal intensity of the same organoid. Approximately 6-9 organoids were analyzed for each experimental group.
4.6.2. Cell Density
The number of PCNA-, Cleaved Caspase 3- or NeuN-positive cells, and pyknotic nuclei were manually counted using the point tool of the Image Pro Plus software (Media Cybernetics) starting from 40x magnification images. Proliferation and apoptosis analysis were performed evaluating the percentage of PCNA- or Cleaved Caspase 3-positive cells over the total cell number. The overall cell density of cortical organoids was evaluated as number of DAPI-positive nuclei/area and expressed as number of cells/μm2. Apoptotic cells in control and CDD cortical organoids were identified by counting the number of pyknotic nuclei, expressed as percentage of DAPI-positive nuclei. Apoptotic neuronal cells were identified by counting the number of NeuN-positive cells displaying pyknotic i.e. condensed and fragmented nuclei [35] and expressed as percentage of the total NeuN-positive cells. Approximately 3000-5000 cells were analyzed from each sample.
4.7. Statistical Analysis
Statistical analysis was performed using Prism 8.0 software (Graphpad). All data are reported as means ± SEM with dots in each graph representing individual values. Statistical values including the n, statistical test, and significance are reported in the Figure legends. Outlier values were excluded according to the ROUT method (Q = 1%). Gaussian distribution of data sets was tested using D'Agostino-Pearson normality test or Shapiro-Wilk for low sample size. Equality of variances was tested using Brown-Forsythe test. Differences within datasets with normal distribution were analyzed for significance using Fisher’s LSD after ordinary One-Way ANOVA when the population had equal variances, or Unpaired t-test after Welch’s ANOVA when unequal variance was present. Datasets with non-parametric distribution were analyzed using uncorrected Dunn’s test after Kruskal–Wallis test. A probability level of P < 0.05 was considered to be statistically significant. A descriptive statistic of the treatment factor is given in Supplementary Table S2.
5. Conclusions
In conclusion, here we have confirmed the pro-proliferative and pro-survival role of CDKL5 in the context of patient-derived human cells that recapitulate brain development during the prenatal period. These findings emphasize the value of cortical organoids as a model to explore complex cellular and molecular mechanisms underlying CDD. The use of human cells offers significant translational value, as it allows us to assess therapy responses in a genetic and physiological context that is highly relevant to patients. However, we are aware that iPSC-derived organoids do not fully replicate the complexity of in vivo neural circuits, nor the influence of systemic factors present in the brain, underscoring the need for further evaluations to support future clinical translatability. Nevertheless, compared to animal models, iPSC-derived organoids provide a more precise human-specific assessment of efficacy and safety, making them a valuable tool for preclinical validation. Using cortical organoids derived from a CDD patient, we obtained further evidence of the greater efficacy of the gene therapy approach based on the recombinant TATk-CDKL5 protein compared to conventional CDKL5 delivery.
Results obtained so far in a mouse model of CDD [20], and now in CDD patient-derived cortical organoids, indicate that the TATk-CDKL5 gene therapy approach is more effective in improving the pathological phenotype in CDKL5-deficient cells based on the unique advantages of the Igk-TATk-CDKL5 transgene. Therefore, we believe that enabling cross-correction via the combination of secretion and cell penetration is an effective strategy to overcome the current hurdles of viral gene therapy for brain diseases, including insufficient viral transduction efficiency resulting in a limited number of brain cells that express the therapeutic protein and, consequently, poor phenotypic recovery, or the use of excessive viral doses which can be harmful to patients. By addressing these challenges, gene therapy could offer a more targeted and long-lasting treatment compared to pharmacological approaches, which often provide only symptomatic relief, and protein replacement therapies, which face limitations in delivery, stability, and intracellular uptake. Further studies aimed at evaluating the efficacy of gene therapy in organoids derived from patients with various CDKL5 mutations will help confirm these findings and further establish the therapeutic potential of this approach in the treatment of CDD.
Supplementary Materials
The following supporting information can be downloaded at the website of this paper posted on Preprints.org, Figure S1: CDKL5 protein expression in CDD cortical organoids following gene therapy; Figure S2: Electrophysiological recordings in CDD cortical organoids following gene therapy; Figure S3: PCNA protein expression in CDD cortical organoids following gene therapy; Figure S4: Cell death in CDD cortical organoids following gene therapy; Figure S5: Neuronal complexity and maturation of CDD cortical organoids following gene therapy; Table S1: Primary and secondary antibodies used for Western blot and Immunostaining; Table S2: Descriptive statistics.
Author Contributions
Conceptualization, E.C., G.M. and A.R.M.; Data curation, G.M., A.M.B. and E.C.; Formal analysis, G.M., A.M.B, S.T., F.P., N.M., F.T., G.C. and M.L.; Funding acquisition, E.C. and A.R.M.; Investigation, G.M., A.M.B, S.T., F.P., N.M., F.T., G.C. and M.L.; Methodology, A.R.M, G.M. and S.T.; Supervision, E.C., and A.R.M.; Writing—original draft preparation, G.M.; Writing—review and editing, E.C. and A.R.M. All authors have read and agreed to the published version of the manuscript.
Funding
This work was supported by a contribution from the CARISBO foundation (ID 20855) to E.C., and funded by the Ministry of University and Research (MUR), National Recovery and Resilience Plan (NRRP), project MNESYS (PE0000006) to E.C. This research was also financed by a contribution from the Italian parent association “CDKL5 insieme verso la cura” to A.M., and E.C.
Institutional Review Board Statement
The study was conducted in accordance with the Declaration of Helsinki, and the protocol 141223 was approved by the University of California San Diego IRB/ESCRO committee on May 29th, 2024.
Data Availability Statement
The datasets analyzed during the current study are available from the corresponding author upon reasonable request.
Conflicts of Interest
The authors declare no conflicts of interest. The funders had no role in the design of the study; in the collection, analyses, or interpretation of data; in the writing of the manuscript; or in the decision to publish the results.
Abbreviations
| CDD | CDKL5 Deficiency Disorder |
| CNS | Central Nervous System |
| MEA | Micro-Electrode Arrays |
| iPSCs | Induced Pluripotent Stem Cells |
| AAV | Adeno-Associated Virus |
References
- Leonard, H.; Downs, J.; Benke, T.A.; Swanson, L.; Olson, H.; Demarest, S. CDKL5 deficiency disorder: clinical features, diagnosis, and management. Lancet Neurol 2022, 21, 563-576. [CrossRef]
- Van Bergen, N.J.; Massey, S.; Quigley, A.; Rollo, B.; Harris, A.R.; Kapsa, R.M.I.; Christodoulou, J. CDKL5 deficiency disorder: molecular insights and mechanisms of pathogenicity to fast-track therapeutic development. Biochem Soc Trans 2022, 50, 1207-1224. [CrossRef]
- Kadam, S.D.; Sullivan, B.J.; Goyal, A.; Blue, M.E.; Smith-Hicks, C. Rett Syndrome and CDKL5 Deficiency Disorder: From Bench to Clinic. Int J Mol Sci 2019, 20. [CrossRef]
- Demarest, S.; Pestana-Knight, E.M.; Olson, H.E.; Downs, J.; Marsh, E.D.; Kaufmann, W.E.; Partridge, C.A.; Leonard, H.; Gwadry-Sridhar, F.; Frame, K.E.; et al. Severity Assessment in CDKL5 Deficiency Disorder. Pediatr Neurol 2019, 97, 38-42. [CrossRef]
- Jakimiec, M.; Paprocka, J.; Smigiel, R. CDKL5 Deficiency Disorder-A Complex Epileptic Encephalopathy. Brain Sci 2020, 10. [CrossRef]
- Amendola, E.; Zhan, Y.; Mattucci, C.; Castroflorio, E.; Calcagno, E.; Fuchs, C.; Lonetti, G.; Silingardi, D.; Vyssotski, A.L.; Farley, D.; et al. Mapping pathological phenotypes in a mouse model of CDKL5 disorder. PLoS One 2014, 9, e91613. [CrossRef]
- Wang, I.T.; Allen, M.; Goffin, D.; Zhu, X.; Fairless, A.H.; Brodkin, E.S.; Siegel, S.J.; Marsh, E.D.; Blendy, J.A.; Zhou, Z. Loss of CDKL5 disrupts kinome profile and event-related potentials leading to autistic-like phenotypes in mice. Proc Natl Acad Sci U S A 2012, 109, 21516-21521. [CrossRef]
- Okuda, K.; Takao, K.; Watanabe, A.; Miyakawa, T.; Mizuguchi, M.; Tanaka, T. Comprehensive behavioral analysis of the Cdkl5 knockout mice revealed significant enhancement in anxiety- and fear-related behaviors and impairment in both acquisition and long-term retention of spatial reference memory. PLoS One 2018, 13, e0196587. [CrossRef]
- Tang, S.; Terzic, B.; Wang, I.J.; Sarmiento, N.; Sizov, K.; Cui, Y.; Takano, H.; Marsh, E.D.; Zhou, Z.; Coulter, D.A. Altered NMDAR signaling underlies autistic-like features in mouse models of CDKL5 deficiency disorder. Nat Commun 2019, 10, 2655. [CrossRef]
- Yennawar, M.; White, R.S.; Jensen, F.E. AMPA Receptor Dysregulation and Therapeutic Interventions in a Mouse Model of CDKL5 Deficiency Disorder. J Neurosci 2019, 39, 4814-4828. [CrossRef]
- Katayama, S.; Sueyoshi, N.; Inazu, T.; Kameshita, I. Cyclin-Dependent Kinase-Like 5 (CDKL5): Possible Cellular Signalling Targets and Involvement in CDKL5 Deficiency Disorder. Neural Plast 2020, 2020, 6970190. [CrossRef]
- Demarest, S.T.; Olson, H.E.; Moss, A.; Pestana-Knight, E.; Zhang, X.; Parikh, S.; Swanson, L.C.; Riley, K.D.; Bazin, G.A.; Angione, K.; et al. CDKL5 deficiency disorder: Relationship between genotype, epilepsy, cortical visual impairment, and development. Epilepsia 2019, 60, 1733-1742. [CrossRef]
- Kind, P.C.; Bird, A. CDKL5 deficiency disorder: a pathophysiology of neural maintenance. J Clin Invest 2021, 131. [CrossRef]
- Fuchs, C.; Trazzi, S.; Torricella, R.; Viggiano, R.; De Franceschi, M.; Amendola, E.; Gross, C.; Calzà, L.; Bartesaghi, R.; Ciani, E. Loss of CDKL5 impairs survival and dendritic growth of newborn neurons by altering AKT/GSK-3β signaling. Neurobiol Dis 2014, 70, 53-68. [CrossRef]
- Fuchs, C.; Medici, G.; Trazzi, S.; Gennaccaro, L.; Galvani, G.; Berteotti, C.; Ren, E.; Loi, M.; Ciani, E. CDKL5 deficiency predisposes neurons to cell death through the deregulation of SMAD3 signaling. Brain Pathol 2019, 29, 658-674. [CrossRef]
- Loi, M.; Trazzi, S.; Fuchs, C.; Galvani, G.; Medici, G.; Gennaccaro, L.; Tassinari, M.; Ciani, E. Increased DNA Damage and Apoptosis in CDKL5-Deficient Neurons. Mol Neurobiol 2020, 57, 2244-2262. [CrossRef]
- Hong, W.; Haviland, I.; Pestana-Knight, E.; Weisenberg, J.L.; Demarest, S.; Marsh, E.D.; Olson, H.E. CDKL5 Deficiency Disorder-Related Epilepsy: A Review of Current and Emerging Treatment. CNS Drugs 2022, 36, 591-604. [CrossRef]
- Wang, Y.; Hu, L.F.; Zhou, T.J.; Qi, L.Y.; Xing, L.; Lee, J.; Wang, F.Z.; Oh, Y.K.; Jiang, H.L. Gene therapy strategies for rare monogenic disorders with nuclear or mitochondrial gene mutations. Biomaterials 2021, 277, 121108. [CrossRef]
- Zhang, Y.; Wu, Z.Y. Gene therapy for monogenic disorders: challenges, strategies, and perspectives. J Genet Genomics 2024, 51, 133-143. [CrossRef]
- Medici, G.; Tassinari, M.; Galvani, G.; Bastianini, S.; Gennaccaro, L.; Loi, M.; Mottolese, N.; Alvente, S.; Berteotti, C.; Sagona, G.; et al. Expression of a Secretable, Cell-Penetrating CDKL5 Protein Enhances the Efficacy of Gene Therapy for CDKL5 Deficiency Disorder. Neurotherapeutics 2022, 19, 1886-1904. [CrossRef]
- Gao, Y.; Irvine, E.E.; Eleftheriadou, I.; Naranjo, C.J.; Hearn-Yeates, F.; Bosch, L.; Glegola, J.A.; Murdoch, L.; Czerniak, A.; Meloni, I.; et al. Gene replacement ameliorates deficits in mouse and human models of cyclin-dependent kinase-like 5 disorder. Brain 2020, 143, 811-832. [CrossRef]
- Voronin, G.; Narasimhan, J.; Gittens, J.; Sheedy, J.; Lipari, P.; Peters, M.; DeMarco, S.; Cao, L.; Varganov, Y.; Kim, M.J.; et al. Preclinical studies of gene replacement therapy for CDKL5 deficiency disorder. Mol Ther 2024. [CrossRef]
- Trazzi, S.; De Franceschi, M.; Fuchs, C.; Bastianini, S.; Viggiano, R.; Lupori, L.; Mazziotti, R.; Medici, G.; Lo Martire, V.; Ren, E.; et al. CDKL5 protein substitution therapy rescues neurological phenotypes of a mouse model of CDKL5 disorder. Hum Mol Genet 2018, 27, 1572-1592. [CrossRef]
- Puhl, D.L.; D'Amato, A.R.; Gilbert, R.J. Challenges of gene delivery to the central nervous system and the growing use of biomaterial vectors. Brain Res Bull 2019, 150, 216-230. [CrossRef]
- Begley, D.J. Delivery of therapeutic agents to the central nervous system: the problems and the possibilities. Pharmacol Ther 2004, 104, 29-45. [CrossRef]
- Cogill, S.A.; Lee, J.H.; Jeon, M.T.; Kim, D.G.; Chang, Y. Hopping the Hurdle: Strategies to Enhance the Molecular Delivery to the Brain through the Blood-Brain Barrier. Cells 2024, 13. [CrossRef]
- Fallah, M.S.; Eubanks, J.H. Seizures in Mouse Models of Rare Neurodevelopmental Disorders. Neuroscience 2020, 445, 50-68. [CrossRef]
- Swingler, M.; Donadoni, M.; Bellizzi, A.; Cakir, S.; Sariyer, I.K. iPSC-derived three-dimensional brain organoid models and neurotropic viral infections. J Neurovirol 2023, 29, 121-134. [CrossRef]
- Eichmuller, O.L.; Knoblich, J.A. Human cerebral organoids - a new tool for clinical neurology research. Nat Rev Neurol 2022, 18, 661-680. [CrossRef]
- Negraes, P.D.; Trujillo, C.A.; Yu, N.K.; Wu, W.; Yao, H.; Liang, N.; Lautz, J.D.; Kwok, E.; McClatchy, D.; Diedrich, J.; et al. Altered network and rescue of human neurons derived from individuals with early-onset genetic epilepsy. Mol Psychiatry 2021, 26, 7047-7068. [CrossRef]
- Wu, W.; Yao, H.; Negraes, P.D.; Wang, J.; Trujillo, C.A.; de Souza, J.S.; Muotri, A.R.; Haddad, G.G. Neuronal hyperexcitability and ion channel dysfunction in CDKL5-deficiency patient iPSC-derived cortical organoids. Neurobiol Dis 2022, 174, 105882. [CrossRef]
- Fitzgerald, M.Q.; Chu, T.; Puppo, F.; Blanch, R.; Chillón, M.; Subramaniam, S.; Muotri, A.R. Generation of 'semi-guided' cortical organoids with complex neural oscillations. Nat Protoc 2024, 19, 2712-2738. [CrossRef]
- Trujillo, C.A.; Gao, R.; Negraes, P.D.; Gu, J.; Buchanan, J.; Preissl, S.; Wang, A.; Wu, W.; Haddad, G.G.; Chaim, I.A.; et al. Complex Oscillatory Waves Emerging from Cortical Organoids Model Early Human Brain Network Development. Cell Stem Cell 2019, 25, 558-569.e557. [CrossRef]
- Walker, J.M. The bicinchoninic acid (BCA) assay for protein quantitation. Methods Mol Biol 1994, 32, 5-8. [CrossRef]
- Ziegler, U.; Groscurth, P. Morphological features of cell death. News Physiol Sci 2004, 19, 124-128. [CrossRef]
- Cho, A.N.; Bright, F.; Morey, N.; Au, C.; Ittner, L.M.; Ke, Y.D. Efficient Gene Expression in Human Stem Cell Derived-Cortical Organoids Using Adeno Associated Virus. Cells 2022, 11. [CrossRef]
- Tasnim, K.; Liu, J. Emerging Bioelectronics for Brain Organoid Electrophysiology. J Mol Biol 2022, 434, 167165. [CrossRef]
- Sharf, T.; van der Molen, T.; Glasauer, S.M.K.; Guzman, E.; Buccino, A.P.; Luna, G.; Cheng, Z.; Audouard, M.; Ranasinghe, K.G.; Kudo, K.; et al. Functional neuronal circuitry and oscillatory dynamics in human brain organoids. Nat Commun 2022, 13, 4403. [CrossRef]
- Scholzen, T.; Gerdes, J. The Ki-67 protein: from the known and the unknown. J Cell Physiol 2000, 182, 311-322.
- Celis, J.E.; Celis, A. Cell cycle-dependent variations in the distribution of the nuclear protein cyclin proliferating cell nuclear antigen in cultured cells: subdivision of S phase. Proc Natl Acad Sci U S A 1985, 82, 3262-3266. [CrossRef]
- D'Amelio, M.; Cavallucci, V.; Cecconi, F. Neuronal caspase-3 signaling: not only cell death. Cell Death Differ 2010, 17, 1104-1114. [CrossRef]
- Toné, S.; Sugimoto, K.; Tanda, K.; Suda, T.; Uehira, K.; Kanouchi, H.; Samejima, K.; Minatogawa, Y.; Earnshaw, W.C. Three distinct stages of apoptotic nuclear condensation revealed by time-lapse imaging, biochemical and electron microscopy analysis of cell-free apoptosis. Exp Cell Res 2007, 313, 3635-3644. [CrossRef]
- Ittner, L.M.; Klugmann, M.; Ke, Y.D. Adeno-associated virus-based Alzheimer's disease mouse models and potential new therapeutic avenues. Br J Pharmacol 2019, 176, 3649-3665. [CrossRef]
- Baltussen, L.L.; Negraes, P.D.; Silvestre, M.; Claxton, S.; Moeskops, M.; Christodoulou, E.; Flynn, H.R.; Snijders, A.P.; Muotri, A.R.; Ultanir, S.K. Chemical genetic identification of CDKL5 substrates reveals its role in neuronal microtubule dynamics. EMBO J 2018, 37. [CrossRef]
- Fuchs, C.; Rimondini, R.; Viggiano, R.; Trazzi, S.; De Franceschi, M.; Bartesaghi, R.; Ciani, E. Inhibition of GSK3β rescues hippocampal development and learning in a mouse model of CDKL5 disorder. Neurobiol Dis 2015, 82, 298-310. [CrossRef]
- Fuchs, C.; Fustini, N.; Trazzi, S.; Gennaccaro, L.; Rimondini, R.; Ciani, E. Treatment with the GSK3-beta inhibitor Tideglusib improves hippocampal development and memory performance in juvenile, but not adult, Cdkl5 knockout mice. Eur J Neurosci 2018, 47, 1054-1066. [CrossRef]
- Khanam, T.; Muñoz, I.; Weiland, F.; Carroll, T.; Morgan, M.; Borsos, B.N.; Pantazi, V.; Slean, M.; Novak, M.; Toth, R.; et al. CDKL5 kinase controls transcription-coupled responses to DNA damage. EMBO J 2021, 40, e108271. [CrossRef]
- Maga, G.; Hubscher, U. Proliferating cell nuclear antigen (PCNA): a dancer with many partners. J Cell Sci 2003, 116, 3051-3060. [CrossRef]
- Gennaccaro, L.; Fuchs, C.; Loi, M.; Pizzo, R.; Alvente, S.; Berteotti, C.; Lupori, L.; Sagona, G.; Galvani, G.; Gurgone, A.; et al. Age-Related Cognitive and Motor Decline in a Mouse Model of CDKL5 Deficiency Disorder is Associated with Increased Neuronal Senescence and Death. Aging Dis 2021, 12, 764-785. [CrossRef]
- Specchio, N.; Trivisano, M.; Lenge, M.; Ferretti, A.; Mei, D.; Parrini, E.; Napolitano, A.; Rossi-Espagnet, C.; Talenti, G.; Longo, D.; et al. CDKL5 deficiency disorder: progressive brain atrophy may be part of the syndrome. Cereb Cortex 2023, 33, 9709-9717. [CrossRef]
- Valli, E.; Trazzi, S.; Fuchs, C.; Erriquez, D.; Bartesaghi, R.; Perini, G.; Ciani, E. CDKL5, a novel MYCN-repressed gene, blocks cell cycle and promotes differentiation of neuronal cells. Biochim Biophys Acta 2012, 1819, 1173-1185. [CrossRef]
- Chen, Q.; Zhu, Y.C.; Yu, J.; Miao, S.; Zheng, J.; Xu, L.; Zhou, Y.; Li, D.; Zhang, C.; Tao, J.; et al. CDKL5, a protein associated with rett syndrome, regulates neuronal morphogenesis via Rac1 signaling. J Neurosci 2010, 30, 12777-12786. [CrossRef]
- Ricciardi, S.; Ungaro, F.; Hambrock, M.; Rademacher, N.; Stefanelli, G.; Brambilla, D.; Sessa, A.; Magagnotti, C.; Bachi, A.; Giarda, E.; et al. CDKL5 ensures excitatory synapse stability by reinforcing NGL-1-PSD95 interaction in the postsynaptic compartment and is impaired in patient iPSC-derived neurons. Nat Cell Biol 2012, 14, 911-923. [CrossRef]
- Zhu, Y.C.; Li, D.; Wang, L.; Lu, B.; Zheng, J.; Zhao, S.L.; Zeng, R.; Xiong, Z.Q. Palmitoylation-dependent CDKL5-PSD-95 interaction regulates synaptic targeting of CDKL5 and dendritic spine development. Proc Natl Acad Sci U S A 2013, 110, 9118-9123. [CrossRef]
- Pizzo, R.; Gurgone, A.; Castroflorio, E.; Amendola, E.; Gross, C.; Sassoe-Pognetto, M.; Giustetto, M. Lack of Cdkl5 Disrupts the Organization of Excitatory and Inhibitory Synapses and Parvalbumin Interneurons in the Primary Visual Cortex. Front Cell Neurosci 2016, 10, 261. [CrossRef]
- Kontaxi, C.; Ivanova, D.; Davenport, E.C.; Kind, P.C.; Cousin, M.A. Epilepsy-Related CDKL5 Deficiency Slows Synaptic Vesicle Endocytosis in Central Nerve Terminals. J Neurosci 2023, 43, 2002-2020. [CrossRef]
- Nawaz, M.S.; Giarda, E.; Bedogni, F.; La Montanara, P.; Ricciardi, S.; Ciceri, D.; Alberio, T.; Landsberger, N.; Rusconi, L.; Kilstrup-Nielsen, C. CDKL5 and Shootin1 Interact and Concur in Regulating Neuronal Polarization. PLoS One 2016, 11, e0148634. [CrossRef]
Figure 1.
Experimental design and AAVPHPB transduction efficacy in cortical organoids. (A) Schematic timeline showing the generation of control cortical organoids, infection, and subsequent histological analysis for the evaluation of transgene expression. (B) Representative fluorescence images of whole-mount immunostaining for CDKL5 (HA, in red) and MAP2 (in green) of 11-week-old control cortical organoids grown on a glass bottom dish, treated with TATk-CDKL5 gene therapy vector at different doses (7.2*109, 3.6*1010, 7.2*1010 vg/org), or vehicle as a control, and collected 1-week after infection for immunostaining. Scale bar = 100 μm. (C) Quantification of HA mean intensity in whole-mount organoids (superficial zone) and organoid slices (inner zone); organoids were infected with different virus doses as described in (A,B). (D) Percentage of apoptotic cells in vehicle-treated and high dose viral (7.2*1010 vg/org)-treated cortical organoids. Values in (C) and (D) are presented as mean ± SEM. *** p < 0.001 (Fisher’s LSD after Two-Way ANOVA). (E) Representative fluorescence images of a cortical organoid slice showing CDKL5 expression (HA, in red) in control cortical organoids grown under constant agitation, infected with TATk-CDKL5 gene therapy vector at the dose of 7.2*1010 vg/org and collected 1-week after infection; MAP2 (in green) and nuclei counterstained with DAPI (in blue). Scale bar = 50 μm.
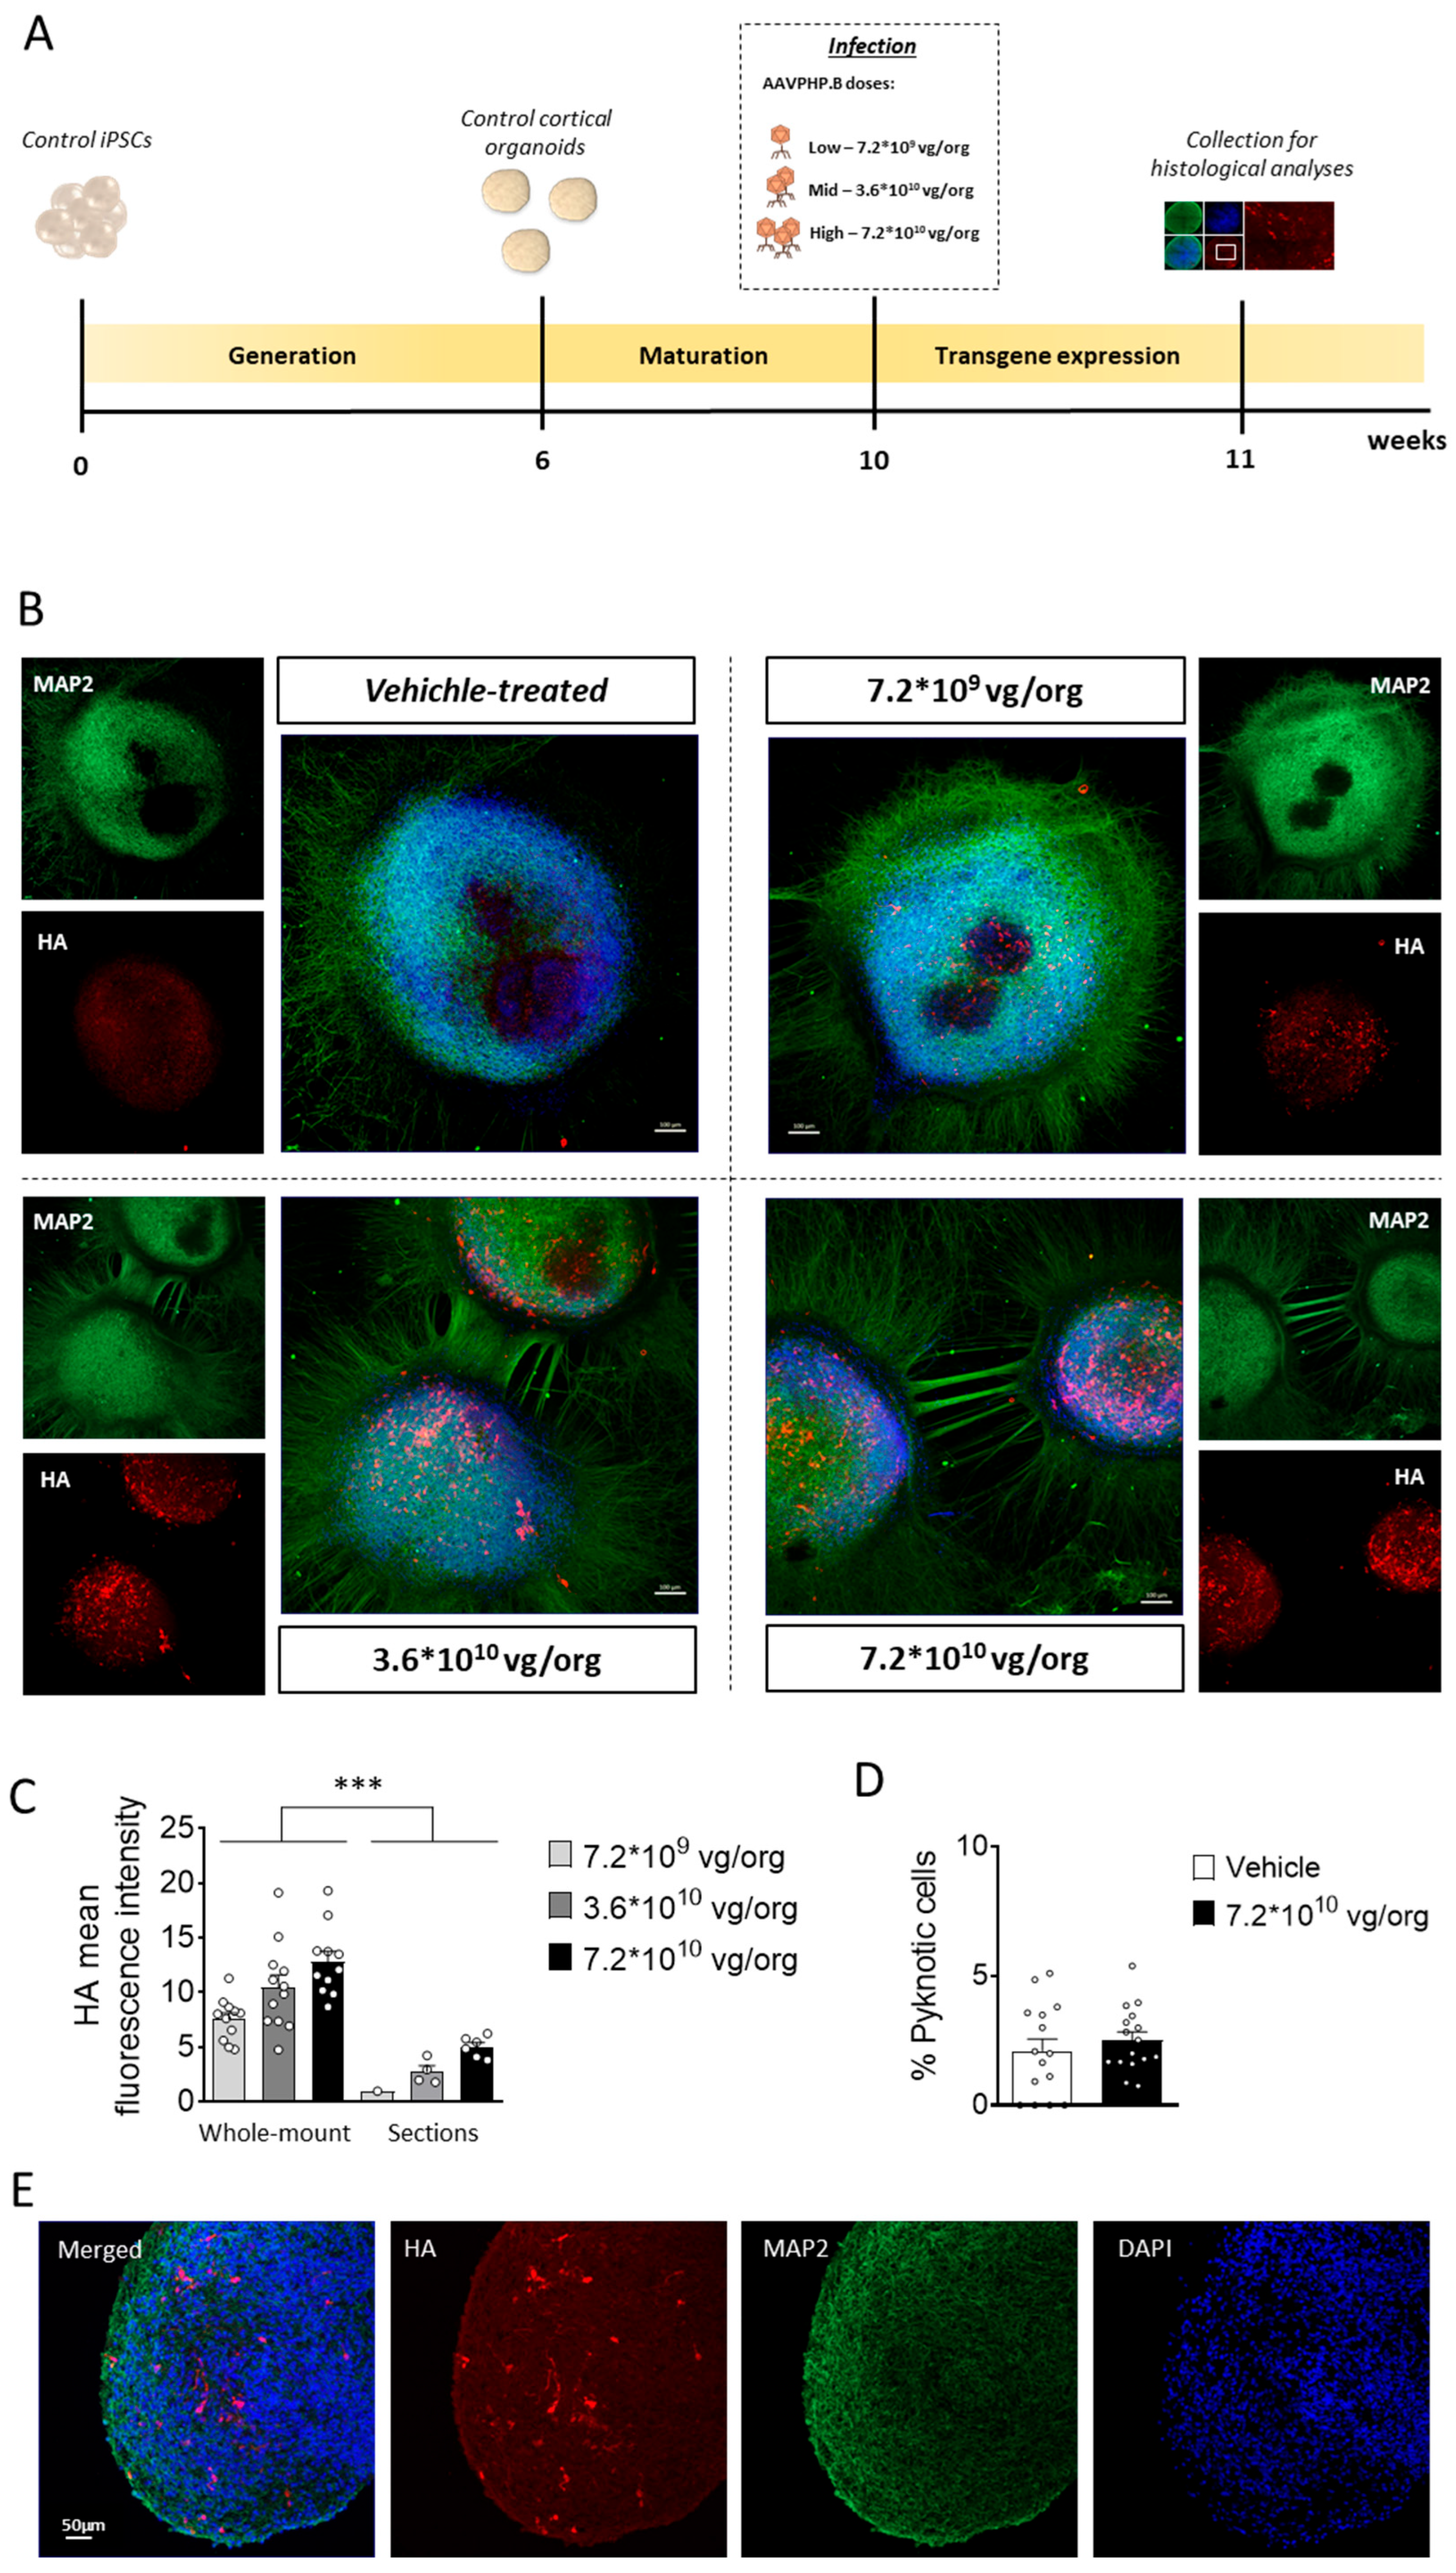
Figure 2.
CDKL5 protein replacement in CDD cortical organoids following gene therapy. (A) Schematic timeline showing the generation of control and CDD cortical organoids, infection, and subsequent analysis for the evaluation of gene therapy treatments. (B,C) Western blot analysis of CDKL5 expression levels in protein extracts from CDD and control cortical organoids grown on MEA plates, treated at 11 weeks old with TATk-CDKL5 or CDKL5 gene therapy vectors at a dose of 3.6*1010 vg/org, or vehicle as a control, and collected 3 weeks after treatment for biochemical analysis (Control: n = 36, 9 org per lane, 2 cell lines; CDD: n = 36, 9 org per lane, 2 cell lines for each condition). (B) Immunoblots of CDKL5 (upper panel) and β-actin (lower panel) proteins. The histogram in (C) shows quantification of CDKL5 expression levels normalized to β-actin levels. (D,E) Western blot analysis of phosphorylation levels of microtubule end-binding protein EB2 in protein extracts from cortical organoids (Control: n = 36, 2 cell lines; CDD: n = 36 for each condition, 2 cell lines; 2 technical replicates per cell line). (D) Immunoblots of the phosphorylated form of EB2 protein (upper panel) and total protein levels (lower panel). The histogram in (E) shows quantification of phosphorylated EB2 protein levels normalized to corresponding total EB2 protein levels. Data sets in (C) and (E) are expressed as a percentage of vehicle-treated control organoids. Values are represented as means ± SEM. * p < 0.05, ** p < 0.01, *** p < 0.001 (Unpaired t-test after Welch’s ANOVA).
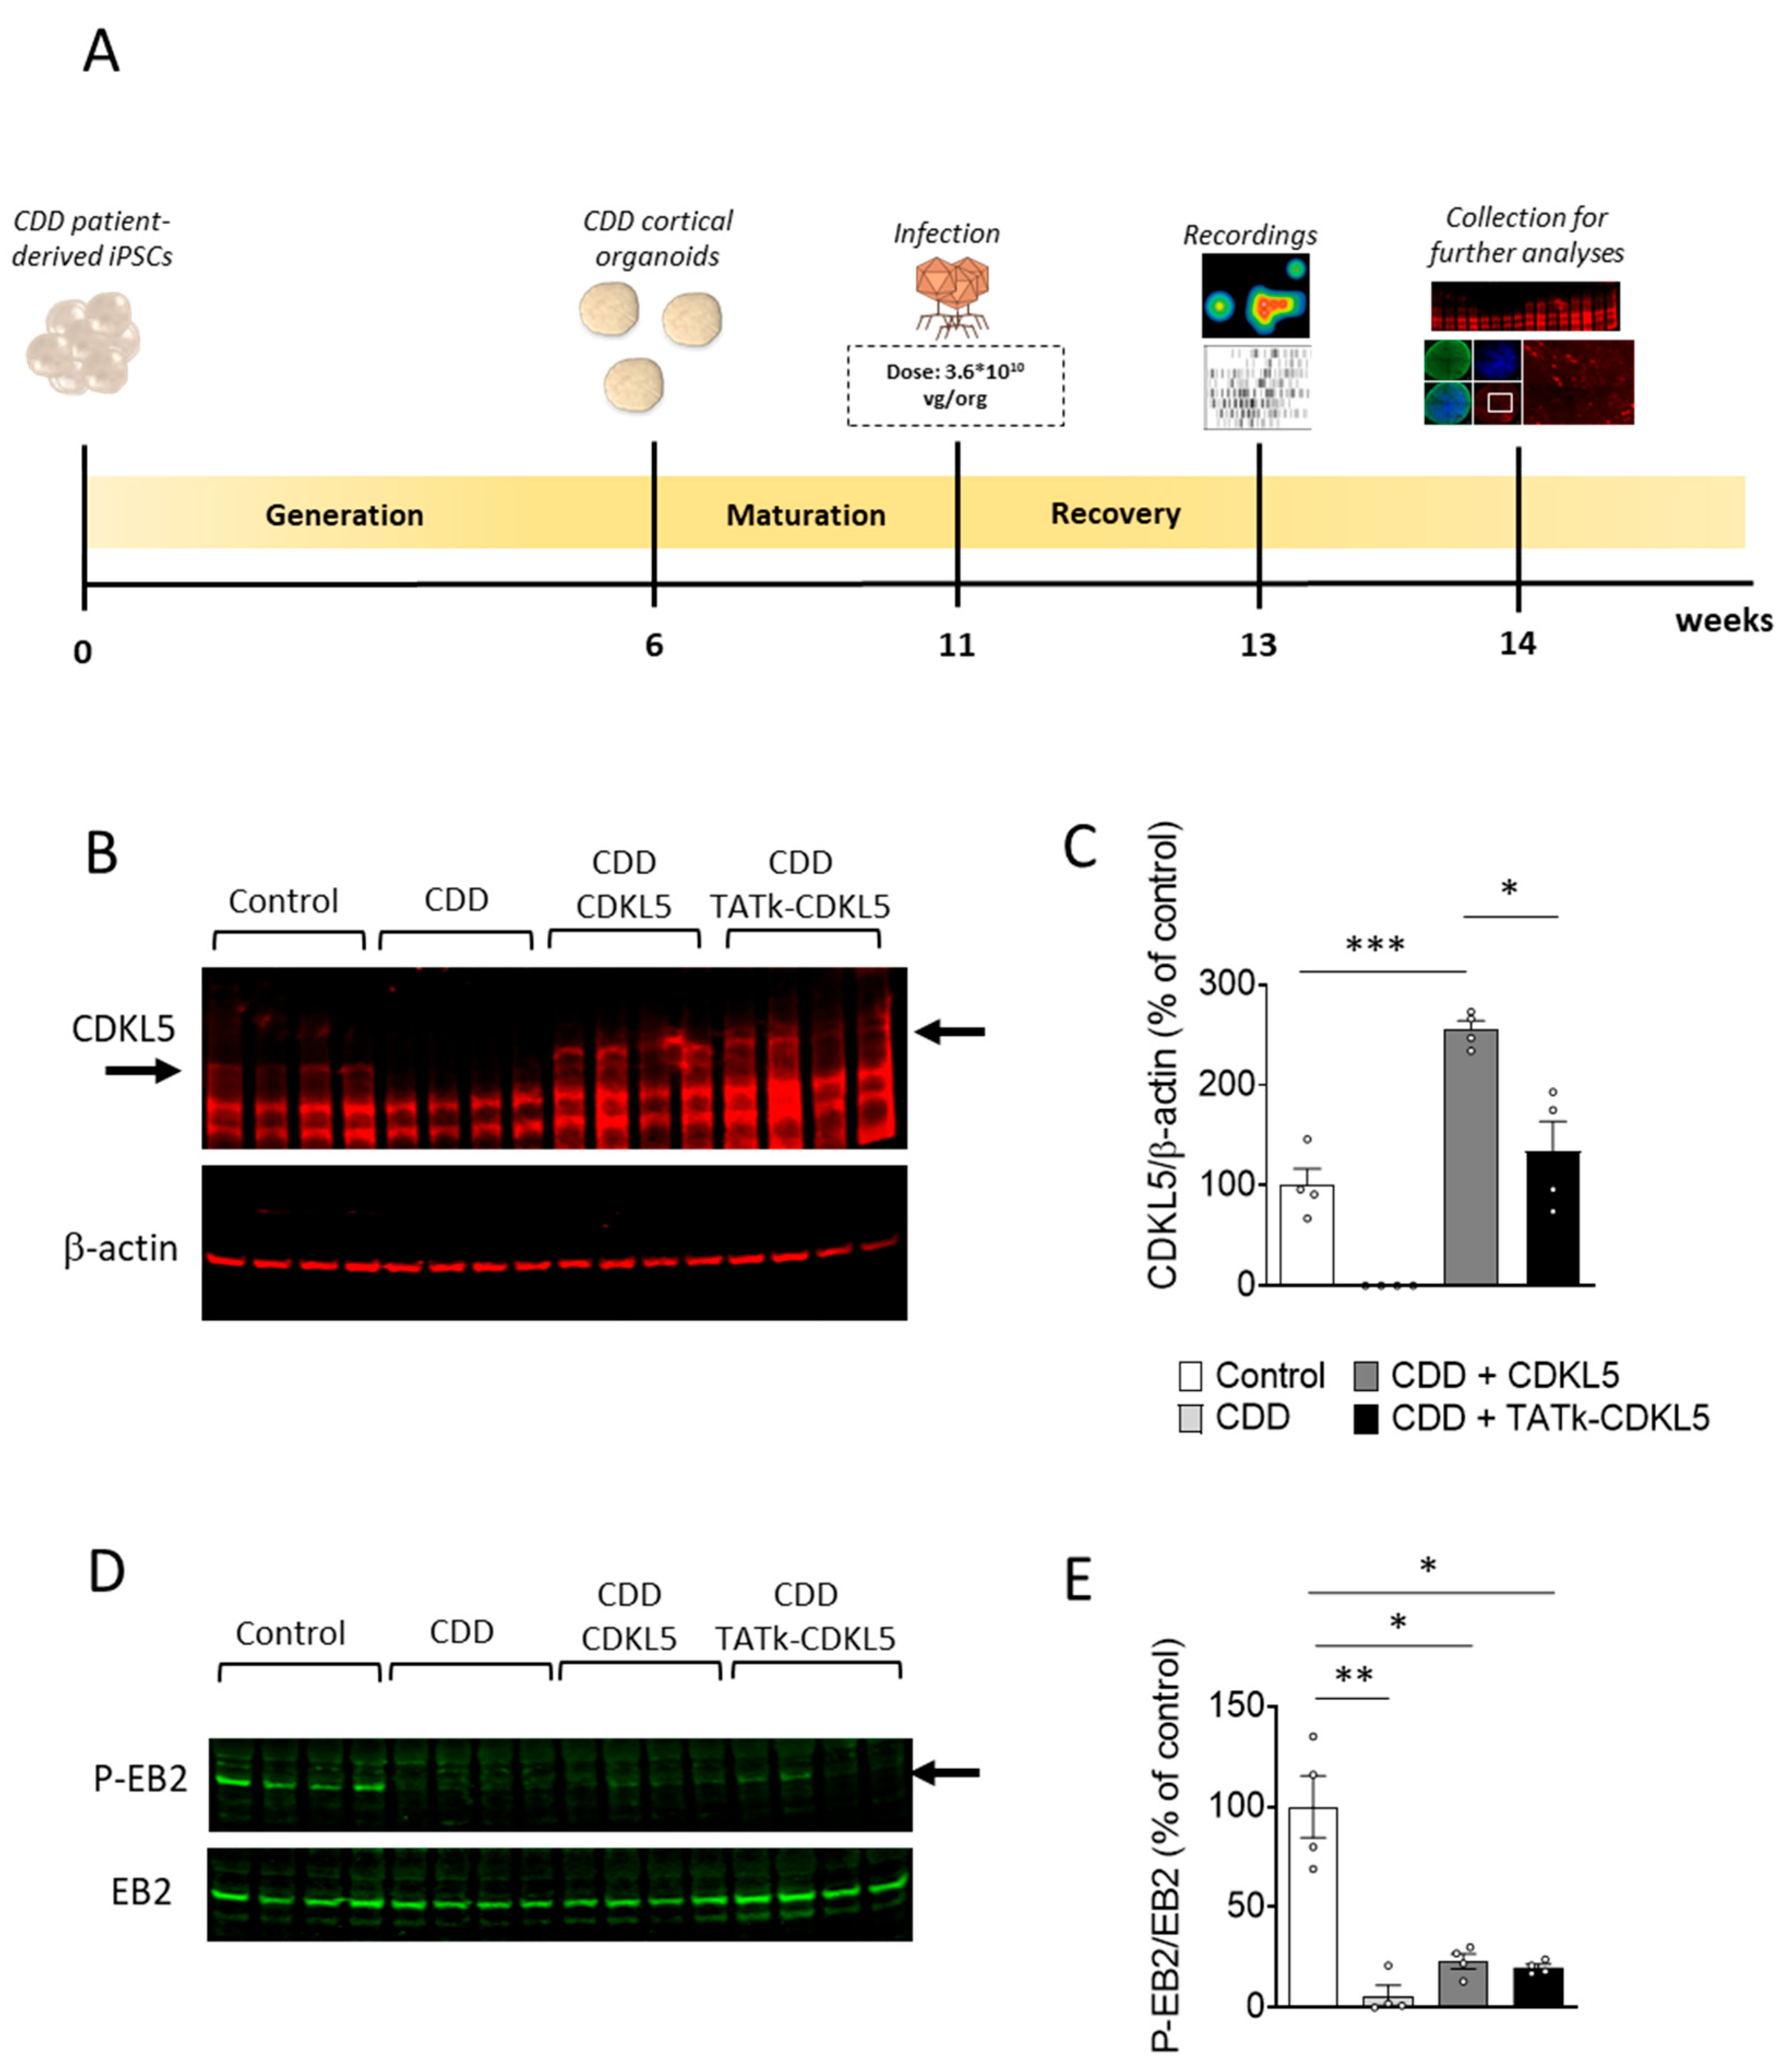
Figure 3.
Electrical activity in CDD cortical organoids following gene therapy. (A) Representative raster plots of MEA recordings for each condition. (B) Electrophysiological recording of CDD and control cortical organoids grown on MEA plates, treated at 11 weeks old with TATk-CDKL5 or CDKL5 gene therapy vectors at a dose of 3.6*1010 vg/org, or vehicle as a control. Electrical activity was recorded 2 weeks after treatment. Graphs show the result of several electrical parameters as indicated during 3 minutes of recording (Control: n = 36, 2 cell lines; CDD: n = 36, 2 cell lines for each condition, 6 technical replicates per cell line). Values are represented as means ± SEM. * p < 0.05, ** p < 0.01, *** p < 0.001 (Unpaired t-test after Welch’s ANOVA, and Dunn’s test after Kruskal-Wallis, for data set “Number of network bursts”).
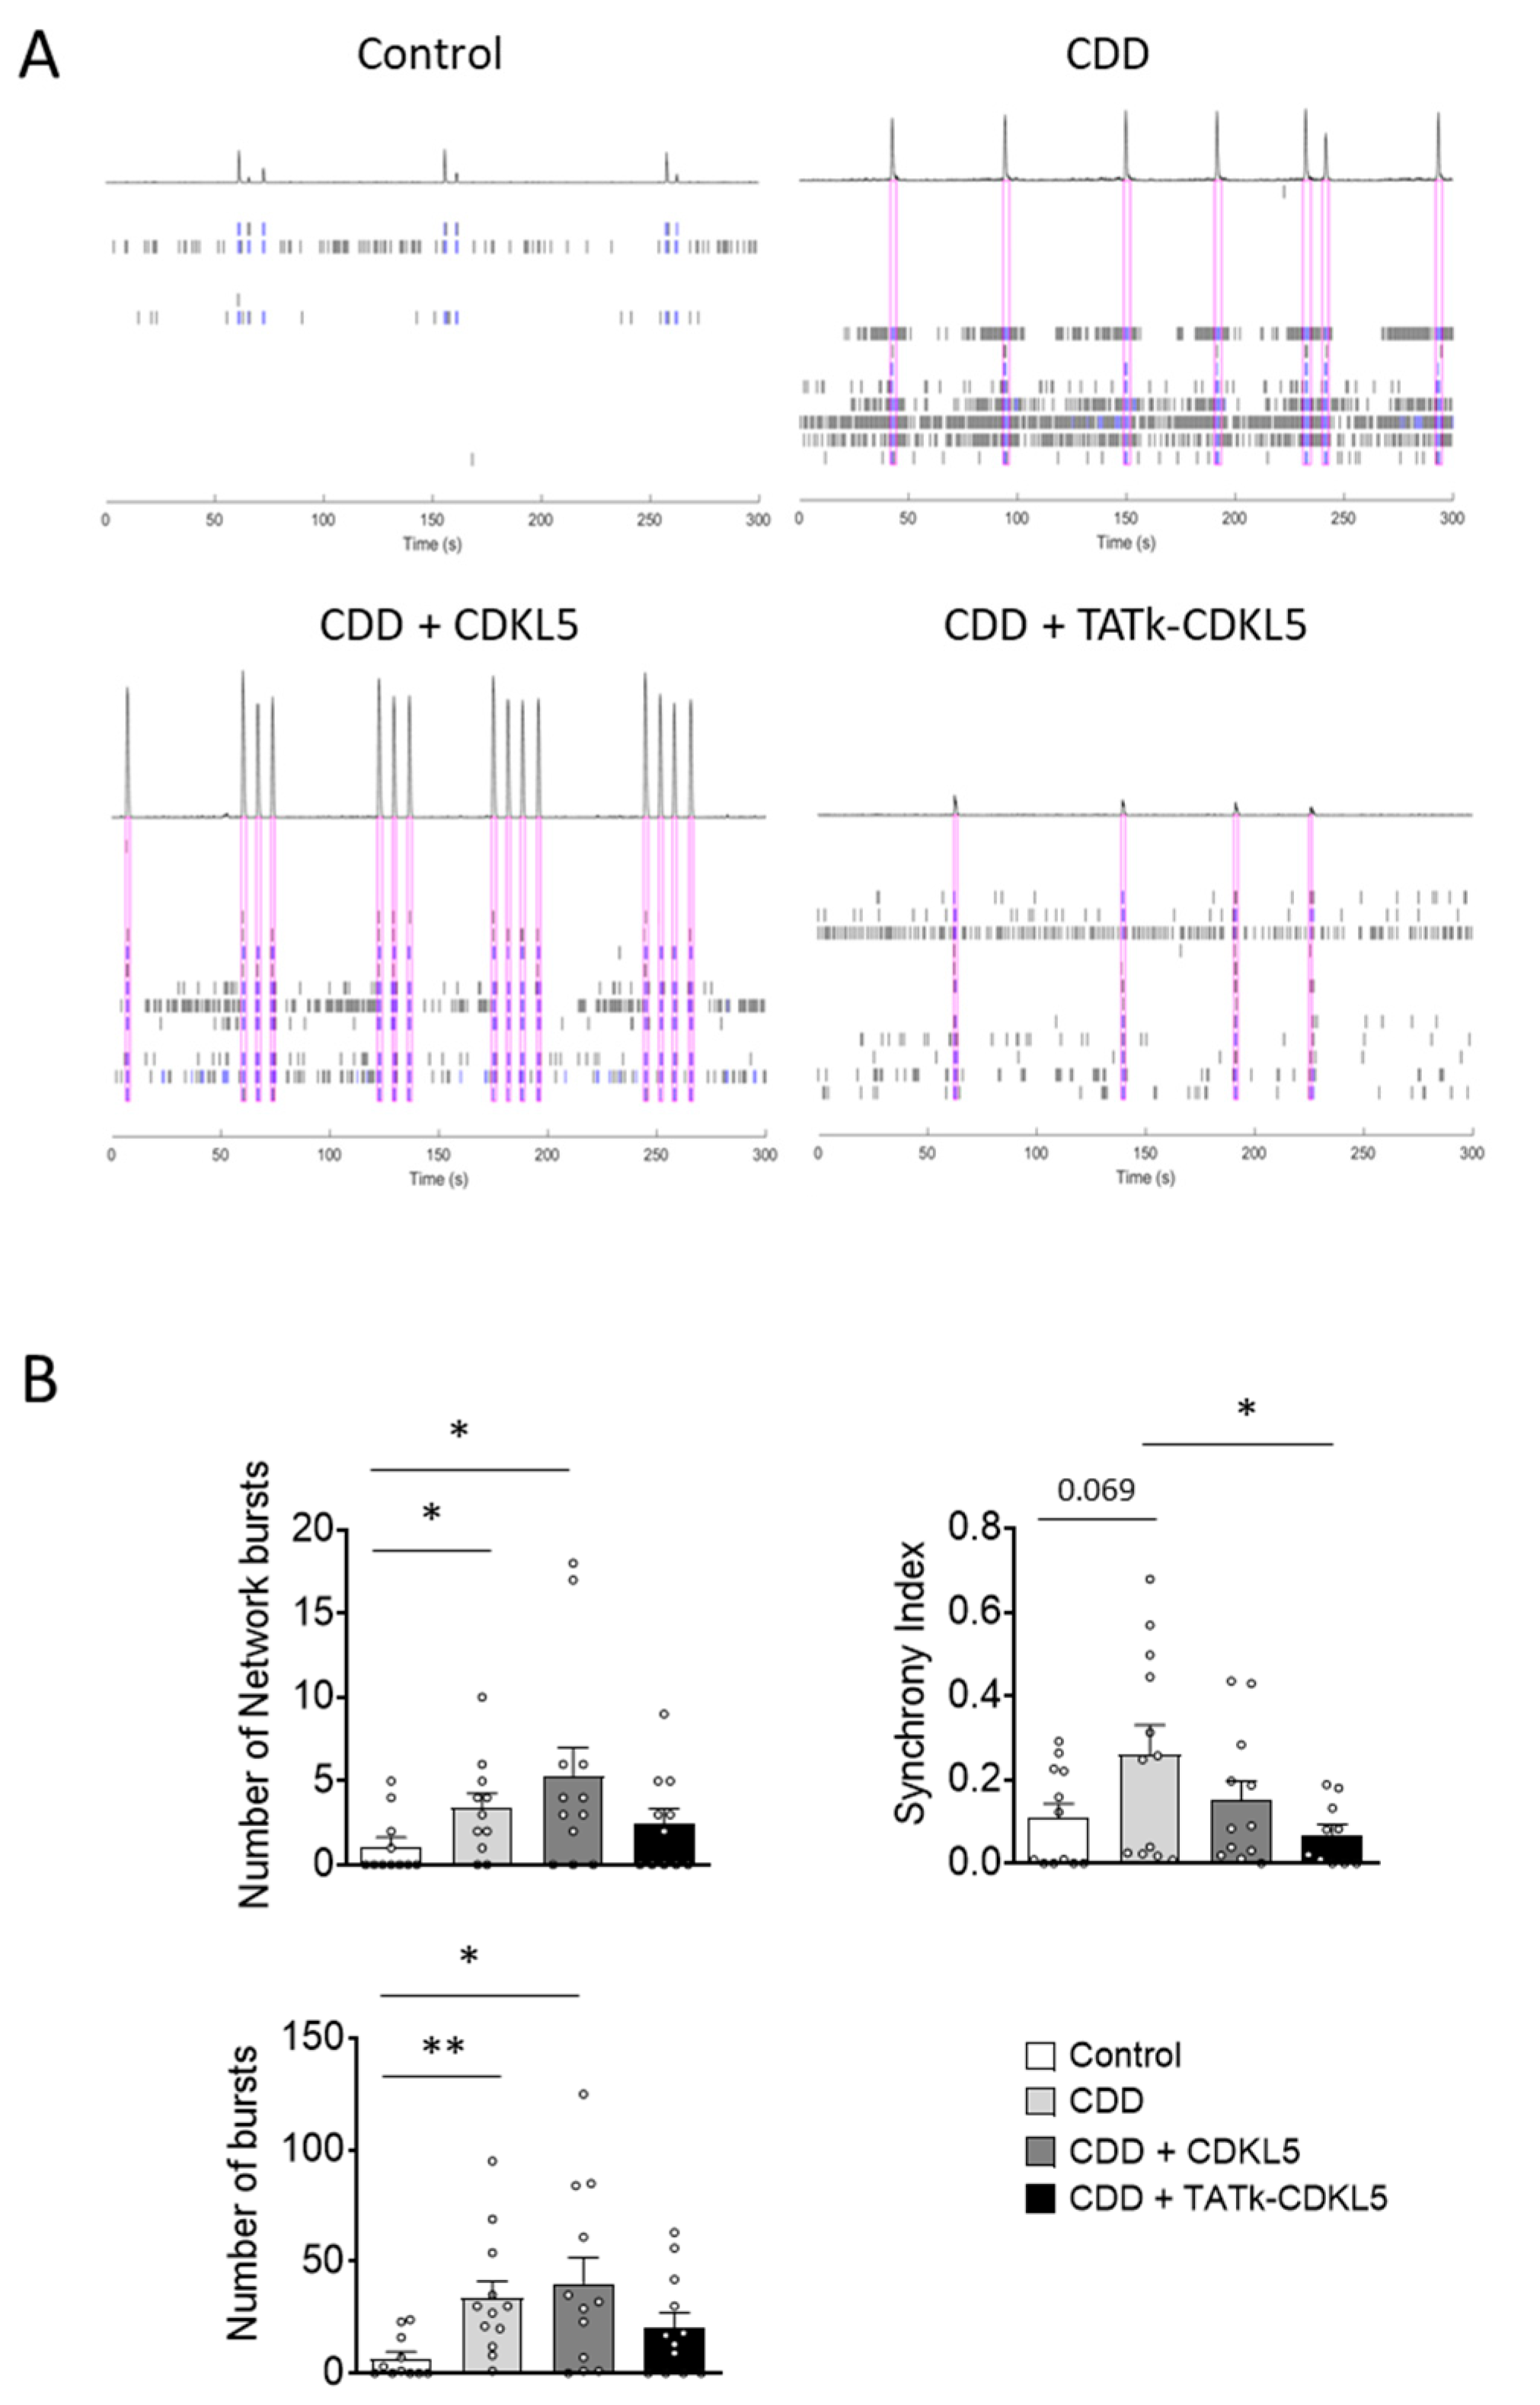
Figure 4.
Cell proliferation in CDD cortical organoids following gene therapy. Evaluation of cell proliferation in CDD and control cortical organoids grown under constant agitation, treated at 11 weeks old with TATk-CDKL5 or CDKL5 gene therapy vectors at a dose of 3.6*1010 vg/org, or vehicle as a control, and collected 3 weeks after treatment for immunostaining. (A-C) Ki-67 immunostaining (Control: n = 6-8, 1 cell line; CDD: n = 6-9, 1 cell line for each condition). Representative fluorescence images (A) and high-magnification images (C) of a cortical organoid slice immunolabeled for proliferation marker Ki-67 (in red) and counterstained for cell nuclei with DAPI (in blue). Dotted lines indicate the manually traced area of the organoid in which signal intensity was quantified. Scale bar = 200 μm (low-magnification); 15 μm (high-magnification). Quantification of Ki-67 intensity normalized to DAPI intensity per organoid area (B). Data are expressed as a percentage of vehicle-treated control organoids. (D,E) Quantification of PCNA-positive cells in cortical organoids treated with gene therapy vectors or vehicle as a control (Control: n = 6-8, 1 cell line; CDD: n = 6-9, 1 cell line for each condition). Graph shows the percentage of PCNA-positive cells on total cells per organoid (D). Representative fluorescence images of cortical organoid slices immunolabeled for proliferation marker PCNA (in red) and counterstained for cell nuclei with DAPI (in blue) (E). Scale bar: 15 μm. (F) Quantification of cell density of cortical organoids expressed as number of cell nuclei per μm2. Data are expressed as the average organoid cell density measured for each experimental replicate. *p < 0.05, **p < 0.01, ***p < 0.001 (Dunn’s test after Kruskal–Wallis test, for data sets in (B); Fisher’s LSD test after one-way ANOVA, for data set in (D) and (F)).
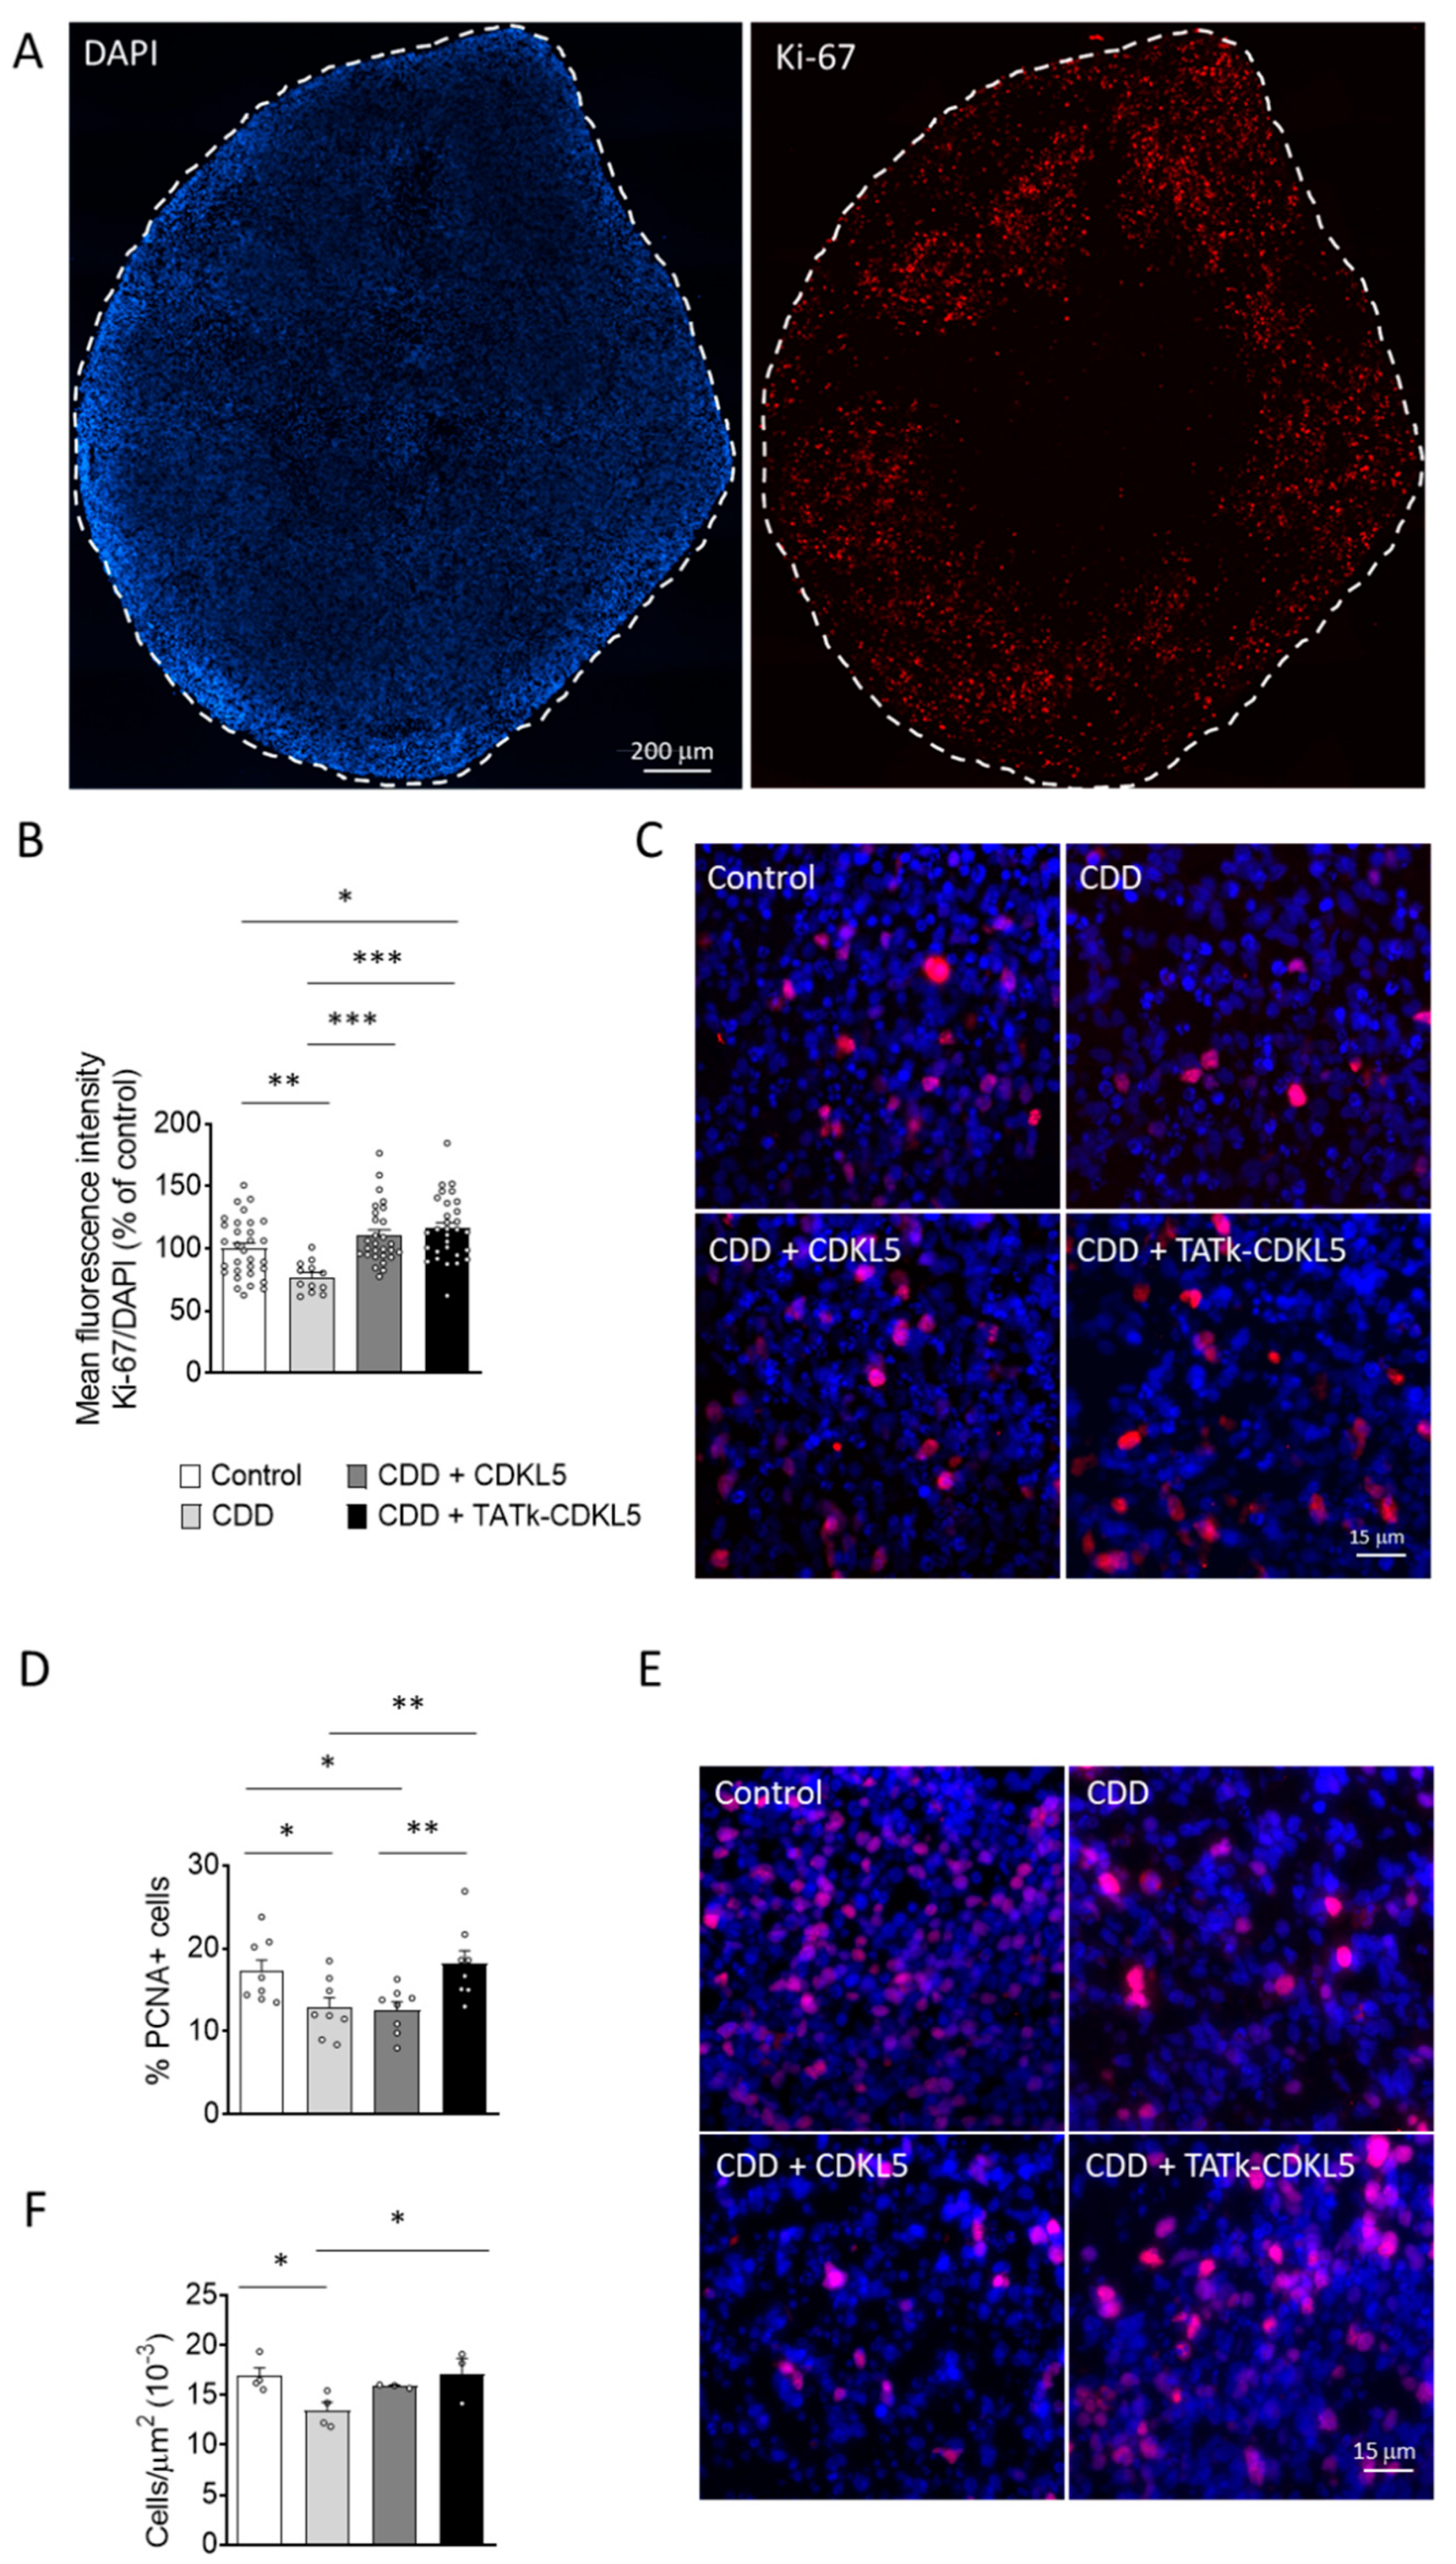
Figure 5.
Neuronal survival in CDD cortical organoids following gene therapy. Evaluation of neuronal survival in CDD and control cortical organoids grown under constant agitation, treated at 11 weeks old with TATk-CDKL5 or CDKL5 gene therapy vectors at a dose of 3.6*1010 vg/org, or vehicle as a control, and collected 3 weeks after treatment for immunostaining. (A) Quantification of Cleaved Caspase-3-positive cells in cortical organoids treated with gene therapy vectors or vehicle as a control (Control: n = 6-8, 1 cell line; CDD: n = 6-9, 1 cell line for each condition). Graph shows the percentage of Caspase-3-positive cells on total cells per organoid. (B) Representative fluorescence images of cortical organoid slices immunolabeled for Cleaved Caspase-3 (in red) and counterstained for cell nuclei with DAPI (in blue). Scale bar: 10 μm. (C) Quantification of apoptotic neurons in cortical organoids treated with gene therapy vectors or vehicle as a control (Control: n = 6-8, 1 cell line; CDD: n = 6-9, 1 cell line for each condition). Graph shows the percentage of total NeuN-positive cells showing apoptotic nuclei. (D) Representative fluorescence images of cortical organoid slices immunolabeled for NeuN (in red) and counterstained for cell nuclei with DAPI (in blue). The yellow arrows indicate apoptotic NeuN-positive cells. Scale bar = 7 μm. (E,F) Quantitative analysis of NeuN (E) and MAP2 (F) intensity, normalized to DAPI intensity in cortical organoids treated with gene therapy vectors or vehicle as a control (Control: n = 6-8, 1 cell line; CDD: n = 6-9, 1 cell line for each condition). Data sets in (A, C, E, F) are expressed as a percentage in comparison to vehicle-treated control organoids. *p < 0.05, **p < 0.01, ***p < 0.001 (Fisher’s LSD test after one-way ANOVA, for data set in (C) and (F); Unpaired t-test after Welch’s ANOVA, for data sets in (A) and (E)).
Disclaimer/Publisher’s Note: The statements, opinions and data contained in all publications are solely those of the individual author(s) and contributor(s) and not of MDPI and/or the editor(s). MDPI and/or the editor(s) disclaim responsibility for any injury to people or property resulting from any ideas, methods, instructions or products referred to in the content. |
© 2025 by the authors. Licensee MDPI, Basel, Switzerland. This article is an open access article distributed under the terms and conditions of the Creative Commons Attribution (CC BY) license (http://creativecommons.org/licenses/by/4.0/).
Copyright: This open access article is published under a Creative Commons CC BY 4.0 license, which permit the free download, distribution, and reuse, provided that the author and preprint are cited in any reuse.


