
Submitted:
17 July 2025
Posted:
17 July 2025
You are already at the latest version
Abstract
Benign paroxysmal positional vertigo (BPPV) is one of the most common vestibular disorders and is characterized by transient but very severe vertigo, which increases the risk of falls, especially in older people. While many risk factors have been reported, there are still contradicting papers and evidence from large-scale studies remains limited. This nationwide, nested case-control study utilized Korean National Health Insurance Service-Health Screening Cohort data to investigate potential risk factors for BPPV. In particular, it examined the association between prior head trauma and BPPV, proposing prior head trauma as a plausible and clinically relevant risk factor. From an initial cohort of 514,866 participants, 29,467 BPPV cases were matched 1:4 with 117,868 controls based on age, sex, income, region, and index date. Conditional logistic regression, with overlap weighting, assessed the risk of BPPV associated with head trauma and other potential factors. Head trauma was modestly more prevalent in the BPPV group (2.29% vs. 1.83%) and was significantly associated with BPPV (adjusted OR 1.28, 95% CI 1.17–1.40, p< 0.001). The association persisted across most subgroups including both demographic and clinical factors except underweight individuals and those with high comorbidity scores. This large-scale analysis reinforces head trauma as a significant risk factor for BPPV, providing population-level evidence that may guide clinical assessment and prevention strategies.
Keywords:
benign paroxysmal positional vertigo
; Risk factor
; Head trauma
; nested case-control study
1. Introduction
Benign paroxysmal positional vertigo (BPPV) is a common vestibular disorder characterized by sudden, brief episodes of vertigo triggered by changes in head position [1]. These vertigo spells can significantly impair daily functioning, causing imbalance, unsteadiness, and an increased risk of falls, which is particularly concerning among older adults [2]. BPPV is reported to account for up to 20-30% of diagnoses in specialized dizziness clinics and contributes to nearly 9% of all patients presenting with vertigo symptoms in primary care settings [3]. The estimated lifetime prevalence of BPPV ranges from 2.4% to 3.2%, making it one of the most frequent causes of peripheral vertigo in clinical practice [4]. Given its high prevalence and potential for causing falls and injury, BPPV imposes a considerable burden both on affected individuals and on healthcare systems.
Understanding the risk factors for disease is crucial in the diagnosis, management and prevention of the disease. Several risk factors for BPPV have been identified in the literature [5]. Advancing age is a well-recognized risk factor, and BPPV has been reported to be approximately twice as common in women as in men [6]. Other conditions associated with BPPV include head trauma, osteoporosis or low bone mineral density, vestibular migraine, prolonged bed rest, and certain metabolic disorders such as diabetes mellitus and hyperlipidemia. A two- to- three-fold increased risk of BPPV was reported in patients with osteopenia or osteoporosis, compared to individuals with normal bone mineral density [7]. These associations suggest that both mechanical and metabolic factors may contribute to the pathophysiology of BPPV.
Nevertheless, the literature presents conflicting results regarding several risk factors for BPPV, and controversies persist about their relative significance. Considering both the prevalence and potential serious consequences of BPPV, including the risk of falls and reduced quality of life, revisiting and clarifying the risk factors of BPPV using large-scale data could provide critical clinical insights.
Given this, our nationwide, large-scale study aims to investigate the associations between various potential risk factors—including head trauma, smoking, BMI, and alcohol consumption—and the occurrence of BPPV. By leveraging comprehensive national health insurance data and employing robust statistical methodologies, especially including exact matching and overlap weighting, we aim to generate more precise, evidence-based insights that could inform clinical decision-making and guide future research.
2. Materials and Methods
2.1. Ethics
The ethics committee of Hallym University (2019-10-023) permitted this study. Written informed consent was waived by the Institutional Review Board. All analyses adhered to the guidelines and regulations of the ethics committee of Hallym University.
2.2. Exposure (Head Trauma)
Head trauma was defined as a diagnosis of ICD-10 codes S00 to S09 by neurologists, neurosurgeons, or emergency medicine doctors at least 2 times, confirmed by head and neck CT evaluations (Claim codes: HA401-HA416, HA441-HA443, HA451-HA453, HA461-HA463, or HA471-HA473)
2.3. Outcome (Benign Paroxysmal Vertigo)
BPPV was selected based on ICD-10 codes (BPPV: H811) by neurologist or otolaryngologist. For the accuracy of diagnosis, we only selected if the participants were visited the clinics ≥ 2 times as the diagnosis of BPPV.
2.4. Study Population and Participant Selection
The detailed description of The Korean National Health Insurance Service-Health Screening Cohort data was described in elsewhere [8].
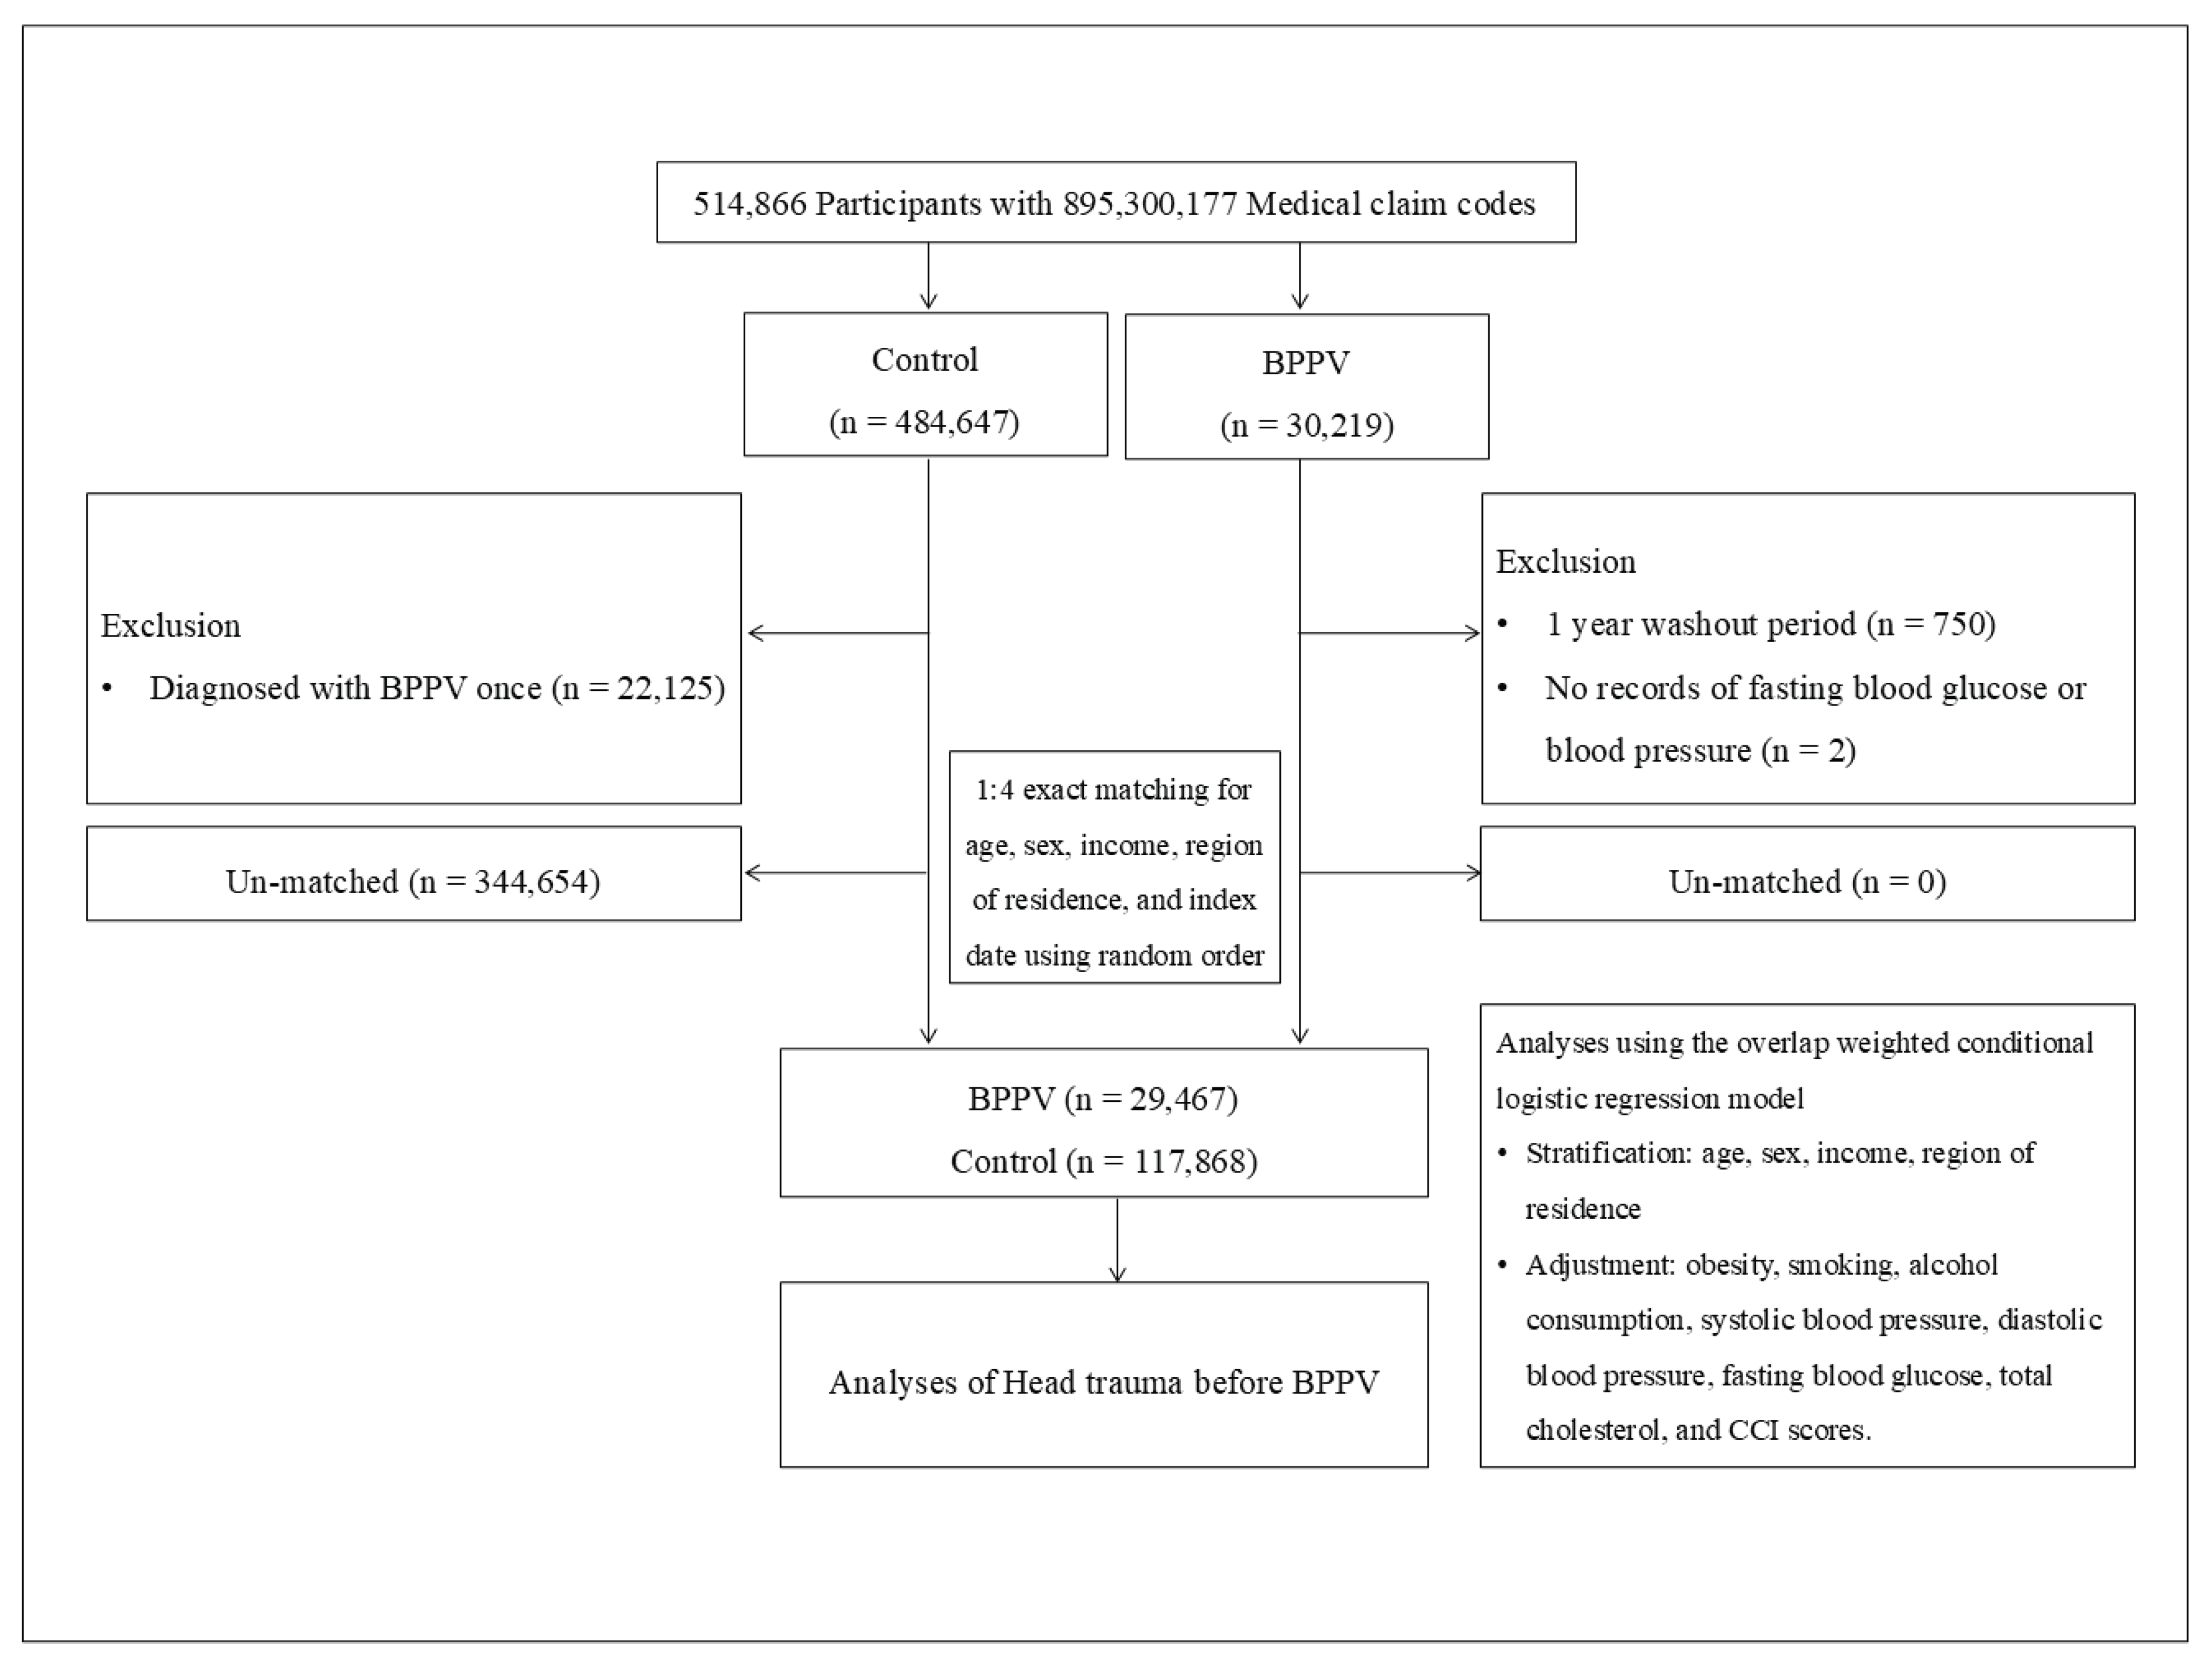
BPPV participants were selected from 514,866 participants with 895,300,177 medical claim codes from 2002 through 2019 (n=30,219). The control group was included if participants were not defined as BPPV from 2002 through 2019 (n=484,647). BPPV participants were excluded for 1 year of washout period (n=750). Control participants were excluded if the participants were diagnosed with BPPV (ICD-10 codes: H811) once (n=22,125). BPPV participants were 1:4 matched with control participants for age, sex, income, and region of residence. To minimize the selection bias, the control participants were sorted using a random number order and were selected from top to bottom. It was assumed that the matched control participants were being evaluated at the same time as each matched BPPV participants (index date).
During matching procedure, 344,654 of control participants were excluded. Finally, 29,467 of BPPV participants were 1:4 matched with 117,868 control participants (Figure 1).
Figure 1.
A schematic illustration of the participant selection process that was used in the present study. Of a total of 514,866 participants, 29,467 of BPPV participants were matched with 117,868 of control participants for age, sex, income, and region of residence.
Figure 1.
A schematic illustration of the participant selection process that was used in the present study. Of a total of 514,866 participants, 29,467 of BPPV participants were matched with 117,868 of control participants for age, sex, income, and region of residence.
2.5. Covariates
Age groups were divided into 5-year intervals: 40- 44…, and 85+ years old. A total of 10 age groups were specified. Income groups were classified as 5 classes (class 1 [lowest income]-5 [highest income]). The region of residence was grouped into urban (Seoul, Busan, Daegu, Incheon, Gwangju, Daejeon, and Ulsan) and rural (Gyeonggi, Gangwon, Chungcheongbuk, Chungcheongnam, Jeollabuk, Jeollanam, Gyeongsangbuk, Gyeongsangnam, and Jeju) areas.
Tobacco smoking was categorized based on the participant’s current smoking status (nonsmoker, past smoker, and current smoker). Alcohol consumption was categorized on the basis of the frequency of alcohol consumption (< 1 time a week and ≥ 1 time a week). Obesity was measured using BMI (body mass index, kg/m2). BMI was categorized as < 18.5 (underweight), ≥ 18.5 to < 23 (normal), ≥ 23 to < 25 (overweight), ≥ 25 to < 30 (obese I), and ≥ 30 (obese II) based on the Asia-Pacific criteria following the Western Pacific Regional Office (WPRO) 2000. Systolic blood pressure (mmHg), diastolic blood pressure (mmHg), fasting blood glucose (mg/dL) and total cholesterol (mg/dL) were measured.
Charlson Comorbidity Index (CCI) has been used widely to measure disease burden using 17 comorbidities [9]. A score was given to each participant depending on the severity and number of diseases. CCI was measured as the continuous variable (0 [no comorbidities] through 29 [multiple comorbidities]).
2.6. Statistical Analyses
The Standardized Difference was used to compare the rate of general characteristics between the BPPV and control groups (Table 1).
To analyze the odds ratios (ORs) with 95% confidence intervals (CIs) of Head trauma for BPPV, conditional logistic regression was used in the matched groups for age, sex, income, and region of residence. In these analyses, Crude model and Overlap weighted model were used (Table 2). The 95% confidence interval (CI) was calculated. Additionally, subgroup analyses according to all covariate variable were performed.
Two-tailed analyses were performed, and significance was defined as P values less than 0.05. The SAS version 9.4 (SAS Institute Inc., Cary, NC, USA) were used for statistical analyses.
3. Results
A total of 514,866 participants were initially included in the study. After applying exclusion criteria, such as single BPPV diagnosis for control group, insufficient washout period, and missing data for fasting blood glucose or blood pressure, the cohort was narrowed down. Subsequently, 1:4 exact matching was performed based on age, sex, income, region of residence, and index date, resulting in a final analysis population of 29,467 participants in the BPPV group and 117,868 in the control group (Figure 1).
Table 1 summarizes the baseline characteristics of the study participants. Slight differences were observed between the BPPV and control groups regarding obesity, smoking status, and alcohol consumption. Among clinical variables, head trauma occurs slightly more often in the BPPV group (2.29% vs. 1.83%), suggesting a potential clinical link. Aside from these variables, the two groups were otherwise very well matched across demographic and clinical factors.
Although the absolute difference in prevalence of head trauma between two groups is small (0.46%), the difference in rates (2.29% vs. 1.83%) is real and biologically and clinically relevant in that head trauma can dislodge otoconia in the inner ear, potentially causing BPPV [10]. Thus, we moved to further investigate whether prior head trauma increases the odds of developing BPPV or not. Logistic regression analysis showed that prior head trauma was significantly associated with increased odds of BPPV by 28% (adjusted odds ratios=1.28, 95% CI 1.17-1.40, P<0.001) (Table 2).
In detail, nearly all subgroups in Table 2 show significantly increased odds of BPPV in patients with history of head trauma except underweight and CCI score=1 subgroups. In detail, the association is consistent across age, sex, income, residence, and clinical subgroup factors including smoking, alcohol consumption, blood pressure, glucose, and cholesterol etc. Especially stronger association with prior head trauma was observed in younger patients (Age<65 years old), people without comorbidities and people with normal/ overweight groups (Table 2).
4. Discussion
Previous studies have reported an association between head trauma and BPPV, suggesting that mechanical displacement of otoconia due to trauma can trigger vertigo episodes [4,11]. Our study provides compelling evidence that prior head trauma is an independent risk factor for BPPV, reinforcing its mechanistic role in the pathophysiology of the condition. Although the prevalence of head trauma was only modestly higher in the BPPV group compared to controls (2.29% vs. 1.83%) as shown in Table 1, this seemingly small difference proved clinically significant. As demonstrated in Table 2, individuals with a history of head trauma before the index date had a significantly increased risk of developing BPPV, with an adjusted odds ratio of approximately 1.28. This association remained consistent across various subgroups defined by age, sex, income, and clinical characteristics, although it appeared somewhat weaker in underweight individuals and those with a higher burden of comorbidities. Taken together, these findings confirm that even a modest increase in head trauma prevalence can translate into a meaningful risk for BPPV, underscoring the importance of considering a history of head trauma during the clinical assessment of patients presenting with vertigo.
Beyond head trauma, we also observed differences between the BPPV and control groups in factors such as smoking status, underweight status, and alcohol consumption. Regarding smoking, the evidence linking it to BPPV remains inconclusive. Some earlier studies have examined smoking as a potential risk factor for vestibular disorders in general, but results have been inconsistent. For instance, Sunami et al. (2006) reported no significant association between smoking and BPPV occurrence or recurrence [12]. Similarly, a meta-analysis did not identify smoking as a significant independent risk factor for BPPV [13], highlighting the need for further large-scale research to clarify any potential relationship. Underweight status has not been directly identified as a risk factor for BPPV in the existing literature. However, it may be indirectly relevant due to its potential association with low bone mineral density, which has been linked to BPPV in previous studies [7]. Similarly, alcohol consumption has not been specifically established as a direct risk factor for BPPV, although it is known to affect balance and vestibular function. Our large-scale, nationwide study provides a valuable opportunity to investigate these potential associations with greater statistical power. Although our data suggest that these lifestyle factors may not be independent risk factors for BPPV, but modest or indirect effects cannot be entirely excluded. These analyses could contribute to filling knowledge gaps in the literature.
This study has several notable strengths. First, we analyzed a large, nationwide cohort, which enhances the statistical power to detect meaningful associations and reduces selection bias inherent in smaller clinical series. Second, our study employed a rigorous 1:4 exact matching approach based on age, sex, income, region of residence, and index date, as well as overlap weighting, a method designed to optimize covariate balance between groups and minimize residual confounding [14]. This methodological strength is evident in the well-matched baseline characteristics shown in Table 1. Third, unlike many previous studies focusing only on small clinical samples, we were able to evaluate head trauma as a potential independent risk factor for BPPV in a general population setting, with comprehensive subgroup analyses to explore effect modification. Collectively, these features provide robust, population-level evidence to clarify the epidemiological relationship between head trauma and BPPV. This comprehensive approach helps clarify the epidemiological association and provides a stronger evidence base for clinicians and researchers
Despite the strengths of our large, nationwide cohort and rigorous matching methods, our study has several limitations. Although head trauma was significantly associated with BPPV, the overall prevalence was low, raising the possibility of rare-event bias, especially in subgroup analyses. The use of claims data introduces potential misclassification of both BPPV and head trauma diagnoses, and residual confounding cannot be entirely excluded [15]. Lastly, the generalizability of our findings to non-Korean populations may be limited due to potential ethnic and healthcare system differences.
In summary, our study adds valuable population-based evidence to the understanding of BPPV, highlighting the role of head trauma as a significant factor associated with its development. By leveraging a large national cohort and robust matching methods, we provide precise risk estimates that may inform clinical assessment and patient counseling. Although future research will likely utilize even larger and more precise datasets, along with more sophisticated statistical techniques, to further clarify these associations, our study provides a meaningful contribution to the current understanding of BPPV, while emphasizing the importance of considering prior head trauma in patients presenting with vertigo symptoms and these insights may ultimately contribute to improved prevention strategies and earlier diagnosis of BPPV.
Author Contributions
Conceptualization, H.G.C. and B.J.K.; methodology, D.M.Y. and B-R.Y.; software, K.H.; validation, D.M.Y. and G.C.; formal analysis, D.M.Y., K.H. and B.J.K.; investigation, G.C. and B-R.Y.; resources, H.G.C.; data curation, K.H.; writing—original draft preparation, D.M.Y. and B.J.K.; writing—review and editing, B-R. Y., J.W.C. and B.J.K.; visualization, D.M.Y.; supervision, H.G.C.; funding acquisition, B.J.K. All authors have read and agreed to the published version of the manuscript.
Funding
This work is supported by the research fund of Chungnam National University (B.J.K.) and the National Research Foundation of Korea (NRF) grant funded by the Korean government (MSIT) (RS-2024-00355990 to B.J.K.). The funding organization did not contribute to the design or conduct of this study, preparation, review, approval, or decision to submit this manuscript for publication.
Conflicts of Interest
The authors declare no conflict of interest.
References
- Lee, G., S. G. Lee, H. S. Park, B. J. Kim, S. J. Choi, and J. W. Choi. “Clinical Characteristics and Associated Factors of Canal Switch in Benign Paroxysmal Positional Vertigo.” J Vestib Res 29, no. 5 (2019): 253-60. [CrossRef]
- Pauwels, S., N. Lemkens, W. Lemmens, K. Meijer, P. Meyns, R. V. D. Berg, and J. Spildooren. “The Importance of Frailty in Older Adults with Benign Paroxysmal Positioning Vertigo.” J Neurol Phys Ther 49, no. 2 (2025): 99-107. [CrossRef]
- Neuhauser, H. K. “Epidemiology of Vertigo.” Curr Opin Neurol 20, no. 1 (2007): 40-6. [CrossRef]
- von Brevern, M., A. Radtke, F. Lezius, M. Feldmann, T. Ziese, T. Lempert, and H. Neuhauser. “Epidemiology of Benign Paroxysmal Positional Vertigo: A Population Based Study.” J Neurol Neurosurg Psychiatry 78, no. 7 (2007): 710-5. [CrossRef]
- Alolayet, H., and L. Murdin. “Benign Paroxysmal Positional Vertigo a Systematic Review of the Effects of Comorbidities.” Front Neurol 16 (2025): 1595693. [CrossRef]
- Kim, J. S., and D. S. Zee. “Clinical Practice. Benign Paroxysmal Positional Vertigo.” N Engl J Med 370, no. 12 (2014): 1138-47.
- Jeong, S. H., S. H. Choi, J. Y. Kim, J. W. Koo, H. J. Kim, and J. S. Kim. “Osteopenia and Osteoporosis in Idiopathic Benign Positional Vertigo.” Neurology 72, no. 12 (2009): 1069-76. [CrossRef]
- Yoo, D. M., H. S. Kang, J. H. Kim, J. H. Kim, H. G. Choi, K. M. Han, N. Y. Kim, W. J. Bang, and M. J. Kwon. “Reduced Risk of Benign Paroxysmal Positional Vertigo in Patients with Parkinson’s Disease: A Nationwide Korean Cohort Study.” Healthcare (Basel) 13, no. 10 (2025). [CrossRef]
- Kim, C. H., J. H. Hong, C. W. La, and J. W. Kim. “Unplanned Emergency Room Visits within 30 and 90 Days after Osteoporotic Hip Fracture Surgery: A Comprehensive Risk Factor Analysis.” Bone 199 (2025): 117576. [CrossRef]
- Bhattacharyya, N., S. P. Gubbels, S. R. Schwartz, J. A. Edlow, H. El-Kashlan, T. Fife, J. M. Holmberg, K. Mahoney, D. B. Hollingsworth, R. Roberts, M. D. Seidman, R. W. Steiner, B. T. Do, C. C. Voelker, R. W. Waguespack, and M. D. Corrigan. “Clinical Practice Guideline: Benign Paroxysmal Positional Vertigo (Update).” Otolaryngol Head Neck Surg 156, no. 3_suppl (2017): S1-S47. [CrossRef]
- Fife, T. D., D. J. Iverson, T. Lempert, J. M. Furman, R. W. Baloh, R. J. Tusa, T. C. Hain, S. Herdman, M. J. Morrow, G. S. Gronseth, and American Academy of Neurology Quality Standards Subcommittee. “Practice Parameter: Therapies for Benign Paroxysmal Positional Vertigo (an Evidence-Based Review): Report of the Quality Standards Subcommittee of the American Academy of Neurology.” Neurology 70, no. 22 (2008): 2067-74.
- Sunami, K., R. Tochino, Y. Tokuhara, H. Yamamoto, S. Tomita, N. Koshimo, and H. Yamane. “Effects of Cigarettes and Alcohol Consumption in Benign Paroxysmal Positioning Vertigo.” Acta Otolaryngol 126, no. 8 (2006): 834-8. [CrossRef]
- Chen, J., S. Zhang, K. Cui, and C. Liu. “Risk Factors for Benign Paroxysmal Positional Vertigo Recurrence: A Systematic Review and Meta-Analysis.” J Neurol 268, no. 11 (2021): 4117-27. [CrossRef]
- Li, F., L. E. Thomas, and F. Li. “Addressing Extreme Propensity Scores Via the Overlap Weights.” Am J Epidemiol 188, no. 1 (2019): 250-57. [CrossRef]
- Griffiths, R. I., C. D. O’Malley, R. J. Herbert, and M. D. Danese. “Misclassification of Incident Conditions Using Claims Data: Impact of Varying the Period Used to Exclude Pre-Existing Disease.” BMC Med Res Methodol 13 (2013): 32. [CrossRef]

Table 1.
General Characteristics of Participants.
| Characteristics | Total participants | |||
| BPPV | Control | Standardized Difference | ||
| Age (years old) (n, %) | 0.00 | |||
| 40-44 | 170 (0.60) | 680 (0.60) | ||
| 45-49 | 1,398 (4.90) | 5,592 (4.90) | ||
| 50-54 | 3,374 (11.83) | 13,496 (11.83) | ||
| 55-59 | 5,070 (17.78) | 20,280 (17.78) | ||
| 60-64 | 5,283 (18.53) | 21,132 (18.53) | ||
| 65-69 | 4,913 (17.23) | 19,652 (17.23) | ||
| 70-74 | 4,000 (14.03) | 16,000 (14.03) | ||
| 75-79 | 2,743 (9.62) | 10,972 (9.62) | ||
| 80-84 | 1,192 (4.18) | 4,768 (4.18) | ||
| 85+ | 368 (1.29) | 1,472 (1.29) | ||
| Sex (n, %) | 0.00 | |||
| Male | 10,502 (36.83) | 42,008 (36.83) | ||
| Female | 18,009 (63.17) | 72,036 (63.17) | ||
| Income (n, %) | 0.00 | |||
| 1 (lowest) | 4,621 (16.21) | 18,484 (16.21) | ||
| 2 | 3,422 (12.00) | 13,688 (12.00) | ||
| 3 | 4,225 (14.82) | 16,900 (14.82) | ||
| 4 | 6,091 (21.36) | 24,364 (21.36) | ||
| 5 (highest) | 10,152 (35.61) | 40,608 (35.61) | ||
| Region of residence (n, %) | 0.00 | |||
| Urban | 12,937 (45.38) | 51,748 (45.38) | ||
| Rural | 15,574 (54.62) | 62,296 (54.62) | ||
| Obesity† (n, %) | 0.09 | |||
| Underweight | 568 (1.99) | 2,951 (2.59) | ||
| Normal | 9,458 (33.17) | 40,057 (35.12) | ||
| Overweight | 8,035 (28.18) | 30,634 (26.86) | ||
| Obese I | 9,509 (33.35) | 36,386 (31.91) | ||
| Obese II | 941 (3.30) | 4,016 (3.52) | ||
| Smoking status (n, %) | 0.14 | |||
| Nonsmoker | 22,509 (78.95) | 87,659 (76.86) | ||
| Past smoker | 3,612 (12.67) | 13,077 (11.47) | ||
| Current smoker | 2,390 (8.38) | 13,308 (11.67) | ||
| Alcohol consumption (n, %) | 0.07 | |||
| <1 time a week | 22,433 (78.68) | 86,328 (75.70) | ||
| ≥1 time a week | 6,078 (21.32) | 27,716 (24.30) | ||
| Systolic blood pressure (Mean, SD) | 126.26 (15.88) | 126.82 (16.53) | 0.04 | |
| Diastolic blood pressure (Mean, SD) | 77.38 (10.10) | 77.68 (10.45) | 0.03 | |
| Fasting blood glucose (Mean, SD) | 100.55 (25.63) | 101.65 (28.34) | 0.04 | |
| Total cholesterol (Mean, SD) | 198.69 (38.57) | 199.07 (38.89) | 0.01 | |
| CCI score (Mean, SD) | 0.98 (1.58) | 0.95 (1.65) | 0.02 | |
| Head trauma (n, %) | 653 (2.29) | 2,082 (1.83) | 0.04 | |
Abbreviations: CCI, Charlson comorbidity index;. † Obesity (BMI, body mass index, kg/m2) was categorized as < 18.5 (underweight), ≥ 18.5 to < 23 (normal), ≥ 23 to < 25 (overweight), ≥ 25 to < 30 (obese I), and ≥ 30 (obese II).
Table 2.
Crude and adjusted odd ratios of Head trauma for BPPV when participants are diagnosed with Head trauma before index date.
Table 2.
Crude and adjusted odd ratios of Head trauma for BPPV when participants are diagnosed with Head trauma before index date.
| Characteristics |
N of BPPV |
N of Control |
Odd ratios for BPPV (95% confidence interval) | |||||
| (exposure/total, %) | (exposure/total, %) | Crude | P-value | Overlap weighted model † | P-value | |||
| Total (n = 142,555) | ||||||||
| No Head trauma | 27,858/28,511 (97.7%) | 111,962/114,044 (98.2%) | 1 1 |
1 | ||||
| Head trauma | 653/28,511 (2.3%) | 2,082/114,044 (1.8%) | 1.26 (1.15-1.38) | <0.001* | 1.28 (1.17-1.40) | <0.001* | ||
| Age < 65 years old (n = 76,475) | ||||||||
| No Head trauma | 15,033/15,295 (98.3%) | 60,431/61,180 (98.8%) | 1 1 |
1 | ||||
| Head trauma | 262/15,295 (1.7%) | 749/61,180 (1.2%) | 1.41 (1.22-1.62) | <0.001* | 1.43 (1.24-1.65) | <0.001* | ||
| Age ≥ 65 years old (n = 66,080) | ||||||||
| No Head trauma | 12,825/13,216 (97.0%) | 51,531/52,864 (97.5%) | 1 | 1 | ||||
| Head trauma | 391/13,216 (3.0%) | 1,333/52,864 (2.5%) | 1.18 (1.05-1.32) | 0.005* | 1.20 (1.07-1.34) | 0.002* | ||
| Men (n = 52,510) | ||||||||
| No Head trauma | 10,212/10,502 (97.2%) | 41,039/42,008 (97.7%) | 1 | 1 | ||||
| Head trauma | 290/10,502 (2.8%) | 969/42,008 (2.3%) | 1.20 (1.05-1.37) | 0.007* | 1.23 (1.08-1.41) | 0.002* | ||
| Women (n = 90,045) | ||||||||
| No Head trauma | 17,646/18,009 (98.0%) | 70,923/72,036 (98.5%) | 1 | |||||
| Head trauma | 363/18,009 (2.0%) | 1,113/72,036 (1.6%) | 1.31 (1.16-1.48) | <0.001* | 1.32 (1.17-1.49) | <0.001* | ||
| Low income (n = 61,340) | ||||||||
| No Head trauma | 11,977/12,268 (97.6%) | 48,124/49,072 (98.1%) | 1 | 1 | ||||
| Head trauma | 291/12,268 (2.4%) | 948/49,072 (1.9%) | 1.23 (1.08-1.41) | 0.002* | 1.26 (1.10-1.44) | 0.001* | ||
| High income (n = 81,215) | ||||||||
| No Head trauma | 15,881/16,243 (97.8%) | 63,838/64,972 (98.3%) | 1 | 1 | ||||
| Head trauma | 362/16,243 (2.2%) | 1,134/64,972 (1.8%) | 1.28 (1.14-1.45) | <0.001* | 1.30 (1.15-1.46) | <0.001* | ||
| Urban residents (n = 64,685) | ||||||||
| No Head trauma | 12,667/12,937 (97.9%) | 50,878/51,748 (98.3%) | 1 | 1 | ||||
| Head trauma | 270/12,937 (2.1%) | 870/51,748 (1.7%) | 1.25 (1.09-1.43) | 0.002* | 1.27 (1.11-1.46) | 0.001* | ||
| Rural residents (n = 77,870) | ||||||||
| No Head trauma | 15,191/15,574 (97.5%) | 61,084/62,296 (98.1%) | 1 | 1 | ||||
| Head trauma | 383/15,574 (2.5%) | 1,212/62,296 (2.0%) | 1.27 (1.13-1.43) | <0.001* | 1.28 (1.14-1.44) | <0.001* | ||
| Underweight (n = 3,519) | ||||||||
| No Head trauma | 558/568 (98.2%) | 2,874/2,951 (97.4%) | 1 | 1 | ||||
| Head trauma | 10/568 (1.8%) | 77/2,951 (2.6%) | 0.67 (0.34-1.30) | 0.237 | 0.69 (0.35-1.35) | 0.274 | ||
| Normal weight (n = 49,515) | ||||||||
| No Head trauma | 9,226/9,458 (97.6%) | 39,275/40,057 (98.1%) | 1 | 1 | ||||
| Head trauma | 232/9,458 (2.5%) | 782/40,057 (2.0%) | 1.26 (1.09-1.46) | 0.002* | 1.29 (1.11-1.50) | 0.001* | ||
| Overweight (n = 38,669) | ||||||||
| No Head trauma | 7,847/8,035 (97.7%) | 30,104/30,634 (98.3%) | 1 | 1 | ||||
| Head trauma | 188/8,035 (2.3%) | 530/30,634 (1.7%) | 1.36 (1.15-1.61) | <0.001* | 1.38 (1.16-1.63) | <0.001* | ||
| Obese (n = 50,852) | ||||||||
| No Head trauma | 10,227/10,450 (97.9%) | 39,709/40,402 (98.3%) | 1 | 1 | ||||
| Head trauma | 223/10,450 (2.1%) | 693/40,402 (1.7%) | 1.25 (1.07-1.46) | 0.004* | 1.25 (1.07-1.45) | 0.001* | ||
| Non-smoker (n = 110,168) | ||||||||
| No Head trauma | 22,026/22,509 (97.9%) | 86,165/87,659 (98.3%) | 1 | 1 | ||||
| Head trauma | 483/22,509 (2.2%) | 1,494/87,659 (1.7%) | 1.26 (1.14-1.40) | <0.001* | 1.26 (1.14-1.40) | <0.001* | ||
| Past smoker and current smoker (n = 32,387) | ||||||||
| No Head trauma | 5,832/6,002 (97.2%) | 25,797/26,385 (97.8%) | 1 | 1 | ||||
| Head trauma | 170/6,002 (2.8%) | 588/26,385 (2.2%) | 1.28 (1.08-1.52) | 0.005* | 1.32 (1.11-1.57) | 0.002* | ||
| Alcohol consumption < 1 time a week (n = 108,761) | ||||||||
| No Head trauma | 21,964/22,433 (97.9%) | 84,908/86,328 (98.4%) | 1 | 1 | ||||
| Head trauma | 469/22,433 (2.1%) | 1,420/86,328 (1.6%) | 1.28 (1.15-1.42) | <0.001* | 1.27 (1.14-1.41) | <0.001* | ||
| Alcohol consumption ≥ 1 time a week (n = 33,794) | ||||||||
| No Head trauma | 5,894/6,078 (97.0%) | 27,054/27,716 (97.6%) | 1 | 1 | ||||
| Head trauma | 184/6,078 (3.0%) | 662/27,716 (2.4%) | 1.28 (1.08-1.51) | 0.004* | 1.30 (1.10-1.53) | 0.002* | ||
| SBP < 140 mmHg and DBP < 90 mmHg (n = 39,816) | ||||||||
| No Head trauma | 7,845/8,020 (97.8%) | 31,236/31,796 (98.2%) | 1 | 1 | ||||
| Head trauma | 175/8,020 (2.2%) | 560/31,796 (1.8%) | 1.24 (1.05-1.48) | 0.013* | 1.26 (1.06-1.50) | 0.009* | ||
| SBP ≥ 140 mmHg or DBP ≥ 90 mmHg (n = 102,739) | ||||||||
| No Head trauma | 20,013/20,491 (97.7%) | 80,726/82,248 (98.2%) | 1 | 1 | ||||
| Head trauma | 478/20,491 (2.3%) | 1,522/82,248 (1.9%) | 1.27 (1.14-1.41) | <0.001* | 1.28 (1.16-1.43) | <0.001* | ||
| Fasting blood glucose < 100 mg/dL (n = 86,876) | ||||||||
| No Head trauma | 17,144/17,516 (97.9%) | 68,224/69,360 (98.4%) | 1 | 1 | ||||
| Head trauma | 372/17,516 (2.1%) | 1,136/69,360 (1.6%) | 1.30 (1.16-1.47) | <0.001* | 1.32 (1.17-1.48) | <0.001* | ||
| Fasting blood glucose ≥ 100 mg/dL (n = 55,679) | ||||||||
| No Head trauma | 10,714/10,995 (97.4%) | 43,738/44,684 (97.9%) | 1 | 1 | ||||
| Head trauma | 281/10,995 (2.6%) | 946/44,684 (2.1%) | 1.21 (1.06-1.39) | 0.005* | 1.23 (1.07-1.41) | 0.003* | ||
| Total cholesterol < 200mg/dL (n = 75,303) | ||||||||
| No Head trauma | 14,716/15,096 (97.5%) | 58,997/60,207 (98.0%) | 1 | 1 | ||||
| Head trauma | 380/15,096 (2.5%) | 1,210/60,207 (2.0%) | 1.26 (1.12-1.41) | <0.001* | 1.29 (1.15-1.45) | <0.001* | ||
| Total cholesterol ≥ 200mg/dL (n = 67,252) | ||||||||
| No Head trauma | 13,142/13,415 (98.0%) | 52,965/53,837 (98.4%) | 1 | 1 | ||||
| Head trauma | 273/13,415 (2.0%) | 872/53,837 (1.6%) | 1.26 (1.10-1.45) | 0.001* | 1.26 (1.10-1.45) | 0.001* | ||
| CCI scores = 0 (n = 85,370) | ||||||||
| No Head trauma | 15,718/16,017 (98.1%) | 68,432/69,353 (98.7%) | 1 | 1 | ||||
| Head trauma | 299/16,017 (1.9%) | 921/69,353 (1.3%) | 1.41 (1.24-1.61) | <0.001* | 1.43 (1.25-1.63) | <0.001* | ||
| CCI score = 1 (n = 24,420) | ||||||||
| No Head trauma | 5,532/5,683 (97.3%) | 18,290/18,737 (97.6%) | 1 | 1 | ||||
| Head trauma | 151/5,683 (2.7%) | 447/18,737 (2.4%) | 1.12 (0.93-1.35) | 0.247 | 1.16 (0.96-1.40) | 0.131 | ||
| CCI score ≥ 2 (n = 32,765) | ||||||||
| No Head trauma | 6,608/6,811 (97.0%) | 25,240/25,954 (97.3%) | 1 | 1 | ||||
| Head trauma | 203/6,811 (3.0%) | 714/25,954 (2.8%) | 1.09 (0.93-1.27) | 0.307 | 1.13 (0.96-1.33) | 0.001* | ||
Abbreviations: CCI, Charlson Comorbidity Index; SBP, Systolic blood pressure; DBP, Diastolic blood pressure; * Conditional or unconditional logistic regression analysis, Significance at P < 0.05 † adjusted for obesity, smoking, alcohol consumption, systolic blood pressure, diastolic blood pressure, fasting blood glucose, total cholesterol, and CCI scores.
Disclaimer/Publisher’s Note: The statements, opinions and data contained in all publications are solely those of the individual author(s) and contributor(s) and not of MDPI and/or the editor(s). MDPI and/or the editor(s) disclaim responsibility for any injury to people or property resulting from any ideas, methods, instructions or products referred to in the content. |
© 2025 by the authors. Licensee MDPI, Basel, Switzerland. This article is an open access article distributed under the terms and conditions of the Creative Commons Attribution (CC BY) license (http://creativecommons.org/licenses/by/4.0/).
Copyright: This open access article is published under a Creative Commons CC BY 4.0 license, which permit the free download, distribution, and reuse, provided that the author and preprint are cited in any reuse.


