
Submitted:
17 July 2025
Posted:
17 July 2025
You are already at the latest version
Abstract
Urban agglomerations underpin regional economic growth and sustainability transitions, yet the spatial heterogeneity and drivers of land use intensity (LUI) remain insufficiently understood. Here, we develop a high-resolution (1 km hexagonal grid) framework to map LUI dynamics and identify nonlinear drivers in the Guanzhong Plain Urban Agglomeration, China, over 2000-2020. Composite indices for human settlement (HS), cropland (CS), and forest (FS) subsystems were derived from multi‐indicator metrics, and an XGBoost-SHAP workflow was employed to quantify the relative importance, threshold effects, and interactions of eleven natural, socioeconomic, urban–rural, and locational variables. HS experienced marked intensification and spatial expansion driven predominantly by economic growth and urbanization. CS transitioned from high- to moderate-intensity cultivation in response to agricultural policy reforms and shifting from biophysical to anthropogenic controls. FS high-intensity zones contracted, reflecting the success of ecological restoration and increasing influence of precipitation and spatial isolation. Urban-rural gradient analyses revealed that HS LUI declines radially from the core, CS peaks at the fringe, and FS intensifies toward rural and mountainous areas. Explainable machine learning illuminated key nonlinearities-such as the inverted U-shaped relationship between GDP per capita and HS LUI-and critical thresholds in population density and proximity effects. These insights advocate for adaptive, subsystem-specific governance: optimizing urban growth boundaries, integrating urban-rural planning, enforcing cropland protection, and tailoring forest management. Our high‐resolution, data‐driven framework offers a transferable basis for policy innovation and sustainable land‐use planning in rapidly urbanizing contexts.
Keywords:
land use intensity
; urban agglomeration
; urban–rural gradient
; spatiotemporal dynamics
; explainable machine learning
; sustainable land management
; Guanzhong plain urban agglomeration
1. Introduction
Urban agglomerations have become the predominant spatial frameworks for national economic advancement and global competitiveness, accommodating more than half of the global population and generating nearly 80% of the world’s gross domestic product [1,2]. As central engines of regional growth and the principal modality of contemporary urbanization, shifts in land use patterns and land use intensity (LUI) within these regions have far-reaching consequences for regional sustainability, ecological integrity, and food security at the national scale [3]. LUI is not only indicative of land use type but also quantifies the magnitude of anthropogenic impacts on natural ecosystems within specific land cover classes, making it a critical metric for the assessment of land use sustainability [4].
The dynamics of LUI are determined by a complex interaction of multiple drivers operating across spatial and temporal scales. These include natural endowments (such as soil quality and topography), which constrain or facilitate land use [5]; socioeconomic factors (notably population growth and economic activity), which promote intensification [6]; locational attributes (for example, proximity to transportation networks and urban centers), which affect accessibility and development prospects [7]; and policy interventions (such as land use regulation and urban planning), which steer the spatiotemporal evolution of LUI [8].
While extensive scholarship exists on land use/land cover change (LUCC) and its determinants-including natural, socioeconomic, technological, and policy drivers [9,10]-there remains a critical need for more refined and system-specific research into LUI, particularly concerning the causal mechanisms and differentiated effects of drivers across urban, agricultural, and forest subsystems [9,10]. The inherently multidimensional and complex nature of LUI requires attention not only to land cover transitions but also to the nuanced variations in land management intensity within the same cover type [9]. For instance, urban LUI is reflected not only by spatial expansion but also by transformations in building density, floor area ratio, population capacity, and the intensity of economic activities [11]. Similarly, agricultural LUI is assessed through indices such as cropping intensity, agrochemical application, and mechanization [12]; while forest LUI relates to silvicultural practices, logging frequency, and forest management regimes [13]. Recognizing these subtleties necessitates moving beyond land cover change per se to investigate the underlying drivers, resource efficiencies, and input–output relationships of land use intensification [10].
Traditional methods for analyzing LUI drivers, including linear and logistic regression [14], provide only limited explanatory power in the face of the high-dimensional, multivariate, nonlinear, and threshold-dominated character of land systems [15]. These models are often predicated on strict assumptions such as linearity and variable independence [16], which may be ill-suited to capturing the intricate interactions and nonlinear impacts of diverse drivers on LUI [17].
The rapid advancement of artificial intelligence and the availability of large-scale datasets have prompted the adoption of machine learning approaches in land use change research, offering strong capabilities for modeling nonlinear relationships and managing data complexity [18]. Of particular note is the XGBoost-SHAP framework, which has shown considerable promise for elucidating the internal mechanisms of complex systems [19]. However, its application in LUI driver analysis remains nascent [20], and there is a lack of established frameworks for systematically investigating land use intensity within distinct land subsystems (urban, agricultural, forest) [21].
The Guanzhong Plain Urban Agglomeration (GPUA)-a nationally strategic cluster situated at the intersection of the Loess Plateau and Qinling Mountains and central to both the Belt and Road Initiative and China’s Western Development Strategy-has experienced rapid yet uneven growth in recent decades [22]. Intensive human activities in the GPUA have precipitated acute tensions between land development and ecological conservation [23], underscoring the urgent need for scientifically informed and adaptive land system governance [24,25]. Neglecting LUI in this context risks an incomplete understanding of human–environment interactions and may result in ineffective or maladaptive land management policies [26].
To address these research gaps, this study advances a 1 km hexagonal grid LUI assessment framework for human settlement, cropland, and forest systems in the GPUA over the period 2000–2020. This framework is coupled with an XGBoost-SHAP analytical approach to elucidate the nonlinear and threshold effects of a diverse set of drivers (see Figure 1). The specific aims are: (1) to map the spatiotemporal evolution of subsystem LUI across the GPUA; (2) to identify and interpret dominant drivers and their heterogeneous effects through explainable machine learning; and (3) to provide policy recommendations for differentiated, efficient, and sustainability-oriented land management in inland urban agglomerations.
2. Materials and Methods
2.1. Study Area
The Guanzhong Plain Urban Agglomeration (GPUA), recognized as the second-largest urban agglomeration in western China, is situated between 33.35°N–36.72°N and 104.57°E–112.22°E [27] (Figure 2). The GPUA spans three provinces-Shaanxi, Gansu, and Shanxi-with Xi’an as its core city, encompassing eleven municipalities: Xi’an, Baoji, Shangluo, Xianyang, Weinan, Tongchuan, Qingyang, Pingliang, Tianshui, Linfen, and Yuncheng.
Geographically, the GPUA occupies the lower reaches of the Yellow River Basin, characterized by a topography that descends from higher elevations in the west to lower elevations in the east. Its expansive central plain forms a distinctive “U”-shaped basin, surrounded by mountains on three sides and open to the east [28]. The region features diverse landforms, including alluvial plains, loess tablelands, and piedmont alluvial fans. The Wei River, the region’s principal watercourse, traverses the agglomeration, providing favorable hydrological conditions for both agriculture and urban development [29].
Climatically, the GPUA is classified as a warm temperate, semi-humid to semi-arid monsoon region, with mean annual temperatures ranging from 9°C to 13°C and annual precipitation between 500 and 800 mm-most of which falls between July and September [30]. The area exhibits pronounced seasonal variation, characterized by hot, wet summers and cold, dry winters.
As of 2020, the permanent resident population of the GPUA reached 42.35 million, accounting for 2.79% of the national population [31]. In the same year, the region’s urbanization rate was 60.06%. The GPUA covers a total land area of 107,100 km² (1.12% of China’s total land area) and reported a gross domestic product (GDP) of 2.19 trillion yuan, equivalent to 2.20% of the national GDP.
2.2. Analytical Framework and Data
2.2.1. Subsystem Classification
To assess land use intensity (LUI) within the GPUA, we developed an analytical framework based on a 1 km hexagonal grid. Compared to traditional square grids, the hexagonal tessellation ensures greater spatial uniformity, minimizing edge effects and spatial sampling bias [32]. Each hexagonal cell was classified into one of three principal land subsystems based on the dominant land cover type: Human-Settlement System (HS), Cropland System (CS), and Forest System (FS). Land cover data for the years 2000, 2010, and 2020 were obtained from the China Land Cover Dataset (CLCD) [33].
The HS includes cells primarily covered by impervious surfaces, representing areas of concentrated human habitation and intensive anthropogenic activity [34]. The CS consists of cells predominantly occupied by cropland, crucial for food production and rural livelihoods [35]. The FS comprises cells mainly covered by forests, shrublands, or grasslands, serving essential ecosystem functions such as landscape provision, recreation, and environmental enhancement [36].
2.2.2. Selection and Calculation of Land Use Intensity Indicators
To ensure system-relevant and robust evaluation, subsystem-specific indicators were selected to quantify LUI, in lieu of a universal index approach [37]. LUI is understood as a direct measure of human intervention in land systems, serving as a core metric for evaluating the sustainability of urban and regional land management practices [38].
A multi-criteria evaluation (MCE) approach [39] was employed, integrating the intensity of human activities, urban development attributes, and data accessibility, to select eight representative indicators for each subsystem within the GPUA (see Table 1). All indicators were standardized to facilitate inter-sample comparability and minimize systematic error. LUI values for each grid cell were calculated through spatial overlay, assigning equal weights to all indicators, and the resulting scores were normalized to a 0–1 scale to enable comparison across subsystems and temporal intervals.
- (1)
- Human-settlement System (HS).
Within the HS subsystem, land use intensity (LUI) was quantified using three indicators reflecting human activities and anthropogenic inputs: population density (PD), building volume (BV), and nighttime light intensity (NTL). Population density and building volume data were sourced from the Global Human Settlement Layer (GHSL), developed by the European Commission [47], while nighttime light intensity was derived from the annual NPP-VIIRS nighttime light (NTL) dataset. Together, these indicators comprehensively represent the scale and intensity of human presence and urban development within each grid cell.
The LUI of the Human-settlement System for each grid cell was calculated as follows:
where, represents the land use intensity value for the Human-settlement System in a given grid cell, is population density (people/m²), is building volume (m³), and denotes nighttime light intensity.
- (2)
- Cropland System (CS).
For the CS subsystem, land use intensity (LUI) was assessed using three key indicators that capture the core dimensions of agricultural management and input–output dynamics: cropping intensity (CI), grain yield (GY), and nitrogen fertilizer input (NFI). These indicators provide a comprehensive evaluation of agricultural practices and outcomes, aligning with internationally recognized standards for sustainability assessment. Cropping intensity data were derived from the 2001–2019 global 250 m resolution dynamic planting intensity dataset, while grain yield was sourced from the GlobalWheatYield4km dataset. Nitrogen fertilizer input was quantified based on the History of Anthropogenic Nitrogen Inputs (HaNi) dataset, capturing spatial and temporal variation in agricultural input intensity within the study area. Collectively, these indicators reflect both productivity and environmental stewardship, which are fundamental to sustainable agricultural land management.
The LUI of the Cropland System for each grid cell was calculated as follows:
where is the land use intensity value for a single grid cell in the Cropland System, and , , represent Cropping Intensity, Grain Production (ton/m2), Nitrogen Fertilizer Input (kg/m2), respectively.
To comprehensively characterize the LUI of the FS subsystem, this study integrates both resource exploitation and ecological conservation dimensions by selecting two primary indicators: Forest Management (FM) and Forest Reserve (FR) [48]. Drawing on the Global Forest Management Map, forest areas were classified into five management categories-agroforestry systems, short-rotation artificial forests (less than 15 years), long-rotation artificial forests (greater than 15 years), commercial natural regeneration forests, and non-commercial natural regeneration forests [49] -to represent varying intensities of human intervention. This classification enables a nuanced assessment of land use intensity consistent with contemporary land management paradigms.
Additionally, forest reservation level was incorporated as a complementary indicator to capture the effectiveness of ecological protection measures [50]. Higher reservation levels, typically associated with officially designated forest reserves, reflect stronger ecological conservation efforts and correspondingly lower levels of human development and utilization intensity [51]. The LUI of the Forest System for each grid cell was calculated as:
where denotes the land use intensity value for an individual grid of the Forest System. represents forest management type, while indicates forest protection levels. Protection levels are assigned as follows: national-level forest reserves = 0.1, provincial-level forest reserves = 0.5, municipal-level forest reserves = 0.7, and other cases = 1.
2.2.3. Analysis of Driving Factors
Changes in land use intensity (LUI) are the result of complex, multifaceted geographic processes, shaped by the interacting influences of natural, social, economic, technological, and policy factors across multiple spatial and temporal scales [52]. Traditional regression methods, while widely used, are inherently limited in their capacity to capture the nonlinearities, high-dimensional interactions, and threshold effects that characterize land use systems. To address these challenges, this study employs advanced machine learning techniques-specifically, the XGBoost algorithm-which are particularly well-suited for modeling complex, high-dimensional, and nonlinear relationships in large datasets [53,54]. Nevertheless, a persistent limitation of such models lies in their “black box” nature, which can hinder transparent interpretation of the contributions and effects of individual predictor variables [55].
To enhance the interpretability of model outputs and strengthen the robustness of impact assessment, this study incorporated the SHAP (Shapley Additive Explanations) framework to systematically identify, quantify, and rank the principal drivers of land use intensity (LUI) across the Human Settlement (HS), Cropland (CS), and Forest (FS) subsystems within the GPUA. Drawing on established literature [56,57,58,59,60], eleven explanatory variables were selected to represent four key domains (Table 2): natural conditions (X1–X4), socioeconomic factors (X5–X7), urban–rural integration (X8–X9), and locational attributes (X10–X11). This multidimensional variable selection provides a comprehensive analytical basis for evaluating the determinants and underlying mechanisms of LUI dynamics.
3. Results
3.1. Spatiotemporal Characteristics of Land Use Intensity
3.1.1. Structure of Land Use Intensity
Over the past two decades, the distribution of land use intensity (LUI) has shifted markedly across all three subsystems (Figure 3). In the Human-Settlement (HS) subsystem, low-intensity grids remained predominant but declined modestly from 86.54 % in 2000 to 83.18 % in 2020. Concurrently, medium-intensity areas increased from 12.10 % to 14.26 %, and high-intensity areas expanded from 1.22 % to 2.56 %, indicating progressive urban densification, particularly in intermediate zones. In the Cropland (CS) subsystem, a pronounced structural realignment occurred: low-intensity cropland rose from 40.85 % in 2000 to 50.10 % in 2010 before falling sharply to 34.90 % by 2020; medium-intensity cropland climbed steadily from 32.53 % to 50.57 %, while high-intensity cropland contracted from 26.62 % to 14.53 %, reflecting a policy-driven shift toward more balanced cultivation practices. In the Forest (FS) subsystem, the dominance of high-intensity forest (52.68 % in 2000; 57.59 % in 2010) was reversed by 2020, when low-intensity forest rose to 59.12 %, underscoring the impact of ecological restoration and afforestation efforts in reducing anthropogenic disturbance.
3.1.2. Spatial Distribution of Land Use Intensity
In 2000, LUI in the GPUA exhibited a concentric pattern (Figure 4). Within the HS, high-intensity cells clustered in Xi’an and secondary cores (Xianyang, Weinan, Baoji, Linfen, Yuncheng), with medium-intensity HS radiating along major corridors and low-intensity HS on rural fringes. The CS’s high-intensity zones formed a belt along the Xi’an–Xianyang–Weinan–Baoji corridor; medium-intensity cropland covered the central plain; and low-intensity cropland occupied marginal uplands. For the FS, high-intensity areas were concentrated in the steep, densely forested southern Qinling Mountains and isolated enclaves in the northern foothills, while low-intensity FS occurred primarily around the periphery of these core forests-along the northern slopes, Loess Plateau gullies, and riparian restoration zones.
By 2010, HS high-intensity expanded west into Xianyang and northward, forging near-continuous urban belts; medium-intensity HS further infiltrated suburban corridors. CS high-intensity receded at urban margins due to sprawl, yet persisted in extensive agricultural regions; medium- and low-intensity cropland remained dominant in hilly and intermontane basins. FS distribution remained largely unchanged: core high-intensity forests persisted in steep, protected mountain reserves, while low-intensity FS continued to fringe these areas, reflecting stable conservation outcomes.
By 2020, HS high-intensity formed a fully contiguous belt between Xi’an and Xianyang, with medium-intensity HS infilling peri-urban zones. Urban encroachment converted some high-intensity CS to HS, but remote grain-production plains retained extensive high-intensity cropland; medium- and low-intensity CS persisted in transitional landscapes. FS again showed remarkable stability: high-intensity forests remained confined to key ecological barriers (e.g., Qinling and Bashan ranges), and low-intensity FS continued to encircle these cores, underscoring the effectiveness of long-term afforestation and protection policies.
3.2. Subsystem-Specific Changes in Land Use Intensity
3.2.1. Spatiotemporal Variation along the Urban–Rural Gradient
Figure 5 illustrates the urban–rural gradient framework for the Guanzhong Plain Urban Agglomeration (GPUA), partitioning the study area into three concentric zones-urban center, urban fringe, and rural hinterland-based on Global Human Settlement Layer (GHS) urbanization classes, population density, and mixed-use indicators [61,62]. Subsystem-specific LUI gradient dynamics are summarized as follows:
Human-Settlement System (HS): LUI declines markedly from the urban core toward rural peripheries. Between 2000 and 2020, mean HS LUI in the urban center rose by over 20 %, driven by intensified construction and infill development. The urban fringe recorded a more moderate 10 % increase, while rural HS LUI remained low (< 0.2) and stable, reflecting the containment of high-intensity settlement within peri-urban belts.
Cropland System (CS): LUI peaks prominently in the urban fringe (~ 0.6), where proximity to markets, infrastructure, and services sustains intensive cultivation. Over the two-decade period, fringe CS LUI held steady, whereas core and rural CS LUI each declined by 5–10 %, signaling both urban encroachment into prime farmland and extensification of more remote agricultural areas.
Forest System (FS): Between 2000 and 2010, forest-system LUI retained its inverse gradient-rising from the urban core through the fringe to the rural hinterland-but absolute LUI values declined in all three zones relative to 2000, signaling an initial contraction of human disturbance across the landscape. By 2020, however, this trajectory had shifted: FS LUI in the urban center not only recovered but exceeded its 2000 peak, driven by intensified peri-urban afforestation and park development; fringe-zone LUI stabilized at levels comparable to 2010, reflecting a balance between managed use and conservation; and rural–mountainous LUI continued its modest upward trend, reflecting ongoing large-scale ecological restoration efforts (e.g., Grain-for-Green).
3.2.2. Patterns of Land Use Intensity Change
To dissect heterogeneity in LUI change, grid cells with unchanged land use type between 2000 and 2020 were analyzed, and nine distinct change patterns were identified (Table 3, Figure 6). In the HS, the majority of land (86.5%) remained stable (Category 5), while approximately 10.5% underwent intensification, particularly around urban cores. Fluctuation or decline was rare and typically localized. The CS exhibited high dynamism, with only 1.68% stable, 55.1% intensifying (notably in favorable agricultural regions), and 38.5% declining, often in areas subject to natural or socio-economic constraints. The FS was dominated by long-term stability (>50%) and delayed growth (26.15%), particularly in policy-targeted ecological restoration areas.
To explore heterogeneity in land use intensity (LUI) dynamics, we focused on grid cells whose underlying land-use category remained constant from 2000 to 2020 and classified their LUI trajectories into nine patterns based on whether intensity decreased, remained stable, or increased during 2000–2010 and 2010–2020 (Table 2; Figure 6).
The vast majority of HS grids (86.5 %) exhibited no net change in LUI over twenty years (Category 5), indicating that most urban areas maintained consistent development intensity. Approximately 10.5 % of cells experienced sustained or accelerated intensification (Categories 6, 8, 9), predominantly around Xi’an, Xianyang, and Weinan-zones of rapid urban expansion and near-saturation development. Cells showing fluctuating or declining intensity (Categories 1–4, 7) were rare (< 3 %) and typically confined to small pockets in Baoji, Yuncheng, and Linfen, reflecting localized redevelopment or transient contraction, but with some presence in the urban core, mostly concentrated in the central district of Xi’an.
In stark contrast, only 1.7 % of cropland remained stable (Category 5). Over half of the CS area (55.1 %) underwent net intensification (Categories 3, 6, 9), concentrated in agriculturally favorable regions such as southern Baoji, western Xianyang, southern Weinan, and northwestern Yuncheng-areas benefiting from improved management and supportive policies. Approximately 38.5 % of cropland experienced net decline (Categories 1, 2, 4, 7), especially in Tianshui, Linfen, and northern Xianyang, where fluctuating-decline patterns (Category 7) prevailed, likely due to natural constraints and urban encroachment.
Forest LUI proved more stable: 59.1 % of forest grids adhered to the long-term stable pattern (Category 5), mainly in the southern Shaanxi mountains (Shangluo, southern Baoji) and along the Qinling foothills-areas with established conservation regimes. Delayed growth (Category 6) accounted for 26.2 %, clustered in the Qinling and Bashan Mountains and adjacent protected zones, signaling gradual ecological restoration under programs such as Grain-for-Green. Only 12.8 % of forest grids exhibited transient change (Categories 2–4), located in the northern margins of Linfen and peripheral urban fringes, where mixed influences of topography, policy, and human disturbance produced moderate intensity shifts.
3.3. Drivers of Land Use Intensity
Changes in land use intensity (LUI) emerge from the complex interplay of natural, socioeconomic, technological, and policy factors operating across multiple spatial and temporal scales [63]. Identifying the key drivers and their mechanisms is therefore essential for diagnosing current land-use dynamics, informing regulatory interventions, and projecting future trends within the GPUA. Building on established frameworks, we selected eleven explanatory variables spanning four domains-natural conditions (X1–X4), socioeconomic attributes (X5–X7), urban–rural integration (X8–X9), and locational factors (X10–X11)-to capture the multidimensional determinants of LUI (Figure 7).
By applying SHAP (Shapley Additive Explanations) to our XGBoost models, we quantified each variable’s contribution, direction of effect, and distributional characteristics for the Human-Settlement (HS), Cropland (CS), and Forest (FS) subsystems over 2000–2020 (Figure 8).
- Human-Settlement Subsystem (HS).
Socioeconomic variables-particularly population density (X5) and per capita GDP (X7)-consistently exerted the strongest positive influence on HS LUI, underscoring the central role of agglomeration and economic growth in urban intensification. Locational proximity to city centers (X11) also enhanced LUI, while urban–rural integration metrics (X8 and X9) grew in importance over time, reflecting the increasing impact of peri-urban expansion.
- Cropland Subsystem (CS).
Early in the study period, biophysical constraints such as slope (X4) dominated cropland intensity. However, by 2020 socioeconomic pressures-most notably population density (X5), proximity to urban markets (X11), and overall GDP (X6)-had become the primary drivers. Accessibility (road length, X10) also contributed positively, illustrating the integration of agricultural systems into broader economic networks.
- Forest Subsystem (FS).
Natural environmental factors-precipitation (X1), elevation (X3), and slope (X4)-remained the principal positive drivers of FS LUI, highlighting the dependency of forest productivity on moisture and terrain. In contrast, indicators of human activity (X5–X7, X10) predominantly suppressed forest LUI, evidencing the protective effect of limited accessibility. Distance from urban centers (X11) emerged as a key positive factor, with intermediate isolation maximizing forest use while both extreme proximity and remoteness reduced intensity.
SHAP dependence analyses (Figure 9 and Figure 10) revealed that many drivers follow nonlinear and threshold behaviors. In HS, per capita GDP exhibited an inverted-U relationship with LUI, indicating diminishing returns beyond a critical income level. In CS, population density showed a similar pattern, whereby moderate densities foster cultivation but excessive densities trigger land competition and conversion. In FS, precipitation drove a positive nonlinear response, whereas distance displayed a peaked effect: optimal forest LUI occurred at intermediate distances, declining both closer to and farther from urban centers.
4 Discussion
4.1. Synergistic Land Use Intensity Change and Policy Responses in the Guanzhong Plain Urban Agglomeration
This study enriches our understanding of land use intensity (LUI) in the Guanzhong Plain Urban Agglomeration (GPUA) by combining high-resolution spatial analysis with interpretable machine learning. Our results reveal distinctive subsystem-specific trajectories driven by the interplay of policy interventions, socioeconomic transformation, and environmental constraints.
In the Human-Settlement (HS) subsystem, rapid economic growth and population agglomeration have fueled a pronounced expansion of high-intensity zones in both core cities and their peripheries. Medium-intensity areas have correspondingly extended into the urban fringe, strengthening urban–rural linkages, while low-intensity settlements have contracted, reflecting an ongoing rural-to-urban transition. Notably, we also detect pockets of declining HS LUI in central districts, indicative of counter-urbanization and functional transformation processes-such as urban renewal, redevelopment, and the conversion of land to ecological parks or service-oriented uses.
Within the Cropland (CS) subsystem, a clear policy-driven shift from intensive to more balanced cultivation practices has emerged. Although high-intensity cropland remains concentrated in the Guanzhong Plain’s core farming areas, medium-intensity zones have expanded under the influence of farmland protection and compensation policies. Nonetheless, CS LUI exhibits marked spatial and temporal volatility: urban encroachment, demographic pressures, and resource constraints drive localized declines, whereas targeted interventions-such as the “cropland occupation-compensation balance” and “permanent basic farmland delimitation” policies-have stabilized or enhanced intensity in key agricultural districts.
In the Forest (FS) subsystem, LUI dynamics reflect the dual objectives of ecosystem restoration and sustainable management. Between 2000 and 2020, high-intensity forest areas-those under active human use and management-declined in many conservation zones, indicating a reduction in disturbance and a shift toward lower-intensity practices. Concurrently, low-intensity forests-characterized by natural regeneration and minimal anthropogenic input-expanded, signifying strengthened ecosystem integrity and enhanced long-term resilience. Nevertheless, LUI at the urban fringe exhibited localized fluctuations, underscoring the need for tailored buffer-zone policies that balance peri-urban development with the preservation of forest structure and function.
4.2. Nonlinear Mechanisms and Threshold Effects in LUI Dynamics
By integrating XGBoost with SHAP value analysis, our study delivers a robust, data-driven characterization of the nonlinear, threshold-based interactions that govern land use intensity (LUI) across distinct subsystems. In the Human-Settlement system (HS), socioeconomic drivers-especially per capita GDP and population density-consistently dominated. The inverted U-shaped relationship between GDP per capita and HS LUI reveals a critical inflection point: initial economic growth promotes urban intensification, but beyond a threshold, further income gains yield diminishing or negative returns, reflecting efficiency boundaries, ecological constraints, and shifts in urban planning priorities. Urban–rural integration metrics (population distribution and urban–rural gradient) likewise exerted significant, nonlinear influences, highlighting the complex role of spatial connectivity in urban dynamics.
Within the Cropland system (CS), the balance of biophysical and socioeconomic controls evolved markedly over time. While slope initially constrained LUI, by 2020 demographic pressure (population density) and proximity to urban centers emerged as primary drivers. SHAP dependence plots reveal that CS LUI peaks at moderate population densities and intermediate distances from city cores, but declines under both intense urban encroachment and extreme remoteness, illustrating a classic inverted U-shaped response.
In the Forest system (FS), natural environmental factors-precipitation, elevation, and slope-remained the principal positive determinants of LUI. Conversely, indicators of human activity and accessibility (population density, GDP, road length) generally suppressed forest intensity, underscoring the protective effect of ecological isolation. Crucially, a pronounced “peak effect” characterized the relationship between distance to urban centers and FS LUI: forests at moderate isolation exhibited the highest intensity, whereas those too close to urban areas suffered disturbance and those excessively distant faced management challenges.
Collectively, these explainable machine learning insights uncover subsystem-specific nonlinearities and thresholds, providing a nuanced empirical foundation for adaptive, differentiated land governance that reconciles intensification with sustainability in rapidly urbanizing regions.
4.3. Policy Implications for Sustainable LUI Optimization
To optimize land use intensity (LUI) in rapidly urbanizing contexts, policy responses must be both adaptive and tailored to each subsystem. In the Human-Settlement System, enforcing urban growth boundaries and prioritizing infill and high-density redevelopment will curb sprawl, while strategic renewal of underperforming central districts can facilitate functional shifts toward mixed-use and green infrastructure. Establishing a polycentric urban network-supported by targeted infrastructure investments and integrated urban–rural development programs-will enhance spatial cohesion and mitigate core–periphery imbalances. Within the Cropland System, the strict protection of farmland redlines, combined with zoning-specific intensification measures (e.g., high-standard farmland, water-efficient and precision-agriculture technologies), is essential to secure food production and maximize land efficiency. Promoting peri-urban facility farming and agri-tourism, alongside the judicious conversion of marginal slopes to forest or grassland, can harmonize agricultural productivity with ecological restoration. For the Forest System, unwavering adherence to ecological redlines and differentiated management-ranging from urban green belts and eco-tourism corridors to strict conservation in remote reserves-will safeguard forest integrity. Continued afforestation and robust ecological compensation schemes, particularly in vulnerable landscape mosaics, are critical to sustaining ecosystem services and reinforcing long-term resilience. Collectively, these integrated measures provide a comprehensive framework for sustainable, subsystem-specific land governance in the Guanzhong Plain Urban Agglomeration and other rapidly developing regions.
5. Conclusions
This study delivers a novel, high-resolution assessment of land use intensity (LUI) dynamics in the Guanzhong Plain Urban Agglomeration (GPUA) over the period 2000–2020. By coupling a 1 km hexagonal grid framework with interpretable machine learning (XGBoost-SHAP), we disentangled subsystem-specific LUI trajectories and uncovered critical nonlinearities and threshold effects that traditional linear models fail to detect.
Our principal findings include: (1) marked intensification and spatial expansion of the Human-Settlement System driven by socioeconomic growth and urbanization; (2) a policy-induced rebalancing in the Cropland System from high to moderate intensity, reflecting the influence of agricultural protection and compensation measures; and (3) a pronounced reduction in Forest System LUI in core zones-indicative of successful ecological restoration-accompanied by complex gradient effects of precipitation and spatial isolation. These patterns confirm that LUI evolution is governed by the intricate interplay of economic development, urban–rural integration, biophysical constraints, and targeted policy interventions.
From a policy perspective, our results underscore the imperative for adaptive, differentiated land governance: (i) enforcing urban growth boundaries and prioritizing infill development to contain sprawl; (ii) safeguarding cropland through zoning-specific intensification and smart agriculture; and (iii) maintaining forest integrity via ecological redlines, tailored conservation, and compensation schemes.
While our framework provides robust, data-driven insights into LUI processes, future work should pursue higher-resolution data, incorporate additional socio-environmental dimensions (e.g., climate change impacts), and undertake comparative analyses across global urban agglomerations to validate and extend these findings. Such efforts will further strengthen the evidence base for sustainable land use planning in rapidly urbanizing and ecologically sensitive regions.
Author Contributions
Conceptualization, Xiaohui Ding and Yu Jiang; methodology, Xiaohui Ding and Heng Wang; software, Yufang Wang; resources, Yuetao Wu; writing-original draft preparation, Xiaohui Ding; writing-review and editing, Xiaohui Ding, Heng Wang, Yuetao Wu; funding acquisition, Xiaohui Ding. All authors have read and agreed to the published version of the manuscript.
Funding
This research was funded by the “National Office for Philosophy and Social Sciences (22BGL195)”, “Humanities and Social Sciences Research Project of the Ministry of Education (19XJCZH001)” and “Fundamental Research Funds for the Central Universities, Ministry of Education of China (24ZYYB010)”.
Data Availability Statement
The datasets used and analyzed during the current study are available from the corresponding author on reasonable request.
Conflicts of Interest
The authors declare no conflicts of interest.
Abbreviations
The following abbreviations are used in this manuscript:
| BV | Building Volume |
| CI | Cropping Intensity |
| CLCD | China Land Cover Dataset |
| CS | Cropland System |
| FM | Forest Management |
| FR | Forest Reserve |
| FS | Forest System |
| GDP | Gross Domestic Product |
| GHSL | Global Human Settlement Layer |
| GP | Grain Production |
| GPUA | Guanzhong Plain Urban Agglomeration |
| HaNi | History of Anthropogenic Nitrogen Inputs |
| HS | Human-settlement System |
| LUI | Land Use Intensity |
| LUCC | Land Use / Land Cover Change |
| NI | Nitrogen Fertilizer Input |
| NTL | Night-time Light Intensity |
| PD | Population Density |
| SHAP | Shapley Additive Explanations |
References
- Fang, C.; Yu, D. Urban agglomeration: An evolving concept of an emerging phenomenon. Landsc Urban Plan 2017, 162, 126–36. [Google Scholar] [CrossRef]
- Seto, K.C.; Güneralp, B.; Hutyra, L.R. Global forecasts of urban expansion to 2030 and direct impacts on biodiversity and carbon pools. Proc Natl Acad Sci U S A 2012, 109(40), 16083–8. [Google Scholar] [CrossRef] [PubMed]
- Dang, Y.; Chen, L.; Zhang, W.; Zheng, D.; Zhan, D. The coordinated development of urban agglomeration and its impact on land use in the Guanzhong Plain urban agglomeration. Land 2022, 11(9), 1547. [Google Scholar] [CrossRef]
- Felipe-Lucia, M.R.; de Frutos, A.; Comín, F.A.; et al. Land-use intensity alters networks of ecosystem service provision across multiple scales. Proc Natl Acad Sci U S A 2020, 117(37), 22802–10. [Google Scholar] [CrossRef] [PubMed]
- Lambin, E.F.; Meyfroidt, P.; Rueda, X.; et al. Land use transitions: Socio-ecological feedback versus socio-economic change. Proc Natl Acad Sci U S A 2013, 110(52), 20918–23. [Google Scholar] [CrossRef]
- Ma, L.; Tian, Y.; Zhang, J.; et al. Urban land expansion driven by economic growth and transportation in China. npj Urban Sustain 2022, 2, 11. [Google Scholar] [CrossRef]
- Xu, Q.; Yang, R.; Zhuang, S.; et al. Spatial relationships of urban land use intensity and its driving forces in China: Empirical analysis based on geographically weighted regression. Land Use Policy 2020, 91, 104364. [Google Scholar] [CrossRef]
- Long, H.; Qu, Y. Land use transitions and land management: A mutual feedback perspective. Land Use Policy 2018, 74, 111–20. [Google Scholar] [CrossRef]
- Erb, K.H.; Haberl, H.; Jepsen, M.R.; et al. A conceptual framework for analysing and measuring land-use intensity. Curr Opin Environ Sustain 2013, 5(5), 464–470. [Google Scholar] [CrossRef] [PubMed]
- van Vliet, J.; de Groot, H.L.; Rietveld, P.; Verburg, P.H. Manifestations and underlying drivers of agricultural land use change in Europe. Landsc Urban Plan 2015, 133, 24–36. [Google Scholar] [CrossRef]
- Wu, Y.; Zhang, X.; Shen, L. Spatiotemporal patterns of urban land use efficiency in China’s urbanization. J Clean Prod 2021, 287, 125051. [Google Scholar] [CrossRef]
- Dietrich, J.P.; Schmitz, C.; Müller, C.; et al. Global agricultural land use intensity and its drivers. Glob Ecol Biogeogr 2019, 28(7), 929–942. [Google Scholar]
- Schall, P.; Gossner, M.M.; Heinrichs, S.; et al. Forest management intensity affects biodiversity and ecosystem functioning. J Appl Ecol 2020, 57(8), 1541–1551. [Google Scholar] [CrossRef]
- Longley, P.A.; Goodchild, M.F.; Maguire, D.J.; Rhind, D.W. Geographic Information Systems and Science, 4th ed.; Wiley: Hoboken, NJ, USA, 2015. [Google Scholar]
- Verburg, P.H.; Erb, K.H.; Mertz, O.; Espindola, G. Land system science: between global challenges and local realities. Curr Opin Environ Sustain 2019, 38, 1–6. [Google Scholar] [CrossRef] [PubMed]
- Hastie, T.; Tibshirani, R.; Friedman, J. The Elements of Statistical Learning: Data Mining, Inference, and Prediction, 2nd ed.; Springer: New York, NY, USA, 2009. [Google Scholar]
- Rindfuss, R.R.; Walsh, S.J.; Turner, B.L.; Fox, J.; Mishra, V. Developing a science of land change: challenges and methodological issues. Proc Natl Acad Sci U S A 2004, 101(39), 13976–13981. [Google Scholar] [CrossRef] [PubMed]
- Noszczyk, T. Machine learning in land use change modeling: A review. Ecol Modell 2019, 408, 108725. [Google Scholar] [CrossRef]
- Zhang, X.; Wang, Y.; Li, J.; et al. Explainable AI for understanding land use change: A case study using XGBoost and SHAP. Remote Sens Environ 2021, 255, 112279. [Google Scholar] [CrossRef]
- Li, M.; Chen, S.; Liu, Y.; et al. Exploring the drivers of urban land use intensity using machine learning approaches. Landsc Urban Plan 2022, 218, 104301. [Google Scholar]
- Wang, H.; Zhang, Q.; Wu, F.; et al. Standardizing machine learning workflows for land use intensity analysis: Challenges and opportunities. Int J Appl Earth Obs Geoinf 2023, 105, 102594. [Google Scholar] [CrossRef]
- Chen, M.; Liu, W.; Lu, D.; et al. Progress of China’s new-type urbanization construction since 2014: a preliminary assessment. Sustainability 2019, 11(5), 1350. [Google Scholar] [CrossRef]
- Zhang, X.; Wang, Y.; Li, J.; et al. Land use conflicts in the Guanzhong Plain Urban Agglomeration: a case study of Xi’an. Land Use Policy 2019, 88, 104156. [Google Scholar] [CrossRef]
- Jia, K.; Yang, L.; He, P.; Wang, Y. Spatiotemporal differentiation of ecological security and its influencing factors for the Guanzhong Plain urban agglomeration, China. Environ Sci Pollut Res 2022, 29(46), 70133–70149. [Google Scholar]
- Yang, Y.; Bao, W.; Liu, Y. Scenario simulation of land system change in the Beijing-Tianjin-Hebei urban agglomeration. Land Use Policy 2021, 109, 105597. [Google Scholar] [CrossRef]
- Meyfroidt, P.; Lambin, E.F.; Erb, K.H.; Hertel, T.W. Globalization of land use: distant drivers of land change and geographic displacement of land use. Curr Opin Environ Sustain 2013, 5(5), 438–444. [Google Scholar] [CrossRef]
- National Development and Reform Commission. Development Plan for the Guanzhong Plain Urban Agglomeration; Government Document: Beijing, China, 2017. [Google Scholar]
- Zhang, Q.; Wu, F.; Li, M. Geomorphological characteristics and land use patterns in the Guanzhong Plain. Geomorphology 2018, 305, 112–125. [Google Scholar] [CrossRef]
- Li, J.; Zhang, X.; Wang, Y. Hydrological characteristics and water resource management in the Wei River Basin. J Hydrol 2019, 578, 124–135. [Google Scholar] [CrossRef]
- Wang, H.; Liu, W.; Chen, M. Climate change impacts on the Guanzhong Plain: A review. Climate Res 2020, 82, 45–58. [Google Scholar] [CrossRef]
- National Bureau of Statistics. China Statistical Yearbook 2021; China Statistics Press: Beijing, China, 2021. [Google Scholar]
- Birch, C.P.; Oom, S.P.; Beecham, J.A. Rectangular and hexagonal grids used for observation, experiment and simulation in ecology. Ecol Modell 2007, 206(3–4), 347–359. [CrossRef]
- Yang, J.; Huang, X. The 30 m annual land cover dataset and its dynamics in China from 1990 to 2019. Earth Syst Sci Data 2021, 13(8), 3907–3925. [Google Scholar] [CrossRef]
- Wu, J.; Xiang, W.N.; Zhao, J. Urban ecology in China: Historical developments and future directions. Landsc Urban Plan 2015, 125, 222–233. [Google Scholar] [CrossRef]
- Yan, H.; Liu, F.; Liu, J.; et al. China’s cropland use intensity and its driving factors. Land Use Policy 2019, 84, 1–10. [Google Scholar] [CrossRef]
- IPBES. Global Assessment Report on Biodiversity and Ecosystem Services; IPBES Secretariat: Bonn, Germany, 2019. [Google Scholar] [CrossRef]
- Smith, J.; Davis, K.; Miller, L. Tailored indicators for land use analysis: A subsystem approach. Land Use Policy 2020, 99, 104987. [Google Scholar] [CrossRef]
- Jones, D.; Smith, E.; Lee, F. Land use intensity as an indicator of sustainable urban development. Sustainability 2019, 11(5), 1234. [Google Scholar] [CrossRef]
- Brown, A.; Johnson, B.; Williams, C. Multi-criteria evaluation in urban planning: A case study of sustainable development. J Urban Plan Dev 2021, 147(2), 04021015. [Google Scholar] [CrossRef]
- Pesaresi, M.; Ehrlich, D.; Ferri, S.; et al. Operating Procedure for the Production of the Global Human Settlement Layer from Landsat Data of the Epochs 1975, 1990, 2000, and 2014; European Commission Joint Research Centre Technical Reports: Ispra, Italy, 2016. [Google Scholar] [CrossRef]
- Chen, Z.; Yu, B.; Yang, C.; et al. A global annual simulated VIIRS nighttime light dataset from 1992 to 2023. Remote Sens Environ 2023, 290, 113125. [Google Scholar] [CrossRef] [PubMed]
- Liu, L.; Zhang, X.; Gao, Y.; et al. Annual dynamic dataset of global cropping intensity from 2001 to 2019. Sci Data 2021, 8, 142. [Google Scholar] [CrossRef] [PubMed]
- Zhang, X.; Wang, Y.; Li, J.; et al. Global Wheat Yield 4km: A high-resolution dataset for agricultural productivity analysis. Agric Syst 2024, 205, 103115. [Google Scholar]
- Tian, H.; Xu, R.; Canadell, J.G.; et al. History of anthropocentric Nitrogen inputs (HaNi). Earth Syst Sci Data 2024, 16, 789–804. [Google Scholar]
- Xu, Y.; Zhang, W.; Liu, J.; et al. Annual maps of global forest management types from 2001 to 2020. For Ecol Manag 2024, 512, 119132. [Google Scholar]
- RESDC (Resource and Environment Science and Data Center). Boundary Data of National Nature Reserves. Available online: https://www.resdc.cn/data.aspx?DATAID=272 (accessed on 25 June 2025).
- Pesaresi, M.; Ehrlich, D.; Ferri, S.; et al. Operating Procedure for the Production of the Global Human Settlement Layer from Landsat Data of the Epochs 1975, 1990, 2000, and 2014; European Commission Joint Research Centre Technical Reports: Ispra, Italy, 2016. [Google Scholar] [CrossRef]
- Smith, D.; et al. Forest management and biodiversity conservation: A review. For Ecol Manag 2023, 500, 118765. [Google Scholar]
- Johnson, B.; et al. Global patterns of forest management and their ecological impacts. Glob Environ Chang 2022, 72, 102345. [Google Scholar]
- Brown, A.; et al. Effectiveness of forest protected areas in reducing deforestation. Conserv Biol 2021, 35(2), 123–135. [Google Scholar] [CrossRef]
- Lee, C.; et al. Balancing conservation and utilization in forest reserves. Biol Conserv 2024, 280, 109876. [Google Scholar]
- Liu, J.; et al. Multiscale drivers of land use change in rapidly urbanizing regions: A case study of the Beijing-Tianjin-Hebei urban agglomeration. Glob Environ Chang 2021, 68, 102317. [Google Scholar] [CrossRef]
- Chen, Y.; Li, X.; Liu, X.; Ai, B. Modeling urban land-use dynamics in a fast developing city using the modified logistic cellular automaton with a patch-based simulation strategy. Environ Model Softw 2020, 123, 104515. [Google Scholar] [CrossRef]
- Torlay, L.; Perrone-Bertolotti, M.; Thomas, E.; Baciu, M. Machine learning–XGBoost analysis of language networks to classify patients with epilepsy. Remote Sens 2019, 11(11), 1312. [Google Scholar] [CrossRef] [PubMed]
- Molnar, C. Interpretable Machine Learning; Lulu.com: Raleigh, NC, USA, 2020; https://christophm.github.io/interpretable-ml-book/. [Google Scholar]
- Xu, J.; et al. Multidimensional Driving Factors of Cultivated Land Use Intensity in the Guanzhong Plain Urban Agglomeration: Based on a Geographical Detector and Geographically Weighted Regression. Land 2020, 11(12), 2314. [Google Scholar] [CrossRef]
- Gao, L.C.; Yang, X.; Li, L.; et al. The Natural and Socioeconomic Influences on Land-Use Intensity: Evidence from China. Land 2021, 10(11), 1254. [Google Scholar] [CrossRef]
- Wang, M.M.; Yang, Y.C.; Guo, T. Measurement of Urban-Rural Integration Level in Suburbs and Exurbs of Big Cities Based on Land-Use Change in Inland China: Chengdu. Land 2021, 10(5), 474. [Google Scholar] [CrossRef]
- Li, L.; Jin, V.L.; Kettler, T.; et al. Decreased Land Use Intensity Improves Surface Soil Quality on Marginal Lands. Agrosyst Geosci Environ 2021, 4(4), e20226. [Google Scholar] [CrossRef]
- Wang, Y.; Song, G.; Li, W. The Interaction Relationship between Land Use Patterns and Socioeconomic Factors Based on Wavelet Analysis: A Case Study of the Black Soil Region of Northeast China. Land 2021, 10(11), 1237. [Google Scholar] [CrossRef]
- Schiavina, M.; Freire, S.; MacManus, K. GHS-POP R2019A - GHS Population Grid Multitemporal (1975–1990–2000–2015); European Commission, Joint Research Centre (JRC): Ispra, Italy, 2019; http://data.europa.eu/89h/0c6b9751-a71f-4062-830b-65d42d515a5d. [Google Scholar]
- Schneider, A.; et al. The Global Human Settlement Layer: A comprehensive dataset for sustainable urban development. Remote Sens Environ 2021, 254, 112204. [Google Scholar] [CrossRef]
- Liu, J.; et al. Multiscale drivers of land use change in rapidly urbanizing regions: A case study of the Beijing-Tianjin-Hebei urban agglomeration. Glob Environ Chang 2021, 68, 102317. [Google Scholar] [CrossRef]
Figure 1.
Conceptual framework of the study.
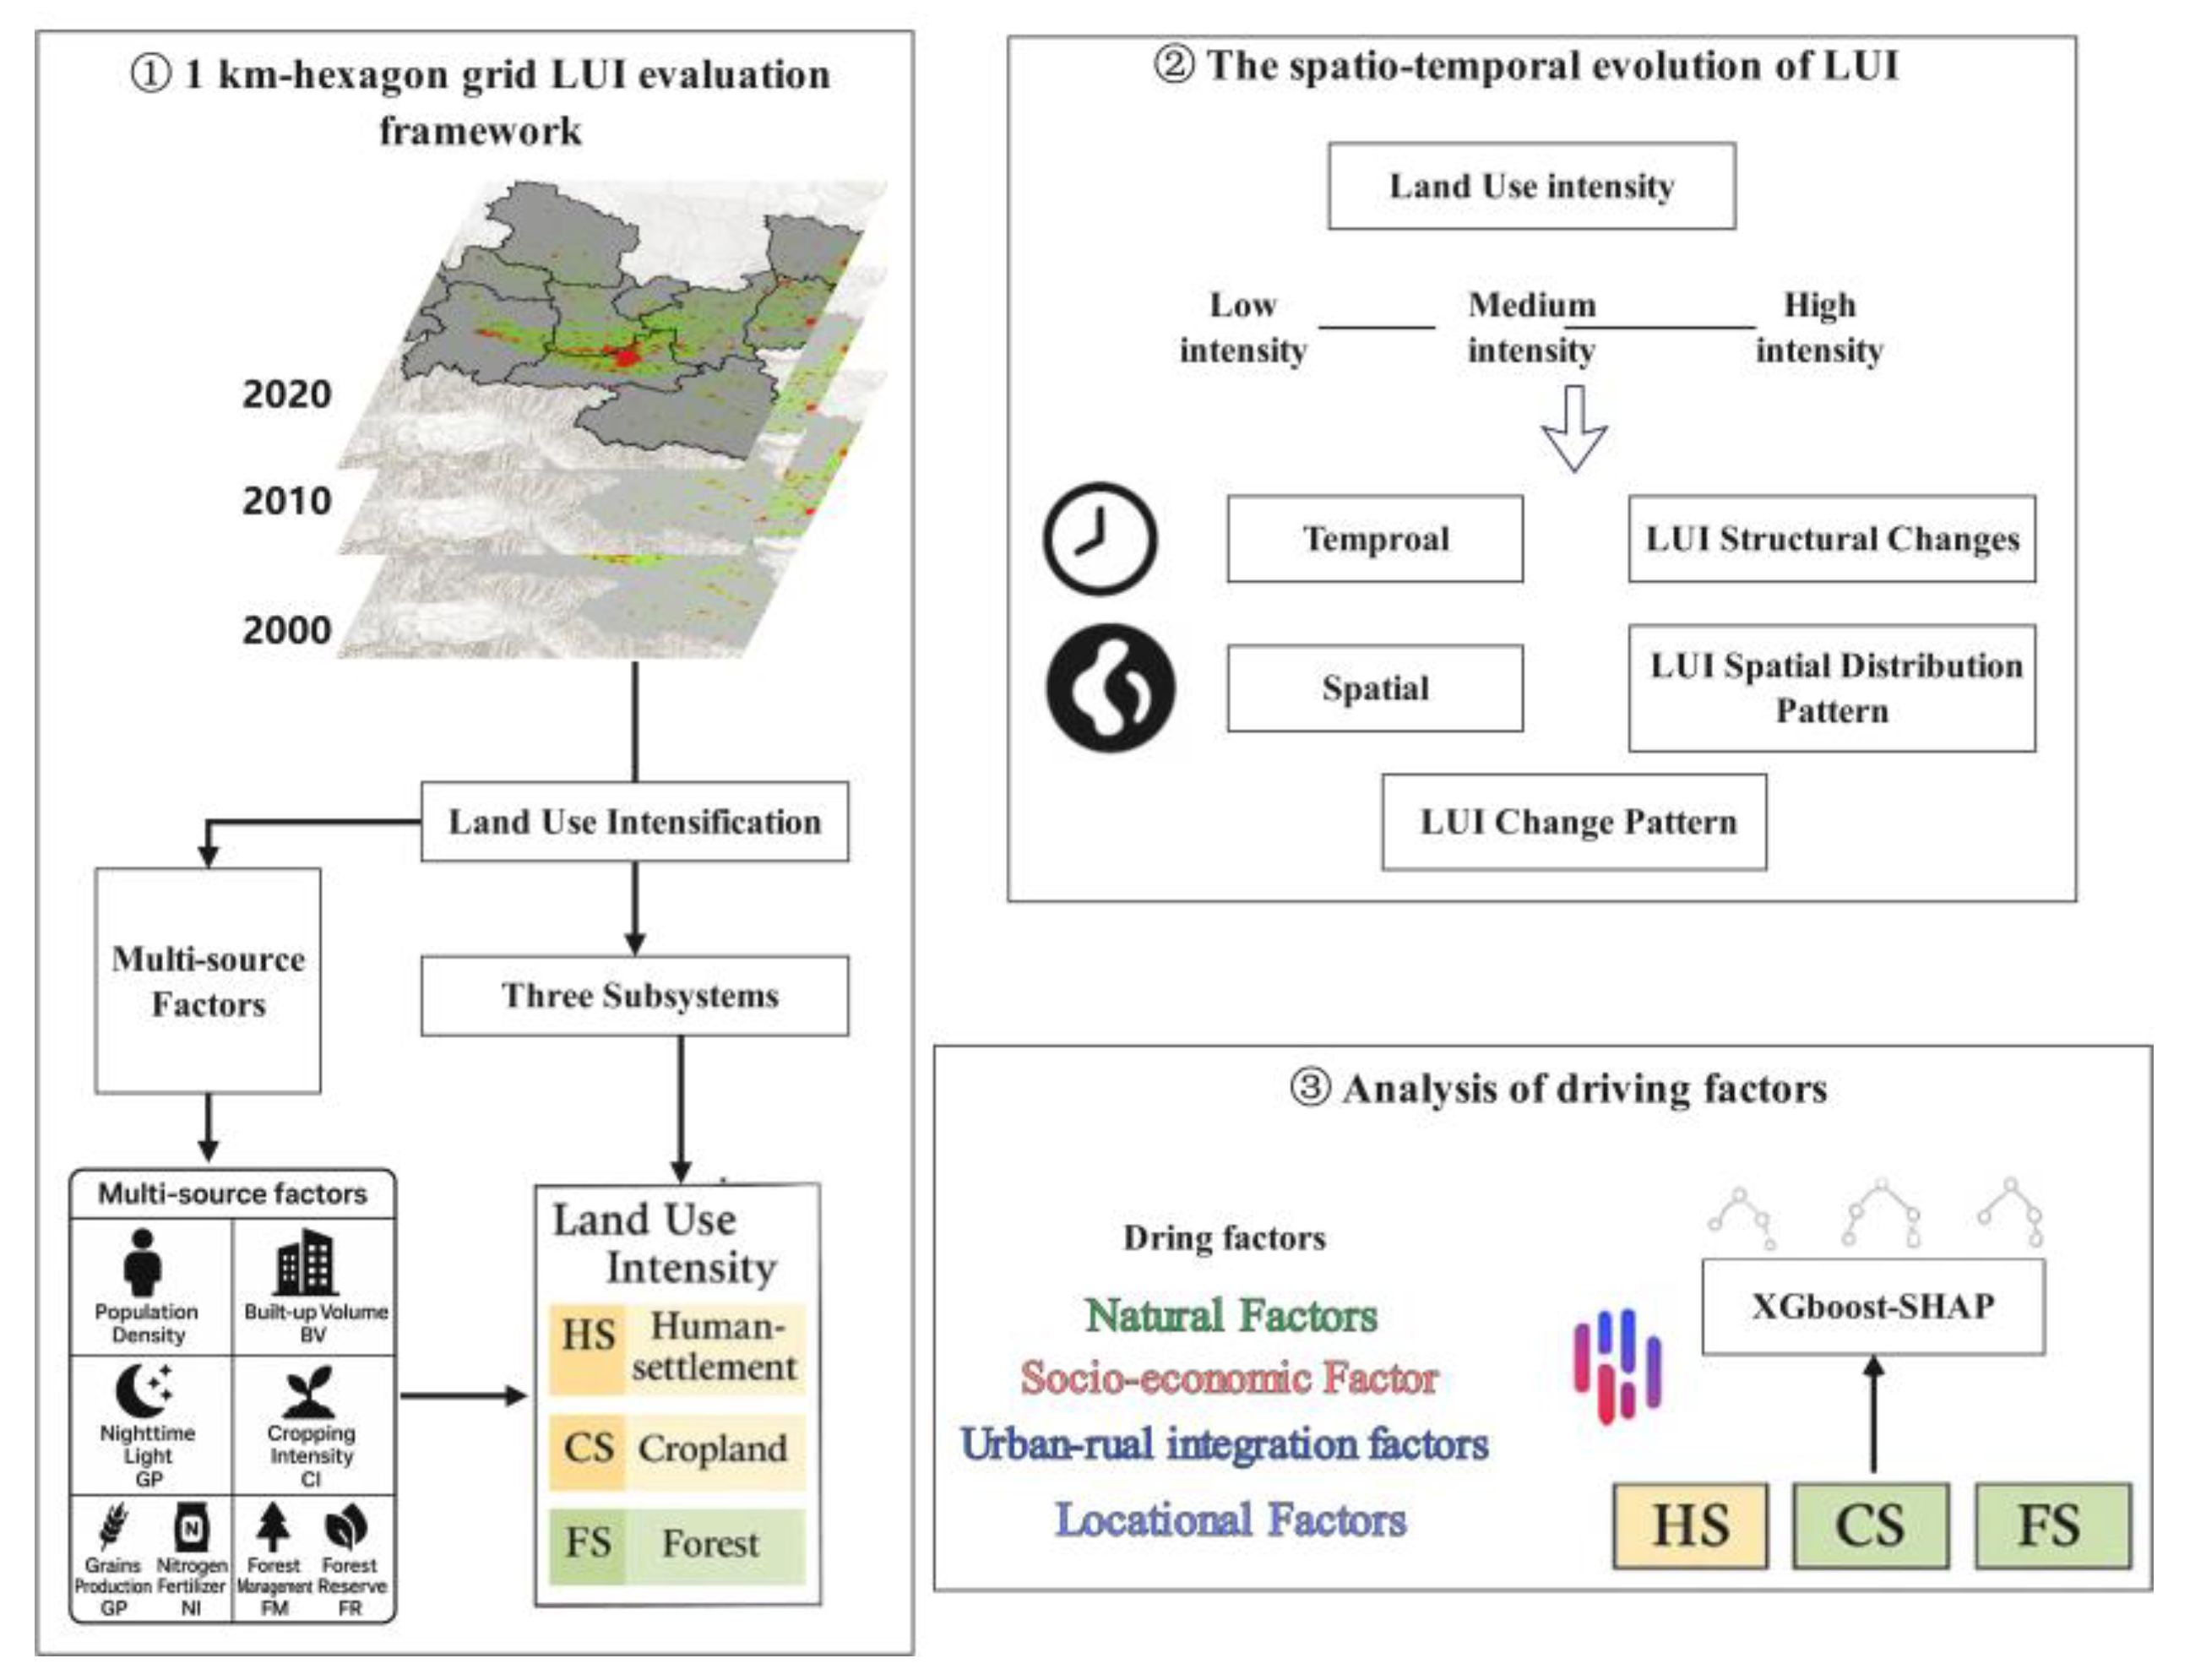
Figure 2.
Location and administrative boundaries of the Guanzhong Plain Urban Agglomeration (GPUA), China.
Figure 2.
Location and administrative boundaries of the Guanzhong Plain Urban Agglomeration (GPUA), China.
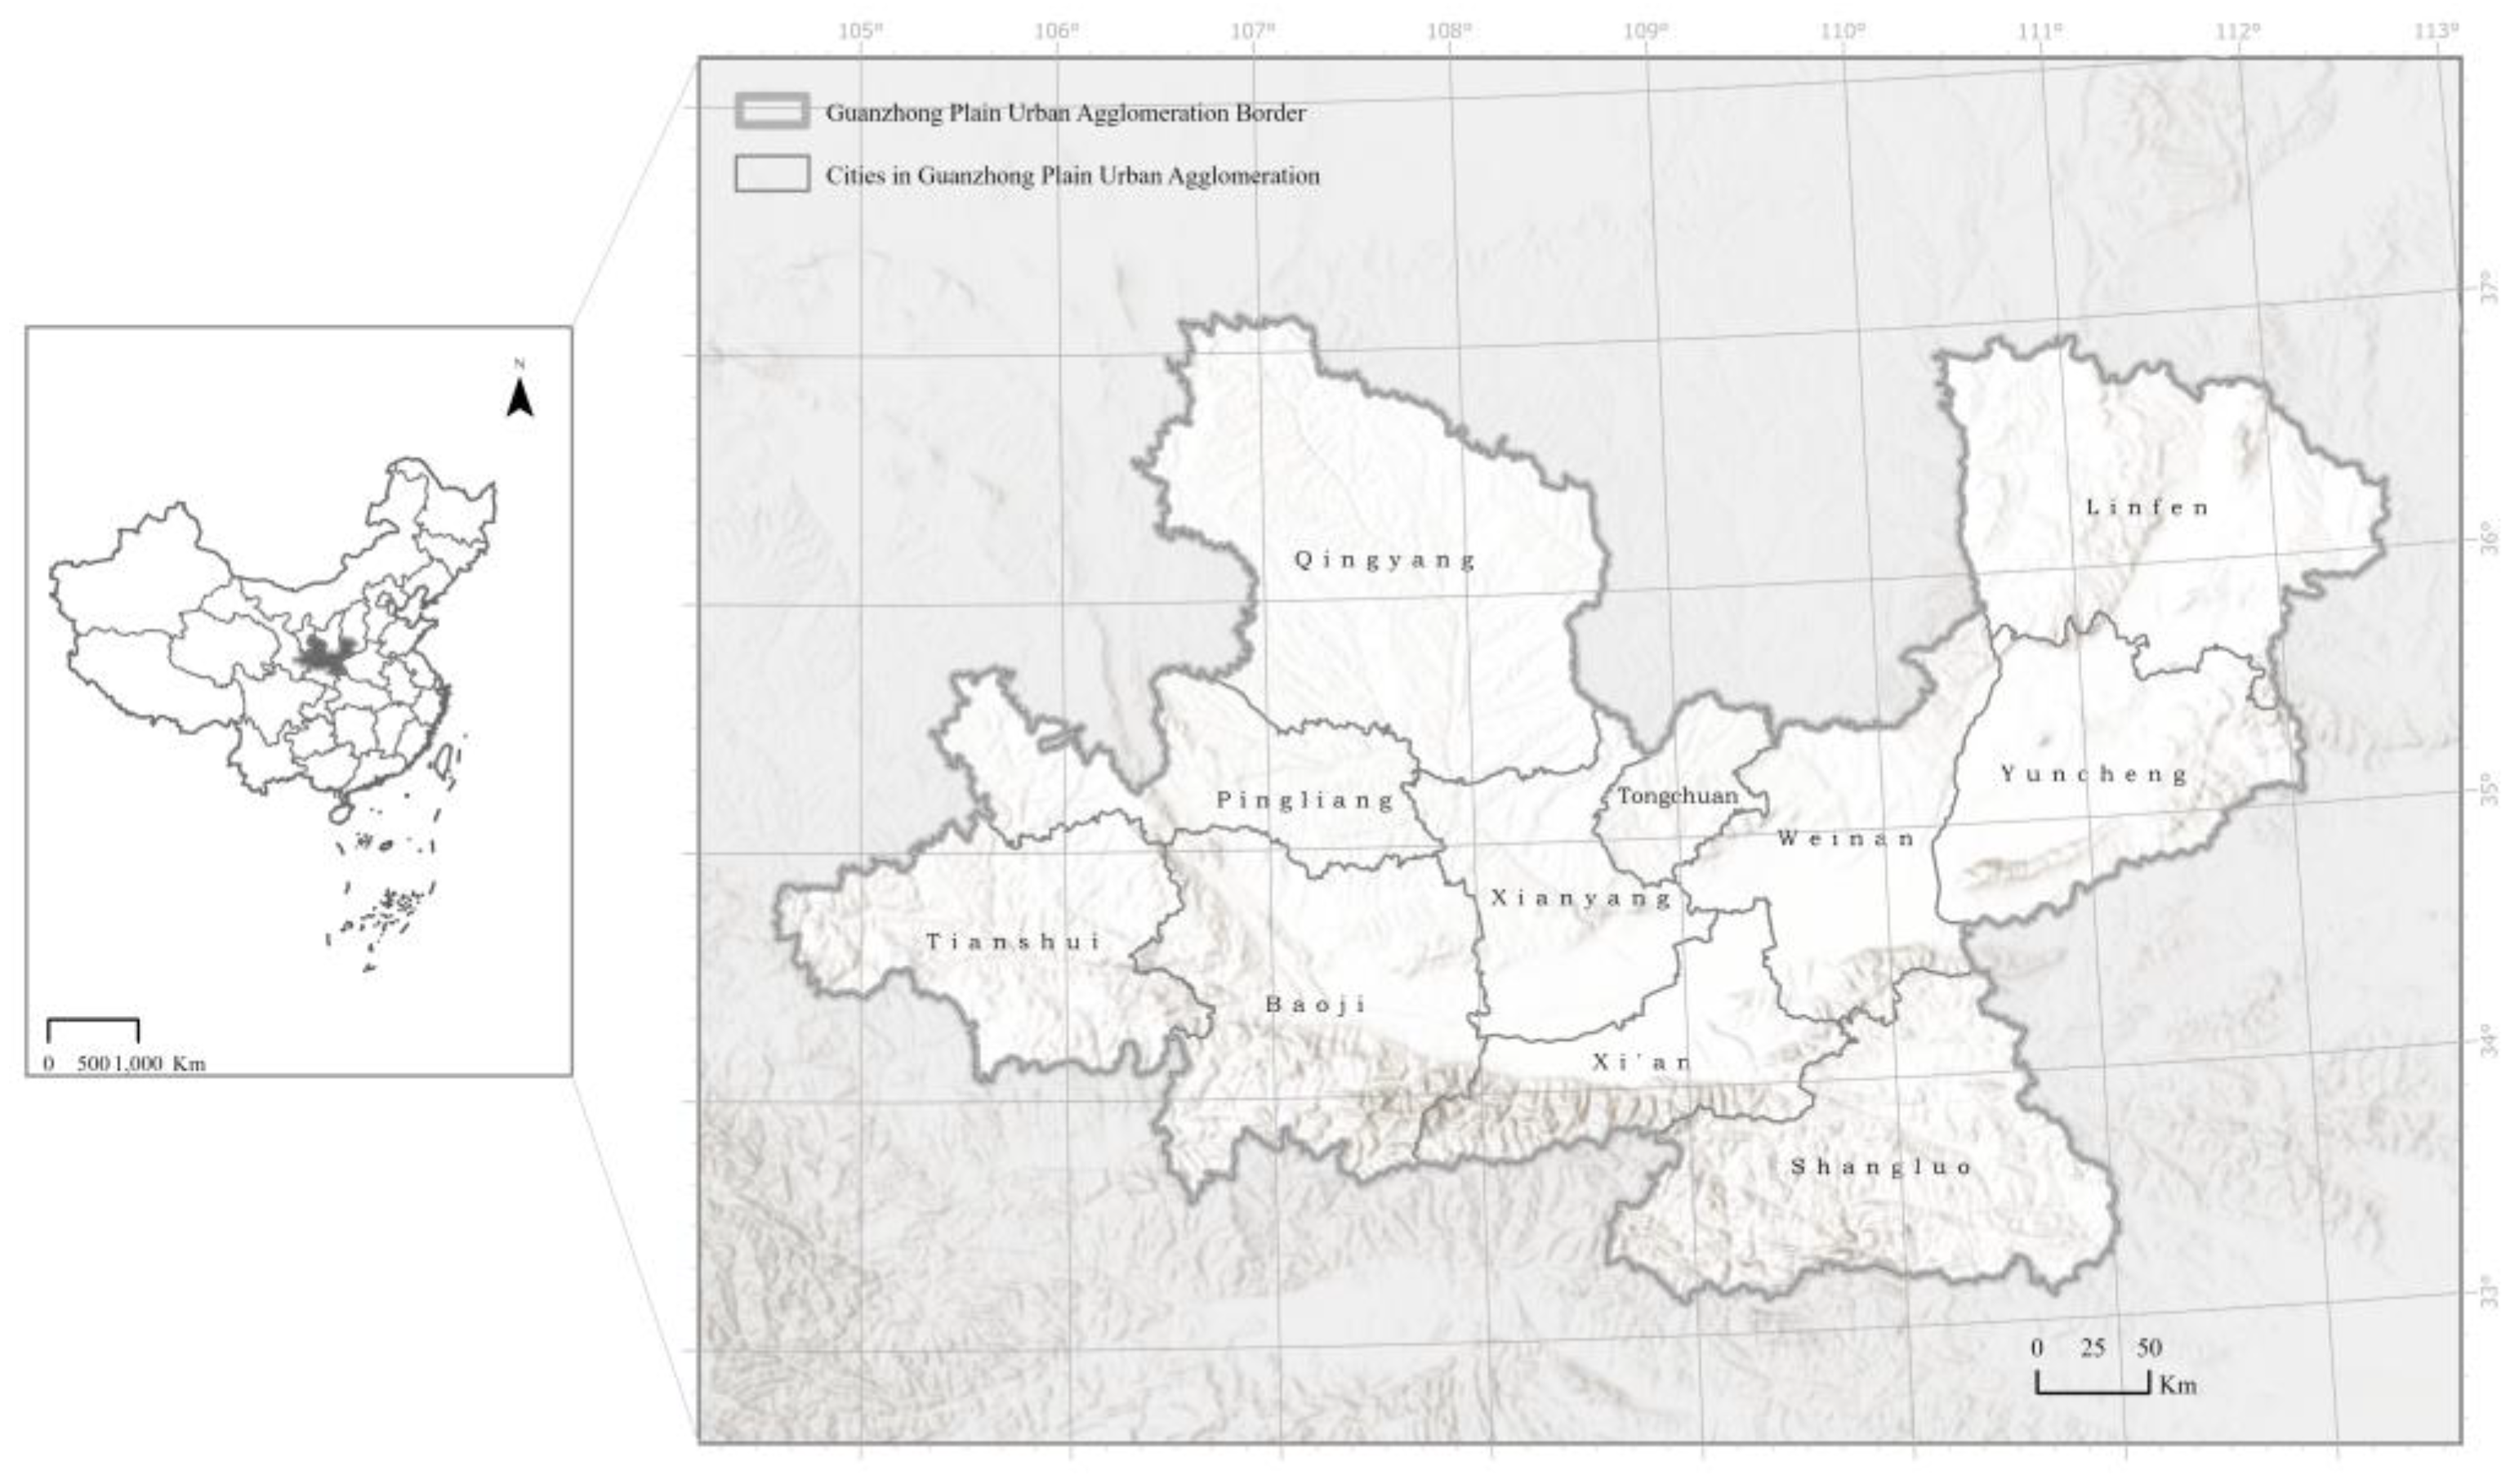
Figure 3.
Temporal evolution of LUI structure in each subsystem (HS, CS, FS) from 2000 to 2020.
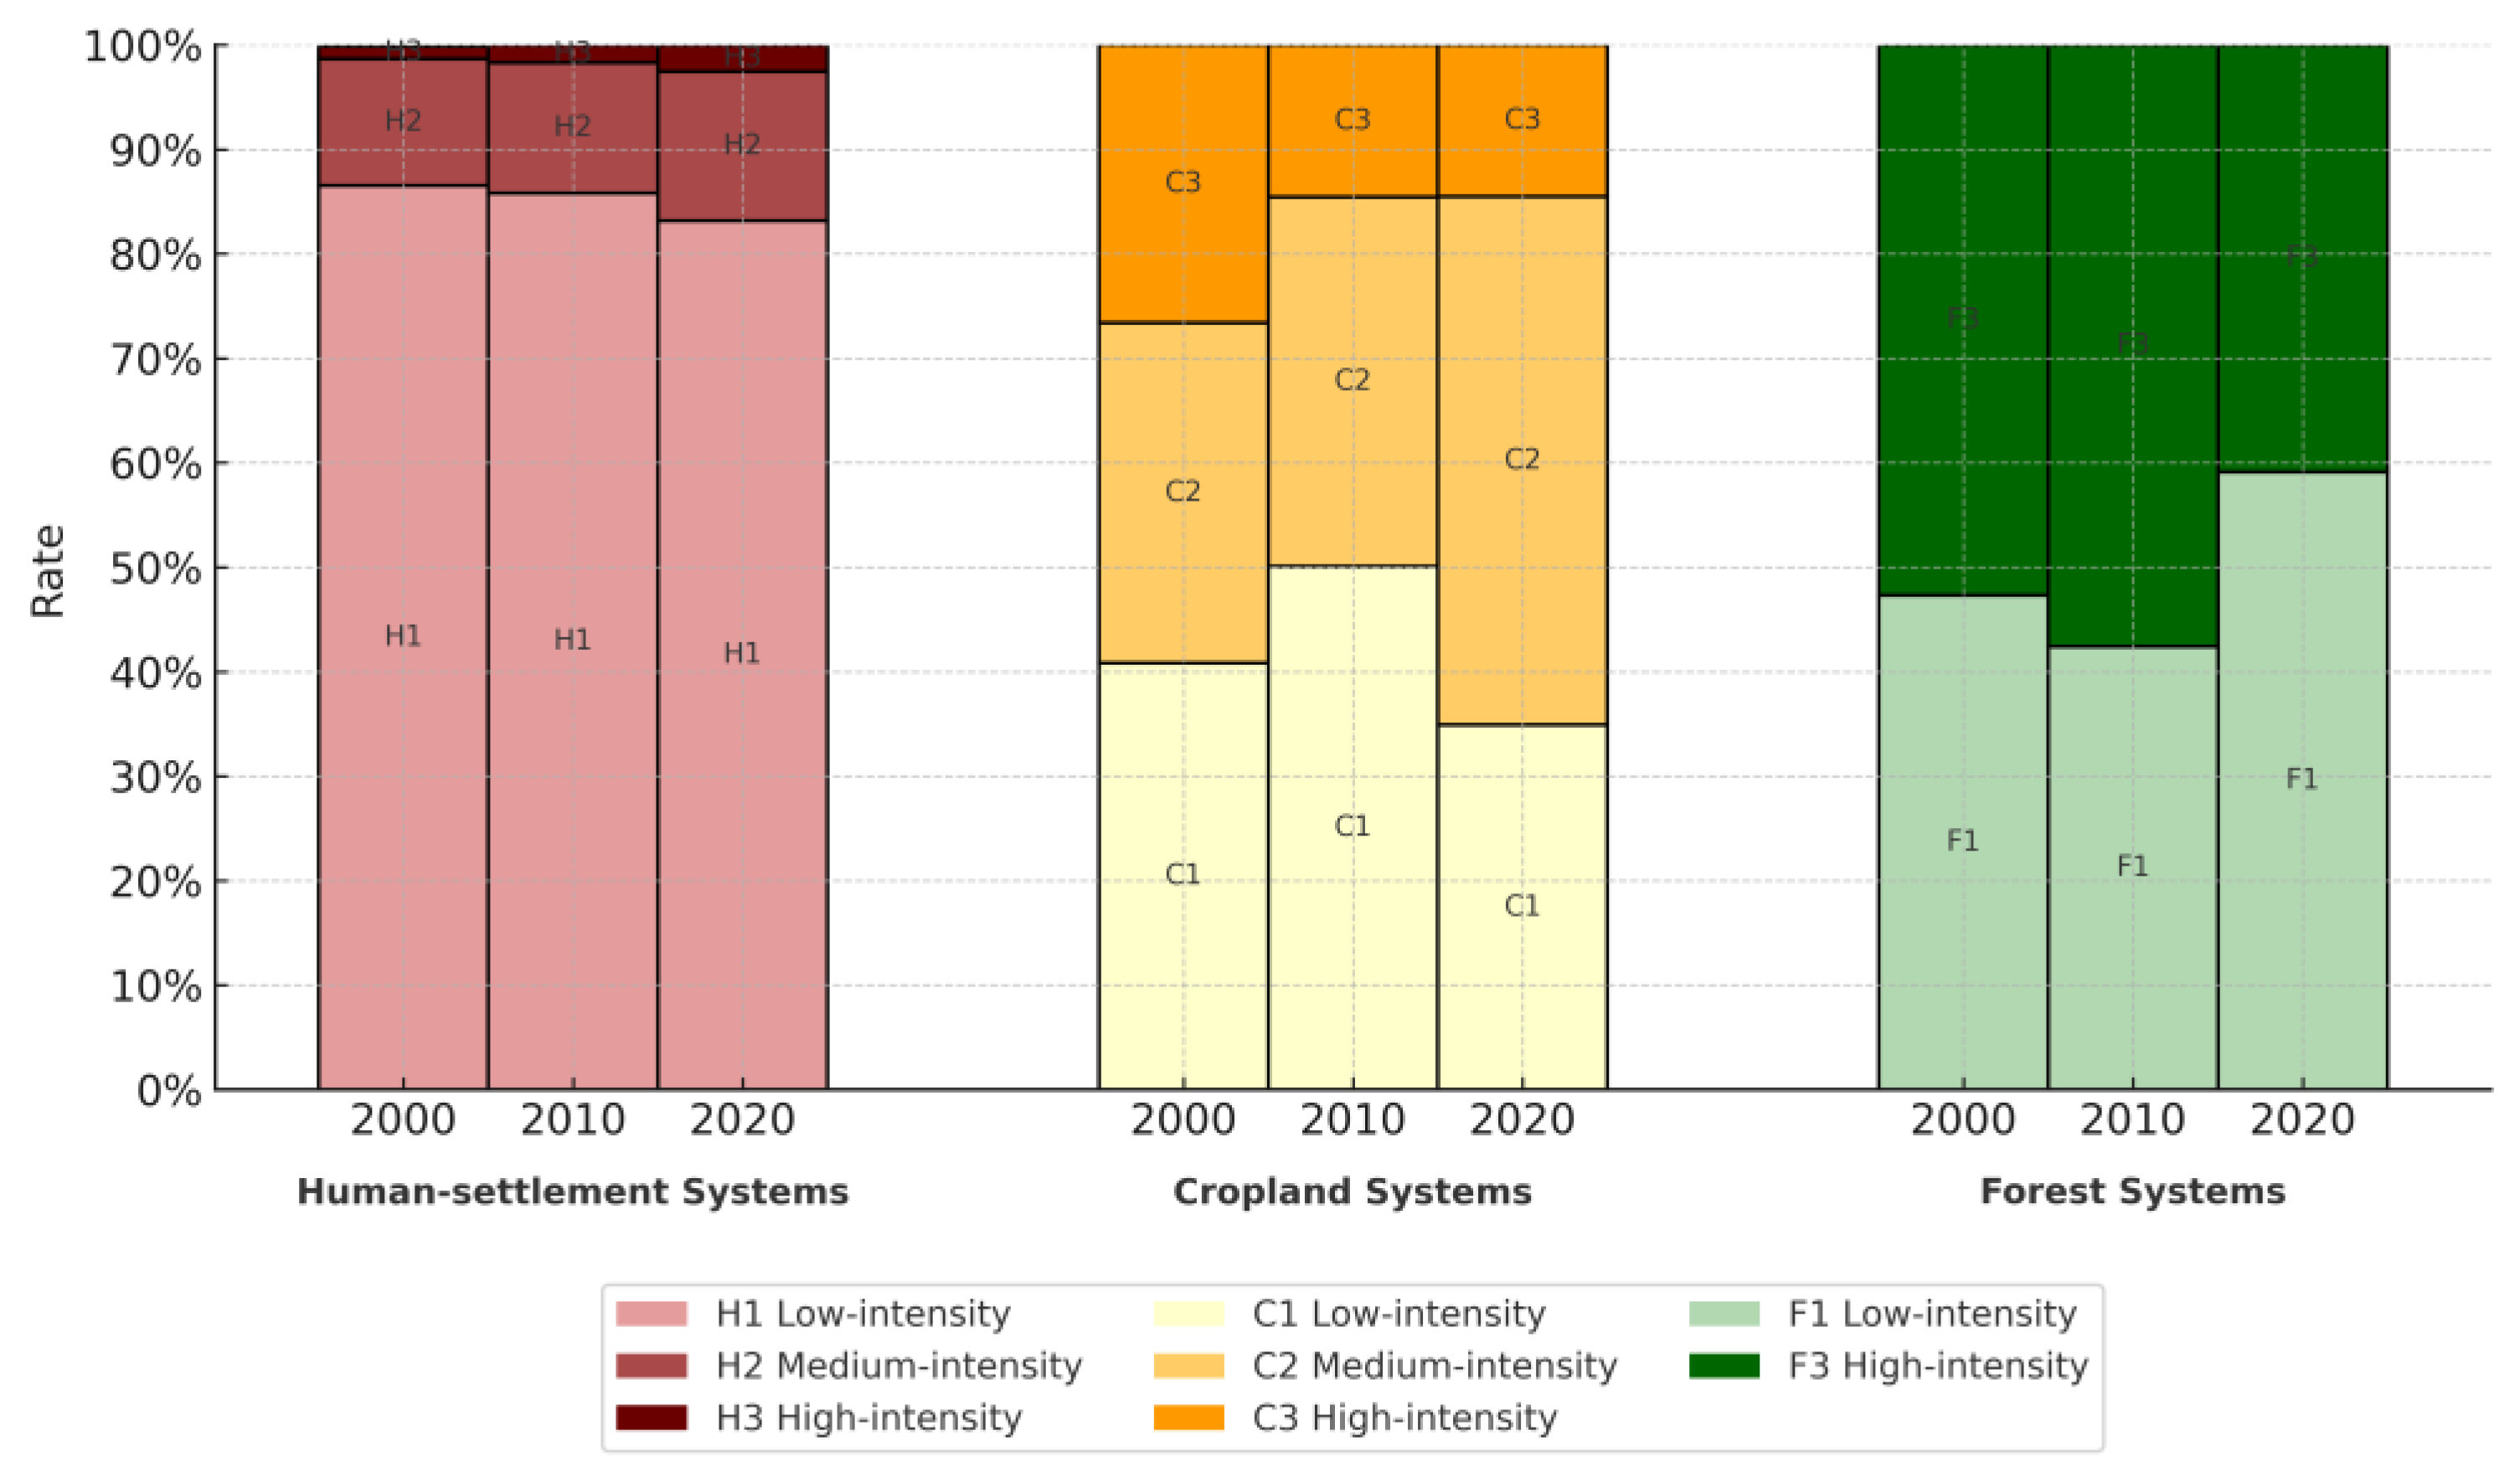
Figure 4.
Spatial distribution of LUI across the GPUA from 2000 to 2020.
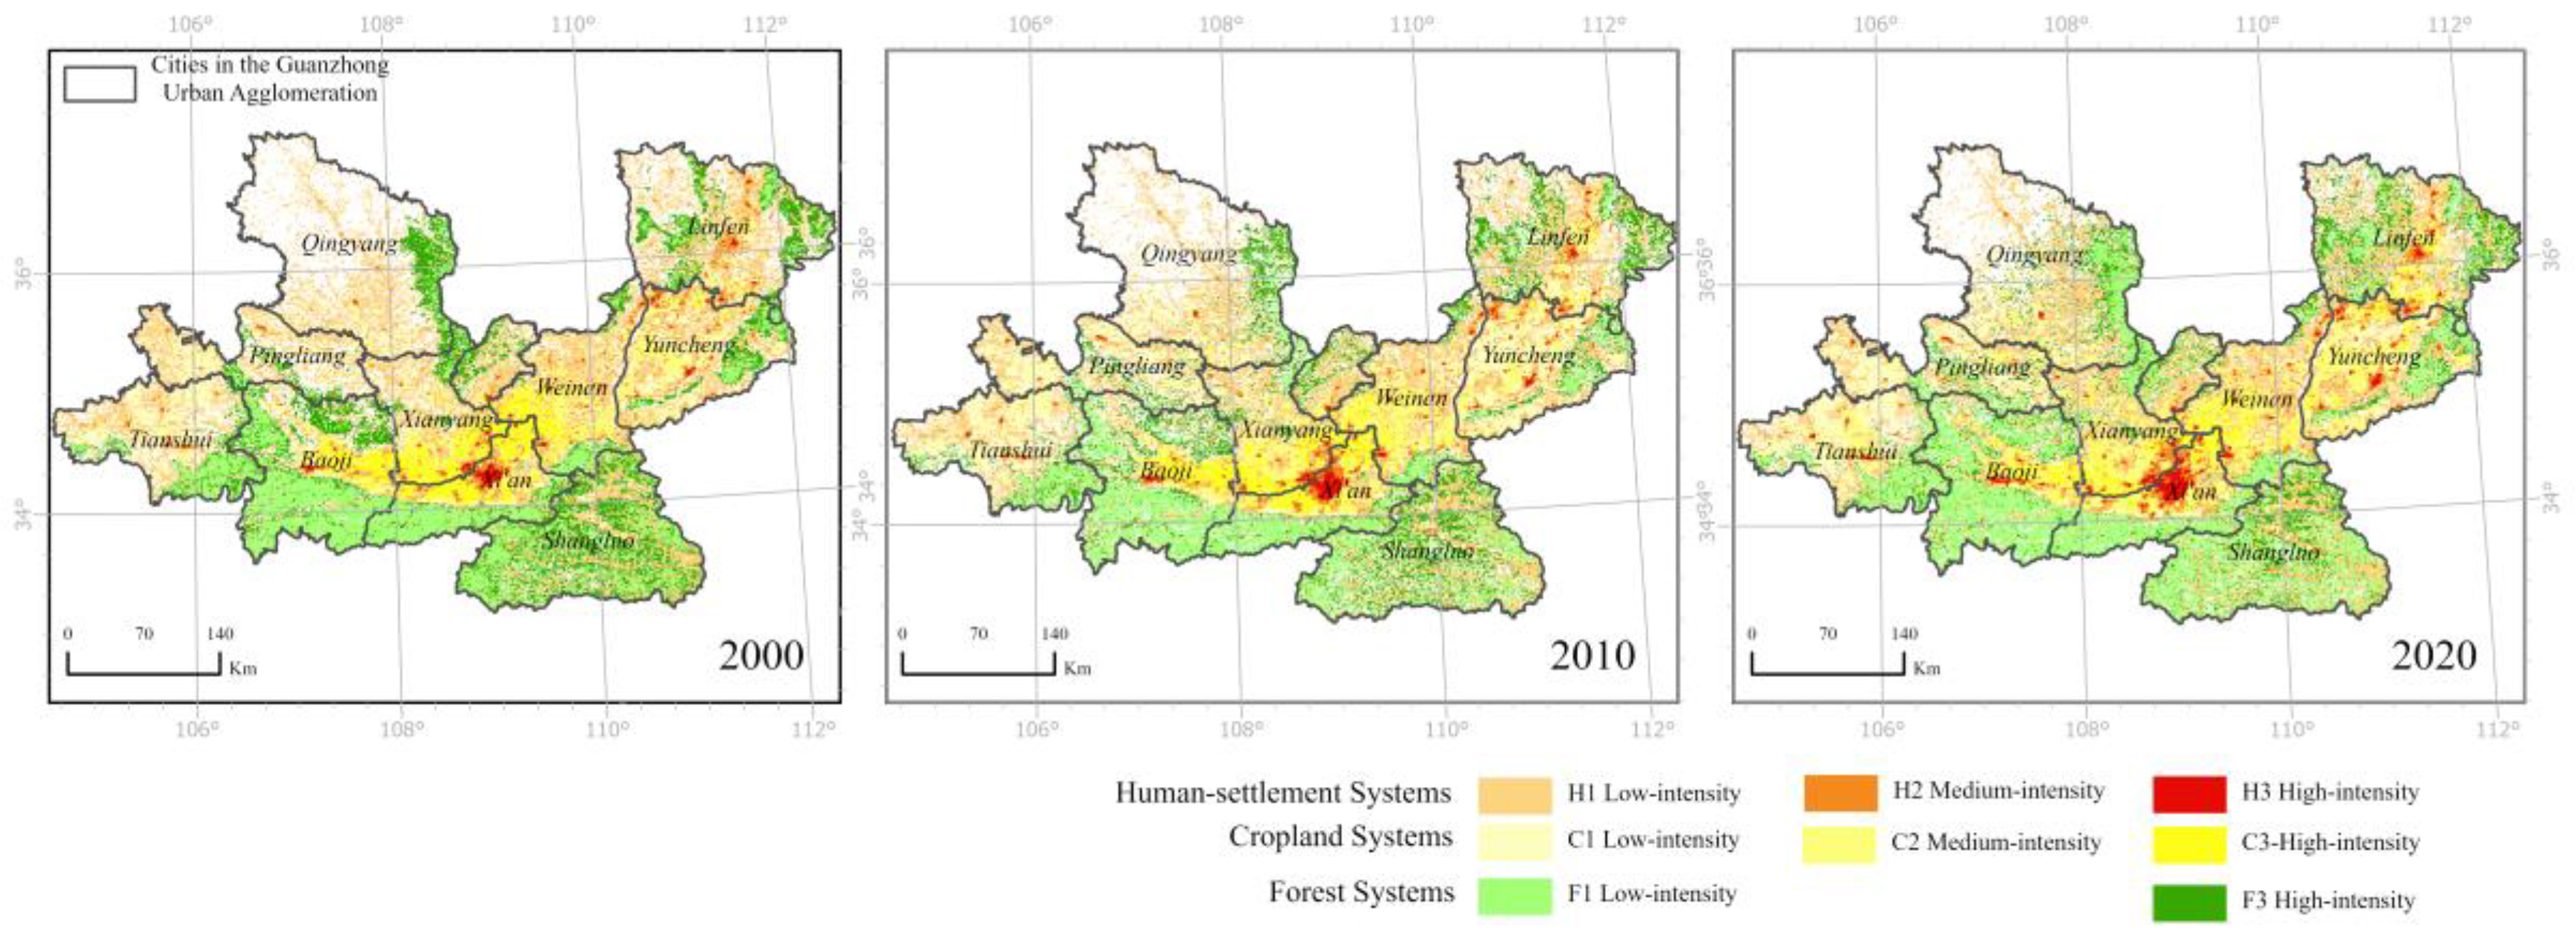
Figure 5.
Urban–rural gradient variation of subsystem LUI in the GPUA between 2000 and 2020.
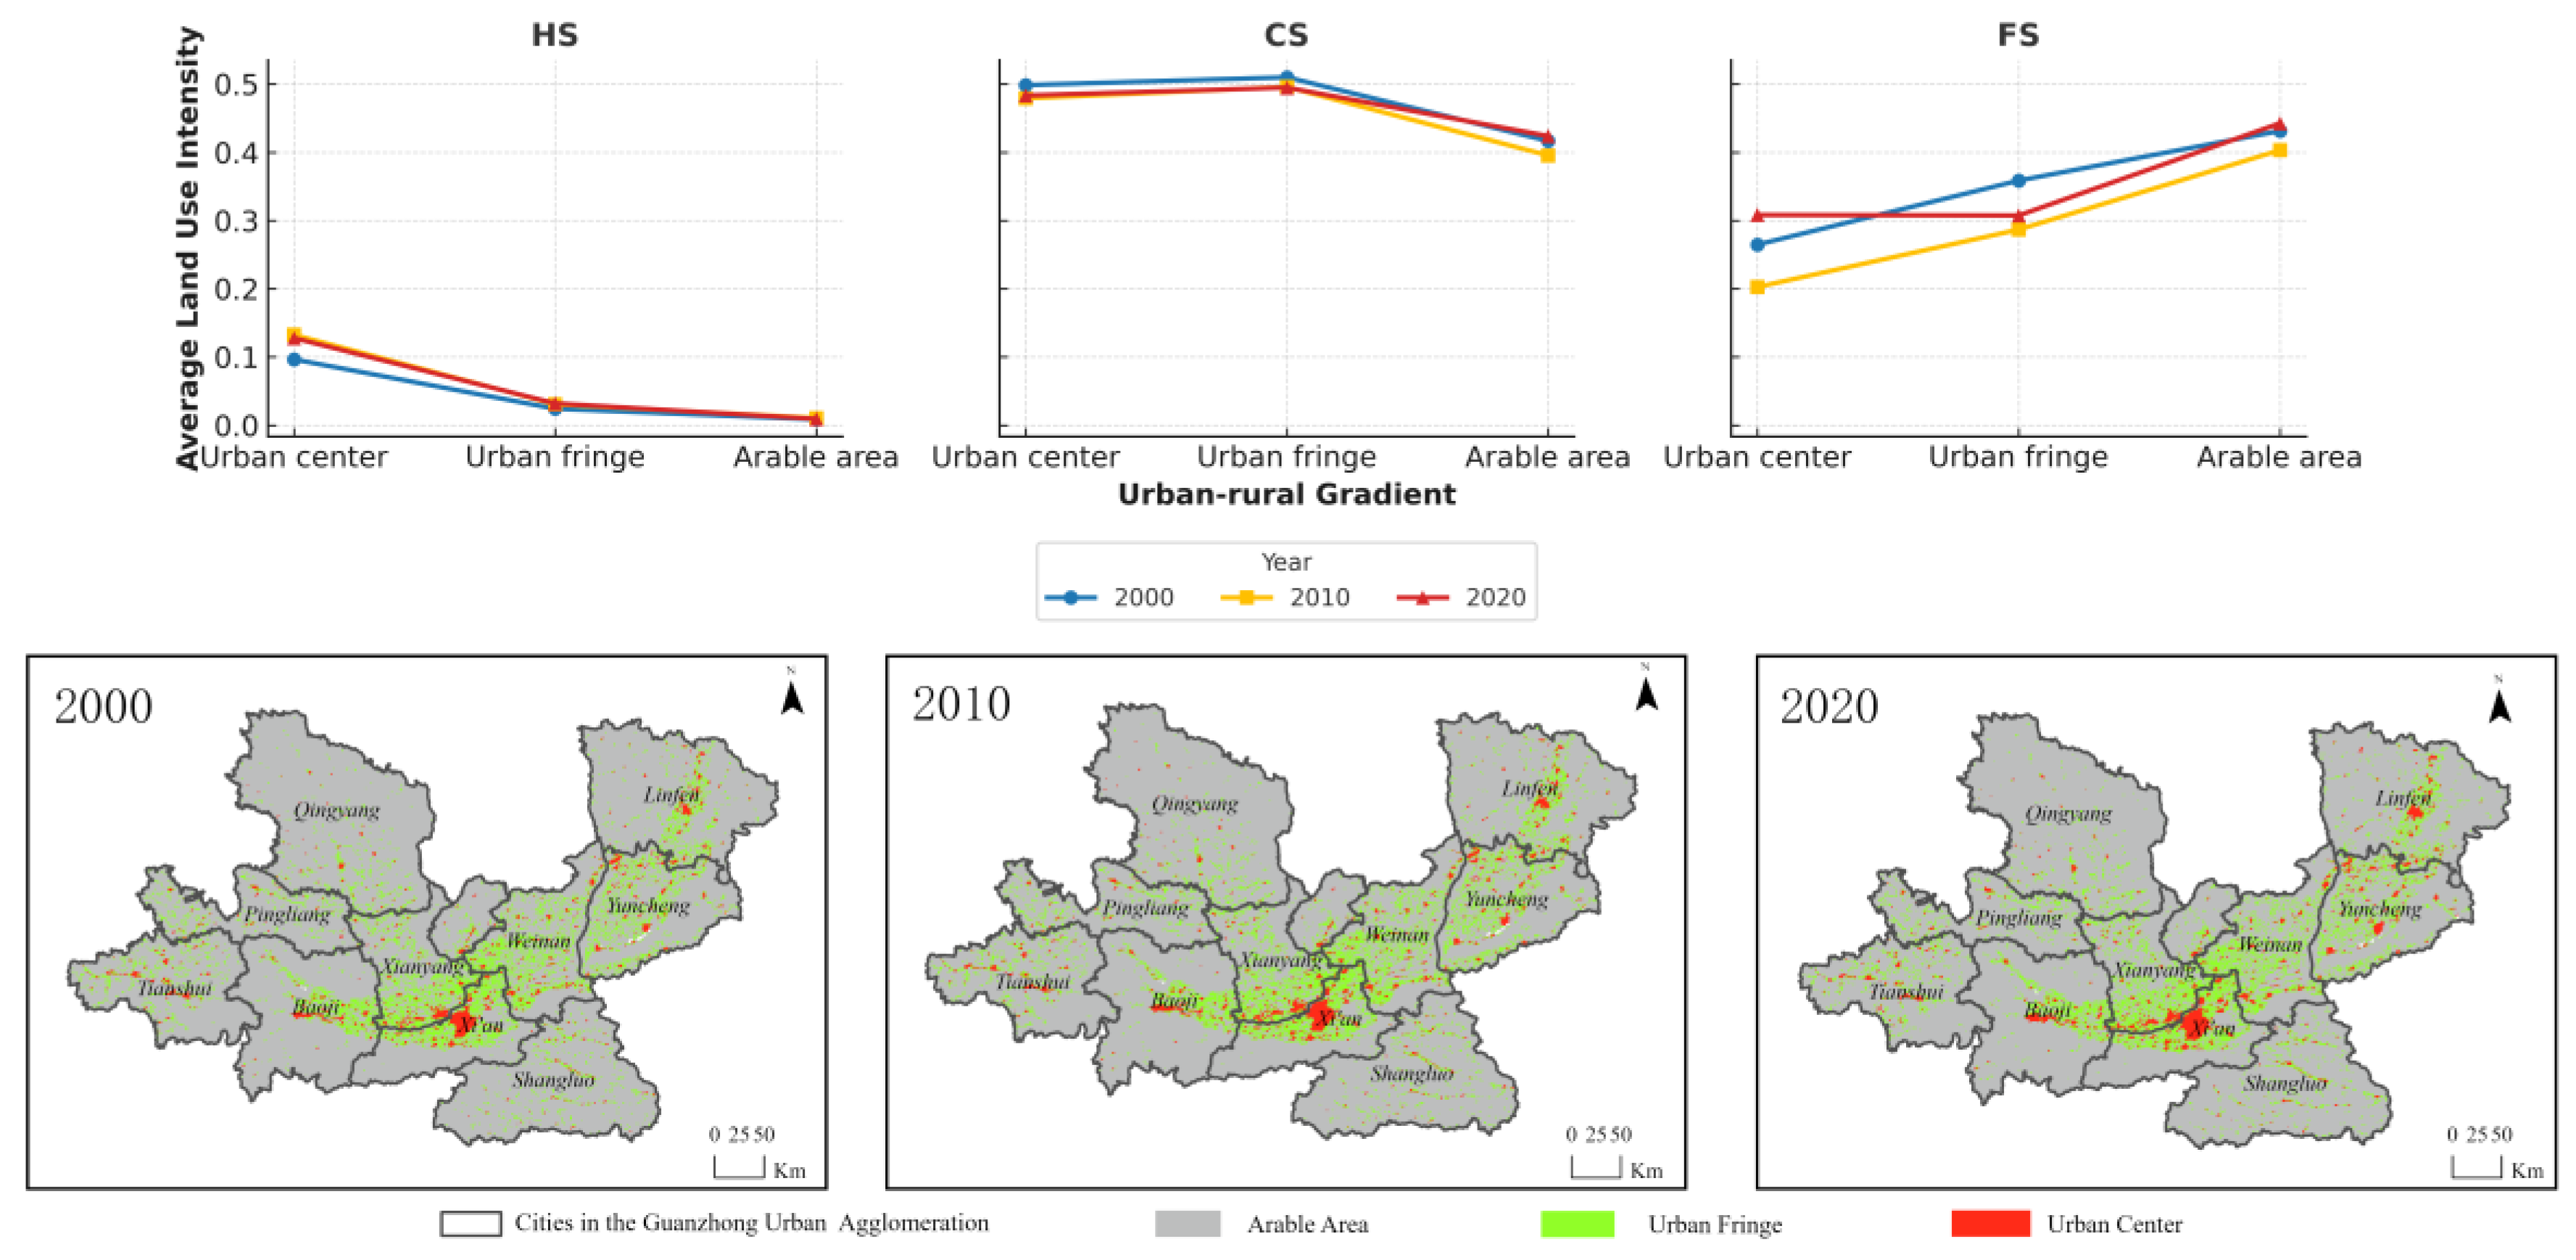
Figure 6.
Patterns of LUI change over 2000–2010 and 2010–2020.
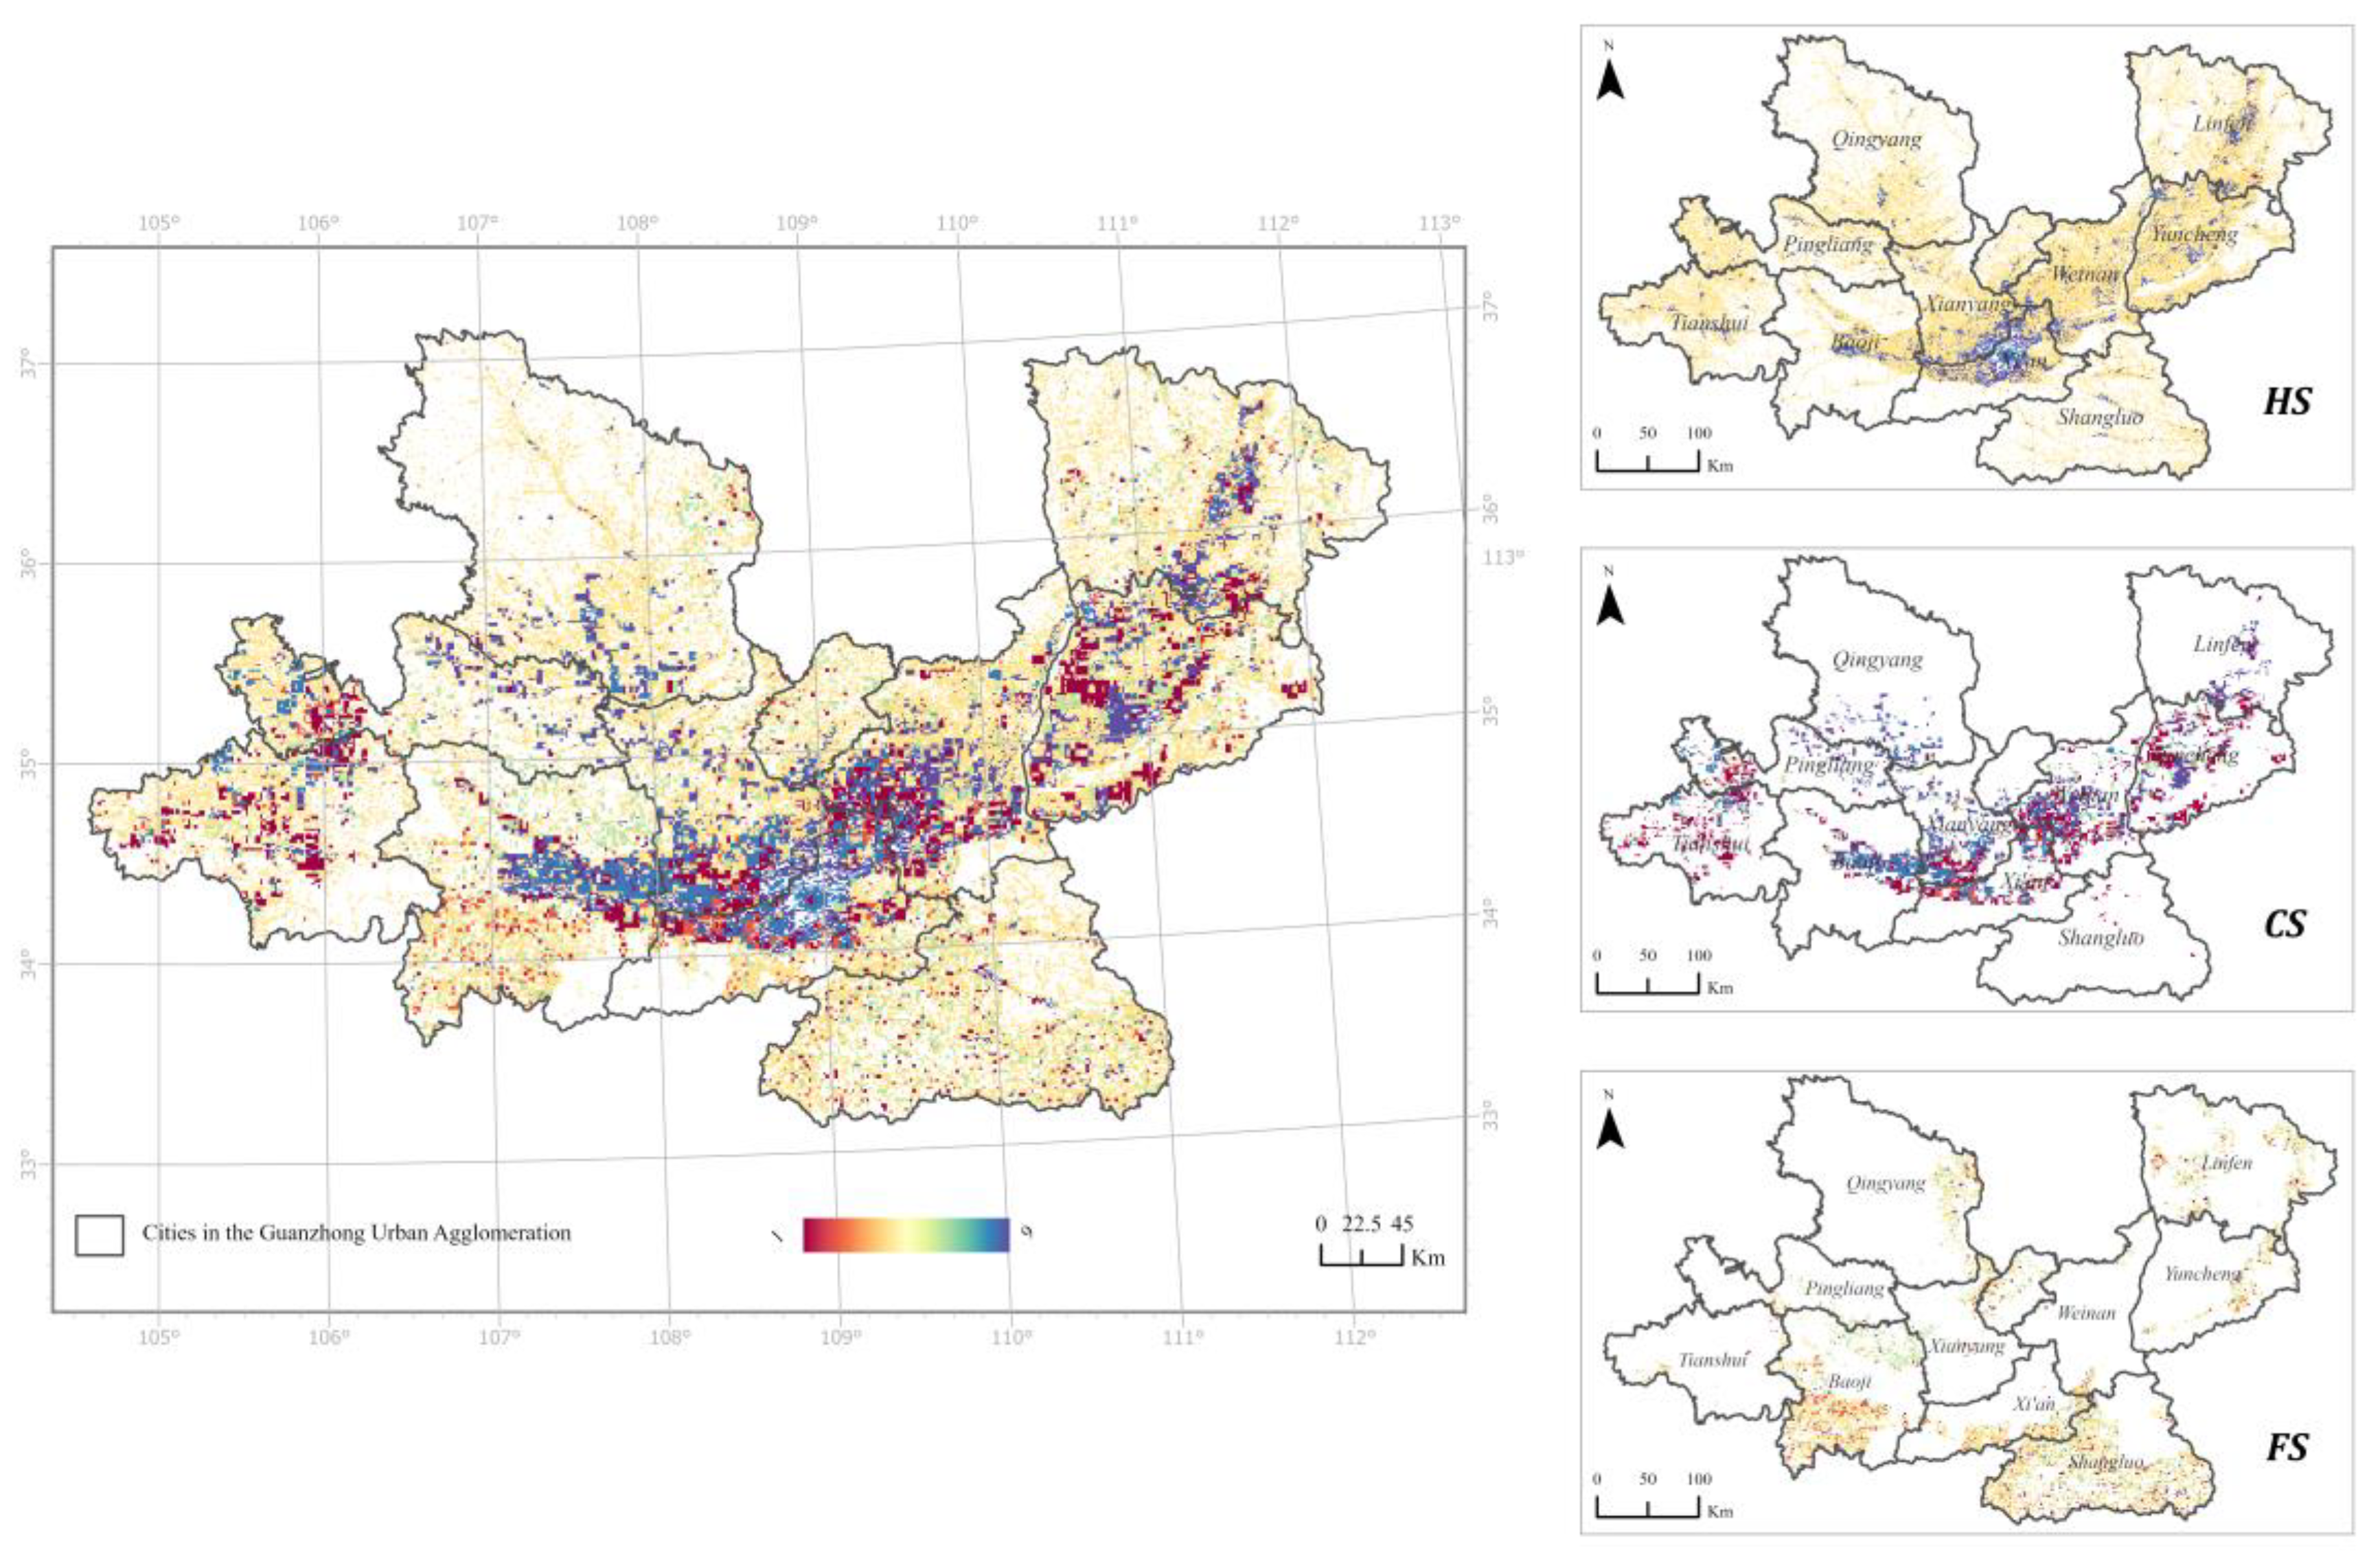
Figure 7.
Spatial distribution of the eleven explanatory variables used in LUI driver analysis.
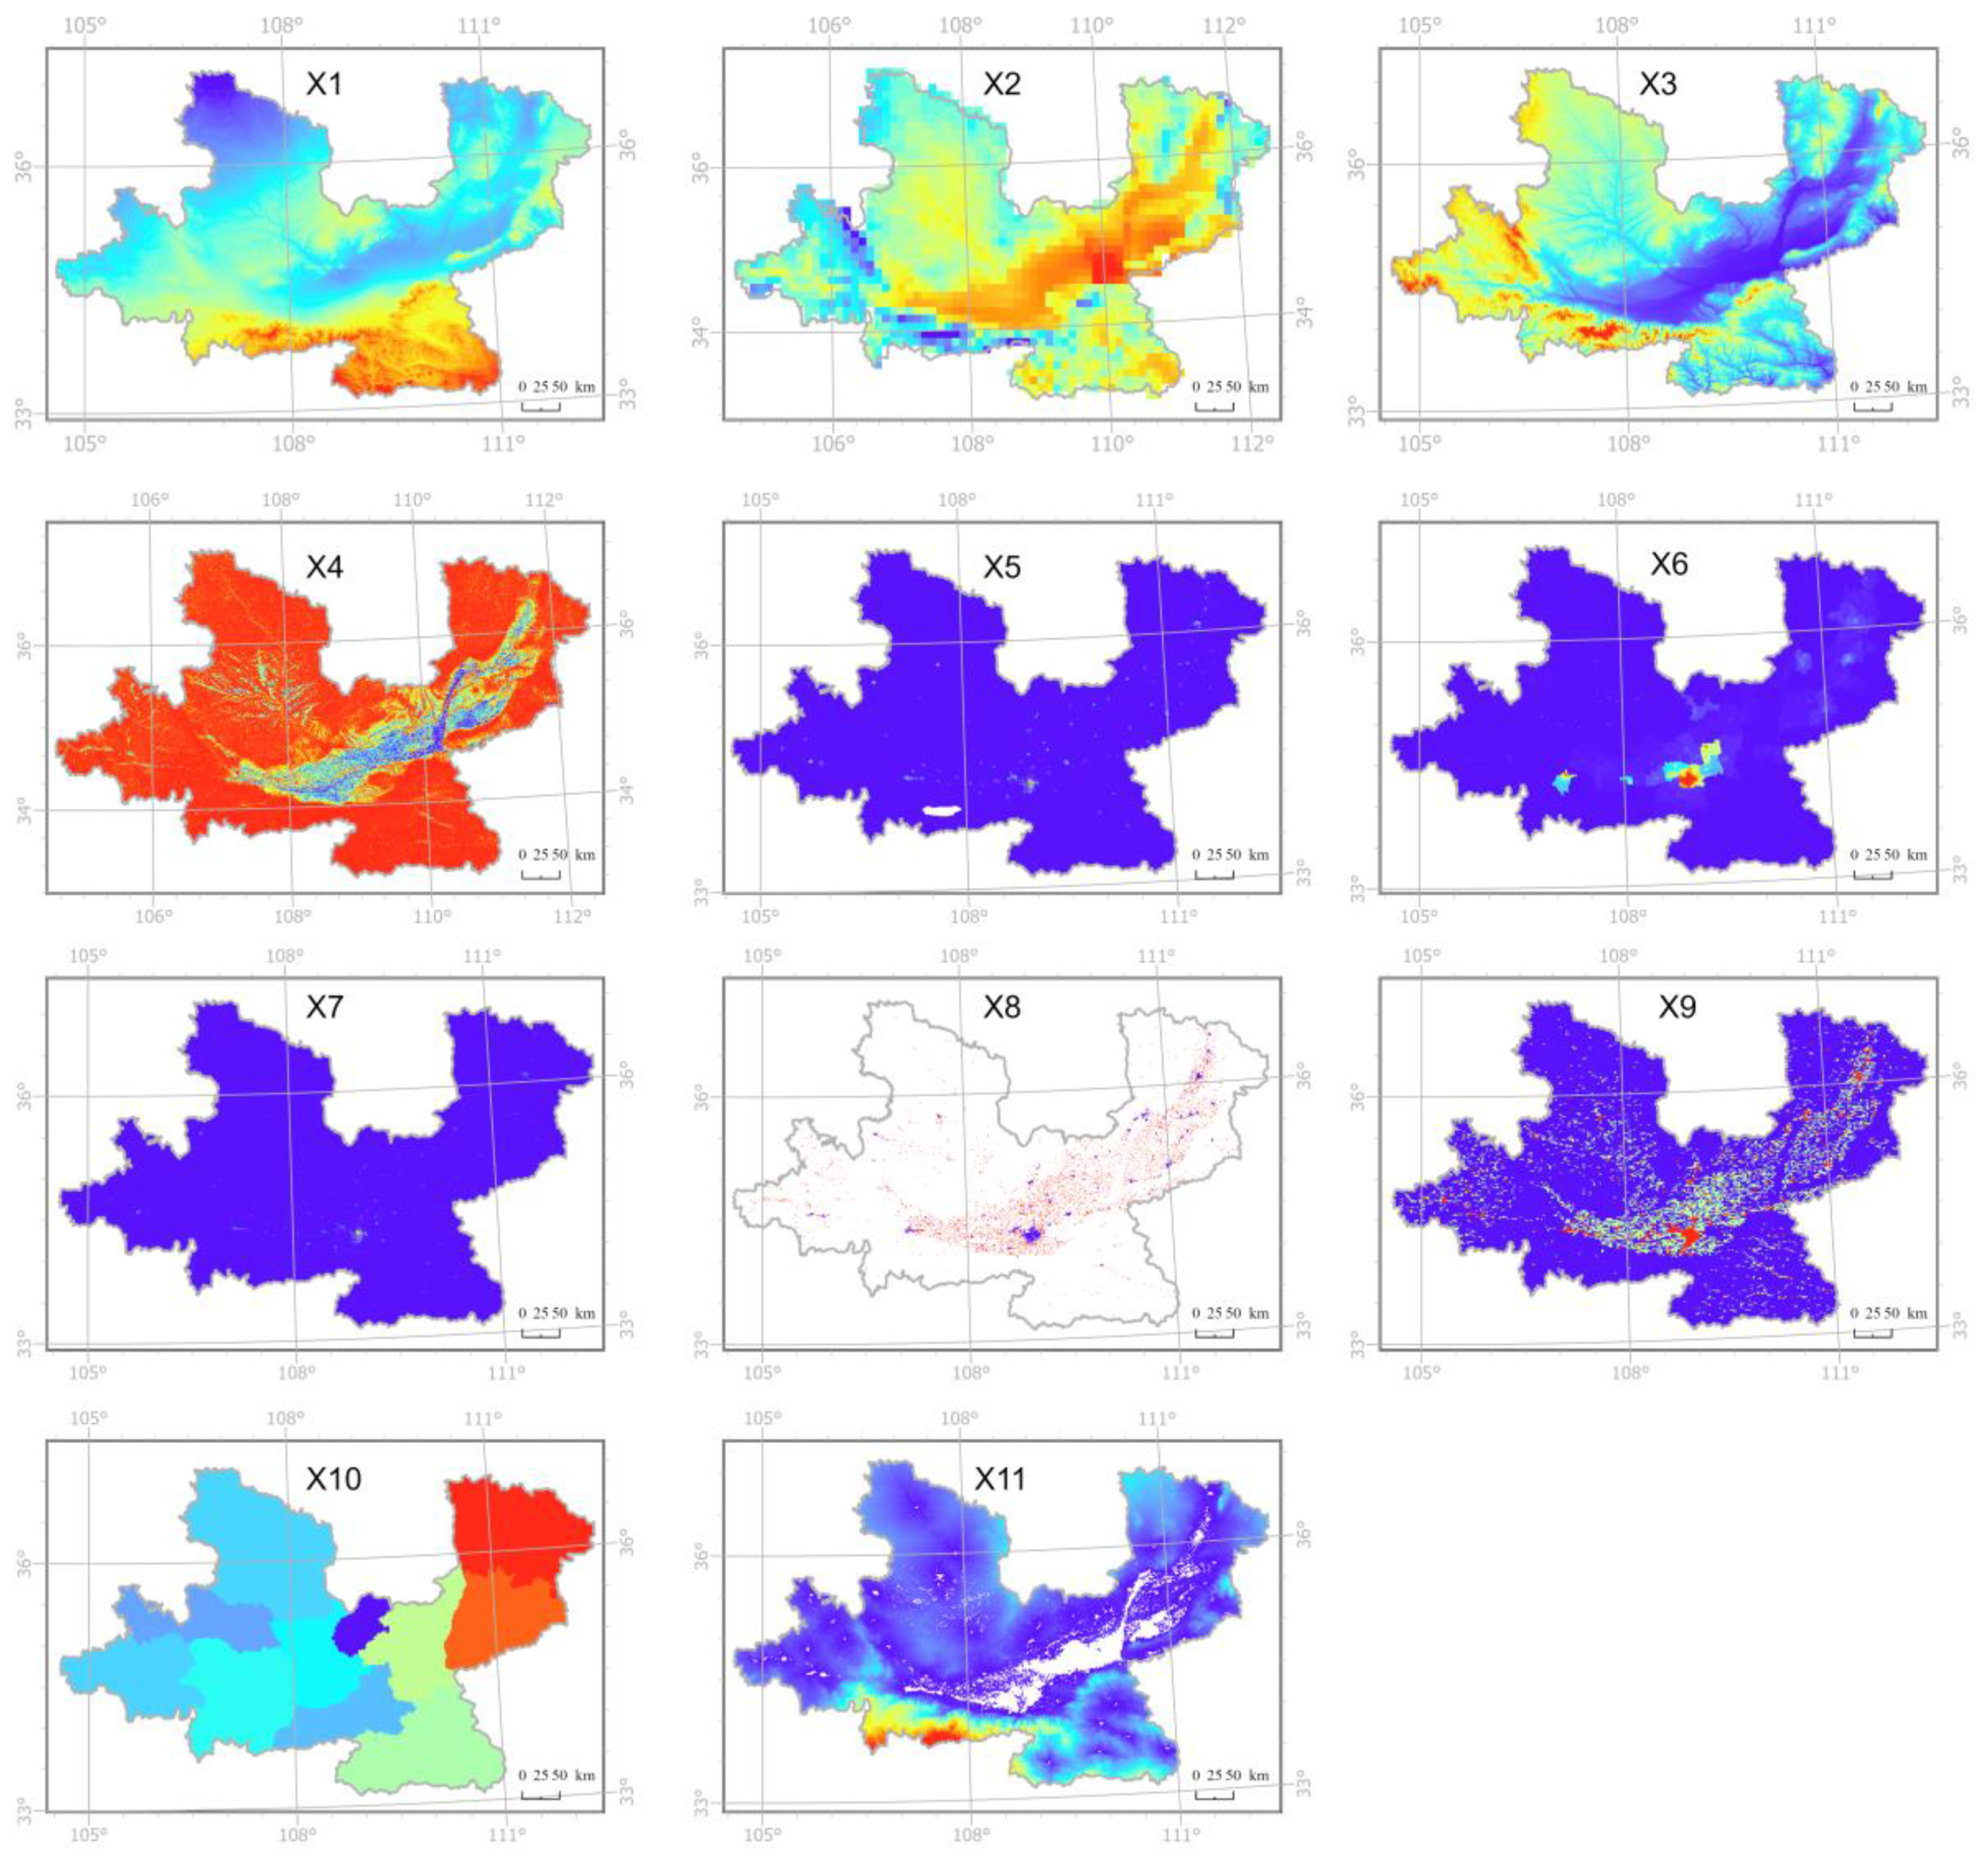
Figure 8.
Aggregated LUI summary plot for each subsystem (HS, CS, FS) over 2000–2020.
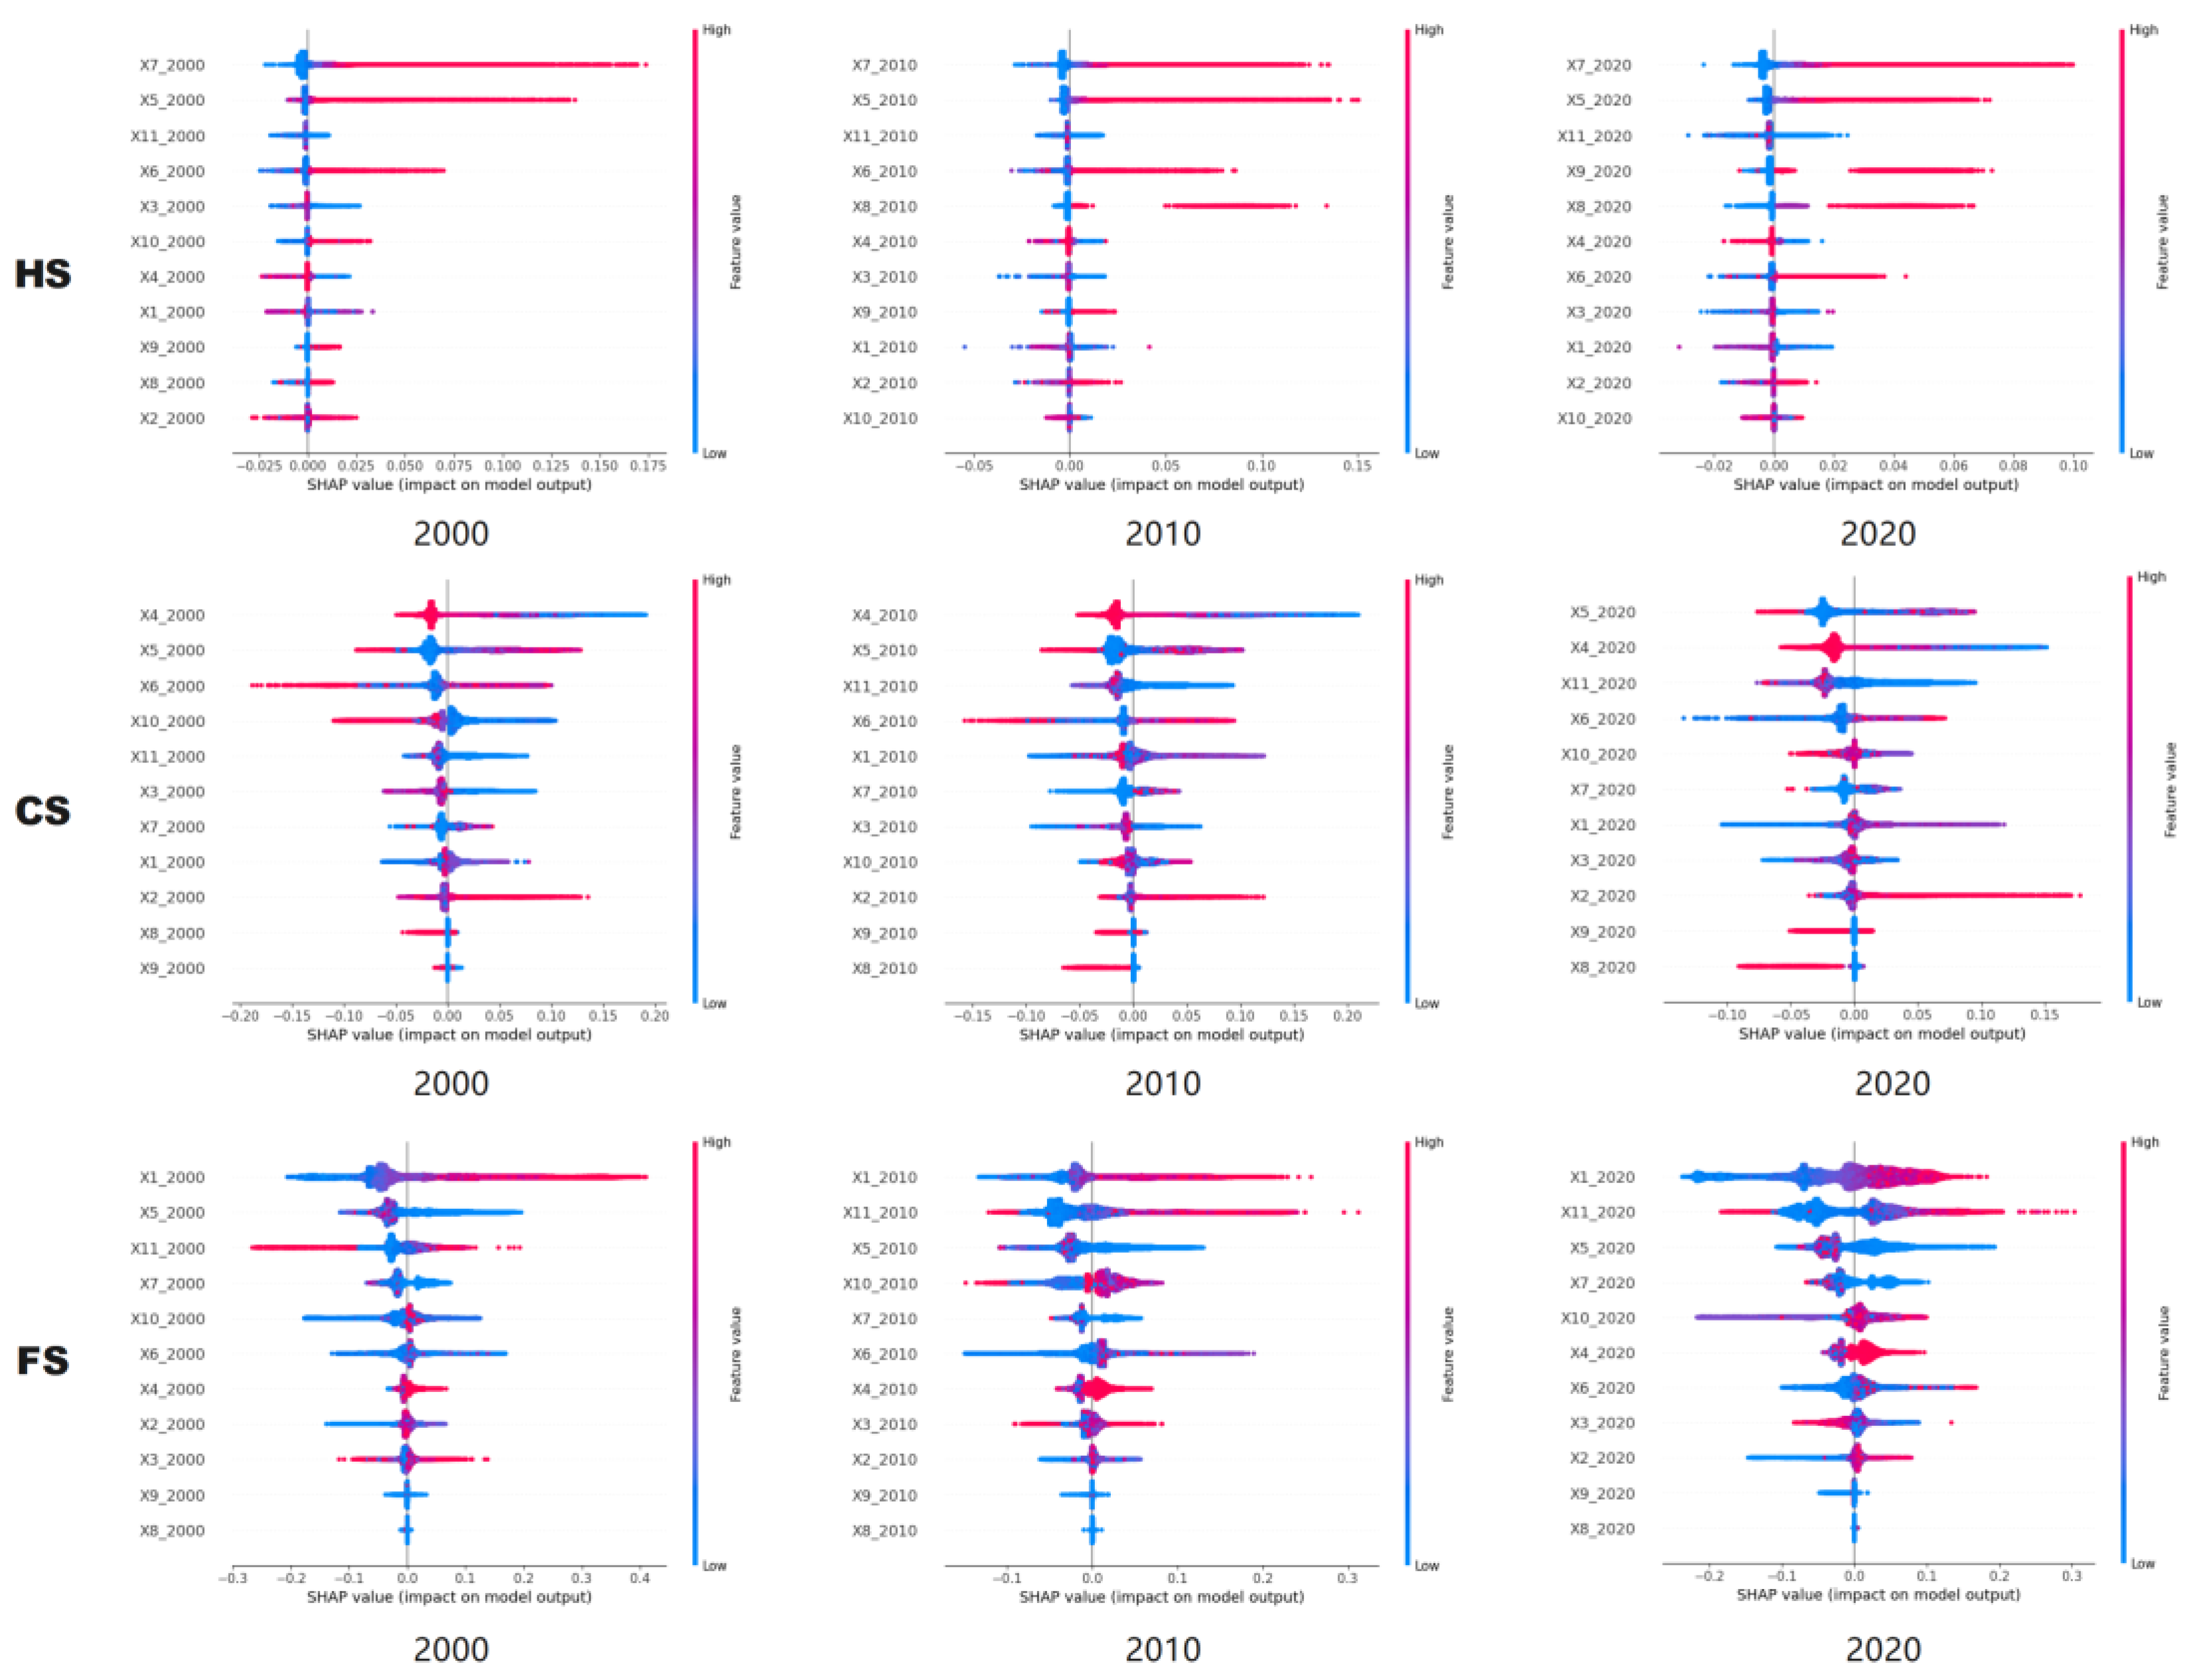
Figure 9.
SHAP dependence plots of the most significant drivers of LUI in each subsystem (2000–2020).
Figure 9.
SHAP dependence plots of the most significant drivers of LUI in each subsystem (2000–2020).
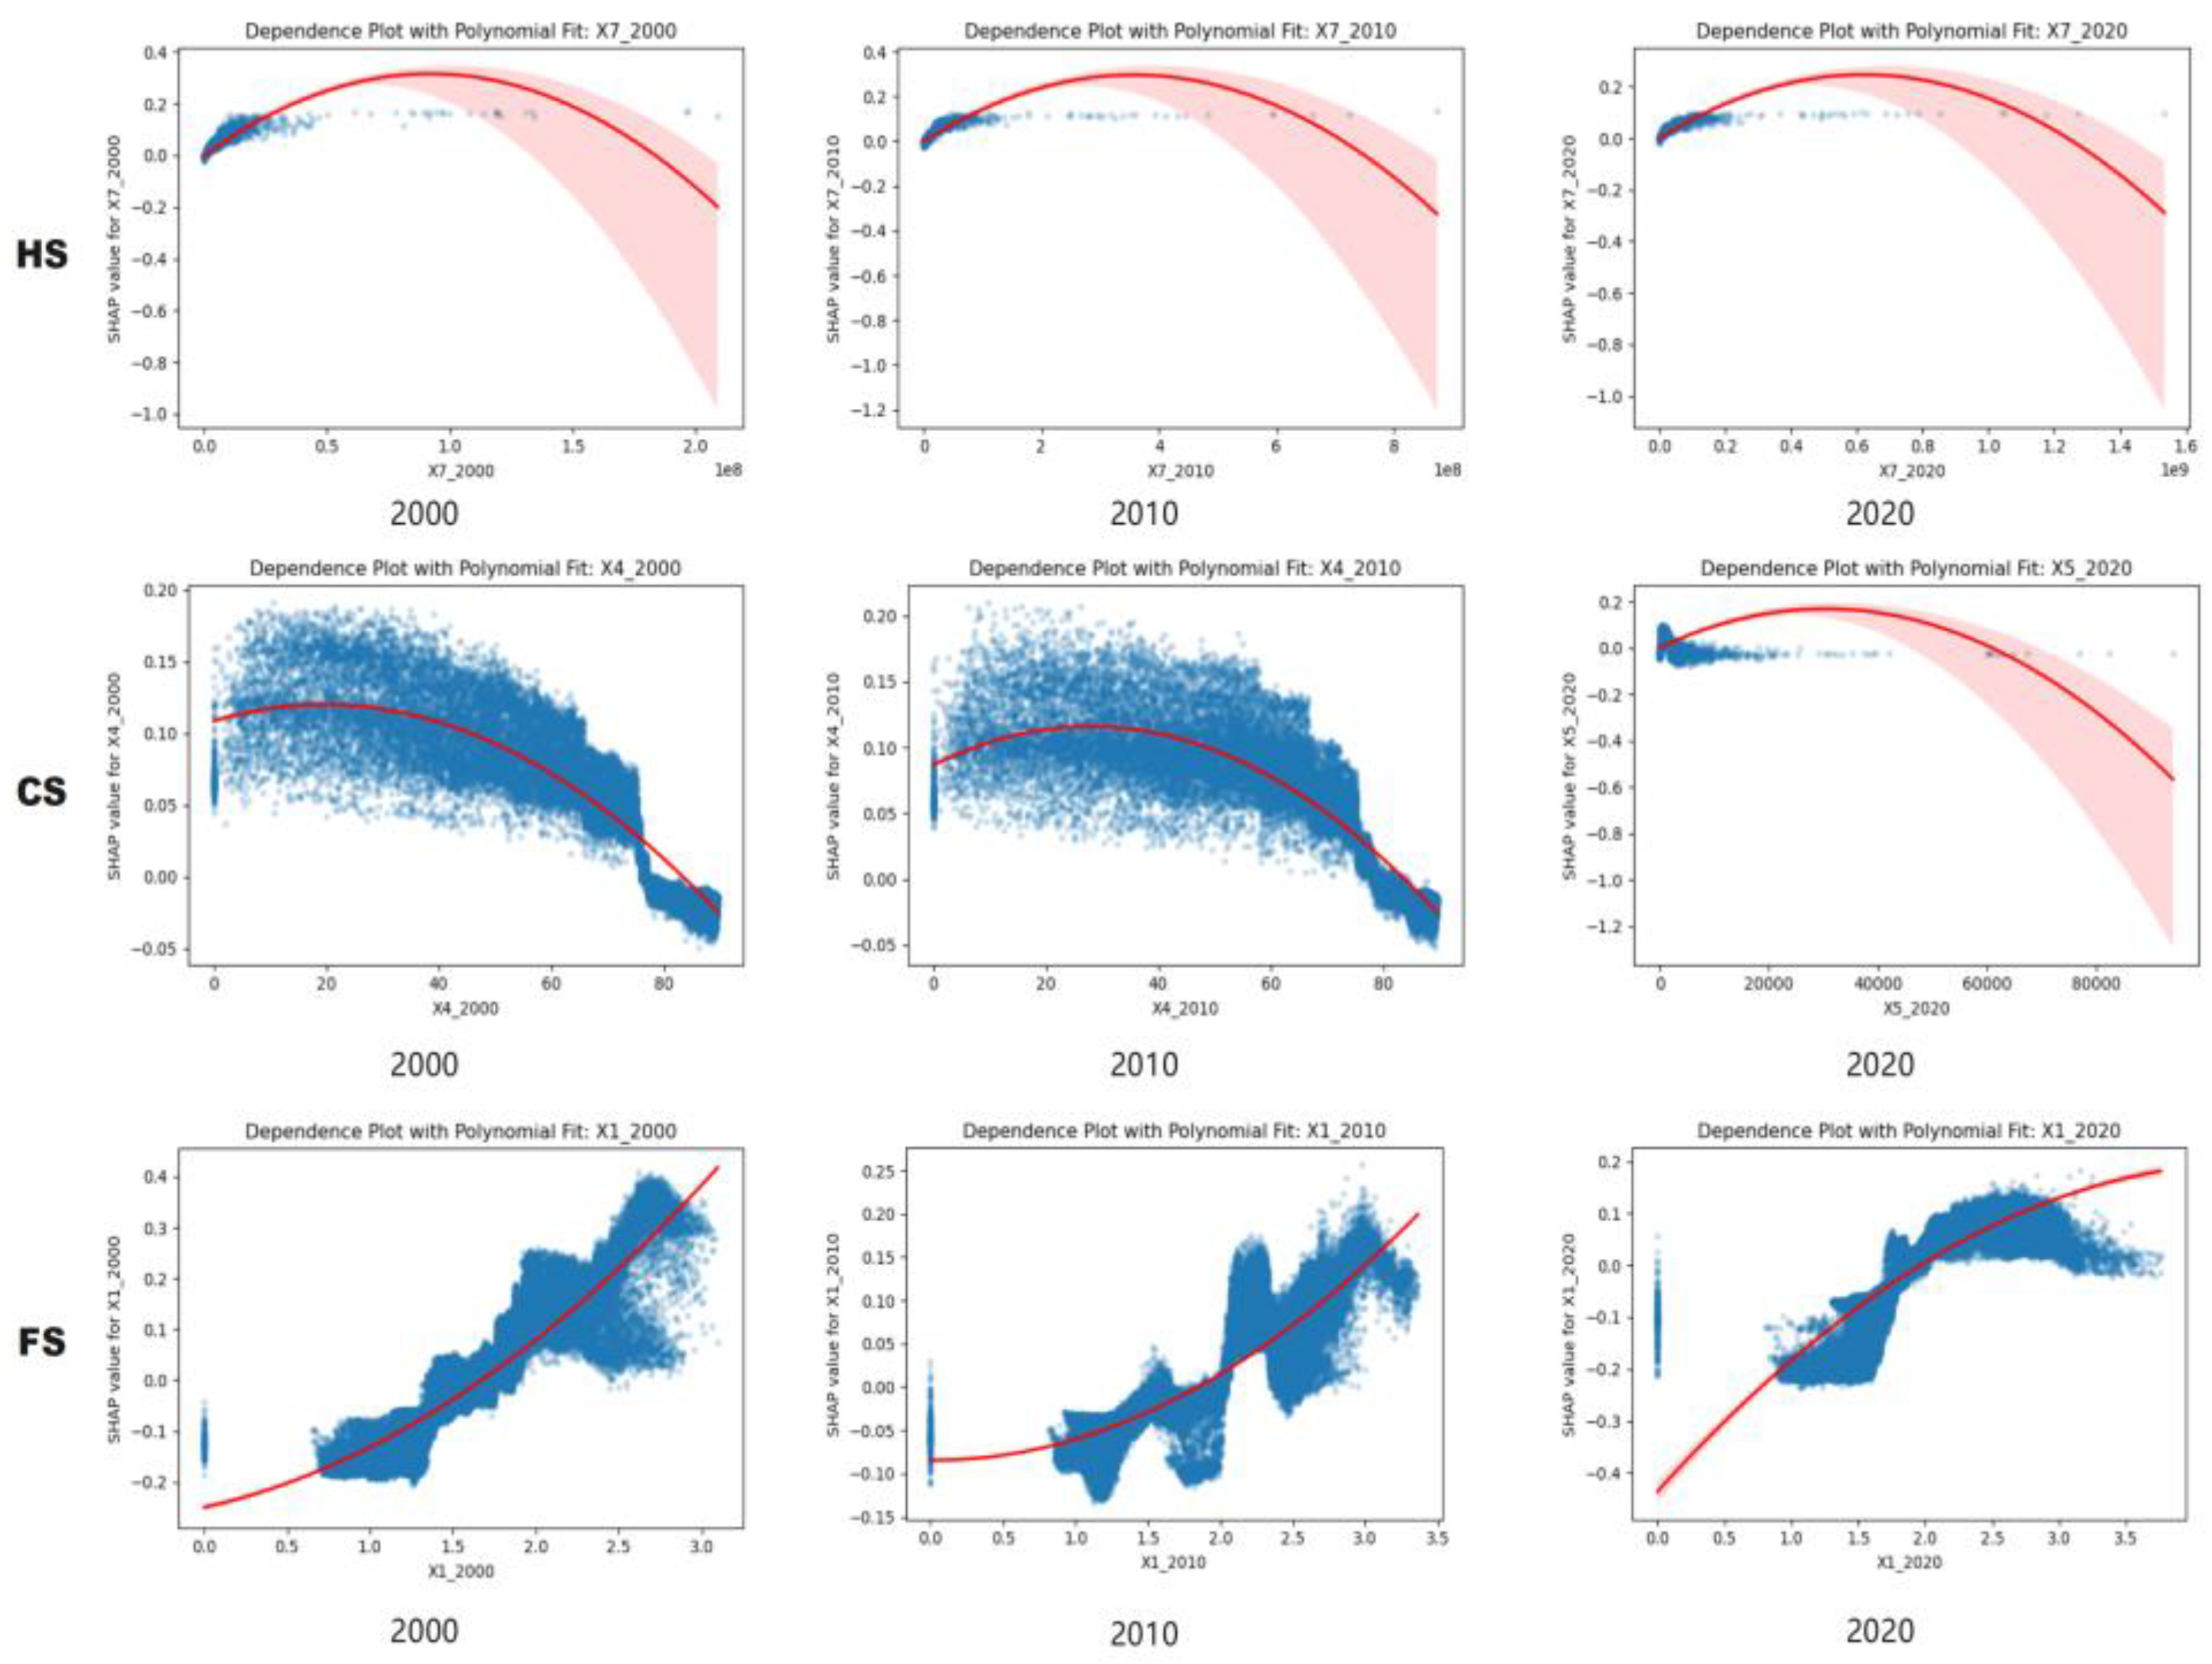
Figure 10.
SHAP dependence plots of emerging and transitional drivers affecting each subsystem’s LUI (2000–2020).
Figure 10.
SHAP dependence plots of emerging and transitional drivers affecting each subsystem’s LUI (2000–2020).
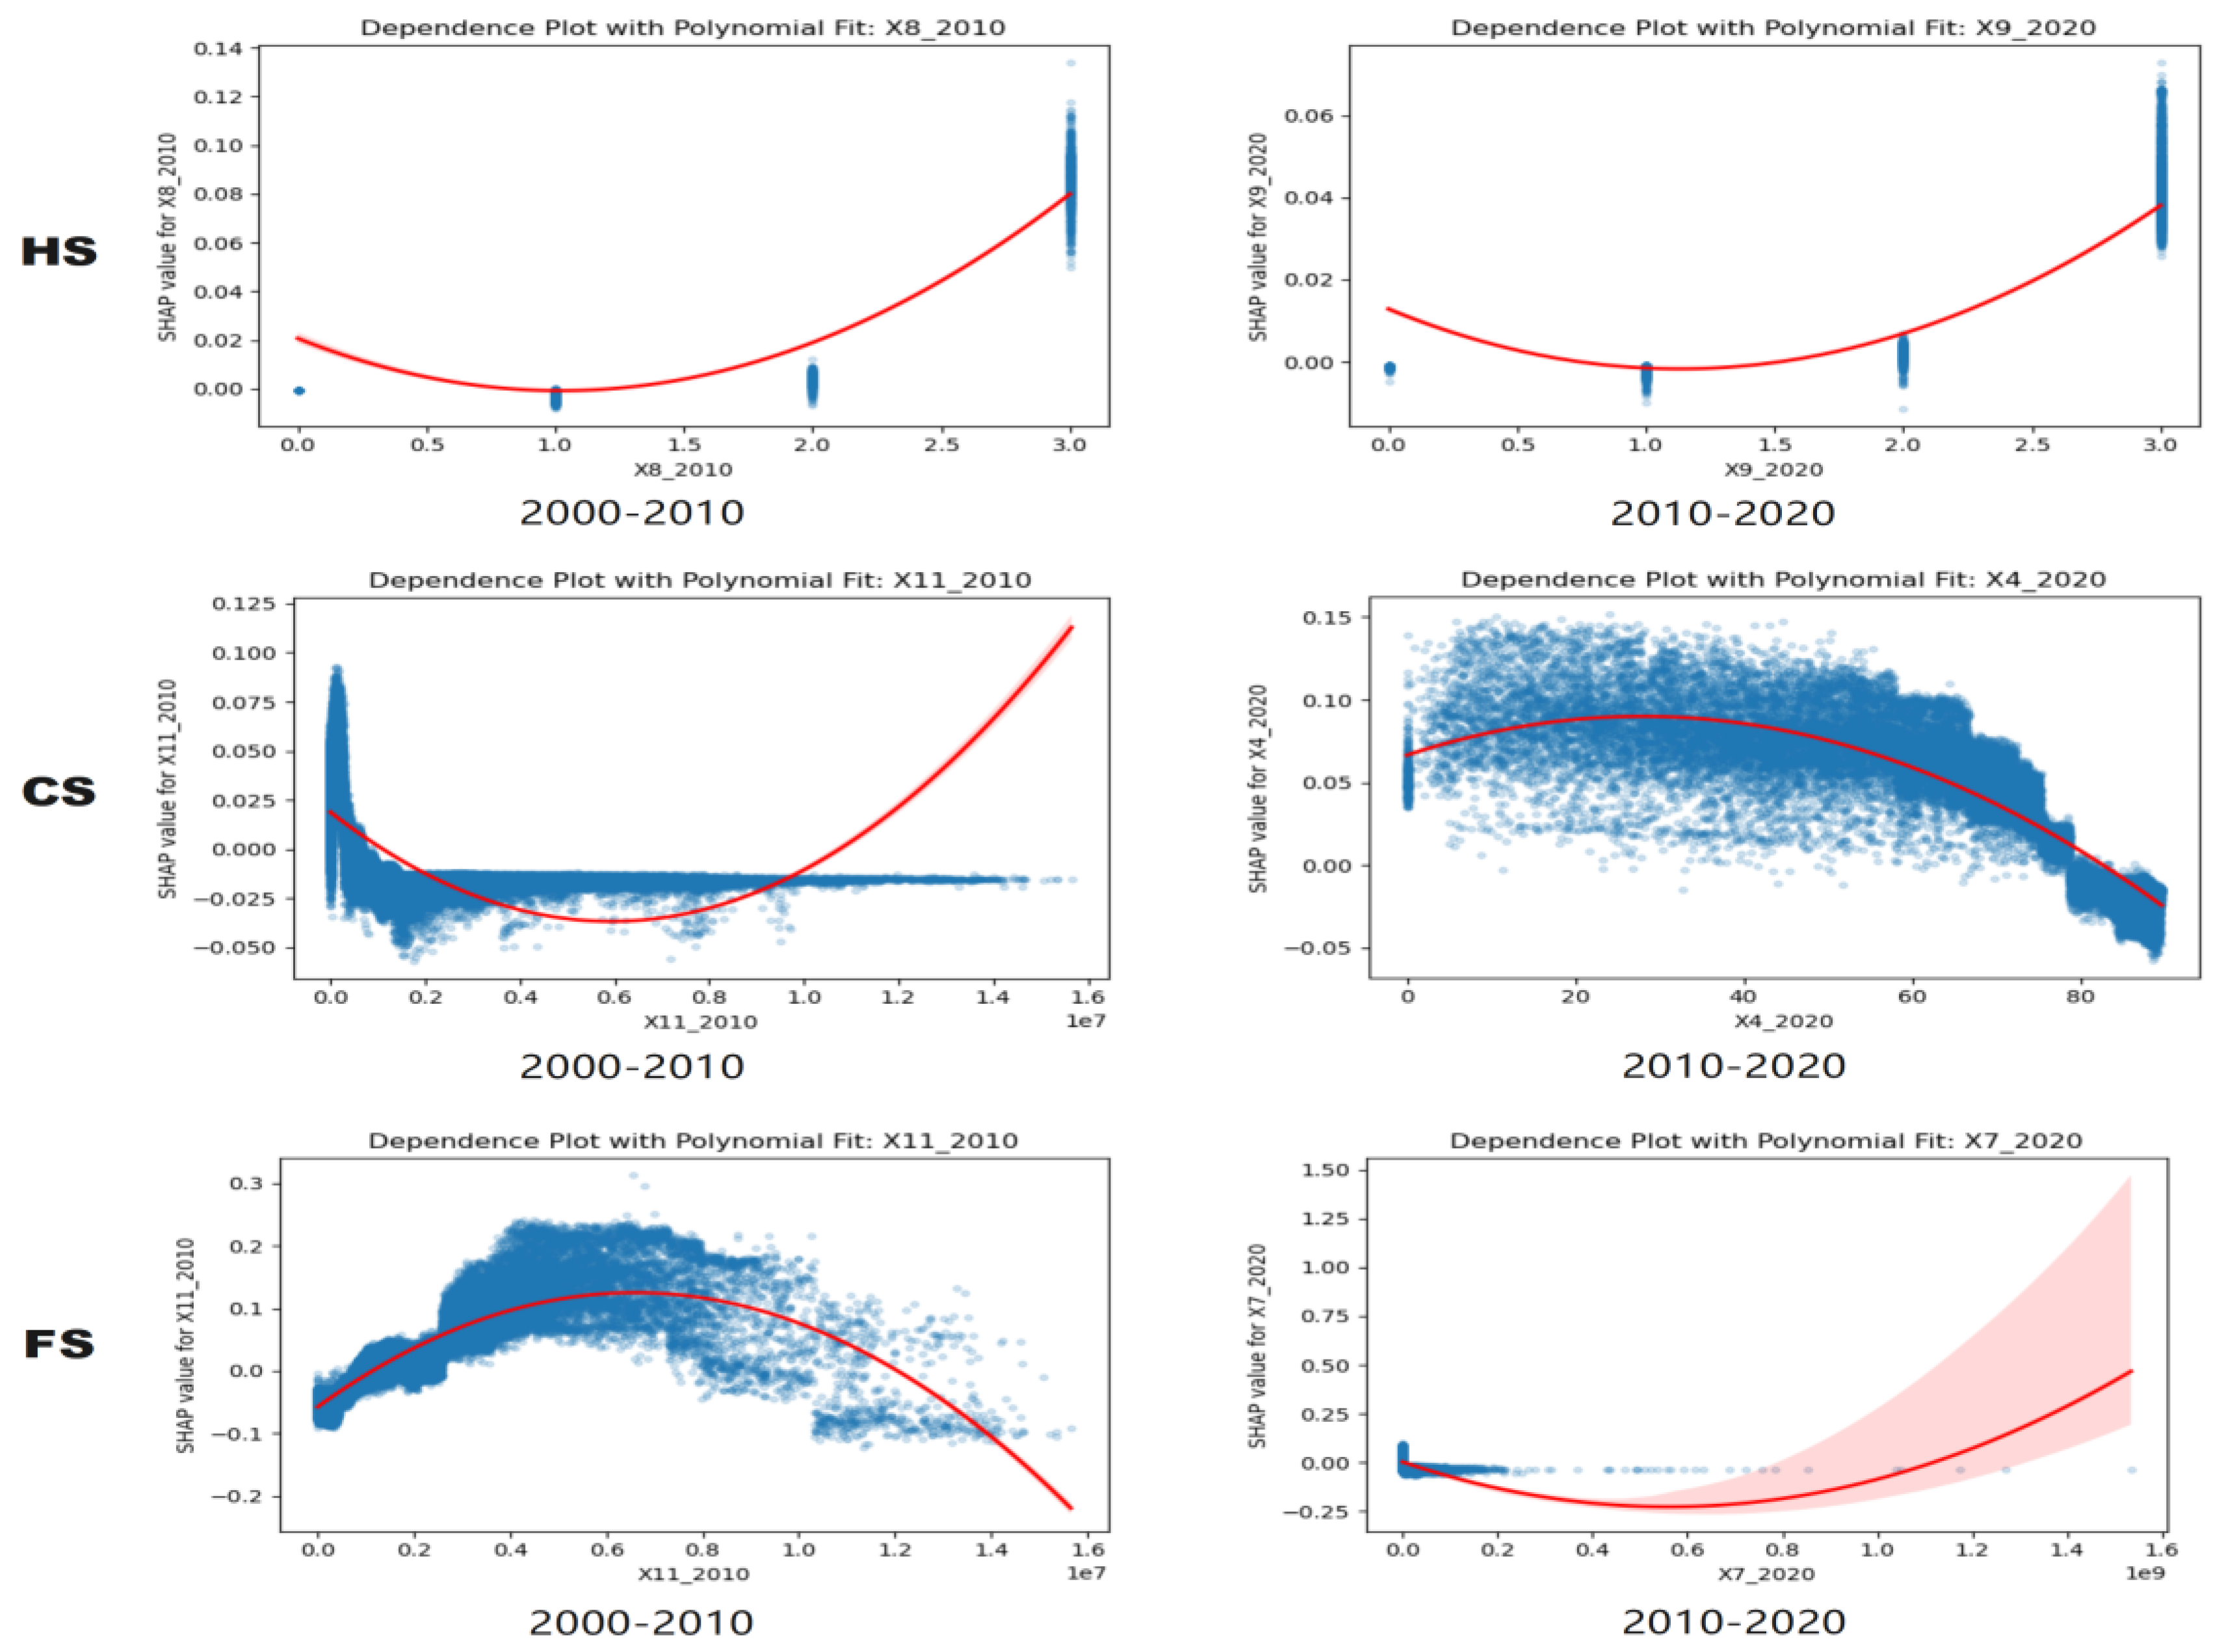

Table 1.
Indicators and data sources used to construct composite land use intensity (LUI) indices for human-settlement, cropland, and forest subsystems.
Table 1.
Indicators and data sources used to construct composite land use intensity (LUI) indices for human-settlement, cropland, and forest subsystems.
| Subsystem | Indicator | Source | Spatial Resolution |
|---|---|---|---|
| Human-settlement Systems | Population Density (PD) | Global Human Settlement Layer (GHSL), European Commission [40] | 100 m |
| Built-up Volume (BV) | Global Human Settlement Layer (GHSL), European Commission [40] | 100 m | |
| Nighttime Light (NTL) | Global Annual Simulated VIIRS Nighttime Light Dataset (1992–2023) [41] | 500 m | |
| Crop Systems | Cropping Intensity (CI) | Annual Dynamic Dataset of Global Cropping Intensity (2001–2019) [42] | 250 m |
| Grains Production (GP) | Global Wheat Yield 4 km [43] | 4 km | |
| Nitrogen Fertilizer Inputs (NFI) | History of Anthropogenic Nitrogen Inputs (HaNI) [44] | 300 m | |
| Forest Systems | Forest Management (FM) | Annual Maps of Global Forest Management Types (2001–2020) [45] | 250 m |
| Forest Reserve (FR) | Boundary Data of National Nature Reserves [46] | - |
Table 2.
List of driving factors for LUI analysis.
| Driving Factors | Code | Variable |
|---|---|---|
| Natural Factors | X1 | Precipitation |
| X2 | Temperature | |
| X3 | Elevation | |
| X4 | Slope | |
| Socioeconomic Factors | X5 | Population Density |
| X6 | Gross Domestic Product | |
| X7 | GDP Per Capita | |
| Urban-rural Integration Factors | X8 | Urban-Rural Population Distribution |
| X9 | Urban-Rural Gradient Distribution | |
| Locational Factors | X10 | Road Length |
| X11 | Distance to the City Center |
Table 3.
Classification of LUI Change Trajectories from 2000 to 2020.
| 2000–2010 Change | 2010–2020 Change | Category Code | Type Description |
|---|---|---|---|
| Decrease | Decrease | 1 | Continuous decline type |
| Decrease | No Change | 2 | Stabilized after decline type |
| Decrease | Increase | 3 | Rebound after decline type |
| No Change | Decrease | 4 | Delayed decline type |
| No Change | No Change | 5 | Long-term stable type |
| No Change | Increase | 6 | Delayed growth type |
| Increase | Decrease | 7 | Fluctuating decline type |
| Increase | No Change | 8 | Stabilized after growth type |
| Increase | Increase | 9 | Continuous growth type |
Disclaimer/Publisher’s Note: The statements, opinions and data contained in all publications are solely those of the individual author(s) and contributor(s) and not of MDPI and/or the editor(s). MDPI and/or the editor(s) disclaim responsibility for any injury to people or property resulting from any ideas, methods, instructions or products referred to in the content. |
© 2025 by the authors. Licensee MDPI, Basel, Switzerland. This article is an open access article distributed under the terms and conditions of the Creative Commons Attribution (CC BY) license (http://creativecommons.org/licenses/by/4.0/).
Copyright: This open access article is published under a Creative Commons CC BY 4.0 license, which permit the free download, distribution, and reuse, provided that the author and preprint are cited in any reuse.


