
Submitted:
16 July 2025
Posted:
17 July 2025
You are already at the latest version
Abstract
Thyroid cancer is a growing global health concern, necessitating reliable and accurate diagnostic tools to support early detection and clinical decision-making. This study aims to develop and implement classical and ensemble machine learning models based on clinical, demographic, and biochemical data to predict thyroid cancer risk. Pearson correlation analysis was employed to identify and select the most relevant features for model training. A range of classifiers was optimized using hyperparameter tuning and cross-validation strategies. To assess robustness and generalizability, model performance was evaluated using accuracy, precision, recall, and F1-score across two independent datasets. Results show that ensemble models, particularly CatBoost, Bagging (Random Forest), and XGBoost, achieved the highest performance, with accuracies of up to 98.70% and F1-scores of 0.99 on Dataset 2, while maintaining consistent performance on Dataset 1 with accuracies around 82.51%. Classical models such as Logistic Regression, LDA, and SVM also performed competitively, achieving up to 97.40% accuracy on Dataset 2 and 82.51% on Dataset 1. These findings demonstrate the effectiveness of combining feature selection with optimized machine learning models and highlight the potential of ensemble approaches for improving thyroid cancer risk as- sessment in clinical practice.
Keywords:
machine learning
; thyroid cancer
; diagnosis
; ensemble algorithm and classical algorithms
1. Introduction
Thyroid cancer is one of the most common endocrine malignancies worldwide, and its global incidence continues to rise. This increase is attributed to improved diagnostic technologies, greater environmental risk exposures, and heightened public health awareness. Among the various subtypes, papillary thyroid carcinoma (PTC) accounts for the majority of cases and generally has a favorable prognosis when detected early. However, accurate and timely diagnosis remains critical for effective clinical intervention and long-term patient survival [1]. Traditional diagnostic approaches such as ultrasonography, fine-needle aspiration cytology (FNAC), and serological evaluations—are essential but often come with limitations. These include being invasive, expensive, and subject to significant inter-observer variability, which may affect diagnostic consistency and accuracy [2].
With the rapid evolution of data-driven healthcare, recent advancements in machine learning (ML) and artificial intelligence (AI) offer promising alternatives to conventional diagnostic pathways. ML algorithms excel at identifying complex, non-linear patterns in high-dimensional clinical data, allowing for earlier detection of diseases with reduced dependence on invasive procedures [3]. These models can analyze heterogeneous large-scale data sets to generate automated, objective and reproducible predictions, thus supporting data-driven clinical decision making and personalized patient management.
Over the last decade, a wide range of ML algorithms have been explored for the diagnosis and prognosis of thyroid disorders. These include classical techniques such as decision trees, support vector machines (SVM), Nave Bayes, and K-nearest neighbors, as well as more advanced ensemble and deep learning models such as random forests, gradient-boosting machines (e.g., XGBoost) and artificial neural networks. Studies have reported high classification accuracy in tasks ranging from identifying hypothyroidism and hyperthyroidism to predicting tumor recurrence and patient survival. For instance, ensemble methods have consistently outperformed individual classifiers in predicting central lymph node metastasis and post-operative recurrence in PTC patients [4,5]. Similarly, large-scale epidemiological datasets like SEER have enabled the development of robust neural network-based survival prediction tools that surpass traditional staging systems in prognostic accuracy [6]. Despite these promising developments, there remains a significant gap in comparative studies that evaluate both classical and ensemble ML models under a unified experimental framework. Such evaluations are essential for determining which algorithms offer the best generalizability and performance for clinical implementation, especially when using real-world clinical and biochemical data. In addition, translating these models into user-friendly digital applications has the potential to greatly enhance screening, diagnosis, and treatment planning, particularly in resource-limited settings.
The primary objective of this study is to perform a comparative evaluation of classical and ensemble machine learning algorithms for the diagnosis of thyroid cancer. Specifically, we aim to:
- Develop and implement classical and ensemble machine learning models to predict thyroid cancer risk based on clinical, demographic, and biochemical datasets.
- Apply Pearson correlation analysis to identify and select the most relevant features for model training.
- Optimize model performance through hyperparameter tuning and cross-validation strategies.
- Evaluate the models using standard classification metrics accuracy, precision, recall, and F1 score across two independent datasets to assess generalizability.
This study contributes to the growing body of medical AI research by offering a rigorous benchmark of ML algorithms for thyroid cancer diagnosis and proposing an efficient pipeline for potential clinical integration.
2. Literature Review
The application of machine learning (ML) to the diagnosis and prognosis of thyroid cancer has gained significant momentum over the past decade. As traditional diagnostic techniques remain labor-intensive, invasive, and susceptible to interpretation bias, researchers have turned to artificial intelligence (AI) to improve accuracy, efficiency, and early detection in thyroid disease management.
[7] developed a hybrid diagnostic framework that integrates rough set theory with machine learning algorithms to address data quality issues commonly present in thyroid disease datasets. The system begins with a string matching system to identify known patterns and escalates to optimization algorithms, namely Artificial Bee Colony (ABC) and Particle Swarm Optimization (PSO), when SMS is insufficient. Missing data is imputed using rough set theory before applying machine learning models, leading to an accuracy of up to 93%. This hybrid approach enhances predictive reliability, although its dependence on imputed values necessitates further validation using cleaner, real-world datasets
[8] proposes a two-phase machine learning approach utilizing ID3 decision trees and Naïve Bayes classifiers to detect thyroid disease and determine its stage. The primary aim is to reduce reliance on time-consuming laboratory tests. The model, developed on a curated dataset, facilitates early diagnosis with minimal input features. While the simplicity and interpretability of the model make it attractive for real-time clinical use, it lacks performance benchmarking against advanced algorithms. The study emphasizes the potential of lightweight ML models in low-resource healthcare settings.
[9]conducted survival analysis in thyroid cancer patients using multiple ML models. Seventeen significant prognostic features were identified, and the Random Forest classifier achieved the highest accuracy (99.3%). The study applied robust feature selection (e.g., SelectKBest, Chi-Square) and cross-validation techniques. Its contributions include a comprehensive impurity-resilience analysis and feature sensitivity assessment, making it a benchmark study in survivability prediction.
[5] developed and validated ML models using a dataset of 2,244 papillary thyroid cancer (PTC) patients to predict structural recurrence. Models included SVM, XGBoost, Random Forest, Neural Networks, and Logistic Regression. All models outperformed the ATA risk stratification system, with AUC values ranging from 0.738 to 0.767. Key features included non-stimulated thyroglobulin, lymph node metastasis ratio, and comorbidities. This study demonstrates the utility of ML in augmenting clinical guidelines for individualized post-treatment planning.
[4] developed ML models to preoperatively predict central lymph node metastasis (CLNM) in PTC patients. Among the seven models tested, Gradient Boosting Decision Trees (GBDT) demonstrated the best performance (AUC = 0.731), surpassing traditional ultrasonography-based methods. Features such as patient age, microcalcifications, and tumor size contributed significantly to the model. This work enhances surgical decision-making by identifying patients who may benefit from lymph node dissection. [10] evaluated classical ML models and artificial neural networks to predict recurrence risk in differentiated thyroid cancer. The inclusion of the ATA risk score alongside 12 clinicopathological features improved model performance, with SVM achieving an AUC of 99.71%. This research supports ML integration with traditional guidelines for personalized follow-up strategies.
[11] categorizes ML applications based on data type—numerical, genomic, radiomic, and ultrasound—and identifies ensemble methods such as the Random Forest, as the most effective across categories. The accuracies ranged from 64.3% to 99.5% and highlights important predictors such as gene expression markers, tumor characteristics, and clinical features, emphasizing that data quality and model interpretability remain essential for clinical adoption.
[6] used multilayer perceptrons (MLPs) and feature selection techniques to predict survival outcomes using the SEER dataset. Their best-performing model achieved an accuracy of 94.5%. The study exemplifies how large-scale public health datasets can be leveraged using ML to generate high-quality prognostic models and calls for the integration of such tools with clinical staging systems.
[12]proposed a machine learning framework for the preoperative classification of thyroid nodules using a clinical dataset of 724 patients and 1,232 nodules. Six machine learning models were evaluated using ten-fold cross-validation and bootstrap analysis. The models outperformed experienced clinicians in diagnostic accuracy and provided interpretability through permutation importance analysis. This study advocates for ML-assisted decision-making in surgical planning.
The collective evidence from these studies affirms the growing potential of machine learning in enhancing the accuracy, efficiency, and personalization of thyroid disease diagnosis and prognosis. Ensemble methods, robust feature selection, and cross-validation consistently underpin high-performing models. While the integration of ML into clinical workflows is promising, further work is needed to ensure model interpretability, clinical validation, and ethical deployment. These insights serve as a foundation for future research aimed at embedding ML tools within endocrine and oncological care pathways.
3. Methodology
3.1. Dataset Description and Preprocessing
The study used a retrospective datasets of patient records with clinical, demographic, and biochemical features relevant to thyroid health. Key features included patient age (numeric), gender (categorical), smoking status (categorical), thyroid function indicators (numeric lab measurements), pathological findings (categorical, e.g. benign or malignant cytology), disease stage (ordinal categorical), and recurrence information (binary categorical indicating if thyroid cancer recurred). The target variable was a label indicating thyroid cancer risk (formulated as a binary classification problem: high-risk vs. low-risk/no cancer). Data cleaning steps were applied to ensure quality: duplicate records were removed, and any missing values in the features were handled appropriately (through imputation or exclusion as necessary) to avoid biases. Categorical features such as gender and smoking status were encoded into numeric form using one-hot encoding, creating binary indicator variables for each category. This OneHotEncoder transformation converts each category level into a separate binary feature, allowing categorical information to be utilized by machine learning algorithms. For numeric features (e.g. age, hormone levels), we applied PowerTransformer from scikit-learn to normalize their distributions. PowerTransformer (with Yeo-Johnson method) is a parametric, monotonic transformation that makes data more Gaussian-like, which helps stabilize variance and reduce skewness in features with non-normal distributions. By default, the PowerTransformer also standardizes features to zero mean and unit variance after transformation.
This scaling is important because many models (e.g. k-NN, logistic regression) assume features are on comparable scales. In summary, the preprocessing pipeline involved removing duplicates, addressing missing values, encoding categorical variables via OneHotEncoder, and scaling/normalizing numerical variables via PowerTransformer to yield a clean and well-prepared feature matrix for modeling.

Table 1.
Dataset One – Thyroid Clinical Data
| Column | Non-Null Count | Data Type |
|---|---|---|
| Age | 383 | int64 |
| Gender | 383 | object |
| Smoking | 383 | object |
| Hx Smoking | 383 | object |
| Hx Radiothreapy | 383 | object |
| Thyroid Function | 383 | object |
| Physical Examination | 383 | object |
| Adenopathy | 383 | object |
| Pathology | 383 | object |
| Focality | 383 | object |
| Risk | 383 | object |
| T | 383 | object |
| N | 383 | object |
| M | 383 | object |
| Stage | 383 | object |
| Response | 383 | object |
| Recurred | 383 | object |
Table 2.
Dataset Two – Thyroid Risk & Diagnosis Dataset
| Column | Non-Null Count | Data Type |
|---|---|---|
| Patient_ID | 212,691 | int64 |
| Age | 212,691 | int64 |
| Gender | 212,691 | object |
| Country | 212,691 | object |
| Ethnicity | 212,691 | object |
| Family_History | 212,691 | object |
| Radiation_Exposure | 212,691 | object |
| Iodine_Deficiency | 212,691 | object |
| Smoking | 212,691 | object |
| Obesity | 212,691 | object |
| Diabetes | 212,691 | object |
| TSH_Level | 212,691 | float64 |
| T3_Level | 212,691 | float64 |
| T4_Level | 212,691 | float64 |
| Nodule_Size | 212,691 | float64 |
| Thyroid_Cancer_Risk | 212,691 | object |
| Diagnosis | 212,691 | object |
3.2. Exploratory Data Analysis (EDA)
Before proceeding with modeling, we conducted comprehensive exploratory data analysis (EDA) to gain a thorough understanding of the dataset’s characteristics. Visual EDA techniques were employed to examine the distribution of key variables and to identify any irregular patterns or outliers. For continuous variables, such as patient age, histograms were plotted to assess their distribution across the cohort—determining, for instance, whether the distribution was approximately normal or skewed. For categorical variables (e.g., gender, smoking status, thyroid pathology results, cancer stage, recurrence status), count plots (bar charts) were used to visualize the frequency of each category. In a count plot, each bar represents a category, and its height corresponds to the number of observations in that category. These visualizations enabled us to observe important patterns such as the gender composition of the sample, the proportion of smokers and non-smokers, the frequency of different pathology outcomes, the distribution across cancer stages (I–IV), and the number of patients who experienced recurrence.
Such visual insights were critical for identifying class imbalances, dominant categories, and potential sources of bias within the dataset. For example, count plots helped highlight the distribution of malignant versus benign pathology results and revealed whether patients were predominantly in early or late stages of disease. Histograms and bar charts also aided in understanding the central tendencies and variability of continuous variables, as well as the prevalence of each category in discrete variables.
This EDA phase provided essential context for interpreting feature values and detecting anomalies, such as unexpected age distributions or underrepresented categories. Moreover, the findings from EDA informed downstream processing decisions: for instance, a skewed age distribution led us to apply a PowerTransformer for normalization, while evidence of class imbalance influenced our selection of evaluation metrics, prompting us to go beyond simple accuracy.
Figure 1.
Exploratory analysis of thyroid diagnosis and risk patterns across gender, family history, and correlated clinical features.
Figure 1.
Exploratory analysis of thyroid diagnosis and risk patterns across gender, family history, and correlated clinical features.
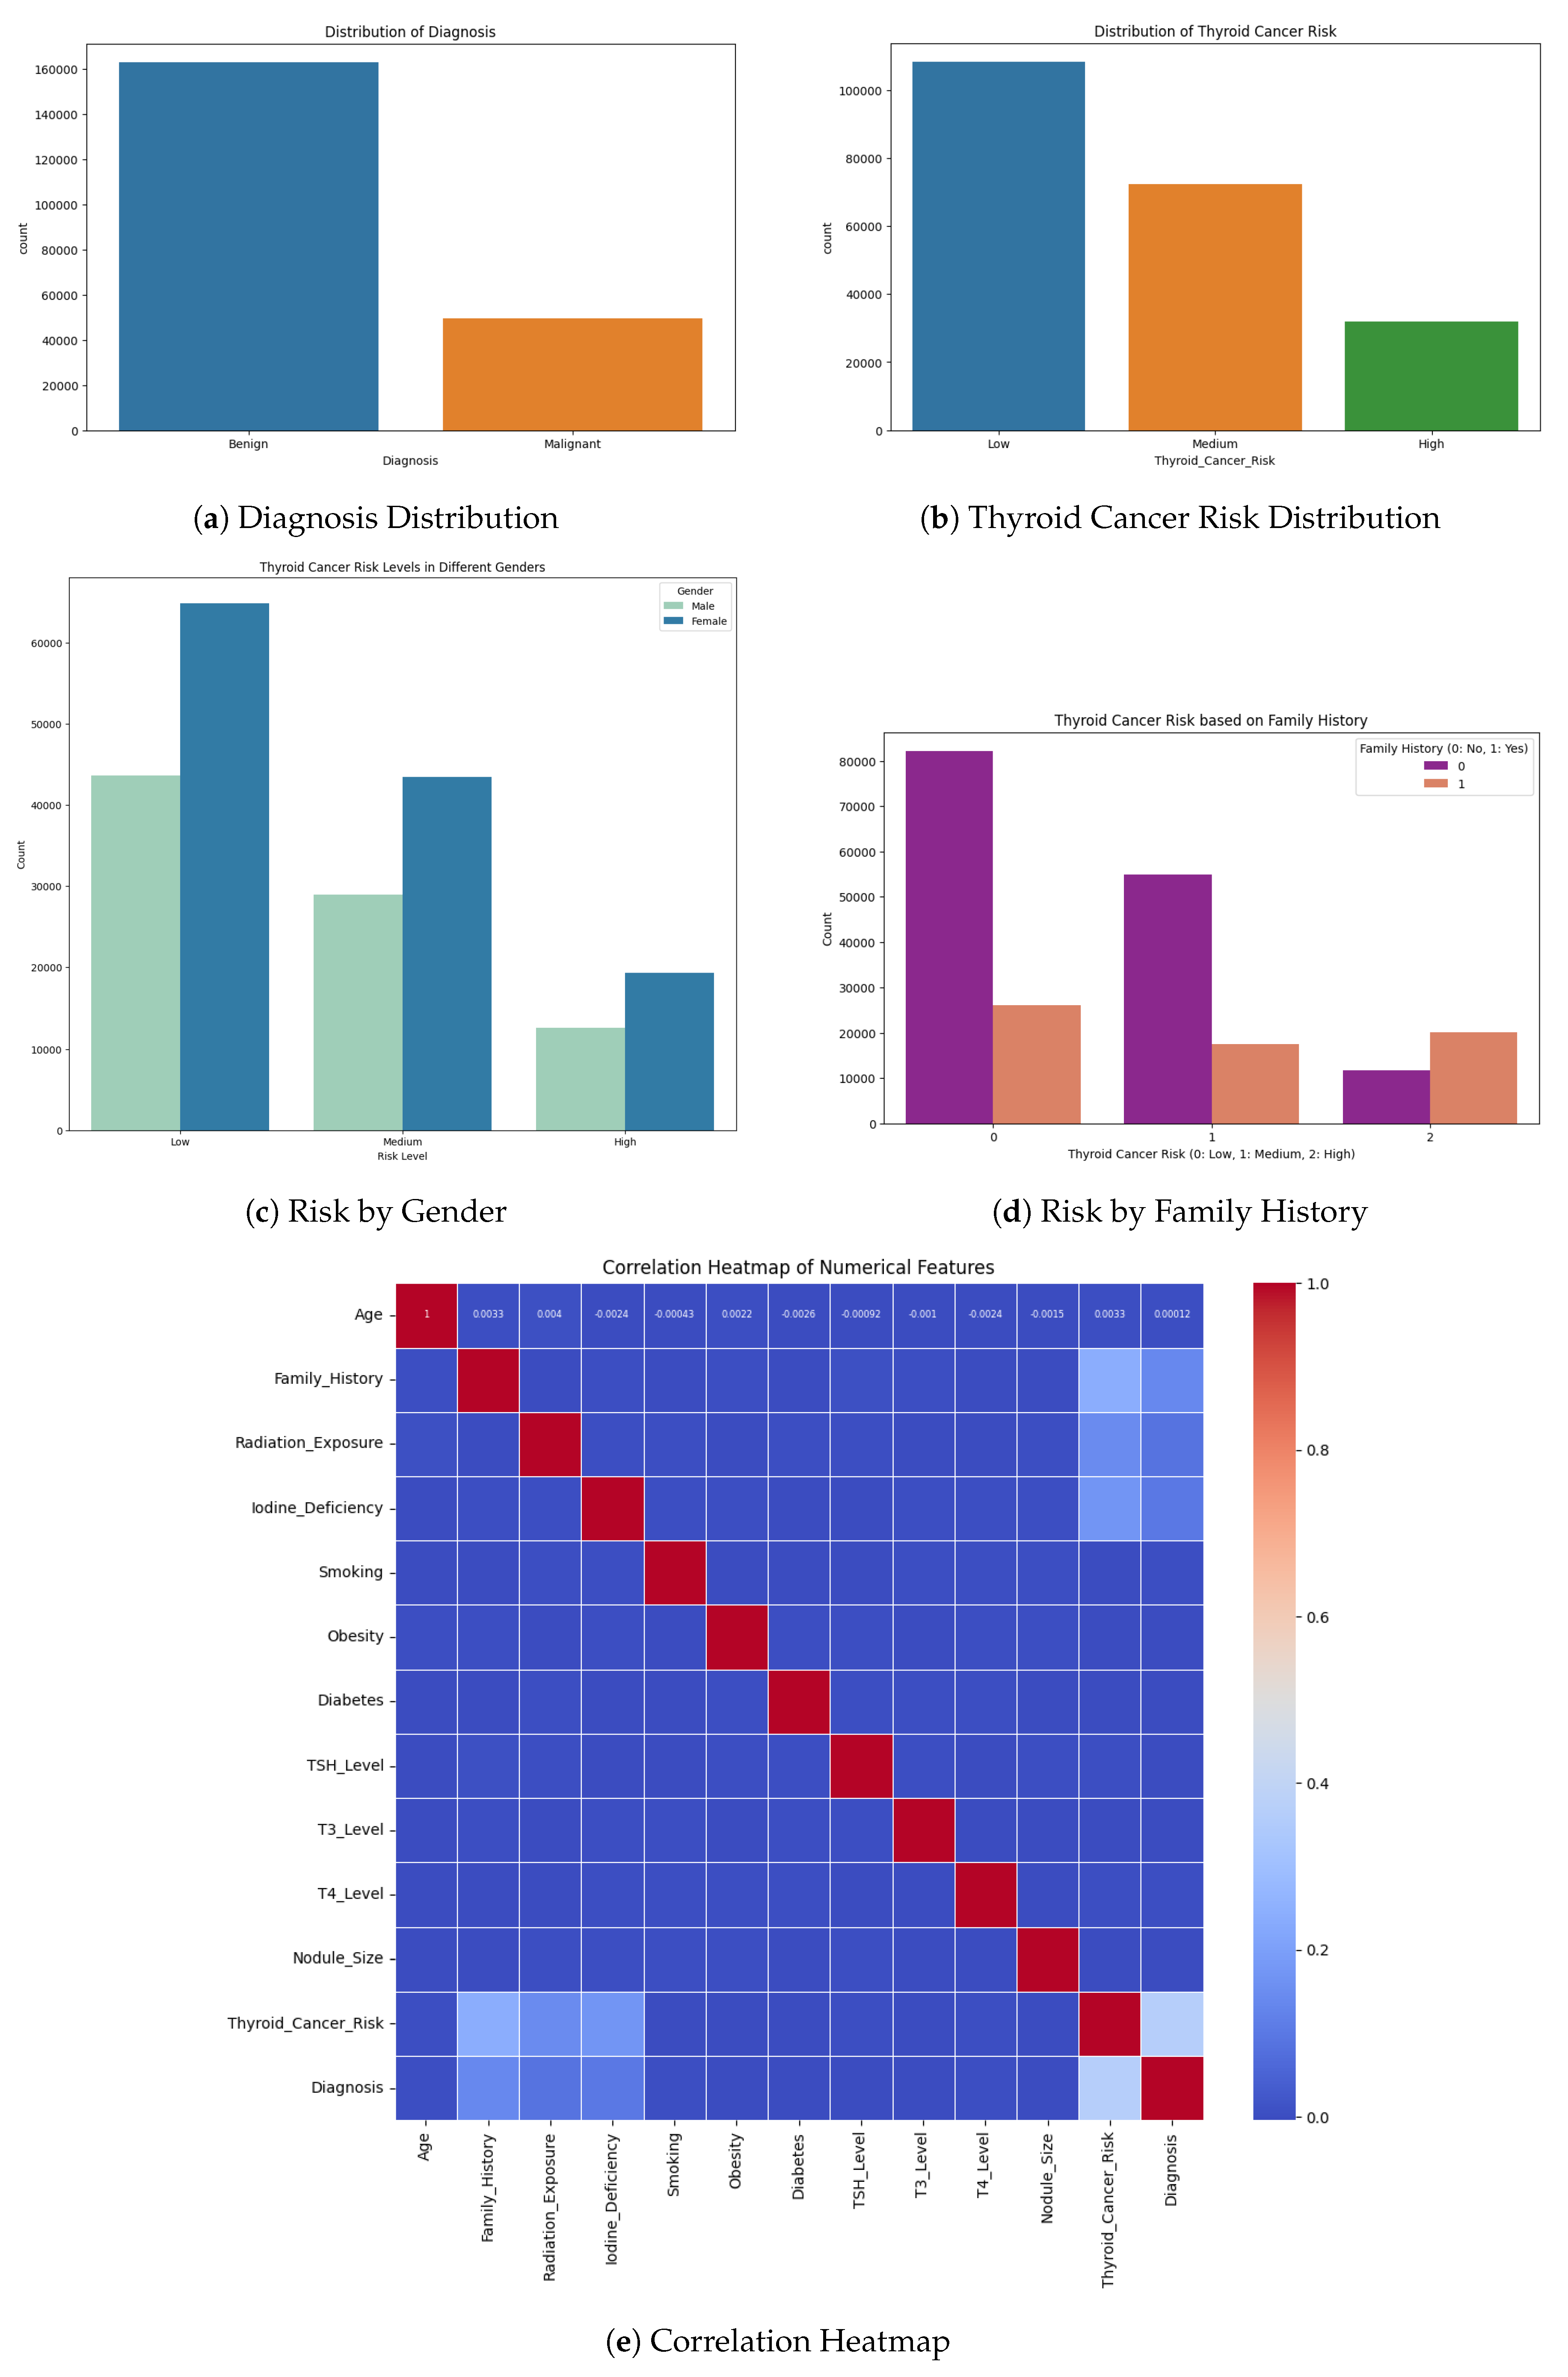
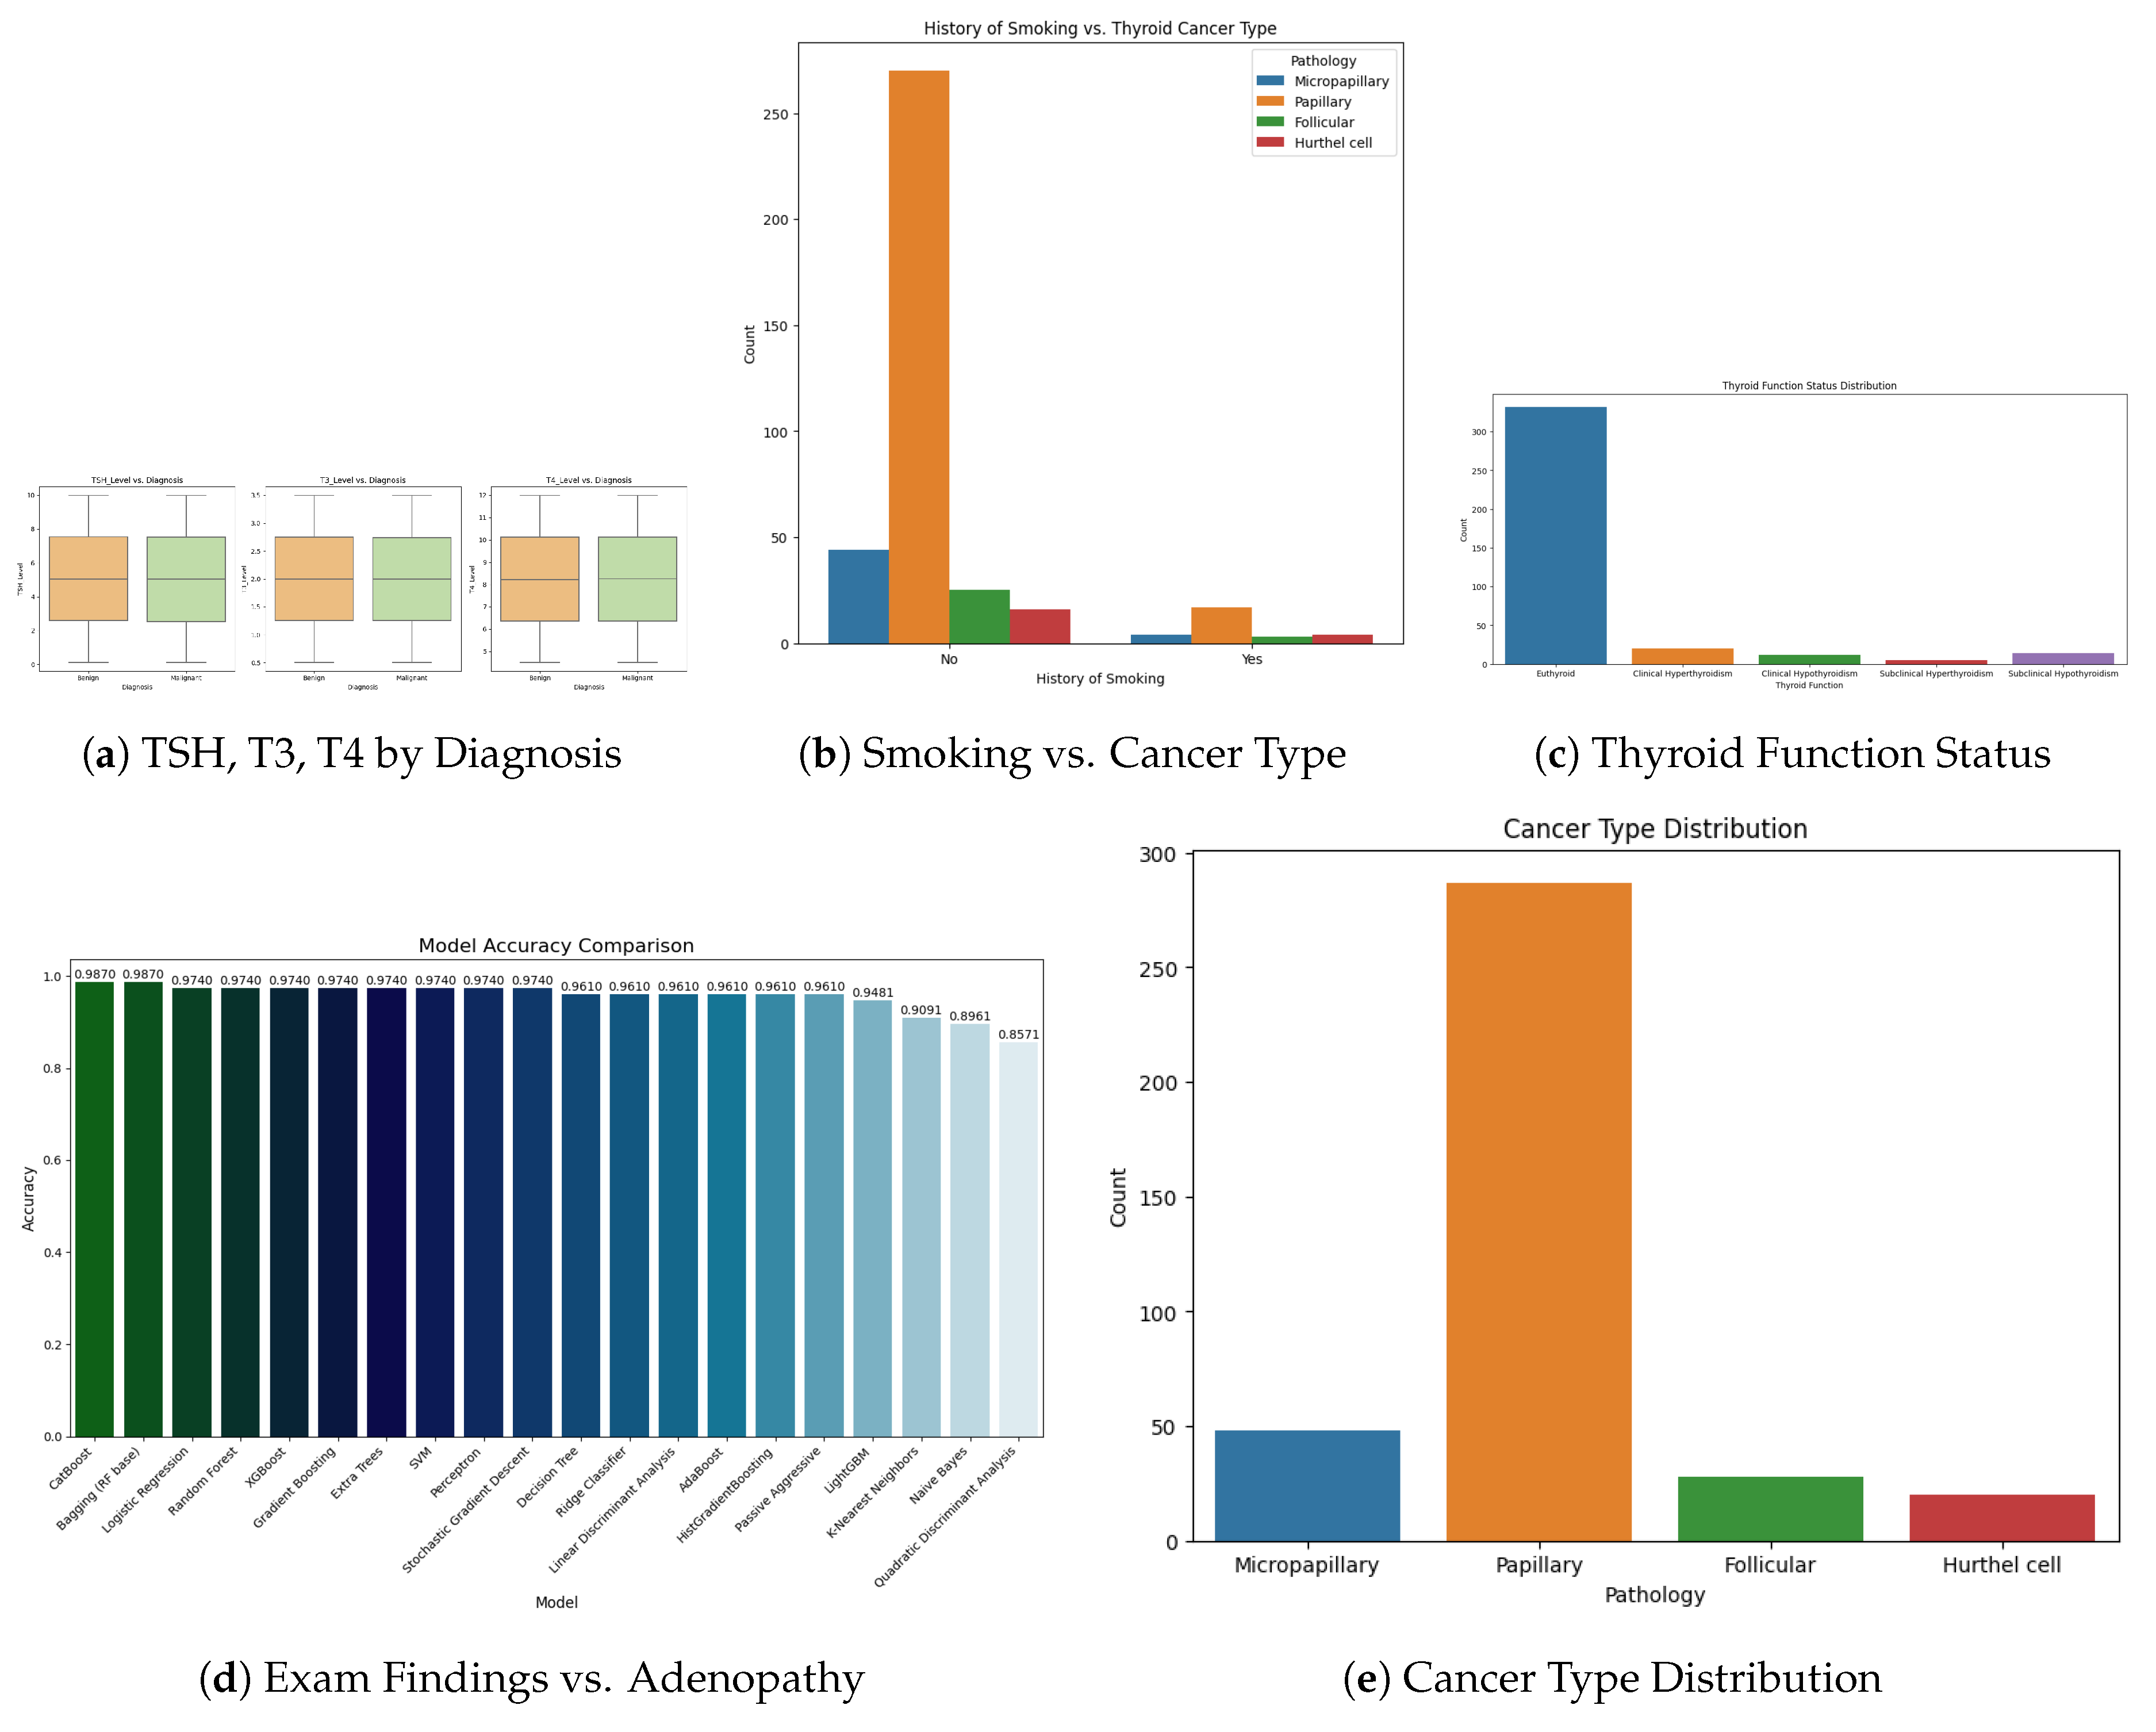
Figure 2.
Clinical feature distributions and associations with diagnosis: hormone levels, smoking history, thyroid function, physical exam, and cancer types.
Figure 2.
Clinical feature distributions and associations with diagnosis: hormone levels, smoking history, thyroid function, physical exam, and cancer types.
3.3. Feature Selection
To inform feature selection and understand the relationships among variables, we conducted a Pearson correlation analysis. We computed a correlation matrix that includes all continuous features and the binary outcome (with the outcome encoded as 0/1 for the absence or presence of high risk). Pearson’s correlation coefficient was used to quantify linear relationships between each pair of features, as well as between each feature and the target label. This analysis helped identify highly collinear features and the most predictive individual features. In particular, we examined if any pairs of features had very high correlation (which could indicate redundancy); for example, if two biochemical markers were strongly correlated with each other, one of them might be potentially dropped or carefully handled to avoid multicollinearity in certain models. More importantly, we looked at the correlation of each feature with the outcome to gauge its relevance. A feature with a higher absolute correlation with the thyroid cancer risk label was considered to have a stronger linear association with the outcome, which could make it a good candidate for the model. This Correlation-based Feature Selection approach assumes that an ideal subset of features has high correlation with the target but low intercorrelation with each other.
In practice, the Pearson correlation matrix was used as an initial filter: features that showed negligible correlation with the outcome (and were not otherwise known to be clinically important) were noted, and features that were highly correlated (r close to 1) with each other were flagged to avoid using both in the same model. The correlation heatmap thus guided us in selecting a set of informative predictors, reducing dimensionality by eliminating redundant features while retaining those most likely to contribute to predicting the risk of thyroid cancer. It should be noted that for categorical features (e.g. gender, pathology categories), we could not directly use Pearson correlation; however, these were one-hot encoded, and we could evaluate point-biserial correlations for binary dummy variables or use domain knowledge to keep important categories. Ultimately, the feature selection was informed by this correlation analysis combined with medical relevance, ensuring the models were built on a set of features that are both non-redundant and relevant to the outcome.
3.4. Model Development
We implemented an array of classical and ensemble machine learning models to predict thyroid cancer risk, using Python libraries such as scikit-learn (for most classifiers) and specialized gradient boosting libraries for advanced ensembles. The modeling algorithms used can be grouped as follows:
- Logistic Regression: A linear model for binary classification that estimates the log-odds of the positive class (i.e., high cancer risk) as a linear combination of input features. The logistic (sigmoid) function then transforms the result into a probability. Logistic regression was included as a baseline due to its simplicity and strong interpretability in clinical settings.
- k-Nearest Neighbors (KNN): A nonparametric, instance-based classifier that assigns labels based on the majority vote among the k most similar training instances in the feature space. We used Euclidean distance as the similarity metric, with all features normalized beforehand. Since KNN relies on distance calculations, its performance can benefit significantly from feature scaling.
- Gaussian Naïve Bayes: A probabilistic classifier based on Bayes’ theorem and the assumption that features are conditionally independent given the class label. It models the likelihood of continuous features using a Gaussian distribution for each class. Despite the independence assumption, Gaussian Naïve Bayes is computationally efficient and often performs well in high-dimensional data settings.
- Random Forest: An ensemble method that constructs multiple decision trees using the bagging technique (bootstrap aggregation). Each tree is trained on a random subset of the training data, and the final prediction is obtained by averaging the individual tree predictions. Random forests are capable of modeling non-linear interactions and are robust enough to overfit. We used a sufficiently large number of estimators to ensure performance stability.
- AdaBoost (Adaptive Boosting): A boosting ensemble that sequentially trains weak classifiers, where each subsequent model focuses more on the instances misclassified by its predecessors. The final prediction is a weighted vote across all weak learners. We used decision stumps (simple trees) as base classifiers. AdaBoost was included for its ability to improve predictive performance by emphasizing difficult cases.
-
Gradient Boosting Machines (GBM): A family of boosting techniques where each new tree is trained to correct the residual errors made by the previous ensemble. We implemented GBM using multiple frameworks:
- –
- GradientBoostingClassifier from scikit-learn
- –
- XGBoost (Extreme Gradient Boosting): Efficient, regularized boosting algorithm often used in competitions [13].
- –
- LightGBM (Light Gradient Boosting Machine): Optimized for speed and memory usage using techniques like Gradient-based One-Side Sampling (GOSS) and Exclusive Feature Bundling (EFB) [14].
- –
- CatBoost: Tailored for categorical data, it applies ordered boosting to reduce overfitting and often achieves high accuracy [15].
These state-of-the-art gradient boosting methods are particularly powerful for structured/tabular data. Their inclusion allowed for a comprehensive comparison against classical models to identify the classifier that performs best for our thyroid cancer risk prediction task.
All models were implemented using the scikit-learn API (for XGBoost, LightGBM, CatBoost), ensuring a consistent training pipeline. Before training, the processed data set was divided into a training set and a test set to allow out-of-sample evaluation of the performance of each model. We typically reserved 20% of the data for testing, using a stratified random split so that the class ratio (high-risk vs. low-risk patients) was preserved in both training and test subsets. Model development was carried out only on the training set: the training data was used for fitting models and performing internal cross-validation, while the test set was held out and only used for the final performance evaluation (to simulate how the model would perform on new, unseen patients). For each classification algorithm, we constructed a pipeline that encapsulated the preprocessing steps and the model itself, using scikit-learn’s Pipeline and ColumnTransformer utilities.
The ColumnTransformer was configured to apply the PowerTransformer to all numeric features and OneHotEncoder to all categorical features, exactly as described in the preprocessing section. This transformer, along with the classifier (e.g. logistic regression or random forest), was combined into a single pipeline object. By doing so, we ensured that during model training and prediction, identical preprocessing was applied to the data seamlessly, without any data leakage from the test set.
In practice, this means the pipeline would fit the PowerTransformer and OneHotEncoder on the training data only, then apply those transformations to transform both the training data (for model fitting) and the test data (for predictions). Using such a pipeline simplifies the workflow and reduces the chance of errors, as the same pipeline can be directly used to generate predictions on the test set or any new dataset, guaranteeing that the incoming features are treated the same way as in the training phase. Each model was trained by calling the pipeline’s fit method on the training set, and then we obtained predictions on the test set via the pipeline’s predict method. We used standard library implementations for reliability and to leverage optimized numerical routines – for example, scikit-learn for logistic regression, k-NN, Naïve Bayes, Random Forest, AdaBoost, and GradientBoostingClassifier, and the Python APIs XGBClassifier (from the XGBoost library), LGBMClassifier (from LightGBM), and CatBoostClassifier (from CatBoost) for the respective gradient-boosting models. All these were integrated consistently. This systematic approach to model development enabled for a fair comparison between various algorithms under the same data processing conditions.
3.5. Hyperparameter Tuning and Optimization
For each modeling approach, we sought to optimize the hyperparameters to improve performance. We employ cross-validation and grid search techniques in the training data for hyperparameter tuning, following best practices in model selection. In general, a set of candidate values for key hyperparameters of each model was defined (a parameter grid), and then an exhaustive search was performed using scikit-learn GridSearchCV to find the combination of parameters that yielded the best cross-validation performance. GridSearchCV automates the process of trying every combination in the grid, using cross-validation (we typically used 5-fold CV) to evaluate the mean performance of each combination in the training set. Integrating k-fold cross-validation into the search, this method provides a robust estimate of how each hyperparameter setting generalizes, thereby enhancing the reliability of the tuning process. It is generally recommended to search the hyperparameter space to find the best cross-validation score, rather than relying on default values, as even a small set of parameters can markedly influence model performance. In our study, we tuned parameters such as the regularization strength (inverse of C) in logistic regression, the number of neighbors k in KNN, and the variance smoothing parameter in Gaussian NB. For ensemble methods, we adjusted parameters such as the number of trees (estimators) and the maximum tree depth in Random Forest and boosting models, the learning rate in AdaBoost and gradient boosting, and algorithm-specific parameters (for example, the tree depth and L2 regularization of XGBoost, the leaf count and subsampling of LightGBM, the depth and learning rate of CatBoost, etc.). Due to computational constraints, not every single model’s full grid search is shown in the code, but representative tuning was performed to ensure each model was reasonably optimized. For instance, in some portions of the code, we have manually tried a few variations (or commented out the exhaustive search for brevity), yet the final results presented are based on models that had been tuned through cross-validation to achieve near-optimal settings.
In cases where GridSearchCV was explicitly run (e.g., tuning a Random Forest’s n_estimators and max_depth), the selected best parameters were then used to refit the model on the entire training set. This hyperparameter optimization step helps prevent overfitting by avoiding overly complex models and ensures that simpler models are not unfairly disadvantaged by suboptimal default parameters. Overall, by using cross-validated grid search, we improved model generalization: the chosen hyperparameters were those that performed best on unseen folds of training data, which typically translates to better performance on the independent test set. All tuning was done strictly within the training data to maintain a valid separation of training and test phases.
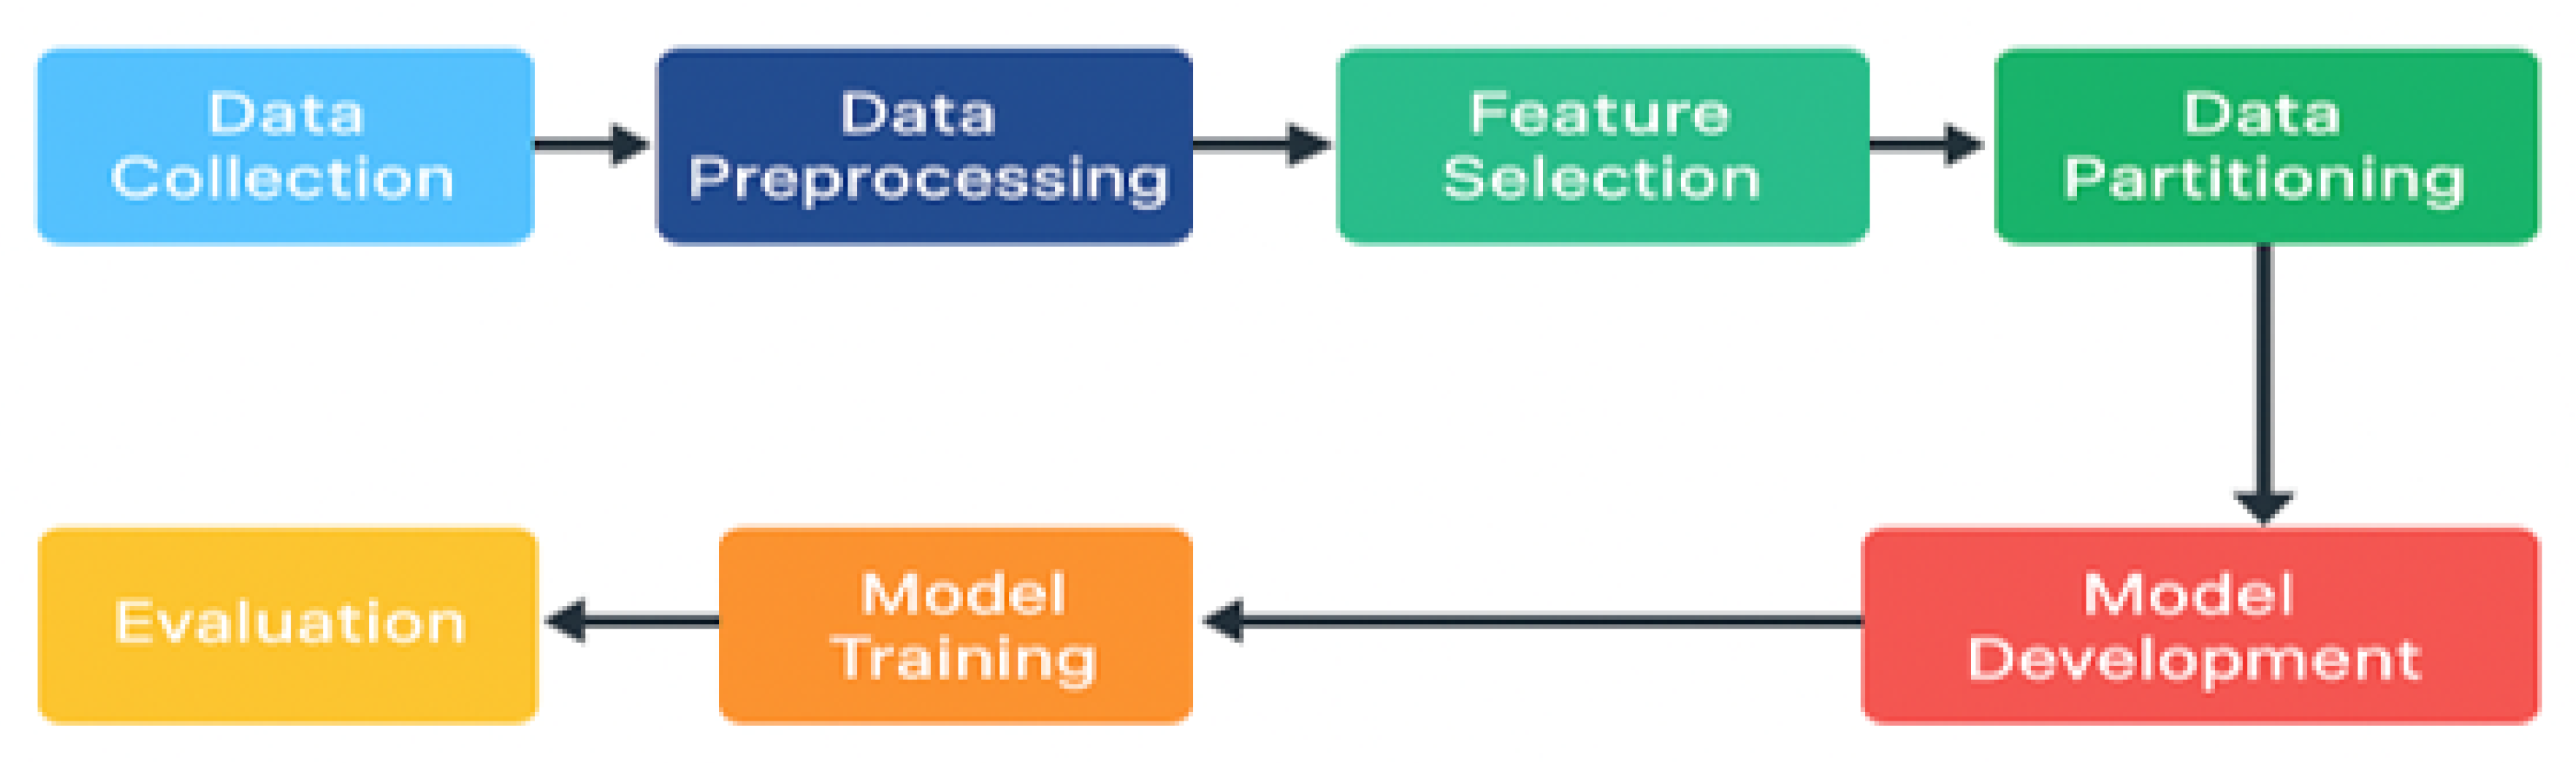
Figure 3.
Workflow for Machine Learning Model Development
4. Result
To assess the diagnostic capability of various machine learning models in thyroid cancer detection, we implemented and benchmarked a set of classical and ensemble classifiers on two distinct datasets: Dataset 1 (D1) and Dataset 2 (D2). Each model’s performance was evaluated using four key metrics: Accuracy (Acc), Precision (Prec), Recall (Rec), and F1-Score (F1). These metrics are reported as weighted averages to account for class imbalances. Table 3 summarizes the results.
Figure 4.
Performance evaluation on Dataset 1
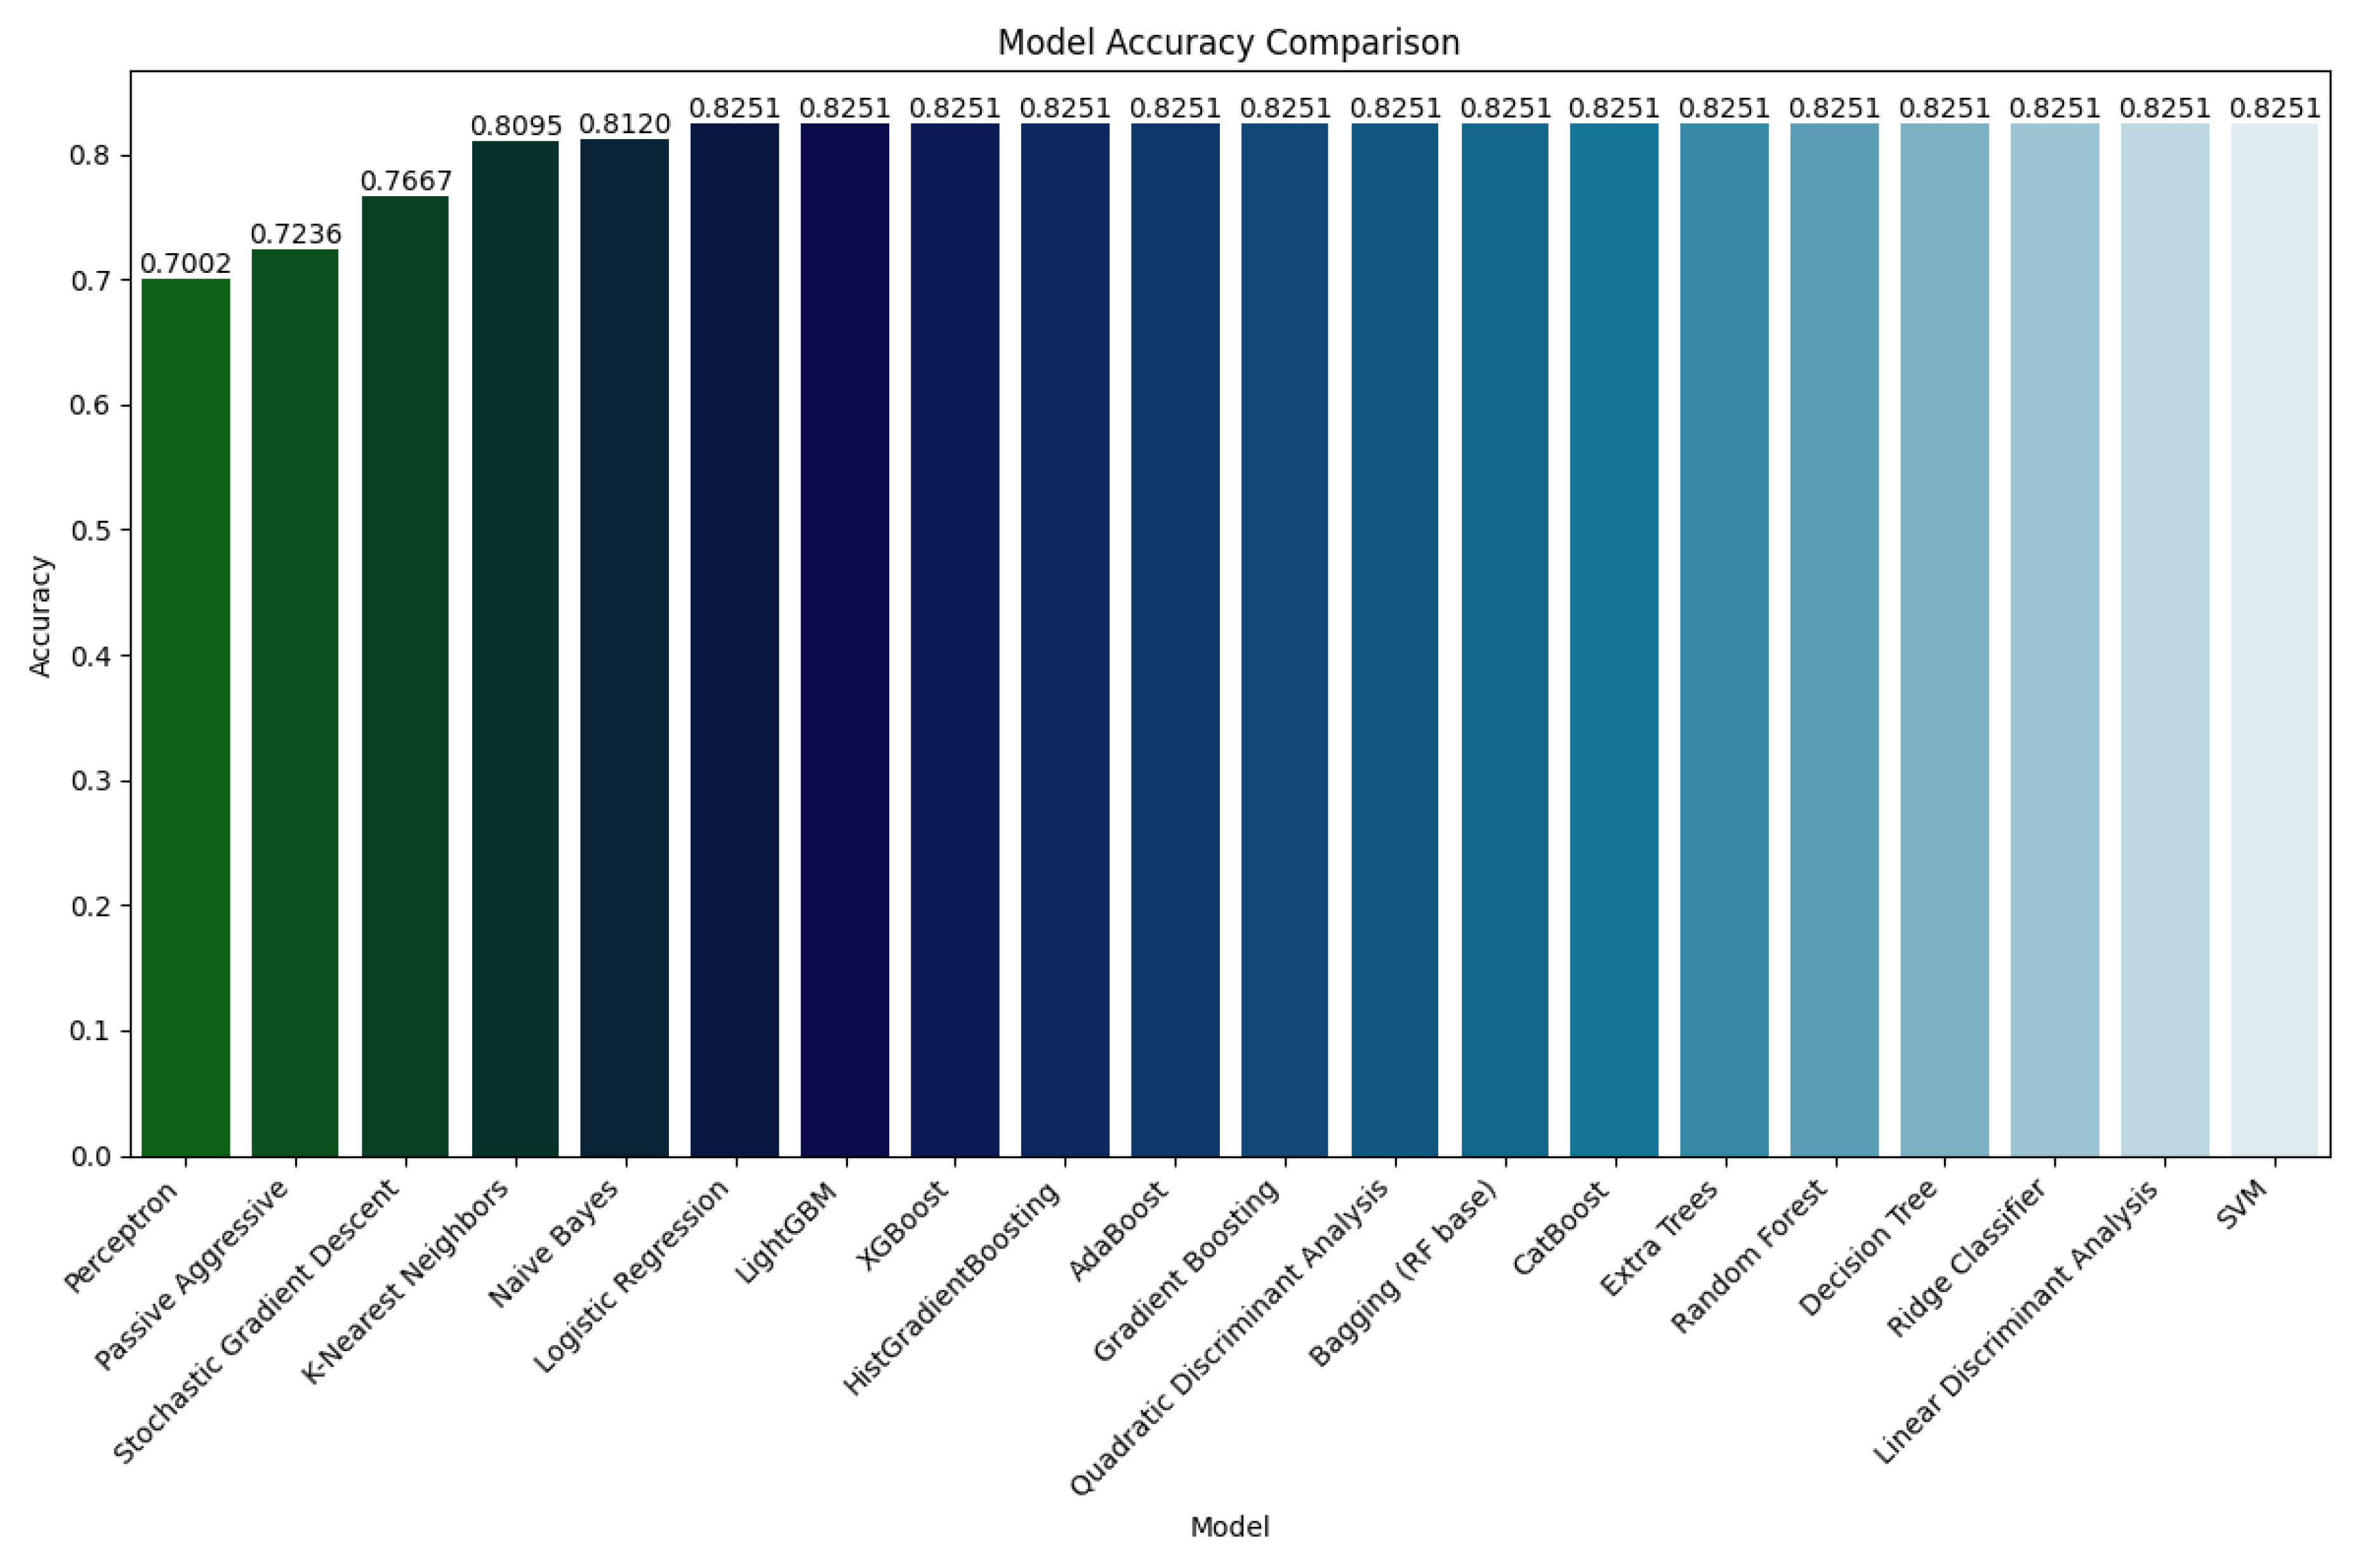
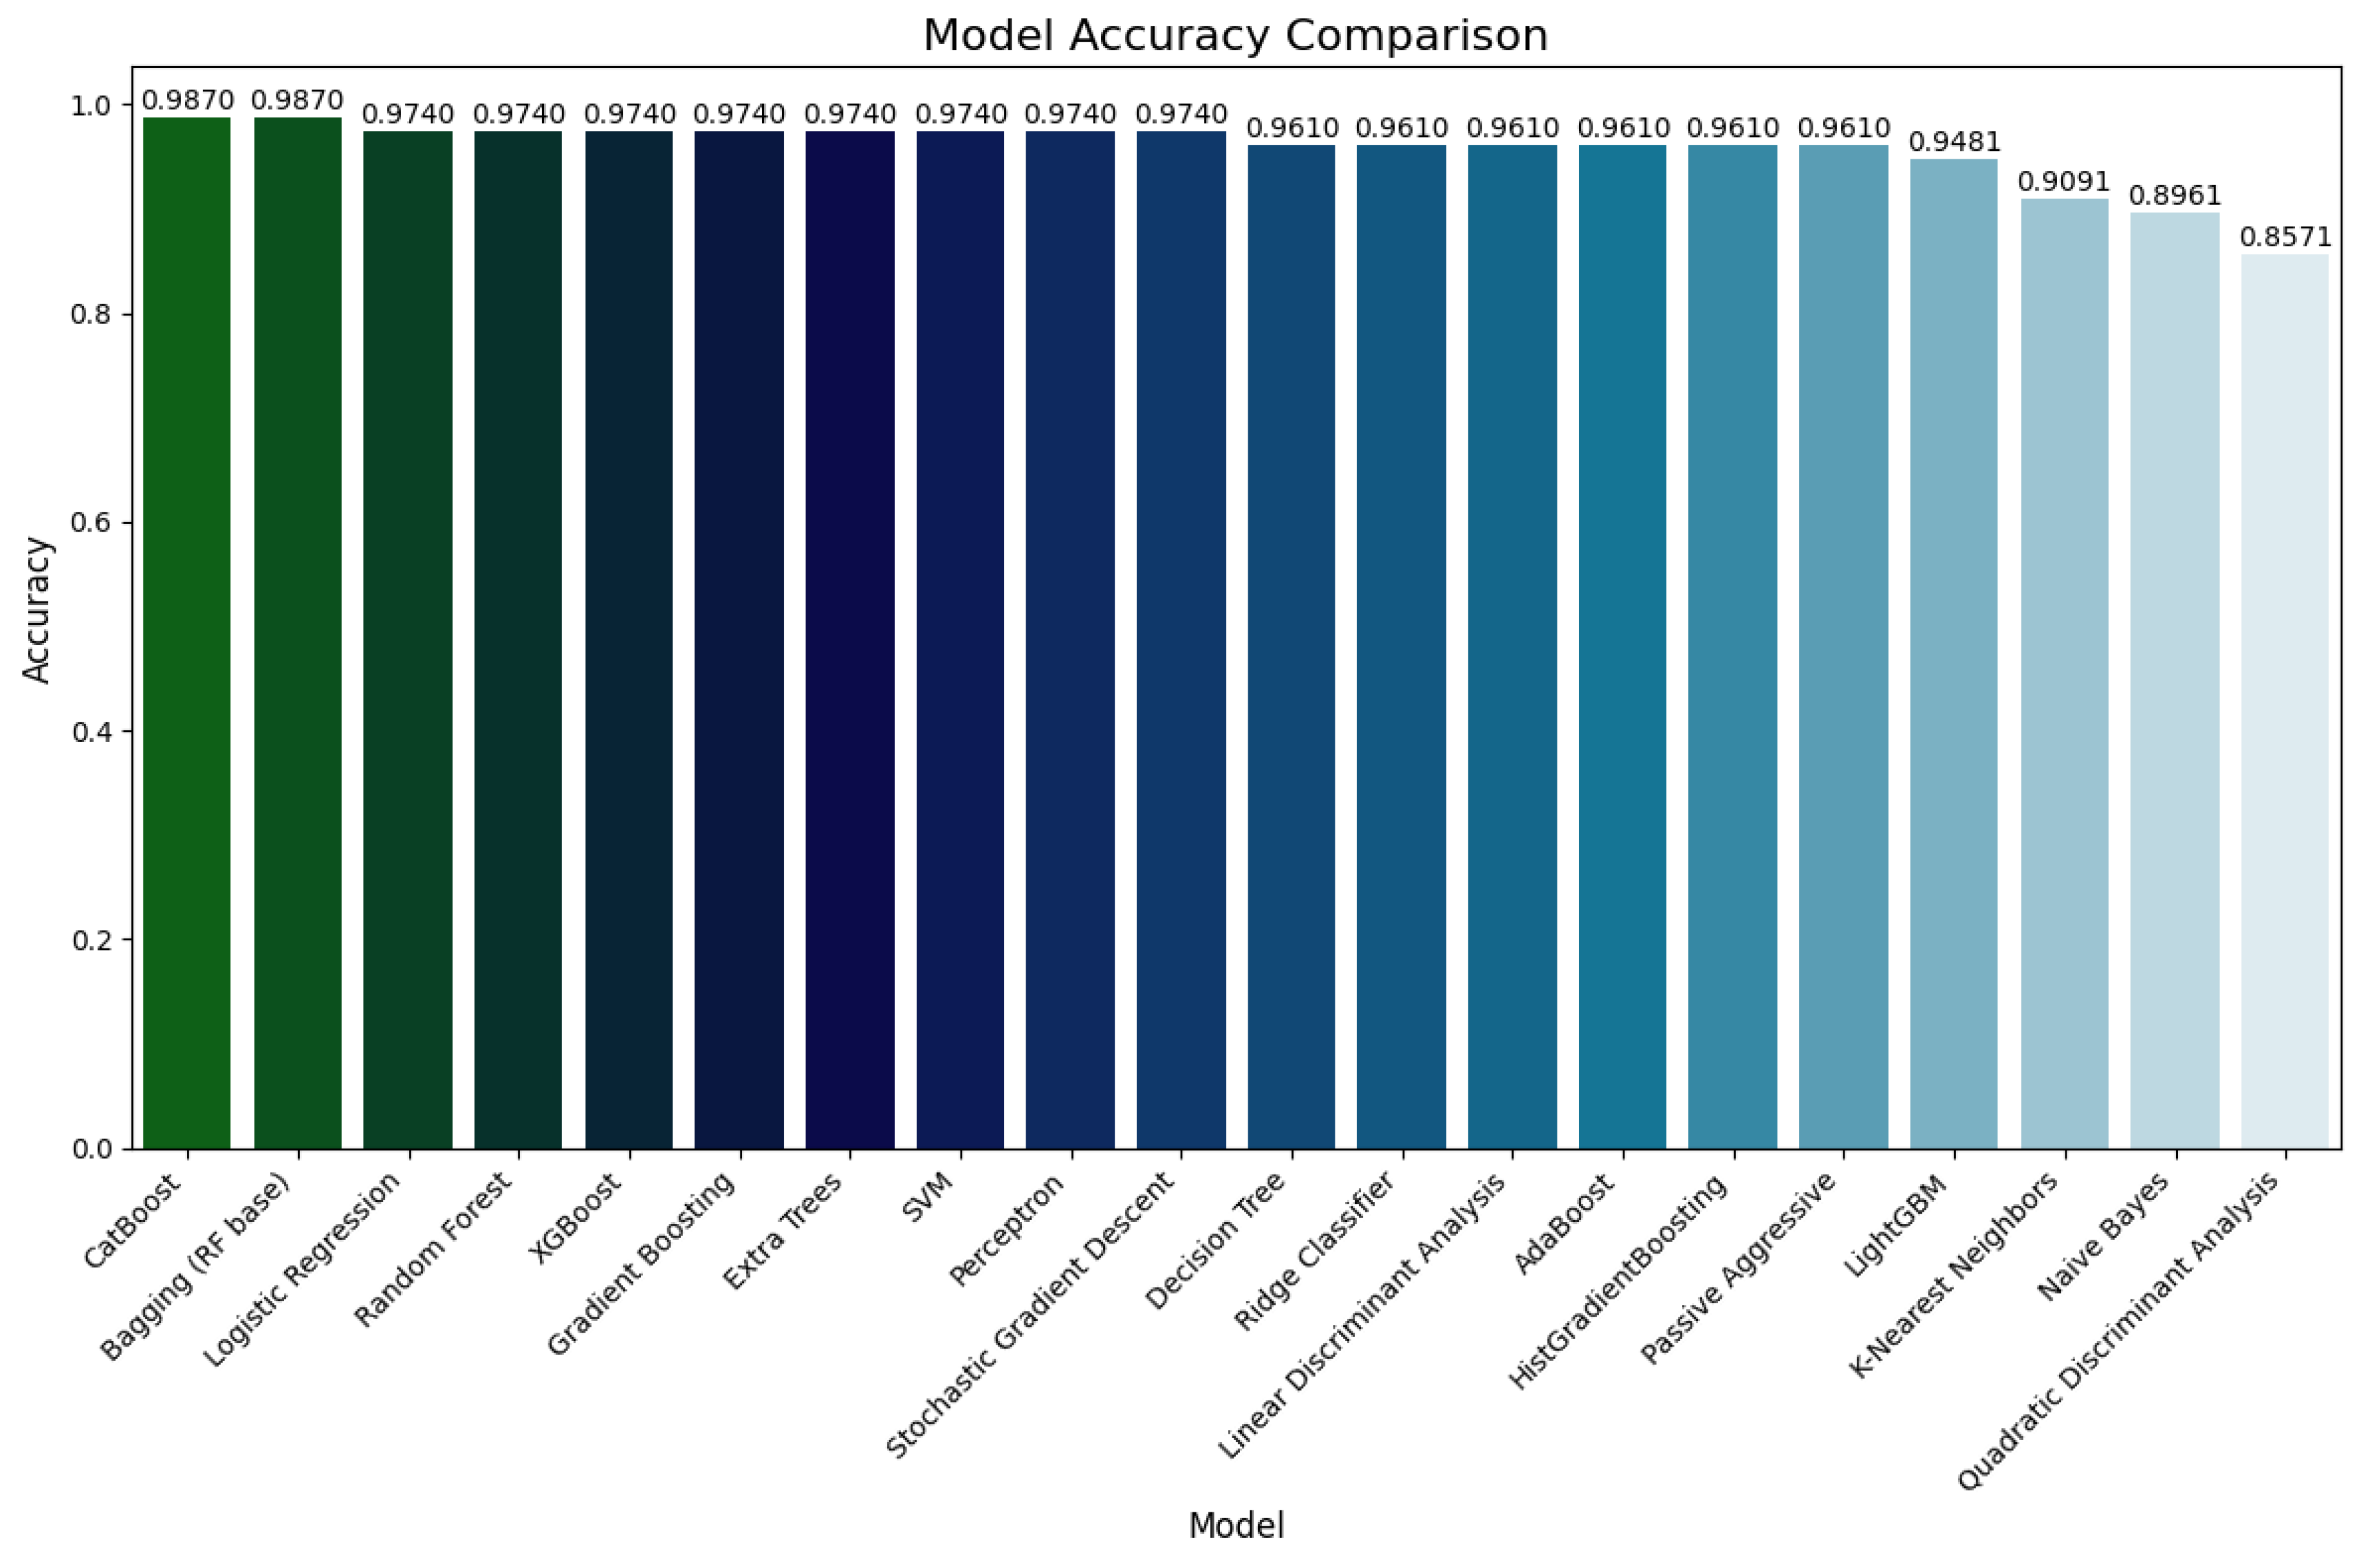
Figure 5.
Performance evaluation on Dataset 2
4.1. Performance on Dataset 2
Dataset 1, which contains a broader spectrum of cases and inherent noise, simulates real-world clinical heterogeneity. Models such as Logistic Regression, Ridge Classifier, Decision Tree, Random Forest, and Gradient Boosting achieved a consistent accuracy of 82.51%, along with substantial precision and recall values (approximately 0.81–0.83). These results indicate the robustness of tree-based and regularized linear classifiers in dealing with moderately complex data.
Ensemble methods like XGBoost, LightGBM, and CatBoost demonstrated similar accuracy on D1, highlighting their resilience even under less-than-ideal data conditions. Interestingly, probabilistic models like Naive Bayes and QDA also performed competitively on D1, with accuracies of 81.20% and 82.51%, respectively.
In contrast, simpler models such as Stochastic Gradient Descent (SGD), Passive Aggressive, and Perceptron showed noticeably lower performance, with accuracies ranging from 70.02% to 76.67%. These models may be more sensitive to the distributional complexity and noise inherent in D1.
4.2. Performance on Dataset 2
Dataset 2 offers a more balanced and refined set of instances, allowing more precise evaluation of each model’s generalization potential. In this setting, ensemble models significantly outperformed their classical counterparts. Both Bagging (Random Forest) and CatBoost reached the highest accuracy of 98.70%, along with perfect or near-perfect precision, recall, and F1 scores (0.99 across all metrics). This affirms their strong ability to generalize and capture intricate feature relationships.
Other high-performing ensemble models included Random Forest, Extra Trees, Gradient Boosting, and XGBoost, all with accuracies of 97.40%, and similarly high F1 scores. Among the classical models, Logistic Regression, Ridge Classifier, LDA, and SVM showed stable and strong performance, with accuracies between 96.10% and 97.40%.
While SGD, Perceptron, and Passive Aggressive classifiers showed improved performance compared to their D1 results, they remained inferior to ensemble methods. Notably, QDA experienced a performance drop on D2 (85.71% accuracy), likely due to its sensitivity to feature covariance assumptions.
4.3. Comparative Insights
Across both datasets, ensemble models consistently outperformed classical models, demonstrating superior accuracy, robustness, and generalizability. The strongest performers, CatBoost, Bagging, and XGBoost, exhibited minimal variation across datasets, making them ideal candidates for clinical deployment where both high accuracy and reliability are critical.
Meanwhile, classical models such as Logistic Regression and LDA maintained competitive results, particularly on D2, making them suitable for low-resource environments requiring model interpretability and computational efficiency.
These findings underscore the crucial importance of evaluating diagnostic models across diverse datasets to ensure stability, particularly in high-stakes medical applications. Ensemble approaches offer a favorable trade-off between predictive power and robustness, validating their integration in intelligent thyroid cancer diagnostic systems.
5. Conclusion
This study set out to develop and implement classical and ensemble machine learning models for predicting thyroid cancer risk using clinical, demographic, and biochemical data. We applied Pearson correlation analysis to identify the most relevant predictive features, ensuring model training focused on the most informative variables.
Our experimental pipeline included comprehensive hyperparameter tuning and cross-validation, enhancing the robustness and generalizability of the models. Evaluation across two independent datasets confirmed the effectiveness of our approach: ensemble methods such as CatBoost, Bagging (Random Forest), and XGBoost achieved the highest overall performance, with accuracies nearing 99% on Dataset 2, and maintaining strong consistency across Dataset 1.
Classical models such as Logistic Regression, Ridge Classifier, and LDA also demonstrated solid performance, particularly when interpretability and simplicity are prioritized. These findings underscore the utility of both ensemble and classical models, depending on application constraints.
Overall, the results affirm the value of combining rigorous feature selection with model optimization strategies. Our dual-dataset evaluation further highlights the importance of testing model performance across cohorts to ensure clinical reliability. This framework lays the groundwork for future integration into real-world thyroid cancer diagnostic support systems.
Code and Datasets
To ensure transparency, reproducibility, and to facilitate further research, the complete source code developed for this study has been made publicly accessible. The code encompasses all essential components of the research workflow, including data preprocessing, feature selection, model implementation, hyperparameter tuning, and performance evaluation. The source code is available at the following links:
Two publicly available datasets were used in this study to analyze and predict thyroid-related conditions:
- Thyroid Cancer Risk Dataset: This dataset provides clinical and demographic attributes relevant to assessing thyroid cancer risk. It is available at: https://www.kaggle.com/datasets/mzohaibzeeshan/thyroid-cancer-risk-dataset.
- Thyroid Disease Dataset: This dataset contains diagnostic records for multiple thyroid disease categories and serves as a benchmark for classification tasks. It can be accessed at: https://www.kaggle.com/datasets/jainaru/thyroid-disease-data/data.
These datasets were selected for their comprehensiveness and relevance to the research objectives. They include a variety of clinical features such as hormone levels, patient history, and diagnostic outcomes, which were critical for building and evaluating machine learning models aimed at early detection and classification of thyroid disorders.
References
- Islam, S.S.; Haque, M.S.; Miah, M.S.U.; Sarwar, T.B.; Nugraha, R. Application of machine learning algorithms to predict the thyroid disease risk: an experimental comparative study. PeerJ Computer Science 2022, 8, e898. [Google Scholar] [CrossRef] [PubMed]
- Sharma, R.; Mahanti, G.K.; Chakraborty, C.; Panda, G.; Rath, A. An IoT and deep learning-based smart healthcare framework for thyroid cancer detection. ACM Transactions on Internet Technology 2023. [Google Scholar] [CrossRef]
- Bhende, D.; Sakarkar, G.; Chaurasia, S.; Amlanc, N.; Deshpande, S.; Samarth, P.; Yasmeen, Z. Machine learning-based classification of thyroid disease: a comprehensive study on early detection and risk factor analysis. In Proceedings of the 2024 IEEE International Students’ Conference on Electrical, Electronics and Computer Science (SCEECS). IEEE, 2024, pp. 1–6.
- Wu, Y.; Rao, K.; Liu, J.; Han, C.; Gong, L.; Chong, Y.; Liu, Z.; Xu, X. Machine learning algorithms for the prediction of central lymph node metastasis in patients with papillary thyroid cancer. Frontiers in endocrinology 2020, 11, 577537. [Google Scholar] [CrossRef] [PubMed]
- Wang, H.; Zhang, C.; Li, Q.; Tian, T.; Huang, R.; Qiu, J.; Tian, R. Development and validation of prediction models for papillary thyroid cancer structural recurrence using machine learning approaches. BMC cancer 2024, 24, 427. [Google Scholar] [CrossRef] [PubMed]
- Mourad, M.; Moubayed, S.; Dezube, A.; Mourad, Y.; Park, K.; Torreblanca-Zanca, A.; Torrecilla, J.S.; Cancilla, J.C.; Wang, J. Machine learning and feature selection applied to SEER data to reliably assess thyroid cancer prognosis. Scientific reports 2020, 10, 5176. [Google Scholar] [CrossRef] [PubMed]
- Prasad, V.; Rao, T.S.; Babu, M.S.P. Thyroid disease diagnosis via hybrid architecture composing rough data sets theory and machine learning algorithms. Soft Computing 2016, 20, 1179–1189. [Google Scholar] [CrossRef]
- Rao, A.R.; Renuka, B. A machine learning approach to predict thyroid disease at early stages of diagnosis. In Proceedings of the 2020 IEEE international conference for innovation in technology (INOCON). IEEE, 2020, pp. 1–4.
- Alhashmi, S.M.; Polash, M.S.I.; Haque, A.; Rabbe, F.; Hossen, S.; Faruqui, N.; Hashema, I.A.; Abubacker, N.F. Survival Analysis of Thyroid Cancer Patients Using Machine Learning Algorithms. IEEE Access 2024. [Google Scholar] [CrossRef]
- Borzooei, S.; Briganti, G.; Golparian, M.; Lechien, J.R.; Tarokhian, A. Machine learning for risk stratification of thyroid cancer patients: a 15-year cohort study. European Archives of Oto-Rhino-Laryngology 2024, 281, 2095–2104. [Google Scholar] [CrossRef] [PubMed]
- Lee, K.S.; Park, H. Machine learning on thyroid disease: a review. Frontiers in Bioscience-Landmark 2022, 27, 101. [Google Scholar] [CrossRef] [PubMed]
- Xi, N.M.; Wang, L.; Yang, C. Improving the diagnosis of thyroid cancer by machine learning and clinical data. Scientific reports 2022, 12, 11143. [Google Scholar] [CrossRef] [PubMed]
- Chen, T.; Guestrin, C. Xgboost: A scalable tree boosting system. In Proceedings of the Proceedings of the 22nd acm sigkdd international conference on knowledge discovery and data mining, 2016, pp. 785–794.
- Ke, G.; Meng, Q.; Finley, T.; Wang, T.; Chen, W.; Ma, W.; Ye, Q.; Liu, T.Y. Lightgbm: A highly efficient gradient boosting decision tree. Advances in neural information processing systems 2017, 30. [Google Scholar]
- Prokhorenkova, L.; Gusev, G.; Vorobev, A.; Dorogush, A.V.; Gulin, A. CatBoost: unbiased boosting with categorical features. Advances in neural information processing systems 2018, 31. [Google Scholar]
Table 3.
Weighted average metrics of models on Datasets 1 and 2.
| Model | Acc(D1) | Acc(D2) | Prec(D1) | Prec(D2) | Rec(D1) | Rec(D2) | F1(D1) | F1(D2) |
|---|---|---|---|---|---|---|---|---|
| Logistic Regression | 0.8251 | 0.9740 | 0.81 | 0.97 | 0.83 | 0.97 | 0.81 | 0.97 |
| Ridge Classifier | 0.8251 | 0.9610 | 0.81 | 0.96 | 0.83 | 0.96 | 0.81 | 0.96 |
| SGD | 0.7667 | 0.9740 | 0.59 | 0.97 | 0.77 | 0.97 | 0.67 | 0.97 |
| Passive Aggressive | 0.7236 | 0.9610 | 0.70 | 0.96 | 0.72 | 0.96 | 0.71 | 0.96 |
| Perceptron | 0.7002 | 0.9740 | 0.71 | 0.97 | 0.70 | 0.97 | 0.70 | 0.97 |
| KNN | 0.8095 | 0.9091 | 0.79 | 0.91 | 0.81 | 0.91 | 0.79 | 0.91 |
| Decision Tree | 0.8251 | 0.9610 | 0.81 | 0.96 | 0.83 | 0.96 | 0.81 | 0.96 |
| Random Forest | 0.8251 | 0.9740 | 0.81 | 0.97 | 0.83 | 0.97 | 0.81 | 0.97 |
| Extra Trees | 0.8251 | 0.9740 | 0.81 | 0.97 | 0.83 | 0.97 | 0.81 | 0.97 |
| Bagging (RF) | 0.8251 | 0.9870 | 0.81 | 0.99 | 0.83 | 0.99 | 0.81 | 0.99 |
| Naive Bayes | 0.8120 | 0.8961 | 0.80 | 0.90 | 0.81 | 0.90 | 0.80 | 0.89 |
| LDA | 0.8251 | 0.9610 | 0.81 | 0.96 | 0.83 | 0.96 | 0.81 | 0.96 |
| QDA | 0.8251 | 0.8571 | 0.81 | 0.86 | 0.83 | 0.86 | 0.81 | 0.84 |
| Grad. Boosting | 0.8251 | 0.9740 | 0.81 | 0.97 | 0.83 | 0.97 | 0.81 | 0.97 |
| AdaBoost | 0.8251 | 0.9610 | 0.81 | 0.96 | 0.83 | 0.96 | 0.81 | 0.96 |
| HistGB | 0.8251 | 0.9610 | 0.81 | 0.96 | 0.83 | 0.96 | 0.81 | 0.96 |
| XGBoost | 0.8251 | 0.9740 | 0.81 | 0.97 | 0.83 | 0.97 | 0.81 | 0.97 |
| LightGBM | 0.8251 | 0.9481 | 0.81 | 0.95 | 0.83 | 0.95 | 0.81 | 0.95 |
| CatBoost | 0.8251 | 0.9870 | 0.81 | 0.99 | 0.83 | 0.99 | 0.81 | 0.99 |
| SVM | 0.8251 | 0.9740 | 0.81 | 0.97 | 0.83 | 0.97 | 0.81 | 0.97 |
Disclaimer/Publisher’s Note: The statements, opinions and data contained in all publications are solely those of the individual author(s) and contributor(s) and not of MDPI and/or the editor(s). MDPI and/or the editor(s) disclaim responsibility for any injury to people or property resulting from any ideas, methods, instructions or products referred to in the content. |
© 2025 by the authors. Licensee MDPI, Basel, Switzerland. This article is an open access article distributed under the terms and conditions of the Creative Commons Attribution (CC BY) license (http://creativecommons.org/licenses/by/4.0/).
Copyright: This open access article is published under a Creative Commons CC BY 4.0 license, which permit the free download, distribution, and reuse, provided that the author and preprint are cited in any reuse.


