Submitted:
12 July 2025
Posted:
14 July 2025
You are already at the latest version
Abstract
Australian agriculture managers deal with climates that are characterised by high var-iability and unpredictability. A simple framework for decision making is used to structure weather related enquiries using recent and long-term climate data to better inform de-cisions based on current conditions and future expectations.
This paper describes the rationale, design philosophy, and development journey of Australian CliMate (CliMate), a contemporary climate analysis tool built to consolidate and modernise functionality of earlier DSTs. CliMate aimed to be simple, transparent, and user-driven, supporting tactical and strategic agricultural decisions. Ten core analyses were included from previous DSTs.
With over 20,000 registered users and widespread adoption among farmers, consultants, and other professionals over a decade, CliMate demonstrates the enduring demand for accessible, mobile climate analysis tools. We reflect on lessons learned in the development process, advocating for minimalism, iteration with users, and integration of transparent data sources. This experience underscores the necessity for long-term support and evaluation to sustain the value of agricultural DSTs.
Keywords:
decision support
; mobile application
; risk assessment
; climate variability
; evaluation
1. Introduction
Given the variable and unpredictable nature of seasons (weather) across Australia [1] and the impact of rainfall and other climate variables on management in agriculture [2], it is not surprising that discussion amongst farmers and their advisors is often around “the weather” and seasonal outlooks. These discussions generally begin “how much rain did you get?” which often moves on to “what’s likely in the coming weeks or season?”. These discussions, whether social or part of strategic and tactical decision-making are often biased by recent weather and shaped by varying expectations from forecasts.
This natural preoccupation with “the weather” led to the development of several computer-based decision support tools (DSTs) including Rainman [3,4], Howwet? [5] and CropMate [6]. With time, most of these DSTs became redundant due to lack of maintenance, emergence of new technologies and loss of support for established technologies. Computing power moved from the desktop to being readily available on mobile devices which offered promise [7]. While these older DSTs were widely applied and valued [3,6,8,9], they were not maintained and degraded with time, with most not being available beyond their active funding period (1-5 years).
Traditional responses to managing variable water supply for crops include fallowing between dryland crops to store soil water and irrigation where available, adjusting planting windows to avoid frost and heat stress and modifying inputs to suit seasonal expectations [2]. Short term (<14 day) and seasonal forecasts (3-6 months) are provided by public [10] and private providers with variable credibility in the rural community [11].
Anderson et al. [12] maintained that decision making in agriculture would be improved if we asked questions such as “what chances, what choices and what consequences”. This paper describes the rationale behind redevelopment of a set of climate related decision support analyses designed to support Anderson et al.’s [12] proposition. The resulting product, Australian CliMate [13] hereafter referred to as CliMate, incorporates analyses from ten products developed over previous decades. We describe the development pathway, design philosophy and reflect on its use and lessons learnt during its development.
2. Design Philosophy
The initiative for CliMate’s development came from recognition that previous DSTs developed for climate analyses, while valued, had become redundant due to developer “champions” no longer available, ceased funding, and developments in technology (from desktop to mobile devices). CliMate was developed under the Managing Climate Variability Program (MCVP), a consortium of rural research and development corporations managed by the Australian Grains Research and Development Corporation. A draft concept was proposed in 2009 for a “generic climate analyser” to incorporate the best features of previous climate related DSTs into one package by 2013. The initial design planned for a desktop application only, but observations of train commuters engrossed in their mobile phones highlighted the potential for mobile platforms to support agricultural decision makers [7]. A second phase (2015-2018) increased the availability of CliMate to include Android and www versions with minor maintenance funding thereafter. The vision was that farmers and their advisors could consult a range of DSTs in their fields where they make decisions along with discussions with their advisors.
It was recognised at the planning stage that a simple enquiry focused approach was more likely to be useful and educative (exploration of “what chances, what choices”) rather than a complex treatment of climate information which was possible with available technology. The concept was that rather than provide answers, a DST should support iterative exploration of the decision space, allowing users to gain a better understanding of current conditions and future expectations based on local climate data.
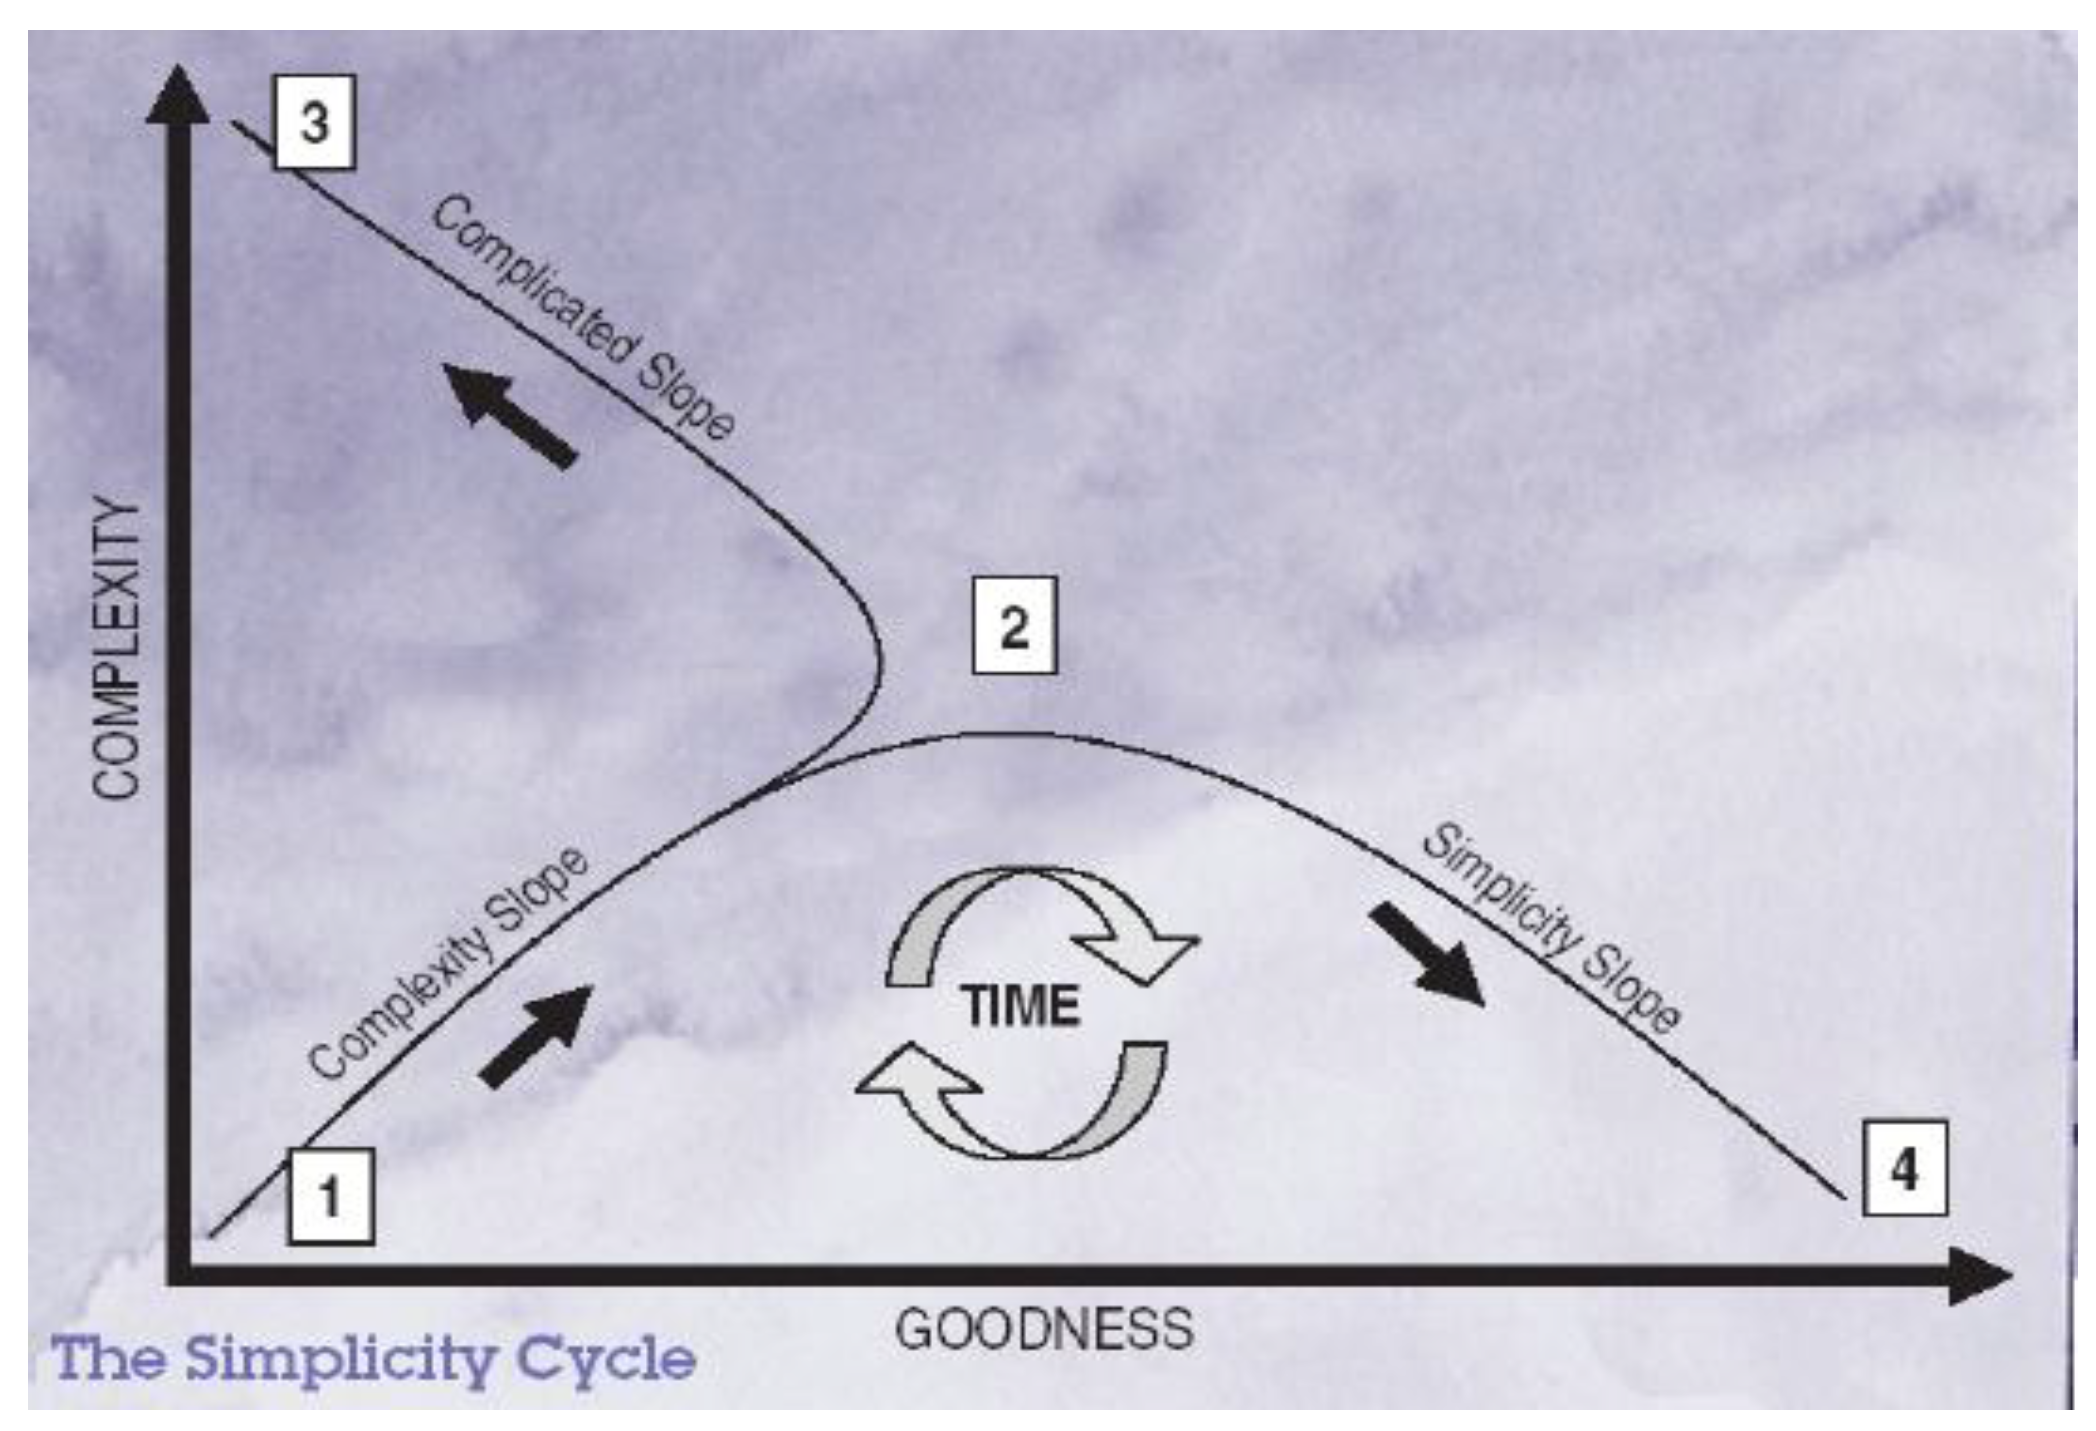
A common belief in the “science” community, who are typically the developers of DSTs, is that adding detail or completeness to an analysis or as a more realistic treatment of the real world (added complexity) would result in a “better” DST and better decisions. Ward [16] proposed that technology can follow several paths as it matures. Some developments add complexity in the belief this will improve reliability of the innovation yet the outcome for usefulness or “goodness” can follow two pathways (Figure 1). Our aim was to follow the simplicity slope of Figure 1 with reduced complexity and improved functionality, even though we experienced peer pressure to add functionality.
Our aim in developing CliMate was to adopt a minimalist approach, with emphasis on user involvement during design and development [15] while avoiding some of the traps of previous developments [16,17].
2.1. Conceptual Framework
A conceptual framework proposed for weather-based decisions consists of two components: understanding the status or current conditions of a system based on recent weather; and future expectations based on probabilistic analysis of long-term data (so called “climatology”) (Figure 2). CliMate facilitates exploration of local data to support tactical and strategic decisions with two categories of analysis included:
- Assessing current condition of a system (rainfall to date, soil water, heat sum, drought) using near real time data from a local weather station, the “knowable” element shown in Figure 2; and
- Probability of future weather events based on “climatology” derived from a probabilistic analysis of historic weather data (rainfall, temperature, radiation) and derivatives (heat sum, soil moisture).
Figure 2.
A decision framework for climate related decisions in agriculture where an outcome of a decision is based on a balance between current conditions and probability of future events.
Figure 2.
A decision framework for climate related decisions in agriculture where an outcome of a decision is based on a balance between current conditions and probability of future events.
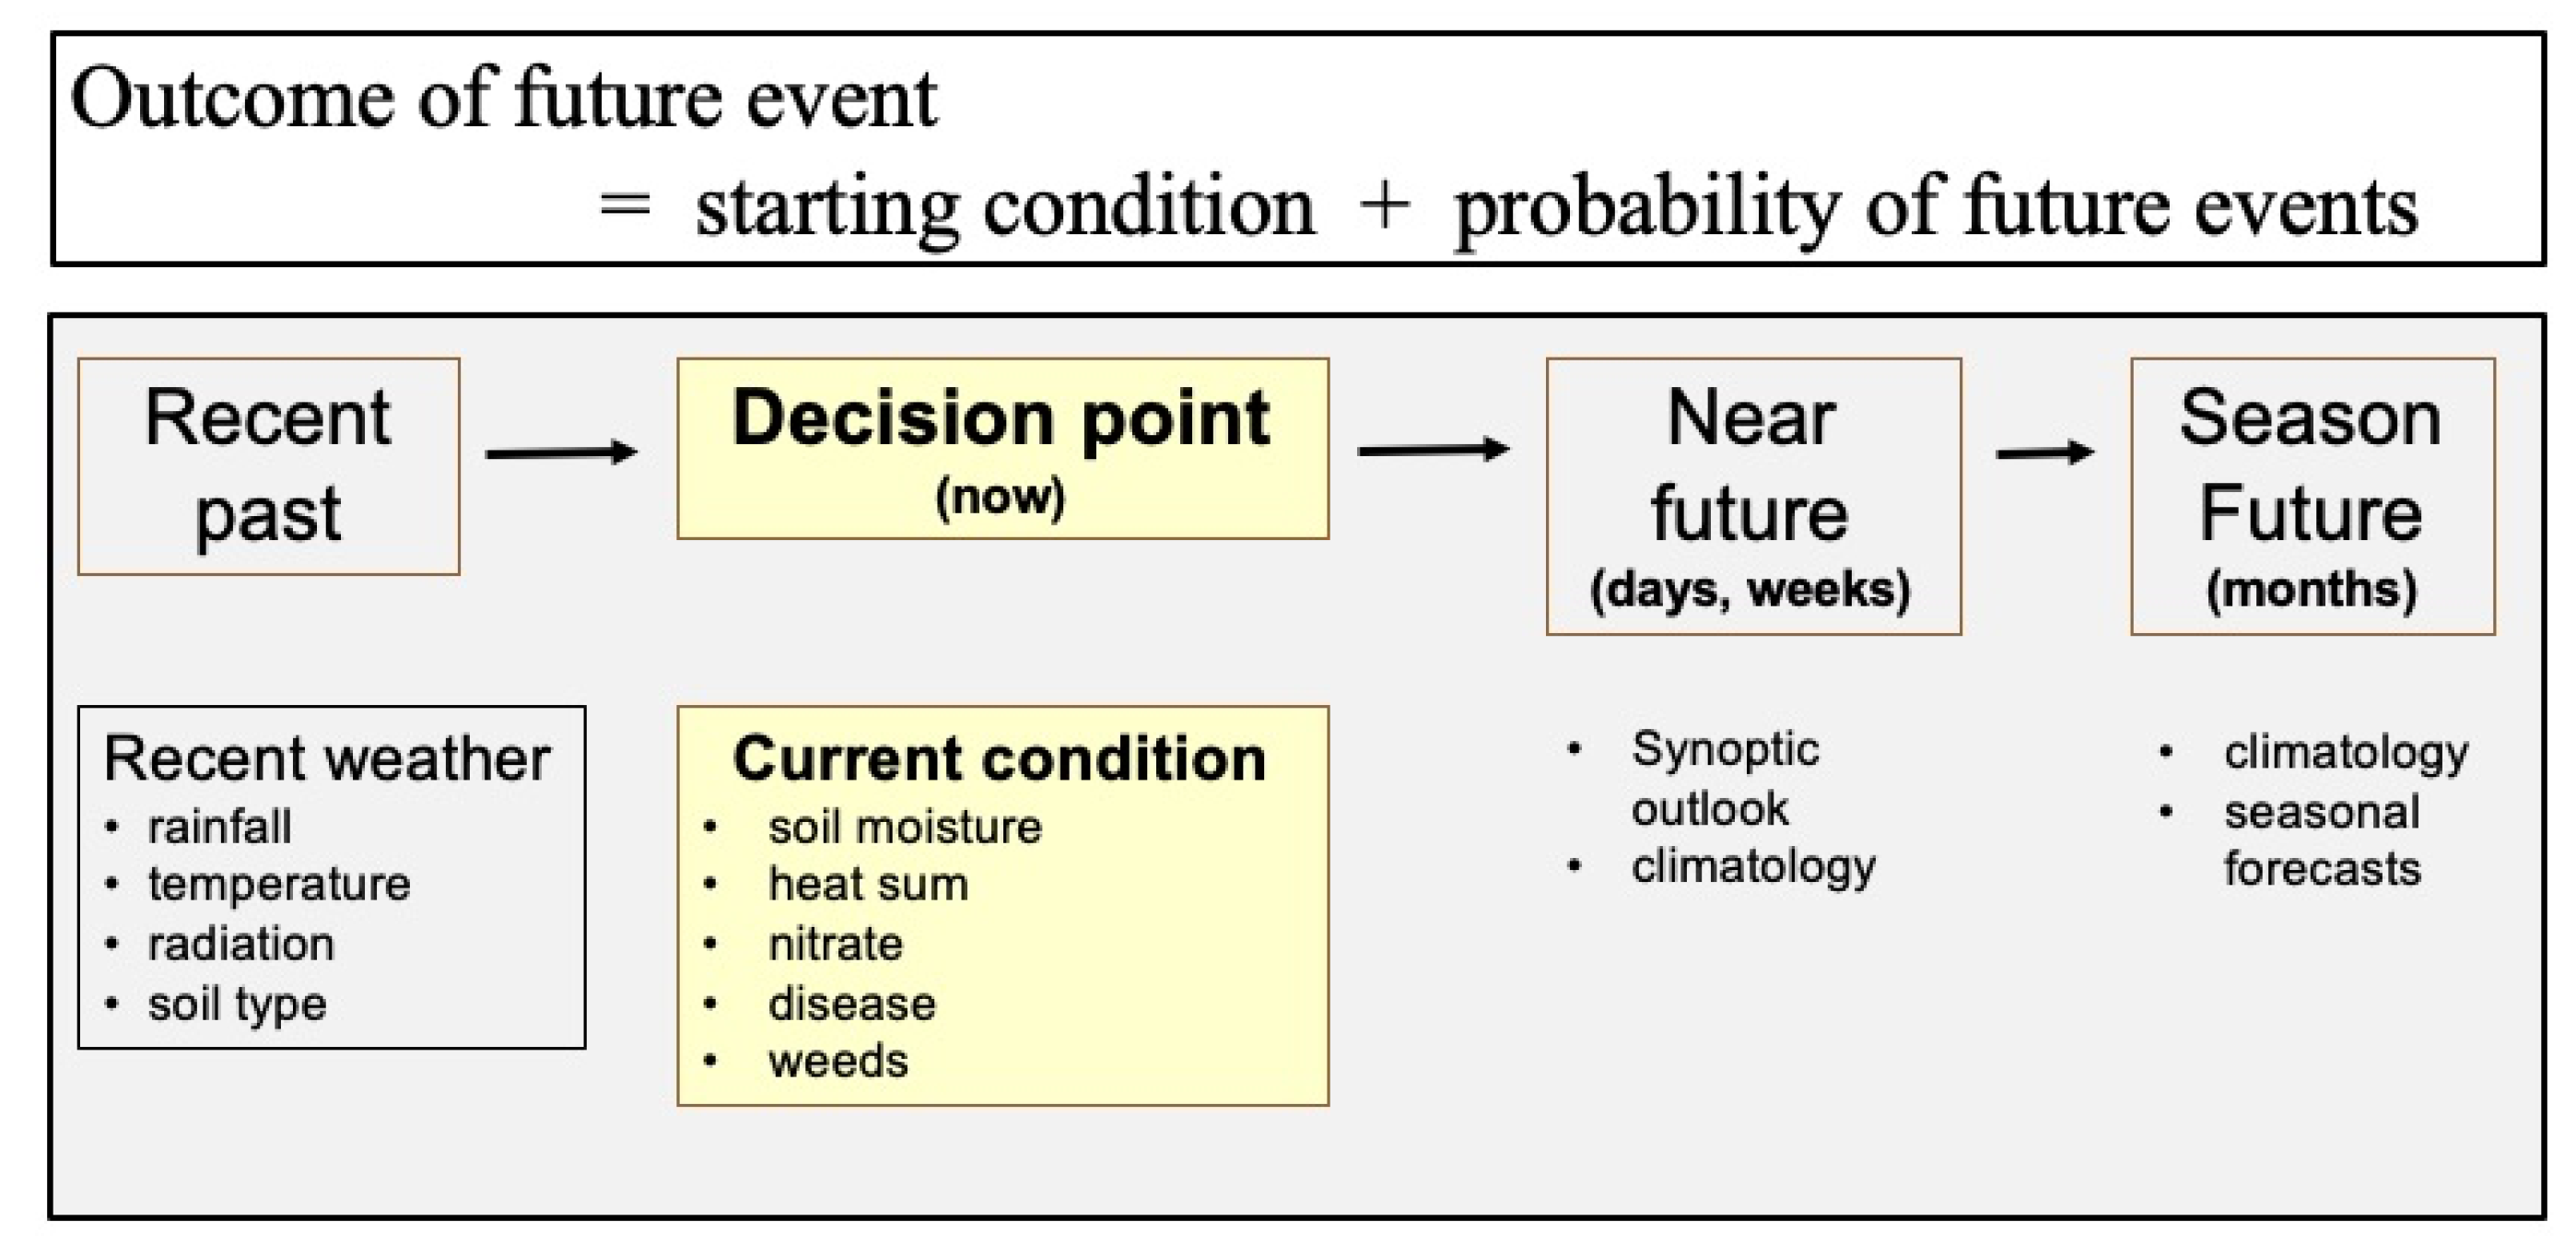
This framework is like the ADOPT approach used to evaluate information and adoption of new technology [18]. Kuehne et al.’s [18] framework also includes a third component which considers a model’s sensitivity and associated discussive potential. CliMate ‘s suitability for iterative exploration for each analysis implicitly meets this third element. In applying the framework (Figure 2), the decision point travels with time, with recent weather history often an important part of any decision. For example, rainfall in the previous weeks or months will be highly influential on soil water status (measurable or knowable). This balance between system status and future expectations can be particularly important when 30-80% of a crop’s water supply is derived from soil water at planting (starting condition) in the northern Australian grain regions [19].
CliMate’s interface was designed to encourage a “discussive” or explorative approach to current conditions and future expectations given its ability to iterate through adjustments to queries of the climate record. CliMate’s reliance on “climatology” rather than forecasts was a purposeful decision in the spirit of maintaining simplicity and transparency and based on user feedback. An application of a seasonal forecast signal was initially included (How likely?) but during construction, skills in forecasts were in a state of flux [20,21] and specialised forecast information was available elsewhere [22,23].
2.2. Specifications
Considering previous DSTs and feedback from prototype users, ten analyses were initially included (Table 1). Key functions of the proposed DST were to:
- Develop a common interface between the previously valued but lapsed analyses;
- Support transparent and open-ended queries to accommodate users’ rules and models across a wide range of agricultural industries (grazing, cropping, horticulture, apiculture);
- Involve stakeholders early in development and revise protypes based on feedback;
- Aim for a minimalist interface (input and output), applying a principle of “if in doubt, leave it out” and use easily recognised graphical presentations such as “fire risk” charts, histograms and line graphs;
- Provide output as text and graphics to accommodate different learning styles [18];
- Allow the mobile-based apps to be used “offline” by farmers when in the “field”. This required accessing and storing climate data sourced when last connected to the internet;
- Include a “backend” that supported iterative tuning of interfaces based on user feedback, shortening development cycles; and
- Embed the ability to monitor use of each analysis including spatial and industry application.
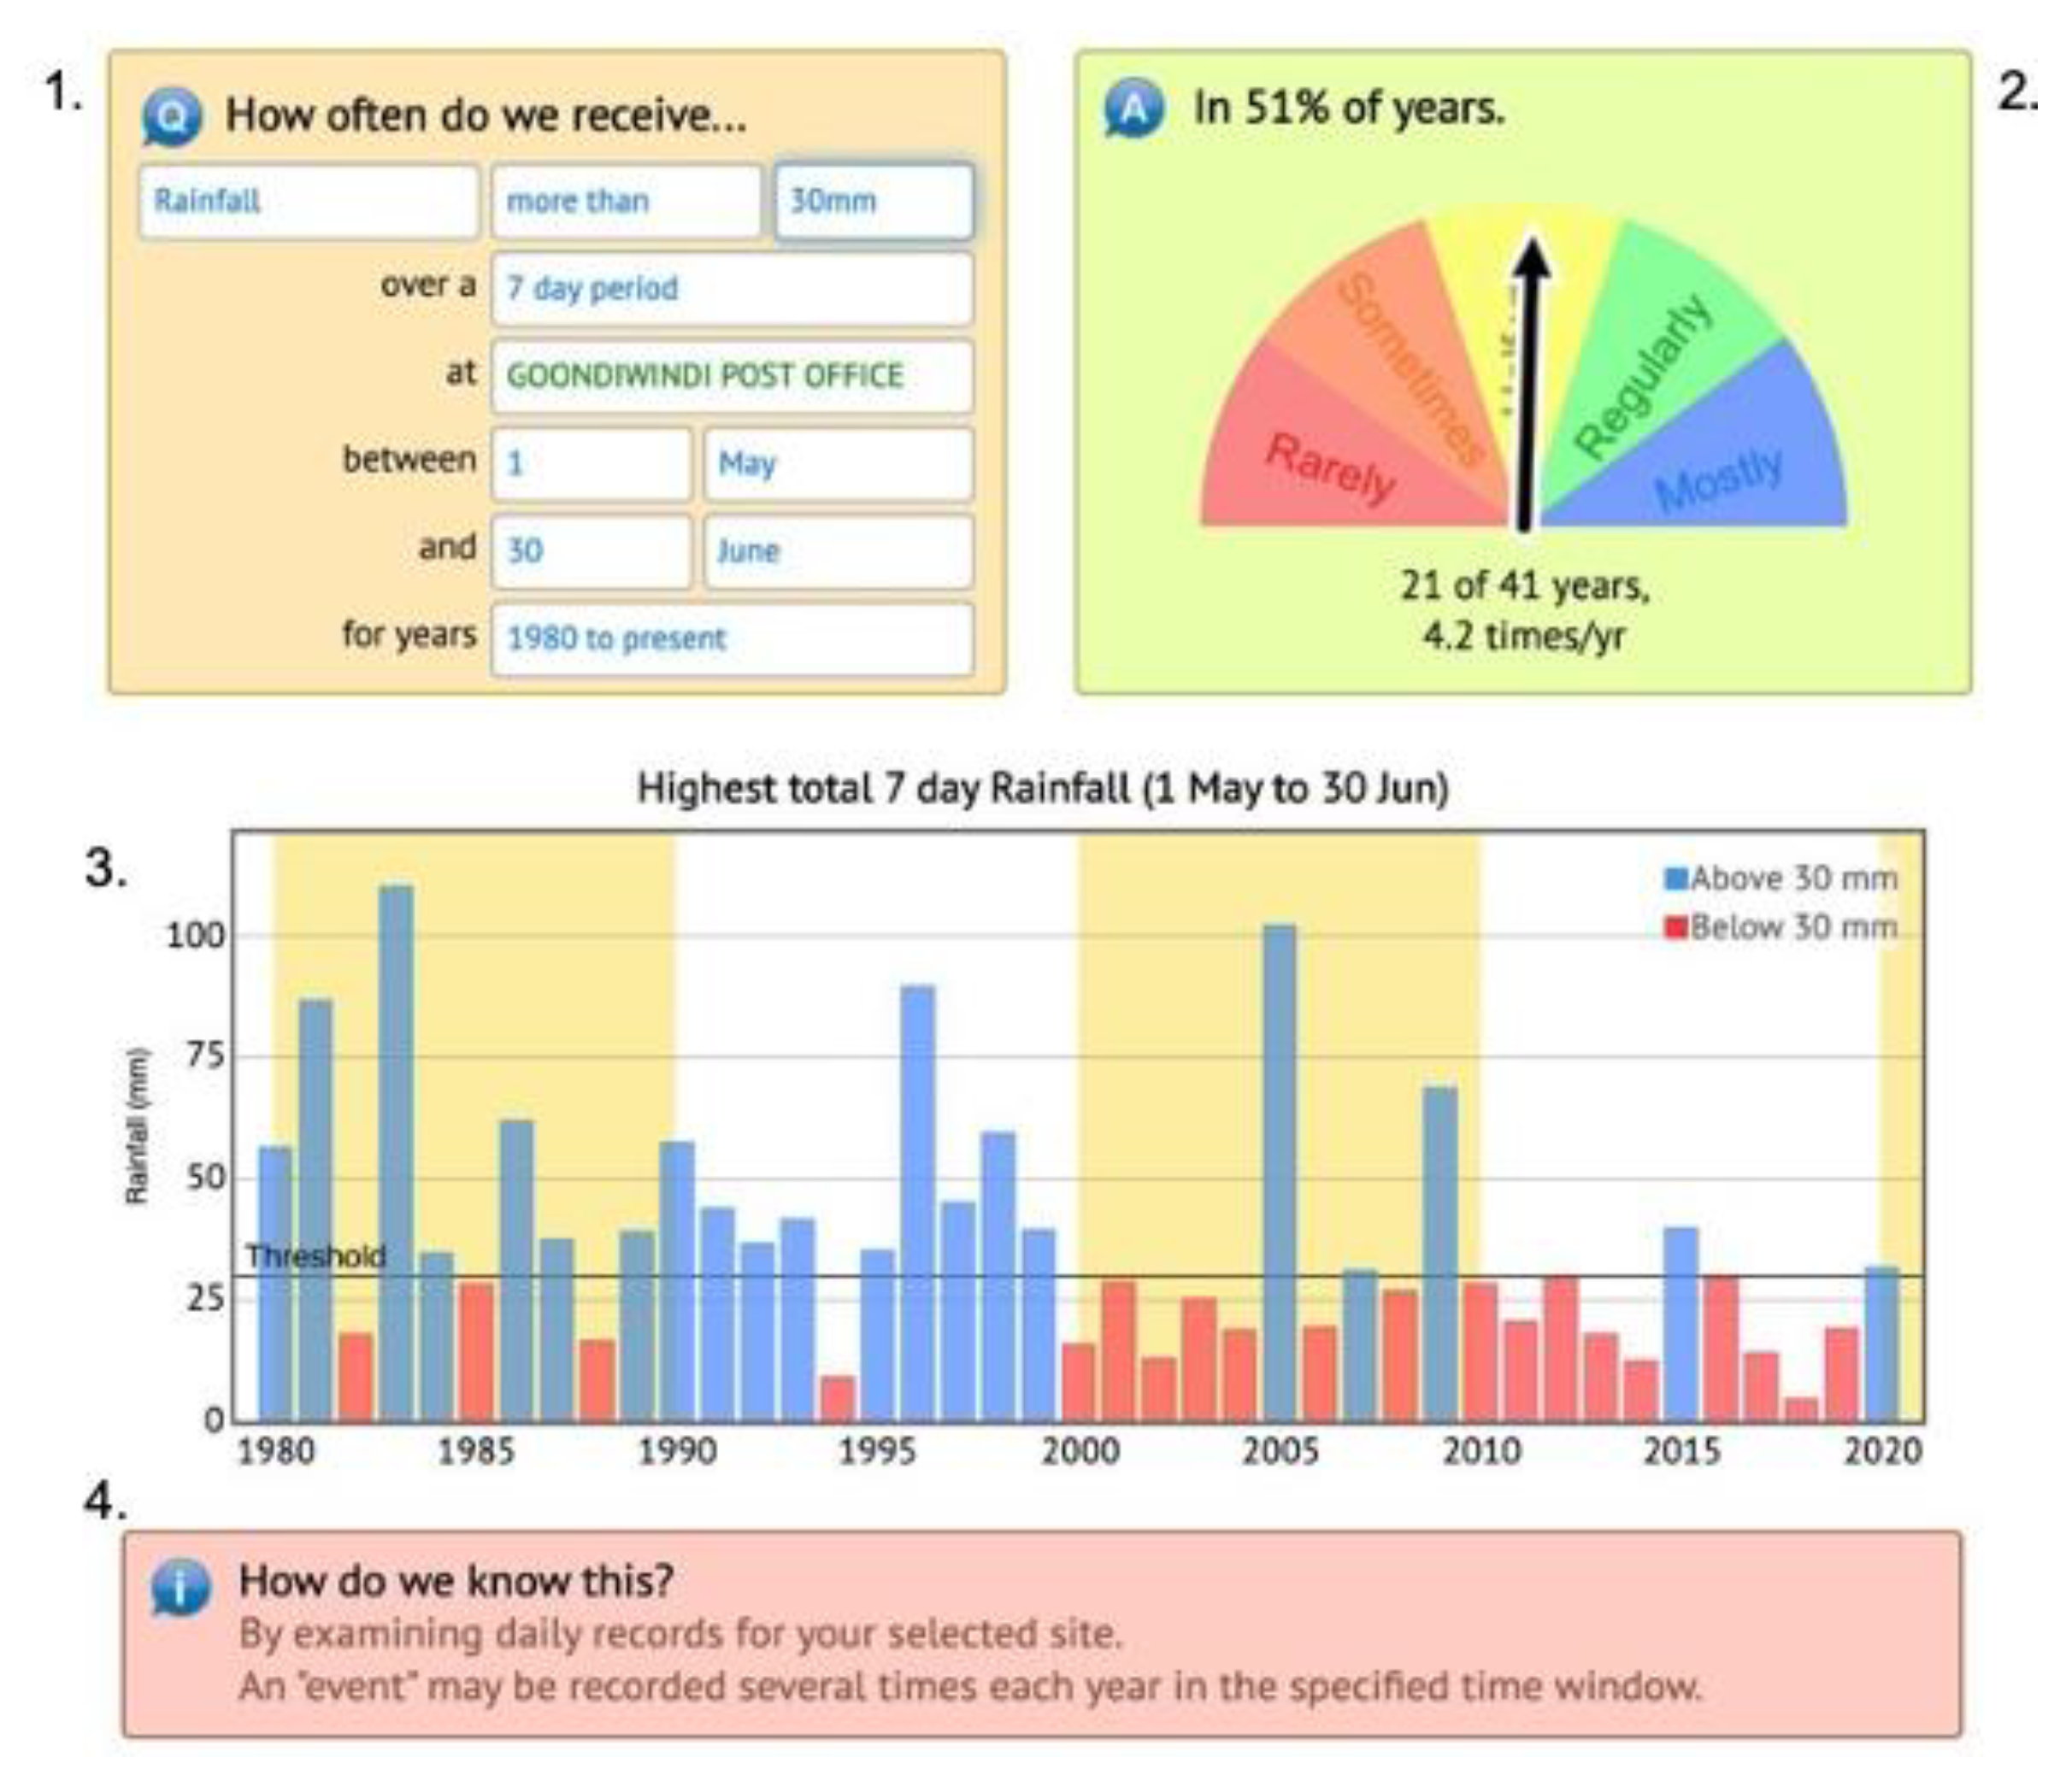
As an example (Figure 3), the Howoften? analysis demonstrates some interface features common across CliMate with inputs including: variable selection (rainfall, consecutive maximum/ minimum temperature, solar radiation); greater than or less than; a target metric value; the number of days over which a test is applied; a location (selected from a list or map); start and end date of a period being explored and the decades of interest. Default values are provided as a starting point for new users while input values from previous analyses are retained. Results are presented as: a fire chart with percentage years the query was true; as text; and a histogram of “hits and misses”. User can iteratively change inputs and view changes immediately, supporting exploration of their local climate.
The initial target audience for CliMate was farmers, with advisors and consultants across all agricultural industries (cropping, grazing, horticulture to apiculture) considered secondary. This audience later extended to education, banking and insurance assessors. To accommodate this broad user base, analyses were designed to be generic yet customisable for diverse agricultural contexts. The app was packaged for iOS and Android native apps and any device that supported a web browser.
Figure 3.
Interface for the Howoften? analysis showing: 1 inputs; 2 outputs as a “fire risk” chart and simple statistics; 3 annual time series; and 4 a brief text explanation of how each analysis was carried out.
Figure 3.
Interface for the Howoften? analysis showing: 1 inputs; 2 outputs as a “fire risk” chart and simple statistics; 3 annual time series; and 4 a brief text explanation of how each analysis was carried out.
2.3. Software and Data Sources
CliMate consists of four separate applications: a website for analysis and administration; a web API for mobile device communication; and separate iOS and Android applications. When development began in 2012, a mature cross-platform development technology was not available to use a single set of source code across all platforms. Therefore, separate technologies were used for each platform including Microsoft asp.Net for the web application and web API, and native technologies for the two mobile applications (Objective-C and Java).
To simplify development and maintenance, a common structure and naming convention was applied across all technologies. Despite having three sets of code for each analysis, core syntax was almost identical across each coding language. Data is stored on an SQL Server database and a custom-built synchronisation algorithm ensured that user-data is synchronised across multiple devices via a web API. This allows off-line operation of the mobile applications with user-data and settings updated once an internet connection was detected. The app is administered from a common web service which supports maintenance, adjustment of default values, generation of user analytics for the three platforms and links to support material.
Long term climate data are curated by the Australian Governments’ Bureau of Meteorology [10] while a continuous data stream of the main climate variables is hosted by the Queensland Governments’ SILO [24] with a national coverage of ~8,000 locations available from 1889 to present. SILO’s data stream is freely available under the Creative Commons Attribution 4.0 International (CC BY 4.0) license. SILO is the only available, curated, long term and continuous daily weather data record available in Australia and while many of Silo’s sites have interpolated and modelled data based on nearest available data, presents the best available data source [25]. CliMate could be extended to any source of continuous daily weather data. Selection of soil types for the Howwet? analysis [5] used a matrix based on soil depth (shallow, average, deep) and texture (heavy clay, light clay, clay loam, sandy loam and sands) for each Australia state (15 generic soil types).

Table 1.
Summary of origin, function, variables considered and interface for ten analyses within Australian CliMate.
Table 1.
Summary of origin, function, variables considered and interface for ten analyses within Australian CliMate.
|
Analysis Origin1 |
Function, application (variables2) |
Interface |
| How’s the season? Rainman [3,4] Qld Govt. |
Current season relative to long term. Adjust expectations, inputs. (1,2,4,5) |
 |
| Howoften? Howoften? [26] Qld Govt. |
Probability of weather event. Risk assessment key operations e.g., planting rain, heat/frost stress, grazing days. (1,2,4) |
 |
| How Wet /Nitrate? Howwet? [5] Qld Govt. |
Soil water and nitrate accumulation in fallows. yield expectations, nitrogen inputs, crop choice (1,2,6,7) |
 |
| Potential yield? WUE [27] PYCalc [28], DAWA |
Expected crop yield Adjust inputs, marketing. (1, WUE) |
 |
| Drought? SCOPIC [29] Qld Govt. |
Drought status, rainfall deficit -decile method. Stocking rate alert, financial relief (1,9) |
 |
| How hot/cold? CropMate [6] NSW Govt. |
Coincident probability of min and max temperature. Risk assessment for new crops, new managers (1,2) |
 |
| How’s the past? Standard statistics. MCVP |
Historic weather. Seasonal overview. land purchase, (1,2,3,4) |
 |
| What trend? Graphical analysis MCVP |
Long term trends graphic. Assess trends and variability (1,2,4,10) |  |
| How likely? SCOPIC [29] BoM, Qld Govt. |
Season forecast and skill (ENSO). Assess forecast skill to compliment “climatology” assessment (11) |
 |
| How’s El Nino Direct lookup BoM, Qld Govt., MCVP |
SOI, ENSO status. Seasonal forecast (11) |
 |
Notes1Origin: Qld Govt – Queensland Government; NSW Govt. - New South Wales Government; MCVP – Managing Climate Variability Program; DAWA -Department of Agriculture, Western Australia; BoM- Bureau of Meteorology, Australian Government. 1 Variables: 1-rainfall; 2-temperature; 3-evaporation; 4-radiation. Derived variables: 5-heat sum, 6-soil water, 7-soil nitrate, 8-crop yield, 9-drought index; 10-incidences of weather events. Lookup variables: 11-SOI, ENSO, IOD. WUE – Water Use Efficiency.
3. The Analyses
Ten analyses were originally included of which nine access data directly from the Silo database while How’s El Nino? sourced data from a link to the Bureau of Meteorology. A summary of the ten initial analyses is shown in Table 1 along with each analysis’s origin, function and application.
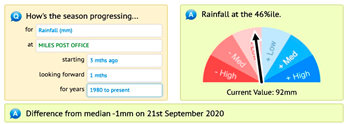
How’s the Season? tracks the current season’s rainfall, temperature, radiation and heat sums in relation to previous years. Applications include adjusting agricultural inputs as a season progresses; forward marketing based on yield expectations, and providing an objective basis for discussions around seasonal prospects for multiple paddocks and clients.
Howoften? calculates a probability of future events based on climatology only (frost, heat stress, planting rain, extreme events) to assess risks of key agronomic and pasture management actions (e.g., crop establishment, heat sum to achieve maturity, break of season for pasture production, wet weather during key operations) within a season.
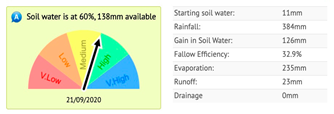
How Wet?/Nitrate? estimates soil water accumulation and nitrate mineralisation during a non-crop (fallow) period. Tactical applications include yield expectations based on soil water at planting and nitrogen fertilizer requirements based on nitrate N accumulation relative to other years.
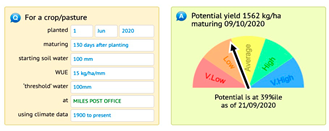
Potential Yield? provides a progressive yield expectation based on soil water at planting, rainfall-to-date and expected rainfall to maturity using a simple water use efficiency model (WUE) [27]. This model’s simplicity is attractive to farmers and consultants in tactical and strategic decision making by adjusting inputs during the season and exploring long term yield expectations.
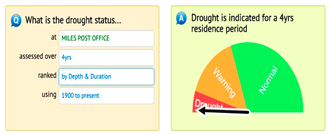
Drought? tracks drought status using the Rainfall Percentile Method [30]. A “drought” condition is flagged when rainfall for a specified “residence time” is below an arbitrary 10 %ile value. Residence time is dependent on location and enterprise. For example, a short duration horticulture crop may have a residence time of months while extensive grazing may have a residence time of several years.
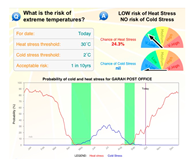
How Hot/Cold? estimates a simultaneous probability of hot and cold extremes and is suited to analysis of temperature conditions when considering a new location and crop, pasture and cultivar types. In many parts of Australia, production is often constrained by heat or cold stress at the beginning or end of growing seasons.
How’s the Past? provides an overview of historic rainfall, temperature, radiation and evaporation data. Applications include strategic analysis for land purchase and reviewing recent seasons.
What Trend? visualises long-term annual times series for rainfall, temperature and radiation and incidences of extremes values for specified monthly windows. Applications include exploring trends in relation to annual variability.
How Likely? generated probabilistic seasonal rainfall and temperature forecasts, looking forward 3 to 6 months along with an assessment of past forecast skill. The forecast was based on correlations between seasonal weather and sea surface temperature and El Niño Southern Oscillation index values.
How’s El Nino? accessed the status of the El Nino Southern Oscillation index and the Bureau of Meteorology (BoM) seasonal interpretation. This analysis was based on a direct feed from the Bureau of Meteorology.
Both How likely? and How’s El Nino were discontinued in 2019 due to either application of unpublished methodology or loss of data feeds with both being least used analyses.
4. Adoption
User characteristics were voluntarily collected during registration (profession and industry involvement) while location, sessions (>30 seconds) and analysis use were continuously collected from 2017. Administrator access allowed the development team to assess use patterns with minor adjustments implemented based on user feedback.
With > 20,000 registered users since its release in 2013, CliMate has been applied across most of Australia (Figure 4). Figure 5 plots registrations and “user sessions” since 2017 while Figure 6 summaries users by agricultural industry and professional group. After CliMate’s main release across all platforms in 2017, registrations ramped up for 18 months even though there was no concerted publicity campaign. “Marketing” was by word of mouth, rural media and industry meetings rather than a concerted campaign, a common feature of many agricultural DSTs.
Grain and animal production users accounted for 70% of users while farmers were the most common user group by profession (Figure 6). The top 100 users have accessed CliMate for ~800 sessions (median), dominated by consultants and insurers. With approximately 85,500 agricultural enterprises in Australia [31] and ~6,000 agricultural consultants [32], we estimate ~ 50% agricultural consultants have used CliMate since its release.
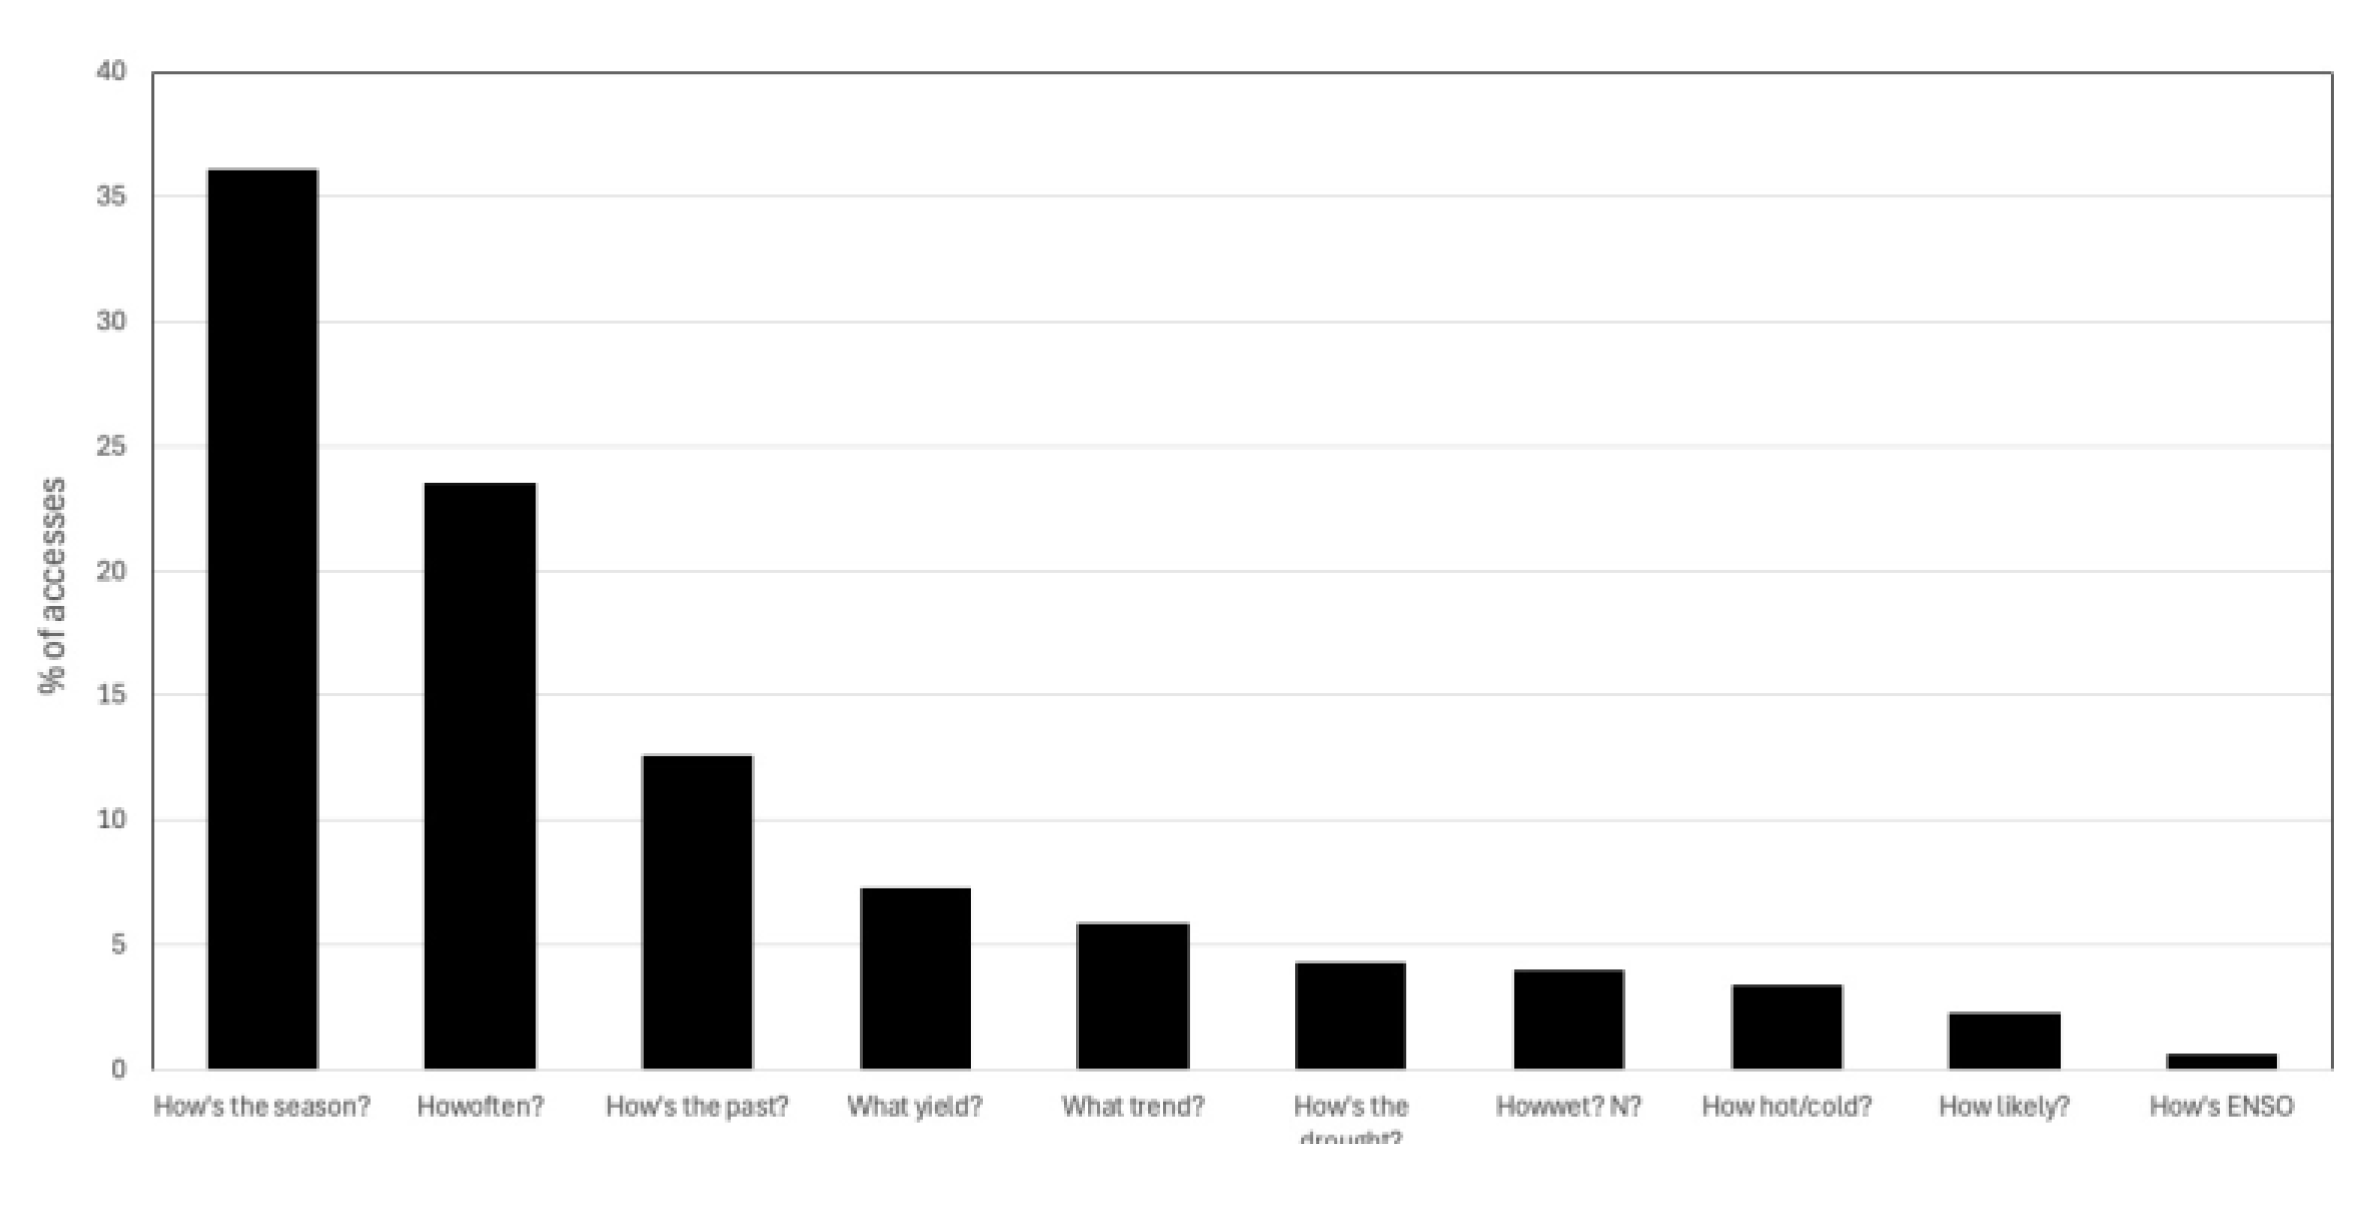
Of the 10 analyses available, the most used analysis was “How’s the season?” (Figure 7) followed by the probabilistic How often? and the longer view How’s the past? Most analyses were used >5,000 times annually. Farmers used How’s the season? most, grain farmers used Yield potential? the most while academics used What trend? the most.
Figure 4.
Silo sites accessed by CliMate user (2017-2025, n=16,700).
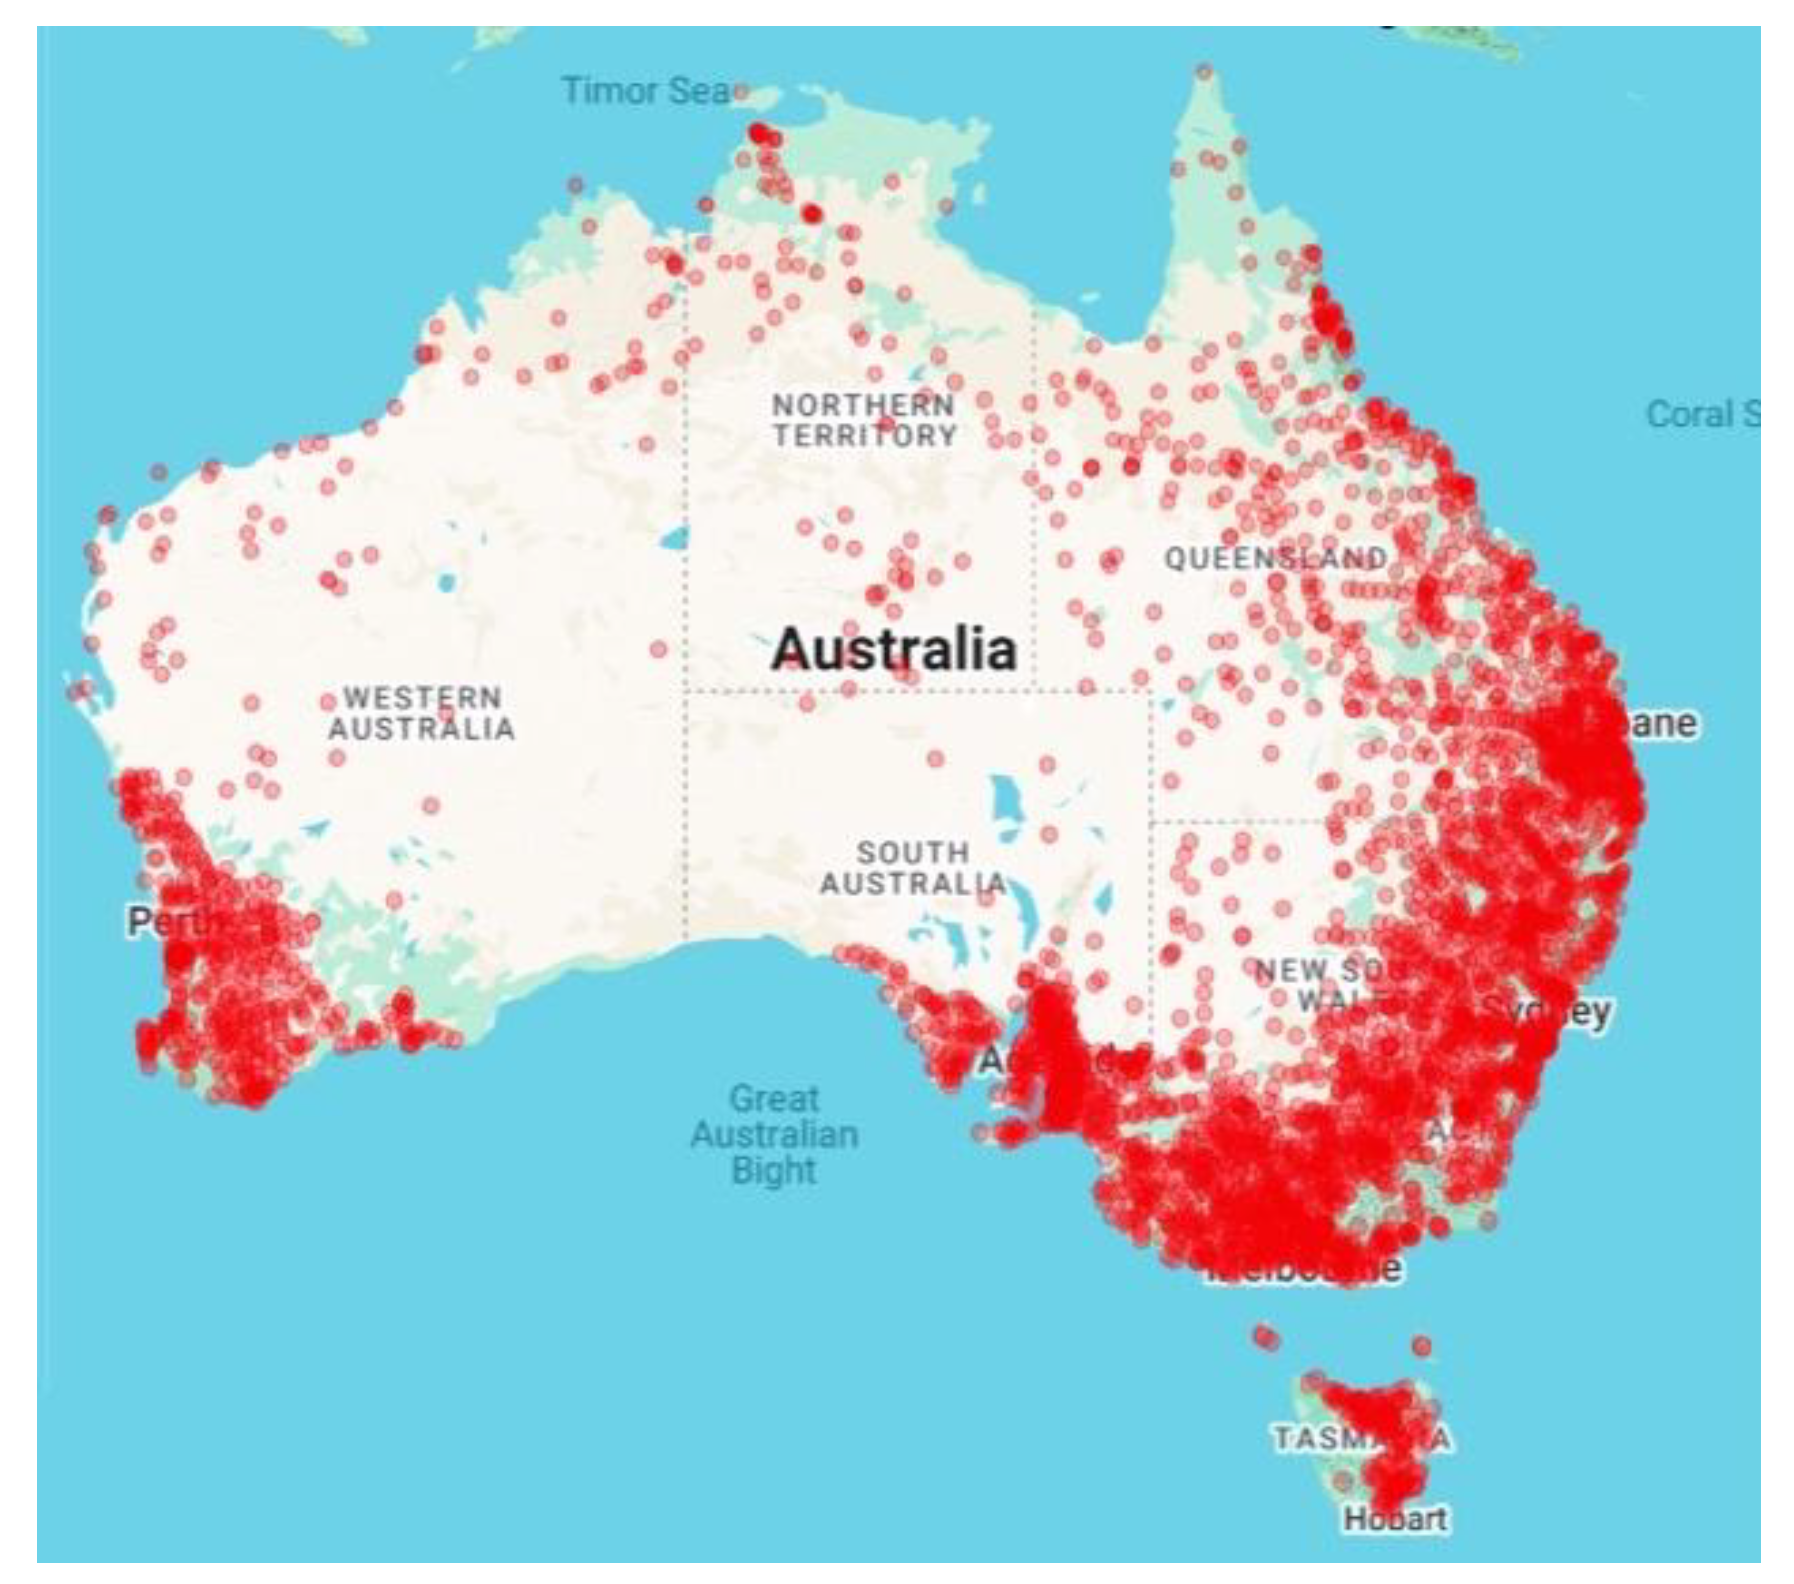
Figure 5.
Registrations and sessions recorded (2017-2025 n=19,000).
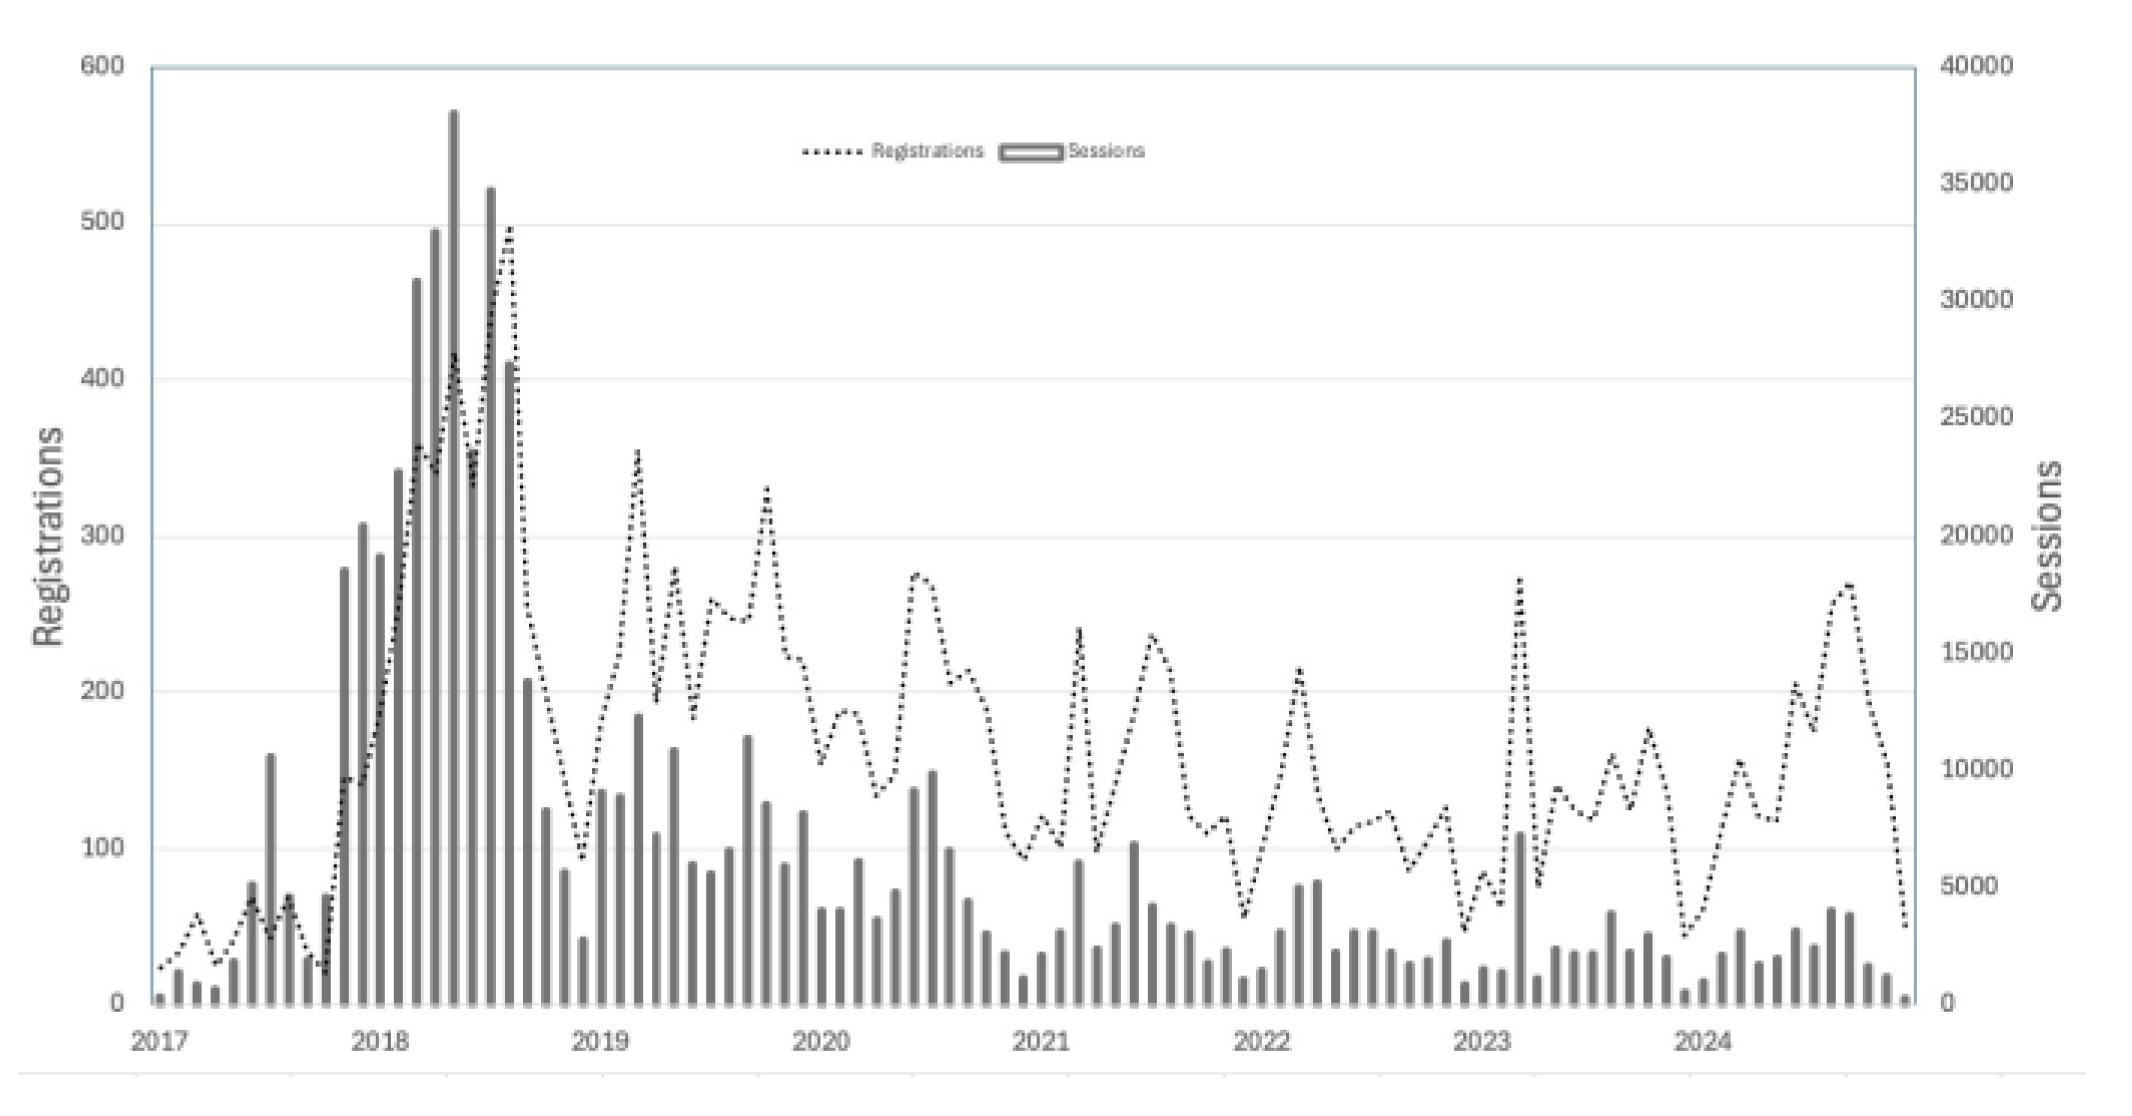
Figure 6.
CliMate user profiles based on profession (left) and rural industry (right) (2017-2025).

Figure 7.
Relative accesses of CliMate’s ten analyses (2013-2025, n=1,370,000).
5. Discussion
Ideally, any DST should be designed with a target audience in mind. CliMate’s development cycle was somewhat organic, with a mandate to update several previously valued climate analysis tools. Initial plans were to re-enact these analyses into a dedicated software package for desktop computers, but the age of mobile devices had arrived, thus the plan for an iOS app was born. Development of a www-based tool that could be used on the originally planned desktop followed as a contracted deliverable. This dual development had to fit within a budget and timeline as CliMate was built in a commercial consulting environment.
An initial challenge was to decide which analyses should be included as several of the target DST’s had multiple functions and complexities, and there were no evaluations of which analyses within existing products were most valued. The decision framework proposed in Figure 2, and a template similar to Figure 3 was adopted from a previous single application, Howoften? [26], which set the scene for inclusion of 7 analyses, later extended to the 10-analysis described here. How’s the past?, Drought? and What Trend? were added in version 2. It was arbitrarily judged that these 10 analyses were logistically manageable within the allocated budget and timeline and keep the interface manageable for users. When a working draft was available for distribution in March 2013, a soft launch using ~50 known contacts was used to gain feedback on functionality and usability. Approximately 45 iterations of the software occurred before release in 2014.
One observation in hindsight is that DST’s are becoming less expensive and faster to build. Technology development enables wider and cheaper access, but DST development remains a significant investment. For example, Rainman [4] with ~ 6000 units distributed over 10 years, had a real investment > AU$2.5 mill compared to CliMate’s 20,000 registered users on three platforms over 7 years costing AU$750,000 (2015 dollars). A common feature of all DSTs in Australia to date is the paucity of evaluation of use and impacts.
Despite CliMate’s popularity, funding for upgrades and maintenance remained challenging. CliMate has been operating reliably since 2014, but several technical issues have led to loss of functionality and availability. These include removal of the Android app as it was difficult to adequately accommodate operating system changes without significant additional support, and third-party data access issues leading to periods of unreliable access to climate data and indices. These issues were impossible to anticipate but seem inevitable in DST development.
5.1. Lessons Learnt
The following points are offered to other developers based on our experience:
- DST development requires a partnership between the intended audience, a program manager, a software engineer and connection to people with empathy and knowledge of the audience and technical issues.
- If software development were to be contracted, specification would need to be very tight. In this case, an organic development cycle allowed for synergy between software design, interface design and user feedback. CliMate’s specification at project initiation would have been difficult as the development team did not understand user preferences without a prototype, and the designers did not fully understand software and technology capabilities and limitations.
- There is a strong tendency for a DST to be comprehensive yet flexible -potentially leading to added complexity and reduced useability [16]. “Keep it simple stupid” (KISS) is a hard but essential lesson in building a useful DST.
- Multiple platforms (iOS, Android and www) increased costs and time to develop. An option might be to develop a rapid www based prototype, interact with a sample of prospective users and carry out an initial evaluation.
- DSTs may have simple interfaces, but technology requires maintenance and on-going support (servers etc.) which needs to be budgeted for the expected life of a DST.
- Technical problems in software development are inevitable as technologies and third-party data-sources evolve, requiring continual support for the expected life of each DST. It seems that 10 years is an over-optimistic life expectancy for a DST.
- DSTs require promotion, evaluation and maintenance after release. Investors under appreciate the importance of building on an initial investment, especially if early indications of acceptance and use are available.
- Evaluation is essential to justify an initial investment and guide future development. CliMate was independently evaluated in 2018 [33] but there was no scope to act on findings.
6. Conclusions
Australian CliMate Version I was released in 2013 as an iOS application. A www app and version 2 for iOS and Android were released between June 2017 and February 2018. CliMate has provided primary producers and their advisers with ready access to long-term and near real-time weather data and analyses which are accessible and easy to interpret [33]. CliMate provides a common format for 8 analyses, accessing near real time weather data which is readily accessible to decision-makers in the field where many discussions and decisions occur, while a flexible and open question focus facilitates user incorporation of local rules of thumb and models.
User statistics indicate that CliMate has facilitated exploration of long-term weather data over a 12-year period, providing objective assessments of current conditions and probabilistic estimates of future weather events based on past climatology. Each analysis is caste as a question for a selected variable (temperature, rainfall, radiation) and period of interest, encouraging users to frame their query using their own models of risk.
CliMate’s use appears reasonably stable with 500-1000 sessions and 50 new users each month after 12 years. Images of CliMate screens appear regularly in farmer discussion groups as it is accepted as a simple tool for many weather-related decisions in Australian agriculture [33].
Acknowledgments
Mr. Colin Creighton AM (deceased) was instrumental in Australian CliMate becoming a reality after a review in 2009 of existing climate focused decision support tools and information needs. CliMate was developed by the Managing Climate Variability Program and funded by a consortium of rural research and development corporations including: the Australian Government’s Department of Agriculture; Grains Research & Development Corporation; Meat and Livestock Australia; Cotton Research and Development Corporation, AgriFutures Australia and Sugar Research Australia. The developers acknowledge input from the many farmers and consultants who offered valuable suggestions to CliMate’s look and feel during development. Access to reliable long term daily climate data from Silo [24] (https://legacy.longpaddock.qld.gov.au/silo/) maintained by the Queensland Governments Department of Environment and Science is critical to Australian CliMate’s function.
References
- Nicholls, N., Drosdowsky, W., Lavery, B. (1996). Australian rainfall variability and change. Weather, 52, 66–72. [CrossRef]
- Felton, W.L., Freebairn, D.M., Fettell, N.A., Thomas, J.B. (1987). Crop residue management. In Cornish, P.S. Pratley, J.E. (Eds.), Tillage: New Directions in Australian Agriculture (Chapter 7, pp. 171–193). Aust. Soc. .Agronomy, Inkata Press. (https://www.agronomyaustraliaproceedings.org/images/sampledata/Tillage/7.%20Chapter%207.pdf) (accessed 25/6/2025).
- Clewett, J.F., Owens, D.T., Clarkson, N.M., Partridge, I.J. (1992). Rainman: Using El Niño and Australia’s rainfall history for better management today. In Harnessing Information for a Smarter Agriculture. Proc. Aust. Inst. of Agric. Science, National Conference, Launceston.
- Clewett, J.F. (2005). Australian RAINMAN: Further development and application to improve management of climate variability. Rural Industries Research and Development Corporation Publication No. 04/181. ISBN 1 74151 090 2.
- Freebairn, D.M., Hamilton, A.H., Cox, P.G., Holzworth, D. (1994). HOW WET? Estimating the storage of water in your soil using rainfall records. Agricultural Production Systems Research Unit, Toowoomba, Queensland.
- Grains Research and Development Corporation. (2015). DAN00102 - CropMate - climate information for crop production. (https://grdc.com.au/research/projects/project?id=468) (accessed 12 June 2025).
- Aker, J.C., Ksoll, C. (2016). Can mobile phones improve agricultural outcomes? Evidence from a randomized experiment in Niger. Food Policy, 60, 44–51. [CrossRef]
- Hamilton, W.D., Woodruff, D.R., Jamieson, A.M. (1991). Role of computer-based decision aids in farm decision making and in agricultural extension. In Muchow, R.C., Bellamy, J.A. (Eds.), Climatic Risk in Crop Production: Models and Management for the Semiarid Tropics and Subtropics. Wallingford, UK: CAB International.
- Woodruff, D.R. (1992). ‘WHEATMAN’: A decision support system for wheat management in sub-tropical Australia. Australian Journal of Agricultural Research, 43, 1483–1499. [CrossRef]
- Australian Government, Bureau of Meteorology. Climate driver update. http://www.bom.gov.au/climate/enso/ (accessed 11 June 2025).
- Parton, K.A., Crean, J., Hayman, P. (2019). The value of seasonal climate forecasts for Australian agriculture. Agricultural Systems, 174, 1–10. (accessed 12 June 2025). [CrossRef]
- Anderson, J.R., Dillon, L., Hardaker, J.B. (1977). Agricultural Decision Analysis. Iowa State University Press.
- Freebairn, D.M., McClymont, D. Australian CliMate app. https://climateapp.net.au/ (accessed 12 June 2025).
- Ward, D. (2015). The Simplicity Cycle: A Field Guide to Making Things Better Without Making Them Worse. Harper Business.
- Lynch, T., Gregor, S. (2004). User participation in decision support systems development: Influencing system outcomes. European Journal of Information Systems, 13(4), 286–291. [CrossRef]
- McCown, R.L. (2002). Locating agricultural decision support systems in the troubled past and socio-technical complexity of ‘models for management’. Agricultural Systems, 74, 11–26. [CrossRef]
- Hayman, P. (2004). Decision support systems in Australian dryland farming: A promising past, a disappointing present and uncertain future. In New Directions for a Diverse Planet, 4th International Crop Science Congress. https://www.agronomyaustraliaproceedings.org/images/sampledata/2004/symposia/4/1/1778_haymanp.pdf (accessed 12 June 2025).
- Kuehne, G., Llewellyn, R., Pannell, D.J., Wilkinson, R., Dolling, P., Ouzman, J., Ewing, M. (2017). Predicting farmer uptake of new agricultural practices: A tool for research, extension and policy. Agricultural Systems, 156, 115–125. (accessed 12 June 2025). [CrossRef]
- Australian Government - Bureau of Meteorology. The Predictive Ocean Atmosphere Model for Australia (POAMA) http://www.bom.gov.au/oceanography/oceantemp/GBR_POAMA.shtml . (accessed 25 June 2025).
- Thomas, G.A., Titmarsh, G.W., Freebairn, D.M., Radford, B.J. (2007). No-tillage and conservation farming practices in grain growing areas of Queensland: A review of 40 years of development. Australian Journal of Experimental Agriculture, 47(8), 887–898. [CrossRef]
- Australian Government - Bureau of Meteorology. Australian Community Climate Earth-System Simulator – Seasonal (ACCESS–S). http://www.bom.gov.au/climate/ahead/about/model/access.shtml (accessed 14 June 2025).
- Australian Government - Bureau of Meteorology. MetEye -your eye on the environment. http://www.bom.gov.au/australia/meteye/ (accessed 25th June 2025).
- Weatherzone. Australian Weather. https://www.weatherzone.com.au/ (accessed 25 June 2025).
- Queensland Government. SILO (Scientific Information for Land Owners). https://www.longpaddock.qld.gov.au/silo/about/ (accessed 12 June 2025).
- Jeffrey, S.J., Carter, J.O., Moodie, K.B., Beswick, A.R. (2001). Using spatial interpolation to construct a comprehensive archive of Australian climate data. Environmental Modelling and Software, 16(4), 309–330. (https://www.longpaddock.qld.gov.au/silo/ accessed 12 June 2025). [CrossRef]
- Glanville , S.F., Freebairn, D.M., (1997) Howoften? A software tool to examine the probabilities of rainfall events. A computer program-©. Agricultural Production Systems Research Unit, QDPI-CSIRO, Toowoomba, Queensland.
- French, R.J., Schultz, J.E. (1984). Water use efficiency of wheat in a Mediterranean-type environment. I. The relation between yield, water use and climate. Australian Journal of Agricultural Research, 35, 743–764. [CrossRef]
- Tennant, D., Tennant, S. (2013). PYCalc – a potential yield calculator [Software]. Department of Agriculture, Western Australia.
- Pacific Meteorological Desk Partnership. (2025). Seasonal Climate Outlooks in Pacific Island Countries (SCOPIC). https://www.pacificmet.net/products-and-services/seasonal-climate-outlooks-pacific-island-countries-scopic (accessed 14 June 2025).
- Wilks, D.S. (1995). Statistical Methods in the Atmospheric Sciences. Academic Press.
- National Farmers Federation. https://nff.org.au/ (accessed 10 June 2025).
- Australian Government, Australian Bureau of Statistics. https://www.abs.gov.au/ (accessed 11 June 2025).
- Starasts, A. (2018). Australian CliMate app: An evaluation for the Managing Climate Variability Program. University of Southern Queensland. (https://research.usq.edu.au/download/f1ee2c47ccdd7d45e243ef0bafdb3153de6a0bd51ba7a75b2bc1a2b91de37517/4067978/Evaluation%20Australian%20Climate%20app%202018.pdf) (accessed 12 June 2025).
Figure 1.
“The simplicity cycle” proposed by Ward [14].
Figure 1.
“The simplicity cycle” proposed by Ward [14].
Disclaimer/Publisher’s Note: The statements, opinions and data contained in all publications are solely those of the individual author(s) and contributor(s) and not of MDPI and/or the editor(s). MDPI and/or the editor(s) disclaim responsibility for any injury to people or property resulting from any ideas, methods, instructions or products referred to in the content. |
© 2025 by the authors. Licensee MDPI, Basel, Switzerland. This article is an open access article distributed under the terms and conditions of the Creative Commons Attribution (CC BY) license (http://creativecommons.org/licenses/by/4.0/).
Copyright: This open access article is published under a Creative Commons CC BY 4.0 license, which permit the free download, distribution, and reuse, provided that the author and preprint are cited in any reuse.


