Submitted:
11 July 2025
Posted:
14 July 2025
You are already at the latest version
Abstract
Autonomous Underwater Vehicles (AUVs) offer the potential for in-situ microplastic (MP) detection at constant, pre-set depths in marine environments. By carrying onboard MP detectors, AUVs can serve as alternatives to traditional methods of sample collection, processing, and analysis, while also addressing inefficiencies and complexities associated with conventional detection procedures. This study conducts a comprehensive review of existing and potential MP detection methods that can be integrated with AUVs for in-situ detection. In particular, guided by the Preferred Reporting Items for Systematic Reviews and Meta-Analyses (PRISMA) framework, this review analyzes selected studies on MP detection using AUVs. It finds that real-time, in-situ MP detection via AUVs or multi-AUV systems remains underdeveloped. Key challenges include deep-sea communication, sensor integration, and underwater durability. The review highlights current advances, research gaps, and future directions for AUV-based MP detection technologies.
Keywords:
autonomous underwater vehicle (AUV)
; drone
; microplastic (MP) detection methods
; marine environment
1. Introduction
Vast quantities of plastic waste enter the ocean each year, gradually degrading into MP particles, many of which are too small to be easily detected by the naked eye. The particles with a diameter of less than 5mm are called microplastics (MPs). MPs are present in human daily life, for instance, in salt, water, and even the air, and among these routes, inhalation of airborne MPs, especially indoors, contributes the most to human intake[1]. Most MPs in wastewater result from day-to-day human activities[2]. Additionally, MP pollution has become a particularly significant threat to marine life and ecosystems due to resistance to natural degradation processes. It contains toxic chemicals, including phthalates and bisphenol A[3]. The diminutive size allows them to enter the bodies of ocean life, potentially wreaking havoc on the delicate balance of marine ecosystems. Researchers found that 0.2 µm PS fluorescent microbeads can enter plant cells and hinder plant growth[4]. In marine environments, various sources, including tiny plastic beads (less than one millimetre-sized particles found in makeup and cleaning products) and degraded plastic debris, are major MP contaminants[5]. Identifying and quantifying the different MPs for protection of the ocean environment is imperative.
There are currently many methods for detecting MPs. Manual visual inspection of MPs is time-consuming, labour-intensive, and unsuitable for large-scale use. The Fourier Transform Infrared (FTIR) detection method is fast[6], non-destructive and needs simple sample preparation[7]. The Raman spectroscopy detection method requires time-consuming sample preparation[8]. Near-infrared spectroscopy is more reliable for estimating the number of MPs than for detecting their polymer types[9]. Laser Direct Infrared Spectroscopy (LDIR) is a fast, non-destructive, and highly automated technique that enables comprehensive analysis of microplastic number, size, shape, and polymer type over large areas without the need for liquid nitrogen, but it is relatively expensive despite being highly efficient for large-scale environmental monitoring[10]. Machine learning algorithms, particularly neural networks, as a powerful auxiliary tool, have shown promise for detecting MPs combined with polarization cameras, yielding real-time high accuracy results if the setup is proper[11,12].
AUVs show strong potential as effective tools for underwater MP detection if the setup is correctly done. In the late 1950s, the Applied Physics Laboratory of the University of Washington built the first AUV, named the Special Purpose Underwater Research Vehicle (SPURV), to perform scientific research in the undersea environment[13]. SPURV, with a 3.1 m overall length and 0.508 m diameter, was a pre-programmed AUV to perform specific research tasks, and its maximum dive depth was 3600 m. SPURV had a torpedo shape and could last 5.5 hours in the undersea environment. It had a 2 - 2.5 m/sec horizontal travel speed, 1.3 m/sec dive rate and 2.3 m/sec climb rate. An acoustic tracking system was employed to monitor SPURV’s underwater activity. The mother ship could send acoustic commands to SPURV, and the tracking range of the acoustics was 2000 m. This early AUV was unsophisticated but serviceable.
In the late 20th century, AUVs were mainly used in military areas, such as territory protection. AUVs have evolved to meet the diverse demands of underwater environments and tasks. These include biomimetic AUVs, screw-driven AUVs, tethered AUVs and underwater gliders. Biomimetic AUVs are designed to mimic marine life to improve their performance in underwater environments[14]. Screw-driven AUVs use a propeller for propulsion to increase speed and hence resilience in ocean currents. A tethered Remotely Operated Vehicle (ROV) connects to the mother ship via tether or cable, allowing those on the vessel to control the ROV in real-time. However, there can be hybrids between an AUV and an ROV.
In the early 21st century, the use of AUVs became more widespread. Due to the reduction in AUV production costs, they have become excellent tools for scientific research, such as marine environmental and biological monitoring. Scientists can complete challenging scientific research due to the combination of AUV and sensors, such as sonar imaging sensors[15]. Figure 1 diagrammatically shows various features of ocean topography. The deepest known ocean trench is 10,972.8 m, and the ocean’s average depth is about 3,600 m. Some AUV dive depths can be in excess of 6,000 m[17]. The Sentry AUVs from Woods Hole Oceanographic Institution (WHOI) can explore the sea down to 6,000 meters (19,685 feet)[18]. The Orpheus AUVs from WHOI can dive to 11,000 meters (36,000 feet)[19]. Deep-sea detection capabilities are critical for examining MPs since particles may be present in all ocean areas, including the deep ocean. AUVs that operate in extremely deep marine environments can expand the scope of deep-sea sampling and in-situ detection in previously inaccessible marine environments.
The main aims of the study were to evaluate the capabilities of AUVs to detect MP particles in the ocean, to examine existing methods of detecting MPs, to recommend practical detection methods that could eventually be extended to AUVs as real-time in-situ sensors, and to offer some insights for future work.
Several specific objectives support this overarching goal:
- For a clear, structured, and methodologically rigorous review process, this study employs Semantic Scholar AI and adheres to the Systematic Literature Review method, supported by semi-automated tools referenced in the Data Availability Statement to complete this review.
- Review existing MP detection methods, AUV-based approaches for MP detection, and AUV-based techniques for plastic debris detection.
- Analyze reviewed MP detection methods to find out which show promise for integration and operation aboard AUVs
- Provide informed guidance for future research, identifying current challenges, technical limitations, and knowledge gaps that require further investigation to advance AUV-based MP detection.
This paper reviews the state-of-the-art MP detection methods that have been used in the last few years. The objective of the review is to put into context the various detection methods that have been proposed. The details of MP are presented. Previous methods of detection are described. Conclusions as to the effectiveness of those methods of MP monitoring are presented.
Below is the structure of the paper: Section 1 introduces the background and objectives. Section 2 describes the Explorer AUV, including its potential for detecting MPs. The next section shows the research methodology. Section 4 presents the results and discussion. The detailed discussion and discoveries follow in the next section. Section 6 provides conclusions and suggestions for future research.
2. MPs and Explorer AUV
2.1. MP
MPs are tiny plastic particles with a diameter of less than 5 mm. MP is mainly made up of polymers, including Polyethylene, Polyethylene Terephthalate, Polypropylene, Polyvinyl Chloride, Polystyrene and Nylon, and metals like iron and aluminum, which are harmful to the environment[20]. Polymers are giant molecules composed of repeating chemical units and are primarily made up of carbon and hydrogen. There are two main types of polymers: homopolymers and copolymers, and MPs can be any polymer. Homopolymers consist of identical monomer units, such as Polyethylene. On the other hand, copolymers are made up of multiple monomer units. An example is Styrene-Acrylonitrile Copolymer (SAN), which includes two different monomers, Styrene and Acrylonitrile.
There are two main kinds of MPs: primary MPs, such as Microbeads, Nurdles, and Microfibers, and secondary MPs, which are tiny particles resulting from the degradation of larger plastic items[21]. Microbeads are tiny plastic particles with less than 1 mm diameter intentionally produced in cosmetic products, such as toothpaste, lipstick, eyeliner, body washes, sunscreen, face scrubs and other personal care products. In order to reduce their environmental impact, numerous countries and regions, including Canada and Taiwan, have banned or restricted these personal-care products. A nurdle, also called a bead, is a small plastic pellet smaller than 5mm used as a raw material in manufacturing plastic products, which can be released into the environment through accidental spills during transport or manufacturing processes. Beads are used for producing items, including bags and plastic containers. A microfibre is a synthetic fibre with less than 10 micrometres diameter released when washing clothing made from polyester or nylon. It can enter aquatic systems and pose a risk to aquatic life.
The journey of MPs coming into public awareness has been a lengthy one. In the 1970s and 1980s, studies mainly focused on the harmful effects of large amounts of plastic waste in the oceans. By the 2000s, scientists started paying more attention to MPs, and this term began appearing more frequently in public articles. MP research significantly increased after 2010 in ocean environments and other areas like freshwater rivers, terrestrial soil, and the air. MPs have recently become a popular research focus due to their negative impact on ecosystems and the human body. As a result of their small size, people can breathe in MPs through the air[22]. MPs are ubiquitous in the human diet and atmosphere, and they cannot be avoided during inhaling and digesting[23]. Although the entry of MPs into the human body might trigger immune responses, scientists have not yet found clear evidence proving that MPs can directly harm the human body[23]. Nevertheless, MP is still a concern in various environments, including seawater, freshwater, soil and atmosphere. They are universal, with widespread implications for ecosystems and creatures on earth.
2.2. Explorer AUV
MPs in marine settings are vexing to detect because they are small, can move around in the water column, and can cover large ocean areas. These challenges reveal that stationary sampling schemes are insufficient to quantify oceanic MP distribution. As such, AUVs are an attractive option for conducting in-situ monitoring and mapping applications of MPs. AUVs allow mobility, programmed travel to deep water, and work as a platform for investigating microplastics in marine habitats.
Figure 2 shows the Explorer AUV of Memorial University of Newfoundland, an underwater robot capable of diving to depths of 3000 meters[25]. It is a potentially useful vehicle for investigations of deep-sea environments due to increasing levels of MP pollution. The Explorer AUV’s speed range (0.5–2.5 m/s) allows for flexible maneuvers for broad surveys and targeted detection. The depth measurements (Valeport MiniSVS) and 300 kHz Doppler Velocity Log (DVL) together with other onboard equipment[26] of the AUV keep it on a stable movement path. The aforementioned functions aid in MP detection work, especially when it requires a specific speed and orientation to obtain trustworthy study results.
Figure 3 shows the internal control architecture of the AUV, showing how input from sensors can help make decisions in real time. The high-level control system transmits real-time signals and controls the navigation direction of the AUV. The Payload Computer (Backseat Driver) continually processes input from the sensors (for example, depth sensor and pressure sensor) to determine environmental features and then modifies predefined mission variables, including speed or heading, via the Vehicle Control Computer (Front-seat Driver). This closed-loop communication will allow the AUV to adapt based on environmental cues. Perhaps most importantly for MP detection, the architecture allowed for sensors to trigger the action of detection (i.e., turning on the MP detection device) exactly when the AUV reaches a desired target zone. An AUV’s control-responsive and sensor-triggered system is a key feature for real-time detection of MPs in the ocean and environmental monitoring of complex and dynamic underwater environments. The ability of AUVs to autonomously take measurements in uncertain marine environments is critical for detecting and mapping MPs, given that human intervention is not feasible.
The Explorer AUV has a hollow cylindrical internal volume inside its wet section, offering at least 0.69 m in length and 0.69 m in diameter. The wet section has room for a water sampler, an MP detector, or other research devices. The MP detector needs to be small enough to fit in the available space, or an MP detector with a suitable size needs to be developed and adapted to be capable of integration into the Explorer AUV’s system. In this situation, the Explorer AUV is programmed to dive to a specific depth of interest. When the depth sensor indicates that the required depth has been achieved, the Explorer AUV goes into a cruise or search mode to detect MPs at that depth. When the Explorer AUV completes its pre-planned path, it will return to the surface along with the collected data. This method is ideal for detecting and mapping MPs in open ocean environments at specific depths. The above process is consistent with the dual driver system[28–30]. More details about the Explorer AUV can be found in a number of published studies[31–37]. However, as of today, very few commercially in-situ MP detectors are available that are mature, stable, and accurate enough to be deployed on an AUV. Therefore, it is imperative to review the existing MP detection technologies and explore the possibility of using an AUV as a platform for MP monitoring.
3. Research Methodology
This paper uses PRISMA guidelines to review MP detection, AUV-based MP, and AUV-based plastic detection methods. The PRISMA statement is a set of evidence-based guidelines designed to help authors transparently report systematic reviews and meta-analyses[38–47]. As shown in Figure 4, the PRISMA flow diagram illustrates the screening process.
3.1. Identification
The preliminary phase of this research included a thorough search for pertinent literature. This study used the Semantic Scholar platform for literature query, which is a free artificial intelligence research tool for collecting scientific papers. Semantic Scholar provides open API access and a wide range of disciplines, including computer science (e.g., robotics, AI) and environmental sciences, making it a useful tool for interdisciplinary literature searches. A Python program was developed using the Semantic Scholar API to automatically search related papers systematically. Three groups of keywords were used: [“AUV,” “Microplastic”], [“AUV,” “Plastic”] and [“Microplastic,” “Detection,” “Method”]. Keywords were needed to be included in the title and abstract of the paper. In addition to the automated results (568 records), other related papers were added manually as a complement (13 records).
As a result of the various stages of routine search, a total of 581 document records were produced. After removing three duplicates, 578 papers remained for further analysis. This search strategy was delivered to encompass literature from an AUV perspective on the detection of MPs, reviewing the literature with MP detection methods and the literature on detecting plastic from an AUV, which may be extended for MP monitoring and detection.
3.2. Screening
A filtering process was applied to narrow the pool of 578 documents. The first filter was the publication venue (i.e., source title, including journals and conference). Any documents with venues matching the list of reputable publications, illustrated in Table 1, were kept. This step helped ensure the quality of selected literature, and the corpus was reduced to 151 documents. Next, due to the large number of papers after the automatic search, all papers with fewer than six citations were filtered out, and the data set was further reduced to 90 documents.
3.3. Eligibility
The analysis focused on the 90 papers identified through the review. However, 16 were excluded in the eligibility review stage. Of these 16 exclusions, one was not accessible; one was not in English, and 14 were excluded, as they were not related to the research topic. After these exclusions, 74 papers remained, comprising the primary dataset for the subsequent analyses. Table 2, Table 3 and Table 4 revealed that a total of 74 papers were published from 2015 to 2025. The topics of MP detection based on AUVs, plastic detection via AUVs, and MP detection methods were included in the review.
4. Results Overview
4.1. Bibliometric Analysis
4.1.1. Trends in Scientific Production
The annual and cumulative number of publications from 2015 to 2025 are shown in Figure 5. The yearly and cumulative publication numbers are shown above the bar graph (green) and below the line graph (red). The total number of publications in 2025 is lower than in most previous years, indicating that the growth rate is decreasing. Overall, it appears high-quality research activity with this focus has passed its peak and is currently declining.
4.1.2. Analysis of Publication Sources
The total number of publications grouped by journal is shown in Figure 6. If at least three papers are published in a given journal, the journal is identified here. Otherwise, the journal is classified as "Other." More than half of the papers belong to the "Other" classification, which contains 42 articles. The second largest category is "Environmental Science and Technology," with 15 publications. "Science of the Total Environment" contains eight articles. "Marine Pollution Bulletin", "Environmental Science: Processes & Impacts" and "Frontiers in Marine Science" have three papers each.
4.1.3. Top Cited Publication Sources
The top 10 most heavily cited journals are shown in Table 5. "Environmental Science and Technology" is markedly the most cited at 1,563 citations, proving the journal’s authority in this field. Following are the "Marine Pollution Bulletin" with 809 citations, "Environmental Chemistry" with 528 citations, "Scientific Reports" with 312 citations, and "Science of the Total Environment" with 242 citations. The reviewed documents come from various sources, not concentrated in a single journal. Overall, the quality of the materials reviewed is relatively high. In terms of time frame, the literature was published within 10 years, which means that the research in this technical field is highly timely and cutting-edge.
4.2. Emerging Advances in Detection Techniques
4.2.1. AUV-Based Detection of Plastics and MPs
Thevar et al. (2023)[48] developed a lightweight system called weeHoloCam, which is compatible with AUV platforms and employs a holographic imaging technique to detect fine particles in marine environments. Target identification is vital for recognition of plastic debris and to improve their detection in marine environments using AUVs. For example, Corrigan et al. (2023) and Zocco et al. (2022) applied neural network models in combination with standard cameras to automate the detection of underwater plastic litter[50,53]. However, extending these approaches to MP (MP) detection is unsuitable because MPs are extremely small. Rahmati and Pompili (2019) [49] developed an efficient method for video data sharing among underwater autonomous vehicles enabling the collaborative reconstruction of marine litter maps jointly. Wang et al. (2022) [51] applied neural network algorithms (YOLOv5-series ) for detecting plastic debris and fishing nets by training on underwater sonar imagery. Hong et al. (2021)[52] proposed a workload distribution architecture allowing multiple AUVs to cooperatively perform marine plastic cleanup, providing robust and adaptive task allocation under persistent difficult communication environments. Tata et al. [118] developed an effective method for ocean plastic detection through NN, yielding commendable real-time accuracy. However, it did not cover how to detect MPs.
4.2.2. Approaches of MP Detection
There are many methods for detection of MPs. Early methods mainly relied on the naked eye and microscopes to observe particles’ size, shape and colour. Fluorescence, spectral, thermal analysis, sensors, and in-situ detection methods are also used to detect MPs. Many scholars have reviewed MP detection technology[60,68,69,74,82,84,85,89,96,100,122] . For instance, Dey et al. (2021)[60] summarized the advantages and disadvantages of multiple MP detection methods, including using naked-eye inspection, stereomicroscopy or Scanning Electron Microscopy (SEM) on morphological identification, for example, size and colour; using Scanning Electron Microscopy-Energy Dispersive Spectroscopy (SEM-EDS)[62], Polarized Light Microscopy (PLM), FTIR, Focal Plane Array-Fourier Transform Infrared Spectroscopy (FPA-FTIR), Raman spectroscopy or thermoanalytical techniques (for instance, Differential Scanning Calorimetry (DSC), Pyro-GC-MS, Thermogravimetric Analysis-Fourier Transform Infrared Spectroscopy (TGA-FTIR) and Atomic Force Microscopy–Infrared Spectroscopy (AFM-IR)) as composition-based analytical techniques; and using remote sensing methods to find MPs by satellite data as described by Biermann et al.[111]. Ye et al. (2021)[68] summarized various primary and auxiliary analytical methods of MPs and future development prospects in the marine and soil environments of the above methods.
Morphological-based Analysis Methods
In the early days of MP research, there was no standard process to analyze such small particles. Manual detection of MPs is time-consuming and laborious. The methods of analyzing MPs include selective sampling, volume-reduced methods and taking samples from the water column[116]. The selective sampling method allows for the detection of MP particles from a beach’s surface with the naked eye. However, MP is often overlooked due to the small size of the plastic debris.
The four primary morphologically-based MP detection methods are shown in Table 6. Light microscopy/optical microscopy is commonly used to identify the size and shape of MPs, as described in other studies[60,68,74,76,86,123]. Stereomicroscopy[60,65,69,82,84,96,113] allows users to use surface-enhanced three-dimensional visualization to characterize MP morphology further.
Fluorescence microscopy[59,80,82,96] uses fluorescent dyes such as Nile red to enable the identification of MPs and distinguish them from organic materials. SEM[60,68,69,80,84,85,96,100,116] is able to provide high-resolution images and analyze surface textures at the micrometer or nanometer level. These techniques are commonly used in laboratory studies and provide morphological details that help characterize MPs in the environment.
Fluorescence-based Analysis Methods
Fluorescence detection protocols for MPs, including both traditional staining protocols and more advanced imaging methods, are presented in Table 7. Fluorescence staining has emerged as the most commonly used technique for detecting MPs due to both the strong affinity of Nile Red to the hydrophobic plastic surface and the amount of literature that supports its use[59,63,66,69,73,77–79,89,96]. Nile red staining effectively highlights MPs, distinguishing them from inorganic and some biological materials by binding to hydrophobic surfaces. However, it cannot reliably distinguish MPs from invertebrate debris[73]. Another detection method, Calcofluor White combined with Evans Blue and Nile Red, increases the detection sensitivity[73]. Fluorescence Lifetime Imaging Microscopy (FLIM)[77,93] generates contrast from the fluorescence decay time. Spectrally Resolved Confocal Fluorescence Microscopy (SR-CFM)[77] extracts spectral profiles from imagery to provide high-resolution information. Even more advanced methods, such as UV-induced fluorescence imaging with automated software analysis[78], allow for high-throughput MPs detection, with little manual labour.
Spectroscopic Component Analysis Methods
The various spectroscopic component analysis techniques that can be used for MP detection are shown in Table 8. FTIR mainly detects plastic particles with a particle size of more than 20 µm and is not good at detecting weathered MPs[85]. FTIR[54,60,68,69,76,82–85,89,92,96,100,112,113,116,117], with Micro-Fourier Transform Infrared Spectroscopy (µ-FTIR)[65,67,70,74,96,106], Attenuated Total Reflectance-Fourier Transform Infrared Spectroscopy (ATR-FTIR)[64,74,79,86,89,97,116], Reflectance-FTIR[105], and FPA-FTIR[60] are predominantly used for polymer identification, as they produce molecular fingerprints.
Raman spectroscopy is a non-destructive, non-contact analytical method that can characterize the polymer composition of samples. Raman spectroscopy[59–61,68,69,72,81,82,84,85,94,96,97,100,103,112,116] and Micro-Raman Spectroscopy (µ-Raman)[67,74,89,96,106,124] are also popular due to having excellent spatial resolution, thus being very useful in identifying tiny particles. Raman spectroscopy relies on inelastic photon scattering and can be used to analyze MPs smaller than 20 µm and bigger than 1 µm[85]. Raman spectroscopy may not be able to distinguish between MPs and microadditive particles effectively[81]. Additive particles can interfere with MP detection, and alcohol treatment can successfully remove interfering particles, allowing for improvements in MP detection accuracy[81]. Compared to FTIR spectroscopy, Raman is more affected by autofluorescence from soil organic matter but is not easily interfered with by organic substances, and the detection process time is relatively short[85].
Stimulated Raman Scattering Spectroscopy (SRS)[69] microscopy can speed up the detection of MPs, but the short focal depth may cause image distortion. Surface-Enhanced Raman Spectroscopy (SERS)[56,80,98,100] can potentially enhance the sensitivity for trace detection due to their ability to yield enhanced Raman signals. Other emerging techniques relevant to MPs are Terahertz Spectroscopy (THz)[68] and AFM-IR spectroscopy[60], the method of choice for structural analysis at multiple wavelengths and high-resolution imaging. Hyperspectral Imaging (HSI)[68,108,121] combines spatial information and spectral information to detect MPs efficiently, but it is relatively expensive to purchase this system. SEM-EDS[62,64,68,74,76,85] helps identify MPs’ shape and chemical elements, but it is time-consuming to analyze particles. LDIR[54,65] for automated screening with sample preparation required. PLM[60,109] cannot detect thick and opaque MPs. Kramers–Kronig[107] analysis allows for more advanced spectral analysis.
Löder et al. proposed a rapid and robust method for detecting enriched MP from environmental samples through Function Point Analysis, based on a Fourier-Transform infrared spectroscopy system for the first time[117]. This is exciting news, as it fills the gap in MP research and provides a faster method for monitoring MP based on its characteristics. However, it requires special devices and expertise, which drives up costs and makes it difficult to use on a large scale. FTIR system is the interferometer, an optical device crucial for transforming the time-domain signal into a frequency-domain spectrum. FTIR interacts with infrared radiation and molecular vibrations within an MP for detection purposes. Huang et al. (2022)[54] used FTIR and LDIR to analyze MPs and determine their size distribution in sputum samples. FTIR and Raman spectroscopy are the most common lab-based MP identification and quantification spectroscopic techniques. Conventional FTIR and Raman spectrometry involve several steps mentioned before. Raman Spectroscopy, compared to FTIR, performs better with non-polar polymers, small particles (<20 µm), MPs in aqueous samples, and higher spatial resolution. However, it involves greater time investment and human effort than FTIR for producing and interpreting data[112]. Some modern FTIR and Raman systems have built-in automated data analysis systems, saving sample analysis time. Xu et al. (2020)[56] operated SERS to detect individual micro and nanoplastics smaller than 1 m, with detection capabilities reaching down to 360 nm in size. Here are other similar MP detection studies using Raman spectroscopy[61]. Zhang et al. (2019)[108] used the HSI method combined with Support Vector Machine (SVM) classification to enable rapid, reagent-free identification of MPs (>0.2 mm) in fish intestinal content with high accuracy and efficiency. However, the HSI system is high-cost, and the data processing is complicated. Nihart et al. (2025)[64] validate MPs and nanoplastics in human brain tissue using multiple approaches (including Pyrolysis-Gas Chromatography-Mass Spectrometry (Py-GC-MS), ATR-FTIR and SEM-EDS). Witzig et al. (2020)[67] used µ-Raman, µ-FTIR and Py-GC-MS to analyze and find MPs from the percolate of disposable gloves.
Thermal-Based Composition Analysis Methods
Five thermal analysis methods for the composition of MPs are shown in Table 9. Py-GC-MS[58,60,64,65,67–69,74,82,84,85,87,89,101,102,116] is the most widely used thermal method due to its high sensitivity and ability to extract detailed polymer composition from complex matrices. Py-GC-MS has fewer restrictions on particle size, but the pretreatment is time-consuming[85]. Thermal Extraction Desorption-Gas Chromatography-Mass Spectrometry (TED-GC-MS)[57,68,75,84,85,89,100] allows the qualitative and quantitative identification of MPs with a short pretreatment time, and can be used to identify polyethylene, polypropylene and polystyrene in complex soil matrices, but currently only polyethylene can be quantitatively analyzed. Thermal Desorption-Proton Transfer Reaction-Mass Spectrometry (TD-PTR-MS)[55] allows for faster detection of MPs from environmental samples. TGA-FTIR[60,100] and DSC[60,68,74] are complementary methods that show thermal decomposition curves and transitions, allowing MPs to be identified. These techniques mainly use laboratory high-temperature instruments, suitable for analyzing micron-sized particles, and complex or mixed samples. Eisentraut et al. (2018)[57] used TED-GC-MS to identify and quantify MPs with rapid processing time, while eliminating the need for sample preparation. Ribeiro et al. (2020)[58] found MPs in commonly consumed fishery products, including crabs, shrimp and oysters, by the Py-GC-MS method. Materić et al. (2020) [55] adopted the TD-PTR-MS method for MP and nanoplastic detection, which offers high sensitivity and chemical fingerprinting capability for identifying and quantifying plastics in complex organic matrices at nanogram levels with complicated process.
Sensor-Based Analysis Methods
Various sensor-based approaches for MP detection are summarized in Table 10. Portable optical sensors combine handheld devices with CCD cameras to enable in-situ visualization for detecting translucent MPs in freshwater[115]. Spaceborne bistatic radar enables large-scale detection of surface roughness changes linked to surfactants that signal MPs[71]. Optical techniques such as plasmonic sensors (include High-Performance Plasmonic Sensors[125]) and fluorescent biosensors have high sensitivity in complex media[104]. Electrochemical sensors using graphene electrodes provide strong signal responses for MP detection[91,104]. Electrochemical sensors enable real-time, low-cost detection but are prone to fouling; Some plasmonic sensors can work in seawater directly; fluorescence biosensors have mainly been demonstrated in the lab but are adaptable for environmental monitoring[104]. Remote sensing methods also show potential for wide-area plastic identification based on spectral signatures [111].
Other Composition Analysis Methods
Other component analysis methods for MP analysis are shown in Table 11. Liquid chromatography with ultraviolet detection (LC-UV)[75] has been used to identify additives and degradation products of MPs. Liquid Chromatography-Tandem Mass Spectrometry (LC-MS/MS)[65,69] has been used for high-sensitivity chemical analysis of plastic-derived chemicals, but sample processing is complex, and instrumentation is costly. MP detection and analysis based on microfluidic[90,103] systems is fast and easy to integrate with other technologies. However, there are too many system instability factors, and strict control conditions are required. High-Performance Liquid Chromatography (HPLC)[68,84,101] mainly characterizes polymer degradation products and additives. Flow cytometry[66] can quickly screen many samples in a short time, with a high degree of automation, but requires a complex sample pretreatment process. Research based on machine learning, including ML-enhanced detection using webcams[110,119,120] and ML-based intelligent detection using polarization cameras[11,12], can provide methods for automatic real-time identification of MPs and reduce workload.
MP detection often uses a combination of multiple methods, and the results can be verified against each other. Erni-Cassola et al. (2017)[59] combined Nile red dye and green fluorescence microscopy to quantify MPs in the size range of 20 µm and 1 mm using Raman Spectroscopy to validate that all fluorescing particles were synthetic plastics. This highly sensitive method is low-cost to detect smaller, low-density MPs. Zhang et al. (2021)[65] used stereomicroscopy, LDIR, µ-FTIR, LC-MS/MS and GC-MS to recognize and analyze MPs in mineralized landfill waste. Analytical chemistry techniques for MP detection include TED-GC-MS, Py-GC-MS, TD-PTR-MS based on Fluorescence Staining (including Nile Red[63]). Kaile et al. (2020)[66] presented a method based on fluorescent dye combining flow cytometry (flow rate is 25 µL/min, and the minimum detection limit of MPs is 0.2 µm) for automated and scalable MP detection. While simplifying the workflow, the method still involved data preparation. Sarker et al. [119] have introduced a methodology for detecting MPs in freshwater environments through neural network techniques combined with standard webcams. Regrettably, their work did not address certain unique complexities (e.g., strong ocean currents, high pressure, low or lack of light conditions) associated with MP detection in oceanic settings. Javier et al. [120] conceived a system to calculate MPs in a controlled laboratory environment through computer vision techniques. Their approach predominantly relies on pre-cleaned MP samples and data acquired from outside of underwater settings. Based on the methods discussed above, it becomes evident that there is room for enhancing the accuracy of real-time MP detection in marine environments by optimizing neural network algorithms. Li et al. [11] developed a method using a polarization camera to intelligently detect MPs in flow rates ranging from 2 ml/min to 15 ml/min with good performance. However, the flow rate is too slow compared with the cruising speed of a free swimming AUV, which is often about 1.5 m/s ( 4,050 ml/min with an inside cross-section of 5mm x 9mm). The method would have to be used on a hovering capable AUV that periodically stops to take samples at discrete intervals.
In-Situ Analysis Methods
Recent in-situ detection methods for MPs are outlined in Table 12 and classified by type of analysis. Four methods of compositional in-situ analysis exist. Polarized light scattering, which enables non-contact, real-time MP detection in water, but accuracy can be affected by multiple factors[88]. Surface-functionalized THz microfluidic metamaterials plus in-situ THz (a rapid, real-time but volume limited high-fabrication sensing method)[95]. Surface nanodroplet microfluidic systems that allow Raman spectroscopy in single-particle in-situ detection (but under complex microfluidic design)[103]. Portable microfluidic triboelectric sensors allow a real-time but low-cost capacity to develop in-situ MP detection, but rely on the flow to be stable[114]. Morphological MP measurements are used in in-situ underwater imaging microscopy, which allows direct visualization within fresh waters[99]. These examples of advances in optical detection and data processing capability, combined with improvements in imaging and computational capacity, suggest that capabilities for field-deployable monitoring technologies for MPs are progressing.
4.3. Analysis of Keyword Clusters
In this research, VOSviewer (v1.6.20) full counts were used to evaluate the co-occurrence of keywords in 74 papers with a limit of 2 occurrences. It was possible to extract 218 keywords, 44 of which met the minimum threshold. The keywords with total link strength were investigated to identify core research topics. Here are more details about VOSviewer[126–131].
Table 13 illustrates nine thematic keyword clusters. These clusters were derived from a co-occurrence and total link strength analysis. The number of occurrences refers to the number of documents in which the keyword appears, and the total link strength measures the cumulative strength of the co-occurrence links a keyword shares with other keywords, indicating how closely they are thematically connected in the dataset. Cluster 1 (i.e. "wastewater" 4× 9) has a theme related to aquatic pollution; Cluster 2 (i.e. "debris" 6× 12) also relates to detection in marine environments; Cluster 3 (i.e. "pollution" 4× 12) focused on chemical analysis; Cluster 4 (i.e. "microscopy" 2× 7) relates to optical imaging; Cluster 5 (i.e. "microplastic" 26× 64) includes polymer characterization; Cluster 6 (i.e. "microplastics" 47× 95) relates to bio-interaction and Raman detection; Cluster 7 (i.e. "nanoplastics" 8× 21) refers to nano-scale polymers; Cluster 8 (i.e. "YOLOv5" 2× 5) used AI-based monitoring; Cluster 9 (i.e., "sensors" 2× 3) highlights sensor technology as a cross-cutting theme across detection methods.
4.4. Network Map
The following network visualization, generated by VOSviewer, is shown in Figure 7, which displays clusters of topics within MPs research. The network map was achieved by analyzing co-occurrences of keywords by maps, with size denoting frequency (weight), thickness showing the strength of co-occurrences, and colours representing different areas of research, for example, sources of pollution, types of polymer, detection methods and AI-based monitoring.
4.5. Overlay Map
The Figure 8 displays the thematic transformation of microplastic research from traditional analytical methods to emerging automated sensing technologies.
VOSviewer overlays visually display the co-occurrence of keywords in MP research, where node size indicates keyword frequency and link thickness indicates connection strength. The colour gradient from purple (2020) to yellow (2023) shows the average publication year, revealing temporal trends. Common central terms like "microplastic" and "microplastics" are situated together with related topics like "polyethylene", "pollution" and "spectroscopy". These grouped topics demonstrate the continued emphasis on material characterization and environmental pollution. The yellow-green nodes represent newer research focuses like "deep sorting", "YOLOv5", and "fluorescence", indicating an emerging emphasis on AI-based detection and novel optical methods.
4.6. Density Map
The density map in Figure 9 generated by VOSviewer visually displays the distribution and popularity of keywords within the MP research dataset, where each keyword is displayed as a dot. The colour intensity reflects the co-occurrence frequency and the strength of its connection with other keywords in the dataset. The darker blue areas (for example, some of the areas surrounding "microplastics", "plastics", and "polyethylene") illustrate areas of active research stemming from the groupings of topics. The lighter yellow-green areas (for example, some of the areas surrounding "deep sorting", "YOLOv5", "sensors", and "fluorescence") represent areas that are emerging or have not been mentioned as much. This diagram highlights both prominent topics in the genre versus outlier or emerging areas of the genre. By including disbursement of keyword density, insight can be gained into current and developing research directions within mainstream and developing areas.
5. Discussion
Most MP detection methods are laboratory-based, involving sample collection, sample pretreatment (for example, dilution), instrument-based measurement, or data analysis. Although these methods are valuable, they are also labour-intensive, take substantial time to analyze, and lack the automation to process information in real-time and on-site, which would limit their application on AUVs for the detection of MPs. There are various detection methods for plastic particles. We can choose the corresponding method according to the different detection objects, such as the ocean surface, the middle of the ocean, seabed sedimentation and beach sedimentation. An AUV is a suitable tool for exploring and studying MPs in the middle and bottom of the seawater column. According to the known information, a gap exists in the scientific research areas that can be filled by using AUVs for real-time intelligent ocean MP detection.
Some exciting MP detection technologies that may apply to AUVs are shown in Table 14. Those methods may be able to fill the gap mentioned above. As shown in the table, these promising technologies can be divided into three major categories: spectroscopy, sensors, other composition-based and in-situ techniques.
HSI technology can detect semi-transparent MP in water environments. However, it is expensive, and few researchers have tried integrating it into AUVs. Electrochemical sensors are portable, low-cost, and can be analyzed in-situ quickly, making them well-suited for miniaturization and integration with microfluidic systems to achieve real-time monitoring. However, matrix effects and surface fouling still affect them. Some plasmonic sensors with proper configuration have high sensitivity and can detect MPs in seawater without sample pretreatment. Although fluorescent biosensors are still in the laboratory stage, they are emerging and changing environmental monitoring.
Machine learning intelligence detection uses polarization cameras, which can detect MPs in real-time at low flow rates and performs well. However, it cannot currently be used at AUV cruising speeds. Polarized light scattering allows contactless detection of MPs in water, but with a long analysis time. Terahertz-based microfluidic metamaterial analysis offers rapid analysis speeds but is limited in sample volume due to equipment constraints. Surface nanodroplet microfluidics with integrated Raman spectroscopy can enable particle detection at the single-particle level but requires complex microfluidic devices. Triboelectric sensors also have the potential to be low-cost, versatile, and rapid for the detection of MPs of various sizes in real time, but the flow must be stable. Underwater microscopy allows for direct morphological observations, but not for component analysis.
6. Conclusions and Future Work
Based on the PRISMA method, this paper reports on a structured and systematic literature review of current MP detection methods. Semantic Scholar was used to retrieve information, and after deleting duplicates, screening and qualification assessment, 74 articles were finally obtained for analysis. Based on these articles, this study also conducted a bibliometric analysis of the number of papers, publication time, and the top 10 journals with the most citations in this field. Potential methods for detecting MPs that can be combined with an AUV for in-situ detection are discussed. Several potential detection methods that may be combined with an AUV are summarized. However, there are still challenges in achieving a mature and stable MP sensor, which can be mounted on an AUV and can be used for in-situ detection, including a few studies focusing on the design of in-situ AUV MP detectors, limited research literature, and existing detection technologies requiring continued advancement.
Future research should focus on transitioning laboratory methods to small autonomous systems that can be deployed on AUVs and improving existing in-situ MP detection methods. Some promising technologies, such as electrochemical and triboelectric sensors, can achieve real-time, low-cost monitoring, but issues like matrix effects exist. Plasmonic sensors are attractive due to their high sensitivity without pretreatment, but they need more field evaluation. Fluorescent biosensors show good promise for future environmental monitoring, but are still experimental. Current advanced spectroscopic techniques for MP detection (HSI and Raman microfluidics) have achieved exceptionally high accuracy, but need to be simplified and reduced in cost. Machine learning also shows good promise in MP monitoring using optical techniques (such as with polarization cameras); however, given AUVs’ operating speed and data processing capabilities, better use of machine learning and optimization algorithms is needed. More importantly, we can develop these technologies for in-situ MP detection in complex and changing marine environments. Future research should strive to develop and improve detection technologies, make detection results more robust, and design more miniaturized and oceanic systems to enable future field monitoring of MP.
Author Contributions
Q.Z. took the lead in the conceptualization, methodology, software, formal analysis, investigation, data curation, writing original draft preparation, visualization, project administration and prepared the first draft of the manuscript. Dr. N.B., as the corresponding author, was responsible for journal communication, supervision, validation, provided resources, funding acquisition, writing review and editing, and project administration. Dr. J.H and Dr. T.Z provided supervision, validation, resources, writing review and editing. All authors have read and agreed to the published version of the manuscript.
Funding
This work was funded by the Natural Sciences and Engineering Research Council (NSERC) Discovery Grant programme to the second author: RGPIN-2021-02506 Advancing Autonomous Underwater Vehicle Capability for Assessment of Marine Pollution. Further financial support came from the NSERC Alliance program: ALLRP 561516-20 Characterization and delineation of oil-in-water at the Scott Inlet seeps through robotic autonomous underwater vehicle technology and funding for Maritime Robotics research to the second author from Memorial University.
Institutional Review Board Statement
Not applicable
Data Availability Statement
The following code was developed for conducting the literature search in this research study:
Conflicts of Interest
The authors declare no conflicts of interest.
Abbreviations
The following abbreviations are used in this manuscript:
| MP | Microplastic |
| AUV | Autonomous Underwater Vehicle |
| PRISMA | the Preferred Reporting Items for Systematic Reviews and Meta-Analyses |
| SEM | Scanning Electron Microscopy |
| FLIM | Fluorescence Lifetime Imaging Microscopy |
| SR-CFM | Spectrally Resolved Confocal Fluorescence Microscopy |
| FTIR | Fourier Transform Infrared Spectroscopy |
| µ-FTIR | Micro-Fourier Transform Infrared Spectroscopy |
| ATR-FTIR | Attenuated Total Reflectance-Fourier Transform Infrared Spectroscopy |
| FPA-FTIR | Focal Plane Array-Fourier Transform Infrared Spectroscopy |
| µ-Raman | Micro-Raman Spectroscopy |
| SRS | Stimulated Raman Scattering Spectroscopy |
| SERS | Surface-Enhanced Raman Spectroscopy |
| THz | Terahertz Spectroscopy |
| AFM-IR | Atomic Force Microscopy–Infrared Spectroscopy |
| HSI | Syperspectral Imaging |
| SEM-EDS | Scanning electron microscopy-energy dispersive spectroscopy |
| LDIR | Laser Direct Infrared Spectroscopy |
| PLM | Polarized Light Microscopy |
| Py-GC-MS | Pyrolysis-Gas Chromatography-Mass Spectrometry |
| TED-GC-MS | Thermal Extraction Desorption-Gas Chromatography-Mass Spectrometry |
| TD-PTR-MS | Thermal Desorption-Proton Transfer Reaction-Mass Spectrometry |
| TGA-FTIR | Thermogravimetric Analysis-Fourier Transform Infrared Spectroscopy |
| DSC | Differential Scanning Calorimetry |
| LC-UV | Liquid Chromatography with Ultraviolet detection |
| LC-MS/MS | Liquid Chromatography-Tandem Mass Spectrometry |
| HPLC | High-Performance Liquid Chromatography |
| SVM | Support Vector Machine |
References
- Zhang, Q.; Xu, E. G.; Li, J.; Chen, Q.; Ma, L.; Zeng, E. Y.; Shi, H. A Review of Microplastics in Table Salt, Drinking Water, and Air: Direct Human Exposure. Environ. Sci. Technol. 2020, 54(7), 3740–3751. [Google Scholar] [CrossRef] [PubMed]
- Talukdar, A.; Kundu, P.; Bhattacharya, S.; Dutta, N. Microplastic Contamination in Wastewater: Sources, Distribution, Detection and Remediation through Physical and Chemical-Biological Methods. Sci. Total Environ. 2024, 916, 170254. [Google Scholar] [CrossRef] [PubMed]
- Rochman, C. M.; Hoh, E.; Hentschel, B. T.; Kaye, S. Long-Term Field Measurement of Sorption of Organic Contaminants to Five Types of Plastic Pellets: Implications for Plastic Marine Debris. Environ. Sci. Technol. 2013, 47(3), 1646–1654. [Google Scholar] [CrossRef] [PubMed]
- Li, L.; Zhou, Q.; Yin, N.; Tu, C.; Luo, Y. Uptake and Accumulation of Microplastics in an Edible Plant. Chin. Sci. Bull. 2019, 64, 928–934. [Google Scholar] [CrossRef]
- Wu, W.; Yang, J.; Criddle, C. Microplastics Pollution and Reduction Strategies. Front. Environ. Sci. Eng. 2017, 11(1), 1–4. [Google Scholar] [CrossRef]
- Sota-Uba, I.; Bamidele, M.; Moulton, J.; Booksh, K.; Lavine, B. K. Authentication of Edible Oils Using Fourier Transform Infrared Spectroscopy and Pattern Recognition Methods. Chemom. Intell. Lab. Syst. 2021, 210, 104251. [Google Scholar] [CrossRef]
- Tan, A.; Zhao, J.; Zhao, Y.; Li, X.; Su, H. Determination of Microplastics by FTIR Spectroscopy Based on Quaternion Parallel Feature Fusion and Support Vector Machine. Chemom. Intell. Lab. Syst. 2023, 243, 105018. [Google Scholar] [CrossRef]
- Liu, K.; Pang, X.; Chen, H.; Jiang, L. Visual Detection of Microplastics Using Raman Spectroscopic Imaging. Analyst 2023, 149(1), 161–168. [Google Scholar] [CrossRef] [PubMed]
- Masoero, G.; Barbera, S.; Kaihara, H.; Mabrouki, S.; Patrucco, S.; Abid, K.; Tassone, S. Rapid Detection of Microplastics in Feed Using Near-Infrared Spectroscopy. Acta IMEKO 2024, 13(2), 1–6. [Google Scholar] [CrossRef]
- Chandran, P. J. I.; Veerasingam, S. Laser Direct Infrared Spectroscopy: A Cutting-Edge Approach to Microplastic Detection in Environmental Samples. Talanta 2025, 284, 127284. [Google Scholar] [CrossRef] [PubMed]
- Li, Y.; Zhu, Y.; Huang, J.; et al. High-Throughput Microplastic Assessment Using Polarization Holographic Imaging. Sci. Rep. 2024, 14, 2355. [Google Scholar] [CrossRef] [PubMed]
- Zhu, Y.; Li, Y.; Huang, J.; et al. Smart Polarization and Spectroscopic Holography for Real-Time Microplastics Identification. Commun. Eng. 2024, 3, 32. [Google Scholar] [CrossRef]
- Widditsch, H. R. SPURV—The First Decade; APL-UW 7215; University of Washington: Seattle, WA, 1973. [Google Scholar]
- Fish, F. Advantages of Aquatic Animals as Models for Bio-Inspired Drones over Present AUV Technology. Bioinspir. Biomim. 2019, 15, 016001. [Google Scholar] [CrossRef] [PubMed]
- Hwang, J.; Bose, N.; Nguyen, H. D.; Williams, G. Acoustic Search and Detection of Oil Plumes Using an Autonomous Underwater Vehicle. J. Mar. Sci. Eng. 2020, 8(8), 618. [Google Scholar] [CrossRef]
- National Oceanic and Atmospheric Administration. Ocean Floor Features. https://www.noaa.gov/education/resource-collections/ocean-coasts/ocean-floor-features (accessed , 2025). 30 June.
- McPhail, S. Autosub6000: A Deep Diving Long Range AUV. J. Bionic Eng. 2009, 6, 55–62. [Google Scholar] [CrossRef]
- Woods Hole Oceanographic Institution. Sentry: Autonomous Underwater Vehicle. https://www.whoi.edu/what-we-do/explore/underwater-vehicles/auvs/sentry/ (accessed , 2025). 30 June.
- Woods Hole Oceanographic Institution. Orpheus: Autonomous Underwater Vehicle. https://www.whoi.edu/what-we-do/explore/underwater-vehicles/auvs/orpheus/ (accessed , 2025). 30 June.
- Malki, J.; Hussien, N.; Tantawy, E.; Khattab, Y.; Mohammadein, A. Terrestrial Biota as Bioindicators for Microplastics and Potentially Toxic Elements. Coatings 2021, 11(10), 1152. [Google Scholar] [CrossRef]
- Waldman, W.; Rillig, M. Microplastic Research Should Embrace the Complexity of Secondary Particles. Environ. Sci. Technol. 2020, 54(13), 7751–7753. [Google Scholar] [CrossRef] [PubMed]
- Huang, S.; Huang, X.; Bi, R.; Guo, Q.; Yu, X.; Zeng, Q.; Huang, Z.; Liu, T.; Wu, H.; Chen, Y.; Xu, J.; Wu, Y.; Guo, P. Detection and Analysis of Microplastics in Human Sputum. Environ. Sci. Technol. 2022, 56(3), 1920–1926. [Google Scholar] [CrossRef] [PubMed]
- Blackburn, K.; Green, D. The Potential Effects of Microplastics on Human Health: What Is Known and What Is Unknown. Ambio 2022, 51(3), 518–530. [Google Scholar] [CrossRef] [PubMed]
- Memorial University of Newfoundland. Large AUV Explorer. https://www.mun.ca/creait/autonomous-ocean-systems-centre/large-auv-explorer/ (accessed Oct 11, 2024).
- Hwang, J.; Bose, N.; Millar, G.; Bulger, C.; Nazareth, G.; Chen, X. Adaptive AUV Mission Control System Tested in the Waters of Baffin Bay. Drones 2024, 8(2), 45. [Google Scholar] [CrossRef]
- Responsive AUV Localization and Mapping (REALM). Explorer AUV. Memorial University of Newfoundland. https://www.mun.ca/engineering/research/centres-and-facilities/research-centres/oerc/facilities/merlin/explorer-auv/ (accessed , 2025). 30 June.
- Hwang, J.; Bose, N.; Nguyen, H. D.; Williams, G. Oil Plume Mapping: Adaptive Tracking and Adaptive Sampling from an Autonomous Underwater Vehicle. IEEE Access 2020, 8, 198021–198034. [Google Scholar] [CrossRef]
- Hwang, J.; Bose, N.; Millar, G.; Nazareth, G.; Bulger, C. An Autonomous Underwater Vehicle (AUV) Dual Driver System for Subsurface Hydrocarbon Plume Survey. SSRN Electron. J. 2023. [CrossRef]
- Hwang, J.; Bose, N.; Millar, G.; Gillard, A.; Nguyen, H.; Williams, G. Enhancement of AUV Autonomy Using Backseat Driver Control Architecture. Int. J. Mech. Eng. Robot. Res. 2021, 10(6), 292–300. [Google Scholar] [CrossRef]
- Hwang, J.; Bose, N.; Millar, G.; Bulger, C.; Nazareth, G. Bubble Plume Tracking Using a Backseat Driver on an Autonomous Underwater Vehicle. Drones 2023, 7(10), 635. [Google Scholar] [CrossRef]
- Fan, S.; Bose, N.; Liang, Z. Polar AUV Challenges and Applications: A Review. Drones 2024, 8(8), 413. [Google Scholar] [CrossRef]
- Issac, M.; Adams, S.; He, M.; Bose, N.; Williams, C.; Bachmayer, R.; Crees, T. Manoeuvring Experiments Using the MUN Explorer AUV. Proc. IEEE/OES OCEANS Conf. 2007, 256–262. [CrossRef]
- Bose, N.; Lewis, R. S.; Adams, S. Preparatory Tests with an Explorer Class Autonomous Underwater Vehicle for Missions under Sea Ice. Int. J. Ocean Clim. Syst. 2010, 1 (3–4), 145–153. [CrossRef]
- Issac, M.; Adams, S.; He, M.; Bose, N.; Williams, C.; Bachmayer, R.; Crees, T. Manoeuvring Trials with the MUN Explorer AUV: Data Analysis and Observations. Proc. OCEANS 2007 2007, 1–8. [Google Scholar] [CrossRef]
- Issac, M. T.; Bose, N.; Williams, C. D.; Bachmayer, R.; Crees, T. Depth-Changing Manoeuvres Using the MUN Explorer AUV. Proc. SNAME 29th Am. Towing Tank Conf. 2010, MD, USA. [Google Scholar] [CrossRef]
- Krishna, H. R.; Issac, M.; Ebenezer, D. D.; Zou, T.; Bose, N.; Randell, B. Numerical Analysis of the Hull-Propeller Interactions for an Explorer Class Autonomous Underwater Vehicle. 2025. [Google Scholar] [CrossRef]
- Krishna, H. R.; Issac, M.; Ebenezer, D. D.; Zou, T.; Bose, N.; Randell, B. Numerical Self-Propulsion Analysis of an Explorer Class Autonomous Underwater Vehicle. J. Ocean Technol. 2025, 20, 74–96. [Google Scholar] [CrossRef]
- PRISMA. Transparent Reporting of Systematic Reviews and Meta-Analyses. PRISMA Statement. http://www.prisma-statement.org/ (accessed 2025-06-30).
- Mendu, B.; Mbuli, N. State-of-the-Art Review on the Application of Unmanned Aerial Vehicles (UAVs) in Power Line Inspections: Current Innovations, Trends, and Future Prospects. Drones 2025, 9(4), 265. [Google Scholar] [CrossRef]
- Page, M. J.; McKenzie, J. E.; Bossuyt, P. M.; Boutron, I.; Hoffmann, T. C.; Mulrow, C. D.; Shamseer, L.; Tetzlaff, J. M.; Akl, E. A.; Brennan, S. E.; Chou, R.; Glanville, J.; Grimshaw, J. M.; Hróbjartsson, A.; Lalu, M. M.; Li, T.; Loder, E. W.; Mayo-Wilson, E.; McDonald, S.; Moher, D. The PRISMA 2020 Statement: An Updated Guideline for Reporting Systematic Reviews. BMJ 2021, 372, n71. [Google Scholar] [CrossRef] [PubMed]
- Rethlefsen, M. L.; Kirtley, S.; Waffenschmidt, S.; Ayala, A. P.; Moher, D.; Page, M. J.; Stewart, L. A. PRISMA-S: An Extension to the PRISMA Statement for Reporting Literature Searches in Systematic Reviews. Syst. Rev. 2021, 10, 39. [Google Scholar] [CrossRef] [PubMed]
- Sohrabi, C.; Franchi, T.; Mathew, G.; Kerwan, A.; Nicola, M.; Griffin, M.; Agha, M.; Agha, R. PRISMA 2020 Statement: What’s New and the Importance of Reporting Guidelines. Int. J. Surg. 2021, 88, 105918. [Google Scholar] [CrossRef] [PubMed]
- Trifu, A.; Smîdu, E.; Badea, D. O.; Tudose Bulboacă, E.; Haralambie, V. Applying the PRISMA Method for Obtaining Systematic Reviews of Occupational Safety Issues in Literature Search. MATEC Web Conf. 2022, 354, 00052. [Google Scholar] [CrossRef]
- Phillips, M.; et al. Systematic Reviews in the Engineering Literature: A Scoping Review. IEEE Access 2024, 12, 62648–62663. [Google Scholar] [CrossRef]
- Boaye Belle, A.; Zhao, Y. Evidence-Based Software Engineering: A Checklist-Based Approach to Assess the Abstracts of Reviews Self-Identifying as Systematic Reviews. Appl. Sci. 2022, 12(18), 9017. [Google Scholar] [CrossRef]
- Agrawal, S.; Oza, P.; Kakkar, R.; Tanwar, S.; Jetani, V.; Undhad, J.; Singh, A. Analysis and Recommendation System-Based on PRISMA Checklist to Write Systematic Review. Assess. Writ. 2024, 61, 100866. [Google Scholar] [CrossRef]
- Moher, D.; Liberati, A.; Tetzlaff, J.; Altman, D. G. ; PRISMA Group. Preferred Reporting Items for Systematic Reviews and Meta-Analyses: The PRISMA Statement. PLoS Med. 2009, 6 (7), e1000097. [CrossRef]
- Thevar, T.; Burns, N.; Ockwell, M.; Watson, J. An Ultracompact Underwater Pulsed Digital Holographic Camera with Rapid Particle Image Extraction Suite. IEEE J. Oceanic Eng. 2023, PP, 1–11. [Google Scholar] [CrossRef]
- Rahmati, M.; Pompili, D. UW-SVC: Scalable Video Coding Transmission for In-Network Underwater Imagery Analysis. arXiv arXiv:1910.08844, 2019. [CrossRef]
- Zocco, F.; Lin, T.-C.; Huang, C.-I.; Wang, H.-C.; Khyam, M. O.; Van, M. Towards More Efficient EfficientDets and Real-Time Marine Debris Detection. IEEE Robot. Autom. Lett. 2023, 8(4), 2134–2141. [Google Scholar] [CrossRef]
- Wang, J.; Feng, C.; Wang, L.; Li, G.; He, B. Detection of Weak and Small Targets in Forward-Looking Sonar Image Using Multi-Branch Shuttle Neural Network. IEEE Sens. J. 2022, 22(7), 6772–6783. [Google Scholar] [CrossRef]
- Hong, L.; Cui, W.; Chen, H. A Novel Multi-Robot Task Allocation Model in Marine Plastics Cleaning Based on Replicator Dynamics. J. Mar. Sci. Eng. 2021, 9(8), 879. [Google Scholar] [CrossRef]
- Corrigan, B. C.; Tay, Z. Y.; Konovessis, D. Real-Time Instance Segmentation for Detection of Underwater Litter as a Plastic Source. J. Mar. Sci. Eng. 2023, 11(8), 1532. [Google Scholar] [CrossRef]
- Huang, S.; Huang, X.; Bi, R.; Guo, Q.; Yu, X.; Zeng, Q.; Huang, Z.; Liu, T.; Wu, H.; Chen, Y.; Xu, J.; Wu, Y.; Guo, P. Detection and Analysis of Microplastics in Human Sputum. Environ. Sci. Technol. 2022, 56(4), 2476–2486. [Google Scholar] [CrossRef] [PubMed]
- Materić, D.; Kasper-Giebl, A.; Kau, D.; Anten, M.; Greilinger, M.; Ludewig, E.; van Sebille, E.; Röckmann, T.; Holzinger, R. Micro- and Nanoplastics in Alpine Snow: A New Method for Chemical Identification and (Semi)Quantification in the Nanogram Range. Environ. Sci. Technol. 2020, 54(4), 2353–2359. [Google Scholar] [CrossRef] [PubMed]
- Xu, G.; Cheng, H.; Jones, R.; Feng, Y.; Gong, K.; Li, K.; Fang, X.; Tahir, M. A.; Valev, V. K.; Zhang, L. Surface-Enhanced Raman Spectroscopy Facilitates the Detection of Microplastics <1 µm in the Environment. Environ. Sci. Technol. 2020, 54(24), 15594–15603. [Google Scholar] [CrossRef] [PubMed]
- Eisentraut, P.; Dümichen, E.; Ruhl, A. S.; Jekel, M.; Albrecht, M.; Gehde, M.; Braun, U. Two Birds with One Stone—Fast and Simultaneous Analysis of Microplastics: Microparticles Derived from Thermoplastics and Tire Wear. Environ. Sci. Technol. Lett. 2018, 5(10), 608–613. [Google Scholar] [CrossRef]
- Ribeiro, F.; Okoffo, E. D.; O’Brien, J. W.; Fraissinet-Tachet, S.; O’Brien, S.; Gallen, M.; Samanipour, S.; Kaserzon, S.; Mueller, J. F.; Galloway, T.; Thomas, K. V. Quantitative Analysis of Selected Plastics in High-Commercial-Value Australian Seafood by Pyrolysis Gas Chromatography Mass Spectrometry. Environ. Sci. Technol. 2020, 54(15), 9408–9417. [Google Scholar] [CrossRef] [PubMed]
- Erni-Cassola, G.; Gibson, M. I.; Thompson, R. C.; Christie-Oleza, J. A. Lost, but Found with Nile Red: A Novel Method to Detect and Quantify Small Microplastics (20 µm–1 mm) in Environmental Samples. Environ. Sci. Technol. 2017, 51(23), 13641–13648. [Google Scholar] [CrossRef] [PubMed]
- Dey, T. K.; Uddin, M. E.; Jamal, M. Detection and Removal of Microplastics in Wastewater: Evolution and Impact. Environ. Sci. Pollut. Res. 2021, 28(14), 16925–16947. [Google Scholar] [CrossRef] [PubMed]
- Wright, S. L.; Levermore, J. M.; Kelly, F. J. Raman Spectral Imaging for the Detection of Inhalable Microplastics in Ambient Particulate Matter Samples. Environ. Sci. Technol. 2019, 53(15), 8947–8956. [Google Scholar] [CrossRef] [PubMed]
- Sgier, L.; Freimann, R.; Zupanic, A.; Kroll, A. Flow Cytometry Combined with viSNE for the Analysis of Microbial Biofilms and Detection of Microplastics. Nat. Commun. 2016, 7, 11587. [Google Scholar] [CrossRef] [PubMed]
- Wiggin, K. J.; Holland, E. B. Validation and Application of Cost and Time Effective Methods for the Detection of 3–500 µm Sized Microplastics in the Urban Marine and Estuarine Environments Surrounding Long Beach, California. Mar. Pollut. Bull. 2019, 143, 152–162. [Google Scholar] [CrossRef] [PubMed]
- Nihart, A. J.; Garcia, M. A.; El Hayek, E.; Liu, R.; Olewine, M.; Kingston, J. D.; Castillo, E. F.; Gullapalli, R. R.; Howard, T.; Bleske, B.; Scott, J.; Gonzalez-Estrella, J.; Gross, J. M.; Spilde, M.; Adolphi, N. L.; Gallego, D. F.; Jarrell, H. S.; Dvorscak, G.; Zuluaga-Ruiz, M. E.; West, A. B.; et al. Bioaccumulation of Microplastics in Decedent Human Brains. Nat. Med. 2025, 31(4), 1114–1119. [Google Scholar] [CrossRef] [PubMed]
- Zhang, Y.; Peng, Y.; Peng, C.; Wang, P.; Lu, Y.; He, X.; Wang, L. Comparison of Detection Methods of Microplastics in Landfill Mineralized Refuse and Selection of Degradation Degree Indexes. Environ. Sci. Technol. 2021, 55(20), 13802–13811. [Google Scholar] [CrossRef] [PubMed]
- Kaile, N.; Lindivat, M.; Elío, J.; Thuestad, G.; Crowley, Q.; Hoell, I. Preliminary Results from Detection of Microplastics in Liquid Samples Using Flow Cytometry. Front. Mar. Sci. 2020, 7, 552688. [Google Scholar] [CrossRef]
- Witzig, C. S.; Földi, C.; Wörle, K.; Habermehl, P.; Pittroff, M.; Müller, Y. K.; Lauschke, T.; Fiener, P.; Dierkes, G.; Freier, K. P.; Zumbülte, N. When Good Intentions Go Bad—False Positive Microplastic Detection Caused by Disposable Gloves. Environ. Sci. Technol. 2020, 54(19), 12164–12172. [Google Scholar] [CrossRef] [PubMed]
- Ye, Y.; Yu, K.; Zhao, Y. The Development and Application of Advanced Analytical Methods in Microplastics Contamination Detection: A Critical Review. Sci. Total Environ. 2022, 818, 151851. [Google Scholar] [CrossRef] [PubMed]
- Baruah, A.; Sharma, A.; Sharma, S.; Nagraik, R. An Insight into Different Microplastic Detection Methods. Int. J. Environ. Sci. Technol. 2021, 19, 8491–8500. [Google Scholar] [CrossRef]
- Rathore, C.; Saha, M.; Gupta, P.; Kumar, M.; Naik, A.; de Boer, J. Standardization of Micro-FTIR Methods and Applicability for the Detection and Identification of Microplastics in Environmental Matrices. Sci. Total Environ. 2023, 888, 164157. [Google Scholar] [CrossRef] [PubMed]
- Evans, M.; Ruf, C. Toward the Detection and Imaging of Ocean Microplastics with a Spaceborne Radar. IEEE Trans. Geosci. Remote Sens. 2021, PP, 1–9. [Google Scholar] [CrossRef]
- Xie, L.; Luo, S.; Liu, Y.; Ruan, X.; Gong, K.; Ge, Q.; Li, K.; Valev, V. K.; Liu, G.; Zhang, L. Automatic Identification of Individual Nanoplastics by Raman Spectroscopy Based on Machine Learning. Environ. Sci. Technol. 2023, 57(46), 18203–18214. [Google Scholar] [CrossRef] [PubMed]
- Maxwell, S. H.; Melinda, K. F.; Matthew, G. Counterstaining to Separate Nile Red-Stained Microplastic Particles from Terrestrial Invertebrate Biomass. Environ. Sci. Technol. 2020, 54(9), 5580–5588. [Google Scholar] [CrossRef] [PubMed]
- Aragaw, T. A. Microplastic Pollution in African Countries’ Water Systems: A Review on Findings, Applied Methods, Characteristics, Impacts, and Managements. SN Appl. Sci. 2021, 3(6), 629. [Google Scholar] [CrossRef] [PubMed]
- Müller, A.; Goedecke, C.; Eisentraut, P.; et al. Microplastic Analysis Using Chemical Extraction Followed by LC-UV Analysis: A Straightforward Approach to Determine PET Content in Environmental Samples. Environ. Sci. Eur. 2020, 32, 85. [Google Scholar] [CrossRef]
- Wagner, J.; Wang, Z. M.; Ghosal, S.; Murphy, M.; Wall, S.; Cook, A. M.; Robberson, W.; Allen, H. Nondestructive Extraction and Identification of Microplastics from Freshwater Sport Fish Stomachs. Environ. Sci. Technol. 2019, 53(24), 14496–14506. [Google Scholar] [CrossRef] [PubMed]
- Sancataldo, G.; Avellone, G.; Vetri, V. Nile Red Lifetime Reveals Microplastic Identity. Environ. Sci.: Processes Impacts 2020, 22, 2266–2275. [Google Scholar] [CrossRef] [PubMed]
- Giardino, M.; Balestra, V.; Janner, D.; Bellopede, R. Automated Method for Routine Microplastic Detection and Quantification. Sci. Total Environ. 2023, 859 (Pt 2), 160036. [Google Scholar] [CrossRef] [PubMed]
- Weber, C. J.; Opp, C.; Prume, J. A.; Koch, M.; Andersen, T. J.; Chifflard, P. Deposition and In-Situ Translocation of Microplastics in Floodplain Soils. Sci. Total Environ. 2022, 819, 152039. [Google Scholar] [CrossRef] [PubMed]
- Guselnikova, O.; Trelin, A.; Kang, Y.; et al. Pretreatment-Free SERS Sensing of Microplastics Using a Self-Attention-Based Neural Network on Hierarchically Porous Ag Foams. Nat. Commun. 2024, 15, 4351. [Google Scholar] [CrossRef] [PubMed]
- Li, D.; Sheerin, E.; Shi, Y.; Xiao, L.; Yang, L.; Boland, J.; Wang, J. J. Alcohol Pretreatment to Eliminate the Interference of Micro Additive Particles in the Identification of Microplastics Using Raman Spectroscopy. Environ. Sci. Technol. 2022, 56, 10226–10235. [Google Scholar] [CrossRef] [PubMed]
- Xiang, S.; Xie, Y.; Sun, X.; Du, H.; Wang, J. Identification and Quantification of Microplastics in Aquaculture Environment. Front. Mar. Sci. 2022, 8, 804208. [Google Scholar] [CrossRef]
- Hahn, A.; Gerdts, G.; Völker, C.; Niebühr, V. Using FTIRS as Pre-Screening Method for Detection of Microplastic in Bulk Sediment Samples. Sci. Total Environ. 2019, 689, 341–346. [Google Scholar] [CrossRef] [PubMed]
- Ateia, M.; Ersan, G.; Alalm, M. G.; Boffito, D. C.; Karanfil, T. Emerging Investigator Series: Microplastic Sources, Fate, Toxicity, Detection, and Interactions with Micropollutants in Aquatic Ecosystems—A Review of Reviews. Environ. Sci.: Processes Impacts 2022, 24 (2), 172–195. [CrossRef]
- Leed, R.; Rogers, M.; Smithson, J.; Moore, A. Ecological Effects of Soil Microplastic Pollution. Sci. Insights 2019, 30, 70–84. [Google Scholar] [CrossRef]
- Lechthaler, S.; Esser, V.; Schüttrumpf, H.; Stauch, G. Why Analysing Microplastics in Floodplains Matters: Application in a Sedimentary Context. Environ. Sci.: Processes Impacts 2021, 23, 66–77. [Google Scholar] [CrossRef] [PubMed]
- Li, P.; Lai, Y.; Zheng, R. G.; Li, Q. C.; Sheng, X.; Yu, S.; Hao, Z.; Cai, Y. Q.; Liu, J. Extraction of Common Small Microplastics and Nanoplastics Embedded in Environmental Solid Matrices by Tetramethylammonium Hydroxide Digestion and Dichloromethane Dissolution for Py-GC-MS Determination. Environ. Sci. Technol. 2023, 57(32), 12010–12018. [Google Scholar] [CrossRef] [PubMed]
- Liu, T.; Yu, S.; Zhu, X.; Liao, R.; Zhuo, Z.; He, Y.; Ma, H. In-Situ Detection Method for Microplastics in Water by Polarized Light Scattering. Front. Mar. Sci. 2021, 8, 739683. [Google Scholar] [CrossRef]
- Jin, M.; Liu, J.; Yu, J.; Zhou, Q.; Wu, W.; Fu, L.; Yin, C.; Fernandez, C.; Karimi-Maleh, H. Current Development and Future Challenges in Microplastic Detection Techniques: A Bibliometrics-Based Analysis and Review. Sci. Prog. 2022, 105(4), 368504221132151. [Google Scholar] [CrossRef] [PubMed]
- Ece, E.; Hacıosmanoğlu, N.; Inci, F. Microfluidics as a Ray of Hope for Microplastic Pollution. Biosensors 2023, 13(3), 332. [Google Scholar] [CrossRef] [PubMed]
- Du, H.; Chen, G.; Wang, J. Highly Selective Electrochemical Impedance Spectroscopy-Based Graphene Electrode for Rapid Detection of Microplastics. Sci. Total Environ. 2023, 862, 160873. [Google Scholar] [CrossRef] [PubMed]
- Liu, Y.; Ling, X.; Jiang, R.; Chen, L.; Ye, L.; Wang, Y.; Lu, G.; Wu, B. High-Content Screening Discovers Microplastics Released by Contact Lenses under Sunlight. Environ. Sci. Technol. 2023, 57(23), 8506–8513. [Google Scholar] [CrossRef] [PubMed]
- Cingolani, M.; Rampazzo, E.; Zaccheroni, N.; Genovese, D.; Prodi, L. Fluorogenic Hyaluronan Nanogels for Detection of Micro- and Nanoplastics in Water. Environ. Sci.: Nano 2022, 9, 144–152. [Google Scholar] [CrossRef]
- Phan, S.; Torrejon, D.; Furseth, J.; Mee, E.; Luscombe, C. Exploiting Weak Supervision to Facilitate Segmentation, Classification, and Analysis of Microplastics (<100 µm) Using Raman Microspectroscopy Images. Sci. Total Environ. 2023, 886, 163786. [Google Scholar] [CrossRef] [PubMed]
- Park, S. J.; Ahn, Y. H. Detection of Polystyrene Microplastic Particles in Water Using Surface-Functionalized Terahertz Microfluidic Metamaterials. Appl. Sci. 2022, 12(14), 7102. [Google Scholar] [CrossRef]
- Canga, E. M.; Gowen, A.; Xu, J. L. Assessing the Inconsistency of Microplastic Measurements in Foods and Beverages. Compr. Rev. Food Sci. Food Saf. 2024, 23(2), e13315. [Google Scholar] [CrossRef] [PubMed]
- Ouyang, X.; Hu, Y.; Li, G. Integrated Sample-Pretreatment Strategy for Separation and Enrichment of Microplastics and Primary Aromatic Amines in the Migration of Teabag. J. Sep. Sci. 2022, 45(4), 929–937. [Google Scholar] [CrossRef] [PubMed]
- Du, B.; Liu, Y.; Tan, J.; Wang, Z.; Ji, C.; Shao, M.; Zhao, X.; Yu, J.; Jiang, S.; Zhang, C.; Man, B.; Li, Z. Thermoelectrically Driven Dual-Mechanism Regulation on SERS and Application Potential for Rapid Detection of SARS-CoV-2 Viruses and Microplastics. ACS Sens. 2024, 9(1), 502–513. [Google Scholar] [CrossRef] [PubMed]
- Shahani, K.; Song, H.; Mehdi, S.; Sharma, A.; Tunio, G.; Ullah, J.; Kalhoro, N. A.; Khaskheli, N. Design and Testing of an Underwater Microscope with Variable Objective Lens for the Study of Benthic Communities. J. Mar. Sci. Appl. 2021, 20, 75–83. [Google Scholar] [CrossRef]
- Chun, S.; Muthu, M.; Gopal, J. Mass Spectrometry as an Analytical Tool for Detection of Microplastics in the Environment. Chemosensors 2022, 10(12), 530. [Google Scholar] [CrossRef]
- Rede, D.; Teixeira, I.; Delerue-Matos, C.; Fernandes, V. C. Assessing Emerging and Priority Micropollutants in Sewage Sludge: Environmental Insights and Analytical Approaches. Environ. Sci. Pollut. Res. 2024, 31(2), 3152–3168. [Google Scholar] [CrossRef] [PubMed]
- Liu, H.; Pan, B.; Zhang, J.; Huang, Z.; Li, P.; Shen, J. Determination of Microplastics in Agricultural Soil by Double-Shot Pyrolysis-Gas Chromatography Combined with Two-Step Extraction. J. Sep. Sci. 2024, 47(1), e2300253. [Google Scholar] [CrossRef] [PubMed]
- Faramarzi, P.; Jang, W.; Oh, D.; Kim, B.; Kim, J. H.; You, J. B. Microfluidic Detection and Analysis of Microplastics Using Surface Nanodroplets. ACS Sens. 2024, 9(3), 1489–1498. [Google Scholar] [CrossRef] [PubMed]
- Rivera-Rivera, D. M.; Quintanilla-Villanueva, G. E.; Luna-Moreno, D.; Sánchez-Álvarez, A.; Rodríguez-Delgado, J. M.; Cedillo-González, E. I.; Kaushik, G.; Villarreal-Chiu, J. F.; Rodríguez-Delgado, M. M. Exploring Innovative Approaches for the Analysis of Micro- and Nanoplastics: Breakthroughs in (Bio)Sensing Techniques. Biosensors 2025, 15(1), 44. [Google Scholar] [CrossRef] [PubMed]
- Willans, M.; Szczecinski, E.; Roocke, C.; Williams, S.; Timalsina, S.; Vongsvivut, J.; McIlwain, J.; Naderi, G.; Linge, K.; Hackett, M. Development of a Rapid Detection Protocol for Microplastics Using Reflectance-FTIR Spectroscopic Imaging and Multivariate Classification. Environ. Sci.: Adv. 2023, 2, 895–904. [Google Scholar] [CrossRef]
- Zhang, Z.; Geng, Y.; Zhou, W.; Shao, X.; Lin, H.; Zhou, Y. Development of a Multi-Spectroscopy Method Coupling µ-FTIR and µ-Raman Analysis for One-Stop Detection of Microplastics in Environmental and Biological Samples. Sci. Total Environ. 2024, 917, 170396. [Google Scholar] [CrossRef] [PubMed]
- Kanyathare, B. E.; Asamoah, B.; Ishaq, M. U.; Amoani, J.; Räty, J.; Peiponen, K.-E. Identification of Plastic Type and Surface Roughness of Film-Type Plastics in Water Using Kramers–Kronig Analysis. Chemosensors 2020, 8(4), 88. [Google Scholar] [CrossRef]
- Zhang, Y.; Wang, X.; Shan, J.; Zhao, J.; Zhang, W.; Liu, L.; Wu, F. Hyperspectral Imaging Based Method for Rapid Detection of Microplastics in the Intestinal Tracts of Fish. Environ. Sci. Technol. 2019, 53(9), 5151–5158. [Google Scholar] [CrossRef] [PubMed]
- Sierra, I.; Chialanza, M. R.; Faccio, R.; Carrizo, D.; Fornaro, L.; Pérez-Parada, A. Identification of Microplastics in Wastewater Samples by Means of Polarized Light Optical Microscopy. Environ. Sci. Pollut. Res. 2020, 27(7), 7409–7419. [Google Scholar] [CrossRef] [PubMed]
- Sarker, M. A. B.; Imtiaz, M. H.; Holsen, T. M.; Baki, A. B. M. Real-Time Detection of Microplastics Using an AI Camera. Sensors 2024, 24(13), 4394. [Google Scholar] [CrossRef] [PubMed]
- Biermann, L.; Clewley, D.; Martinez-Vicente, V.; Topouzelis, K. Finding Plastic Patches in Coastal Waters Using Optical Satellite Data. Sci. Rep. 2020, 10, 5364. [Google Scholar] [CrossRef] [PubMed]
- Frere, L.; Paul-Pont, I.; Moreau, J.; Soudant, P.; Lambert, C.; Huvet, A.; Rinnert, E. A Semi-Automated Raman Micro-Spectroscopy Method for Morphological and Chemical Characterizations of Microplastic Litter. Mar. Pollut. Bull. 2016, 113, 461–468. [Google Scholar] [CrossRef]
- Song, Y. K.; Hong, S. H.; Jang, M.; et al. A Comparison of Microscopic and Spectroscopic Identification for Analysis of Microplastics in Environmental Samples. Mar. Pollut. Bull. 2015, 93, 202–209. [Google Scholar] [CrossRef] [PubMed]
- Motalebizadeh, A.; Fardindoost, S.; Jungwirth, J.; Tasnim, N.; Hoorfar, M. Microplastic In Situ Detection Based on a Portable Triboelectric Microfluidic Sensor. Anal. Methods 2023, 15(36), 4718–4727. [Google Scholar] [CrossRef] [PubMed]
- Asamoah, B. O.; Kanyathare, B.; Roussey, M.; Peiponen, K.-E. A Prototype of a Portable Optical Sensor for the Detection of Transparent and Translucent Microplastics in Freshwater. Chemosphere 2019, 231, 161–167. [Google Scholar] [CrossRef] [PubMed]
- Zubkov, M. B.; Esiukova, E. E. Microplastics in a Marine Environment: Review of Methods for Sampling, Processing, and Analyzing Microplastics in Water, Bottom Sediments, and Coastal Deposits. Oceanology 2018, 58, 137–143. [Google Scholar] [CrossRef]
- Löder, M.; Kuczera, M.; Mintenig, S.; Lorenz, C.; Gerdts, G. Focal Plane Array Detector-Based Micro-Fourier-Transform Infrared Imaging for the Analysis of Microplastics in Environmental Samples. Environ. Chem. 2015, 12, 563–581. [Google Scholar] [CrossRef]
- Tata, G.; Royer, S.-J.; Poirion, O.; Lowe, J. A Robotic Approach towards Quantifying Epipelagic Bound Plastic Using Deep Visual Models. arXiv 2021. [CrossRef]
- Sarker, M. A. B.; Butt, U.; Imtiaz, M. H.; Baki, A. B. Automatic Detection of Microplastics in the Aqueous Environment. In 2023 IEEE 13th Annual Computing and Communication Workshop and Conference (CCWC); IEEE, 2023; pp 768–772. [CrossRef]
- Lorenzo-Navarro, J.; Castrillón-Santana, M.; Santesarti, E.; De Marsico, M.; Martínez, I.; Raymond, E.; Gómez, M.; Herrera, A. SMACC: A System for Microplastics Automatic Counting and Classification. IEEE Access 2020, 8, 25249–25261. [Google Scholar] [CrossRef]
- Shan, J.; Zhao, J.; Zhang, Y.; et al. Simple and Rapid Detection of Microplastics in Seawater Using Hyperspectral Imaging Technology. Anal. Chim. Acta 2019, 1050, 161–168. [Google Scholar] [CrossRef] [PubMed]
- Lin, W.; Li, X.; Yang, M.; Lee, K.; Chen, B.; Zhang, B. Brominated Flame Retardants, Microplastics, and Biocides in the Marine Environment: Recent Updates of Occurrence, Analysis, and Impacts. In Advances in Marine Biology; Chen, B., Zhang, B., Zhu, Z., Lee, K., Eds.; Academic Press: 2018; Vol. 81, pp 167–211. [CrossRef]
- Free, C. M.; Jensen, O. P.; Mason, S. A.; et al. High Levels of Microplastic Pollution in a Large, Remote, Mountain Lake. Mar. Pollut. Bull. 2014, 85, 156–163. [Google Scholar] [CrossRef] [PubMed]
- Cauwenberghe, L. V.; Claessens, M.; Vandegehuchte, M. B.; et al. Microplastics Are Taken Up by Mussels (Mytilus edulis) and Lugworms (Arenicola marina) Living in Natural Habitats. Environ. Pollut. 2015, 199, 10–17. [Google Scholar] [CrossRef] [PubMed]
- Gallant, S. M. V.; Whelan, L. D.; Stewart, L. D.; Merschrod, E. F. S. Hierarchical Magnetic Films for High-Performance Plasmonic Sensors. Langmuir 2021, 37(48), 14043–14049. [Google Scholar] [CrossRef] [PubMed]
- VOSviewer. Visualizing Scientific Landscapes; Centre for Science and Technology Studies (CWTS), Leiden University. https://www.vosviewer.com/ (accessed 2025-06-30).
- Wong, D. VOSviewer. Tech. Serv. Q. 2018, 35(2), 219–220. [Google Scholar] [CrossRef]
- van Eck, N. J.; Waltman, L. Software Survey: VOSviewer, a Computer Program for Bibliometric Mapping. Scientometrics 2010, 84(2), 523–538. [Google Scholar] [CrossRef] [PubMed]
- Carley, S.; Porter, A.; Rafols, I.; Leydesdorff, L. Visualization of Disciplinary Profiles: Enhanced Science Overlay Maps. J. Data Inf. Sci. 2017, 2(4), 1–21. [Google Scholar] [CrossRef]
- Waltman, L.; van Eck, N. J.; Noyons, E. C. M. A Unified Approach to Mapping and Clustering of Bibliometric Networks. J. Informetr. 2010, 4(4), 629–635. [Google Scholar] [CrossRef]
- Perianes-Rodriguez, A.; Waltman, L.; van Eck, N. J. Constructing Bibliometric Networks: A Comparison between Full and Fractional Counting. J. Informetr. 2016, 10(4), 1178–1195. [Google Scholar] [CrossRef]
Figure 1.
Features of Ocean Topography Sourced from the NOAA[16]
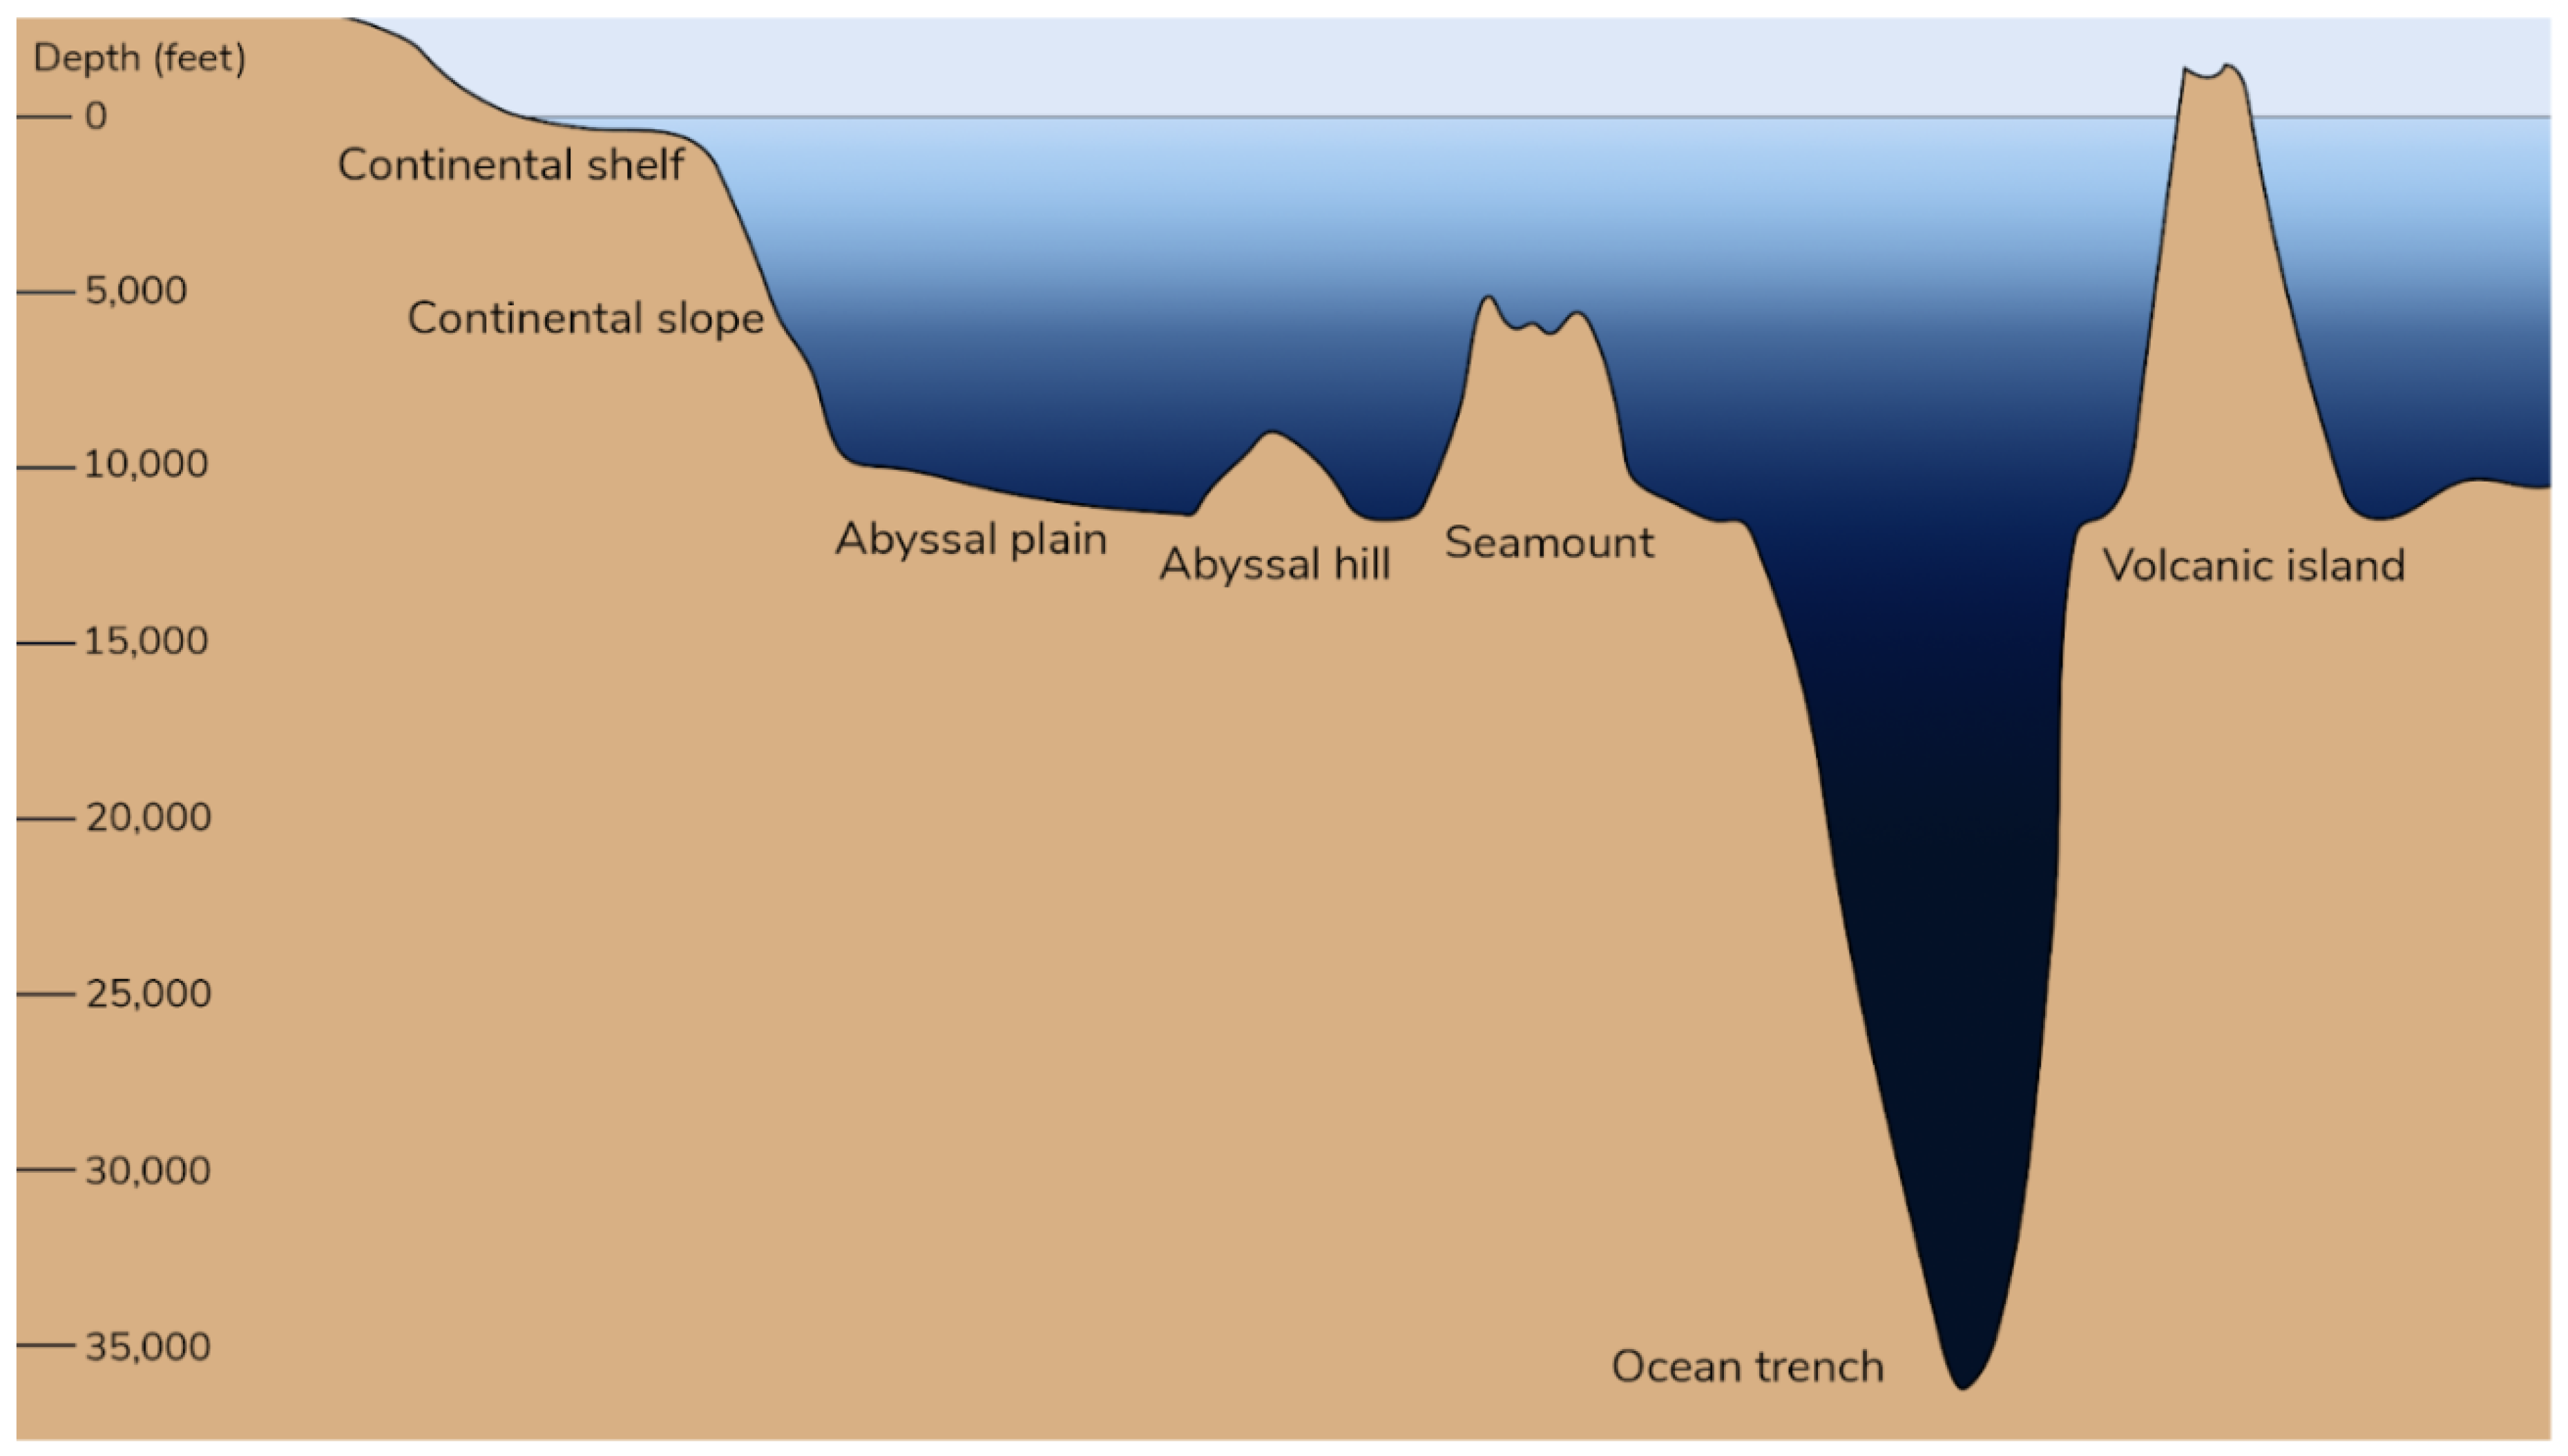
Figure 2.
Explorer AUV of Memorial University of Newfoundland Sourced from[24]
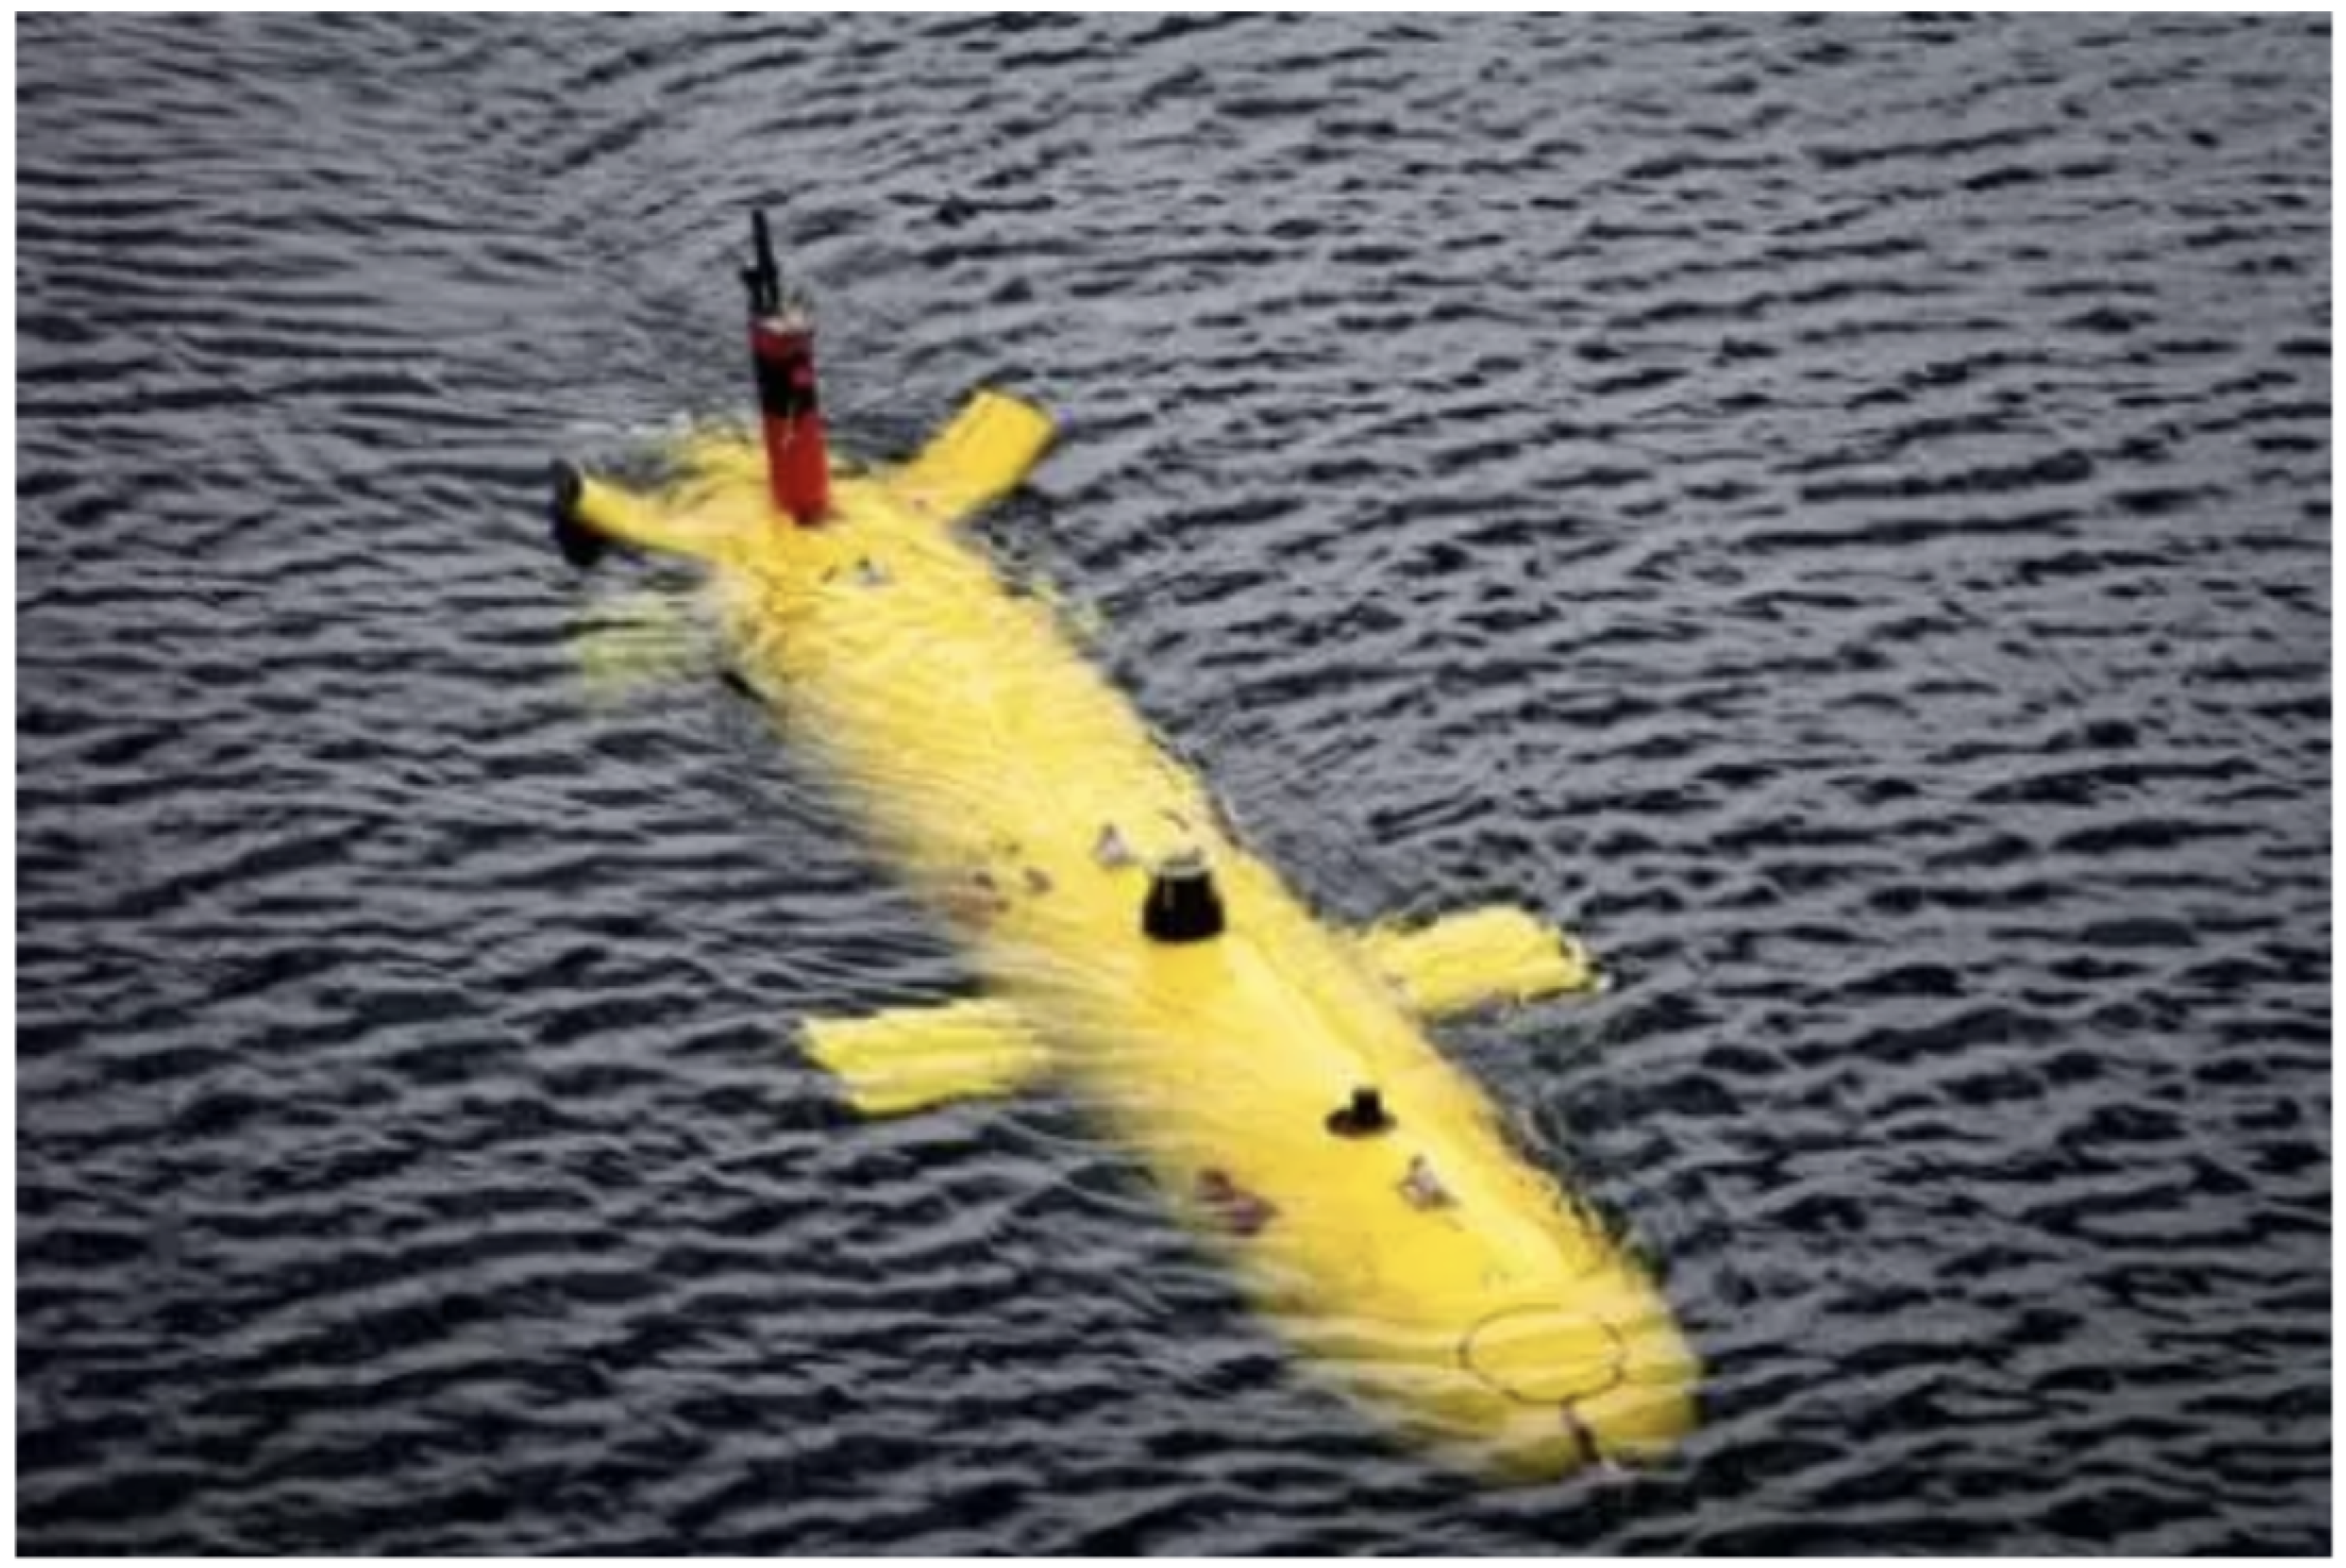
Figure 3.
Data Flow Diagram for Sensor Measurement and Sampling Triggering Sourced from Hwang et al.[27]
Figure 3.
Data Flow Diagram for Sensor Measurement and Sampling Triggering Sourced from Hwang et al.[27]
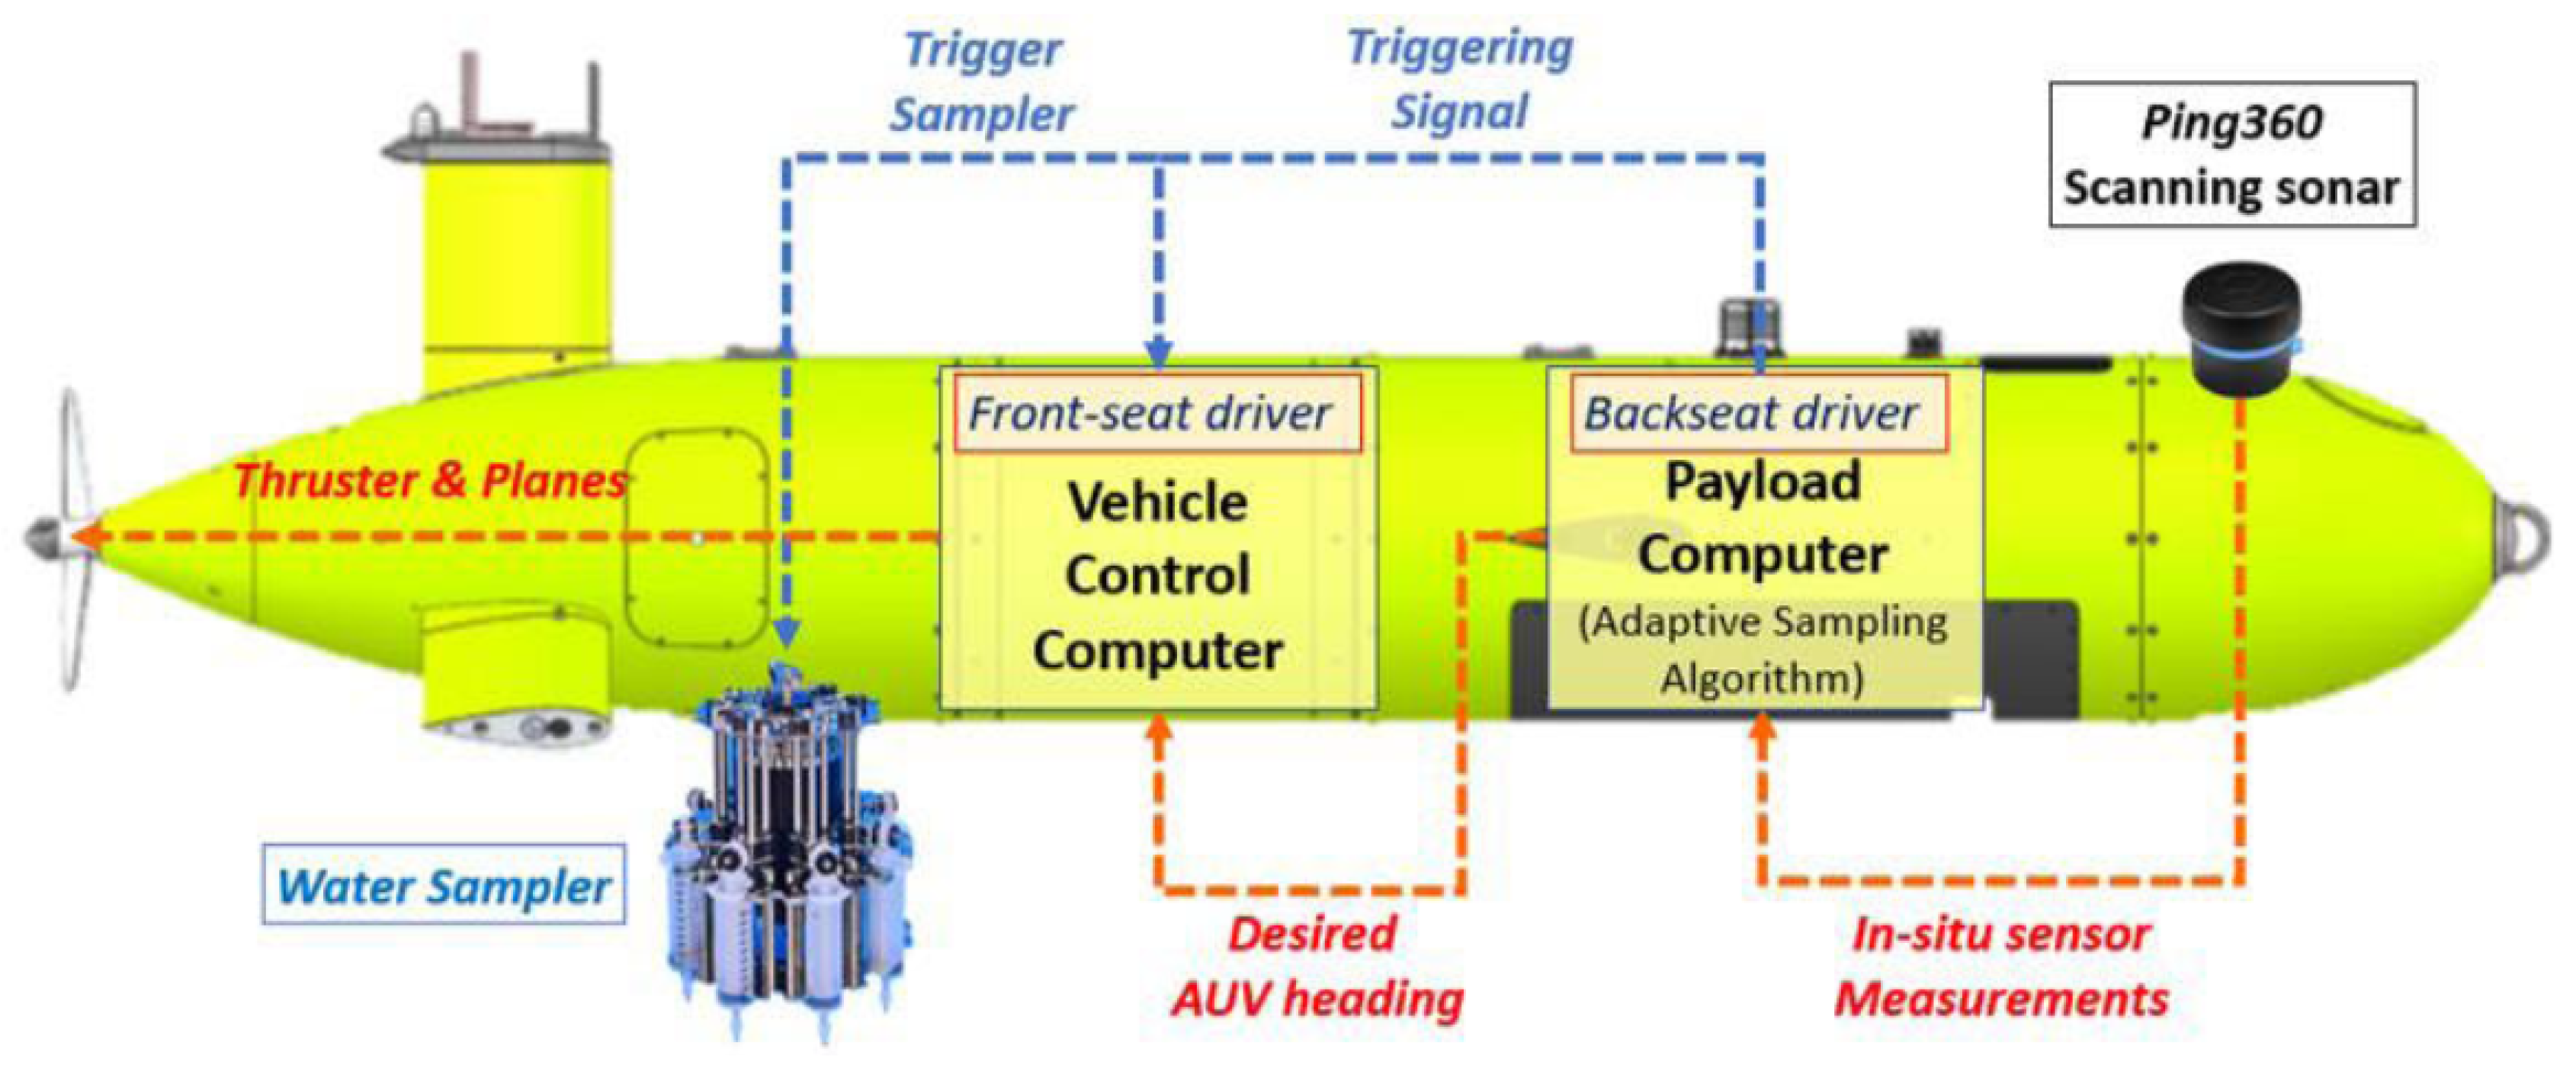
Figure 4.
PRISMA Flow Diagram Adapted from Page et al. (2021)[40] and Licensed under CC BY 4.0.
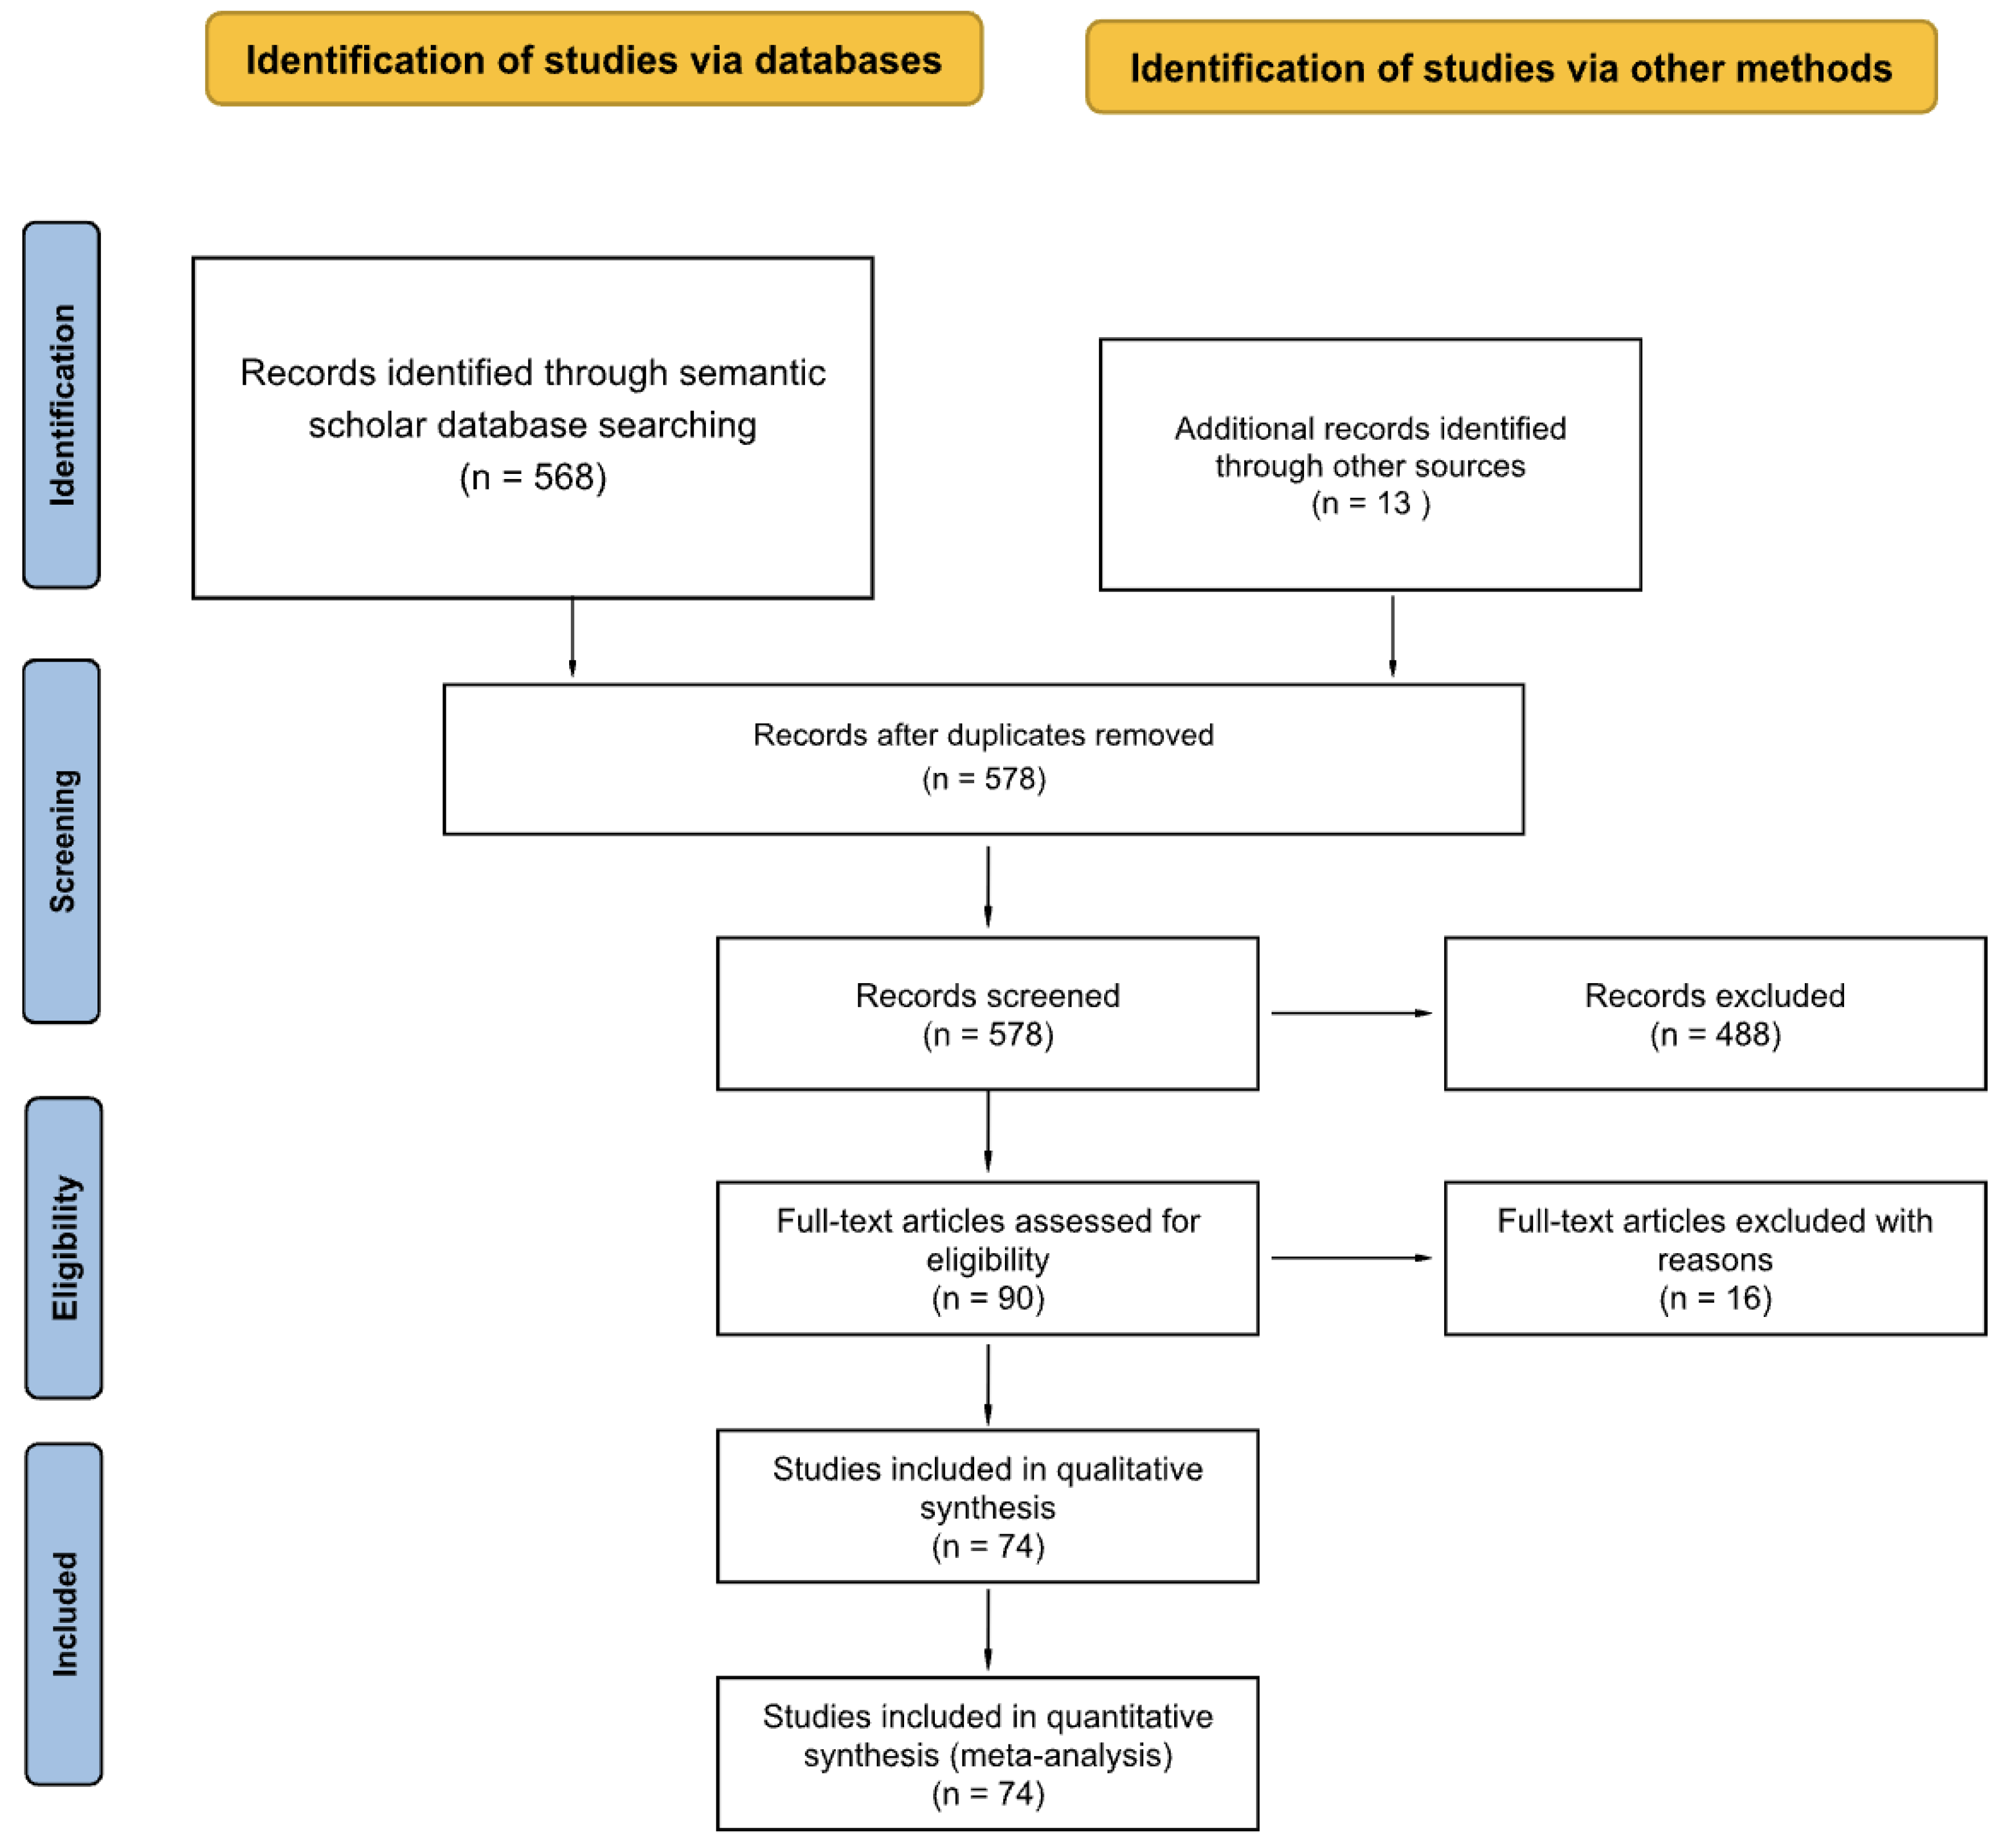
Figure 5.
The Annual and Cumulative Number of Publications from 2015 to 2025
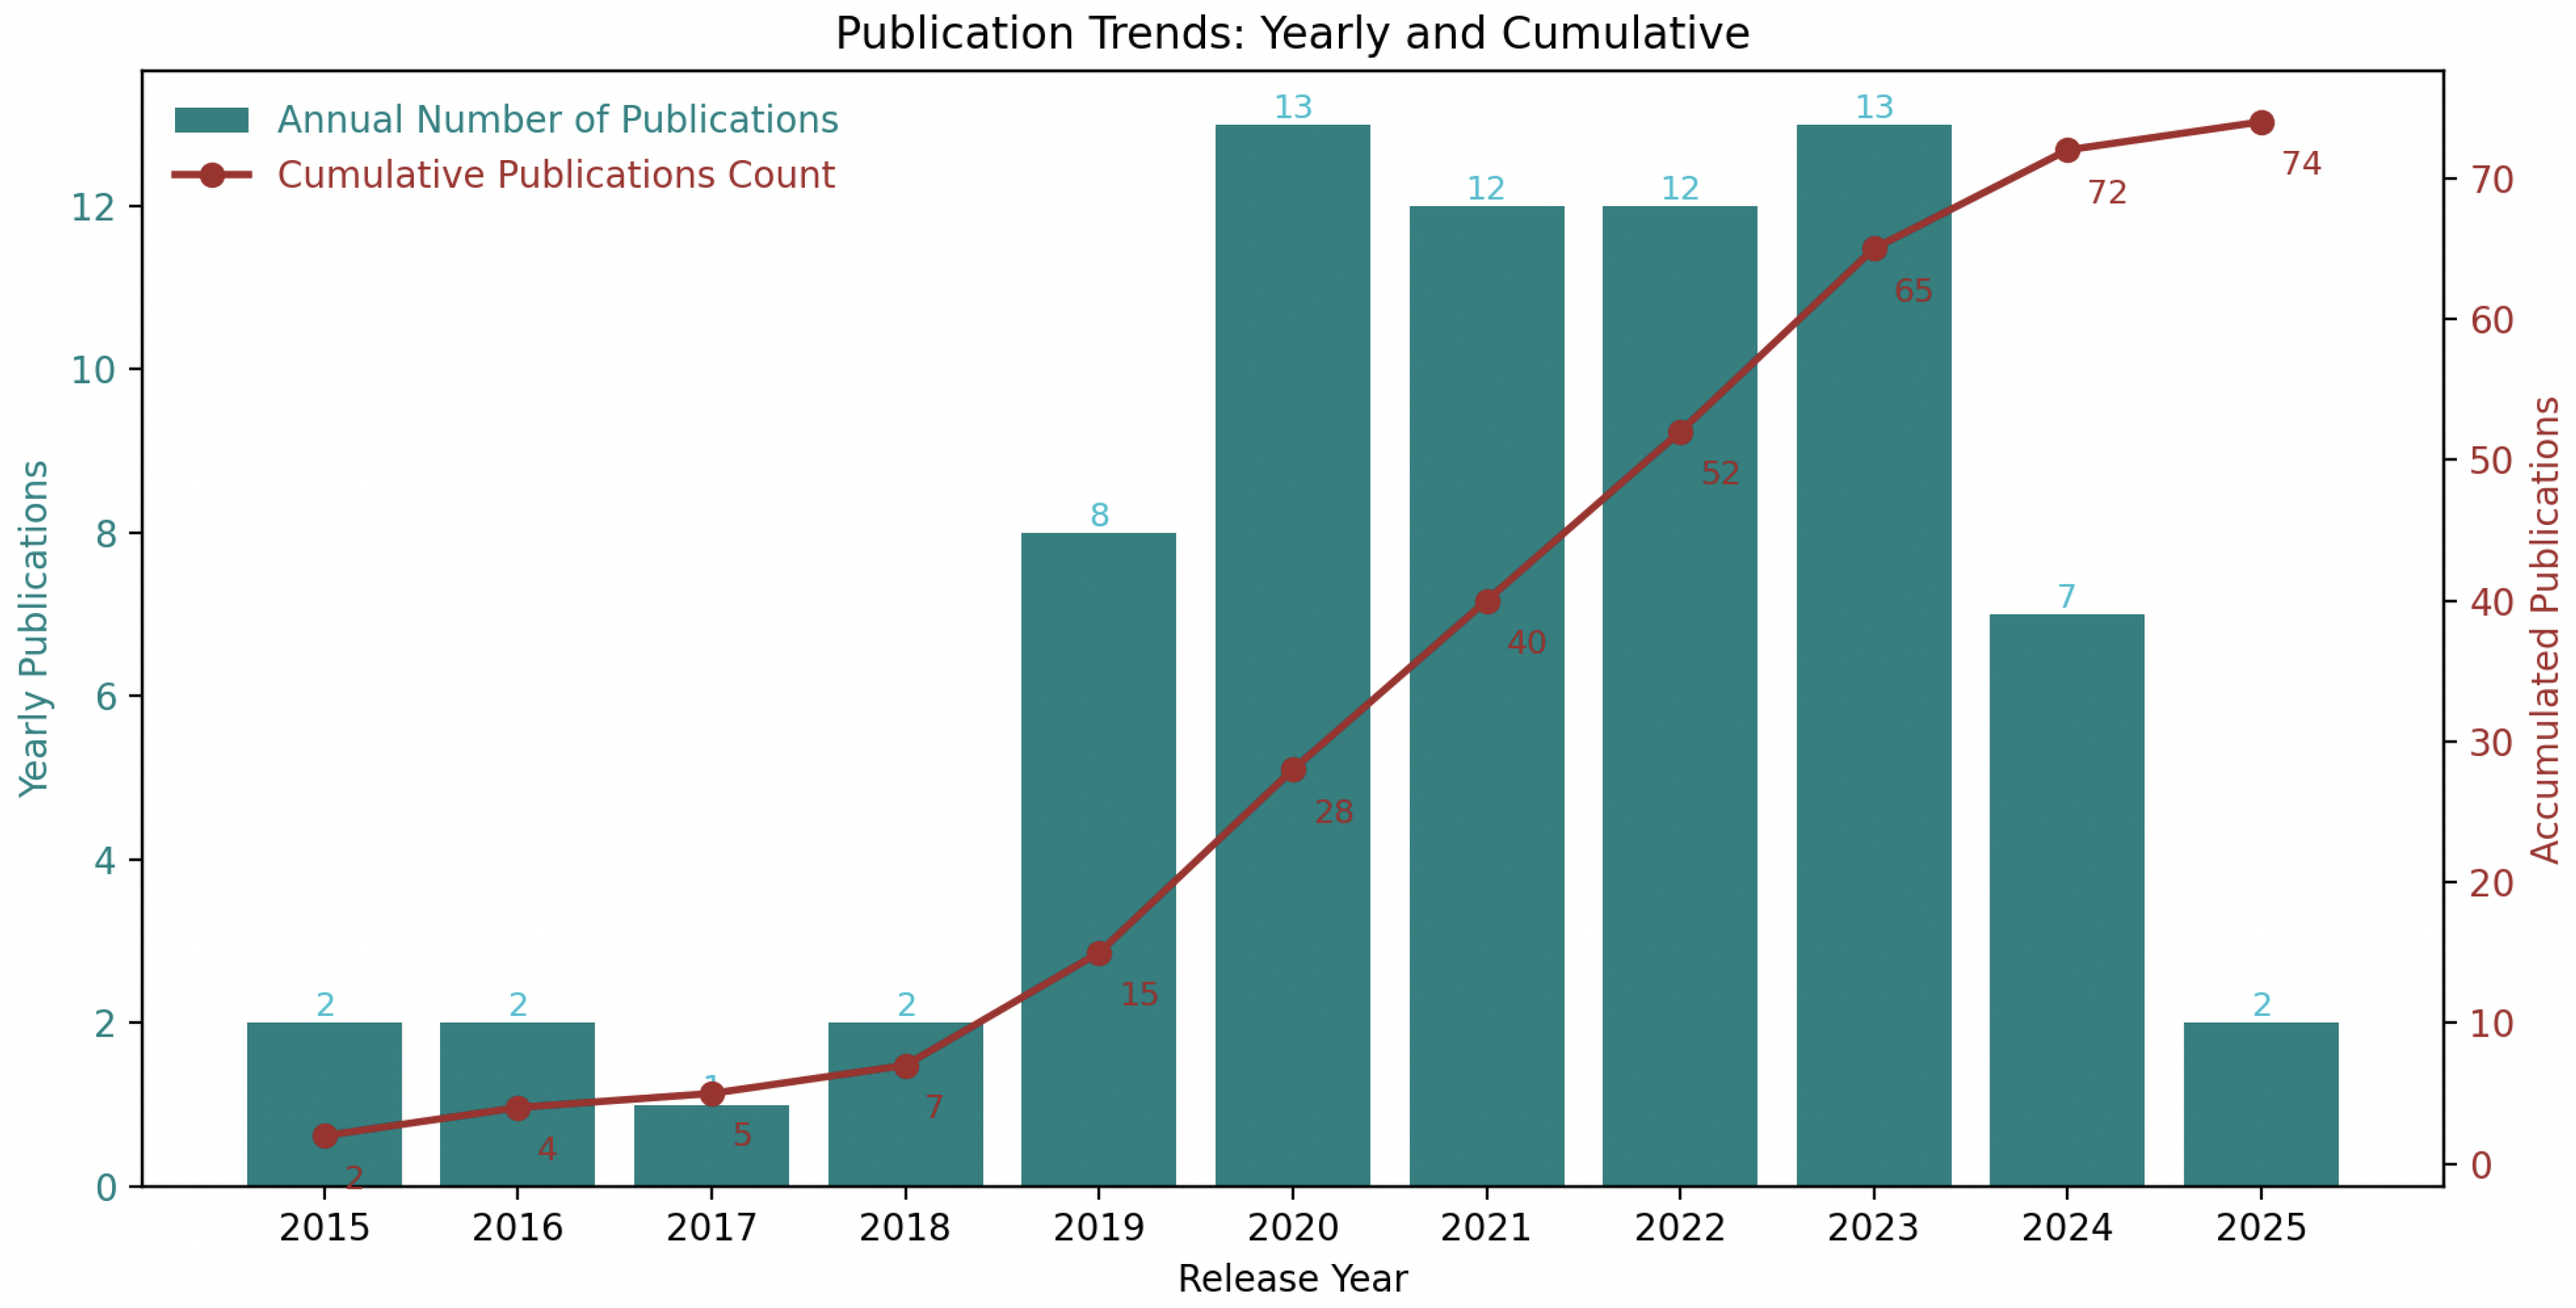
Figure 6.
The Total Number of Publications Grouped by Journal
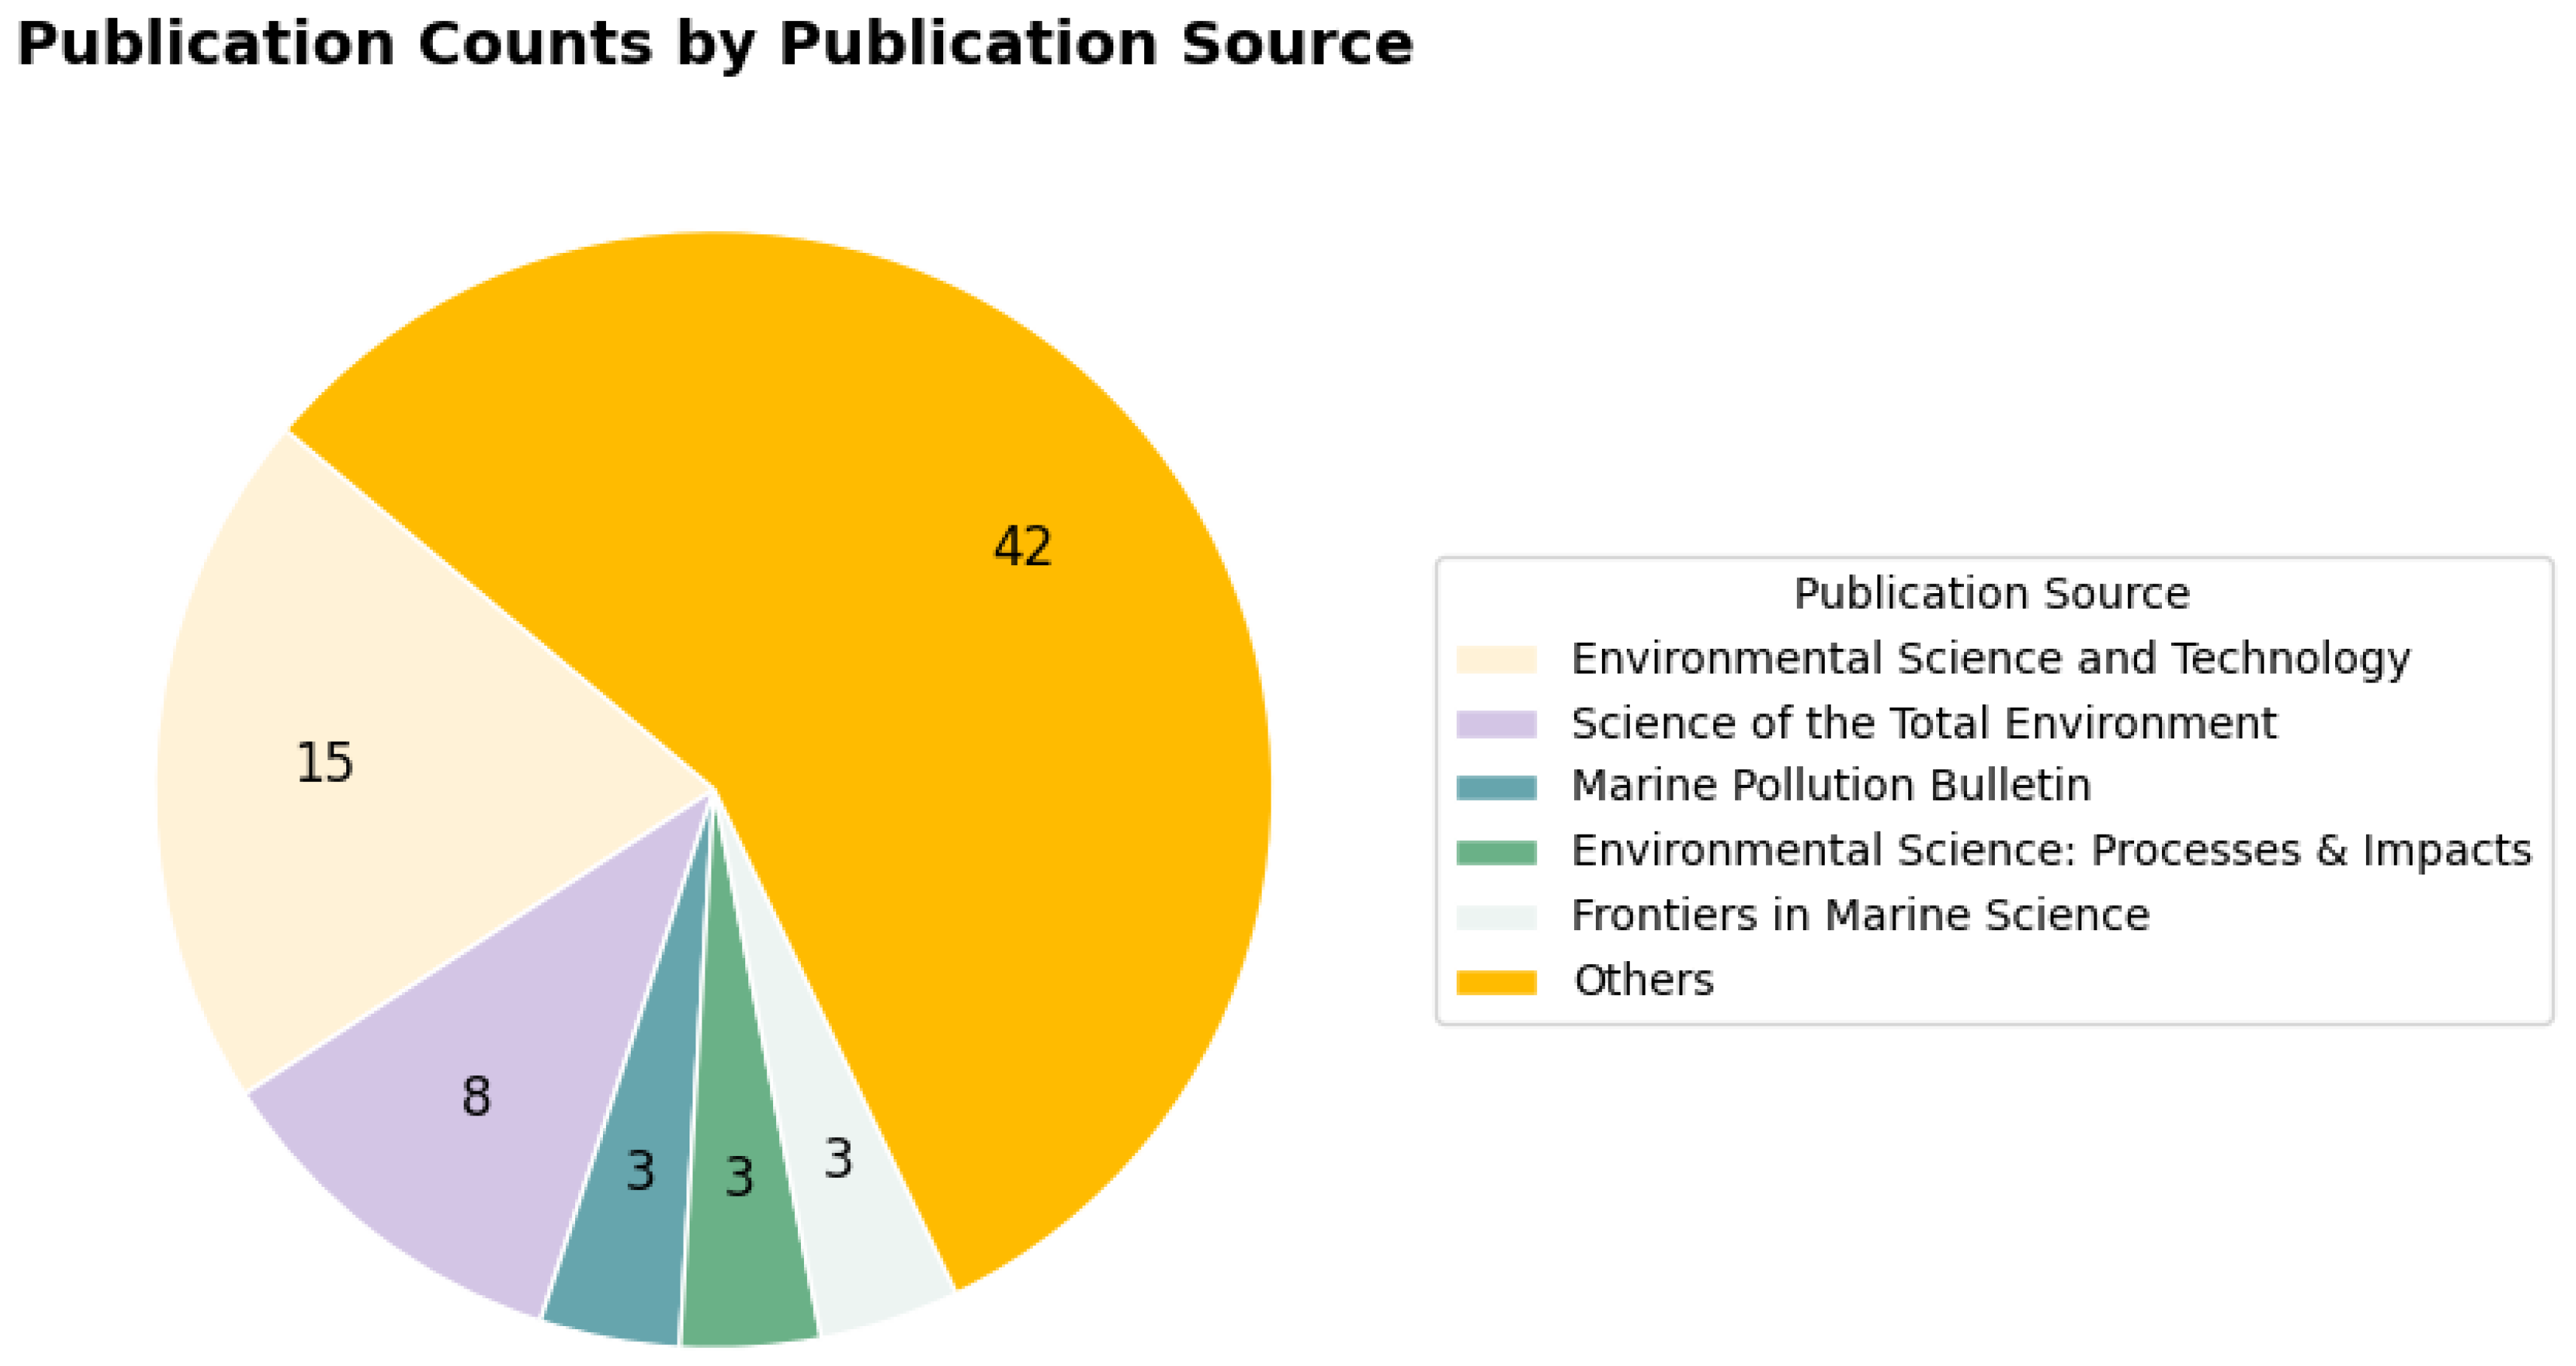
Figure 7.
VOSviewer-Generated Network Map Visualization of Research Topics
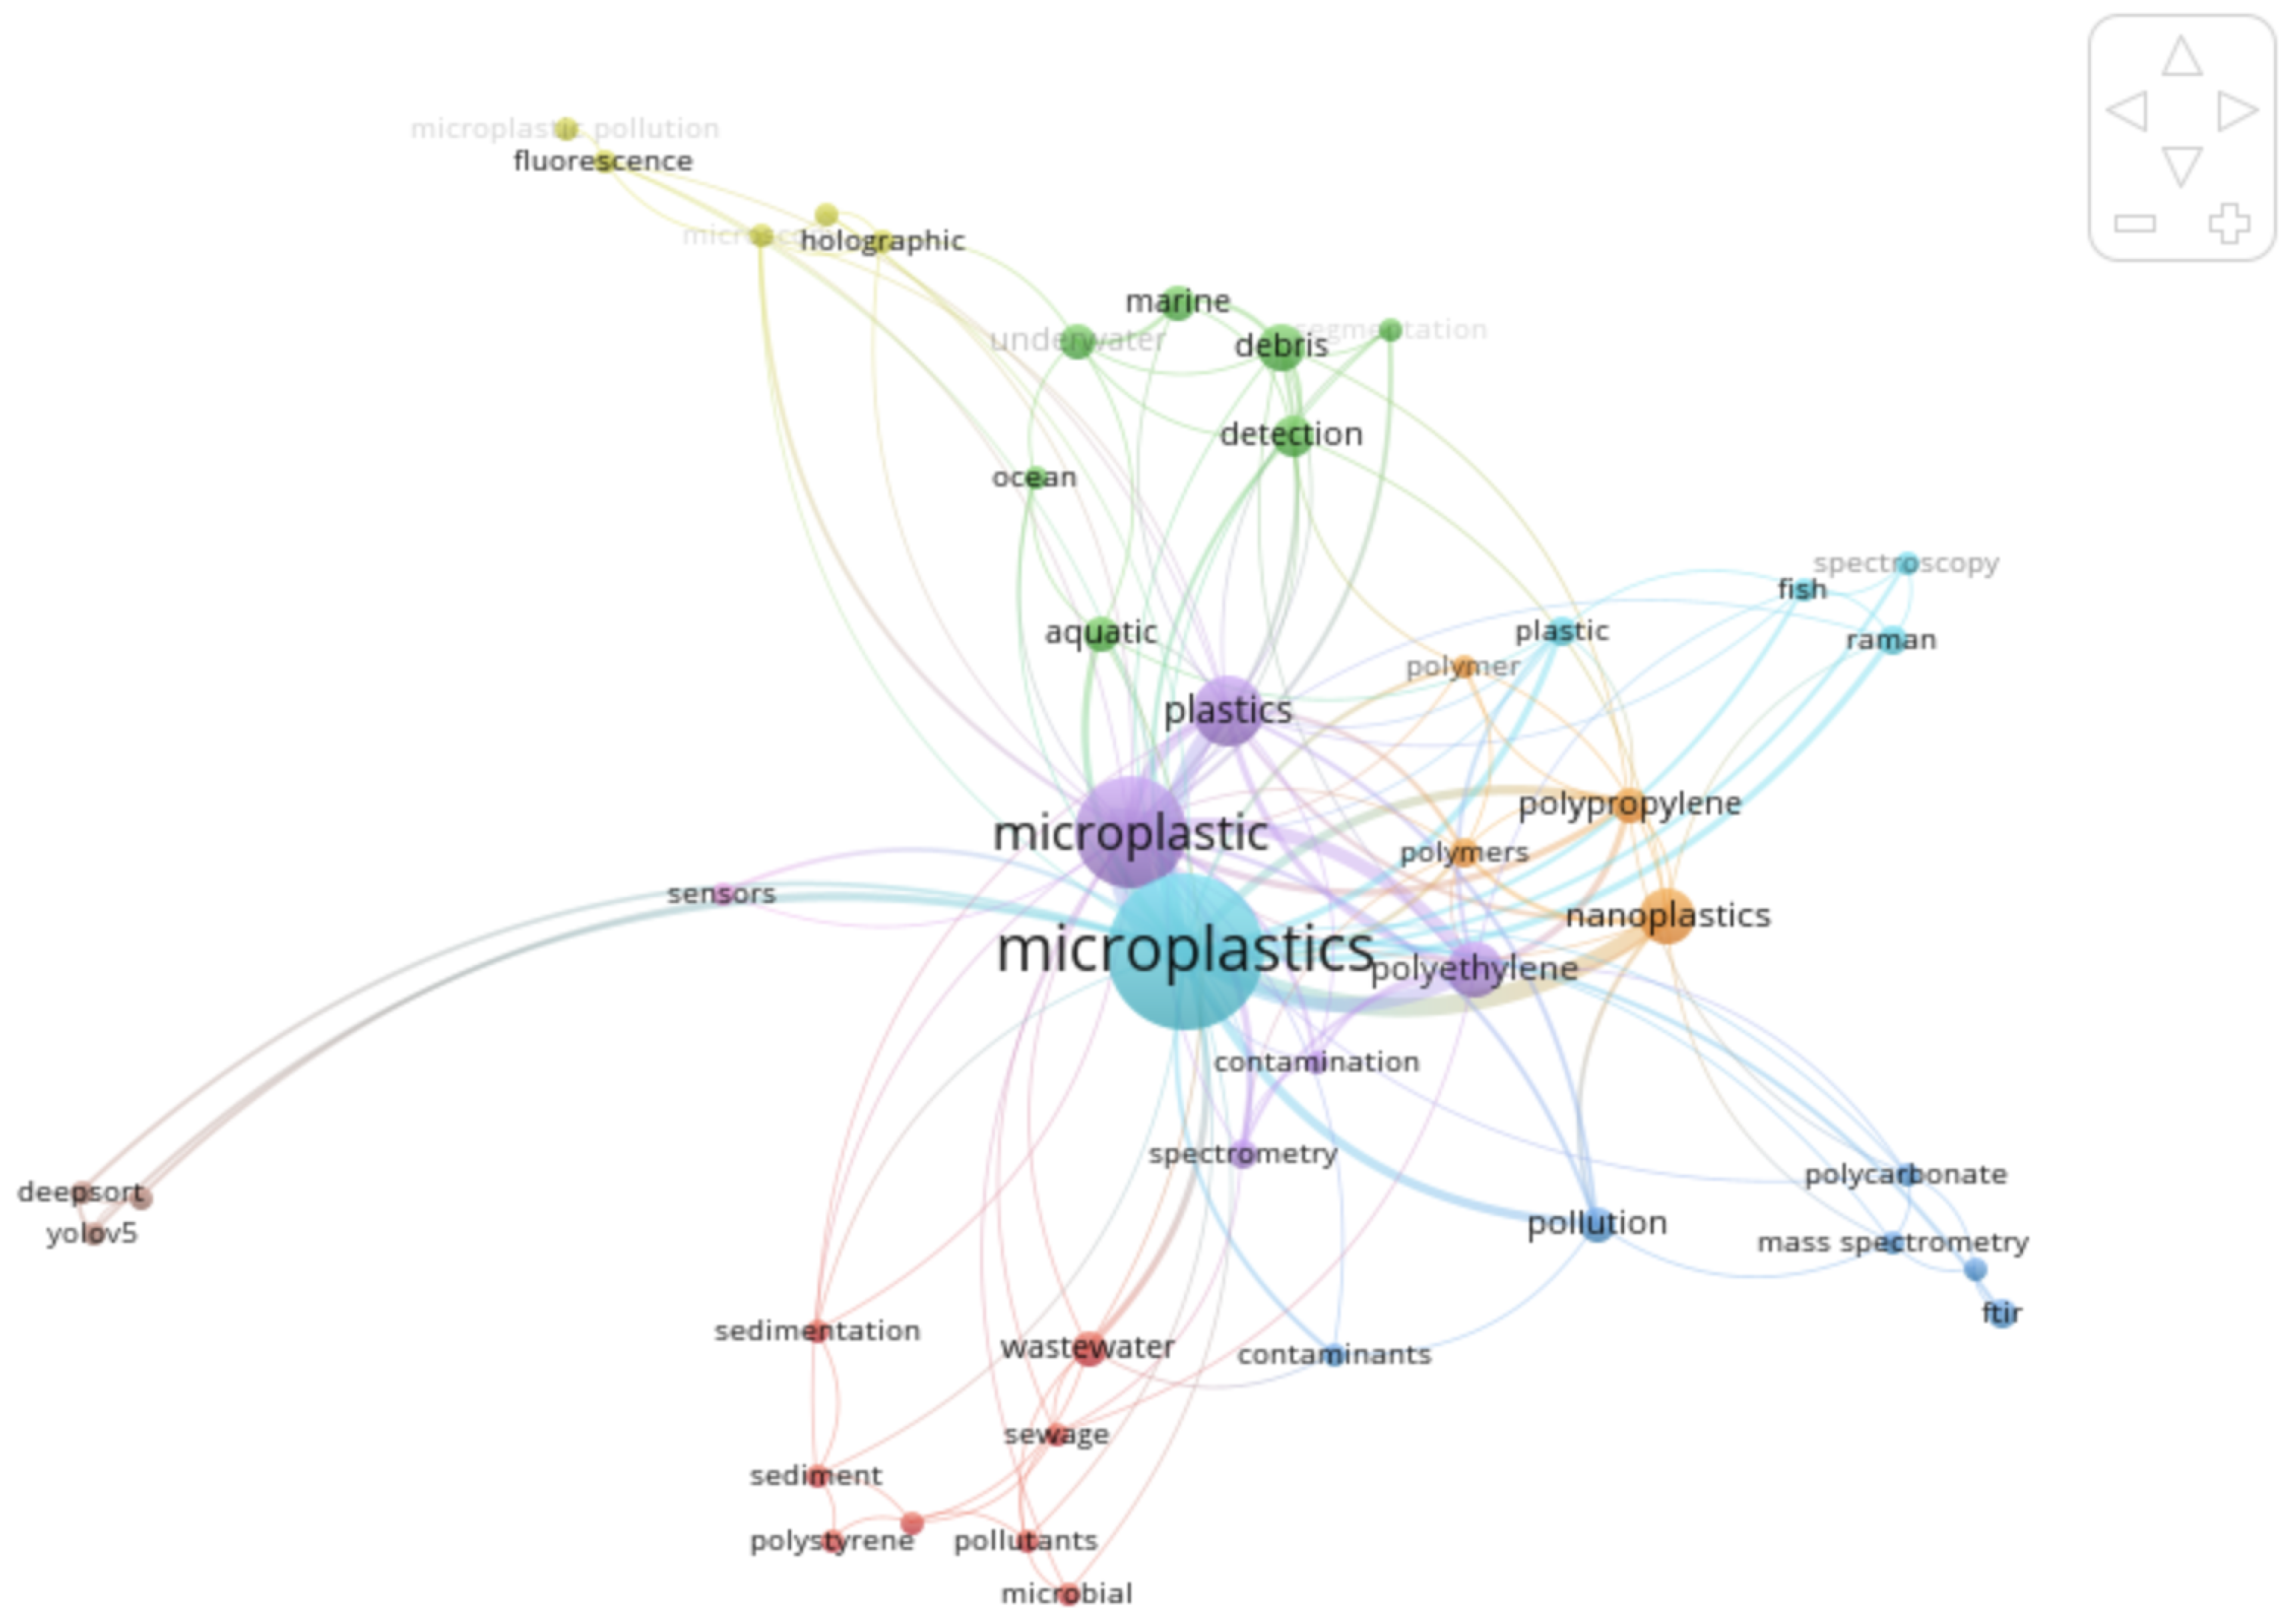
Figure 8.
VOSviewer-Generated Overlay Map Visualization of Research Topics
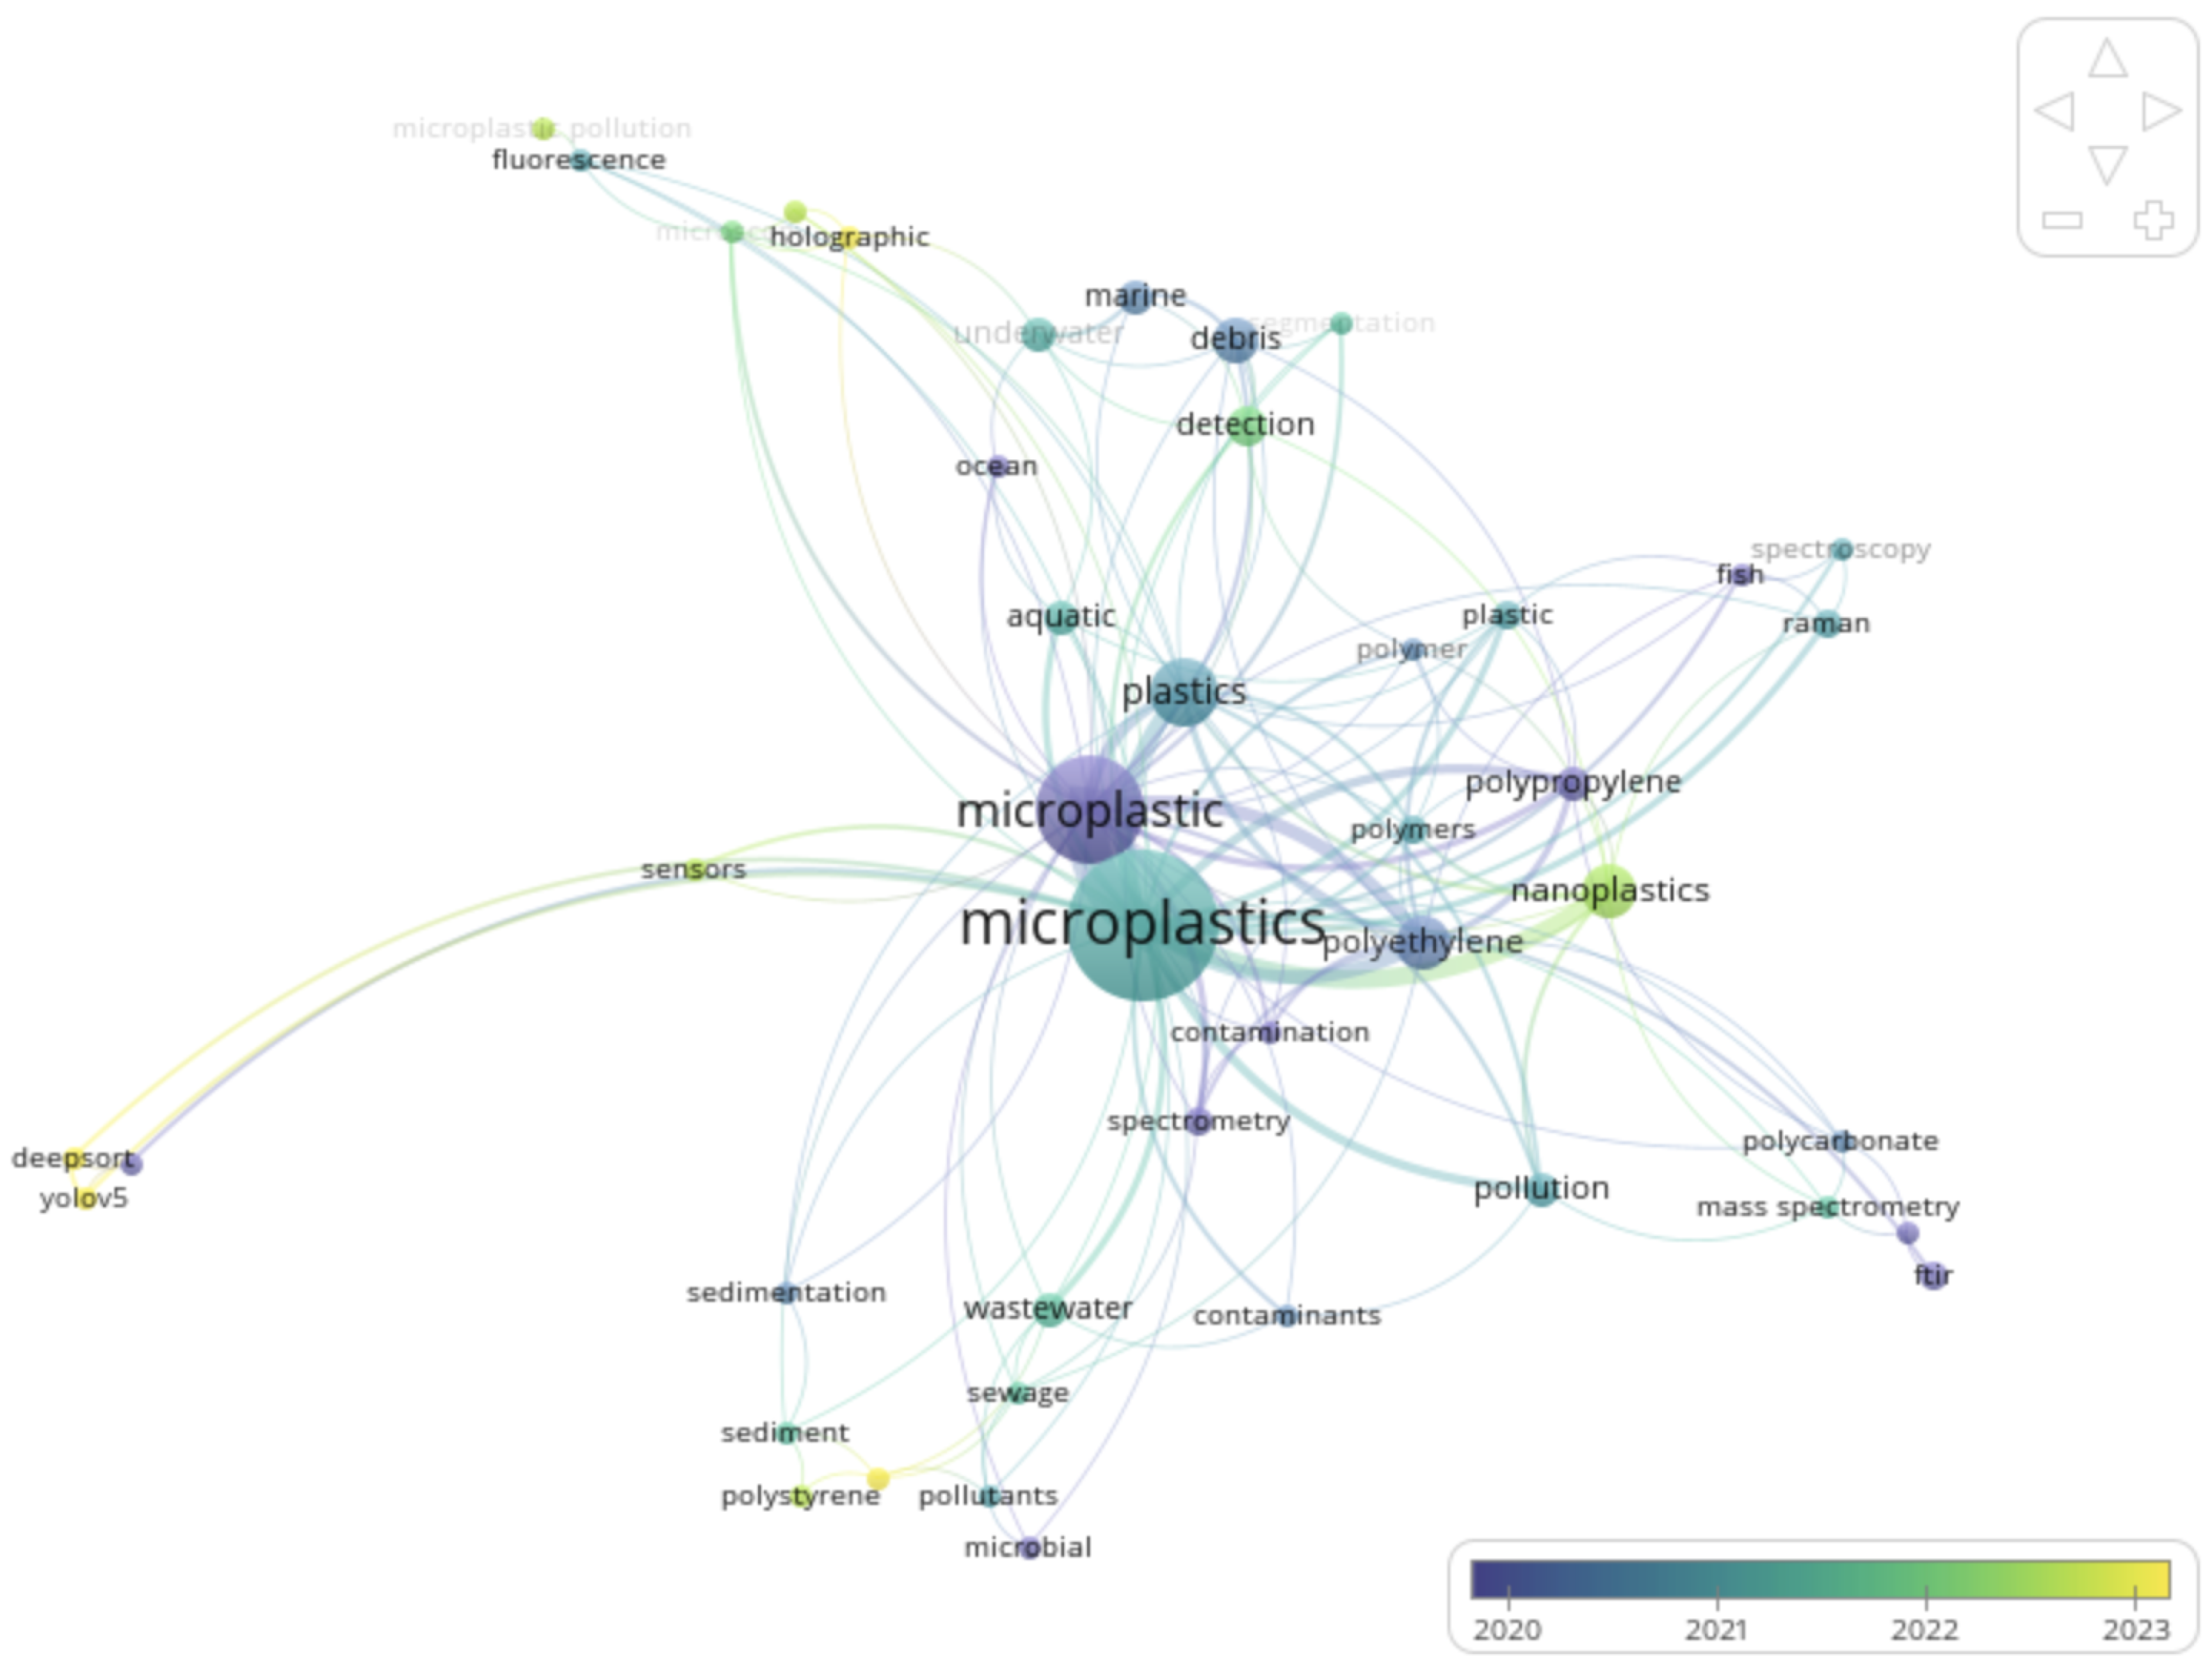
Figure 9.
VOSviewer-Generated Density Map Visualization of Research Topics
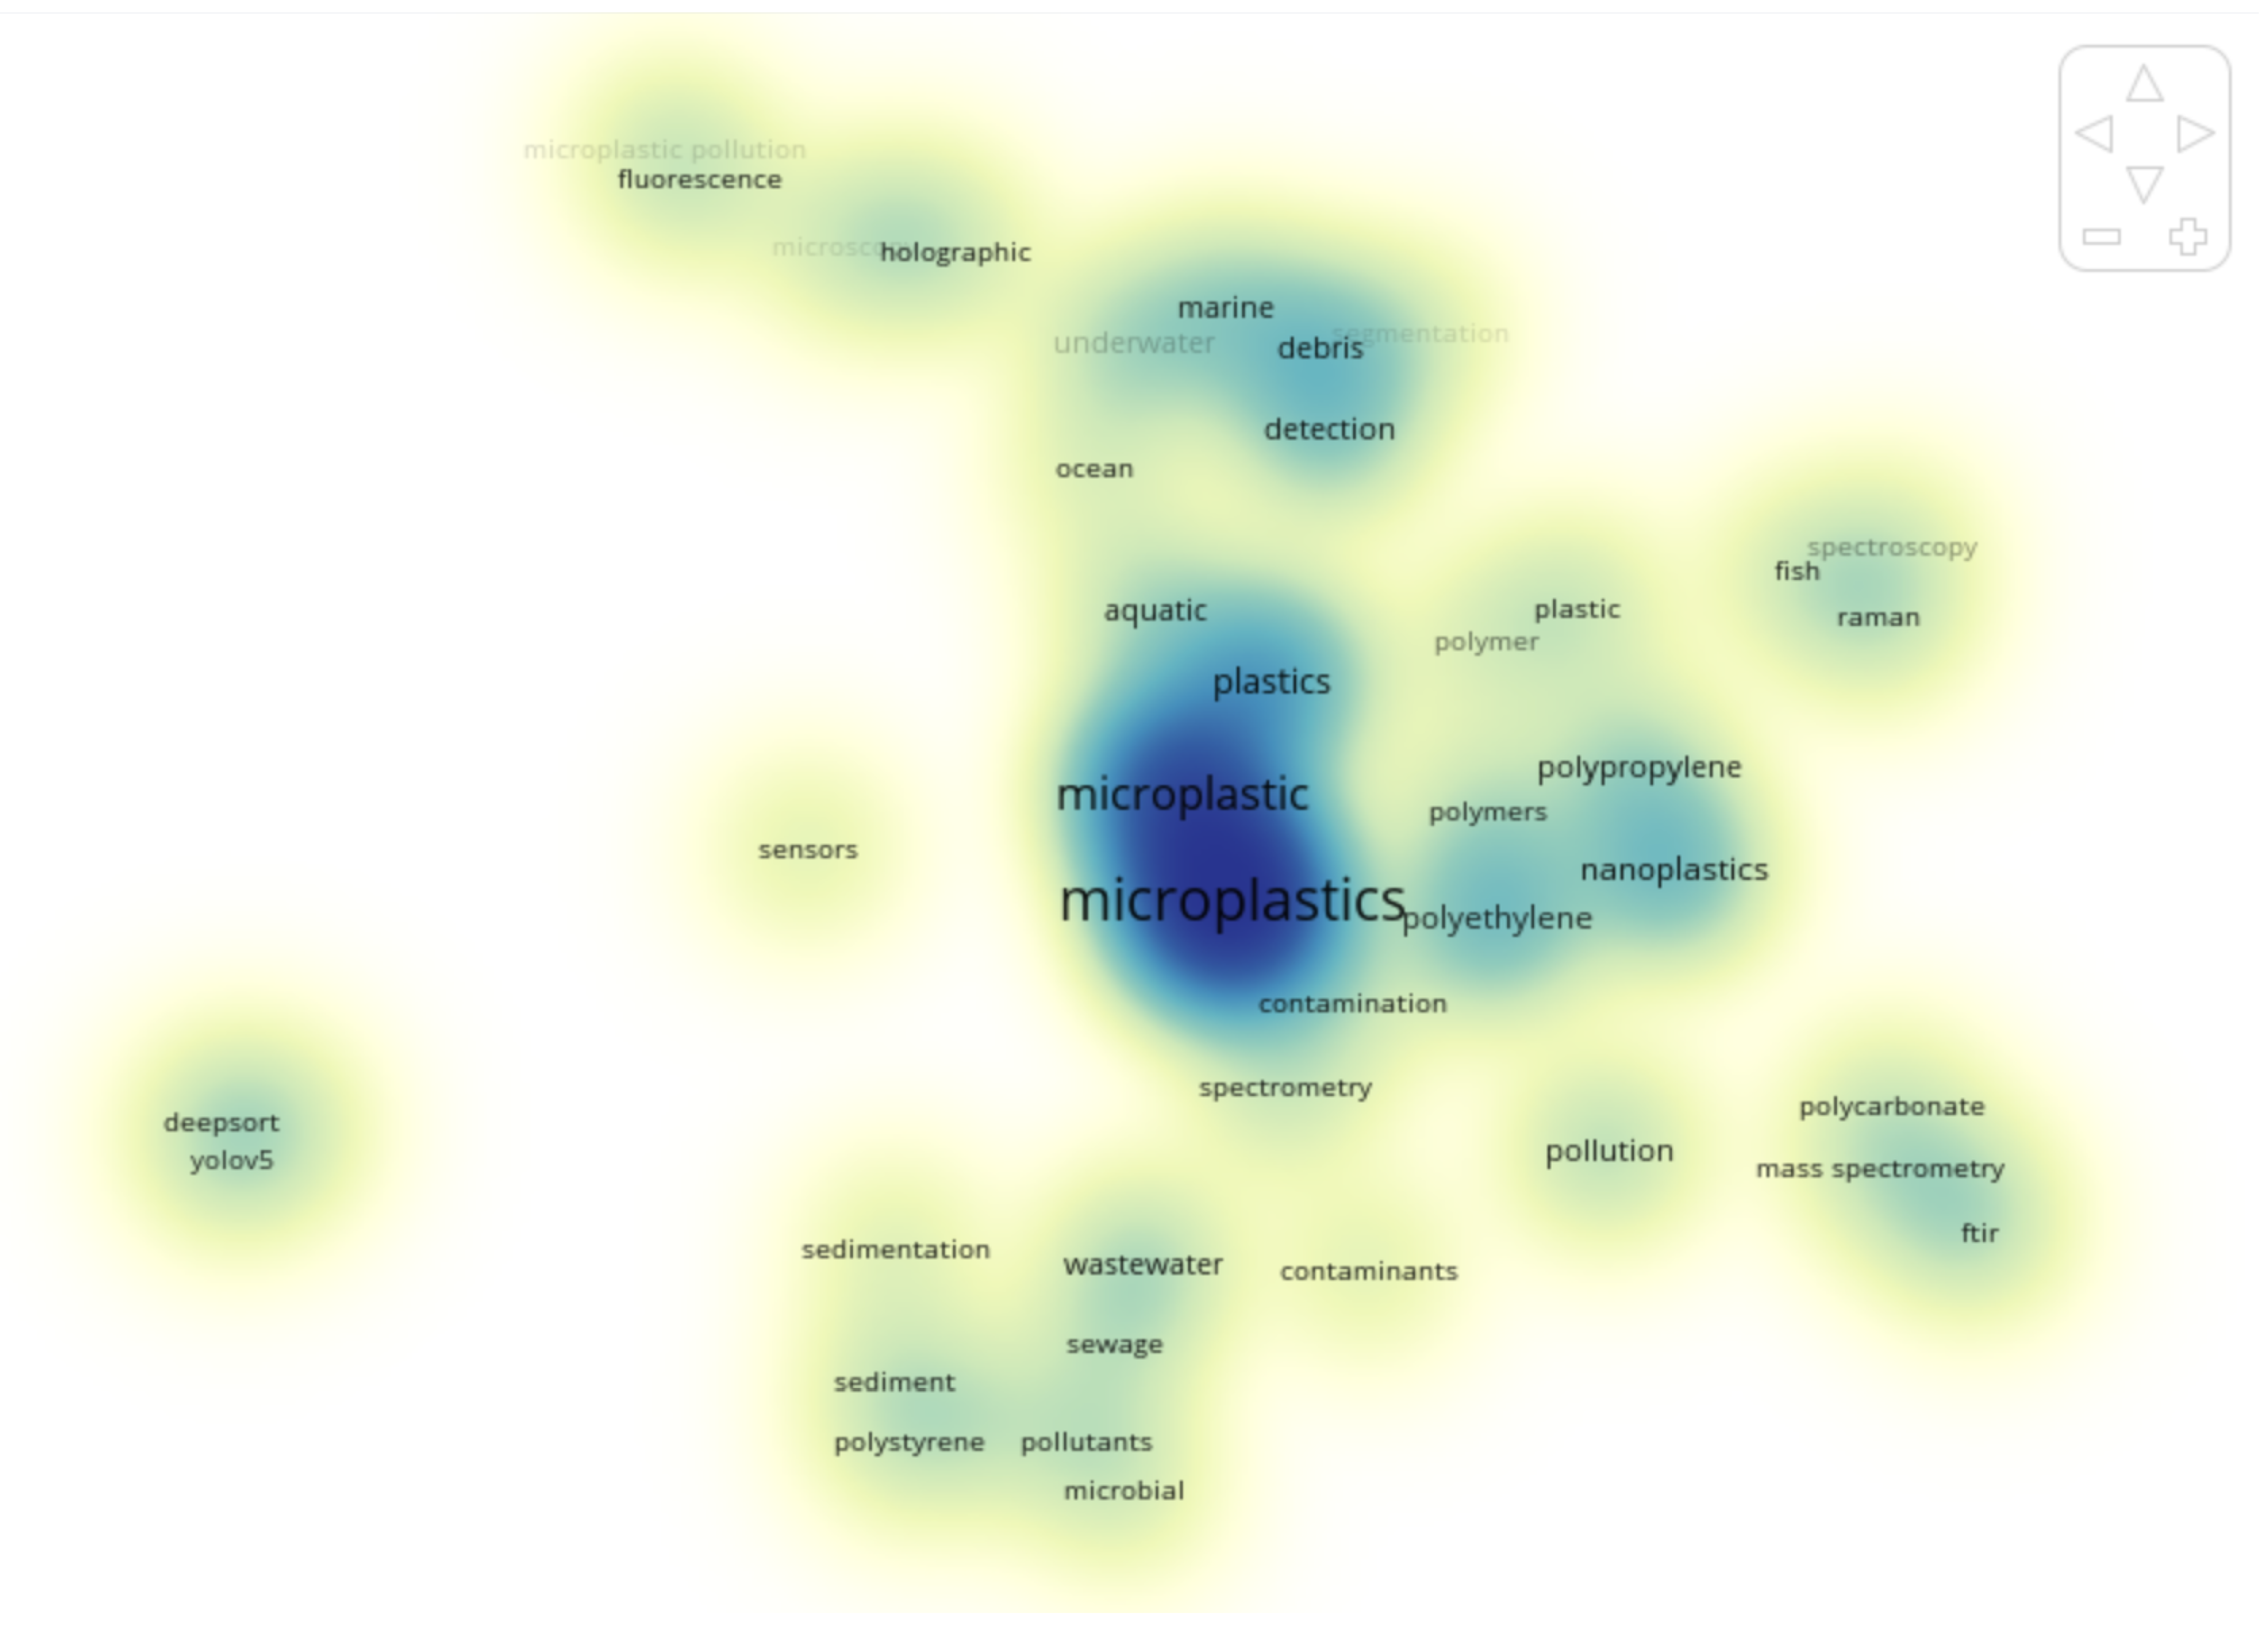

Table 1.
Filtered Journals and Conference Sources Considered for Review.
| Venue Name / Source title |
|---|
| Nature |
| Drones |
| Sensors |
| Science |
| Talanta |
| IEEE Access |
| IEEE Sensors Journal |
| IEEE Internet of Things Journal |
| IEEE Journal of Oceanic Engineering |
| IEEE/OES Autonomous Underwater Vehicles |
| IEEE Transactions on Neural Networks and Learning Systems |
| Nature Communications |
| Environmental Pollution |
| Marine Pollution Bulletin |
| Science of the Total Environment |
| Communications Earth & Environment |
| Environmental Science and Technology |
| Frontiers in Ecology and the Environment |
| International Journal of Intelligent Robotics and Applications |
Table 2.
Papers Included for AUV-Based Detection of Plastics and MPs
| Cited | Year | Authors | Cited | Year | Authors |
|---|---|---|---|---|---|
| [48] | 2023 | Thevar et al. | [49] | 2019 | Rahmati and Pompili |
| [50] | 2022 | Zocco et al. | [51] | 2022 | Wang et al. |
| [52] | 2021 | Hong et al. | [53] | 2023 | Corrigan et al. |
Table 3.
Paper Included for Approaches of MP Detection
| Cited | Year | Authors | Cited | Year | Authors |
|---|---|---|---|---|---|
| [54] | 2022 | Huang et al. | [55] | 2020 | Materić et al. |
| [56] | 2020 | Xu et al. | [57] | 2018 | Eisentraut et al. |
| [58] | 2020 | Ribeiro et al. | [59] | 2017 | Erni-Cassola et al. |
| [60] | 2021 | Dey et al. | [61] | 2019 | Wright et al. |
| [62] | 2016 | Sgier | [63] | 2019 | Wiggin et al. |
| [64] | 2025 | Nihart et al. | [65] | 2021 | Zhang et al. |
| [66] | 2020 | Kaile et al. | [67] | 2020 | Witzig et al. |
| [68] | 2021 | Ye et al. | [69] | 2021 | Baruah et al. |
| [70] | 2023 | Rathore et al. | [71] | 2021 | Evans et al. |
| [72] | 2023 | Xie et al. | [73] | 2020 | Maxwell et al. |
| [74] | 2021 | Aragaw et al. | [75] | 2020 | Müller et al. |
| [76] | 2019 | Wagner et al. | [77] | 2020 | Sancataldo et al. |
| [78] | 2023 | Giardino et al. | [79] | 2022 | Weber et al. |
| [80] | 2024 | Guselnikova et al. | [81] | 2022 | Li et al. |
| [82] | 2022 | Xiang et al. | [83] | 2019 | Hahn et al. |
| [84] | 2022 | Ateia et al. | [85] | 2019 | Leed et al. |
| [86] | 2021 | Lechthaler et al. | [87] | 2023 | Li et al. |
| [88] | 2021 | Liu et al. | [89] | 2022 | Jin et al. |
| [90] | 2023 | Ece et al. | [91] | 2023 | Du et al. |
| [92] | 2023 | Liu et al. | [93] | 2022 | Cingolani et al. |
| [94] | 2023 | Phan et al. | [95] | 2022 | Park and Ahn |
| [96] | 2024 | Canga et al. | [97] | 2022 | Ouyang et al. |
| [98] | 2024 | Du et al. | [99] | 2021 | Shahani et al. |
| [100] | 2022 | Chun et al. | [101] | 2024 | Rede et al. |
| [102] | 2024 | Liu et al. | [103] | 2024 | Faramarzi et al. |
| [104] | 2025 | Rivera-Rivera et al. | [105] | 2023 | Willans et al. |
| [106] | 2024 | Zhang et al. | [107] | 2020 | Kanyathare et al. |
| [108] | 2019 | Zhang et al. |
Table 4.
Papers Included via Manually Search
| Cited | Year | Authors | Cited | Year | Authors |
|---|---|---|---|---|---|
| [11] | 2024 | Li et al. | [109] | 2020 | Sierra et al. |
| [110] | 2024 | Sarker et al. | [111] | 2020 | Biermann et al. |
| [112] | 2016 | Frere et al. | [113] | 2015 | Song et al. |
| [114] | 2023 | Motalebizadeh et al. | [115] | 2019 | Asamoah et al. |
| [116] | 2018 | Zubkov et al. | [117] | 2015 | Löder et al. |
| [118] | 2021 | Tata al. | [119] | 2023 | Sarker et al. |
| [120] | 2020 | Lorenzo-Navarro et al. |
Table 5.
Top Cited Journals with Year Ranges.
| Source Titles | Total Citations | Year Start | Year End |
|---|---|---|---|
| Environmental Science and Technology | 1563 | 2017 | 2023 |
| Marine Pollution Bulletin | 809 | 2015 | 2019 |
| Environmental Chemistry | 528 | 2015 | 2015 |
| Scientific Reports | 312 | 2020 | 2024 |
| Science of the Total Environment | 242 | 2019 | 2024 |
| Environmental Science and Technology Letters | 186 | 2018 | 2018 |
| Environmental Science and Pollution Research International | 164 | 2021 | 2023 |
| Nature Communications | 117 | 2016 | 2024 |
| Frontiers in Marine Science | 113 | 2020 | 2022 |
| Oceanology | 112 | 2018 | 2018 |
| Environmental Science: Processes & Impacts | 89 | 2020 | 2022 |
Table 6.
Morphological-Based MPs Detection Methods
| Method Type | Techniques | References |
|---|---|---|
| Morphological-Based Analysis Methods | Optical Microscopy | [60,68,74,76,86,123] |
| Stereomicroscope | [60,65,69,82,84,96,113] | |
| Fluorescence Microscopy | [59,80,82,96] | |
| SEM | [60,68,69,80,84,85,96,100,116] |
Table 7.
Fluorescence-Based Detection Methods for MPs
| Method Type | Technique | References |
|---|---|---|
| Fluorescence-Based Analysis Methods | Nile Red Stained | [59,63,66,69,73,77–79,89,96] |
| Calcofluor White, Evans Blue and Nile Red Stained | [73] | |
| FLIM | [77,93] | |
| SR-CFM | [77] | |
| UV-Induced Fluorescence Imaging with Automated Software Analysis | [78] |
Table 8.
Spectroscopic Component Analysis Methods for MPs
| Method Type | Technique | References |
|---|---|---|
| SpectroscopicComponent AnalysisMethods | FTIR | [54,60,68,69,76,82–85,89,92,96,100,112,113,116,117] |
| µ-FTIR | [65,67,70,74,96,106] | |
| ATR-FTIR | [64,74,79,86,89,97,116] | |
| Reflectance-FTIR | [105] | |
| FPA-FTIR | [60] | |
| Raman | [59–61,68,69,72,81,82,84,85,94,96,97,100,103,112,116] | |
| µ-Raman | [67,74,89,96,106,124] | |
| SRS | [69] | |
| SERS | [56,80,98,100] | |
| THz | [68] | |
| AFM-IR | [60] | |
| HSI Methods | [68,108,121] | |
| SEM-EDS | [62,64,68,74,76,85] | |
| LDIR | [54,65] | |
| PLM | [60,109] | |
| Kramers–Kronig Analysis | [107] |
Table 9.
Thermal-Based Composition Analysis Methods for MPs
| Method Type | Technique | References |
|---|---|---|
| Thermal-BasedComposition AnalysisMethods | Py-GC-MS | [58,60,64,65,67–69,74,82,84,85,87,89,101,102,116] |
| TED-GC-MS | [57,68,75,84,85,89,100] | |
| TD-PTR-MS | [55] | |
| TGA-FTIR | [60,100] | |
| DSC | [60,68,74] |
Table 10.
Sensor-Based Detection Methods for MPs
| Method Type | Technique | References |
|---|---|---|
| Sensor-Based Analysis Methods | Portable Optical Sensor Combining the Measurement Principle of a Handheld Device and a CCD Camera | [115] |
| Spaceborne Radar | [71] | |
| Plasmonic Sensors | [104] | |
| Fluorescence Biosensors | [104] | |
| Electrochemical Sensor Based on Graphene Electrode | [91,104] | |
| Remote Sensing Method | [111] |
Table 11.
Other Composition Analysis Methods
| Method Type | Technique | References |
|---|---|---|
| Other Composition Analysis Methods | LC-UV | [75] |
| LC-MS/MS | [65,69] | |
| Microfluidics | [90,103] | |
| HPLC | [68,84,101] | |
| Flow Cytometry | [66] | |
| Machine Learning Enhanced Standard Webcam Detection | [110,119,120] | |
| ML-based Intelligent Detection with a Polarization Camera | [11,12] |
Table 12.
In-Situ Detection Methods for MPs
| Method Type | Technique | References |
|---|---|---|
| In-SituComposition AnalysisMethods | Polarized Light Scattering Method | [88] |
| Surface-Functionalized THz Microfluidic Metamaterials Combined with In-Situ THz | [95] | |
| Microfluidic Approach Combined with Surface Nanodroplets and Raman | [103] | |
| Portable Microfluidic Triboelectric Sensor | [114] | |
| In-Situ Morphological | In-Situ Underwater Microscopy | [99] |
Table 13.
Keyword Clusters with Total Link Strength and Occurrences
| Description | Keywords | Total Link Strength | Occurrences |
|---|---|---|---|
| Cluster 1 (8 Keywords) | microbial | 3 | 2 |
| pollutants | 5 | 2 | |
| polystyrene | 2 | 2 | |
| sediment | 5 | 2 | |
| sedimentation | 4 | 2 | |
| sewage | 6 | 2 | |
| sludge | 5 | 2 | |
| wastewater | 9 | 4 | |
| Cluster 2 (7 Keywords) | aquatic | 9 | 4 |
| debris | 12 | 6 | |
| detection | 9 | 5 | |
| marine | 6 | 4 | |
| ocean | 4 | 2 | |
| segmentation | 5 | 2 | |
| underwater | 7 | 4 | |
| Cluster 3 (6 Keywords) | contaminants | 4 | 5 |
| ftir | 3 | 3 | |
| mass spectrometry | 5 | 2 | |
| pet | 3 | 2 | |
| pollution | 12 | 4 | |
| polycarbonate | 6 | 2 | |
| Cluster 4 (5 Keywords) | fluorescence | 5 | 2 |
| holographic | 4 | 2 | |
| microplastic pollution | 1 | 2 | |
| microscopy | 7 | 2 | |
| polarization | 4 | 2 | |
| Cluster 5 (5 Keywords) | contamination | 7 | 2 |
| microplastic | 64 | 26 | |
| plastics | 32 | 12 | |
| polyethylene | 30 | 8 | |
| spectrometry | 10 | 3 | |
| Cluster 6 (5 Keywords) | fish | 7 | 2 |
| microplastics | 95 | 47 | |
| plastic | 7 | 3 | |
| raman | 7 | 3 | |
| spectroscopy | 4 | 2 | |
| Cluster 7 (4 Keywords) | nanoplastics | 21 | 8 |
| polymer | 7 | 2 | |
| polymers | 11 | 3 | |
| polypropylene | 16 | 4 | |
| Cluster 8 (3 Keywords) | deepsort | 5 | 2 |
| environmental monitoring | 4 | 2 | |
| yolov5 | 5 | 2 | |
| Cluster 9 (1 Keywords) | sensors | 3 | 2 |
Table 14.
Potential AUV-Based Microplastic Detection Technologies
| Category | MPs Detection Method | Reference |
|---|---|---|
| Spectroscopy | HSI Methods | [[68,108,121]] |
| Sensors | Plasmonic Sensors | [104] |
| Fluorescence Biosensors | [104] | |
| Electrochemical Sensor Based on Graphene Electrode | [[91,104]] | |
| Others | Portable Optical Sensor Combining the Measurement Principle of a Handheld Device and a CCD Camera | [115] |
| Machine Learning-Based Intelligent Detection with a Polarization Camera | [[11,12]] | |
| In-Situ | Polarized Light Scattering Method | [88] |
| Surface-Functionalized THz Microfluidic Metamaterials Combined with In-situ THz | [95] | |
| Microfluidic Approach Combined with Surface Nanodroplets and Raman | [103] | |
| Portable Microfluidic Triboelectric Microfluidic Sensor | [114] | |
| In-Situ morphological analysis methods: Underwater Microscopy | [99] |
Disclaimer/Publisher’s Note: The statements, opinions and data contained in all publications are solely those of the individual author(s) and contributor(s) and not of MDPI and/or the editor(s). MDPI and/or the editor(s) disclaim responsibility for any injury to people or property resulting from any ideas, methods, instructions or products referred to in the content. |
© 2025 by the authors. Licensee MDPI, Basel, Switzerland. This article is an open access article distributed under the terms and conditions of the Creative Commons Attribution (CC BY) license (http://creativecommons.org/licenses/by/4.0/).
Copyright: This open access article is published under a Creative Commons CC BY 4.0 license, which permit the free download, distribution, and reuse, provided that the author and preprint are cited in any reuse.


