Submitted:
12 July 2025
Posted:
14 July 2025
You are already at the latest version
Abstract
The larvae of five species of myctophids [Benthosema suborbitale, Ceratoscopelus townsendi, Hygophum taaningi, Myctophum selenops, and Notolychnus valdiviae] from the eastern Gulf of Mexico were examined to estimate energetic and prey requirements during early growth. Age was determined from examination of sagittal otoliths. Larval period ranged from 36 days for the rapidly growing C. townsendi to 67 days for the diminutive N. valdiviae. Growth rate ranged from 0.14mmSL day-1 for B. suborbitale to 0.38 mmSL day-1 for C. townsendi. Energetic demands were estimated from a slightly modified version of the equation for the bioenergetic model where; Qc = Qg + Qs + Qm where Qc = energy consumed, Qg = food energy converted into potential energy through growth, Qs = includes energy lost in feces, excretions, and secretions, and Qm = includes energy consumed in routine metabolism [Qr] and energy consumed in active metabolism [Qa]. Proximate and elemental composition of larvae was measured and converted to calories using standard factors. Daily growth in calories was estimated from age and growth information combined with chemical composition [protein, lipid, and carbohydrate]. Time of active metabolism was determined from information on gut fullness evaluated during a diel cycle. Metabolic costs were then estimated from the measured respiratory activity of other Atlantic tropical-subtropical species. Caloric requirements for growth varied among species and size of larvae, but the greatest variation resulted from assumption regarding assimilation efficiency. Daily requirements ranged from less than one to 33 day-1. Using known caloric value of preferred food, prey requirements were calculated for larvae by matching larval size to prey of the appropriate size and taxa. From these data, daily prey requirements ranged from <10 to >300 items.
Keywords:
larval growth
; bioenergetics
; zooplankton
; ichthyoplankton
; lanternfish
; Myctophidae
; proximate composition
; elemental composition
; trophodynamics
1. Introduction
Mesopelagic fishes dominate the oceanic fish fauna in terms of the number of species and individuals [1,2,3]. Lanternfishes share this pelagic environment, are the most abundant of the vertically migrating mesopelagic fish groups [4,5,6,7,8,9,10], and play a primary role in the vertical transport of organic matter in the world’s oceans [10,11,12,13]. Growth and development of vertically migrating myctophids is similar to that of ecologically and morphologically similar shallow water species [13,14]. Their populations support a wide variety of predators including cephalopods [15], other fishes [16,17,18,19], sea birds [20,21], penguins [22,23], pinnipeds [24,25], cetaceans [26,27], and some human populations indirectly as feed for our livestock [28,29,30,31].
As the most abundant vertical migrator in the world’s oceans, understanding lanternfish ecology is critical in understanding the transfer of carbon and energy in the largest ecosystems on the planet, the ocean pelagial. Further, understanding the transfer of energy as Ash Free Dry Weight [AFDW], calories (cal), or energy density [ED]] and matter [as proximate and chemical composition] is essential for understanding the trophic transfer through pelagic habitats [32,33,34,35]. The ED of postmetamorphic lanternfishes has been reported from tropical-subtropical populations [33,34,35] to polar regions [32]. Energy content is variable, changing with food availability [33,34,35,36,37], depth of occurrence [35], and species within the family [32]. There is no comparable information for the larval stages of lanternfishes, a major component of pelagic ichthyoplankton assemblages.
Larval growth and survival have been identified as critical for understanding adult size and structure [38,39,40,41,42,43,44,45]. Because enhanced survival and growth can have a dramatic impact on adult year class strength [38,46,47,48,49] there has been a focus on early life history events to address problems in fisheries [50]. The emphasis on fisheries resulted in an emphasis on the temperate commercially important coastal species [51,52,53,54,55,56,57,58] that exhibit a wide range of growth rate [46]. Growth of these species varies because of a complex mixture of intrinsic [genetic] and extrinsic [temperature, food availability] factors [42]. Over the past several decades, we have learned much about the early life history of these important coastal species see [40,50,54,59] for reviews, but there are relatively few studies of open ocean ichthyoplankton.
In the epipelagic zone, larvae of the family Myctophidae are abundant members of the ichthyoplankton, ranging from about 45-70% of all larvae collected [60,61,62,63,64,65,66]. Lanternfish larvae are at least an order of magnitude greater in abundance than adults in the eastern Gulf of Mexico [67] suggesting that larval mortality is an important factor in determining adult population size and structure, thus meeting energetic requirements during early growth is essential. Although there is still much to learn, information on larval feeding ecology, [68,69,70,71] and age and growth [14,72,73] have increased our understanding of this ecologically important group of vertebrates, but energy flow has not been examined.
The purpose of this study is to estimate the energetic demand for metabolism and growth during early life of larval myctophids and in turn, the prey required for larval growth to metamorphosis of representative members of the family. The trophodynamics of abundant larval lanternfishes in the eastern Gulf of Mexico were assessed from the examination of larval feeding chronology [69] age and growth [14] combined with proximate and chemical composition as reported here. Estimates from these combined studies can also be used to evaluate larval recruitment to the resident myctophid populations. Additionally, from the energetic information, we can generate approximations of energy available in myctophid ichthyoplankton to tertiary consumers, which will lead to a better understanding of energy flow in oceanic ecosystems. This is a companion study the ecology of postmetamorphic lanternfishes [6,12,13,67,74,75,76]. Thus, these results are part of a larger project initiated to provide a detailed analysis of the myctophid assemblage in the eastern Gulf of Mexico. This research adds an estimate of the calories required for growth towards transition to juveniles when these fishes begin their diel vertical migrations.
2. Materials and Methods
All samples were collected within 20 nautical miles of 27oN, 86oW. The hydrographic conditions are typical of vertically stratified oligotrophic environments [77]. The zooplankton and micronekton communities of the area have been extensively studied [see 75, 74,75,76,77,78,79,80 and references therein]. Net tows were made hourly during four summer cruises over a period of four years, representing over a month of daily sampling [14,69]. Ichthyoplankton was collected using two 505 µm mesh plankton nets, suspended side by side within a modified Tucker trawl frame [81]. These nets had a mouth opening of 0.56m2 per net, and a length to mouth ratio of 7:1. Investigations in other areas [62,63] and preliminary investigations in the eastern Gulf of Mexico revealed that myctophid larvae were concentrated within the upper 200m of the water column, therefore, sampling was concentrated within this zone. Fish larvae were sorted immediately from the catch, identified, measured to the nearest 0.1mm standard length [SL], and frozen in individually sealed Nalgene® capsules. Larvae were separated into three groups. One group of larvae was used for estimates of age and growth [14], the second for dry weight measurement, and the third for proximate and elemental composition.
To estimate the energetic demands [Qc] of lanternfish larvae, the bioenergetics of the most abundant species [Benthosema suborbitale, Ceratoscopelus townsendi, Hygophum taaningi, Myctophum selenops, and Notolychnus valdiviae, [hereafter referred to as representative species] was evaluated. Bioenergetic models have been used to determine the energy budget of both adult [82,83] and larval [85,86,87,88,89,90,91] fishes. The following is a slightly modified [92] version of the equation for the bioenergetic model which has been discussed in detail [93,94,95]:
Qc = Qg + Qs + Qm
where.
Qc = energy consumed
Qg = food energy converted into potential energy through growth
Qs = energy lost in feces, excretions, and secretions
Qm = energy consumed in routine metabolism [Qr] and energy consumed in active metabolism [Qa].
The calculation of energy converted to potential energy through growth [Qg] requires knowledge of growth rate [14], increase in biomass, and chemical composition. Protein, lipid, and carbohydrate composition were determined for larvae of the representative species. Protein content was determined by a slightly modified version [see 92] of the method developed by Lowrey et al. [96]. Lipid content was quantified following the methods of Bligh & Dyer [97] and carbohydrates by the methods of Dubois et al. [98]. Dry weight was measured by drying formerly frozen larvae at 60oC and weighing individuals on a Perkin-Elmer Autobalance AD-2 in a temperature and humidity-controlled chamber. Larvae were measured to the nearest 0.1mmSL and weighed to the nearest 0.001mg. Daily growth in calories [Qg] was estimated from age and growth information [14] combined with chemical composition [protein, lipid, and carbohydrate] using the following conversions; proteins contain 5.7 calories mg-1, lipids contain 8.7 calories mg-1, and carbohydrates 4.2 calories mg-1 [99].
Routine respiration [Qr] was not directly measured for lanternfish larvae but respiration rates for the larvae of a variety of other tropical to subtropical species were in close agreement [34,87,88,91]. To approximate the respiratory rates of the five representative lanternfishes, the respiration during routine metabolism for larvae of similar morphology and diet [69] were matched to the measured values [91] of other tropical-subtropical species. Respiration [µl O2 µgDW-1 hour-1] was converted to calories using the oxycalorific equivalent of 0.0046 calories µl-1 O2 [99]. It was assumed that active [=feeding] metabolism was twice routine metabolism [99], estimated mean ratio of active to routine metabolic rate [1.7 + 0.4] [99] and an estimated factor of 2.5 to convert routine to active metabolism for pelagic fishes [100]. Time of active metabolism was estimated from feeding incidence determined from gut fullness evaluated during a diel cycle [69]. Daily cost of metabolism was estimated from the equation [91]:
Qm = [2m[t1] + m[t2]]W
where;
Qm = the 24-hour metabolic cost in calories
m = routine metabolic rate [cal µg-1 h-1]
W = dry weight of larvae [µg]
t1 = hours in feeding activity
t2 = non-feeding hours.
Energy lost through feces, excretions, and secretions [Qs] can be a major source of energy loss for fish larvae [91,101,102]. Thus, prey assimilation, or the percentage of food energy used for growth and activity, is highly variable. An average loss through defecation of 27% was measured for young carnivorous fishes [99]. Losses as high as 83% [91,103] and as low as 8% [87] have been reported for some marine fish larvae. Therefore, rather than choose one value, calculations of daily ration included minimum, average, and maximum values for this energy loss. Caloric requirements of the larvae [Qc values] were calculated at three levels according to the range of published assimilation values where the calculation of QcMin assumes a high assimilation [thus a lower prey requirement] of 92%, QcAvg assumes an average assimilation of 73%, and QcMax assumes a low assimilation of 18%. Losses due to metabolic excretions [urine and other metabolic fluids] are reported to be considerably lower, ranging from 1-10% [99]. This potential loss was not separately included in these calculations because of the wide range of loss calculated for assimilation values.
Caloric value of prey was determined from gut analysis [69]. Individual prey items were counted, measured, and identified. Wet mounts were made by pipetting small organisms [< 200µm] onto glass slides for measurement at 100 or 400X magnification. Volume of organisms was estimated from the closest geometric form. Calculated volume was converted to dry weight using a standard relation to volume [104] for soft bodied [non- crustacean] organisms. Dry weight of copepods and other crustaceans was calculated from dry weight to cephalothorax length relations of copepods collected from the same location in the eastern Gulf of Mexico [Conley & Hopkins, unpublished data]. Caloric value was determined from an average conversion factor of 0.0059 calories µgDW-1.
3. Results
Growth of the representative lanternfish larvae was previously detailed [14]. Food energy converted to potential energy through growth [Qg] was estimated using the daily increase in standard length [from otolith microincrements], the relationship of biomass [as dry weight] to length, and the energetic value of tissue from its chemical composition [Table 1]. Analysis of chemical composition [Table 1] revealed that AFDW as percent of

Table 1.
Chemical composition of the five representative species of lanternfish larvae.
| Species | AFDW (% DW) |
Protein (% AFDW) |
Lipid (% AFDW) |
Carbohydrate (% AFDW) |
| Benthosema suborbitale | 94.3 | 55.4 | 22.8 | 1.0 |
| Ceratoscopelus townsendi | 86.7 | 48.9 | 13.6 | 1.2 |
| Hygophum taaningi | 80.5 | 54.0 | 14.5 | 1.0 |
| Myctophum selenops | 83.9 | 55.4 | 13.3 | 1.3 |
| Notolychnus valdiviae | 83.5 | 58.4 | 11.7 | 0.8 |
carbon ranged from 80.5% [Hygophum taaningi] to 94.3% [Benthosema suborbitale]. Expressed as a percentage of AFDW, protein ranged from 48.9% [Ceratoscopelus townsendi] to 58.4% [Notolychnus valdiviae], lipids ranged from 11.7% [N. valdiviae] to 22.8% [B. suborbitale], and carbohydrates ranged from 0.8% [N. valdiviae] to 1.3% [Myctophum selenops]. Combining the information on age and growth [14], dry weight [14], and chemical composition [Table 1] resulted in an estimate of average daily increase in the caloric content of tissues [Figure 1]. Daily increase in the caloric
Figure 1.
Relationship between dry weight and caloric content for larvae of the five representative species of myctophids [Benthosema suborbitale, Ceratoscopelus townsendi, Hygophum taaningi, Myctophum selenops, and Notolychnus valdiviae] from the eastern Gulf of Mexico. MinQc cal day-1 = AvgQc cal day-1 = MaxQc cal day-1 =
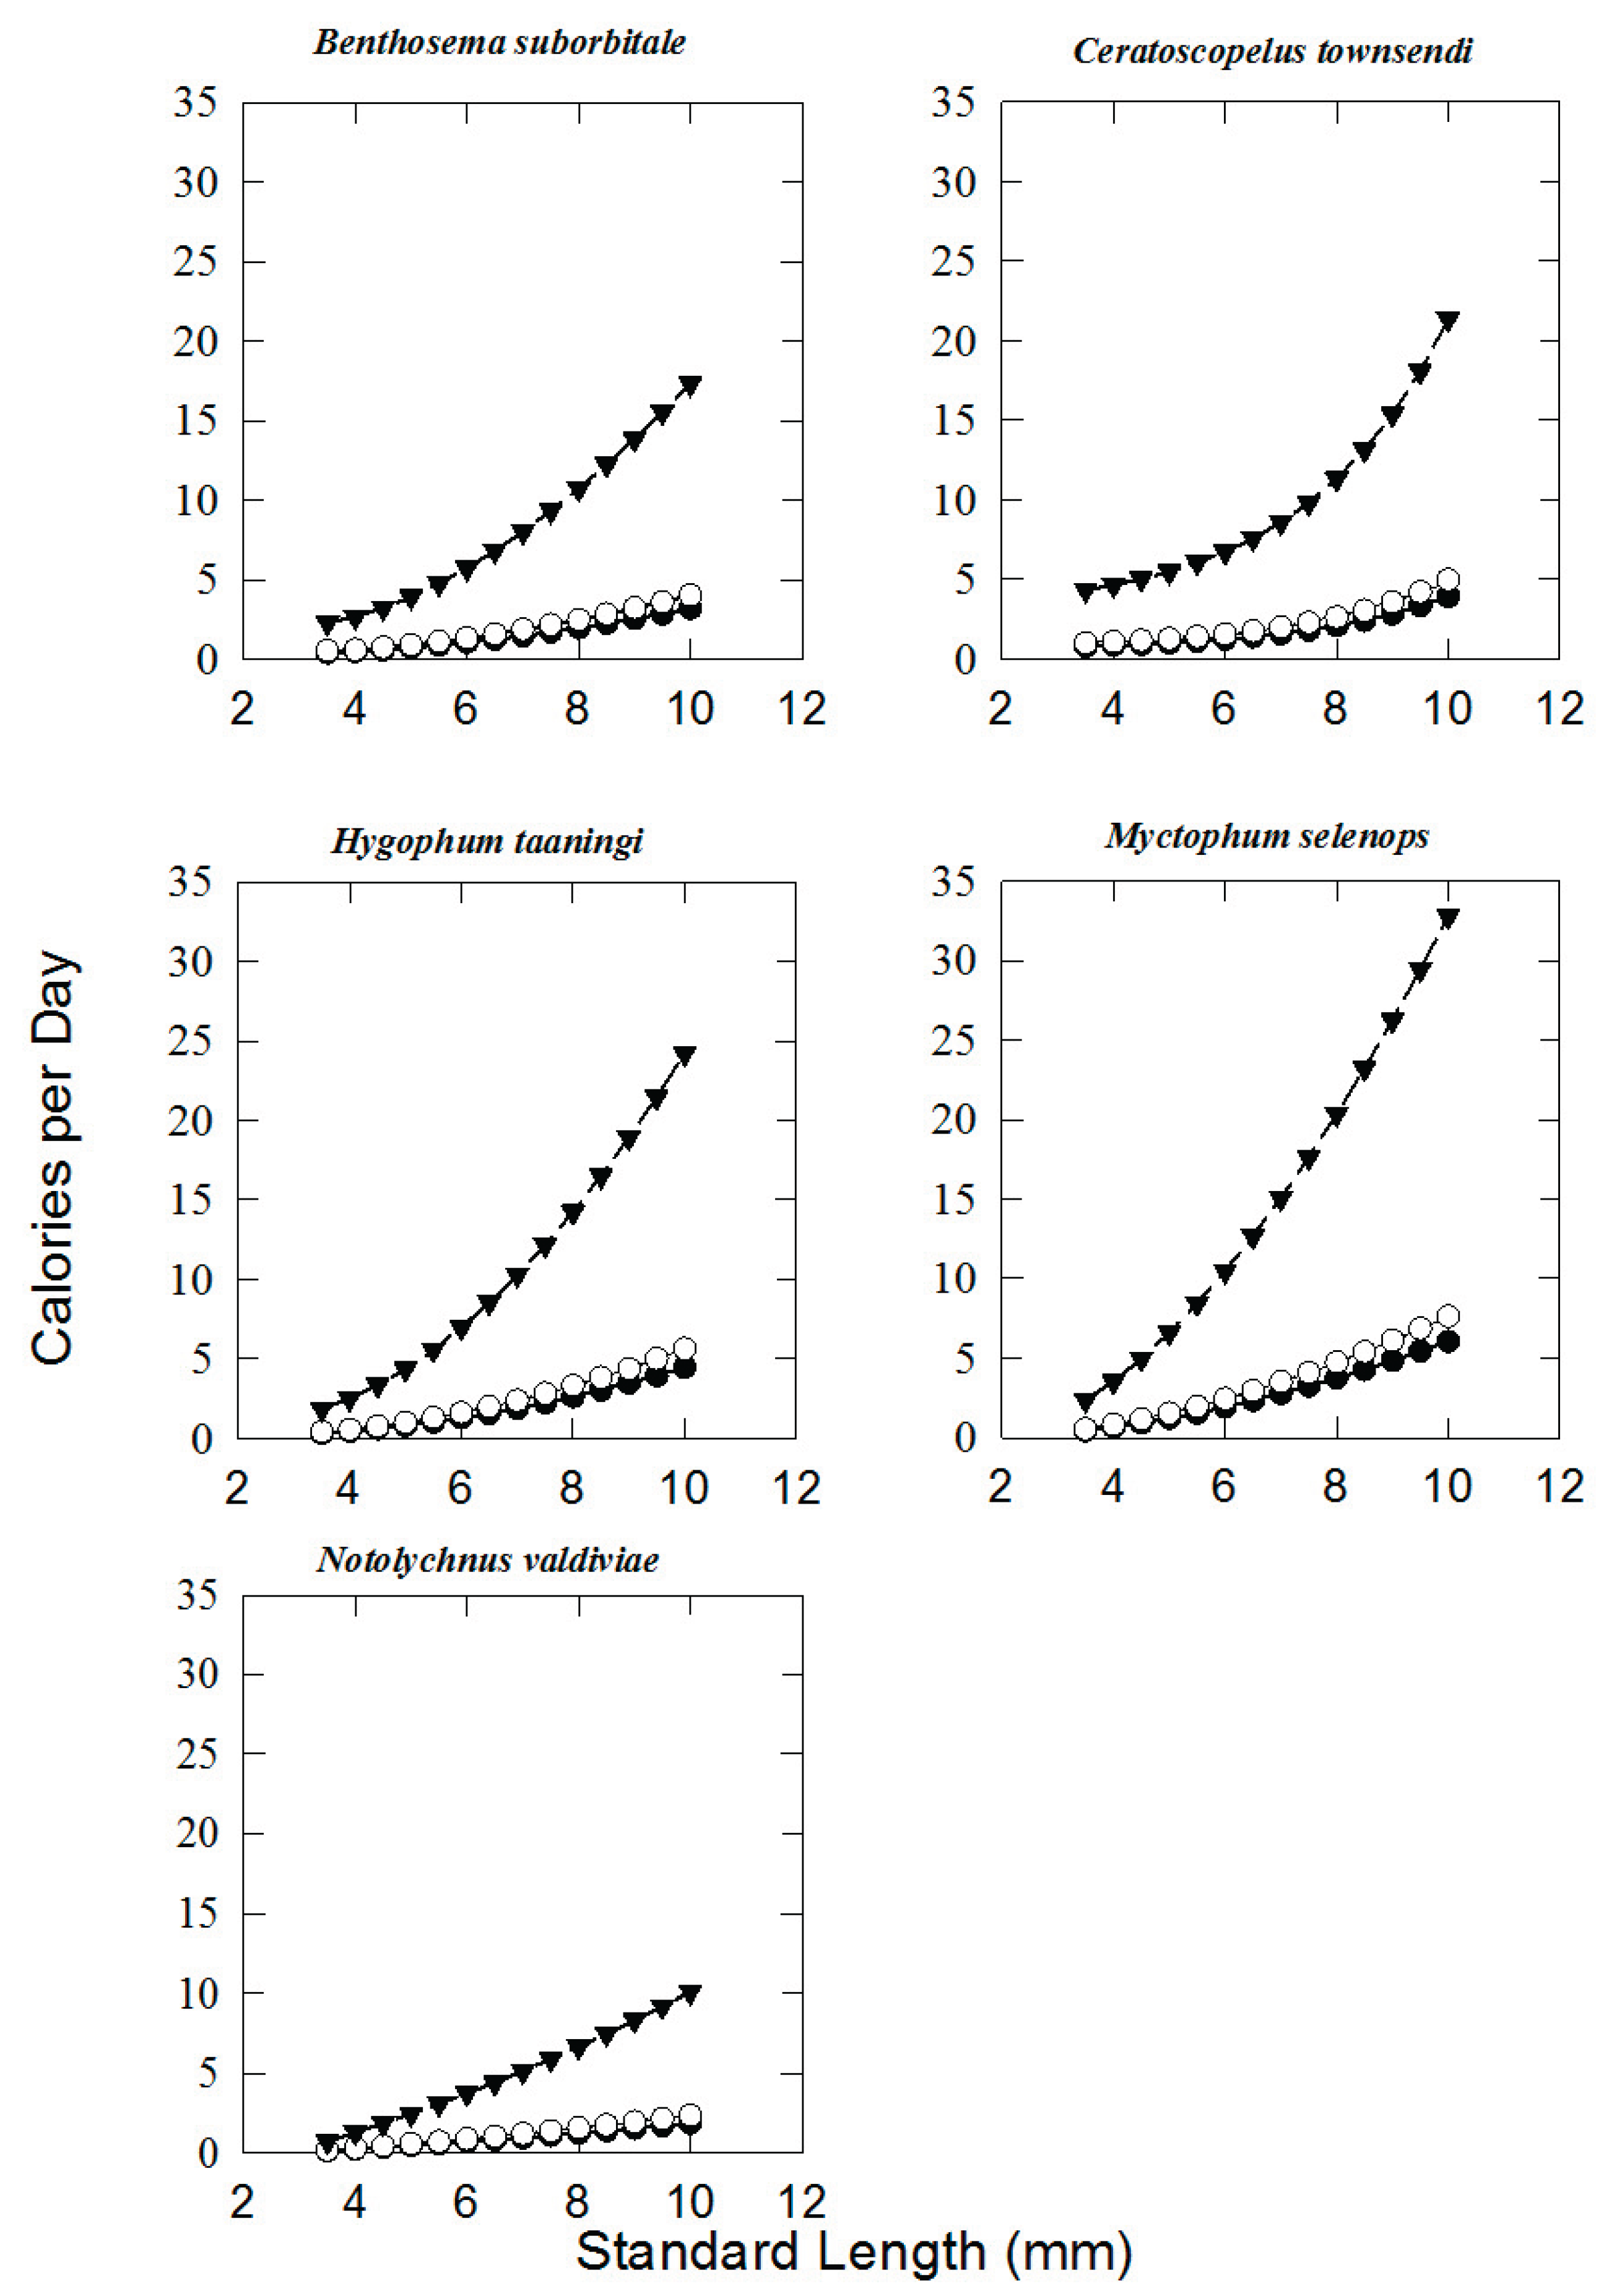
Table 2.
Calculation of caloric and numerical prey requirements for larvae of Benthosema suborbitale. Column headings refer to the variables of the bioenergetic and respiratory equations; SL = standard length of larvae, W = dry weight of larvae, R = respiratory rate, m = routine metabolic rate, Qm = includes energy consumed in routine and active metabolism, Qg = food energy converted into potential energy through growth, Qc = total energy cost.
| SL (mm) |
W µgDW |
R µg O2 h –1 |
m x 10-6cal µg –1 h –1 |
Qm cal day-1 |
Qg cal day-1 |
Qm + Qg cal day-1 |
AvgQc cal day-1 |
MinQc cal day-1 |
MaxQc cal day-1 |
AvgPrey no. day-1 |
MinPrey no. day-1 |
MaxPrey no. day-1 |
| 3.5 | 80 | 0.70 | 40 | 0.13 | 0.27 | 0.39 | 0.54 | 0.42 | 2.30 | 7 | 5 | 29 |
| 4.0 | 130 | 1.05 | 37 | 0.19 | 0.27 | 0.45 | 0.62 | 0.49 | 2.67 | 8 | 6 | 34 |
| 4.5 | 210 | 1.56 | 35 | 0.28 | 0.27 | 0.55 | 0.75 | 0.60 | 3.22 | 9 | 8 | 41 |
| 5.0 | 320 | 2.23 | 32 | 0.40 | 0.27 | 0.67 | 0.91 | 0.73 | 3.92 | 12 | 9 | 50 |
| 5.5 | 460 | 3.02 | 30 | 0.55 | 0.27 | 0.81 | 1.11 | 0.88 | 4.77 | 9 | 7 | 60 |
| 6.0 | 630 | 3.93 | 29 | 0.71 | 0.27 | 0.97 | 1.34 | 1.06 | 5.73 | 10 | 8 | 45 |
| 6.5 | 830 | 4.95 | 28 | 0.89 | 0.27 | 1.16 | 1.59 | 1.26 | 6.82 | 12 | 10 | 53 |
| 7.0 | 1060 | 6.08 | 27 | 1.10 | 0.27 | 1.36 | 1.87 | 1.48 | 8.02 | 15 | 12 | 62 |
| 7.5 | 1320 | 7.31 | 26 | 1.32 | 0.27 | 1.58 | 2.17 | 1.72 | 9.32 | 17 | 13 | 72 |
| 8.0 | 1610 | 8.63 | 25 | 1.56 | 0.27 | 1.82 | 2.50 | 1.98 | 10.72 | 19 | 15 | 80 |
| 8.5 | 1930 | 10.04 | 24 | 1.81 | 0.27 | 2.08 | 2.85 | 2.26 | 12.23 | 21 | 17 | 91 |
| 9.0 | 2280 | 11.55 | 23 | 2.09 | 0.27 | 2.35 | 3.22 | 2.56 | 13.83 | 24 | 19 | 103 |
| 9.5 | 2660 | 13.14 | 23 | 2.37 | 0.27 | 2.64 | 3.61 | 2.87 | 15.52 | 27 | 21 | 115 |
| 10.0 | 3070 | 14.82 | 22 | 2.68 | 0.27 | 2.94 | 4.03 | 3.20 | 17.30 | 30 | 24 | 129 |
Table 3.
Calculation of caloric and numerical prey requirements for larvae of Ceratoscopelus townsendi. Column headings refer to the variables of the bioenergetic and respiratory equations; SL = standard length of larvae, W = dry weight of larvae, R = respiratory rate, m = routine metabolic rate, Qm = includes energy consumed in routine and active metabolism, Qg = food energy converted into potential energy through growth, Qc = total energy cost.
| SL (mm) |
W µgDW |
R µg O2 h –1 |
m x 10-6 cal µg –1 h –1 |
Qm cal day-1 |
Qg cal day-1 |
Qm + Qg cal day-1 |
AvgQc cal day-1 |
MinQc cal day-1 |
MaxQc cal day-1 |
AvgPrey no. day-1 |
MinPrey no. day-1 |
MaxPrey no. day-1 |
| 3.5 | 199 | 1.36 | 32 | 0.24 | 0.49 | 0.74 | 1.01 | 0.80 | 4.34 | 15 | 12 | 64 |
| 4.0 | 243 | 1.65 | 31 | 0.30 | 0.49 | 0.79 | 1.08 | 0.86 | 4.65 | 16 | 13 | 68 |
| 4.5 | 297 | 2.01 | 31 | 0.36 | 0.49 | 0.86 | 1.17 | 0.93 | 5.03 | 17 | 14 | 74 |
| 5.0 | 363 | 2.44 | 31 | 0.44 | 0.49 | 0.93 | 1.28 | 1.02 | 5.49 | 21 | 16 | 89 |
| 5.5 | 444 | 2.97 | 31 | 0.54 | 0.49 | 1.03 | 1.41 | 1.12 | 6.06 | 23 | 18 | 98 |
| 6.0 | 543 | 3.62 | 31 | 0.65 | 0.49 | 1.15 | 1.57 | 1.25 | 6.74 | 25 | 20 | 109 |
| 6.5 | 664 | 4.40 | 31 | 0.79 | 0.49 | 1.29 | 1.76 | 1.40 | 7.58 | 29 | 23 | 123 |
| 7.0 | 811 | 5.36 | 31 | 0.97 | 0.49 | 1.46 | 2.00 | 1.59 | 8.59 | 32 | 26 | 139 |
| 7.5 | 992 | 6.52 | 30 | 1.18 | 0.49 | 1.67 | 2.29 | 1.82 | 9.82 | 37 | 29 | 159 |
| 8.0 | 1213 | 7.93 | 30 | 1.43 | 0.49 | 1.93 | 2.64 | 2.09 | 11.32 | 42 | 33 | 178 |
| 8.5 | 1483 | 9.65 | 30 | 1.74 | 0.49 | 2.24 | 3.06 | 2.43 | 13.15 | 48 | 38 | 207 |
| 9.0 | 1813 | 11.74 | 30 | 2.12 | 0.49 | 2.61 | 3.58 | 2.84 | 15.38 | 56 | 45 | 242 |
| 9.5 | 2216 | 14.29 | 30 | 2.58 | 0.49 | 3.07 | 4.21 | 3.34 | 18.08 | 66 | 53 | 285 |
| 10.0 | 2709 | 17.39 | 30 | 3.14 | 0.49 | 3.63 | 4.98 | 3.95 | 21.37 | 78 | 62 | 336 |
Table 4.
Calculation of caloric for larvae of Hygophum taaningi. Column headings refer to the variables of the bioenergetic and respiratory equations; SL = standard length of larvae, W = dry weight of larvae, R = respiratory rate, m = routine metabolic rate, Qm = includes energy consumed in routine and active metabolism, Qg = food energy converted into potential energy through growth, Qc = total energy cost.
| SL (mm) |
W µgDW |
R µg O2 h –1 |
m x 10-6 cal µg –1 h –1 |
Qm cal day-1 |
Qg cal day-1 |
Qm + Qg cal day-1 |
AvgQc cal day-1 |
MinQc cal day-1 |
MaxQc cal day-1 |
| 3.5 | 100 | 1.09 | 51 | 0.20 | 0.12 | 0.32 | 0.43 | 0.34 | 1.86 |
| 4.0 | 160 | 1.70 | 49 | 0.31 | 0.12 | 0.43 | 0.58 | 0.46 | 2.51 |
| 4.5 | 240 | 2.49 | 48 | 0.45 | 0.12 | 0.57 | 0.78 | 0.62 | 3.35 |
| 5.0 | 340 | 3.46 | 47 | 0.62 | 0.12 | 0.74 | 1.02 | 0.81 | 4.37 |
| 5.5 | 460 | 4.60 | 46 | 0.83 | 0.12 | 0.95 | 1.30 | 1.03 | 5.58 |
| 6.0 | 600 | 5.91 | 46 | 1.07 | 0.12 | 1.19 | 1.62 | 1.29 | 6.97 |
| 6.5 | 760 | 7.38 | 45 | 1.33 | 0.12 | 1.45 | 1.99 | 1.58 | 8.54 |
| 7.0 | 940 | 9.01 | 44 | 1.63 | 0.12 | 1.75 | 2.39 | 1.90 | 10.27 |
| 7.5 | 1140 | 10.81 | 44 | 1.95 | 0.12 | 2.07 | 2.84 | 2.25 | 12.18 |
| 8.0 | 1360 | 12.76 | 43 | 2.30 | 0.12 | 2.42 | 3.32 | 2.63 | 14.25 |
| 8.5 | 1600 | 14.87 | 43 | 2.69 | 0.12 | 2.80 | 3.84 | 3.05 | 16.50 |
| 9.0 | 1860 | 17.14 | 43 | 3.09 | 0.12 | 3.21 | 4.40 | 3.49 | 18.90 |
| 9.5 | 2140 | 19.55 | 42 | 3.53 | 0.12 | 3.65 | 5.00 | 3.97 | 21.47 |
| 10.0 | 2440 | 22.13 | 42 | 4.00 | 0.12 | 4.11 | 5.64 | 4.47 | 24.20 |
Table 5.
Calculation of caloric and numerical prey requirements for larvae of Myctophum selenops. Column headings refer to the variables of the bioenergetic and respiratory equations; SL = standard length of larvae, W = dry weight of larvae, R = respiratory rate, m = routine metabolic rate, Qm = includes energy consumed in routine and active metabolism, Qg = food energy converted into potential energy through growth, Qc = total energy cost.
| SL (mm) |
W µgDW |
R µg O2 h –1 |
m x 10-6 cal µg –1 h –1 | Qm cal day-1 |
Qg cal day-1 |
Qm + Qg cal day-1 |
AvgQc cal day-1 |
MinQc cal day-1 |
MaxQc cal day-1 |
AvgPrey no. day-1 |
MinPrey no. day-1 |
MaxPrey no. day-1 |
| 3.5 | 153 | 1.20 | 36 | 0.27 | 0.14 | 0.40 | 0.55 | 0.44 | 2.36 | 5 | 4 | 22 |
| 4.0 | 300 | 2.11 | 33 | 0.47 | 0.14 | 0.60 | 0.83 | 0.66 | 3.55 | 8 | 6 | 33 |
| 4.5 | 493 | 3.20 | 30 | 0.71 | 0.14 | 0.85 | 1.16 | 0.92 | 4.97 | 11 | 8 | 46 |
| 5.0 | 730 | 4.45 | 28 | 0.99 | 0.14 | 1.12 | 1.54 | 1.22 | 6.61 | 9 | 7 | 40 |
| 5.5 | 1013 | 5.85 | 27 | 1.30 | 0.14 | 1.43 | 1.97 | 1.56 | 8.44 | 12 | 9 | 51 |
| 6.0 | 1340 | 7.40 | 26 | 1.64 | 0.14 | 1.78 | 2.44 | 1.93 | 10.47 | 15 | 12 | 63 |
| 6.5 | 1713 | 9.09 | 25 | 2.02 | 0.14 | 2.15 | 2.95 | 2.34 | 12.67 | 18 | 14 | 76 |
| 7.0 | 2130 | 10.91 | 24 | 2.42 | 0.14 | 2.56 | 3.51 | 2.78 | 15.06 | 21 | 17 | 91 |
| 7.5 | 2593 | 12.86 | 23 | 2.86 | 0.14 | 2.99 | 4.10 | 3.25 | 17.61 | 25 | 20 | 106 |
| 8.0 | 3100 | 14.94 | 22 | 3.32 | 0.14 | 3.46 | 4.73 | 3.76 | 20.33 | 28 | 22 | 120 |
| 8.5 | 3653 | 17.14 | 22 | 3.81 | 0.14 | 3.95 | 5.40 | 4.29 | 23.21 | 32 | 25 | 137 |
| 9.0 | 4250 | 19.47 | 21 | 4.33 | 0.14 | 4.46 | 6.11 | 4.85 | 26.24 | 36 | 29 | 155 |
| 9.5 | 4893 | 21.90 | 21 | 4.87 | 0.14 | 5.00 | 6.85 | 5.44 | 29.43 | 40 | 32 | 173 |
| 10.0 | 5580 | 24.46 | 20 | 5.44 | 0.14 | 5.57 | 7.63 | 6.05 | 32.77 | 45 | 36 | 193 |
Table 6.
Calculation of caloric and numerical prey requirements for larvae of Notolychnus valdiviae. Column headings refer to the variables of the bioenergetic and respiratory equations; SL = standard length of larvae, W = dry weight of larvae, R = respiratory rate, m = routine metabolic rate, Qm = includes energy consumed in routine and active metabolism, Qg = food energy converted into potential energy through growth, Qc = total energy cost.
| SL (mm) |
W µgDW |
R µg O2 h –1 |
m x 10-6cal µg –1 h –1 |
Qm cal day-1 |
Qg cal day-1 |
Qm + Qg cal day-1 |
AvgQc cal day-1 |
MinQc cal day-1 |
MaxQc cal day-1 |
AvgPrey no. day-1 |
MinPrey no. day-1 |
MaxPrey no. day-1 |
| 3.5 | 20 | 0.22 | 50 | 0.04 | 0.08 | 0.12 | 0.16 | 0.13 | 0.68 | 3 | 2 | 12 |
| 4.0 | 90 | 0.77 | 40 | 0.14 | 0.08 | 0.22 | 0.30 | 0.23 | 1.27 | 5 | 4 | 23 |
| 4.5 | 170 | 1.31 | 36 | 0.24 | 0.08 | 0.31 | 0.43 | 0.34 | 1.85 | 8 | 6 | 33 |
| 5.0 | 260 | 1.87 | 33 | 0.34 | 0.08 | 0.41 | 0.57 | 0.45 | 2.44 | 8 | 7 | 36 |
| 5.5 | 360 | 2.46 | 32 | 0.44 | 0.08 | 0.52 | 0.71 | 0.57 | 3.06 | 10 | 8 | 45 |
| 6.0 | 470 | 3.07 | 30 | 0.56 | 0.08 | 0.63 | 0.87 | 0.69 | 3.72 | 13 | 10 | 54 |
| 6.5 | 590 | 3.72 | 29 | 0.67 | 0.08 | 0.75 | 1.03 | 0.81 | 4.40 | 15 | 12 | 64 |
| 7.0 | 720 | 4.40 | 28 | 0.79 | 0.08 | 0.87 | 1.19 | 0.95 | 5.12 | 17 | 14 | 75 |
| 7.5 | 860 | 5.10 | 27 | 0.92 | 0.08 | 1.00 | 1.37 | 1.08 | 5.87 | 20 | 16 | 86 |
| 8.0 | 1010 | 5.84 | 27 | 1.05 | 0.08 | 1.13 | 1.55 | 1.23 | 6.65 | 20 | 16 | 86 |
| 8.5 | 1170 | 6.60 | 26 | 1.19 | 0.08 | 1.27 | 1.74 | 1.38 | 7.47 | 22 | 18 | 97 |
| 9.0 | 1340 | 7.40 | 26 | 1.34 | 0.08 | 1.41 | 1.94 | 1.54 | 8.31 | 25 | 20 | 108 |
| 9.5 | 1520 | 8.22 | 25 | 1.48 | 0.08 | 1.56 | 2.14 | 1.70 | 9.19 | 28 | 22 | 119 |
| 10.0 | 1710 | 9.08 | 25 | 1.64 | 0.08 | 1.72 | 2.35 | 1.86 | 10.09 | 30 | 24 | 131 |
value of fish tissue [AvgQc cal day-1] for mid-size (6.5 mm SL) larvae ranged from 1.03 calories for N. valdiviae, the slowest growing species represented, to 2.95 calories for M. selenops, the heaviest of the species represented [Table 2, Table 3, Table 4, Table 5 and Table 6].
Diurnal activity patterns were determined from an analysis of larval feeding activity, assuming that non-feeding larvae are quiescent [69]. Unlike adult lanternfishes, larvae are primarily diurnal predators. Four of the five species revealed a similar diel pattern; feeding commenced between 0600 and 0800 hours and terminated between 1700 and 2100 hours [69]. Time of peak feeding incidence varied and there was no consistent pattern among species. Unlike the other representative species, larvae of Myctophum selenops apparently always fed, regardless of light availability.
The weight-specific energy cost for activity [Qm], estimated from the relationship of oxygen consumption to larval dry weight and activity level for mid-sized larvae, ranged from 0.67-2.02 calories per day [Table 2, Table 3, Table 4, Table 5 and Table 6]. Larval size and assimilation efficiency [choice of Qs] resulted in greater differences than among species.
The number of individual zooplankters required daily was calculated from the caloric value of known preferred prey items and the size of prey ingested by each size class of larvae [69]. The number of prey ingested also varied more according to size and assimilation efficiency within a species than among species. The average number of prey required daily for larvae 5.0 mm SL or less ranged from 3-23 [Table 2, Table 3, Table 4, Table 5 and Table 6]. For larvae in the second size category [> 5.0-7.5mmSL], average daily prey requirements ranged from 9 to 37. The average number of prey required daily for species greater than 7.5mmSL ranged from 19 - 78.
4. Discussion
There are no other comprehensive evaluations of the bioenergetics of myctophid larvae. Most studies on shallow water larval species [83,84,85,86,87,88,89,90] employ comparable evaluations, assumptions, and results. Since lanternfish larvae are essentially shallow water species pre-transformation, we have utilized similar methodology and assumptions with some adaptations. The amount of energy required for daily growth and maintenance [Qc] by the five representative species of lanternfishes was estimated from a bioenergetic equation. The modeling efficiency of bioenergetics can be quite high [90,96], but variations in each of the three major parameters used to calculate Qc affect the final determination of energy requirements. The estimate of prey energy converted into potential energy through growth [Qg] was evaluated from analysis of age and growth [14], plus measurement of dry weight and chemical composition. Age was determined from microincrement analysis of sagittal otoliths.
The chemical composition of lanternfish larvae [Table 1], with proteins and lipids predominant over carbohydrates, is similar to that exhibited by the larvae of shallow water fish species [88,89,106]. In addition, results for these larvae fall within the range reported for postmetamorphic lanternfishes from the eastern Gulf of Mexico [35], except that the unusually high lipid level that they reported in adult Notolychnus valdiviae was not found in the larvae of this species, which had the lowest percent lipid content of all species examined.
Four of the representative species were actively feeding for approximately 15 hours a day except larvae of Myctophum selenops, which appeared to feed continuously [69]. Energy spent during routine metabolism was estimated from an examination of respiration by the larvae of a variety of tropical-subtropical species [92]. These authors concluded that oxygen uptake [R] related strongly to biomass [dry weight] and did not differ significantly among species. Further, analysis of respiration by larval redfish [Sciaenops ocellatus] was similar to the respiratory requirements of other tropical-subtropical species [89,108]. It is likely, therefore, that the equations generated by Houde & Schekter [92] are applicable for approximating the metabolic requirements of lanternfish larvae.
Whereas the values for energy funneled into growth [Qg] and burned for activity [Qm] were either measured or derived from corroborated values in the literature, the amount of energy lost through non-assimilation is contentious. The ability to capture and measure the amount of prey energy lost in feces [unassimilated food] is difficult, thus it is often measured indirectly [107,108]. Even when direct measurement of prey assimilation was attempted [102], assimilation levels were shown to be highly variable within a species and were not significantly related to age, standard length, or dry weight. Results of assimilation calculations range from 17-92% in marine larvae, with an average value of 73%. Because of the high degree of variability associated with this parameter, Qc was determined for the lowest, average, and highest levels for assimilation reported for marine fish larvae.
Larval fishes probably have lower assimilation levels than adults because of the lack of development of gut tissues and digestive organs [103,109], but the values are probably not as low as indicated by some experimental results. Among the factors contributing to the variability of measured assimilation levels are prey availability and type. The maintenance of larvae in the laboratory requires prey densities much higher than those available in situ [39]. Under such conditions larvae pack their guts, forcing prey items through more quickly than would probably occur naturally [108]. Lack of retention within the gut would result in lower assimilation efficiencies. Houde and The poor assimilation of prey by bay anchovy [Anchoa mitchilli] may be related to a residence time in the gut of only a few minutes duration [92]. Although high prey concentrations are likely encountered by marine larvae [69,110,111,112,113], these do not match the high levels of prey consistently provided to laboratory-reared larvae [39]. It is likely, therefore, that the minimum and average prey requirements calculated herein are closer to the natural feeding requirements of larvae, which assumes a relatively high assimilation rate.
The digestibility of prey also affects assimilation efficiencies. It was suggested that the high assimilation of rotifers by redfish larvae to the relative ease at which these prey can be digested [87,88]. It may be more difficult to extract energy from other prey items, such as phytoplankton and crustacean prey. Hygophum taaningi is particularly problematic in this regard. Larvae of this species have a diet dominated by gelatinous prey, primarily tunicates [69]. Because of the difficulty in both determining actual prey size and the lack of caloric conversion information, we did not feel confident that we could accurately estimate numerical prey consumption. Most marine larvae feed upon a variety of prey, especially during the early part of larval development [69,115,116,117]. The average assimilation rate of 73% [99] is likely the best estimate for assimilation of prey for larvae over a range of sizes.
Although variation exists among the five species reported herein, the change in growth rate is minor when compared to other families. The larval period is variable among tropical - subtropical species, ranging from a few days to months [118,119,120,121]. Lanternfish growth is not unlike that of several species of Gulf of Mexico clupeids and sciaenids [14,119,120]. Thus, even though post-metamorphic myctophids reside at mesopelagic depths, their larval life history, spent in epipelagic waters, most closely resembles that of normally epipelagic and shallow water fish species. It was suggested that except for some differences related to diel vertical migrations [e.g. feeding chronology, otolith microincrement deposition periods], basic myctophid biology [age, growth and reproduction patterns] in general does not reflect unique adaptation to their deep-sea residence, but in fact resembles that of shallow water species [13]. Our early life history data support this concept. Despite many morphological and physiological adaptations to their deep-sea homes, myctophids have not lost the basic shallow water life history patterns of their ancient ancestors.
Acknowledgements
Many individuals assisted in the collection of zooplankton. Our thanks go to Joseph Donnelly, Mark Flock, Steven Kinsey, Ken Passarella, Jonathan Rast, and Tracey Sutton who assisted with net collections. We especially wish to express our gratitude to Joseph Donnelly for his assistance with the analysis of chemical composition and Claire Obordo for her assistance with library research. The cruises were supported by the State of Florida and NSF OCE #841787 grant to Thomas L. Hopkins.
References
- Gjøsaeter, H.; Kawaguchi, K. A review of the world resources of mesopelagic fishes. FAO Fish Tech Pap 1980, 193, 1–151. [Google Scholar]
- Beamish, R.J.; McFarlane, G.A. The forgotten requirements for age validation in fisheries biology. Trans Am Fish Soc 1983, 112, 735–743. [Google Scholar] [CrossRef]
- Irigoien, X.; Klevjer, T.A.; Røstad, A.; Martinez, U.; Boyra, G.; Acuña, J.L.; Kaartvedt, S. Large mesopelagic fishes biomass and trophic efficiency in the open ocean. Nature communications 2014, 5, 3271. [Google Scholar] [CrossRef] [PubMed]
- Maynard, S.D.; Riggs, F.V.; Walters, J.F. Mesopelagic micronekton in the Hawaiian waters: Faunal composition, standing stock, and diel vertical migration. Fish Bull US 1975, 73, 726–736. [Google Scholar]
- Hulley, P.A. Results of the research cruises of FRV ‘Walther Herwig’ to South America. LVIII. Family Myctophidae (Osteichthyes, Myctophiformes). Archiv. Fisch.Wiss. 1981, 31, 1–300. [Google Scholar]
- Gartner, J.V. Jr.; Hopkins, T.L.; Baird, R.C.; Milliken, D.M. The lanternfishes [Pisces: Myctophidae] of the eastern Gulf of Mexico. Fish Bull US 1987, 85, 81–98. [Google Scholar]
- Beamish, R.; Leask, K.D.; Ivanov, O.A.; Balanov, A.A.; Orlov, A.M.; Sinclair, B. The ecology, distribution, and abundance of midwater fishes of the Subarctic Pacific gyres. Progress in Oceanography 1999, 43, 399–442. [Google Scholar] [CrossRef]
- Catul, V.; Gauns, M.; Karuppasamy, P.K. A review on mesopelagic fishes belonging to family Myctophidae. Reviews in Fish Biology and Fisheries 2011, 21, 339–54. [Google Scholar] [CrossRef]
- Eduardo, L.N.; Bertrand, A.; Mincarone, M.M.; Martins, J.R.; Fredou, T; Assuncao, R.V.; Lima, R.S.; Ménard, F.; Le Loc'h, F.; Lucena-Fredou, F. Distribution, vertical migration, and trophic ecology of lanternfishes (Myctophidae) in the Southwestern Tropical Atlantic. Progress in Oceanography 2021, 199, 102695. [Google Scholar] [CrossRef]
- Hopkins, T.L.; Baird, R.C. Aspects of the feeding ecology of oceanic midwater fishes. In Oceanic sound scattering prediction. Andersen, N.R., Zahuranec, B.J. eds.. Plenum Press. New York USA 1977, 325-360.
- Robinson, B.H.; Bailey, T.G. Sinking rates and dissolution of midwater fish fecal matter. Mar Biol 1981, 65, 135–142. [Google Scholar] [CrossRef]
- Hopkins, T.L.; Sutton, T.; Lancraft, T.M. The trophic structure and predation impact of a low latitude midwater fish assemblage. Prog Oceanogr 1996, 38, 205–239. [Google Scholar] [CrossRef]
- Gartner. J.V. Jr. Life histories of three species of lanternfishes [Pisces: Myctophidae] from the eastern Gulf of Mexico II. Age and growth patterns. Mar Biol 1991, 111, 21–27. [CrossRef]
- Conley, W.J.; Gartner, J.V. Jr. Growth among larvae of lanternfishes [Teleostei: Myctophidae] from the eastern Gulf of Mexico. Bull Mar Sci 2009, 84, 123–135. [Google Scholar]
- Nigmatullin, C.M.; Nesis, K.N.; Arkhipkin, A.I. A review of the biology of the jumbo squid Dosidicus gigas [Cephalopoda: Ommastrephidae]. Fisheries Research 2001, 54, 9–19. [Google Scholar] [CrossRef]
- Alverson, F.G. The food of yellowfin and skipjack tunas in the eastern tropical Pacific. Ocean Bull I-ATTC 1963, 7, 293–396. [Google Scholar]
- Scott, W.B.; Tibbo, S.N. Food and feeding habits of swordfish, Xiphias gladius, in the western North Atlantic. J Fish Res Bd Canada 1968, 25, 903–919. [Google Scholar] [CrossRef]
- Sutton, T.T.; Hopkins, T.L. Trophic ecology of the stomiid (Pisces: Stomiidae) fish assemblage of the eastern Gulf of Mexico: Strategies, selectivity and impact of a top mesopelagic predator group. Mar Biol 1996, 127, 179–192. [Google Scholar] [CrossRef]
- Sanchez-Velasco, L.; Contreras-Arredondo, I.; Esqueda-Escarcega, G. Diet composition of Euthynnus lineatus and Auxis sp. larvae [Pisces: Scombridae] in the Gulf of California. Bull Mar Sci 1999, 65, 687–698. [Google Scholar]
- Harrison, C.S.; Hida, T.; Seki, M.P. Hawaiian seabird feeding ecology. Wildlife Monographs 1983 1, 3–71.
- Springer, A.M.; Piatt, J.F.; Vliet, G.V. Sea birds as proxies of marine habitats and food webs in the western Aleutian Arc. Fisheries Oceanography 1996, 5, 45–55. [Google Scholar] [CrossRef]
- Olsson, O.; North, A.W. Diet of the King Penguin Aptenodytes patagonicus during three summers at South Georgia. Ibis 1997, 139, 504–512. [Google Scholar] [CrossRef]
- Dakwa, F. E.; Ryan, P. G.; Dyer, B. M.; Crawford, R. J. M.; Pistorius, P. A.; Makhado, A. B. [2021]. Long-term variation in the breeding diets of macaroni and eastern rockhopper penguins at Marion Island [1994–2018]. African Journal of Marine Science 2021, 43, 187–199. [Google Scholar] [CrossRef]
- Carey, P.W. Fish prey species of the New Zealand fur seal [Arctocephalus forsteri, Lesson]. New Zealand Journal of Ecology 1992, 41–46. [Google Scholar]
- Klages, N.T.W.; Bester, M.N. Fish prey of fur seals Arctocephalus spp. at subantarctic Marion Island. Mar Biol 1998, 131, 559–566. [Google Scholar] [CrossRef]
- Fitch, J.E.; Brownell Jr, R.L. Fish otoliths in cetacean stomachs and their importance in interpreting feeding habits. J Fish Res Bd Canada 1968, 25, 2561–2574. [Google Scholar] [CrossRef]
- Giménez, J.; Marçalo, A.; García-Polo, M.; García-Barón, I.; Castillo, J. J.; Fernández-Maldonado, C.; de Stephanis, R. Feeding ecology of Mediterranean common dolphins: The importance of mesopelagic fish in the diet of an endangered subpopulation. Marine Mammal Science, 2018, 34, 136–154. [Google Scholar] [CrossRef]
- Pereyra, W.T. , Pearcy, W.G.; Carvey Jr., F.E. Jr. Feeding on mesopelagic fauna, with consideration of the ecological implications. J Fish Res Bd Canada 1969, 26, 2211–2215. [Google Scholar] [CrossRef]
- Freer, J.J.; Tarling, G.A.; Collins, M.A.; Partridge, J.C.; Genner, M.J. 2019 Predicting future distributions of lanternfish, a significant ecological resource within the Southern Ocean. Diversity and Distributions 2019, 25, 1259–1272. [Google Scholar] [CrossRef]
- Shaviklo, A.R. A comprehensive review on animal feed, human food and industrial application of lanternfishes; from prototypes to products. Turkish Journal of Fisheries and Aquatic Sciences 2020, 20, 827–843. [Google Scholar] [CrossRef]
- Kourantidou, M.; Jin, D. Mesopelagic–epipelagic fish nexus in viability and feasibility of commercial-scale mesopelagic fisheries. Natural Resource Modeling 2022, 35, e12350. [Google Scholar] [CrossRef]
- Tierney, M.; Hindell, Mark A.; Goldsworthy, S. . Energy content of mesopelagic fish from Macquarie Island. Antarctic science 2002, 14, 225–230. [CrossRef]
- López-Pérez, C.; Olivar, M.P.; Tuset V.M.; Bernal A.; Hulley P.A. Energy density of mesopelagic fishes from the Atlantic Ocean. Journal of Fish Biology 2023, 102, 924–35. [CrossRef]
- Zhang B, Virtue P, Pethybridge H, Swadling KM, Nichols PD, Chang KJ. Nutritional composition and energetic values of mesopelagic fish from the Tasman Sea. Journal of Food Composition and Analysis. 2025 Jun 1;142:107509. 2025, 142, 107509.
- Stickney, D.G.; Torres, J.J. Proximate composition and energy content of mesopelagic fishes from the eastern Gulf of Mexico. Mar Biol 1989, 3, 13–24. [Google Scholar] [CrossRef]
- Childress, J.J.; Nygaard, M. H. ; The chemical composition of midwater fishes as a function of depth of occurrence off southern California. Deep Sea Research and Oceanographic Abstracts 1973, 20, 1093–1109. [Google Scholar] [CrossRef]
- Bailey, T.G.; Robison, B.H. Food availability as a selective factor on the chemical compositions of midwater fishes in the eastern North Pacific. Mar Biol 1986, 91, 131–141. [Google Scholar] [CrossRef]
- Hjort, J. Fluctuations in the great fisheries of northern Europe viewed in light of biological research. Rapp P-v Reun Cons Int Explor Mer 1914, 20, 1–228. [Google Scholar]
- Houde, E.D. Critical food concentrations for larvae of three species of subtropical marine fishes. Bull Mar Sci 1978, 28, 395–411. [Google Scholar]
- Hunter, J.R. Feeding ecology and predation of marine fish larvae. In: Lasker, R. [ed] Marine fish larvae. University of Washington Press. Seattle, USA. 1981, 1, 33–77. [Google Scholar]
- Sifa, L. and Matius J.A. 1987. The Critical Period of High Mortality of Larvae Fish: A Discussion Based on Current Research. Chinese Journal of Oceanology and Limnology 1987, 5, 80–96. [Google Scholar] [CrossRef]
- Letcher, B.H.; Rice, J.A.; Crowder, L.B.; Rose, K.A. Variability in survival of larval fish: Disentangling components with a generalized individual-based model. Can J Fish Aquat Sci 1996, 53, 787–801. [Google Scholar] [CrossRef]
- Claramunt, R.M.; Wahl, D.H. The effects of abiotic and biotic factors in determining larval fish growth rates: A comparison across species and reservoirs. Trans Amer Fish Soc 2000, 12, 835–851. [Google Scholar] [CrossRef]
- MacKenzie, B.R.; Kiørboe, T. Larval fish feeding and turbulence: A case for the downside. Limnol Oceanogr 2000, 45, 1–10. [Google Scholar] [CrossRef]
- McCasker, N.; Humphries, P.; Meredith, S.; Klomp, N. Contrasting Patterns of Larval Mortality in Two Sympatric Riverine Fish Species: A Test of the Critical Period Hypothesis. PLoS ONE 2014, 9, e109317. [Google Scholar] [CrossRef] [PubMed]
- Houde, E.D. Fish early life dynamics and recruitment variability. Amer Fish Soc Symp 1987, 2, 17–29. [Google Scholar]
- Luecke, C.; Rice, J.A.; Crowder, L.B.; Yeo, S.E.; Binkowski, F. P. Recruitment mechanisms of bloater in Lake Michigan: an analysis of the predatory gauntlet. Can J Fish Aquat Sci 1990, 47, 524–532. [Google Scholar] [CrossRef]
- Rice, J.A.; Miller, T.J.; Rose, K.A.; Crowder, L.B.; Marschall, E.A.; Trebitz, A.S.; DeAngelis, D.L. Growth rate variation and larval survival: Inferences from an individual-based size-dependent predation model. Can J Fish Aquat Sci 1993, 50, 133–142. [Google Scholar] [CrossRef]
- Jeffrey, J.; Taggart, C.T. Growth variation and water mass associations of larval silver hake (Merluccius bilinearis) on the Scotian Shelf. Can J Fish Aquat Sci 2000, 57, 1728–1738. [Google Scholar] [CrossRef]
- Lasker. R. Use of fish eggs and larvae in probing some major problems in fisheries and aquaculture. Amer Fish Soc Symp 1987, 2, 1–16.
- Rosenthal, H.; Hempel, G. Experimental studies in feeding and food requirements of herring larvae [Clupea harengus L.] In: Steele JH [ed] Marine food chains. Univ of California Press, USA. 1970, 1, 344–364. [Google Scholar]
- Blaxter, J.H.S.; Staines, M.E. Food searching potential in marine fish larvae. In: Crisp DJ [ed] Fourth European marine biology symposium. University Press, Cambridge, UK. 1971, 1, 467–485. [Google Scholar]
- Hunter, J.R. Swimming and feeding behavior of larval anchovy Engraulis mordax. Fish Bull US 1972, 70, 821–838. [Google Scholar]
- May, R.C. Larval mortality in marine fishes and the critical period concept. In: Blaxter JHS [ed] The early life history of fish. Springer-Verlag, New York. 1974, 3-19.
- Hinrichsen, H.H.; Lehmann, A.; Möllmann, C.; Schmidt, J.O. Dependency of larval fish survival on retention/dispersion in food limited environments: the Baltic Sea as a case study. Fish Oceanogr 2003, 12, 425–433. [Google Scholar] [CrossRef]
- Govoni, J.J. , Terwilliger, M.; Markle, D.F. Age, growth, and long-distance dispersal in the western North Atlantic of vexillifer larvae of the pearlfish, Echiodon dawsoni, with notes on Carapus bermudensis [Ophidiiformes: Carapidae]. Ichthyol Res 2015, 62, 409–419. [Google Scholar] [CrossRef]
- Llopiz, J. K.; Hobday, A. J. A global comparative analysis of the feeding dynamics and environmental conditions of larval tunas, mackerels, and billfishes. Deep Sea Research Part II: Topical Studies in Oceanography 2015, 113, 113–124. [Google Scholar] [CrossRef]
- Quintanilla, J.M.; Borrego-Santos, R.; Malca, E.; Swalethorp, R.; Landry, M.R.; Gerard, T.; Laiz-Carrión, R. Maternal Effects and Trophodynamics Drive Interannual Larval Growth Variability of Atlantic Bluefin Tuna [Thunnus thynnus] from the Gulf of Mexico. Animals 2024, 14, 3–23. [Google Scholar] [CrossRef]
- Ferron, A.; Leggett, W.C. An appraisal of condition measures for marine fish larvae. Adv Mar Biol 1994, 30, 215–303. [Google Scholar]
- Ahlstrom, E.H. Kinds and abundance of fishes in the California Current region based on egg and larval surveys. Calif Mar Res Comm CalCOFI Rept 1965, 10, 31–52. [Google Scholar]
- Ahlstrom, E.H. Kinds and abundance of fish larvae in the eastern tropical Pacific on the second multivessel EASTROPAC survey, and observations on the annual cycle of larval abundance. Fish Bull US 1972, 70, 1153–1242. [Google Scholar]
- Loeb, V.J. Vertical distribution and development of larval fishes in the North Pacific central gyre during summer. Fish Bull US 1979, 77, 777–793. [Google Scholar]
- Loeb, V.J. Patterns of spatial and species abundance within the larval fish assemblage of the North Pacific central gyre during late summer. Mar Biol 1980, 60, 189–200. [Google Scholar] [CrossRef]
- Belyanina, T.N. Ichthyoplankton of the Gulf of Tonkin [composition, distribution and seasonal changes in populations]. J Ichthyo 1987, 7, 51–57. [Google Scholar]
- Perteseva-Ostroumova, T.A. New data on lanternfish larvae [Myctophidae, Pisces] with oval eyes from the Indian and Pacific Oceans. Tr Inst Okeanol SSSR 1974, 96, 77–142. [Google Scholar]
- Rodrıguez, J.M.; Barton, E.D.; Eve, L.; Hernández-León, S. Mesozooplankton and ichthyoplankton distribution around Gran Canaria, an oceanic island in the NE Atlantic. Deep Sea Research Part I: Oceanographic Research Papers 2001, 48, 2161–2183. [Google Scholar] [CrossRef]
- Gartner, J.V. Jr.; Conley, W.J.; Hopkins, T.L. Escapement by fishes from midwater trawls: A case study using lanternfishes [Pisces: Myctophidae]. Fish Bull US 1989, 87, 213–222. [Google Scholar]
- Sabatés, A.; Saiz, E. Intra-and interspecific variability in prey size and niche breadth of myctophiform fish larvae. Mar Ecol Prog Ser 2000, 201, 261–71. [Google Scholar] [CrossRef]
- Conley, W.J.; Hopkins, T.L. Feeding Ecology of Lanternfish [Pisces: Myctophidae] Larvae: Prey Preferences as a Reflection of Morphology. Bull Mar Sci 2004, 84, 123–135. [Google Scholar]
- Sassa, C.; Kawaguchi, K. 2005. Larval feeding habits of Diaphus theta, Protomyctophum thompsoni, and Tarletonbeania taylori (Pisces: Myctophidae) in the transition region of the western North Pacific. Mar Ecol Prog Ser 2005, 298, 261–276. [Google Scholar] [CrossRef]
- Contreras, T. , Olivar, M. P., Bernal, A., & Sabatés, A. Comparative feeding patterns of early stages of mesopelagic fishes with vertical habitat partitioning. Mar Biol, 2015, 162, 2265–2277. [Google Scholar]
- Methot, R.D. Jr. Spatial covariation of daily growth rates of larval northern anchovy, Engraulis mordax, and northern lampfish, Stenobranchius leucopsarus. Rapp P-v Reun Cons int Explor Mer 1981, 178, 424–431. [Google Scholar]
- Sassa, C.; Takahashi, M. Comparative larval growth and mortality of mesopelagic fishes and their predatory impact on zooplankton in the Kuroshio region. Deep Sea Research Part I: Oceanographic Research Papers 2018, 131, 121–32. [Google Scholar] [CrossRef]
- Gartner. J.V. Jr. Life histories of three species of lanternfishes [Pisces: Myctophidae] from the eastern Gulf of Mexico I. Morphological and microstructural analysis of sagittal otoliths. Mar Biol 1991, 111, 11–20. [CrossRef]
- Gartner, J.V. Jr. Patterns of reproduction in the dominant lanternfish species [Pisces: Myctophidae] of the eastern Gulf of Mexico, with a review of reproduction among tropical-subtropical Myctophidae. Bull Mar Sci 1993, 52, 721–750. [Google Scholar]
- Hopkins, T.L. Gartner, J.V. Jr. Resource-partitioning and predation impact of a low-latitude myctophid community. Mar Biol 1992, 11, 185–197. [Google Scholar] [CrossRef]
- Hopkins, T.L.; Sutton, T.; Lancraft, T.M. The trophic structure and predation impact of a low latitude midwater fish assemblage. Prog Oceanogr 1996, 38, 205–239. [Google Scholar] [CrossRef]
- Sutton, T.T.; Hopkins, T.L. Species composition, abundance, and vertical distribution of the stomiid [Pisces: Stomiiformes] fish assemblage of the Gulf of Mexico. Bull Mar Sci 1996, 59, 530–542. [Google Scholar]
- Hopkins, T.L. The vertical distribution of zooplankton in the eastern Gulf of Mexico. Deep-Sea Res 1982, 29, 1069–1083. [Google Scholar] [CrossRef]
- Hopkins, T.L.; Lancraft, T.M. The composition and standing stock of mesopelagic micronekton at 27oN, 86oW in the eastern Gulf of Mexico. Contr Mar Sci 1984, 27, 143–158. [Google Scholar]
- Hopkins, T.L.; Flock, M.E.; Gartner, J.V. Jr.; Torres, J.J. Structure and trophic ecology of a low latitude midwater decapod and mysid assemblage. Mar Ecol Prog Ser 1994, 109, 143–156. [Google Scholar] [CrossRef]
- Hopkins, T.L.; Baird, R.C.; Milliken, D.M. A messenger-operated closing trawl. Limnol Oceanogr 1973, 18, 488–490. [Google Scholar] [CrossRef]
- Baird, R.C.; Hopkins, T.L. Trophodynamics of the fish Valenciennelus tripunctulatus. III. Energetics, resources and feeding strategy. Mar Ecol Prog Ser 1981, 5, 21–28. [Google Scholar] [CrossRef]
- Burke, B. J.; Rice, J. A. A linked foraging and bioenergetics model for southern flounder. Trans Amer Fish Soc 2002, 131, 120–131. [Google Scholar] [CrossRef]
- Laurence, G.C. Growth and survival of Haddock (Melanogrammus aeglefinus) larvae in relation to planktonic prey concentration. J. Fish. Res. Bd. Canada 1974, 31, 1415–1419. [Google Scholar] [CrossRef]
- Laurence, G.C. A bioenergetic model for the analysis of feeding and survival potential of winter flounder, Pseudopleuronectes americanus, larvae during the period from hatching to metamorphosis. Fish. Bull 1977, 75, 529–546. [Google Scholar]
- Eldridge, M.B.; Whipple, J.A.; Bowers, M.J. Bioenergetics and growth of striped bass, Morone saxatilis, embryos and larvae. Fish Bull US 1982, 80, 461–474. [Google Scholar]
- Brightman, R.V. Energetics and RNA/DNA ratio of red drum larvae Sciaenops ocellatus. PhD Dissertation, Univ of South Florida, Tampa, Florida. 1993, 1-178.
- Brightman, R.V.; Torres, J.J.; Donnelly, J.D.; Clarke, M.E. Energetics of larval red drum Sciaenops ocellatus. Part II, Growth and biochemical indicators. Fish Bull US 1997, 95, 431–444. [Google Scholar]
- Karjalainen, J.; Miserque, D.; Huuskonen, H. The estimates of food consumption in larval and juvenile fish: experimental evaluation of bioenergetic models. J Fish Biol 1997, 51, 39–51. [Google Scholar] [CrossRef]
- Morales, M.M.; Fiechter, J.; Field, J.C.; Kashef, N.S.; Hazen, E.L.; Carr, M.H. , Development and application of a bioenergetics growth model for multiple early life stages of an ecologically important marine fish. Ecological Modelling 2024, 488, 110575. [Google Scholar] [CrossRef]
- Houde, E.D.; Schekter, R.C. Oxygen uptake and comparative energetics among eggs and larvae of three subtropical marine fishes. Mar Biol 1983, 72, 283–293. [Google Scholar] [CrossRef]
- Donnelly, J.; Torres, J.J.; Hopkins, T.L.; Lancraft, T.M. Proximate composition of Antarctic mesopelagic fishes. Mar Biol 1990, 106, 13–23. [Google Scholar] [CrossRef]
- Winberg, G.G. The relation of the metabolic rate of fish to temperature. Role of metabolism and food requirements of fishes. 1956, 194, 21–38. [Google Scholar]
- Warren, C.E.; Davis, G.E. Laboratory studies on the feeding, bioenergetics and growth of fish. In: Gerking SD [ed.] The biological basis of fresh-water fish production. Wiley & Sons, New York, USA. 1967, 175-214. [Google Scholar]
- Deslauriers, D.; Chipps, S.R.; Breck, J.E.; Rice, J.A.; Madenjian, C.P. Fish Bioenergetics 4.0: An R-Based Modeling Application. Fisheries 2017, 42, 586–96. [Google Scholar] [CrossRef]
- Lowrey, O.H.; Roseborough, N.J.; Farr, A.L.; Randall, R.J. Protein measurement with the Folin phenol reagent. J Biol Chem 1951, 193, 265–275. [Google Scholar] [CrossRef]
- Bligh, E.G.; Dyer, W.F. A rapid method of total lipid extraction and purification. Can J Biochem Physiol 1959, 37, 911–917. [Google Scholar] [CrossRef]
- Dubois, M.; Gilles, K.A.; Hamilton, J.K.; Rebers, P.A.; Smith, F. Colorimetric method for determination of sugars and related substances. Analyt Chem 1956, 28, 350–356. [Google Scholar] [CrossRef]
- Brett, J.R.; Groves, T.D.D. Physiological Energetics. In: Hoar WS Randall DJ [eds.] Fish Physiology. Academic Press New York, NY, USA 1979, VIII, 279-351.
- Ware, D.M. Bioenergetics of pelagic fish: Theoretical change in swimming speed and motion with body size. J Fish Res Bd Canada 1975, 35, 33–41. [Google Scholar] [CrossRef]
- Govoni, J.J.; Peters, D.S.; Merriner, J.V. Carbon assimilation during larval development of the marine teleost Leiostomus xanthurus Lacepede. J Exp Mar Biol Ecol 1982, 64, 287–299. [Google Scholar] [CrossRef]
- Govoni, J.J.; Boehlert, G.M.; Watanabe, Y. The physiology of digestion in fish larvae. Environ Biol Fishes 16, 59–77. [CrossRef]
- Hansson, S.; Rudstam, L.G.; Kitchell, J.F.; Peppard, P.E.; Hildén, M.; Johnson, B.L. Predation rates by North Sea cod [Gadus morhua]–predictions from models on gastric evacuation and bioenergetics. ICES Journal of Marine Science 1996, 53, 107–114. [Google Scholar] [CrossRef]
- Beers, J.R.; Reid, F.M.H.; Stewart, G.L. Microplankton of the North Pacific Central Gyre. Population structure and abundance, June 1973. Int Revue Gesamten Hydrobiol 1975, 60, 607–638. [Google Scholar]
- Cetta, C.M.; Capuzzo, J.M. Physiological and biochemical aspects of embryonic and larval development of the winter flounder Pseudopleuronectes americanus. Mar Biol 1982, 71, 327–337. [Google Scholar] [CrossRef]
- Torres, J.J.; Brightman, R.V.; Donnelly, J.; Harvey, J. Energetics of larval red drum Sciaenops ocellatus. Part I: Oxygen consumption, specific dynamic action, and nitrogen excretion. Fish Bull US 1996, 95, 431–444. [Google Scholar]
- Houde, E.D.; Schekter, R.C. Simulated food patches and survival of larval bay anchovy, Anchoa mitchilli, and sea bream, Archosargus rhomboidalis. Fish Bull US 1978, 76, 483–486. [Google Scholar]
- Theilacker, G.H. Feeding ecology and growth energetics of larval northern anchovy, Engraulis mordax. Fish Bull US 1987, 85, 213–228. [Google Scholar]
- Infante, J. Z.; Cahu, C. L. Ontogeny of the gastrointestinal tract of marine fish larvae. Comparative Biochemistry and Physiology. Part C: Toxicology & Pharmacology 2001, 130, 477–487. [Google Scholar]
- Cassie, R.M. Micro-distribution of plankton. NZJ Sci 1959, 2, 398–409. [Google Scholar]
- Owen, R.W. Microscale plankton patchiness in the larval anchovy environment. Rapp P-v Reun Cons int Explor Mer 1981, 178, 363–368. [Google Scholar]
- Owen, R.W. Microscale and finescale variations of small plankton in coastal and pelagic environments. J Mar Res 1989, 47, 197–240. [Google Scholar] [CrossRef]
- Conley, W.J.; Turner, J.T. The Zooplankton and Phytoplankton of the Westport River Estuary. Hydrobiologia 1991, 210, 225–232. [Google Scholar] [CrossRef]
- Arthur, D.K. Food and feeding of larvae of three fishes occurring in the California Current, Sardinops sagax, Engraulis mordax, and Trachurus symmetricus. Fish Bull US 1976, 74, 517–530. [Google Scholar]
- Govoni, J.J.; Hoss, D.E.; Chester, A.J. Comparative feeding of three species of larval fishes in the northern Gulf of Mexico: Brevoortia patronus, Leiostomus xanthurus, and Micropogonias undulatus. Mar Ecol Prog Ser 1983, 13, 189–199. [Google Scholar] [CrossRef]
- Govoni, J.J.; Ortner, P.B.; Al-Yamani, F.; Hill, L.C. Selective feeding of spot, Leiostomus xanthurus, and Atlantic croaker, Micropogonias undulatus, larvae in the northern Gulf of Mexico. Mar Ecol Prog Ser 1986, 28, 175–183. [Google Scholar] [CrossRef]
- Stoecker, D.K.; Govoni, J.J. Food selection by young larval gulf menhaden [Brevoortia patronus]. Mar Biol 1984, 80, 299–306. [Google Scholar] [CrossRef]
- Brothers, E.B.; Williams, D.M.; Sale, P.F. Length of larval life in twelve families of fishes at "One Tree Lagoon", Great Barrier Reef, Australia. Mar Biol 1983, 76, 319–324. [Google Scholar] [CrossRef]
- Cowan, J.H. Jr. Age and growth of Atlantic croaker, Micropogonias undulatus, larvae collected in the coastal waters of the northern Gulf of Mexico as determined by increments in saccular otoliths. Bull Mar Sci 1988, 42, 349–357. [Google Scholar]
- Peebles, E.B.; Tolley, S.G. Distribution, growth and mortality of larval spotted seatrout, Cynoscion nebulosus: a comparison between two adjacent estuarine areas of southwest Florida. Bull Mar Sci 1988, 42, 397–410. [Google Scholar]
- Searcy, S.P.; Sponaugle, S. Variable larval growth in a coral reef fish. Mar Ecol Prog Ser 2000, 206, 213–226. [Google Scholar] [CrossRef]
Disclaimer/Publisher’s Note: The statements, opinions and data contained in all publications are solely those of the individual author(s) and contributor(s) and not of MDPI and/or the editor(s). MDPI and/or the editor(s) disclaim responsibility for any injury to people or property resulting from any ideas, methods, instructions or products referred to in the content. |
© 2025 by the authors. Licensee MDPI, Basel, Switzerland. This article is an open access article distributed under the terms and conditions of the Creative Commons Attribution (CC BY) license (https://creativecommons.org/licenses/by/4.0/).
Copyright: This open access article is published under a Creative Commons CC BY 4.0 license, which permit the free download, distribution, and reuse, provided that the author and preprint are cited in any reuse.


