Submitted:
11 July 2025
Posted:
11 July 2025
You are already at the latest version
Abstract
Growth regulatory factors (GRFs) and growth-regulating interacting factors (GIFs) play significant roles in plant growth, development, and environmental stress responses. Previous studies have reported the functions of GRF and GIF genes in model plants such as Arabidopsis and rice. Nevertheless, the GRF and GIF genes remained unexplored in cassava. Cassava (Manihot esculenta Crantz) is an important tropical economic crop. Its starchy storage roots serve as a major source of food and industrial raw materials, while its protein-rich leaves are widely consumed as leafy vegetables in Africa and other regions, offering high nutritional value and significant horticultural potential. This study identified 28 MeGRFs distributed on 13 chromosomes and 5 MeGIFs on 4 chromosomes through bioinformatic analysis and expression profiling. Promoter analysis uncovered cis-acting elements associated with growth, hormone signaling, and biotic stress responses. The MeGRFs and MeGIFs genes exhibited differential expression patterns in 11 different tissues. Real-time quantitative PCR analysis showed a significant expression for 11 MeGRFs and 3 MeGIFs under the Xanthomonas phaseoli pv. manihotis (Xpm) treatment. The protein-protein interaction network highlighted a potential GRF-GIF complex with MeGRF28 and MeGIF4 key hub genes. This study provides a theoretical basis for understanding the functional evolution of the GRF and GIF gene families in cassava and their roles in horticultural trait development and stress resistance mechanisms.
Keywords:
Cassava
; GRF gene family
; GIF gene family
; molecular evolution
; gene expression
; Xanthomonas phaseoli pv. manihotis
1. Introduction
Cassava, also known as the South Sea potato, is a perennial shrub of the Euphorbiaceae family, mainly distributed in tropical and subtropical regions. As an important tropical crop with food, economic, and horticultural value, cassava not only provides starch-rich storage roots that are widely used as food and industrial raw materials, but also produces tender leaves that are consumed as leafy vegetables in parts of Africa and Asia [1,2]. These leaves are rich in proteins, vitamins, and minerals, offering high nutritional value and great potential for horticultural development [3,4]. Due to its strong tolerance to drought, poor soils, and environmental stresses, cassava is considered a key crop for ensuring food and nutritional security in marginal areas, particularly in sub-Saharan Africa [5].
CBB (Cassava bacterial blight) is one of the major international quarantine diseases caused by Xanthomonas pxonopodis pv. manihotis (Xpm) [6]. It leads to severe destruction of the global cassava production [7] and has even been linked to famines throughout human history [8]. The initial signs of infection manifest as dark green, angular lesions on the leaves that appear water-soaked. Subsequently, the pathogen Xpm spreads through the vascular system, causing the leaves to wilt and eventually leading to the death of plants [9]. However, currently, there are no effective strategies for preventing or controlling CBB.In present years, enhancing genetic resistance to CBB has emerged as a critical research priority in cassava breeding research. When specific cell-surface receptors detect pathogen-associated molecular patterns (PAMPs), PAMP-triggered immunity (PTI) is initiated. This activates signaling pathways, orchestrating a cascade of disease-resistance responses and inducing the transcriptional activation of numerous defense-related genes in plant cells [10,11].
Transcription factors play a vital role in plant responses to environmental stress. They regulate plant growth, development, and stress signaling pathways by binding to cis-elements in the promoter regions of various genes [12]. This establishes complex regulatory networks that modulate physiological and metabolic responses, enabling plants to adapt to specific environmental conditions and stressors or enhance disease resistance [13].
Growth regulatory factors (GRFs) represent a large gene family characterized by highly conserved proteins. The N-terminal regions of GRF proteins contain two well-conserved domains: QLQ (Glu-Leu-Glu) and WRC (Trp-Arg-Cys) [14]. The QLQ domain, composed of the conserved Gln-Leu-Gln (QX₃LX₂Q) motif and its adjacent residues, is also found in the SWI2/SNF2 chromatin-remodeling protein complex in Saccharomyces cerevisiae [15,16,17]. The GIF proteins possess a highly conserved SNH domain at the N-terminus that directly interacts with the GRF QLQ domain [18]. The WRC domain, which consists of three cysteines and one histidine residue (CX₉CX₁₀CX₂H, also known as the C3H motif), serves as a DNA-binding domain that regulates downstream gene expression by binding to cis-acting elements [19,20]. In contrast to the conserved N-terminal region, the C-terminal region of the GRF proteins is less conserved and contains additional motifs such as TQL (Thr, Gln, Leu), FFD (Phe, Phe, Asp), and GGPL (Gly, Gly, Pro, Leu) [14,15,21,22].
GRFs are unique plant-specific transcription factors that regulate plant growth, development, and responses to biotic stresses [23,24,25]. The first GRF gene, named OsGRF1, was identified in rice (Oryza sativa) and was found to be induced by gibberellin (GA₃) [15], where it played a key role in stem elongation. The GRF gene family comprises 9 members in Arabidopsis thaliana, 12 in rice(Oryza sativa), 14 in maize(Zea mays), and 17 in Chinese cabbage (Brassica rapa) [14,21,26,27,28]. Extensive research has demonstrated that GRF genes are involved in various aspects of plant development, including leaf growth [29], flower organ development [30,31], grain size [32], root development [33], and the regulation of plant organ lifespan [34]. Most GRF genes exhibit higher expression levels in meristematic and young tissues, while their expression is typically reduced in mature tissues [21]. In A. thaliana, triple null mutants of grf1/2/3 produce smaller leaves and cotyledons, while single mutants showed no noticeable changes in phenotype, double mutants exhibited only slight alterations [21]. The overexpression of AtGRF1 and AtGRF2 results in larger leaves, longer petioles, and a delay in bolting the inflorescence stem relative to wild-type plants [21]. In rice, the overexpression of OsGRF3 and OsGRF10 induces the formation of adventitious roots at nodesand give rises to abnormal meristematic activity [35,36,37]. In addition, GRF genes contribute to stress responses by coordinating plant growth with defense mechanisms. For example, the overexpression of AtGRF7 in Arabidopsis enhances resistance to drought and salt stress [23]. Certain GRFs are involved in responding to environmental stress. For instance, OsGRF6 is crucial for responding to biotic and abiotic stresses, contributing to the balance between growth and disease resistance in rice [37,38,39,40]. Likewise, AtGRF1 and AtGRF3 have been implicated in the biotic stress response following Heterodera schachtii infection [33]. Nonetheless, the roles of GRF family genes in responding to environmental stress in various plant species, including cassava, are still mostly uninvestigated [22].
GIF proteins represent a conserved class of plant transcriptional coactivators, functionally analogous to human SYT coactivators [41] and classified within the SSXT superfamily [25]. Structurally, these proteins feature an N-terminal SNH domain highly conserved and capable of direct interaction with the QLQ domain of GRF proteins [42], and a C-terminal transactivation domain rich in glutamine (Q) and glycine (G), termed the QG domain due to its distinctive composition [27]. In A. thaliana, the GIF family comprises three members: GIF1, GIF2, and GIF3 [23,43]. While AtGIF1 regulates leaf growth and morphology [33,44], GIF2 and GIF3 primarily enhance cell proliferation, influencing leaf size [43]. Emerging evidence indicates that GIF proteins may interact with additional regulatory factors to coordinate plant growth and development [34,45,46,47]. Ultimately, it is important to note that although GIFs have the ability to activate transcription, their absence of a DNA-binding domain indicates that they act as transcriptional co-regulators instead of being direct transcription factors [46,47].
The GRF family encodes transcription factors that bind to DNA in a sequence-specific manner and interact with the transcriptional coactivator GIF to form a functional transcriptional complex [42]. This complex plays crucial roles in plant growth and development, including leaf, stem, root, seed, and flower development [19]. The functions of GRF-GIF fusion proteins have been extensively studied. For example, a GRF-GIF chimeric protein in wheat enhances plant regeneration, improves transformation efficiency [48], and facilitates gene editing applications. In A. thaliana, a GRF-GIF fusion protein increases chlorophyll content and delays leaf senescence [49]. Additionally, these fusion proteins influence biotic stress responses. For instance, in cabbage (Brassica oleracea), the expression of a GRF5-GIF1-GRF5 fusion protein optimizes genetic transformation efficiency [50]. By using an optimized gene editing and transformation system, researchers successfully knocked out the BoBPM6 and BoDMR6 genes, generating novel cabbage germplasm with broad-spectrum disease resistance [50]. These findings highlight the pivotal role of GRF-GIF interactions in plant development and their potential in agricultural biotechnology for crop improvement.
To better understand the functional evolution of GRF and GIF genes in cassava and their roles in shaping horticultural traits and to investigate their possible regulatory functions in response to Xpm, we performed a genome-wide identification and expression analysis of the GRF and GIF gene families. A total of 28 MeGRFs and 5 MeGIFs were identified in the cassava genome. Comprehensive in silico analyses were conducted to characterize their chromosomal distribution, cis-regulatory elements, evolutionary relationships, genome collinearity, and patterns of selection pressure. In addition, we investigated their potential functional roles through protein-protein interaction network predictions and gene expression profiling. These results will offer important understanding of the regulatory roles of GRF and GIF family members in relation to cassava bacterial blight (CBB) infection.
2. Materials and Methods
2.1. Identification Analysis of the MeGRFs and MeGIFs Gene in the Cassava Genome
The cassava genome file (version DM v6.1) was downloaded from the Spud DB database (http://spuddb.uga.edu/). The amino acid sequences of Arabidopsis (TAIR, http://www.arabidopsis.org/) and rice (RGAP, http://rice.uga.edu/) GRF and GIF proteins were used as queries in BlastP homology searches to identify candidate GRF and GIF proteins against the cassava genome DM v6.1. All retrieved cassava amino acid sequences were validated for the presence of QLQ and WRC (PF08880, PF08879, respectively; http://pfam.xfam.org/) domains and SSXT (PF05030) domains by the CDD (Conserved Domain Database; https://www.ncbi.nlm.nih.gov/cdd/) and SMART (http://smart.embl-heidelberg.de/) programs. The physicochemical properties of MeGRF protein, including the number of amino acids, molecular weight (MW), isoelectric point (pI), and average hydrophilicity (GRAVY), were analyzed using the ExPASy ProtParam tool (http://www.expasy.org/protparam/). The subcellular localization of GRF and GIF proteins was determined using the web server predictor in the Cell-PLoc package (http://www.csbio.sjtu.edu.cn/bioinf/plant-multi/).
2.2. Phylogenetic, Conserved Motif, and Gene Structure Analysis
To visualize the evolutionary relationship between GRF and GIF family members, the full-length amino acid sequences of MeGRF, AtGRF, OsGRF, and SlGRF were aligned using ClustalW (https://www.genome.jp/tools-bin/clustalw). A phylogenetic tree was constructed using the neighbor-joining method in MEGA11 software (https://www.megasoftware.net/), and a bootstrap test was performed using 1000 replicates. Homology analysis was performed for potato GRF proteins, and the results were visualized using the SnapGene tool (https://www.snapgene.com/). The exon-intron structure diagram of the MeGRF gene was visualized using GSDS2.0 (GeneStructure Display Server 2.0, http://gsds.cbi.pku.edu.cn/index.php). In addition, the MEME tool (https://meme-suite.org/meme/tools/meme) was used to predict the conserved motifs of cassava GRF family members. The number of motifs was set to 8, with 0 or 1 occurrence in each sequence. Multiple sequence alignments were performed on the three species using MEGA software and visualized with jalviewg software .
2.3. Cis-Acting Element Analysis of the MeGRFs and MeGIFs Promoters
The 2000 bp upstream sequence of the MeGRF gene was extracted using TBtools software based on the full-length DNA sequence of the cassava genome. The cis-acting elements of the potential promoter region were identified using the PlantCARE database (http://bioinformatics.psb.ugent.be/webtools/plantcare/html/).
2.4. Expression Profiles of MeGRFs and MeGIFs Genes
The expression profiles of MeGRFs and MeGIFs genes were determined using data from the laboratory. The tissue specificity of different tissues and organs (leaves, midribs, axillary buds, somatic embryos, fragile callus, fibrous roots, tuber roots, stem averages, petioles, root tips, and shoot tips) was analyzed. Data on cassava under different stresses (drought, low temperature, microbial pathogen infection, and insect pests) were analyzed. A heat map of the expression pattern was constructed using TBtools (https://github.com/CJ-Chen/TBtools/).
2.5. Synteny Analysis of MeGRFs and MeGIFs Family Genes
To characterize duplication events involving GRF and GIF genes, MCScanX (Multiple Collinearity Scan toolkit) was used to analyze intra- and intergenomic synteny. Homologous genes located on the same chromosome closer than 100 kb, and with sequence similarity and sequence coverage > 75 %, were regarded as tandem replicated genes.
2.6. RNA Extraction and Real-Time Quantitative PCR
Total RNA was extracted by RNAprep Pure Plant Plus Kit (TIANGEN Biotech Co., Ltd., Beijing) according to the manufacturer’s instructions. Approximately 1 mg of extracted total RNA was used to synthesize cDNA using a reverse transcriptase kit and the manufacturer’s instructions (TIANGEN Biotech Co., Ltd., Beijing).and verified using 1 % agarose gel electrophoresis and Nanodrop Nucleic Acid Detector (Nano-300 Micro-Spectrophotometer (ALLSHENG, Hangzhou, China) for gene expression analysis. .cDNA using a reverse transcriptase kit and the manufacturer’s instructions (TIANGEN Biotech Co., Ltd., Beijing). The first strand of cDNA was created using a reverse transcriptase kit (M1631, Thermo, USA). A 7500 Real-Time PCR System with a total reaction volume of 20 mL was used for real-time PCR, which included 2 mL cDNA template, 1 mL forward primer, 1 mL reverse primer, 10 mL qPCR Master Mix, and 6 mL sterilized ddH2O. The real-time PCR amplification protocol was set at 95°C for 30 seconds (s) for 40 cycles, 95°C for 5 s, 55°C for 30 s,72°C for 30 s, and 72°C for 10 minutes. Each sample was performed in 3 replicates, and the 2-ΔΔCt method was used for relative expression analysis. The SPSS software was used to perform statistical data analysis, and the t-test was used to test for significance between the different treatments.
2.7. Interaction Analysis Between MeGRFs and MeGIFs Family Proteins
A protein-protein interaction network was constructed between all GRF and GIF proteins identified in the same species using the online software STRING (http://string db.org/). Selected organisms were the same as the species analyzed; the confidence level of minimum required interaction score parameters was set to 0.3, and other parameters were set to the default values. The results were visualized using Cytoscape 3.8.2.
The interaction domain of proteins and their structural information were predicted based on protein sequences through the AlphaFold website (https://colab.research.google.com/github/sokrypton/ColabFold/blob/main/AlphaFold2.ipynb) and the corresponding PDB structure files. The downloaded PDB file of the docking result can be opened and viewed with visual software such as PyMOL Alternatively, the online tool PDBePISA can be used to analyze the docking results (https://www.ebi.ac.uk/msd-srv/prot_int/).
2.8. Coexpression Analysis of MeGRFs and MeGIFs
The FPKM values of MeGRF and MeGIF gene families under XpmCNH11 infection were calculated using the R software package “Hmisc.” The Pearson correlation coefficient between the GRF and GIF families was calculated.
3. Results
3.1. Identification Analysis of the MeGRFs and MeGIFs Gene in the Cassava Genome
Through BLAST and HMMER searches of the WRC (PF08879) and QLQ (PF08880) domains, 28 non-redundant candidate MeGRF genes were identified from the cassava genome database. We further named these genes MeGRF1-28 based on their position on the chromosome. ranging from 191 aa (MeGRF5) to 2243 aa (MeGRF3 and MeGRF10) amino acids in length. The molecular weights ranged from 20990.78 Da (MeGRF5) to 251011.23 Da (MeGRF10), and the isoelectric points were between 5.65 (MeGRF6) and 9.67 (MeGRF17). The pI values of 21 PgGRF members were greater than 7. The instability index ranged from 39.8 (MeGRF4) to 61.43 (MeGRF17), the Aliphatic Index was between 45.29 (MeGRF19) and 75.22 (MeGRF12), and the Grand Average of Hydropathicitywas from -1.018 (MeGRF17) to -0.471 (MeGRF11) (Table S1).
Furthermore, we obtained five MeGIF genes through BLAST and HMMER searches of the conserved domain SSXT (PF05030). These genes were named MeGIF1-5 based on their position on the chromosome. The amino acid lengths of the GIF proteins in cassava ranged from 144 aa (MeGIF1) to 224 aa (MeGIF5). In addition, the interval of molecular weights was 16790.96 Da (MeGIF1) to 23706.29 Da (MeGIF5), and the isoelectric points varied from 5.63 (MeGIF2) to 6.12 (MeGIF1). These outcomes indicated that these GIF proteins were rich in acidic amino acids. Also, the instability index ranged from 58.59 (MeGIF3) to 77.37 (MeGIF1), the Aliphatic Index flctuated between 54.11 (MeGIF4) and 68.54 (MeGIF1), and the Grand Average of Hydropathicity spanned from -0.88 (MeGIF1) to -0.582 (MeGIF4) (Table S1).

Table 1.
Physical and chemical properties of the MeGRFs and MeGIFs gene family proteins.
| Gene ID |
Number of Amino Acid | Molecular Weight | Theoretical pI | Instability Index | Aliphatic Index | Grand Average of Hydropathicity |
|---|---|---|---|---|---|---|
| MeGRF1 | 495 | 52400.94 | 6.32 | 55.07 | 61.58 | -0.507 |
| MeGRF2 | 218 | 23968.14 | 8.99 | 53.19 | 72.02 | -0.544 |
| MeGRF3 | 2243 | 250934.06 | 9.08 | 55.41 | 72.58 | -0.706 |
| MeGRF4 | 480 | 51734.08 | 9.29 | 39.8 | 65.25 | -0.604 |
| MeGRF5 | 191 | 20990.78 | 9.21 | 61.39 | 69.95 | -0.609 |
| MeGRF6 | 257 | 29154.26 | 5.65 | 47.84 | 65.64 | -0.962 |
| MeGRF7 | 496 | 54818.67 | 9.17 | 48.77 | 61.33 | -0.695 |
| MeGRF8 | 359 | 40723.21 | 8.69 | 56.36 | 55.99 | -0.85 |
| MeGRF9 | 345 | 38959.98 | 8.22 | 58.33 | 52.61 | -0.866 |
| MeGRF10 | 2243 | 251011.23 | 8.93 | 58.16 | 70.4 | -0.746 |
| MeGRF11 | 475 | 51559.57 | 9.54 | 47.05 | 73.87 | -0.471 |
| MeGRF12 | 276 | 31666.05 | 6.51 | 53.13 | 75.22 | -0.522 |
| MeGRF13 | 595 | 64651.39 | 6.63 | 56.15 | 66.87 | -0.588 |
| MeGRF14 | 339 | 37222.87 | 8.32 | 45 | 66.25 | -0.502 |
| MeGRF15 | 409 | 44355.41 | 8.61 | 53.14 | 62.32 | -0.581 |
| MeGRF16 | 323 | 35901.59 | 9.57 | 56.67 | 60.93 | -0.909 |
| MeGRF17 | 335 | 37622.51 | 9.67 | 61.43 | 53.28 | -1.018 |
| MeGRF18 | 944 | 107236.37 | 6.11 | 42.81 | 75.67 | -0.647 |
| MeGRF19 | 327 | 36385.27 | 8.74 | 57.02 | 45.29 | -0.784 |
| MeGRF20 | 340 | 38313.39 | 9.32 | 54.09 | 59.06 | -0.695 |
| MeGRF21 | 396 | 43061.93 | 7.81 | 47.56 | 62.37 | -0.624 |
| MeGRF22 | 344 | 38540.8 | 9.01 | 57.02 | 49.39 | -0.798 |
| MeGRF23 | 448 | 49554.39 | 5.97 | 59.41 | 61.61 | -0.552 |
| MeGRF24 | 1520 | 172018.07 | 5.94 | 46.36 | 75.61 | -0.488 |
| MeGRF25 | 1036 | 117794.42 | 8.56 | 53.77 | 75.81 | -0.543 |
| MeGRF26 | 384 | 43073.87 | 8.84 | 53.73 | 56.88 | -0.783 |
| MeGRF27 | 1043 | 118549.18 | 8.3 | 51.52 | 78.68 | -0.519 |
| MeGRF28 | 627 | 68086.34 | 8.68 | 51.04 | 61.18 | -0.635 |
| MeGIF1 | 144 | 16790.96 | 6.12 | 77.37 | 68.54 | -0.88 |
| MeGIF2 | 208 | 22243.16 | 5.63 | 69.46 | 60.24 | -0.606 |
| MeGIF3 | 207 | 21958.62 | 5.83 | 58.59 | 54.98 | -0.676 |
| MeGIF4 | 219 | 23066.56 | 5.72 | 64.57 | 54.11 | -0.582 |
| MeGIF5 | 224 | 23706.29 | 5.8 | 62.54 | 56.34 | -0.617 |
MeGRFs and MeGIFs were unevenly distributed on cassava chromosomes. MeGRF genes were distributed across 13 chromosomes (chromosomes1-5,chromosomes8-9, chromosomes11-13, chromosomes16-18). Some chromosomes harbored multiple MeGRF genes. For example, Chromosome08 had five genes ( MeGRF15-19), while some chromosomes had only one MeGRF gene (chromosomes4, chromosomes11-13, chromosomes17-18). In contrast, MeGIF genes were distributed across 4 chromosomes (chromosomes1, chromosomes5, chromosomes8-9). All chromosomes had only one gene except for two genes on the first chromosome (Figure 1).
3.2. Phylogenetic, Conserved Motif, and Gene Structure Analysis
To explore the evolutionary relationships and sequence homology between MeGRF proteins, A. thaliana, and rice, a phylogenetic tree was constructed using MEGA11 software. The evolutionary relationship of MeGRFs was analyzed, and 49 MeGRFs from 3 plant species (AtGRF,OsGRF,MeGRF) were clustered into 6 subgroups, designated as Group 1, Group 2, Group 3, Group 4, Group 5, and Group 6 (Figure 2c). 6, 2, 6, 2, 5, and 7 MeGRF members were assigned to subgroups 1, 2, 3, 4, 5and 6, respectively (Figure 2). Notably, MeGRFs were found to be more closely related to AtGRFs, probably due to the fact that both cassava and Arabidopsis are dicotyledonous species. The clear separation of subgroups in the tree highlighted the conserved nature and evolutionary divergence of the MeGRFs gene family across different species. For instance, Group 4 includes MeGRF proteins from cassava(MeGRF15,MeGRF21) and Arabidopsis(AtGRF3-4,AtGRF7-8), illtustrating the potential conservation of roles in growth and development. In contrast, Group 6 contained only MeGRFs, which implied the cassava-specific functional evolution. Furthermore, within Group 2, OsGRF6 was previously reported to enhance rice yield and resistance to bacterial blight, suggesting that members of this subgroup may also play key roles in biotic stress responses (Figure 2).
The phylogenetic relationship of MeGIFs clustered 15 MeGIFs from 4 plant species(MeGRF,AtGRF,SlGRF,OsGRF) into 4 subgroups, subsequently designated as Group 1, Group 2, Group 3, and Group 4. 5, 3, 2, and 5 MeGIF members are assigned to subgroups 1, 2, 3, 4, and 5, respectively (Figure 2d). The phylogenetic tree showed that MeGIF was more closely related to AtGIF and SlGIF than OsGIF (Figure 2d). This could be due to the fact that cassava and tomato are both dicotyledons. Group 4 consisted of various MeGIF members along with SiGIF1a and SiGIF1b, creating a closely-knit evolutionary group. This indicated that these genes might be involved in comparable regulatory pathways or possess conserved functional traits. In contrast, Group 3 contained only MeGIF1 and OsGIF1, indicating that this subgroup may represent a more conserved and functionally distinct lineage.
To determine the structural diversity and functional prediction of MeGRFs and MeGIFs, the amino acid sequences of MeGRFs and MeGIFs family members were compared several times. A total of 10 conserved motifs were identified in MeGRF. Among them, motifs 1 and 2 are labeled as WRC and QLQ domains, respectively, and they are included in most of the MeGRF family members, indicating that these two domains are highly conserved. It is important to note that the characteristics of these motifs are consistent within the same cluster. For example, MeGRF22, MeGRF9, MeGRF8, and MeGRF26 exhibit 4 common conserved motifs (motifs 1, 2, 3, and 5). The gene structure of the MeGRF gene family was further analyzed using the GSDS online tool. The lengths of MeGRF genes range from approximately 2,000 to 12,000 bp.Members of the same phylogenetic cluster exhibited similar exon-intron structures, suggesting a strong correlation between gene structure and evolutionary relationships within the gene family. In addition, MeGRF8, MeGRF19, and MeGRF15 had only one 3’ untranslated region (UTR), while MeGRF22, MeGRF9, MeGRF23, MeGRF14, MeGRF20, and MeGRF7 did not have a 3’ UTR, and the other 19 MeGRF genes have 5’ CDS and 3’ UTR at both ends (Figure 2d). A total of 10 conserved motifs were identified in MeGIFs. Among them, motif 1 is labeled as the SSXT domain, and they are found in all MeGIF gene members, indicating that this domain is highly conserved. It is important to note that the characteristics of these motifs are consistent within the same cluster. For example, MeGIF2 and MeGIF3 exhibit 7 common conserved motifs (motifs 1, 2, 3, 4, 5, 8, and 9). The gene structure of the MeGIF gene family was further analyzed using the GSDS online tool. The lengths of MeGIF genes range from approximately 1,000 to 5,000 bp, with each gene containing two to three introns. Members of the same phylogenetic group showed comparable exon-intron arrangements, indicating a significant link between gene structure and the evolutionary connections among members of the gene family. In addition, MeGIF2 did not have a 3′ UTR at either end, while the other 4 MeGIF genes have 5′-CDS and 3′-UTR at both ends (Figure 3 and Figure 4).
3.3. Synteny Analysis of MeGRFs and MeGIFs Genes
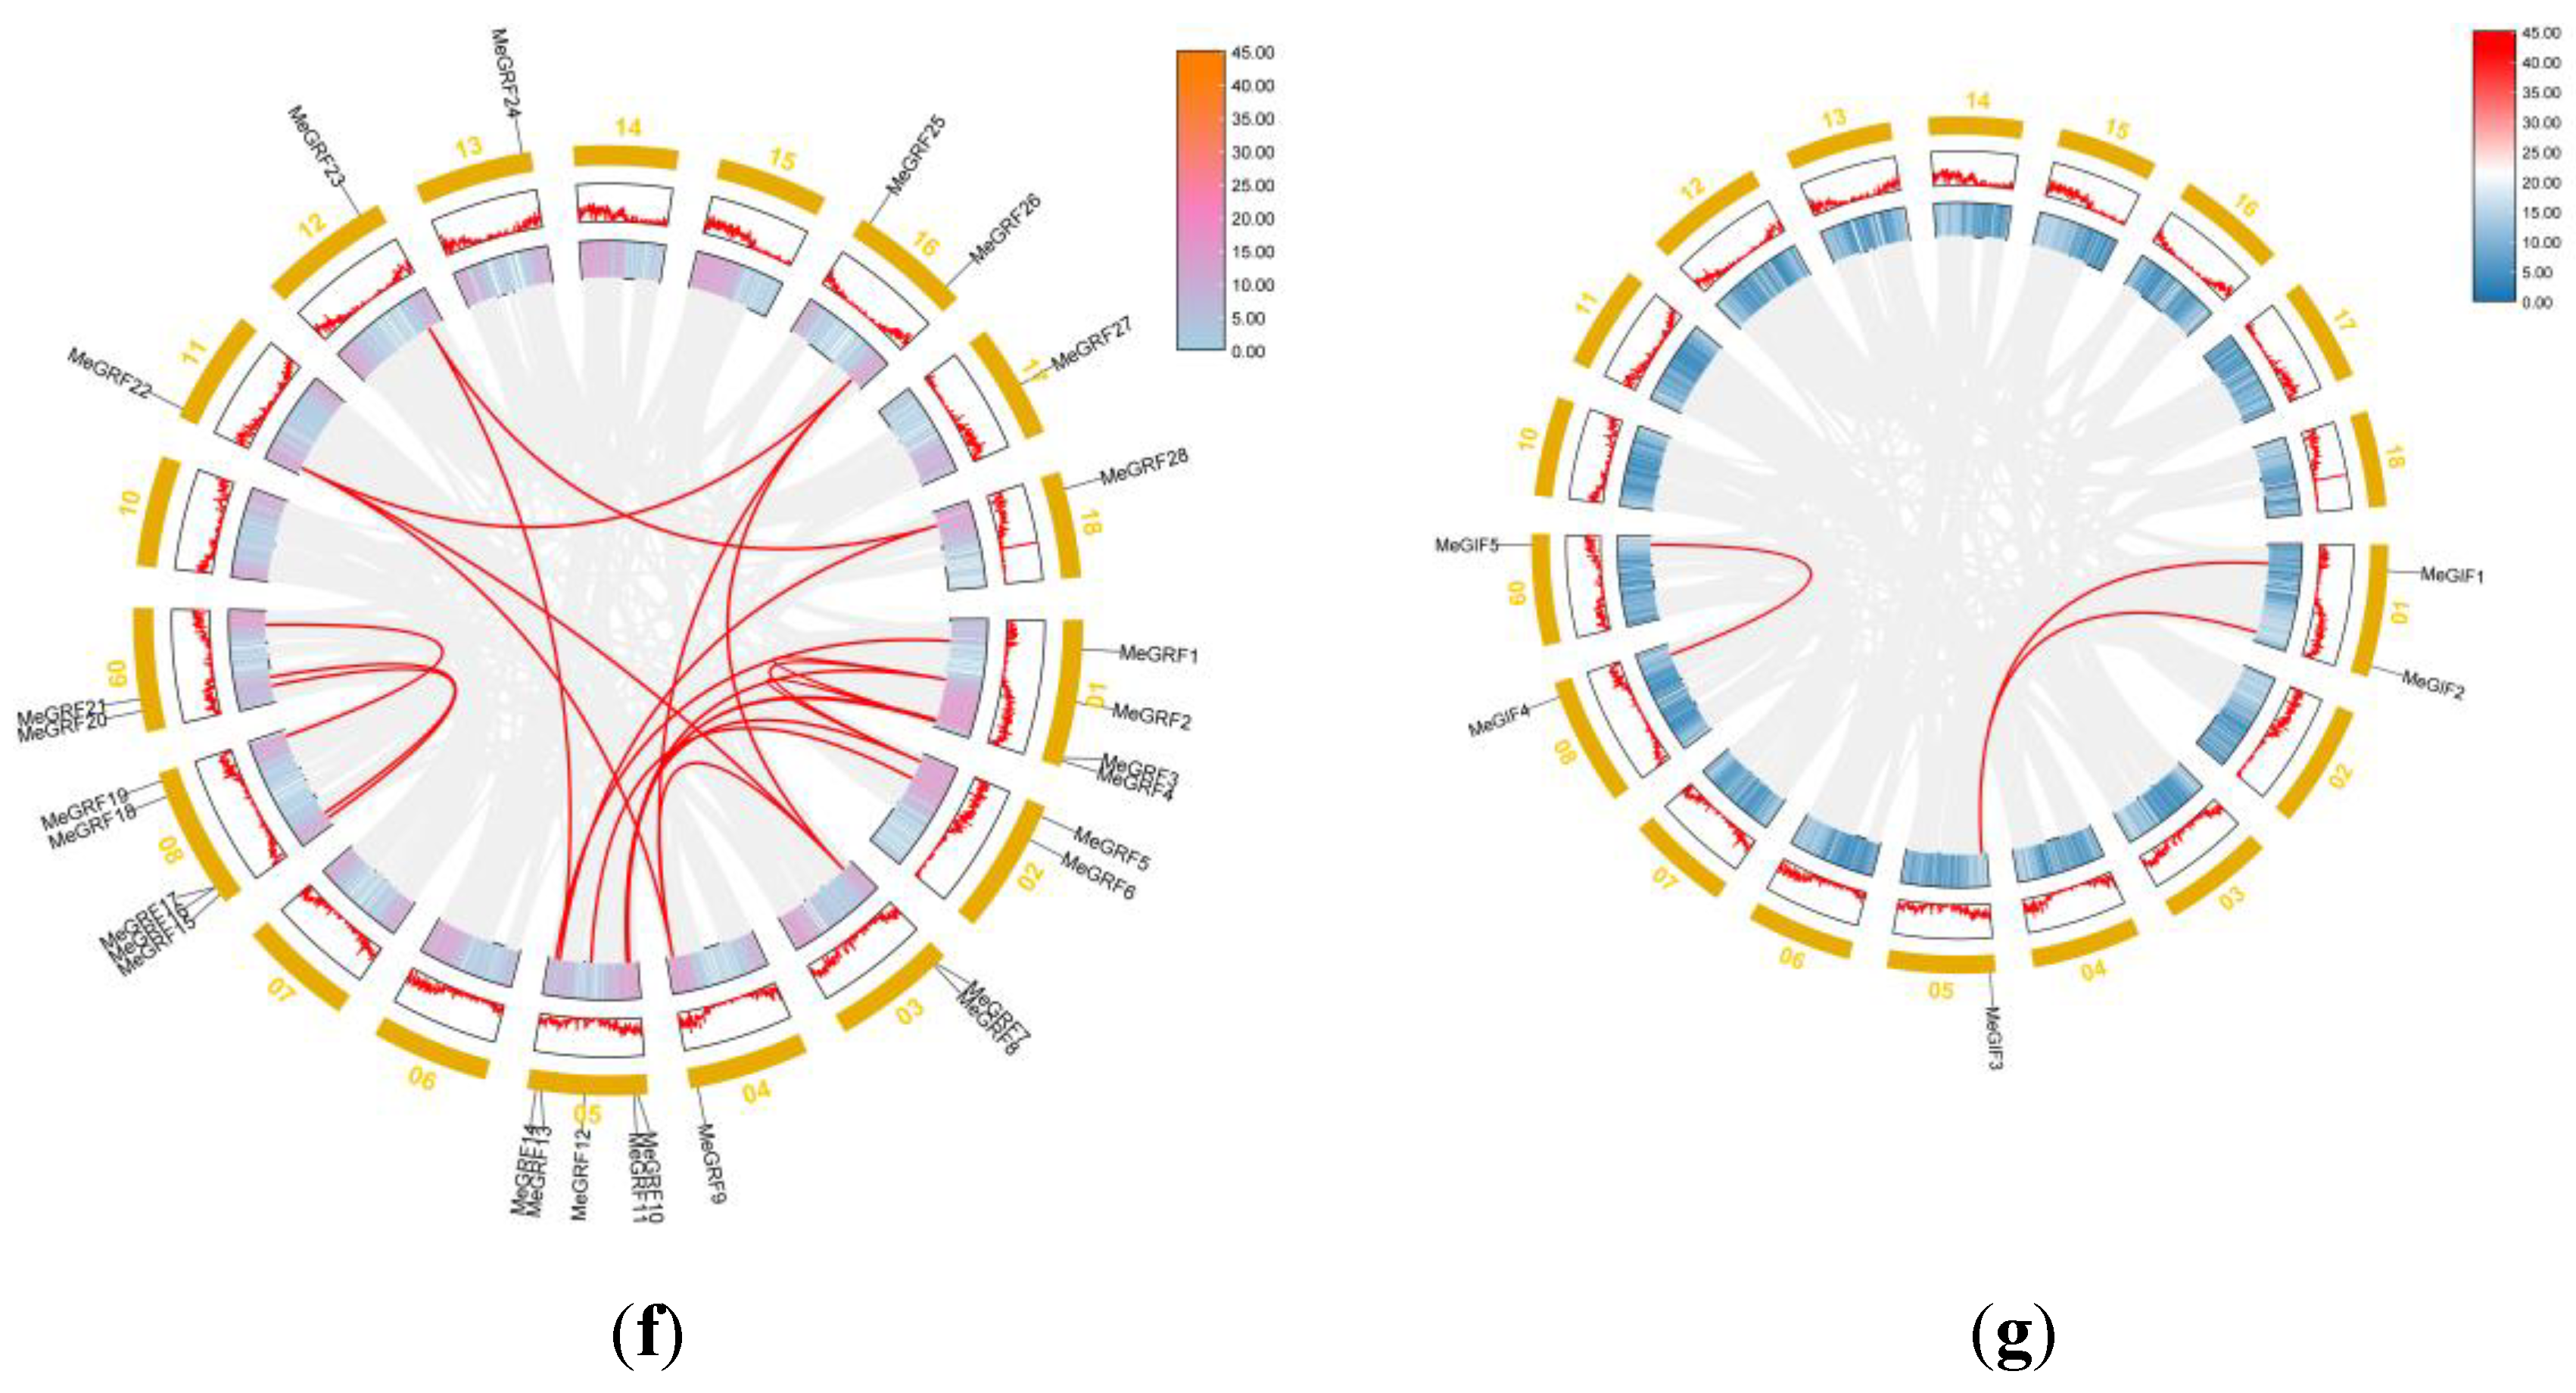
Gene duplication events were regarded as the primary driving force of evolution.. Previous studies defined two or more adjacent homologous genes on a single chromosome as tandem duplicated genes [51]. In contrast, homologous genes between different genomic regions or chromosomes were considered segmental duplication genes [51]. An intraspecific collinearity analysis showed that 20 pairs of MeGRFs originated from segmental replication (whole-genome duplication, WGD). In the MeGIF family, 3 pairs of MeGIFs originated from segmental replication. Based on the above results, we can infer that WGD events lead to the derivation of new MeGRF gene members. The same phenomenon was found in many other plant GRF and GIF families, such as Panax ginseng (Figure 4) [52].
Figure 4.
Collinearity analysis of GRFs and GIFs. The red lines indicate probably duplicated MeGRFs and MeGIFs gene pairs. (g) Collinearity analysis of all MeGRFs in the cassava genome. (h) Collinearity analysis of all MeGIFs in the cassava genome.
Figure 4.
Collinearity analysis of GRFs and GIFs. The red lines indicate probably duplicated MeGRFs and MeGIFs gene pairs. (g) Collinearity analysis of all MeGRFs in the cassava genome. (h) Collinearity analysis of all MeGIFs in the cassava genome.
3.4. Cis-Acting Elements in the Promoter Regions of MeGRFs and MeGIFs Genes
To further understand the function of cis-acting elements within the promoter region of MeGRF, the promoter region of MeGRFs was submitted to PlantCARE for prediction. These cis-regulatory elements are divided into four categories: light-responsive elements, hormone-responsive elements, growth and development-related elements, and stress-related elements. Light response includes seven cis-regulatory elements, accounting for the majority of the total number. MeGRF11, MeGRF19, and MeGRF28 were found to contain several cis-acting elements that were closely associated with hormonal responses, including ABRE (associated with abscisic acid reactivity), AuxRR-core (associated with auxin reactivity), TCA-element (associated with salicylic acid reactivity), CGTCA, and TGACGmotif (associated with MeJA reactivity), and P-box (associated with gibberellin reactive element). Most of the MeGRF genes containing the CGTCA and TGACG motifs were observed 48 times, accounting for 32 % of the hormone-associated cis-acting elements. The subsequent category pertains to plant growth and development, and it comprises 6 distinct types of cis-regulatory elements: CAT-box, CCAAT-box, GCN4 motif, Box II-like sequence, A-box, and O2-site. The promoter regions of the 28 MeGRFs contain cis-acting elements associated with environmental stresses. The ARE motif, critical for anaerobic induction, has been identified 53 times, accounting for 53 % of the stress-related cis-acting elements. TC-rich repeats, and defense and stress-responsive elements were identified from MeGRF10, MeGRF15, and MeGRF25 (Figure 5).
The cis-acting element in the promoter of MeGIFs is mainly responsible for the growth and development of plants, TCA element, CGTCA- and TGACG-motif, TATC-box (the MeJA-responsiveness), TGA-element (auxin-responsive element), ABRE, P-box and GARE-motif (gibberellins responsive element). The promoter region of the four MeGIFs contains cis-acting elements associated with environmental stress. LTR (Low-Temperature Responsive cis-acting Element), MBS (drought-induced cis-acting element), MBSI (salt stress-induced cis-acting element), and the ARE motif have been discovered 12 times, accounting for 50 % of the stress-related cis-acting elements. The promoter of MeGIF5 contains CAT-box (associated with meristem development). Similarly, the promoter of MeGIF2 contains an MSA-like motif that is implicated in cell cycle regulation. In addition, cis-acting elements associated with light-responsive elements (G-box and Box 4) were also found in the promoters of MeGIFs (Figure 5).
3.5. Tissue-Specific Expression of MeGRFs and MeGIFs in Cassava
The tissue-specific expression analysis of 28 genes showed that these genes exhibited significant expression differences across various cassava tissues. Overall, Six genes (MeGRF3, MeGRF6, MeGRF10, MeGRF18, MeGRF25, and MeGRF28) showed higher expression in the Lateral bud, and SAM was highly expressed in all 11 tested tissues (FPKM > 5). In comparison, two genes (MeGRF14 and MeGRF23) exhibited consistently low expression across all tissues (FPKM < 1)(Figure 6).
The examination of tissue-specific expression for the five MeGIF genes revealed that all MeGIFs, with the exception of MeGIF5, showed high expression levels in leaves (FPKM > 10).. Notably, MeGIF2 and MeGRF3 were highly expressed across all 11 tissues. The distinct expression patterns of MeGRFs and MeGIFs suggest that these genes may participate in different biological processes in various cassava tissues(Figure 6).
3.6. Expression Analysis of MeGRFs and MeGIFs Under Different Biotic and Abiotic Stresses
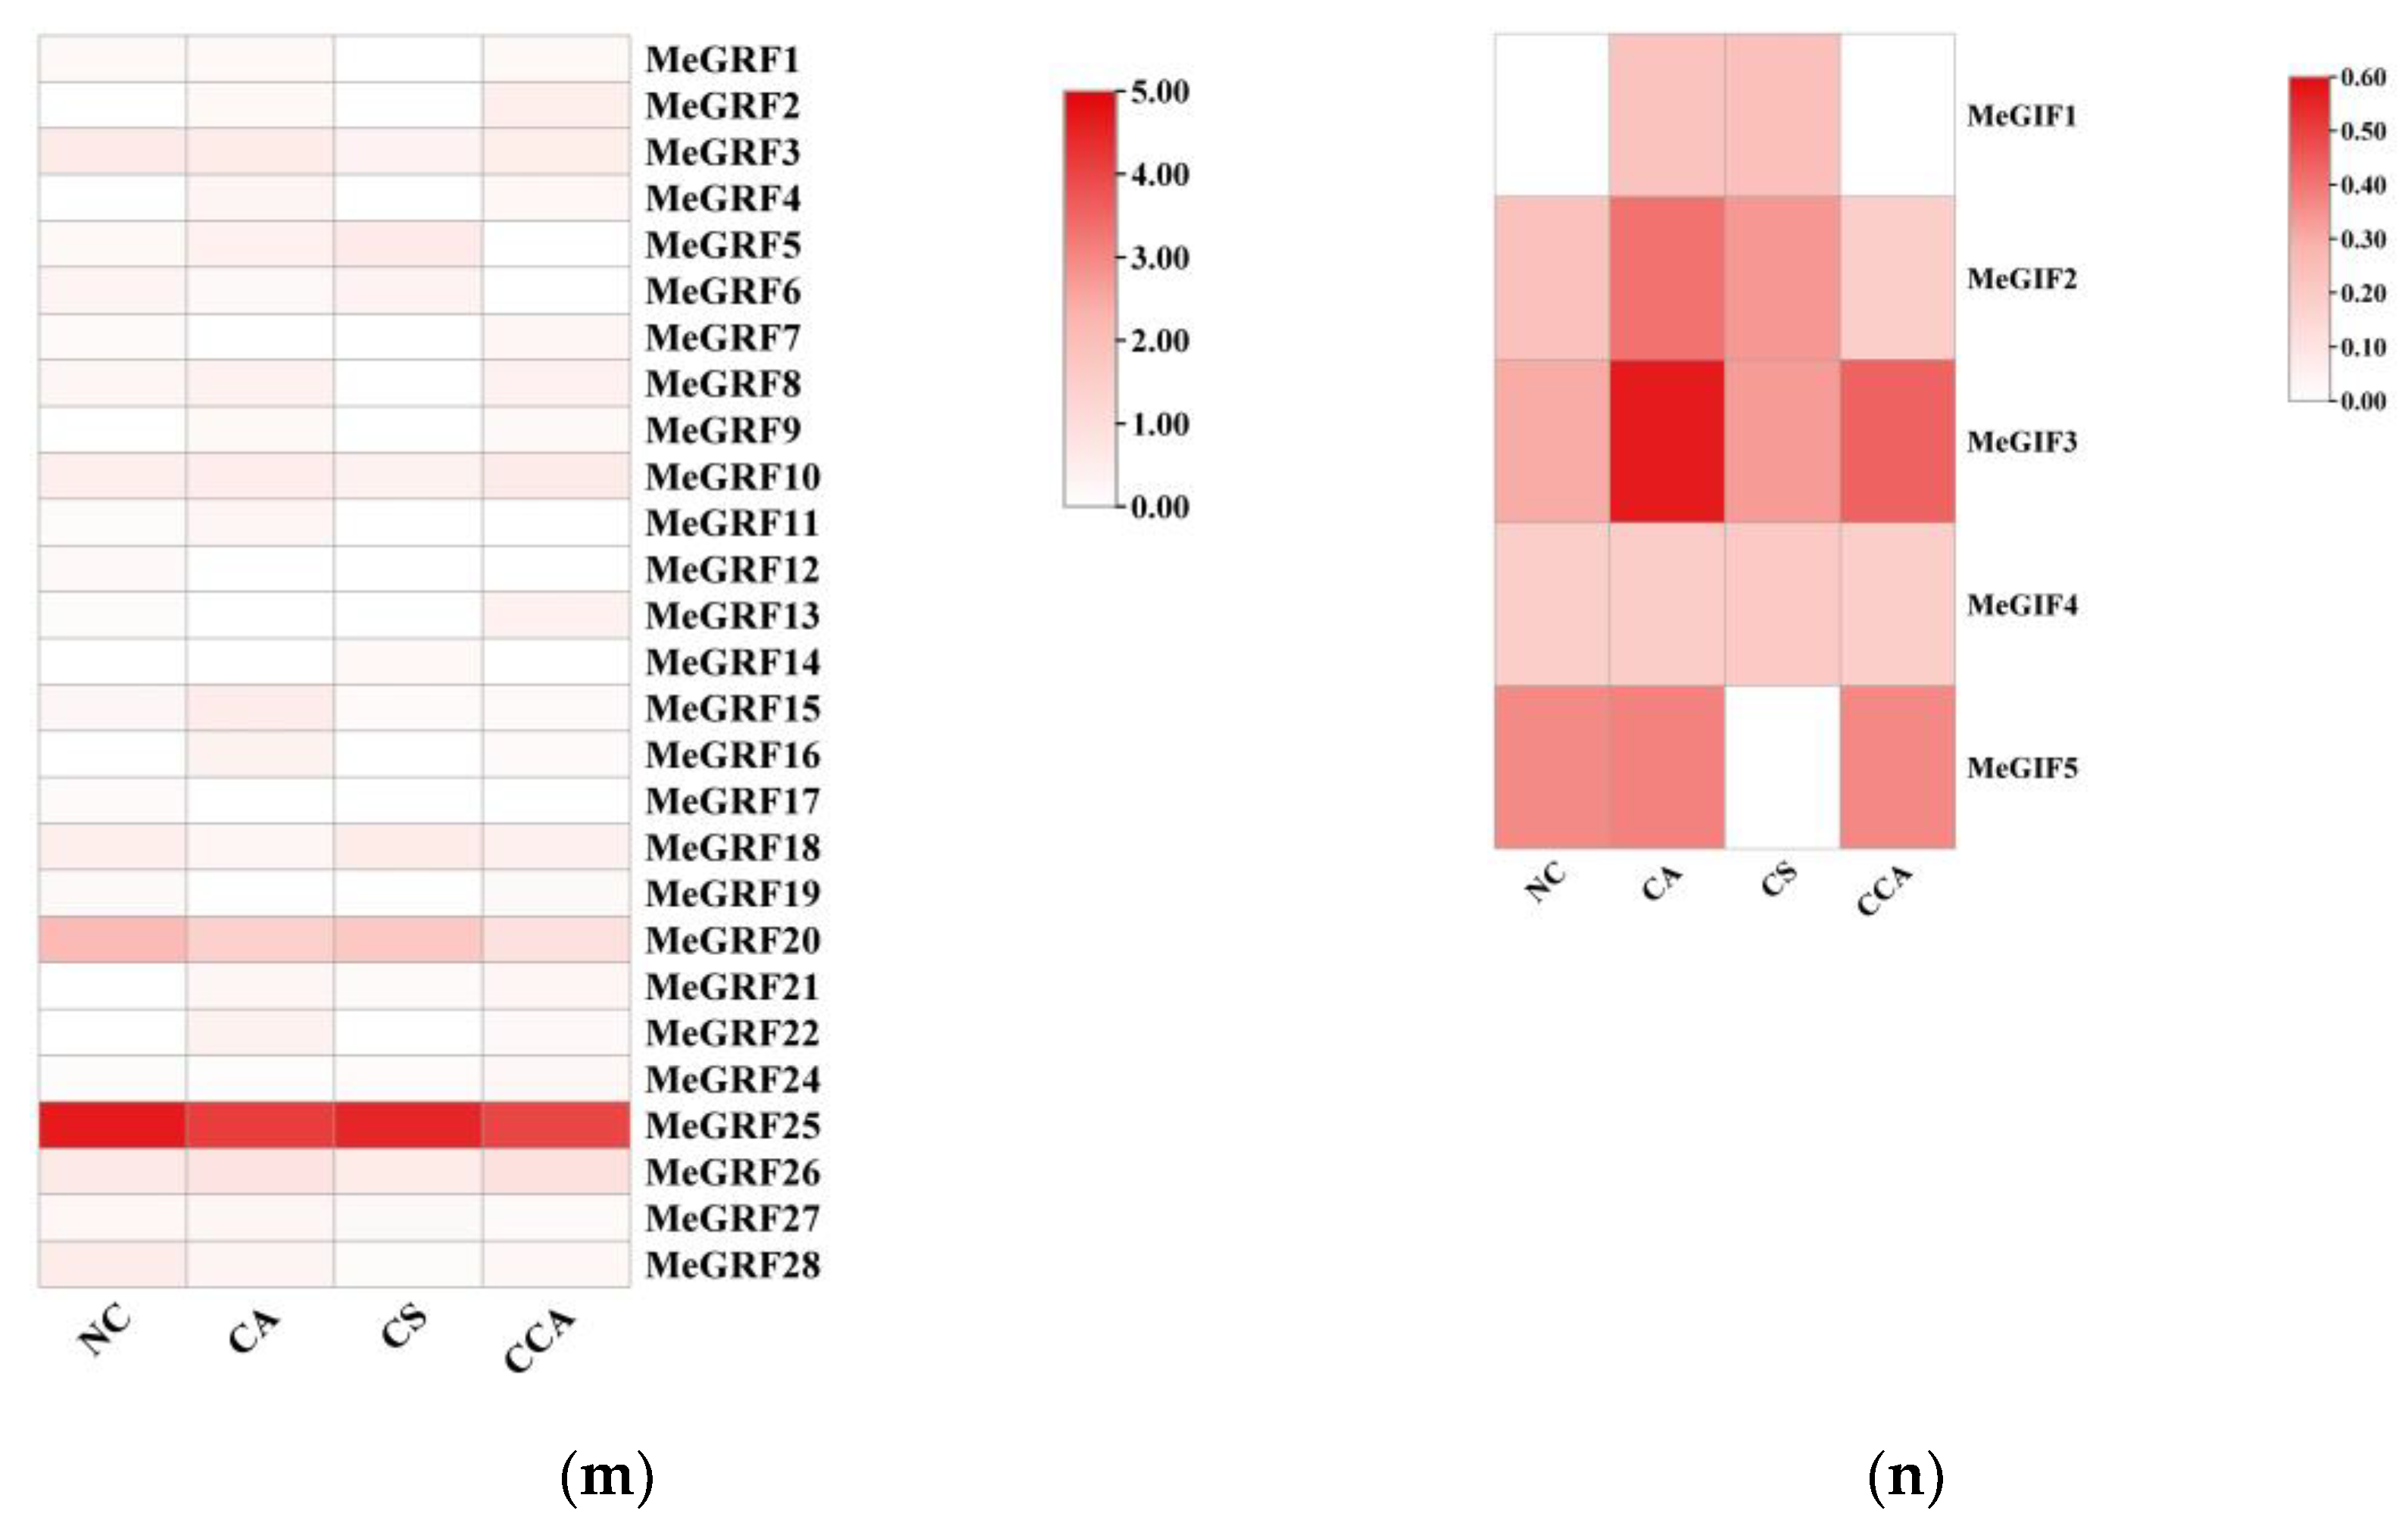
For MeGRFs, the expression levels varied significantly among different stress treatments. Under CA (from 24°C to 14°C), MeGRF1 showed a notable upregulation, while MeGRF2 was downregulated. This indicated that the responses of different MeGRF genes to moderate chilling stress were distinctive. When subjected to CCA (from 14°C to 4°C after acclimation), approximately two - thirds of the differentially expressed MeGRF genes reversed their expression patterns. For instance, MeGRF1, which was upregulated during CA, became downregulated during CCA. This reversal suggested that the plant's regulatory mechanisms adjust to the changing stress intensity, and MeGRFs play crucial roles in this adaptation process. Under CS (a rapid drop from 24°C to 4°C), a large number of MeGRF genes were expressed in different extents. MeGRF4, for example, was highly induced, suggesting its importance in the plant's response to sudden and severe chilling stress.
Regarding MeGIFs, similar trends were observed. During CA, MeGIF1 and MeGIF3 were upregulated, indicating their possible involvement in the early response to moderate chilling. In CCA, many differentially expressed MeGIFs reversed their expression directions. Specifically, 87.5% of the miRNAs that were down - and up - regulated from NC to CA reversed their expression from CA to CCA. This reversal was also observed in the expression of their target genes, suggesting a complex regulatory network involving MeGIFs and their targets in response to chilling stress. In the context of CS, the expression levels of MeGIFs were notably affected, particularly MeGIF4, which exhibited a significant drop in expression. This decline may be linked to the plant's reaction to the abrupt stress..
Figure 6.
Expression profiles of cassava GRF and GIF under different low temperature stress conditions. (m) Expression profiles of cassava GRF under different low temperature stress conditions. (n) Expression profiles of cassava GIF under different low temperature stress conditions. gradual chilling acclimation (CA), chilling stress after chilling acclimation (CCA), and chilling shock (CS), with plants grown at 24°C as the normal control (NC).
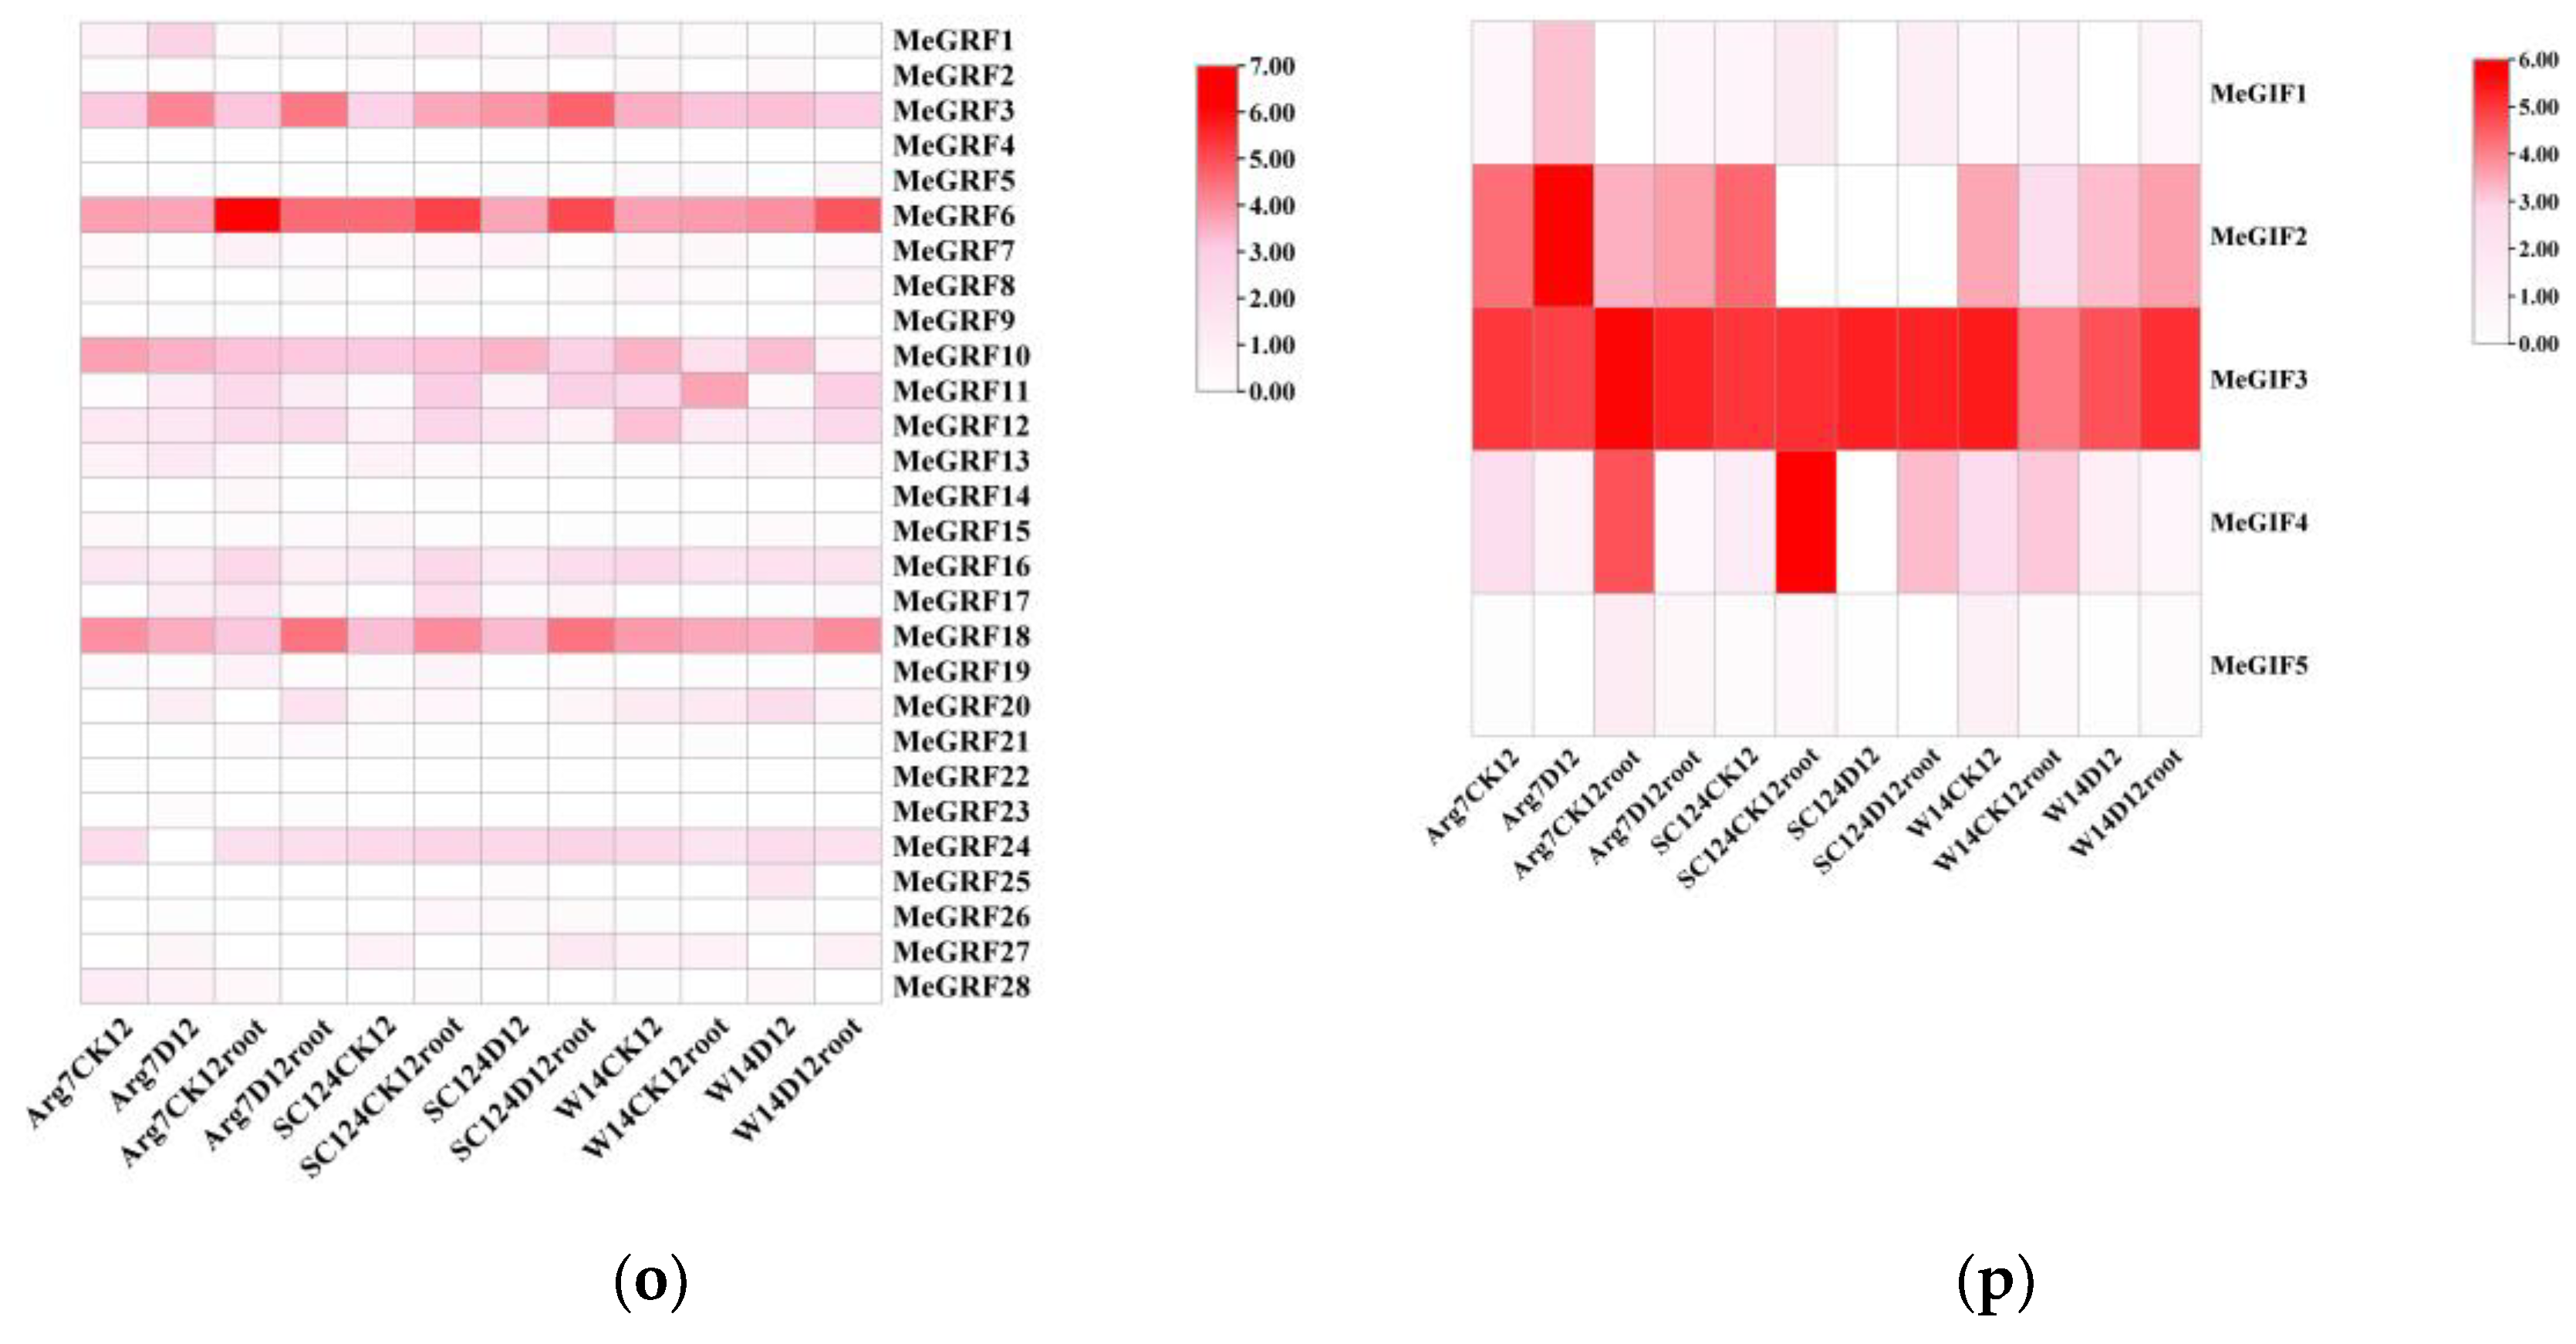
To seek insights into the roles of GRF and GIF genes in cassava development, total RNA was isolated from stems, leaves, and storage roots of cultivated varieties (Arg7) 、in south 124 (SC124) variety and china wild subspecies (W14) for transcriptome analysis.Regarding the MeGRFs heatmap, MeGRF5 standed out with high expression in various samples, including Arg7D12, SC124D12root, and W14D12root. This high expression might be associated with functions such as modulating cell growth and metabolism to cope with water scarcity. MeGRF17 also showed significant expression levels in multiple samples, potentially playing a role in stress - responsive pathways.On the other hand, some MeGRF genes like MeGRF14 and MeGRF20 had relatively low expression across most samples, suggesting that their functions may be less relevant or that they were downregulated under drought stress.
From the heatmap of MeGIFs, several notable patterns emerged. MeGIF2 showsed relatively high expression levels across multiple samples, such as in Arg7D12, SC124D12root, and W14D12root. This suggested that MeGIF2 may play a crucial role in the response to drought stress in these genotypes. For example, in Arg7D12, its high expression might be involved in regulating gene expression networks related to drought adaptation in this particular cassava variety.
MeGIF3 also exhibited elevated expression in many samples, indicating its importance in the overall response to drought. In contrast, MeGIF5 had a lower expression level in most samples, which demonstrated that its function may not be as prominent under drought conditions or that it may be regulated differently compared to other MeGIF genes.
Figure 7.
Expression profiles of MeGRF and MeGIF genes in different tissues of three cassava genotypes. FPKM value was used to create the heat map. The scale represents the relative signal intensity of FPKM values. (o) Expression profiles of MeGRF genes in different tissues of three cassava genotypes. (p) Expression profiles of MeGIF genes in different tissues of three cassava genotypes.
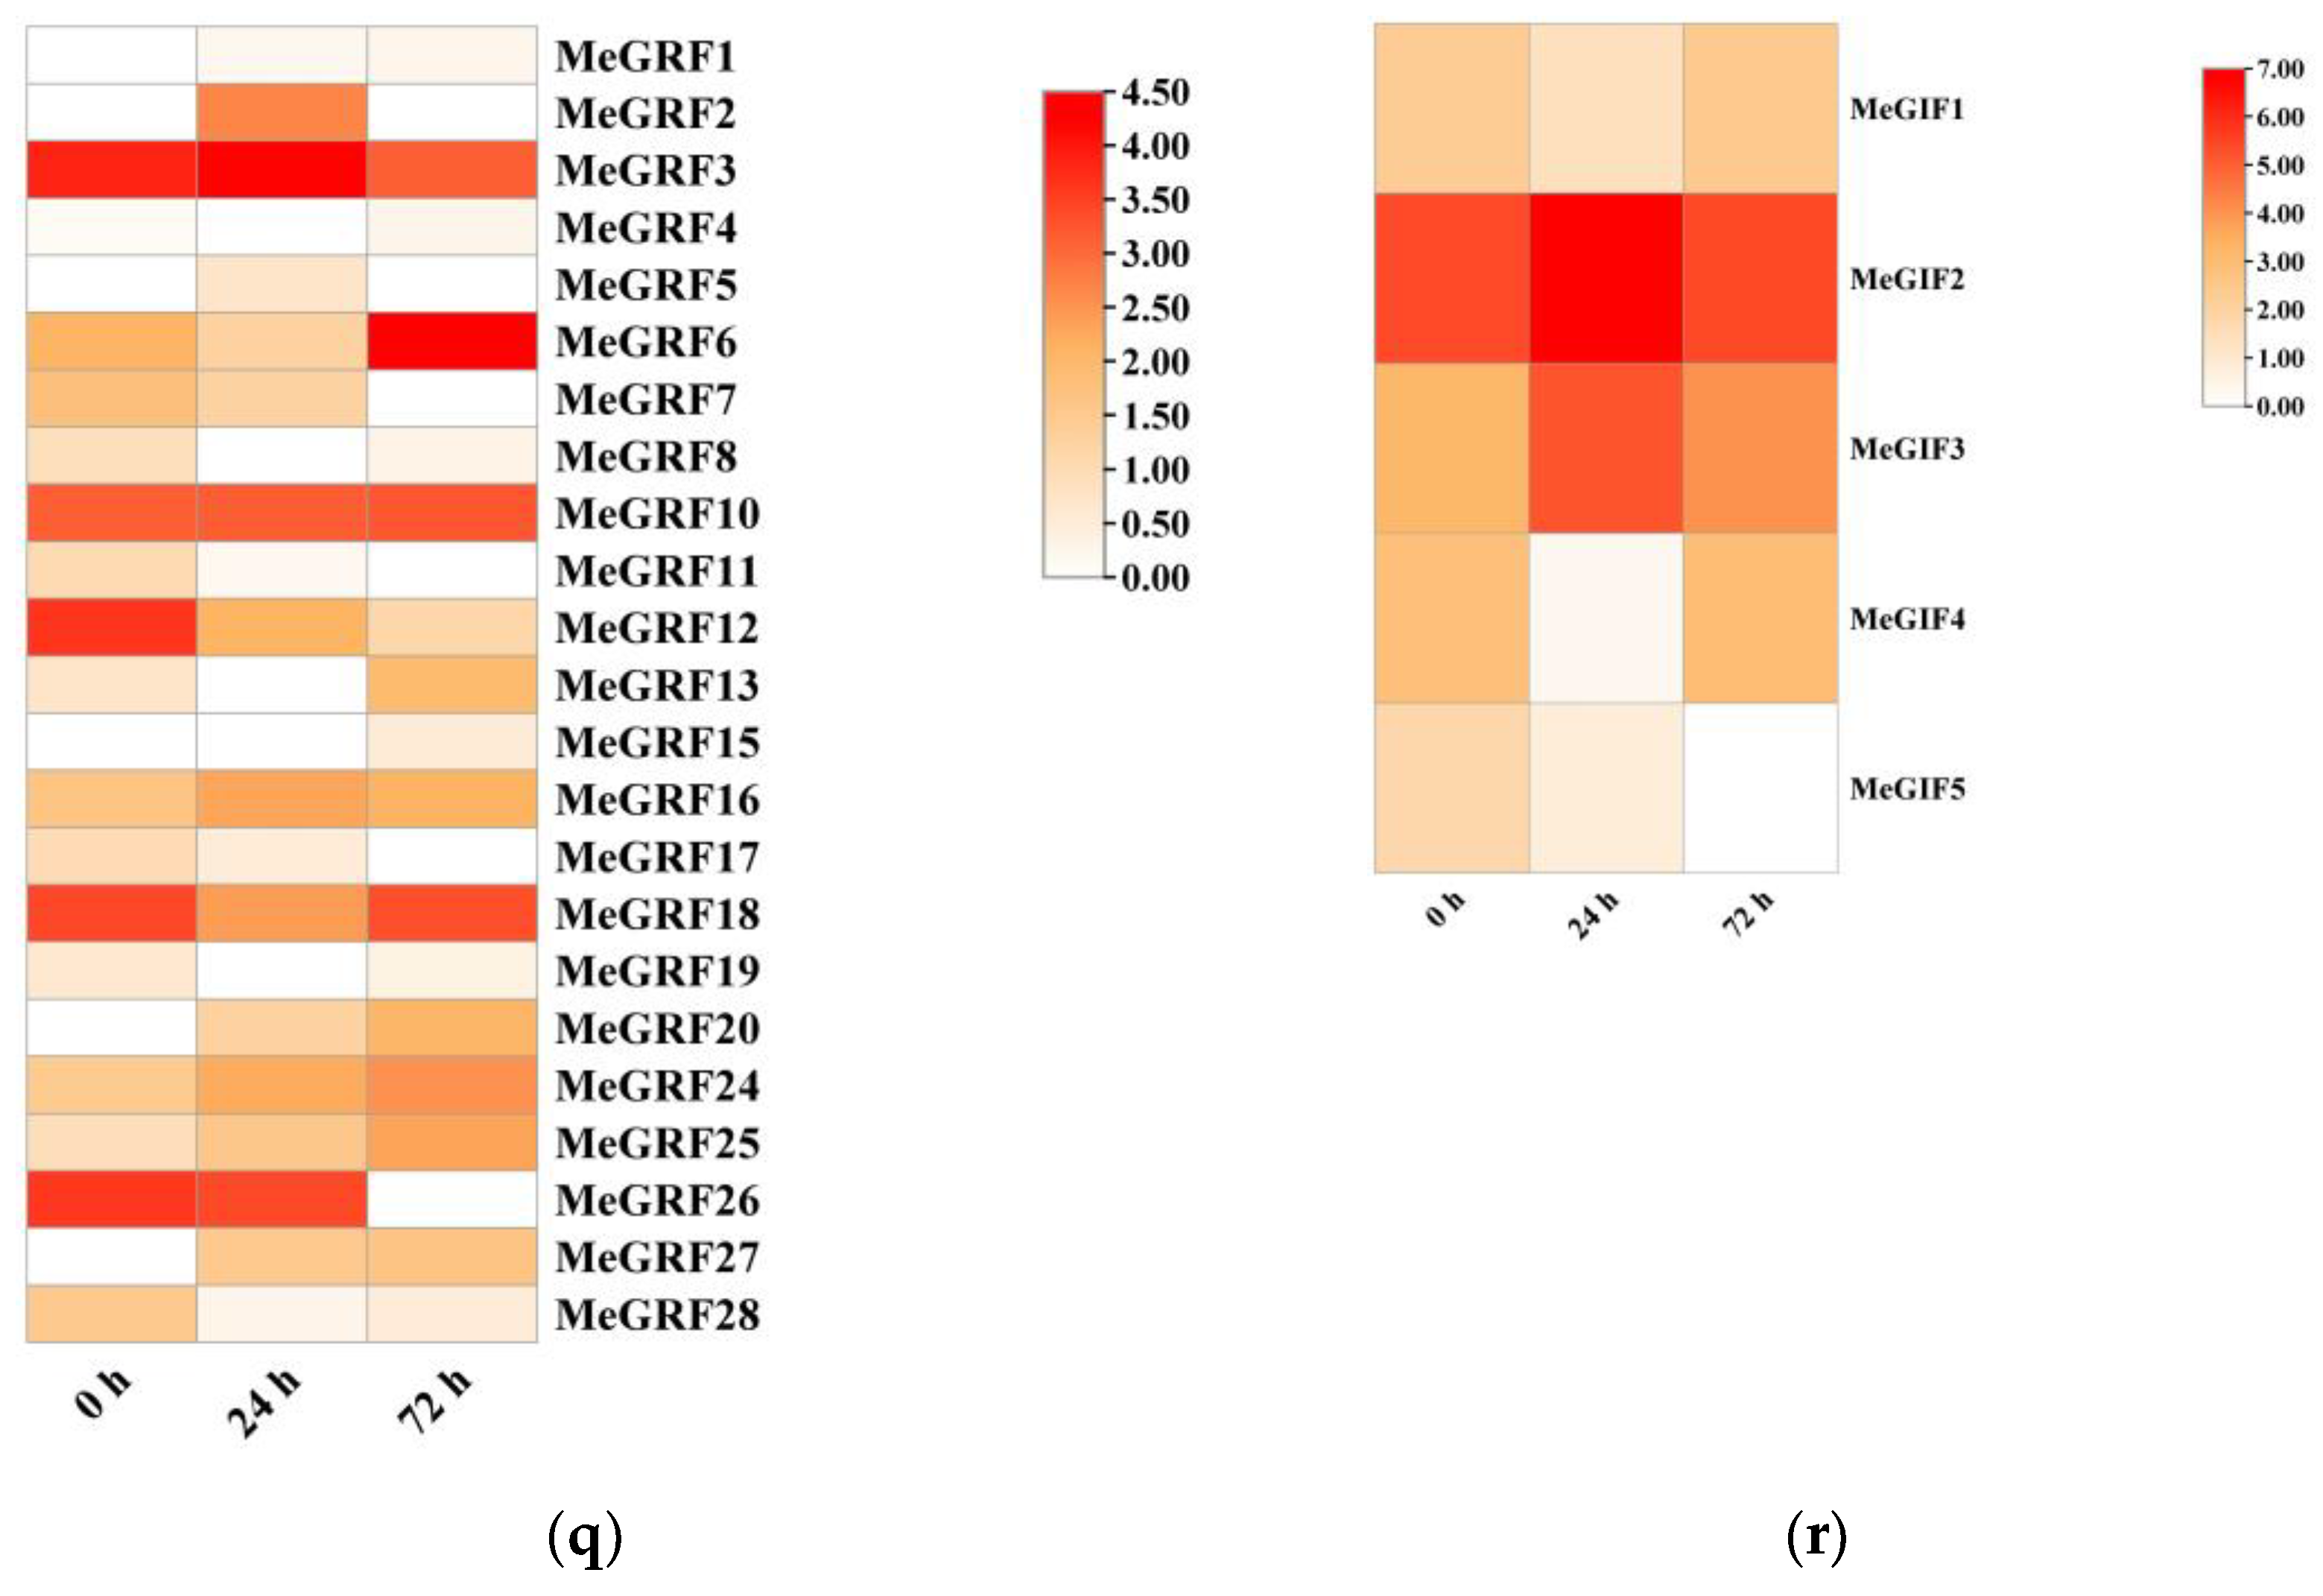
To further explore the responses of GRF and GIF to insect infestation in cassava, we analyzed the transcriptome data of cassava after 0 h, 24 h and 72 h after insect infestation. In the heatmap of MeGRFs, different genes exhibited distinct expression profiles over time under insect pest stress. MeGRF3 exhibited elevated expression levels at 0 h, 24 h, and 72 h, indicating its continuous involvement in the response of plants to insects. This gene might play a fundamental role in the basal defense mechanisms or regulatory processes related to pest resistance.MeGRF6 had particularly high expression at 72 h, suggesting that it may be involved in the later - stage response to insect pests. It could be regulating genes associated with long - term defense adaptations, like the synthesis of secondary metabolites that deter pests or the reinforcement of plant cell walls. Some MeGRF genes, like MeGRF4 and MeGRF14, showed lower expression level throughout the time points, which might imply that they are not major players in the insect pest stress response under these experimental conditions, or their functions are suppressed during pest attack.
For the MeGIFs heatmap, MeGIF2 showed a remarkable peak in expression at 24 h. This significant upregulation at this specific time point suggests that MeGIF2 may be a key regulator in the plant's immediate response to insect pests. It could be interacting with MeGRFs or other regulatory components to initiate defense - related gene expression cascades.MeGIF3 also had a higher expression level at 24 h and 72 h, indicating its continuous participation in the response process. It might collaborate with MeGIF2 or other MeGIFs to gradually adjust the plant's defense mechanisms.MeGIF4 and MeGIF5 displayed lower expression levels compared to MeGIF2 and MeGIF3, especially at 24 h. Their relatively subdued expression might suggest that they have less prominent roles in the initial and mid - stage responses to insect pests. However, they could still be engaged in other elements of the overall stress response at various times or under particular circumstances.
Figure 8.
Expression profiles of cassava GRF and GIF genes under insect pest stress.(q) Expression profiles of cassava GRF genes under insect pest stress.. (r) Expression profiles of cassava GRF and GIF genes under insect pest stress.
Figure 8.
Expression profiles of cassava GRF and GIF genes under insect pest stress.(q) Expression profiles of cassava GRF genes under insect pest stress.. (r) Expression profiles of cassava GRF and GIF genes under insect pest stress.
We performed transcriptomic analysis of MeGRF and MeGIF genes at different time points after infection with XpmCNH11. The results showed that the expression levels of MeGRF genes initially increased and then decreased over time compared to the 0 h control. However, the timing of peak expression varied among different MeGRF genes, occurring at 3 h, 6 h, 1 day, 3 days, or 6 days. The expression levels of each gene were distinguishing, and the overall expression levels of MeGRF3, MeGRF6, MeGRF10, MeGRF18, and MeGRF25 were higher than those of other genes. Most gene traits were initially upregulated and then downregulated (e.g., MeGRF3, MeGRF6, MeGRF17, MeGRF18, and MeGRF25), but MeGRF9, MeGRF22, and MeGRF23 were not expressed in transcriptome data. In 25 MeGRF genes, varying degrees of response expression were observed. Specifically, MeGRF1, MeGRF7, and MeGRF26 mainly showed late responses, while genes with high expression levels (MeGRF6 and MeGRF28) all showed early responses. These results indicated that XpmCNH11 induction could affect the expression of the cassava GRF gene for some time. In MeGIFs, although the expression levels of individual genes varied significantly, a clear overall trend of upregulation was observed. MeGIF1, MeGIF4, and MeGRF5 were predominantly expressed during the early stage, whereas MeGIF2 and MeGIF3 showed higher expression in the late stage(Figure 7).
3.5. RNA Extraction and Real-Time PCR
The results of qPCR analysis of the MeGRF gene in cassava under XpmCNH11 infection revealed diverse and dynamic expression patterns. In the early stages of infection (3 h and 6 h later), most genes such as MeGRF3, MeGRF6, and MeGRF8 exhibited lower expression levels with higher statbility, , which displayed weaker immediate response compared to the control group. Over time to day 3, several genes were significantly upregulated, suggesting that they were involved in defense responses, including MeGRF3, MeGRF6, and MeGRF8. By day 6, while some genes, such as MeGRF10, MeGRF16, and MeGRF17, continued to be highly expressed, others, such as MeGRF8 and MeGRF15, returned to early-stage levels, and some genes were significantly upregulated at day 6, such as MeGRF28. This suggested that different MeGRF genes had different temporal functions in cassava defense against XpmCNH11. Some genes are essential for long-term resistance, while others are more short-lived in specific defense phases. These genes constitute a coordinated and time-varying defense network, highlighting the complexity of cassava’s molecular response to XpmCNH11 infection.
The qPCR results of MeGIF2, MeGIF3, and MeGIF4 in cassava under XpmCNH11 infection showed distinctive time-dependent expression patterns. MeGIF2 gradually increased in expression over time, MeGIF3 had low expression initially and upregulates later, while MeGIF4 showed a pattern of initial low expression with a peak at 3 d and a slight decrease at 6 d. These genes likely contributed to a coordinated defense response, with their expressions finely tuned for optimal resistance at different infection stages, providing key insights into cassava’s anti-pathogen molecular mechanisms(Figure 8).
3.6. Interaction Analysis Between MeGRFs and MeGIFs Family Proteins
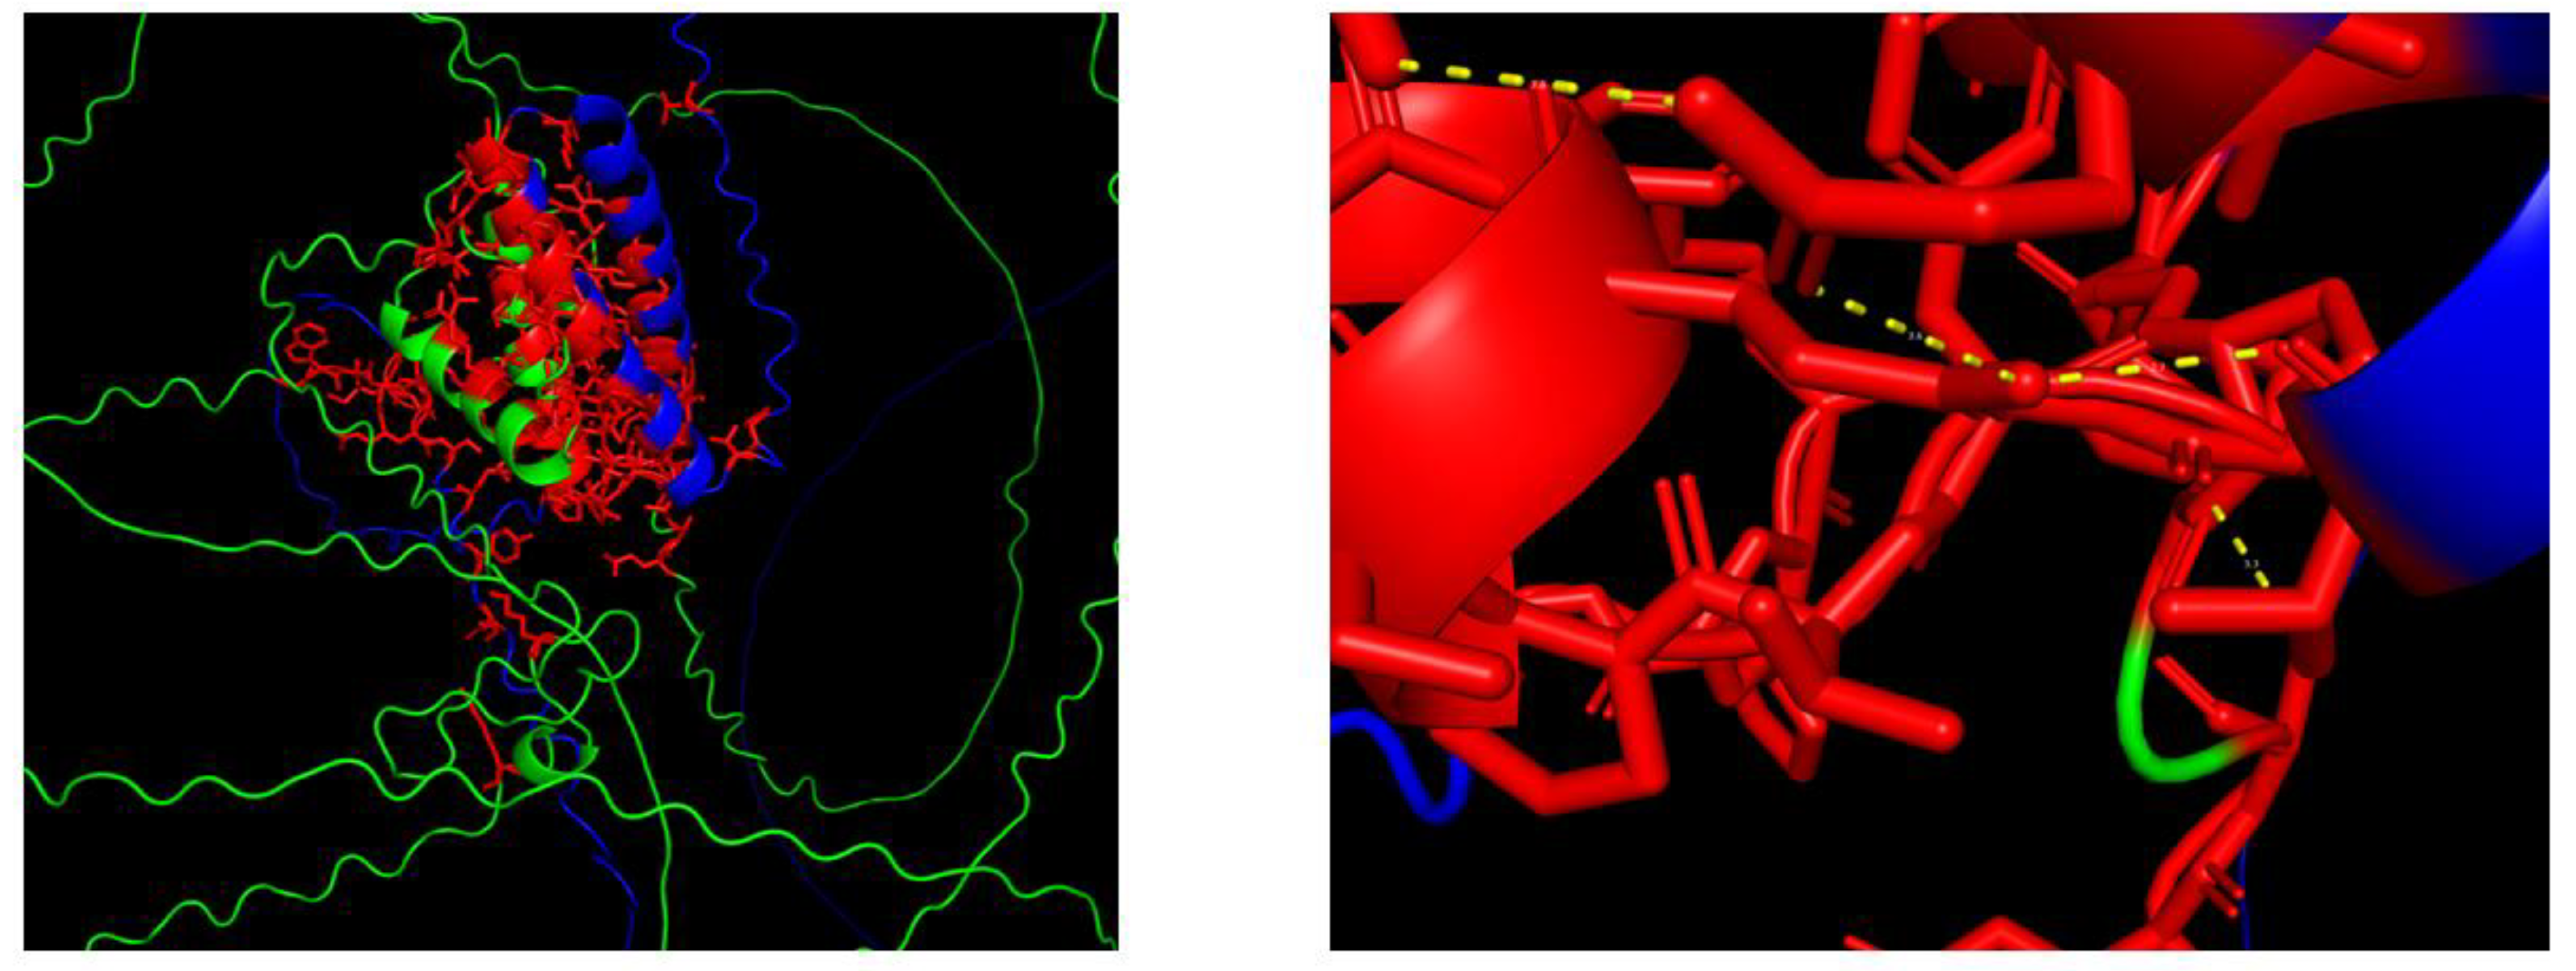
The protein-protein interaction map depicted relationships between MeGIF4, MeGIF5 (in blue), and several MeGRF genes (in pink) in cassava,which suggested that MeGIF4 and MeGIF5 may interact with these MeGRF proteins, By predicting the interaction domain between MeGRF28 and MeGIF4 protein, the interface area (Å2) of the protein interaction surface was 345.3, and the free energy was -2.9 (ΔiG kcal/mol) under this docking mode. Usually less than zero free energy corresponds to a meaningful docking result.likely forming complexes to modulate various biological processes. These interactions could be crucial for coordinating gene expression and physiological responses in cassava, such as growth regulation or stress responses. Understanding these interactions can provide insights into the molecular mechanisms underlying cassava’s development and adaptation(Figure 9).
Figure 9.
Interaction analysis of GRF and GIF proteins. Red circles represent GRF proteins, whereas blue circles represent GIF proteins.
Figure 9.
Interaction analysis of GRF and GIF proteins. Red circles represent GRF proteins, whereas blue circles represent GIF proteins.
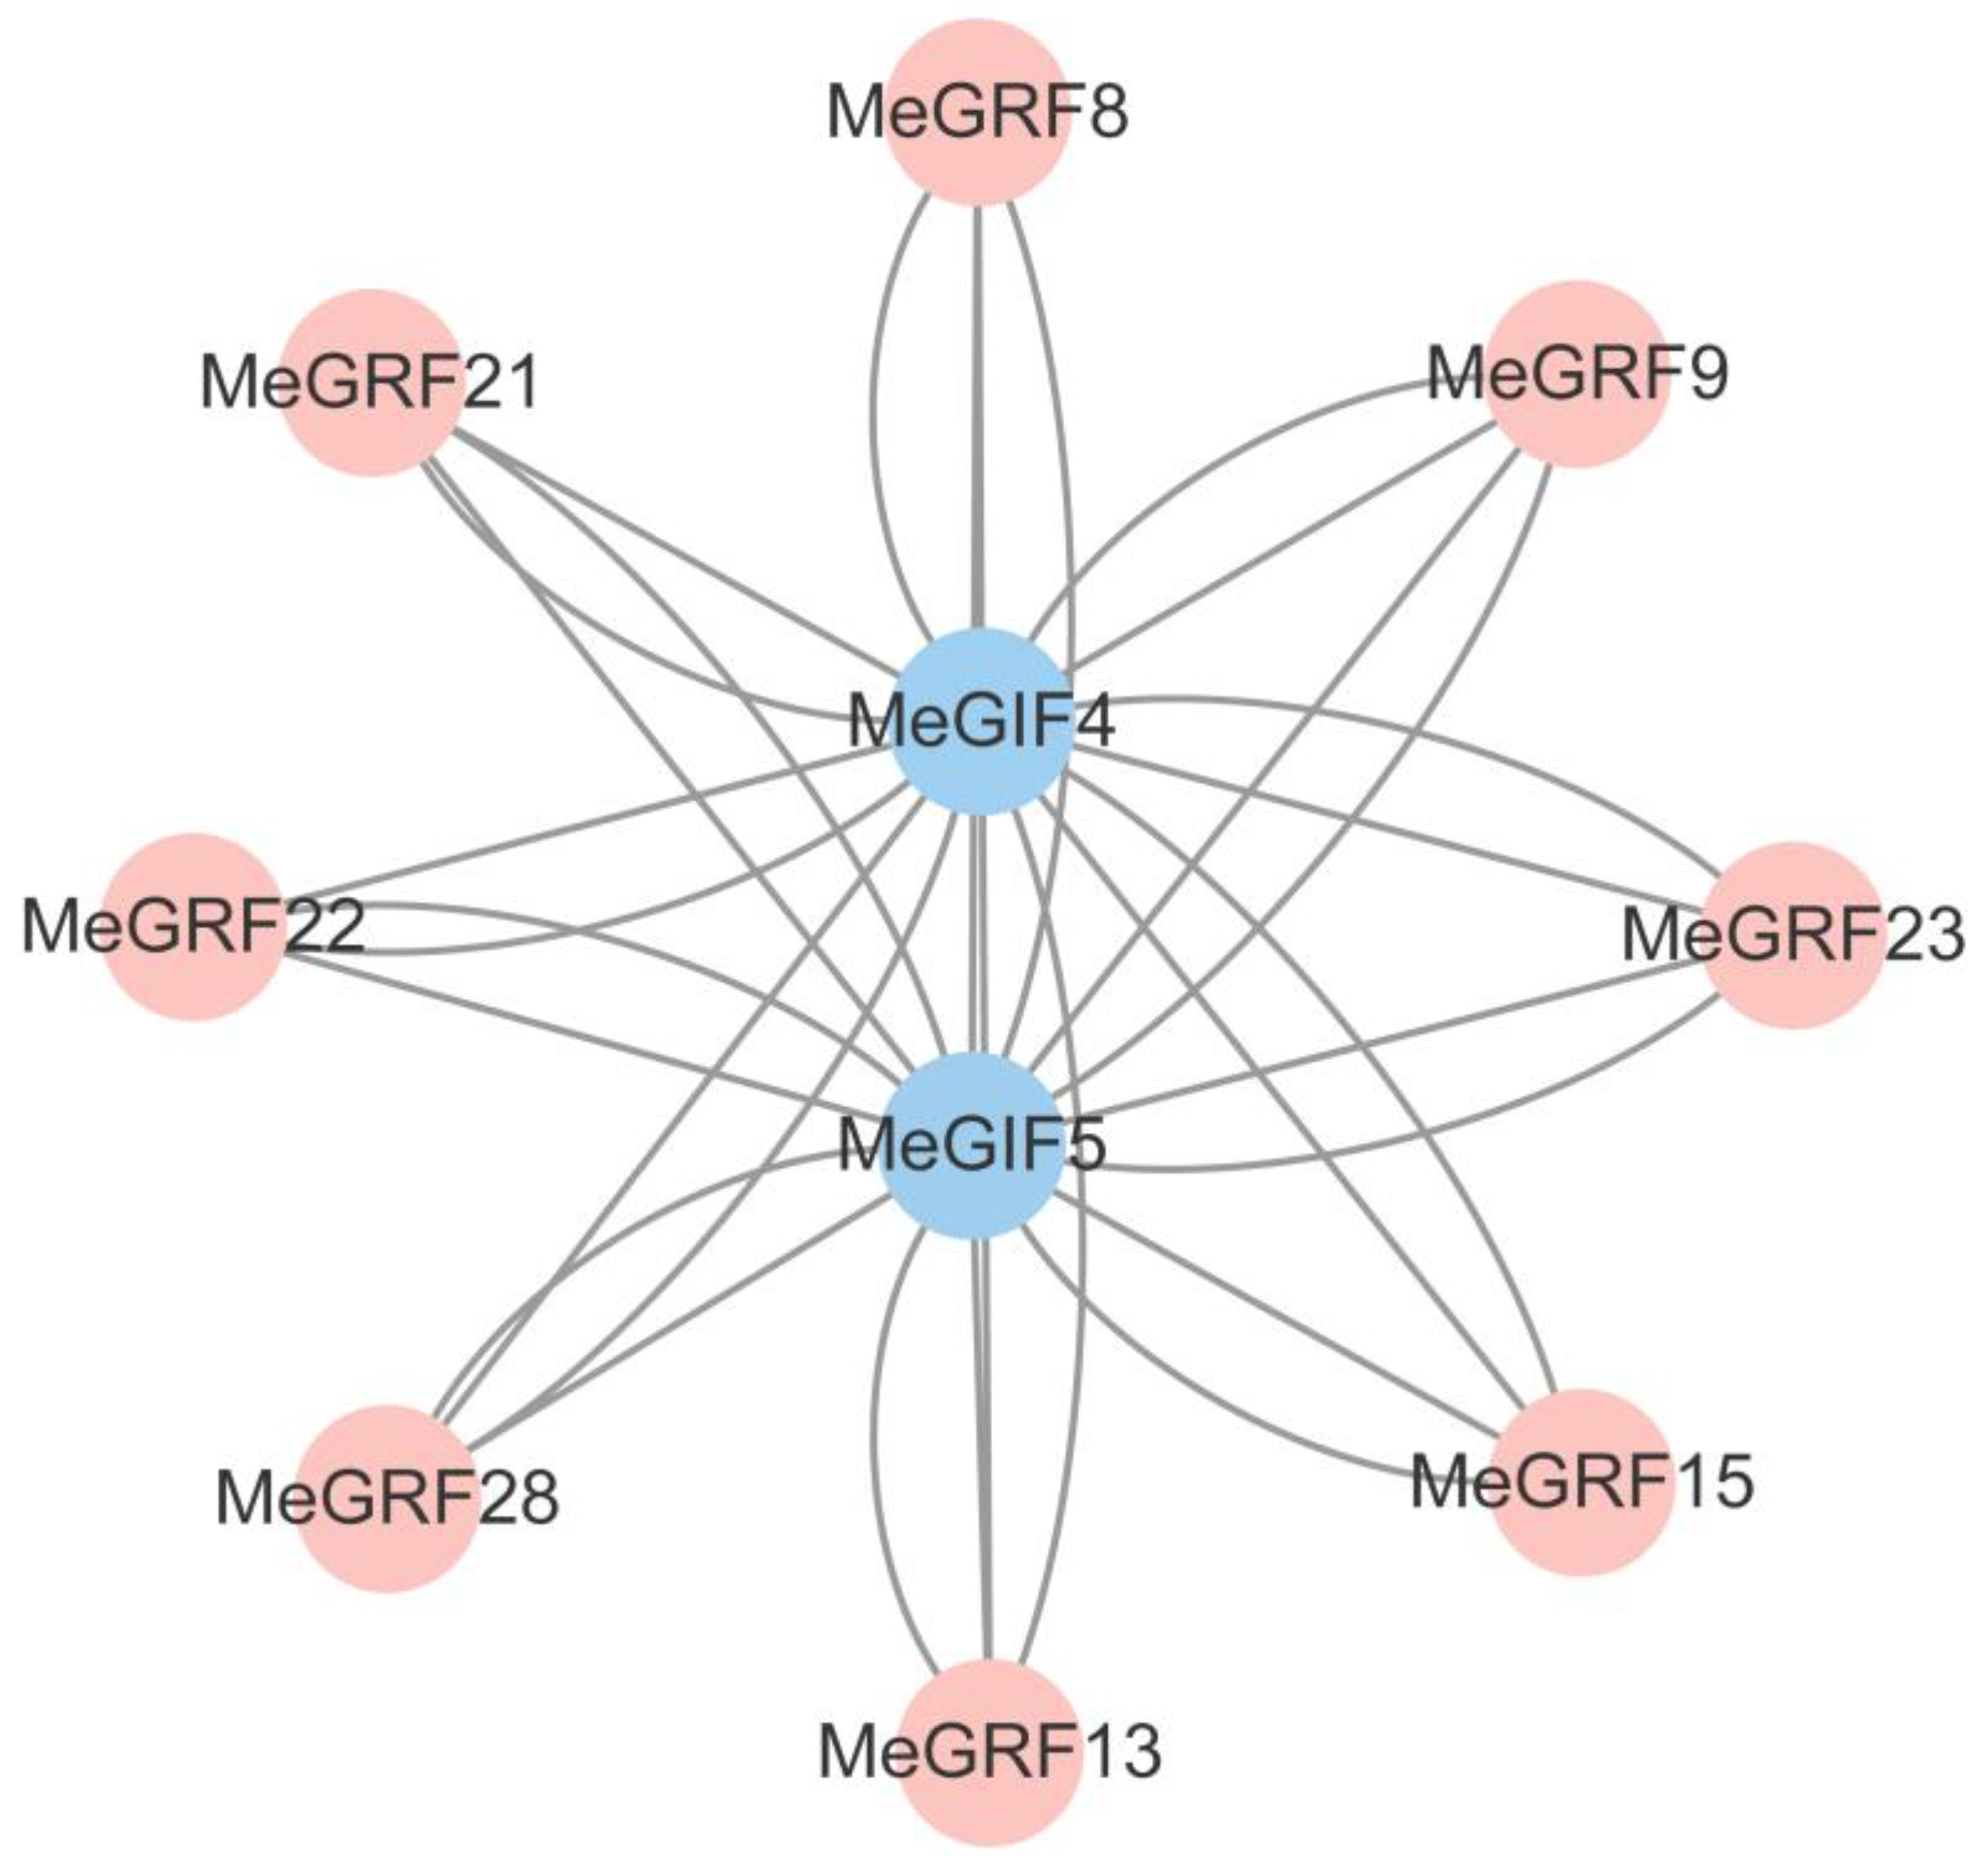
Figure 10.
Visualization analysis of the interaction domain between MeGRF28 and MeGIF4 proteins. Green represents MeGRF, blue represents MeGIF, red represents interacting amino acids, and yellow represents polar covalent bonds.
Figure 10.
Visualization analysis of the interaction domain between MeGRF28 and MeGIF4 proteins. Green represents MeGRF, blue represents MeGIF, red represents interacting amino acids, and yellow represents polar covalent bonds.
3.5. Coexpression Analysis Between MeGRFs and MeGIFs
To further understand whether there is a regulatory relationship between cassava GIF and GRF genes, the correlation between MeGIFs and MeGRFs was analyzed. Coexpression heat maps of MeGRFs and MeGIFs genes revealed the relationship between MeGIF and MeGRF gene families in cassava XpmCNH11 infection. During the examination process of phylogenetic tree analysis, we concentrated on MeGRF28 due to its significant similarity to OsGRF6, which has been demonstrated to improve rice yield and aid in resistance to bacterial blight. The coexpression network also showed that the expression levels of MeGRF28 were higher with MeGIF1, MeGIF4 and MeGIF5 (correlation r value greater than 0.5) (Figure 10). The expression levels of MeGIF and MeGRF genes were highly correlated, indicating that there was a regulatory relationship between these genes.(MeGRF6 and MeGIF1,MeGIF5;MeGRF15 and MeGIF3;MeGRF7 and MeGIF3)(Figure 10).
4. Discussion
4.1. MeGRFs and MeGIFs: An Overview of Evolution and Function
Regarding gene numbers, cassava possessed a markedly expanded GRF family with 28 members and a moderately expanded GIF family with 5 members. This is significantly higher than those in well-studied model plants: Arabidopsis has 9 GRFs and 3 GIFs [21], while rice contains 11 GRFs and 3 GIFs [20]. Tomatoes, which are crops with an allotetraploid origin, have been found to contain 13 GRF genes [22] and 4 GIF genes [44], respectively, which are fewer than what we observe in cassava. . The larger GRF repertoire in cassava is more akin to those in some polyploid or larger-genome species; for example, wheat (hexaploid) contained 13 GRFs and 8 GIFs, and the recent whole-genome duplication in Brassica napus (rapeseed) resulted in at least 35 GRF genes. Ginseng (P. ginseng), an ancient polyploid medicinal plant, similarly has 20 GRF genes and as many as 10 GIF genes [52], the latter being an extreme case for the typically small GIF family, presumably due to genome and segmental duplications in ginseng’s lineage. Cassava’s 5 MeGIFs thus put it slightly above the norm of 3-4 seen in diploids, suggesting one or two duplication events have been retained in cassava’s evolutionary history. Such retention is consistent with evidence that interacting proteins like GRFs and GIFs tend to be co-retained after duplications. In fact, a majority of the cassava GRF genes can be identified as recent duplicates due to their sequence similarity and chromosomal positioning (data not presented), which aligns with observations in other species (for instance, 18 out of 20 PgGRFs in ginseng originated from segmental duplications).The gene structure of GRF and GIF loci is likewise conserved. Most plant GRF genes contain only 2-4 introns (i.e., 3-5 exons), a compact structure observed in Arabidopsis and rice and also found in cassava GRFs [53,54]. This suggests strong selective pressure to maintain a simple gene architecture, possibly for tight transcriptional control or efficient post-transcriptional regulation. Notably, a few divergent GRFs can possess many introns. For instance, two ginseng GRFs carry > 20 introns [52], but such cases are rare and may result from recent gene fusion or alternative splicing events. In cassava, our analysis revealed that all MeGRF genes encoded the conserved QLQ and WRC domains at the N-terminus, and shared the minimal exon-intron organization seen in other species. The MeGIF genes were similarly compact, each comprising only a few exons, and all encoded the canonical SSXT domain at their N-termini, followed by less conserved regions. Collectively, the conservation of domain architecture (QLQ, WRC in GRFs; SSXT in GIFs) and gene structure across diverse plant lineages underscores the fundamental importance of these features. The motif conservation implies that GRF-GIF complexes have maintained the same molecular mechanism of DNA-binding by the GRF and recruitment of coactivators via the GIF since their origin [18,42], even as the gene family expanded and diversified in higher plants. This provides a molecular basis for the similar functions of GRF/GIF proteins observed across species [20,55].
We also analyzed the cis-acting elements in their promoter regions to understand the upstream control of GRF and GIF genes. The 2-kb cassava GRF/GIF gene promoters are enriched with diverse regulatory motifs related to developmental, hormonal, and stress responses. Notably, we identified multiple light-responsive elements (e.g., G-box), hormone-responsive elements (e.g., TGA-elements for auxin, P-box/GARE for gibberellins, ABRE for abscisic acid), and stress-responsive elements (such as ARE for anaerobic stress, W-box for pathogen response, and TC-rich repeats associated with defense). In particular, many cassava GRF/GIF promoters contain the TCA-element, a cis-element responsive to salicylic acid and associated with pathogen defense genes [56]. A similar finding was reported for tomato, the results showed that all four SlGIF gene promoters shared a common set of ~ 33 cis-elements, including the TCA-element (salicylic acid response), G-box (light and sugar signaling), ABRE (ABA response), and the core TATA and CAAT boxes [44]. The widespread presence of pathogen- and hormone-responsive sites in GRF/GIF promoters suggests these genes are points of convergence for signaling pathways. The identification of TCA-elements, W-boxes, and other defense motifs in MeGRF promoters in this study was congruent with their inducibility by XpmCNH11 infection, implying they might be direct targets of defense-related transcription factors (such as WRKYs or TGA-family factors activated by salicylic acid) during immune responses [57]. Likewise, the abundance of hormone-responsive CAREs (cis-acting regulatory elements) indicates that plant growth hormones modulate GRF/GIF expression [52]. For example, gibberellin-responsive motifs (GARE/ P-box) were found in many PgGRF promoters in ginseng, which is consistent with experimental data that GA treatment induces GRF transcription [52]. We noted the presence of drought (MBS, MYB-binding site) and low temperature (LTR) responsive elements in various cassava GRF promoters, similar to observations in ginseng, where five PgGRFs contained LTRs and six had MBS elements. This suggests that GRF genes may react to abiotic stresses such as cold and drought. These in silico results align with the expression changes seen under stress conditions (e.g., certain MeGRFs were upregulated under osmotic stress in publicly available cassava RNA-Seq) [58], reinforcing that GRFs are integrated into general stress response pathways.
4.2. The Role of MeGRF and MeGIF in Growth and Development
On the growth side, GRF-GIF complexes are known to regulate a host of developmental processes. They play a crucial role in the development of leaves by promoting cell growth in the leaf blade [27,34,59], control of stem elongation (e.g., via GA-mediated signals) [60,61] and root architecture (GIFs affecting lateral root formation and GRFs likely modulating root meristem activity) [18,47], and even determining seed or storage organ size (OsGRF-mediated control of grain size in rice, BrGRF effects on head size in cabbage) [62]. In cassava, the development of storage roots and overall yield are crucial characteristics. We noted the expression of certain MeGRFs in developing storage roots, hinting that these factors could influence root thickening and starch accumulation [54]. In other species, altering GRF expression can dramatically change organ size: for example, upregulating specific GRFs leads to larger leaves and fruits (as seen in tomato where mutation in GRF8 yielded larger fruits in some cultivars, and in poplar where overexpressing PtGRF genes increased leaf area) [20,44]. As a result, it is generally understood that GRF-GIF complexes serve as key regulators of organ growth. They integrate signals from hormones such as auxin, gibberellins (GA), and brassinosteroids, along with developmental signals. At the same time, they function as points where stress signaling pathways can interact to adjust growth [36,42]. This integration ensures plant growth is optimized but not at the expense of survival under threat- a balance orchestrated by adjusting GRF/GIF activity.
4.3. Expression Changes Under Pathogen Stress (XpmCNH11 Infection)
One of the most significant findings of this study is the dynamic regulation of cassava GRF and GIF genes during biotic stress, particularly infection by Xanthomonas phaseoli pv. manihotis (XpmCNH11), the causal agent of cassava bacterial blight. Our results show that a subset of 11 MeGRF and 3 MeGIF genes exhibit pronounced expression changes in response to XpmCNH11 inoculation. Several MeGRF transcripts were rapidly induced upon pathogen attack, while others were repressed, indicating that the GRF/GIF network is involved in cassava’s defense response to this bacterial pathogen. This is a fascinating finding, as GRF-GIF genes have typically been examined in relation to growth and development. However, new evidence from various species strongly indicates that these genes also play a significant role in immunity and responses to stress. In Arabidopsis, for example, reducing the activity of miR396 (which targets GRF transcripts) results in elevated GRF levels and confers broad resistance to both necrotrophic and hemibiotrophic fungi [34]. During fungal infection, Arabidopsis miR396 levels normally decrease, de-repressing its GRF targets and triggering defense-related transcriptional reprogramming. This leads to a primed immune state in which defense genes are superactivated, and notably, this enhanced resistance is achieved without discernible growth penalties in the absence of pathogens. Such findings imply that GRFs positively influence immune signaling pathways, a notion further corroborated by studies in rice. Recent work demonstrated that overexpression of OsGRF6 in rice significantly improved resistance to bacterial blight caused by Xanthomonas oryzae pv. oryzae (Xoo) [37]. OsGRF6-overexpressing rice plants developed much smaller lesions upon Xoo infection compared to wild-type, and molecular analysis revealed that OsGRF6 directly activates defense genes: it binds to and upregulates the promoters of OsWRKY82 and other immune regulators, thereby stimulating downstream defense responses (e.g., JA signaling and reactive oxygen species accumulation) during infection. Intriguingly, OsGRF6 transcript levels increase upon bacterial challenge, suggesting positive feedback where pathogen-triggered signals boost GRF expression to amplify immunity. This reflects our finding that specific MeGRFs are activated by XpmCNH11, suggesting that cassava might employ a comparable mechanism.4.4. GRF-GIF Coexpression and Interaction Networks
GRF transcription factors exert their functions largely through partnership with GIF co-factors, and our coexpression and protein-protein interaction (PPI) network analyses shed light on these relationships in cassava. We found extensive evidence of coordinated regulation between specific MeGRFs and MeGIFs. An analysis of Pearson correlation on gene expression across various hormone treatments and stress conditions showed that numerous GRF-GIF gene pairs exhibited closely related expression patterns, with correlation coefficients exceeding 0.6 for 27 PgGRF-PgGIF pairs in ginseng [52]. In cassava, we similarly identified numerous MeGRF/MeGIF pairs co-expressed across tissues and treatments, suggesting these genes respond to stimuli in unison. One striking observation is that MeGRF28 (the largest cassava GRF by protein size) and MeGIF4 emerged as potential hub pairings in the network, showing strong coexpression and multiple interaction predictions. This is similar to results found in tomatoes, where a single GRF (SlGRF4) was noted to physically interact with all four GIF proteins in that species.The tomato GRF-GIF interactome also showed that three of the four SlGIFs have high coexpression with five SlGRF genes, indicating a tightly knit GRF-GIF subnetwork. Identifying a common interactor GRF (like SlGRF4 in tomato) hints that certain GRFs might serve as central nodes binding multiple GIF partners, thereby orchestrating a larger transcription complex [44]. It is tempting to speculate that MeGRF28 (hub in cassava) could play an analogous role, potentially interacting with multiple MeGIFs to regulate a broad set of target genes. This potential is backed by the presence of several interaction motifs in MeGRF28, which includes an extended QLQ domain region, and its high expression in important tissues alongside MeGIF4. Experimentally, nearly all GRF and GIF proteins in Arabidopsis have been shown to interact in a promiscuous network essentially, any GRF can bind any GIF in yeast two-hybrid and in vitro assays [63], so physical interaction alone may not be limiting. Instead, coexpression and co-localization likely dictate which GRF-GIF pairs form in vivo. Thus, the concordant expression patterns we observe in cassava are a good proxy for functional GRF-GIF partnerships.
5. Conclusions
We conducted a comprehensive genome-wide identification and characterization of the GRF and GIF gene families in cassava. A total of 28 MeGRF and 5 MeGIF genes were identified, exhibiting conserved domain structures and gene architectures, yet displaying diverse phylogenetic relationships, motif compositions, and expression patterns. Promoter analysis revealed the presence of numerous cis-acting elements associated with hormonal signaling, developmental regulation, and stress responses, suggesting multifaceted regulatory roles.Tissue-specific expression analysis revealed that several GRF and GIF genes exhibited high expression levels in shoot apices, leaves, and developing storage roots, Meanwhile, multiple genes showed significant responses under both biotic stress (such as Xpm) and abiotic stress conditions. Coexpression analysis and protein–protein interaction studies indicated that MeGRF28 and MeGIF4 are likely key candidate regulators, suggesting that the GRF-GIF complex may cooperatively regulate transcriptional responses during growth and development as well as under environmental stress conditions.
In summary, our research offers new perspectives on the evolution, regulatory networks, and stress-related roles of the GRF and GIF gene families in cassava. The study also establishes a basis for validating the functions of potential candidate genes and provides theoretical backing for upcoming cassava breeding initiatives aiming to improving disease resistance and increasing crop yield.
Supplementary Materials
The following supporting information can be downloaded at the website of this paper posted on Preprints.org.
Author Contributions
R.X.: Conceptualization, Writing—original draft, Writing—review and editing; T.L.: Data curation, Writing—review and editing; L.Z.: Data curation, Formal analysis; A.H.A.: Investigation, Data curation, Formal analysis; Y.F.: Project administration, Resources, Investigation; W.W.: Project administration, Resources, Investigation; Y.C.: Methodology, Software, Formal analysis; Y.C.: Supervision, Funding acquisition, Writing—review and editing. All authors have read and agreed to the published version of the manuscript.
Funding
Hainan Province Science and Technology Special Fund (ZDYF2023XDNY179), the International Science & Technology Cooperation Program of Hainan Province (GHYF2024008).
Data Availability Statement
Data are contained within the article.
Conflicts of Interest
The authors declare no conflicts of interest.
References
- Dufour DL: Cyanide content of cassava (Manihot esculenta, Euphorbiaceae) cultivars used by Tukanoan Indians in Northwest Amazonia. Economic Botany 1988, 42(2):255-266. [CrossRef]
- Essers AJA: Removal of Cyanogens from Cassava Roots Studies on Domestic Sun-Drying and Solid-Substrate Fermentation in Rural Africa: Wageningen University and Research; 1995.
- Montagnac JA, Davis CR, Tanumihardjo SA: Nutritional Value of Cassava for Use as a Staple Food and Recent Advances for Improvement. Comprehensive reviews in food science and food safety 2009, 8(3):181-194. [CrossRef]
- Burns A, Gleadow R, Cliff J, Zacarias A, Cavagnaro T: Cassava: The Drought, War and Famine Crop in a Changing World. 2010, 2(11):3572-3607. [CrossRef]
- Howeler RH, Lutaladio N, Thomas G: Save and grow : cassava : a guide to sustainable production intensification. Rome: Food and Agriculture Organization of the United Nations; 2013.
- Wydra K, Zinsou V, Jorge V, Verdier V: Identification of Pathotypes of Xanthomonas axonopodis pv. manihotis in Africa and Detection of Quantitative Trait Loci and Markers for Resistance to Bacterial Blight of Cassava. Phytopathology 2004, 94(10):1084-1093.
- McCallum EJ, Anjanappa RB, Gruissem W: Tackling agriculturally relevant diseases in the staple crop cassava (Manihot esculenta). Current opinion in plant biology 2017, 38:50-58. [CrossRef]
- Liu W, Yan Y, Zeng H, Li X, Wei Y, Liu G, He C, Shi H: Functional characterization of WHY-WRKY75 transcriptional module in plant response to cassava bacterial blight. Tree physiology 2018, 38(10):1502-1512. [CrossRef]
- Veley KM, Elliott K, Jensen G, Zhong Z, Feng S, Yoder M, Gilbert KB, Berry JC, Lin ZD, Ghoshal B et al: Improving cassava bacterial blight resistance by editing the epigenome. Nature communications 2023, 14(1):85.
- Garcia-Brugger A, Lamotte O, Vandelle E, Bourque S, Lecourieux D, Poinssot B, Wendehenne D, Pugin A: Early signaling events induced by elicitors of plant defenses. Molecular plant-microbe interactions : MPMI 2006, 19(7):711-724. [CrossRef]
- Boller T, Felix G: A renaissance of elicitors: perception of microbe-associated molecular patterns and danger signals by pattern-recognition receptors. Annual review of plant biology 2009, 60:379-406. [CrossRef]
- Mitsuda N, Ohme-Takagi M: Functional analysis of transcription factors in Arabidopsis. Plant & cell physiology 2009, 50(7):1232-1248.
- Buscaill P, Rivas S: Transcriptional control of plant defence responses. Current opinion in plant biology 2014, 20:35-46.
- Choi D, Kim JH, Kende H: Whole genome analysis of the OsGRF gene family encoding plant-specific putative transcription activators in rice (Oryza sativa L.). Plant & cell physiology 2004, 45(7):897-904. [CrossRef]
- van der Knaap E, Kim JH, Kende H: A novel gibberellin-induced gene from rice and its potential regulatory role in stem growth. Plant physiology 2000, 122(3):695-704.
- Treich I, Cairns BR, de los Santos T, Brewster E, Carlson M: SNF11, a new component of the yeast SNF-SWI complex that interacts with a conserved region of SNF2. Molecular and cellular biology 1995, 15(8):4240-4248. [CrossRef]
- Perani M, Ingram CJ, Cooper CS, Garrett MD, Goodwin GH: Conserved SNH domain of the proto-oncoprotein SYT interacts with components of the human chromatin remodelling complexes, while the QPGY repeat domain forms homo-oligomers. Oncogene 2003, 22(50):8156-8167.
- Kim JH: Biological roles and an evolutionary sketch of the GRF-GIF transcriptional complex in plants. BMB reports 2019, 52(4):227-238. [CrossRef]
- Omidbakhshfard MA, Proost S, Fujikura U, Mueller-Roeber B: Growth-Regulating Factors (GRFs): A Small Transcription Factor Family with Important Functions in Plant Biology. Molecular plant 2015, 8(7):998-1010.
- Chen X, Zhang J, Wang S, Cai H, Yang M, Dong Y: Genome-wide molecular evolution analysis of the GRF and GIF gene families in Plantae (Archaeplastida). BMC Genomics 2024, 25(1):74. [CrossRef]
- Kim JH, Choi D, Kende H: The AtGRF family of putative transcription factors is involved in leaf and cotyledon growth in Arabidopsis. The Plant journal : for cell and molecular biology 2003, 36(1):94-104. [CrossRef]
- Khatun K, Robin AHK, Park JI, Nath UK, Kim CK, Lim KB, Nou IS, Chung MY: Molecular Characterization and Expression Profiling of Tomato GRF Transcription Factor Family Genes in Response to Abiotic Stresses and Phytohormones. International journal of molecular sciences 2017, 18(5). [CrossRef]
- Kim JS, Mizoi J, Kidokoro S, Maruyama K, Nakajima J, Nakashima K, Mitsuda N, Takiguchi Y, Ohme-Takagi M, Kondou Y et al: Arabidopsis growth-regulating factor7 functions as a transcriptional repressor of abscisic acid- and osmotic stress-responsive genes, including DREB2A. The Plant cell 2012, 24(8):3393-3405.
- Baucher M, Moussawi J, Vandeputte OM, Monteyne D, Mol A, Pérez-Morga D, El Jaziri M: A role for the miR396/GRF network in specification of organ type during flower development, as supported by ectopic expression of Populus trichocarpa miR396c in transgenic tobacco. Plant biology (Stuttgart, Germany) 2013, 15(5):892-898.
- Chen H, Pei Y, Tang W, Li H, Huang Y, Chu Y, Kou G, Niu W, He R, Gong R: Genome-Wide Identification and Expression Analysis of the GRF and GIF Gene Families in Prunus avium. In: Agronomy. vol. 15; 2025.
- Zhang D-F, Li B, Jia G-Q, Zhang T-F, Dai J-R, Li J-S, Wang S-C: Isolation and characterization of genes encoding GRF transcription factors and GIF transcriptional coactivators in Maize (Zea mays L.). Plant Science 2008, 175(6):809-817.
- Kim JH, Kende H: A transcriptional coactivator, AtGIF1, is involved in regulating leaf growth and morphology in Arabidopsis. Proceedings of the National Academy of Sciences of the United States of America 2004, 101(36):13374-13379.
- Wang F, Qiu N, Ding Q, Li J, Zhang Y, Li H, Gao J: Genome-wide identification and analysis of the growth-regulating factor family in Chinese cabbage (Brassica rapa L. ssp. pekinensis). BMC Genomics 2014, 15(1):807. [CrossRef]
- Wu W, Li J, Wang Q, Lv K, Du K, Zhang W, Li Q, Kang X, Wei H: Growth-regulating factor 5 (GRF5)-mediated gene regulatory network promotes leaf growth and expansion in poplar. The New phytologist 2021, 230(2):612-628. [CrossRef]
- Liang G, He H, Li Y, Wang F, Yu D: Molecular mechanism of microRNA396 mediating pistil development in Arabidopsis. Plant physiology 2014, 164(1):249-258.
- Liu H, Guo S, Xu Y, Li C, Zhang Z, Zhang D, Xu S, Zhang C, Chong K: OsmiR396d-regulated OsGRFs function in floral organogenesis in rice through binding to their targets OsJMJ706 and OsCR4. Plant physiology 2014, 165(1):160-174. [CrossRef]
- Li S, Gao F, Xie K, Zeng X, Cao Y, Zeng J, He Z, Ren Y, Li W, Deng Q et al: The OsmiR396c-OsGRF4-OsGIF1 regulatory module determines grain size and yield in rice. Plant biotechnology journal 2016, 14(11):2134-2146.
- Hewezi T, Maier TR, Nettleton D, Baum TJ: The Arabidopsis microRNA396-GRF1/GRF3 regulatory module acts as a developmental regulator in the reprogramming of root cells during cyst nematode infection. Plant physiology 2012, 159(1):321-335.
- Debernardi JM, Mecchia MA, Vercruyssen L, Smaczniak C, Kaufmann K, Inze D, Rodriguez RE, Palatnik JF: Post-transcriptional control of GRF transcription factors by microRNA miR396 and GIF co-activator affects leaf size and longevity. The Plant journal : for cell and molecular biology 2014, 79(3):413-426.
- Kuijt SJ, Greco R, Agalou A, Shao J, t Hoen CC, Overnäs E, Osnato M, Curiale S, Meynard D, van Gulik R et al: Interaction between the GROWTH-REGULATING FACTOR and KNOTTED1-LIKE HOMEOBOX families of transcription factors. Plant physiology 2014, 164(4):1952-1966.
- Liu Y, Guo P, Wang J, Xu ZY: Growth-regulating factors: conserved and divergent roles in plant growth and development and potential value for crop improvement. The Plant journal : for cell and molecular biology 2023, 113(6):1122-1145. [CrossRef]
- Yuan H, Cheng M, Fan F, Zheng X, Wang R, Si F, Luo X, Li N, Li S: OsGRF6-OsYUCCA1/OsWRKY82 Signaling Cascade Upgrade Grain Yield and Bacterial Blight Resistance in Rice. Advanced science (Weinheim, Baden-Wurttemberg, Germany) 2024, 11(46):e2407733.
- Wang W, Wang W, Pan Y, Tan C, Li H, Chen Y, Liu X, Wei J, Xu N, Han Y et al: A new gain-of-function OsGS2/GRF4 allele generated by CRISPR/Cas9 genome editing increases rice grain size and yield. The Crop Journal 2022, 10(4):1207-1212.
- Yuan H, Cheng M, Wang R, Wang Z, Fan F, Wang W, Si F, Gao F, Li S: miR396b/GRF6 module contributes to salt tolerance in rice. Plant biotechnology journal 2024, 22(8):2079-2092.
- Li Z, Wang B, Zhang Z, Luo W, Tang Y, Niu Y, Chong K, Xu Y: OsGRF6 interacts with SLR1 to regulate OsGA2ox1 expression for coordinating chilling tolerance and growth in rice. Journal of plant physiology 2021, 260:153406. [CrossRef]
- Horiguchi G, Kim GT, Tsukaya H: The transcription factor AtGRF5 and the transcription coactivator AN3 regulate cell proliferation in leaf primordia of Arabidopsis thaliana. The Plant journal : for cell and molecular biology 2005, 43(1):68-78. [CrossRef]
- Kim JH, Tsukaya H: Regulation of plant growth and development by the GROWTH-REGULATING FACTOR and GRF-INTERACTING FACTOR duo. Journal of experimental botany 2015, 66(20):6093-6107. [CrossRef]
- Lee BH, Ko JH, Lee S, Lee Y, Pak JH, Kim JH: The Arabidopsis GRF-INTERACTING FACTOR gene family performs an overlapping function in determining organ size as well as multiple developmental properties. Plant physiology 2009, 151(2):655-668.
- Ai G, Zhang D, Huang R, Zhang S, Li W, Ahiakpa JK, Zhang J: Genome-Wide Identification and Molecular Characterization of the Growth-Regulating Factors-Interacting Factor Gene Family in Tomato. Genes 2020, 11(12). [CrossRef]
- Vercruyssen L, Verkest A, Gonzalez N, Heyndrickx KS, Eeckhout D, Han SK, Jégu T, Archacki R, Van Leene J, Andriankaja M et al: ANGUSTIFOLIA3 binds to SWI/SNF chromatin remodeling complexes to regulate transcription during Arabidopsis leaf development. The Plant cell 2014, 26(1):210-229.
- Nelissen H, Eeckhout D, Demuynck K, Persiau G, Walton A, van Bel M, Vervoort M, Candaele J, De Block J, Aesaert S et al: Dynamic Changes in ANGUSTIFOLIA3 Complex Composition Reveal a Growth Regulatory Mechanism in the Maize Leaf. The Plant cell 2015, 27(6):1605-1619.
- Zhang D, Sun W, Singh R, Zheng Y, Cao Z, Li M, Lunde C, Hake S, Zhang Z: GRF-interacting factor1 Regulates Shoot Architecture and Meristem Determinacy in Maize. The Plant cell 2018, 30(2):360-374. [CrossRef]
- Debernardi JM, Tricoli DM, Ercoli MF, Hayta S, Ronald P, Palatnik JF, Dubcovsky J: A GRF-GIF chimeric protein improves the regeneration efficiency of transgenic plants. Nature biotechnology 2020, 38(11):1274-1279.
- Vercruyssen L, Tognetti VB, Gonzalez N, Van Dingenen J, De Milde L, Bielach A, De Rycke R, Van Breusegem F, Inzé D: GROWTH REGULATING FACTOR5 stimulates Arabidopsis chloroplast division, photosynthesis, and leaf longevity. Plant physiology 2015, 167(3):817-832.
- Zhang Y, Liu J, Li Y, Ma H, Ji J, Wang Y, Zhuang M, Yang L, Fang Z, Li J et al: Generation of novel bpm6 and dmr6 mutants with broad-spectrum resistance using a modified CRISPR/Cas9 system in Brassica oleracea. J Integr Plant Biol 2025, 67(5):1214-1216.
- Liu JJ, Ekramoddoullah AK: Identification and characterization of the WRKY transcription factor family in Pinus monticola. Genome 2009, 52(1):77-88.
- Wang P, Xiao Y, Yan M, Yan Y, Lei X, Di P, Wang Y: Whole-genome identification and expression profiling of growth-regulating factor (GRF) and GRF-interacting factor (GIF) gene families in Panax ginseng. BMC Genomics 2023, 24(1):334. [CrossRef]
- Cao Y, Han Y, Jin Q, Lin Y, Cai Y: Comparative Genomic Analysis of the GRF Genes in Chinese Pear (Pyrus bretschneideri Rehd), Poplar (Populous), Grape (Vitis vinifera), Arabidopsis and Rice (Oryza sativa). Frontiers in plant science 2016, 7:1750.
- Shang S, Wu C, Huang C, Tie W, Yan Y, Ding Z, Xia Z, Wang W, Peng M, Tian L et al: Genome-Wide Analysis of the GRF Family Reveals Their Involvement in Abiotic Stress Response in Cassava. Genes 2018, 9(2).
- Meng L, Li X, Hou Y, Li Y, Hu Y: Functional conservation and divergence in plant-specific GRF gene family revealed by sequences and expression analysis. Open life sciences 2022, 17(1):155-171. [CrossRef]
- Gbadegesin MA, Beeching JR: Isolation and partial characterization of a root-specific promoter for stacking multiple traits into cassava (Manihot esculenta CRANTZ). Genetics and molecular research : GMR 2011, 10(2):1032-1041. [CrossRef]
- Zhang X, Dong J, Liu H, Wang J, Qi Y, Liang Z: Transcriptome Sequencing in Response to Salicylic Acid in Salvia miltiorrhiza. PloS one 2016, 11(1):e0147849.
- Ding Z, Tie W, Fu L, Yan Y, Liu G, Yan W, Li Y, Wu C, Zhang J, Hu W: Strand-specific RNA-seq based identification and functional prediction of drought-responsive lncRNAs in cassava. BMC Genomics 2019, 20(1):214. [CrossRef]
- Horiguchi G, Nakayama H, Ishikawa N, Kubo M, Demura T, Fukuda H, Tsukaya H: ANGUSTIFOLIA3 plays roles in adaxial/abaxial patterning and growth in leaf morphogenesis. Plant & cell physiology 2011, 52(1):112-124.
- Lu Y, Zeng J, Liu Q: The Rice miR396-GRF-GIF-SWI/SNF Module: A Player in GA Signaling. Frontiers in plant science 2022, Volume 12 - 2021.
- He Z, Zeng J, Ren Y, Chen D, Li W, Gao F, Cao Y, Luo T, Yuan G, Wu X et al: OsGIF1 Positively Regulates the Sizes of Stems, Leaves, and Grains in Rice. Frontiers in plant science 2017, 8:1730.
- Duan P, Ni S, Wang J, Zhang B, Xu R, Wang Y, Chen H, Zhu X, Li Y: Regulation of OsGRF4 by OsmiR396 controls grain size and yield in rice. Nature Plants 2015, 2(1):15203.
- Debernardi JM, Mecchia MA, Vercruyssen L, Smaczniak C, Kaufmann K, Inze D, Rodriguez RE, Palatnik JFJTPJ: Post-transcriptional control of GRF transcription factors by micro RNA miR396 and GIF co-activator affects leaf size and longevity. 2014, 79(3):413-426.
Figure 1.
Chromosomal mapping of cassava MeGRFs and MeGIFs. The ratio represents megabases (Mb). The chromosome number is displayed to the left of each vertical bar. (a) Chromosomal mapping of cassava MeGRFs; (b) cassava MeGIFs.
Figure 1.
Chromosomal mapping of cassava MeGRFs and MeGIFs. The ratio represents megabases (Mb). The chromosome number is displayed to the left of each vertical bar. (a) Chromosomal mapping of cassava MeGRFs; (b) cassava MeGIFs.
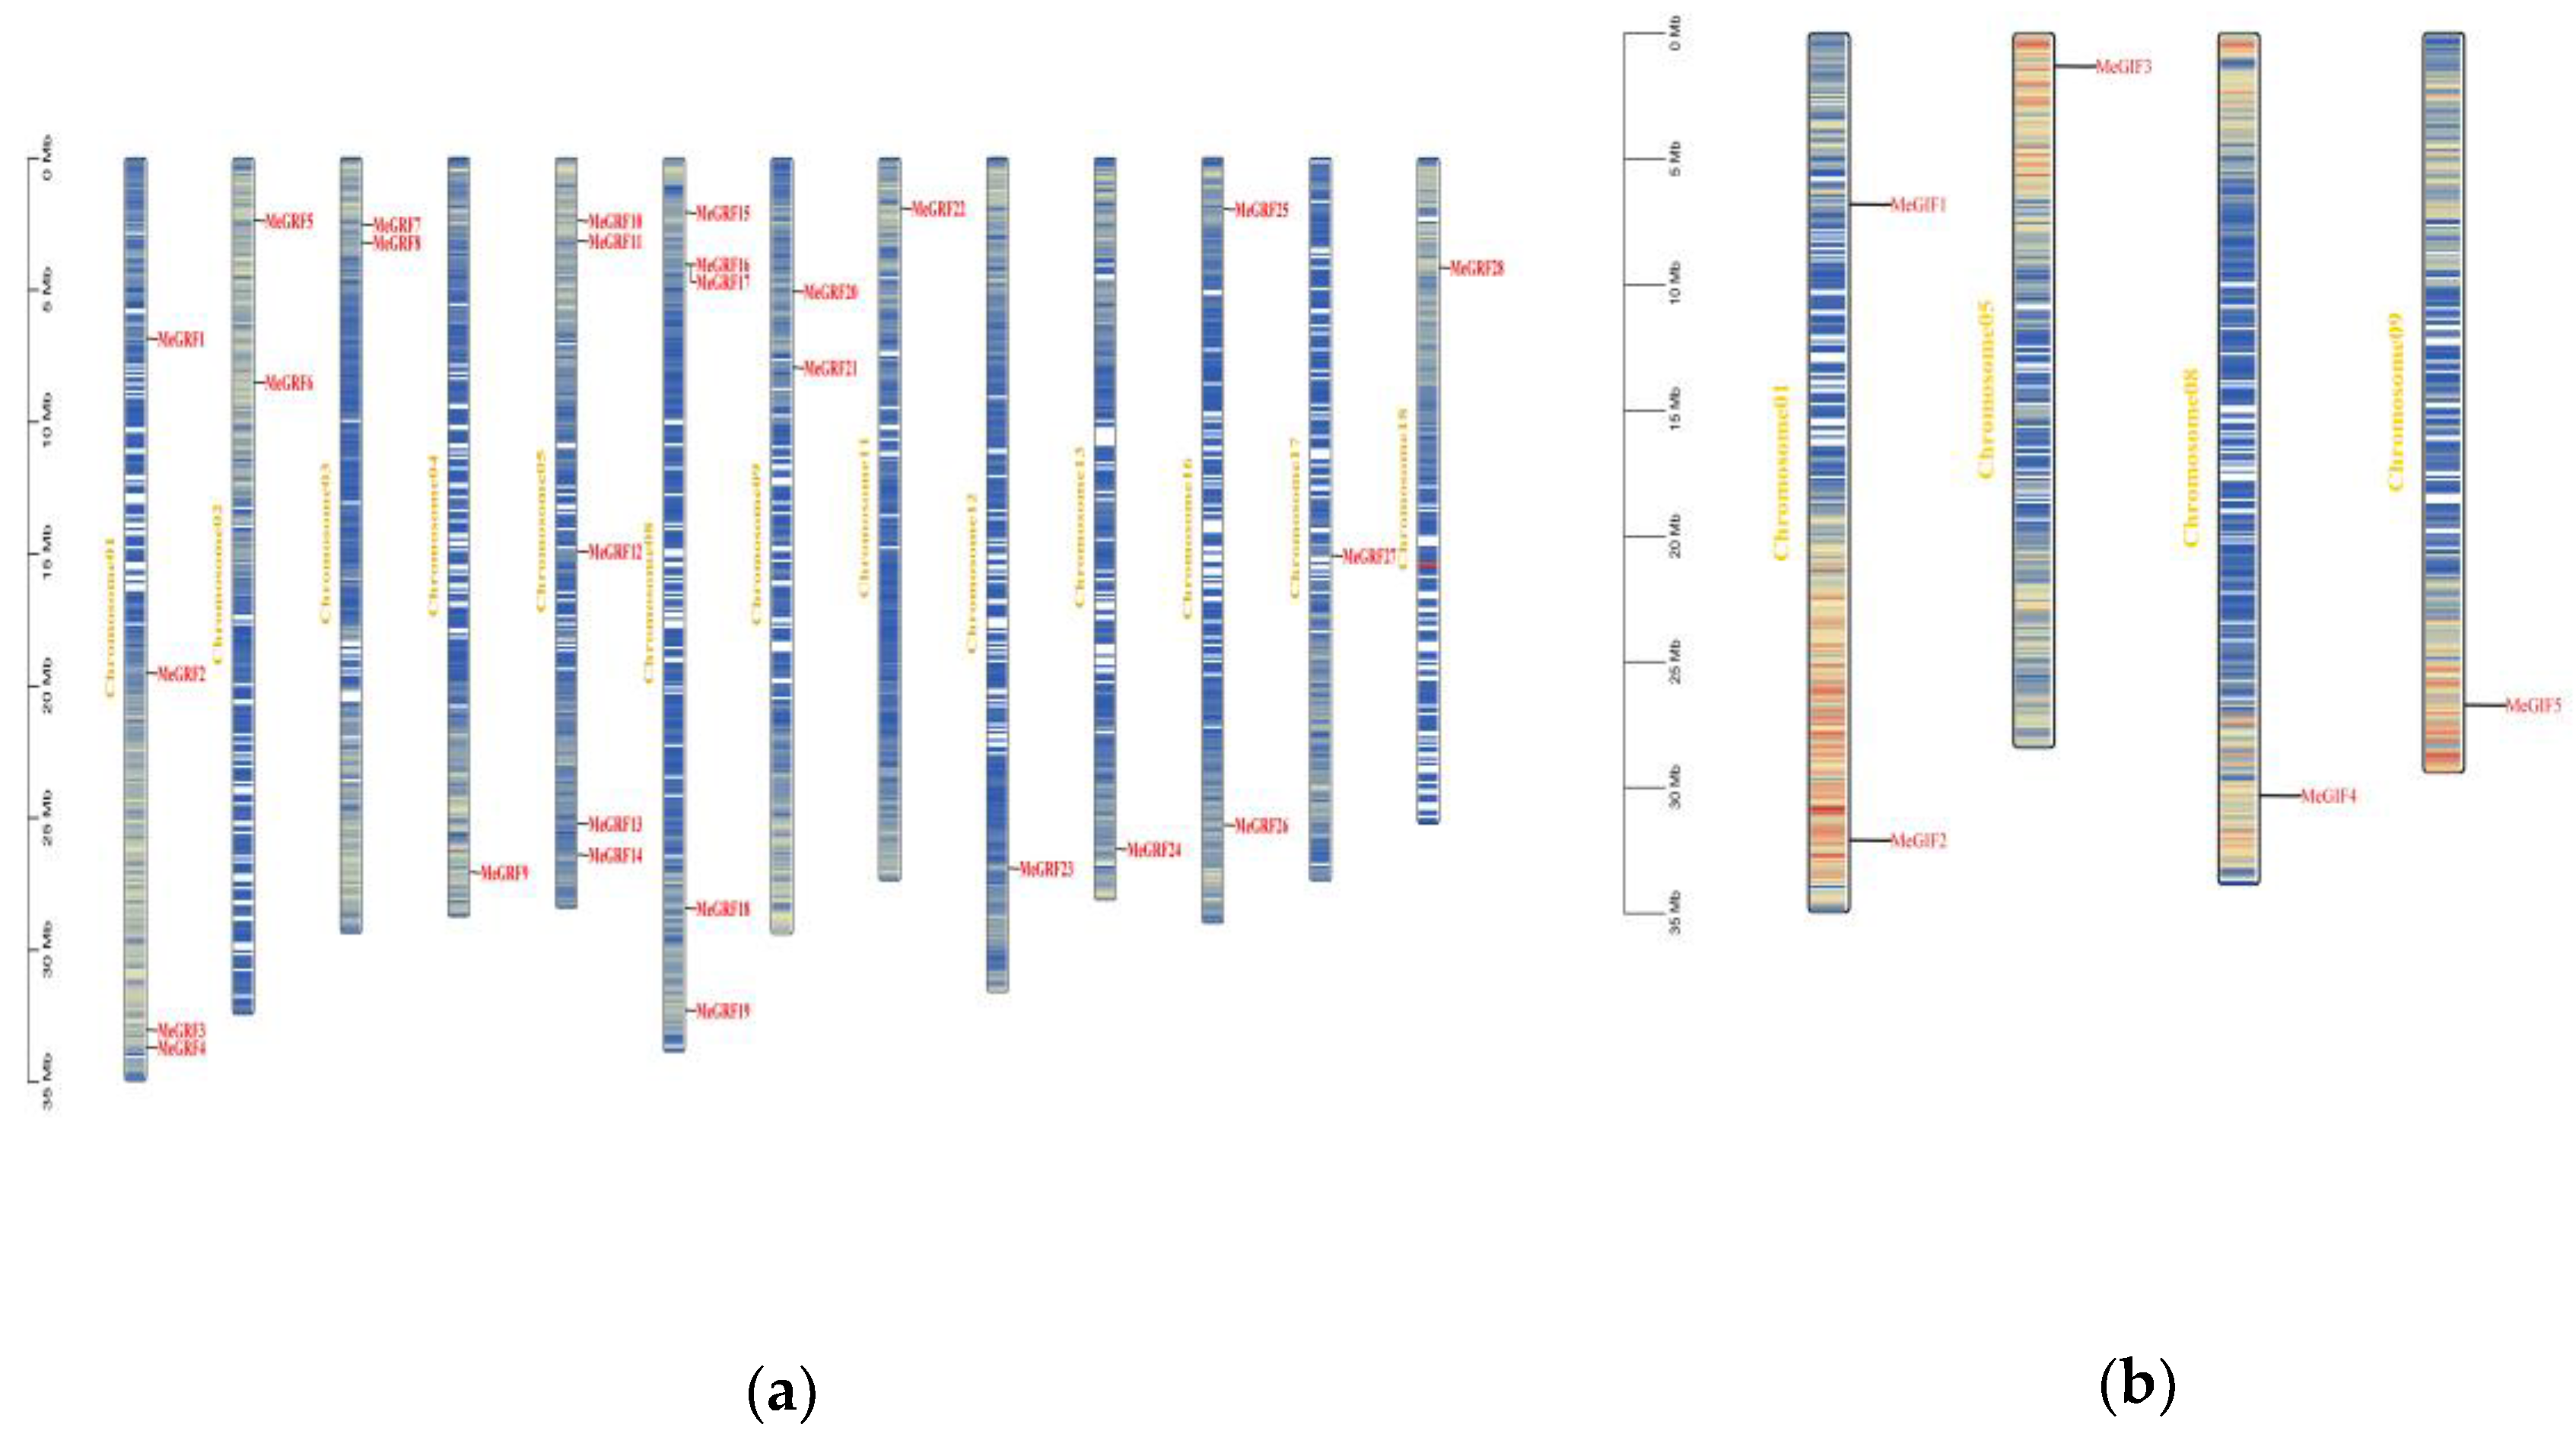
Figure 2.
Phylogenetic analysis of MeGRFs and MeGIFs in cassava. (c) Phylogenetic tree of GRF genes in cassava, Arabidopsis, and rice. The star represents Arabidopsis, the circle represents rice, and the square represents cassava.; (d) Phylogenetic tree of GIF genes in cassava, Arabidopsis, rice, and tomato. The star represents cassava, the circle represents Arabidopsis, the square represents tomato, and the check mark represents rice.
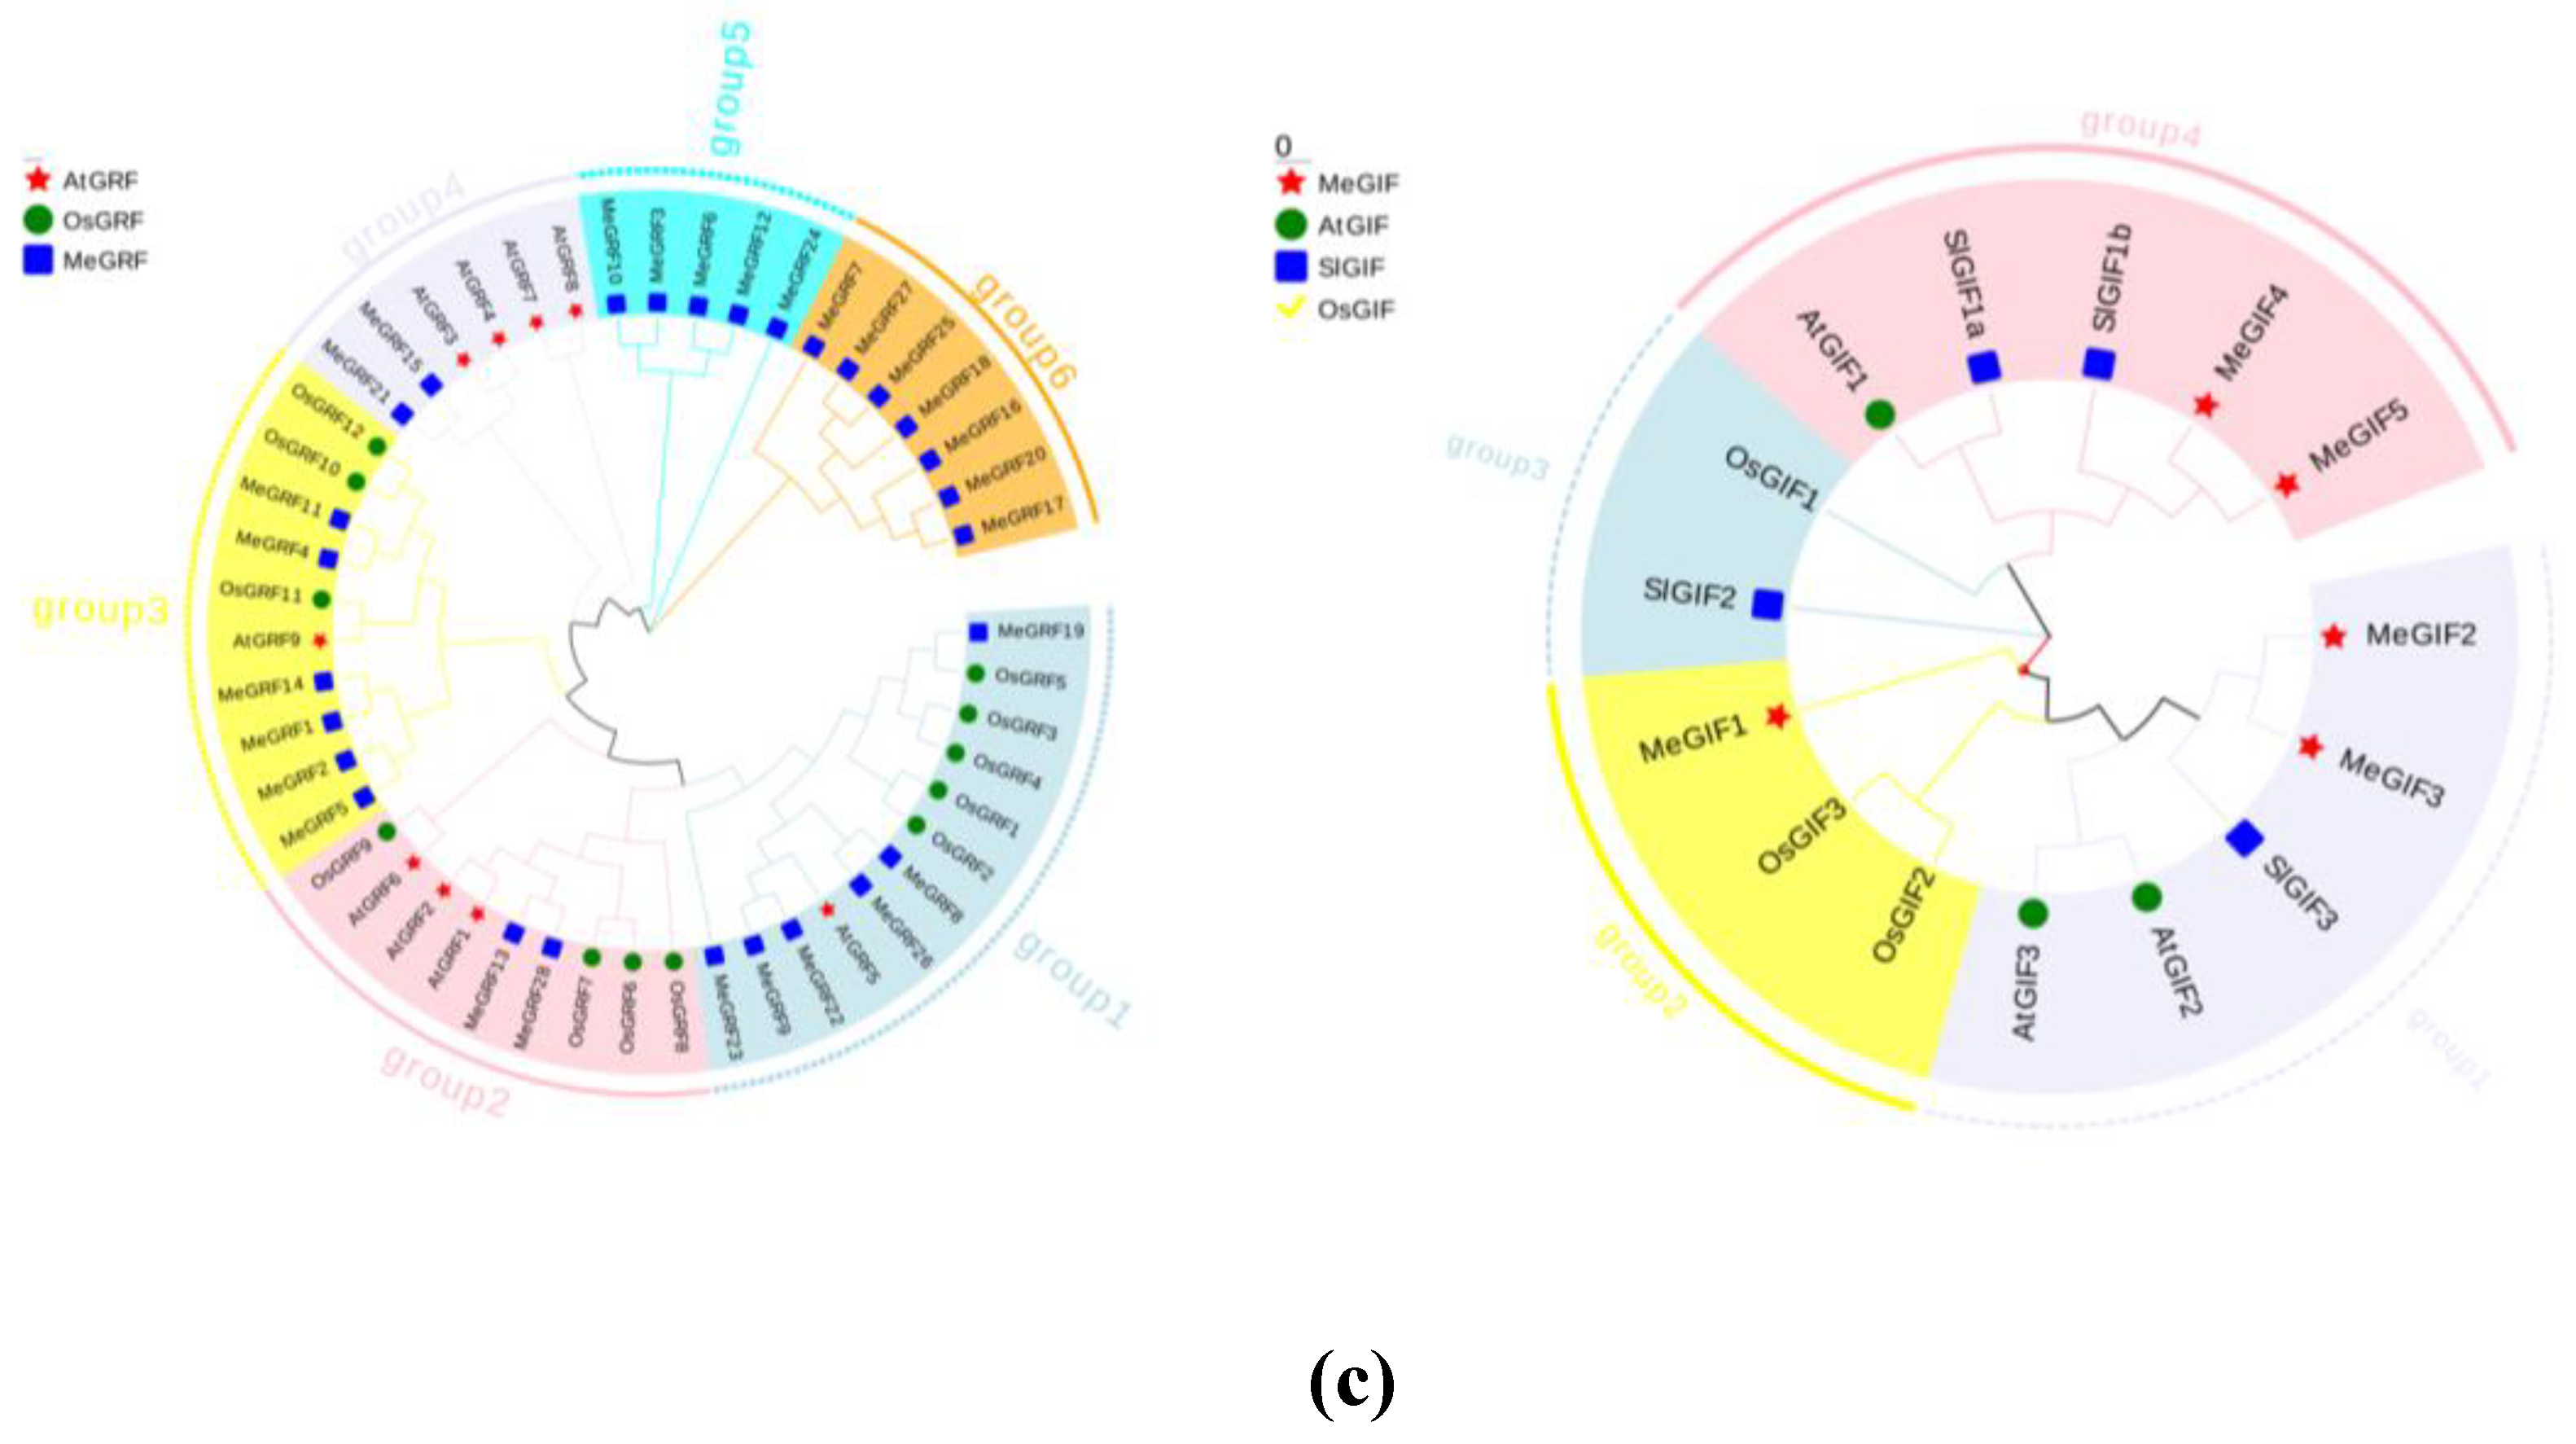
Figure 3.
Conserved domain of cassava MeGRFs and MeGIFs. Conserved motifs in MeGRF and MeGIF genes were detected using MEME. Boxes of different colors represent ten different motifs. (d) Conserved domain of MeGRFs; (e) Conserved domain of MeGIFs.
Figure 3.
Conserved domain of cassava MeGRFs and MeGIFs. Conserved motifs in MeGRF and MeGIF genes were detected using MEME. Boxes of different colors represent ten different motifs. (d) Conserved domain of MeGRFs; (e) Conserved domain of MeGIFs.
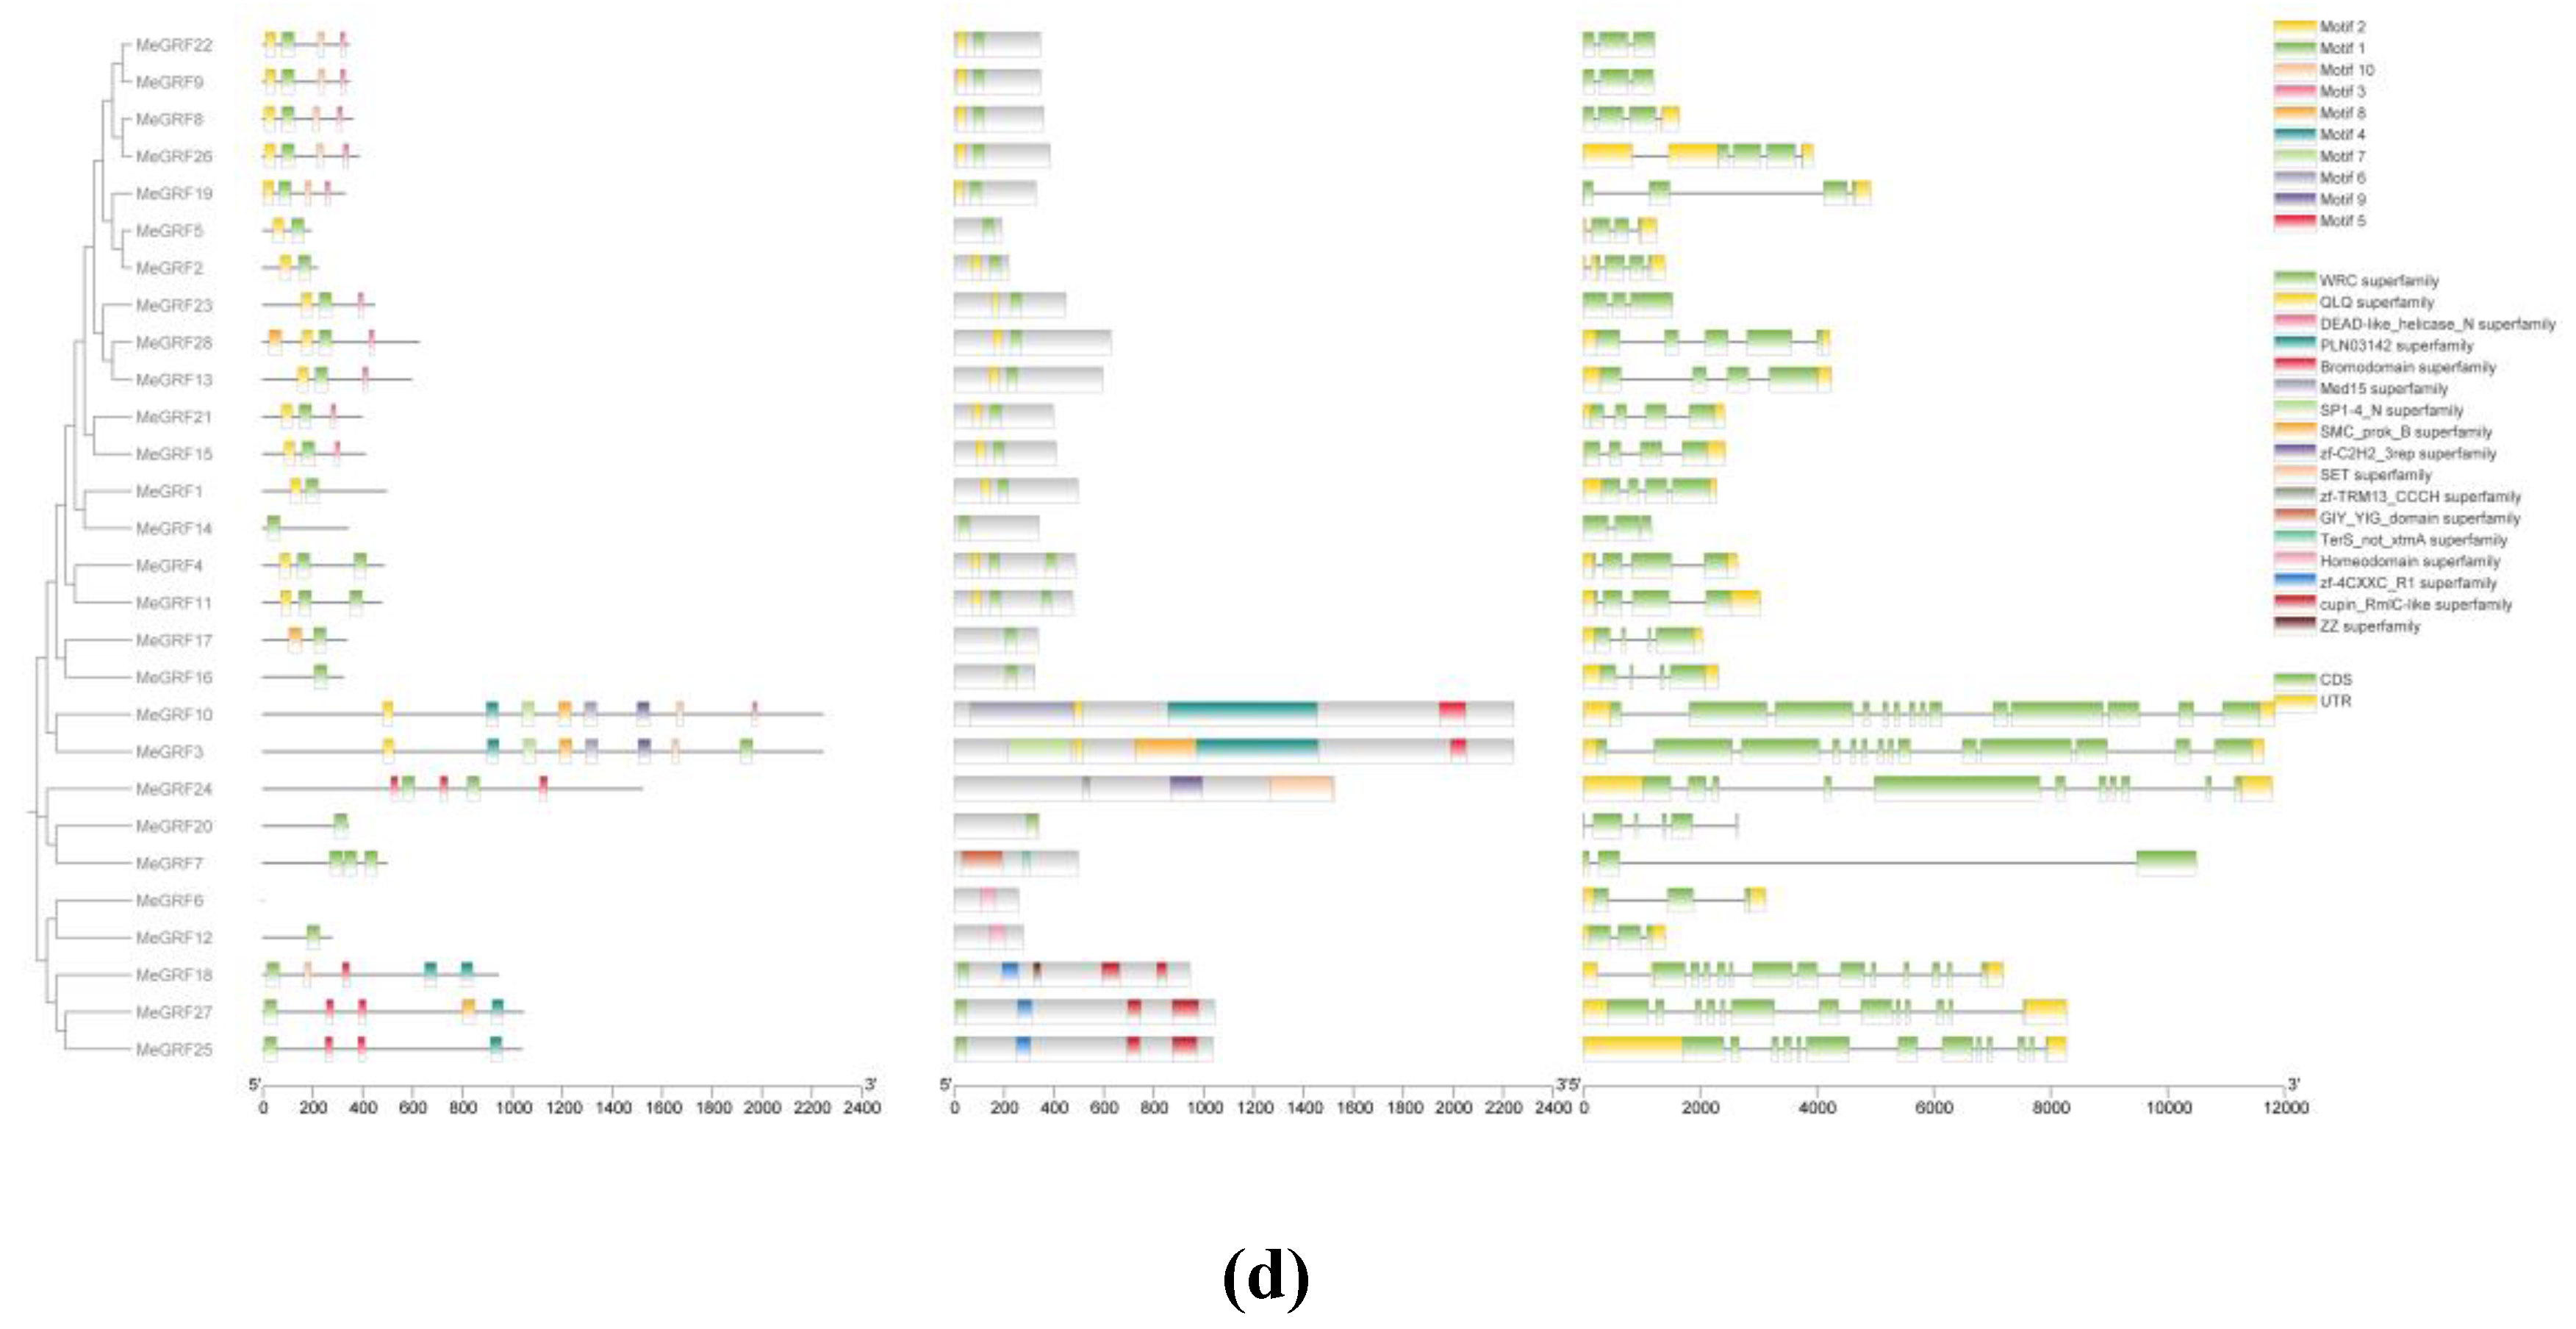
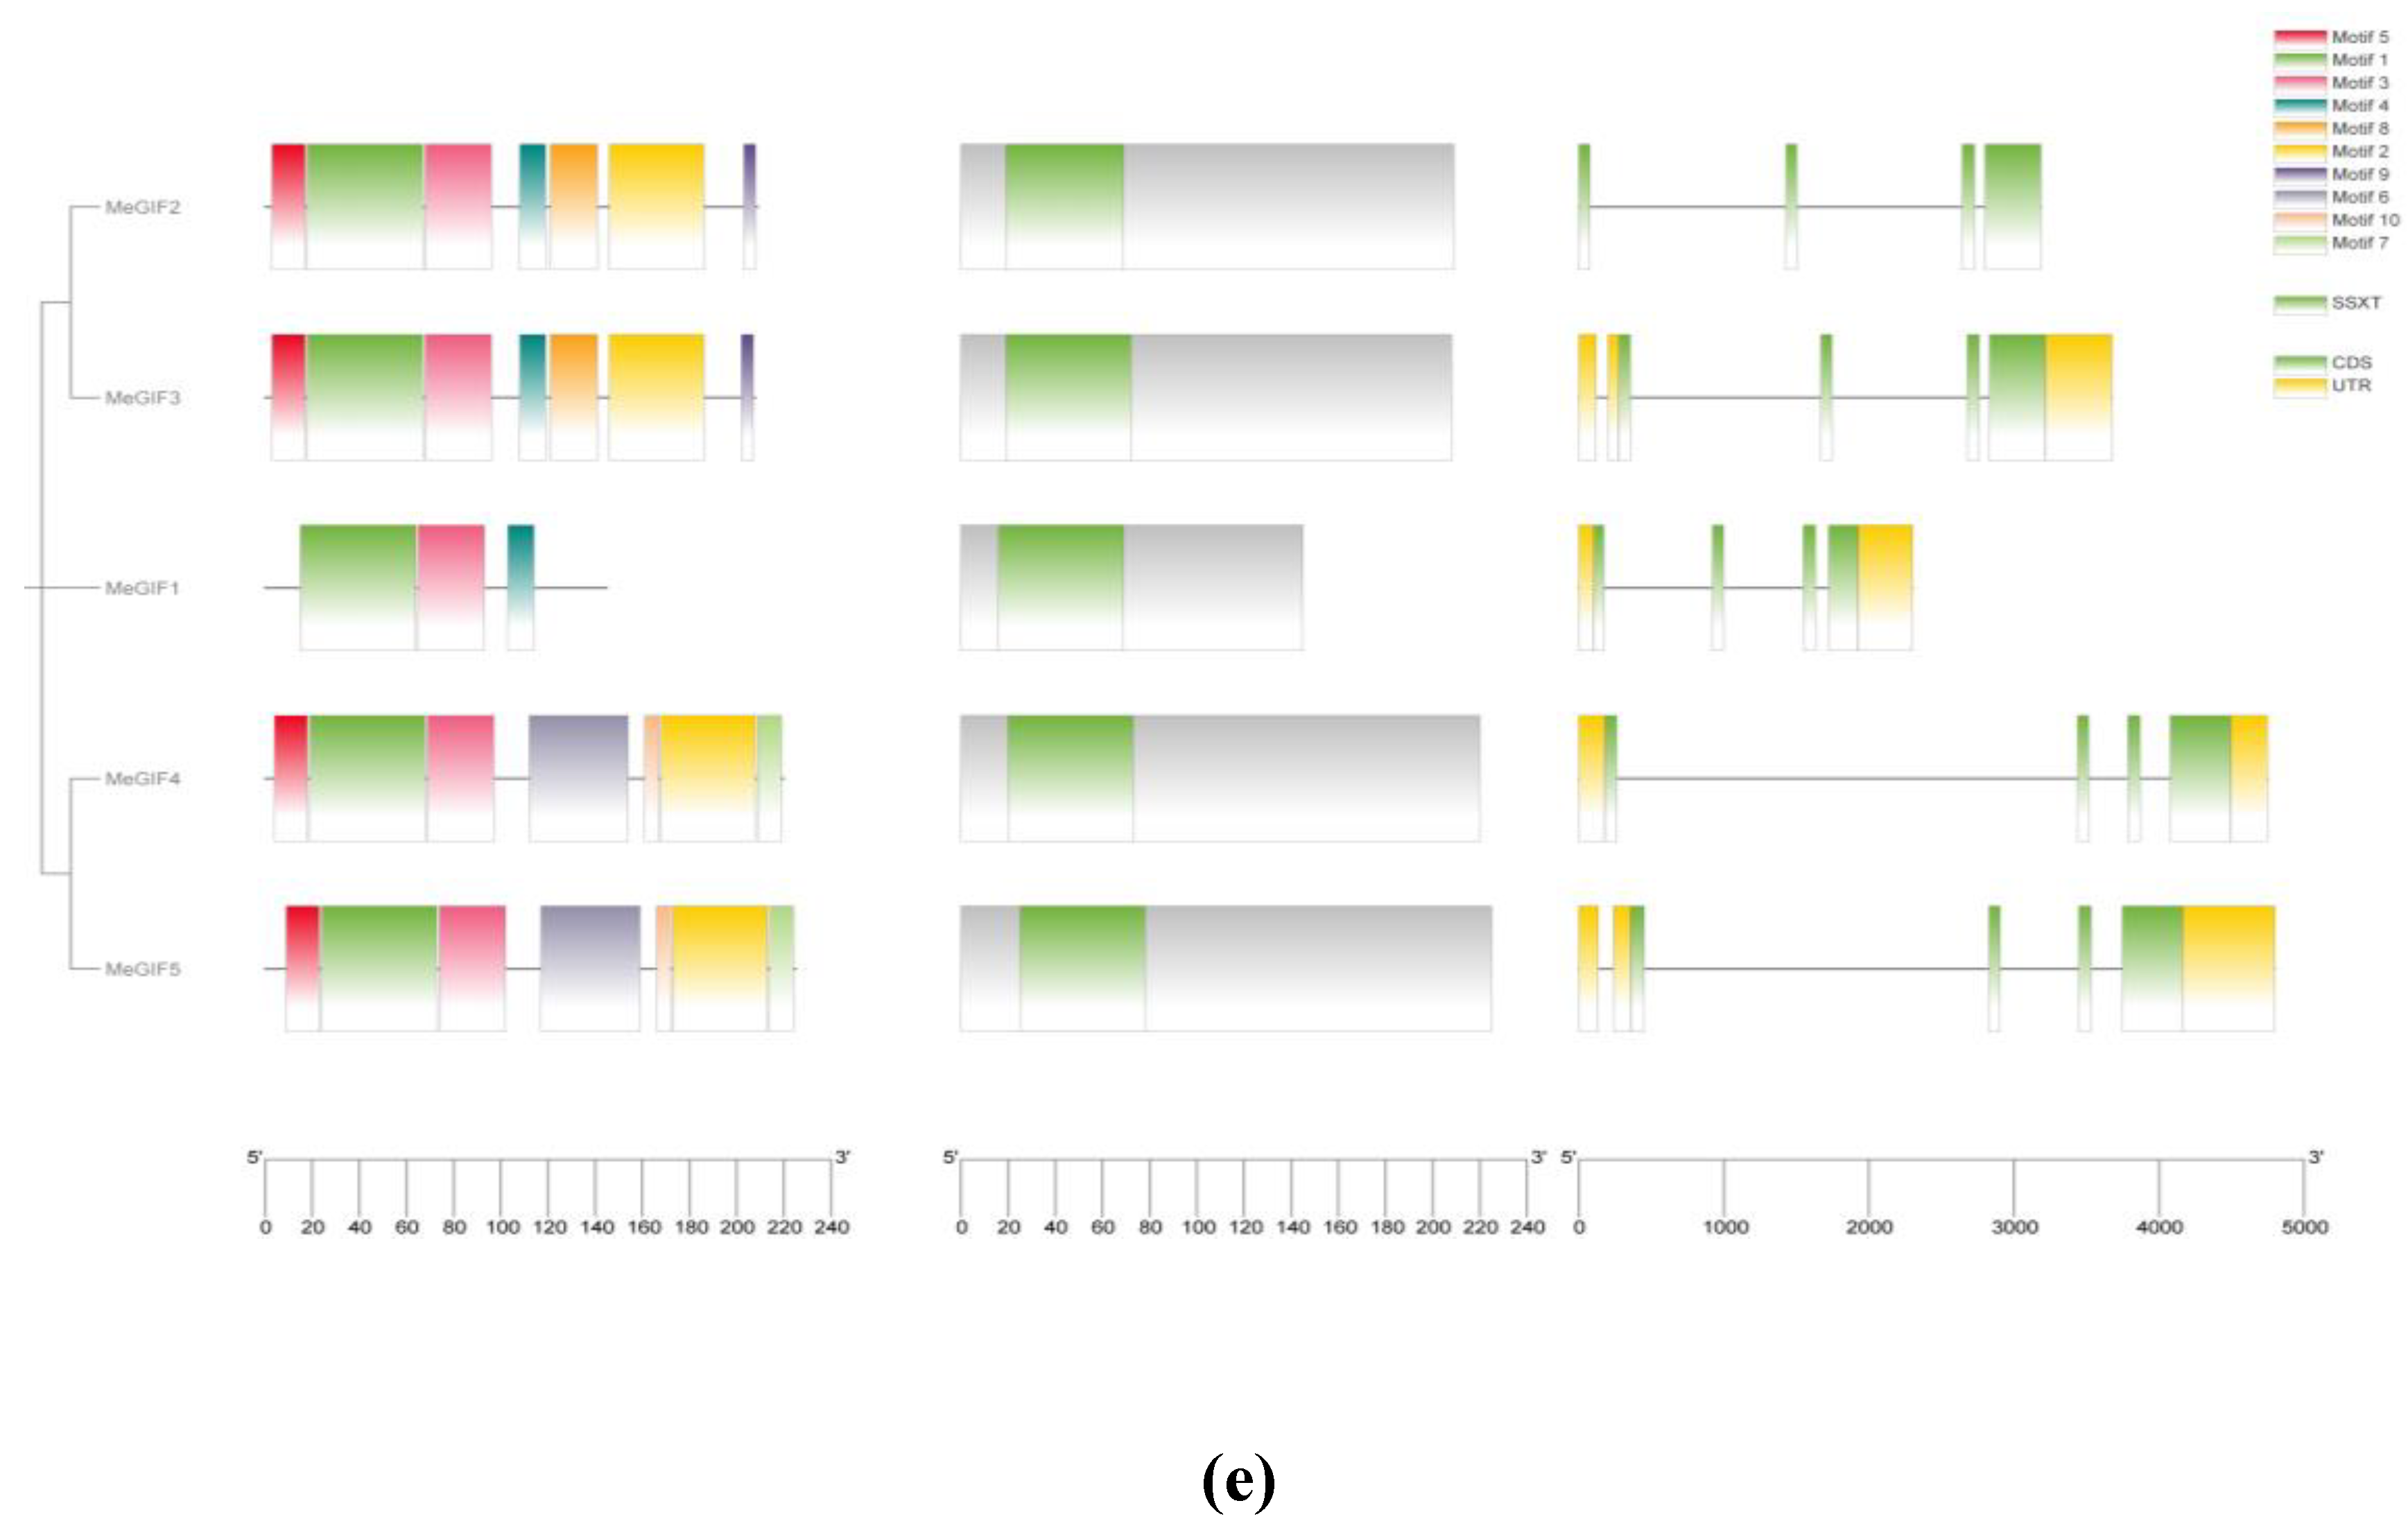
Figure 4.
The C-terminal region of GRF proteins is less conserved and contains additional motifs such as TQL (Thr, Gln, Leu), FFD (Phe, Phe, Asp), and GGPL (Gly, Gly, Pro, Leu).
Figure 4.
The C-terminal region of GRF proteins is less conserved and contains additional motifs such as TQL (Thr, Gln, Leu), FFD (Phe, Phe, Asp), and GGPL (Gly, Gly, Pro, Leu).
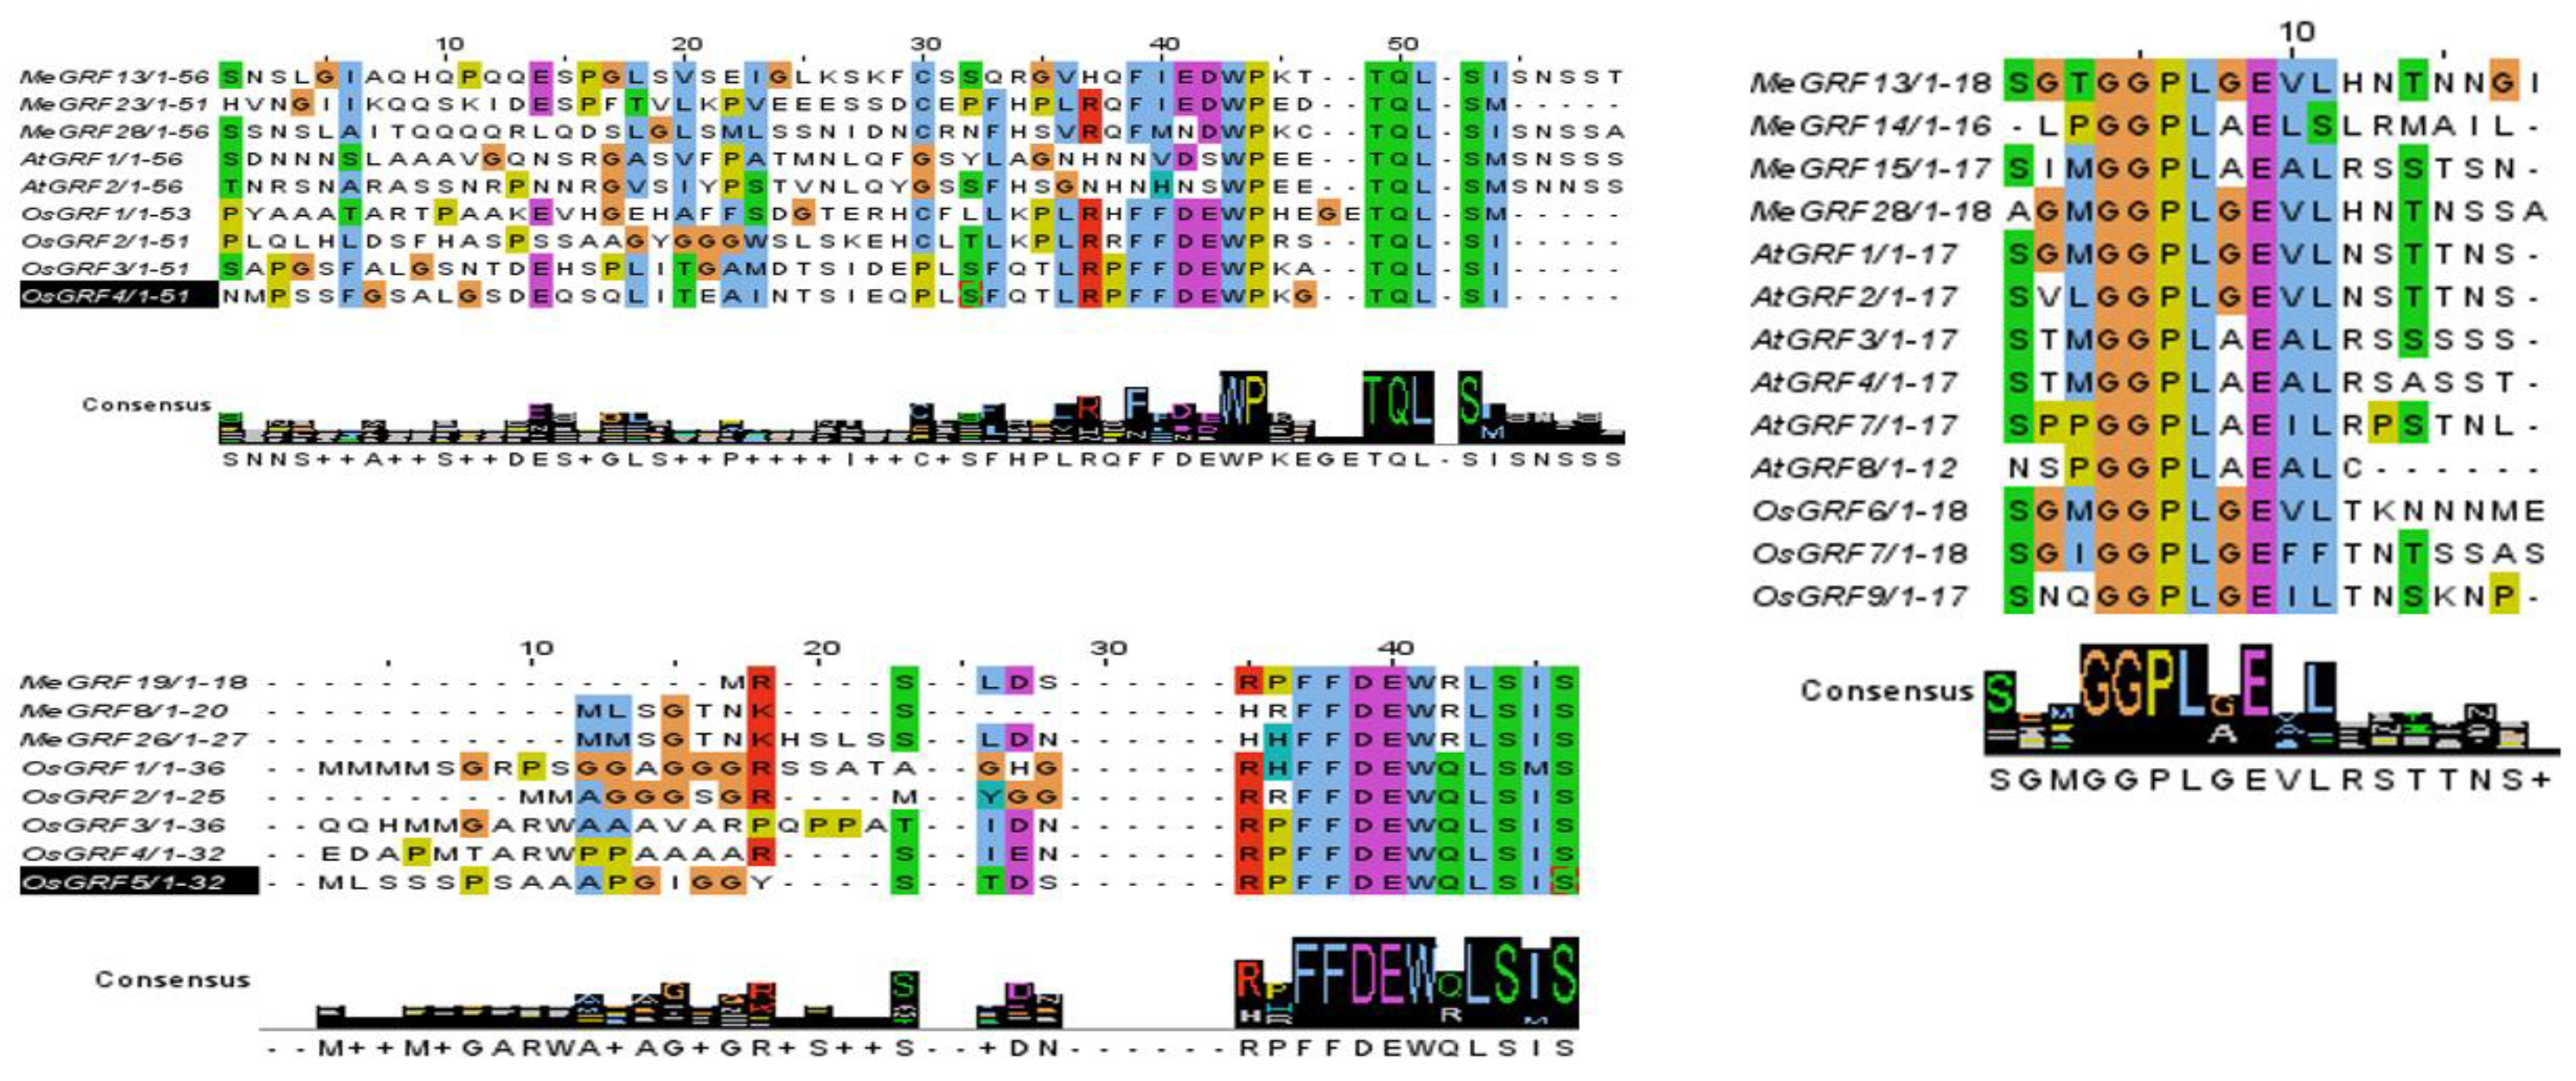
Figure 5.
Type and number of cis-acting elements in the MeGRFs and MeGIFs gene promoter. (i) Cis-acting element analysis of the MeGRFs family genes. (h) Cis-acting element analysis of the MeGRFs family genes. There are four directions of light response element, hormone response, growth and development, and environmental stress: the light reaction element, the hormone response related element., growth and development, and the environmental stress element.
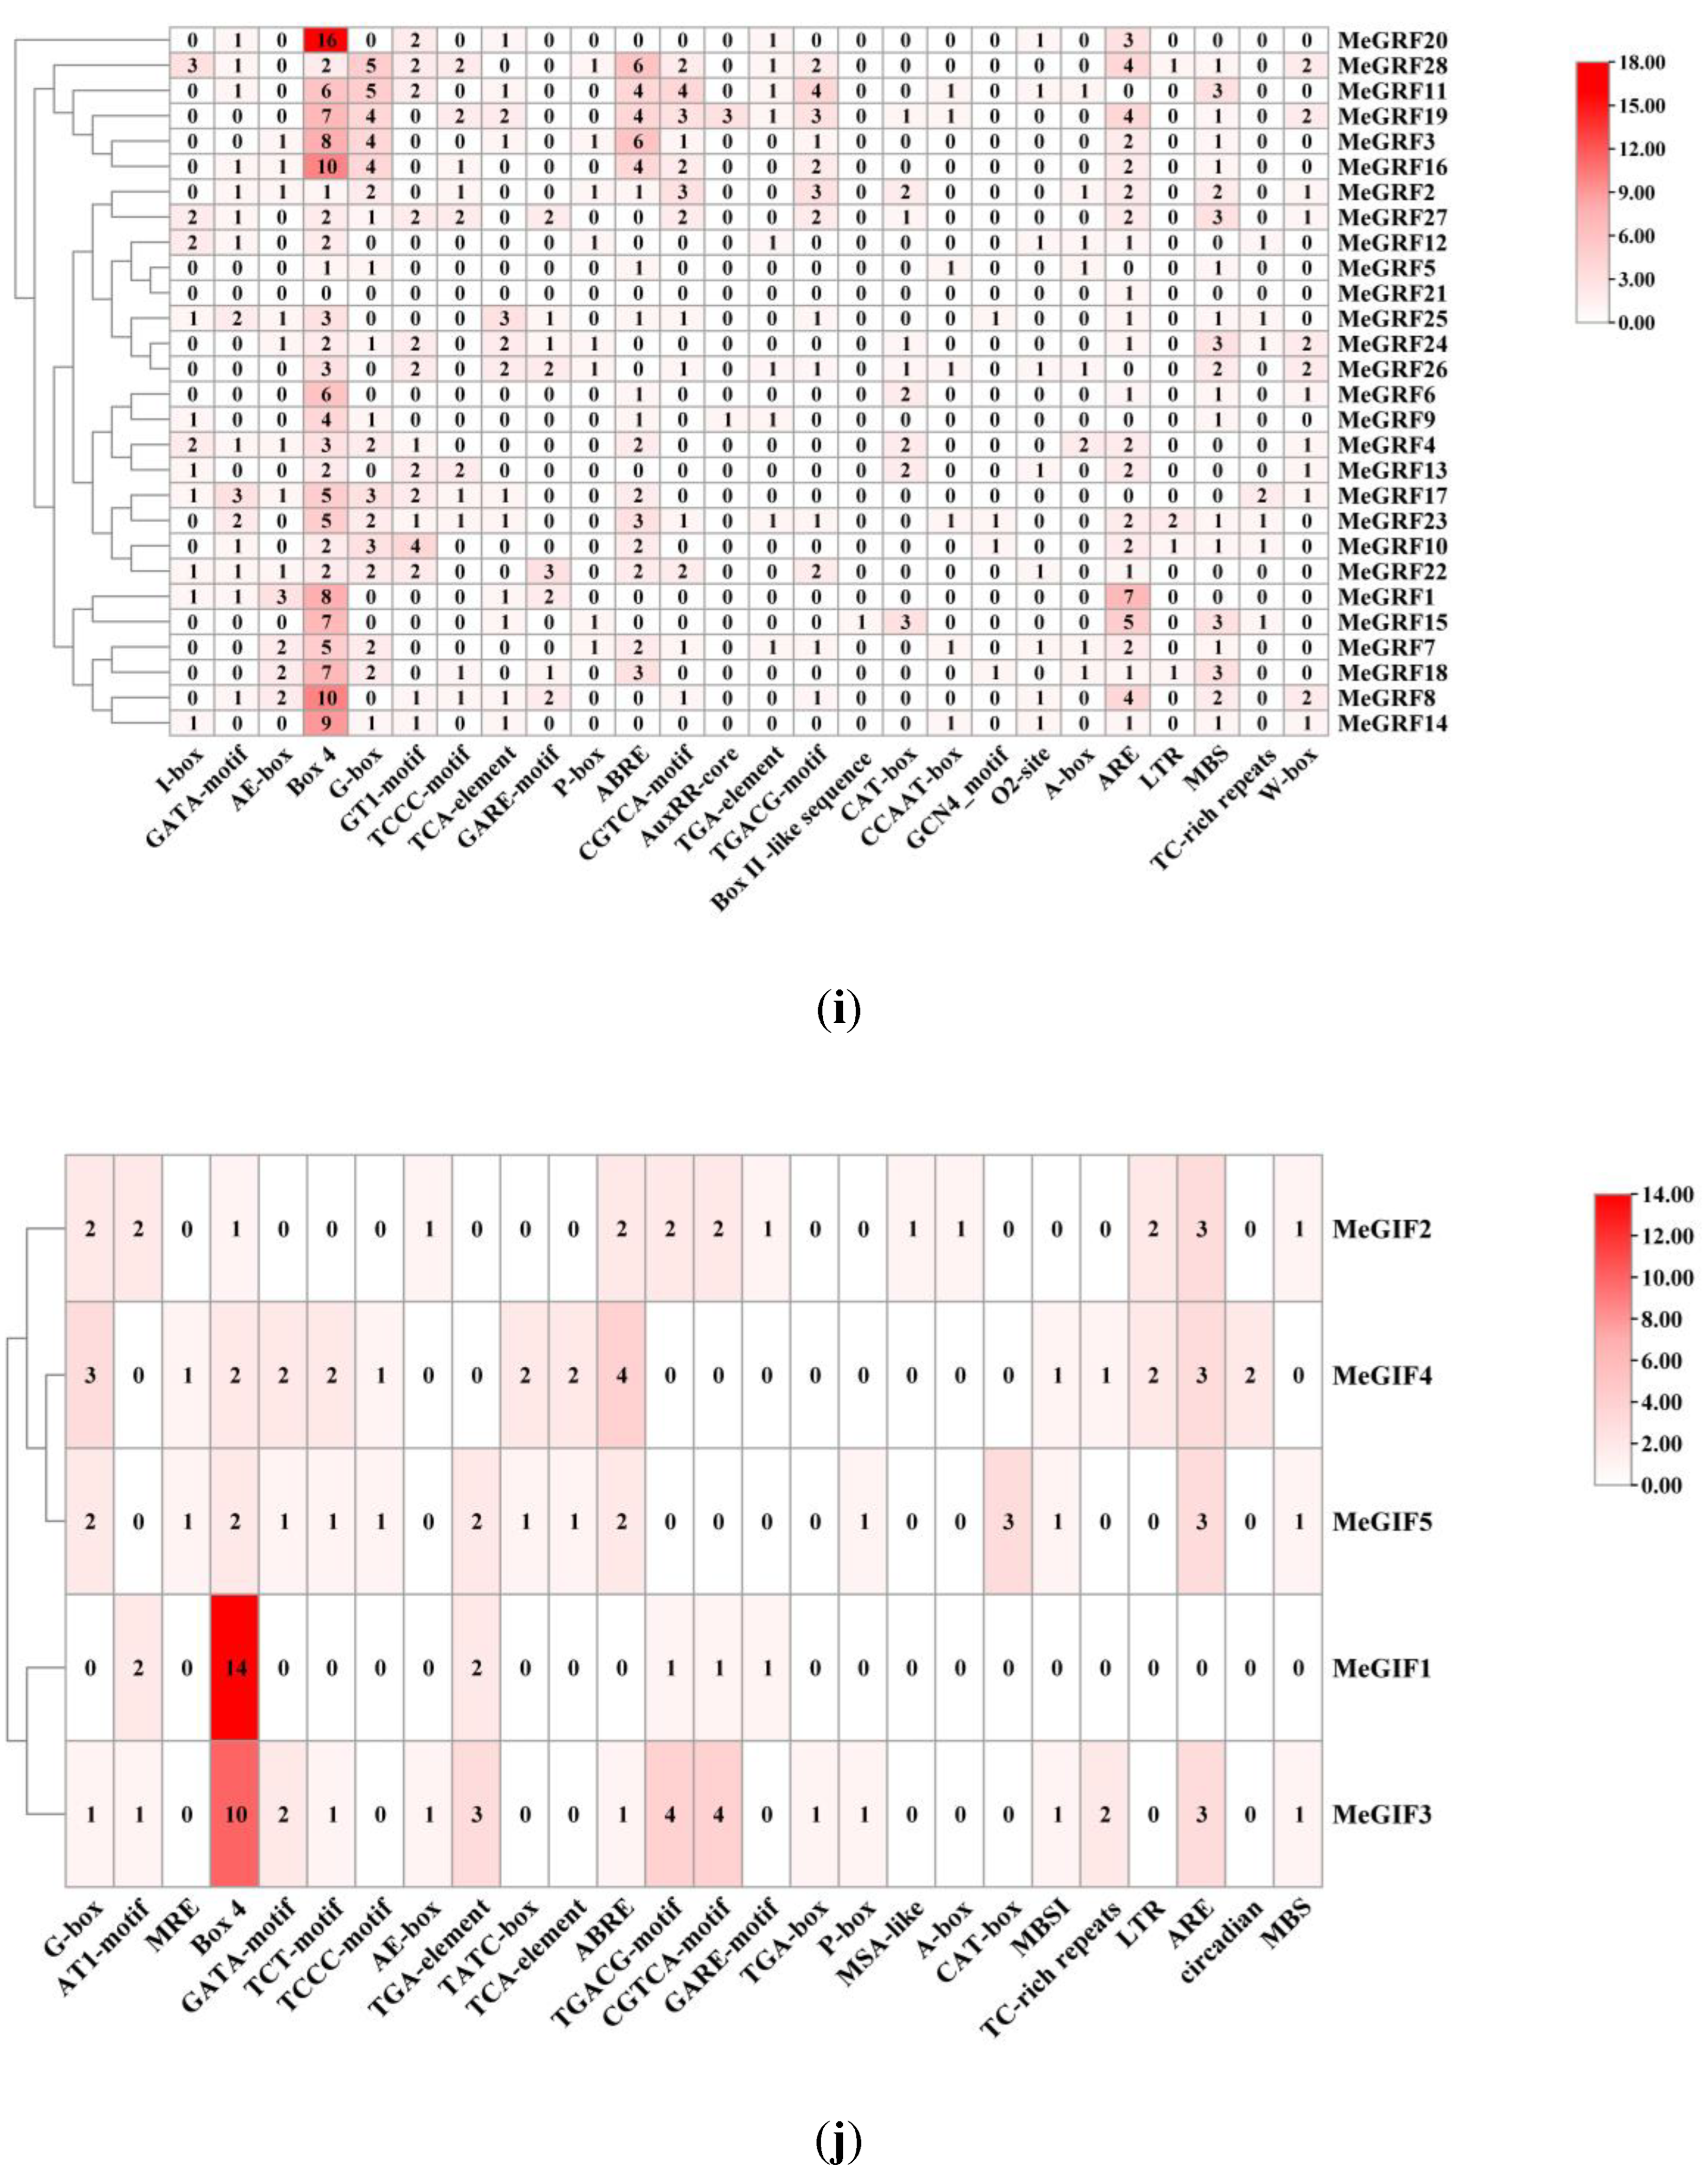
Figure 6.
Expression patterns of cassava GRF and GIF Expression in different tissues. (k) Expression patterns of cassava GRF Expression in different tissues. (l) Expression patterns of cassava GIF Expression in different tissues. OES, Somatic embryos; FEC, Brittle calluses; FR, Fibrous roots; SR, Root tubers; RAM, Root tips; SAM, Stem apexes were tested. The bar at the right of the heatmap represents the relative expression values; values < 0 represent downregulated expression, and values > 0 represent upregulated expression.
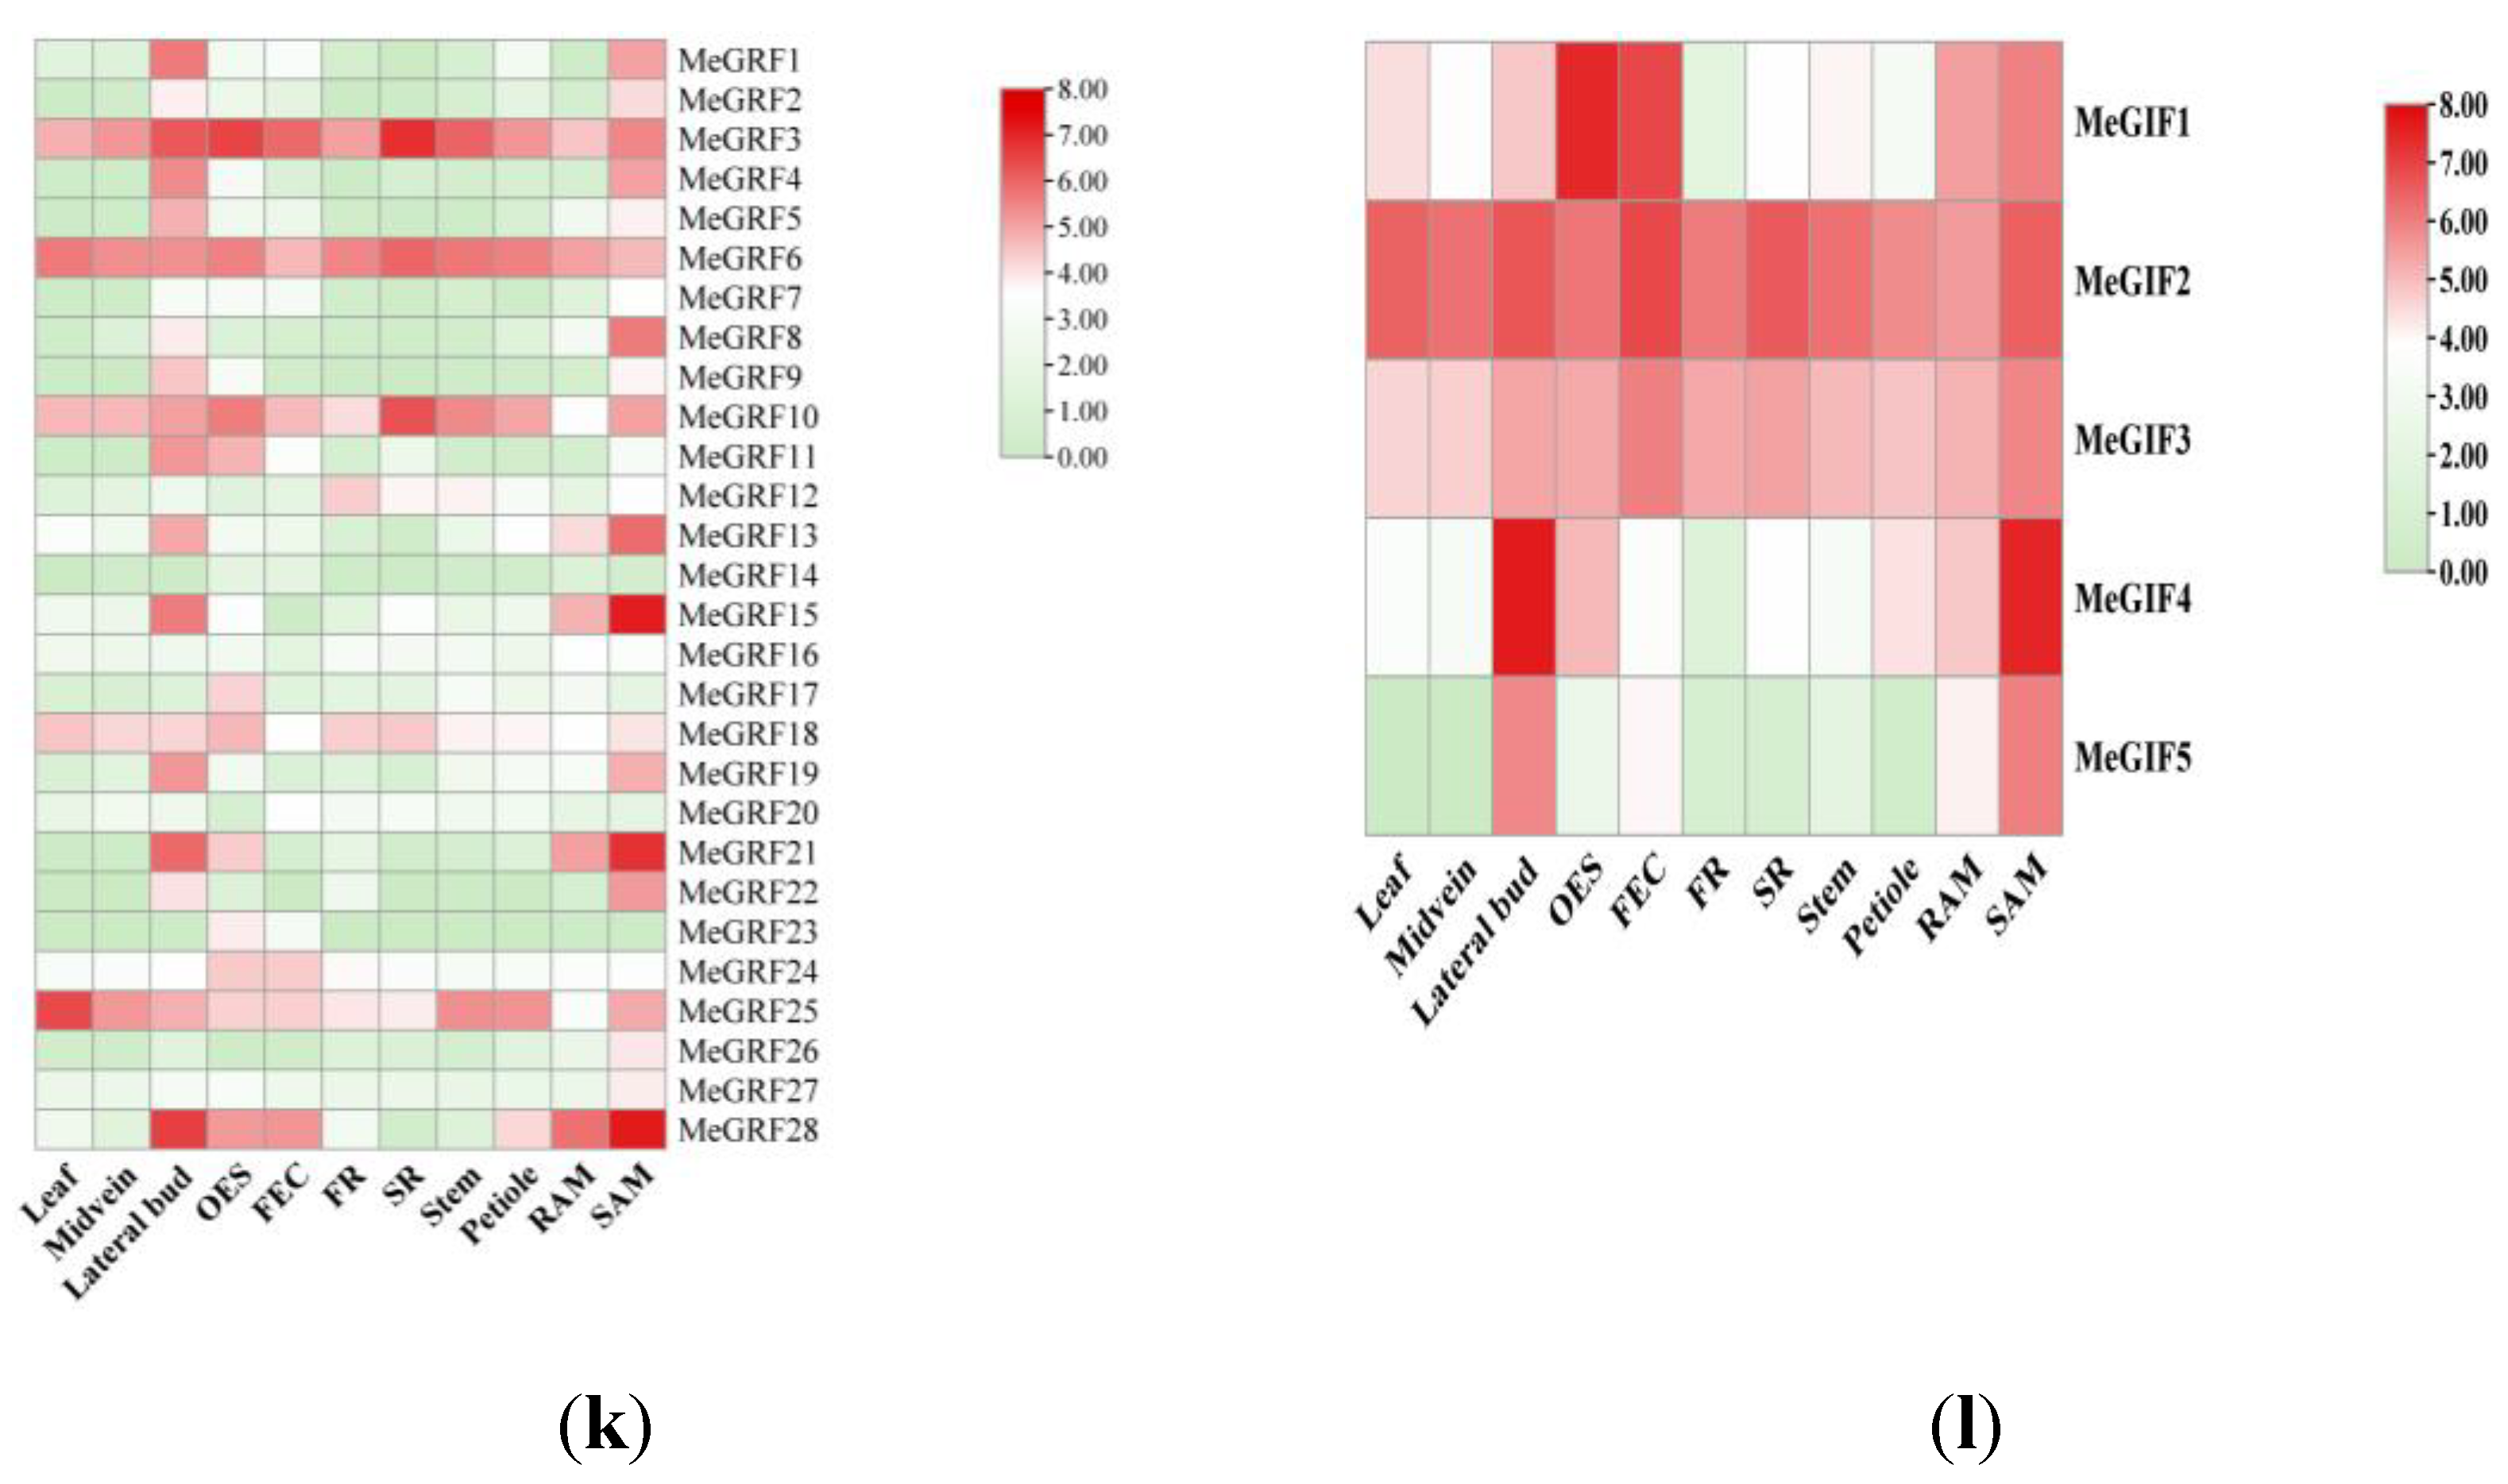
Figure 7.
Expression profiles of cassava GRF and GIF genes in response to the XpmCNH11 (s) Expression profiles of cassava GRF genes in response to the XpmCNH11 (t) Expression profiles of cassava GIF genes in response to the XpmCNH11.
Figure 7.
Expression profiles of cassava GRF and GIF genes in response to the XpmCNH11 (s) Expression profiles of cassava GRF genes in response to the XpmCNH11 (t) Expression profiles of cassava GIF genes in response to the XpmCNH11.
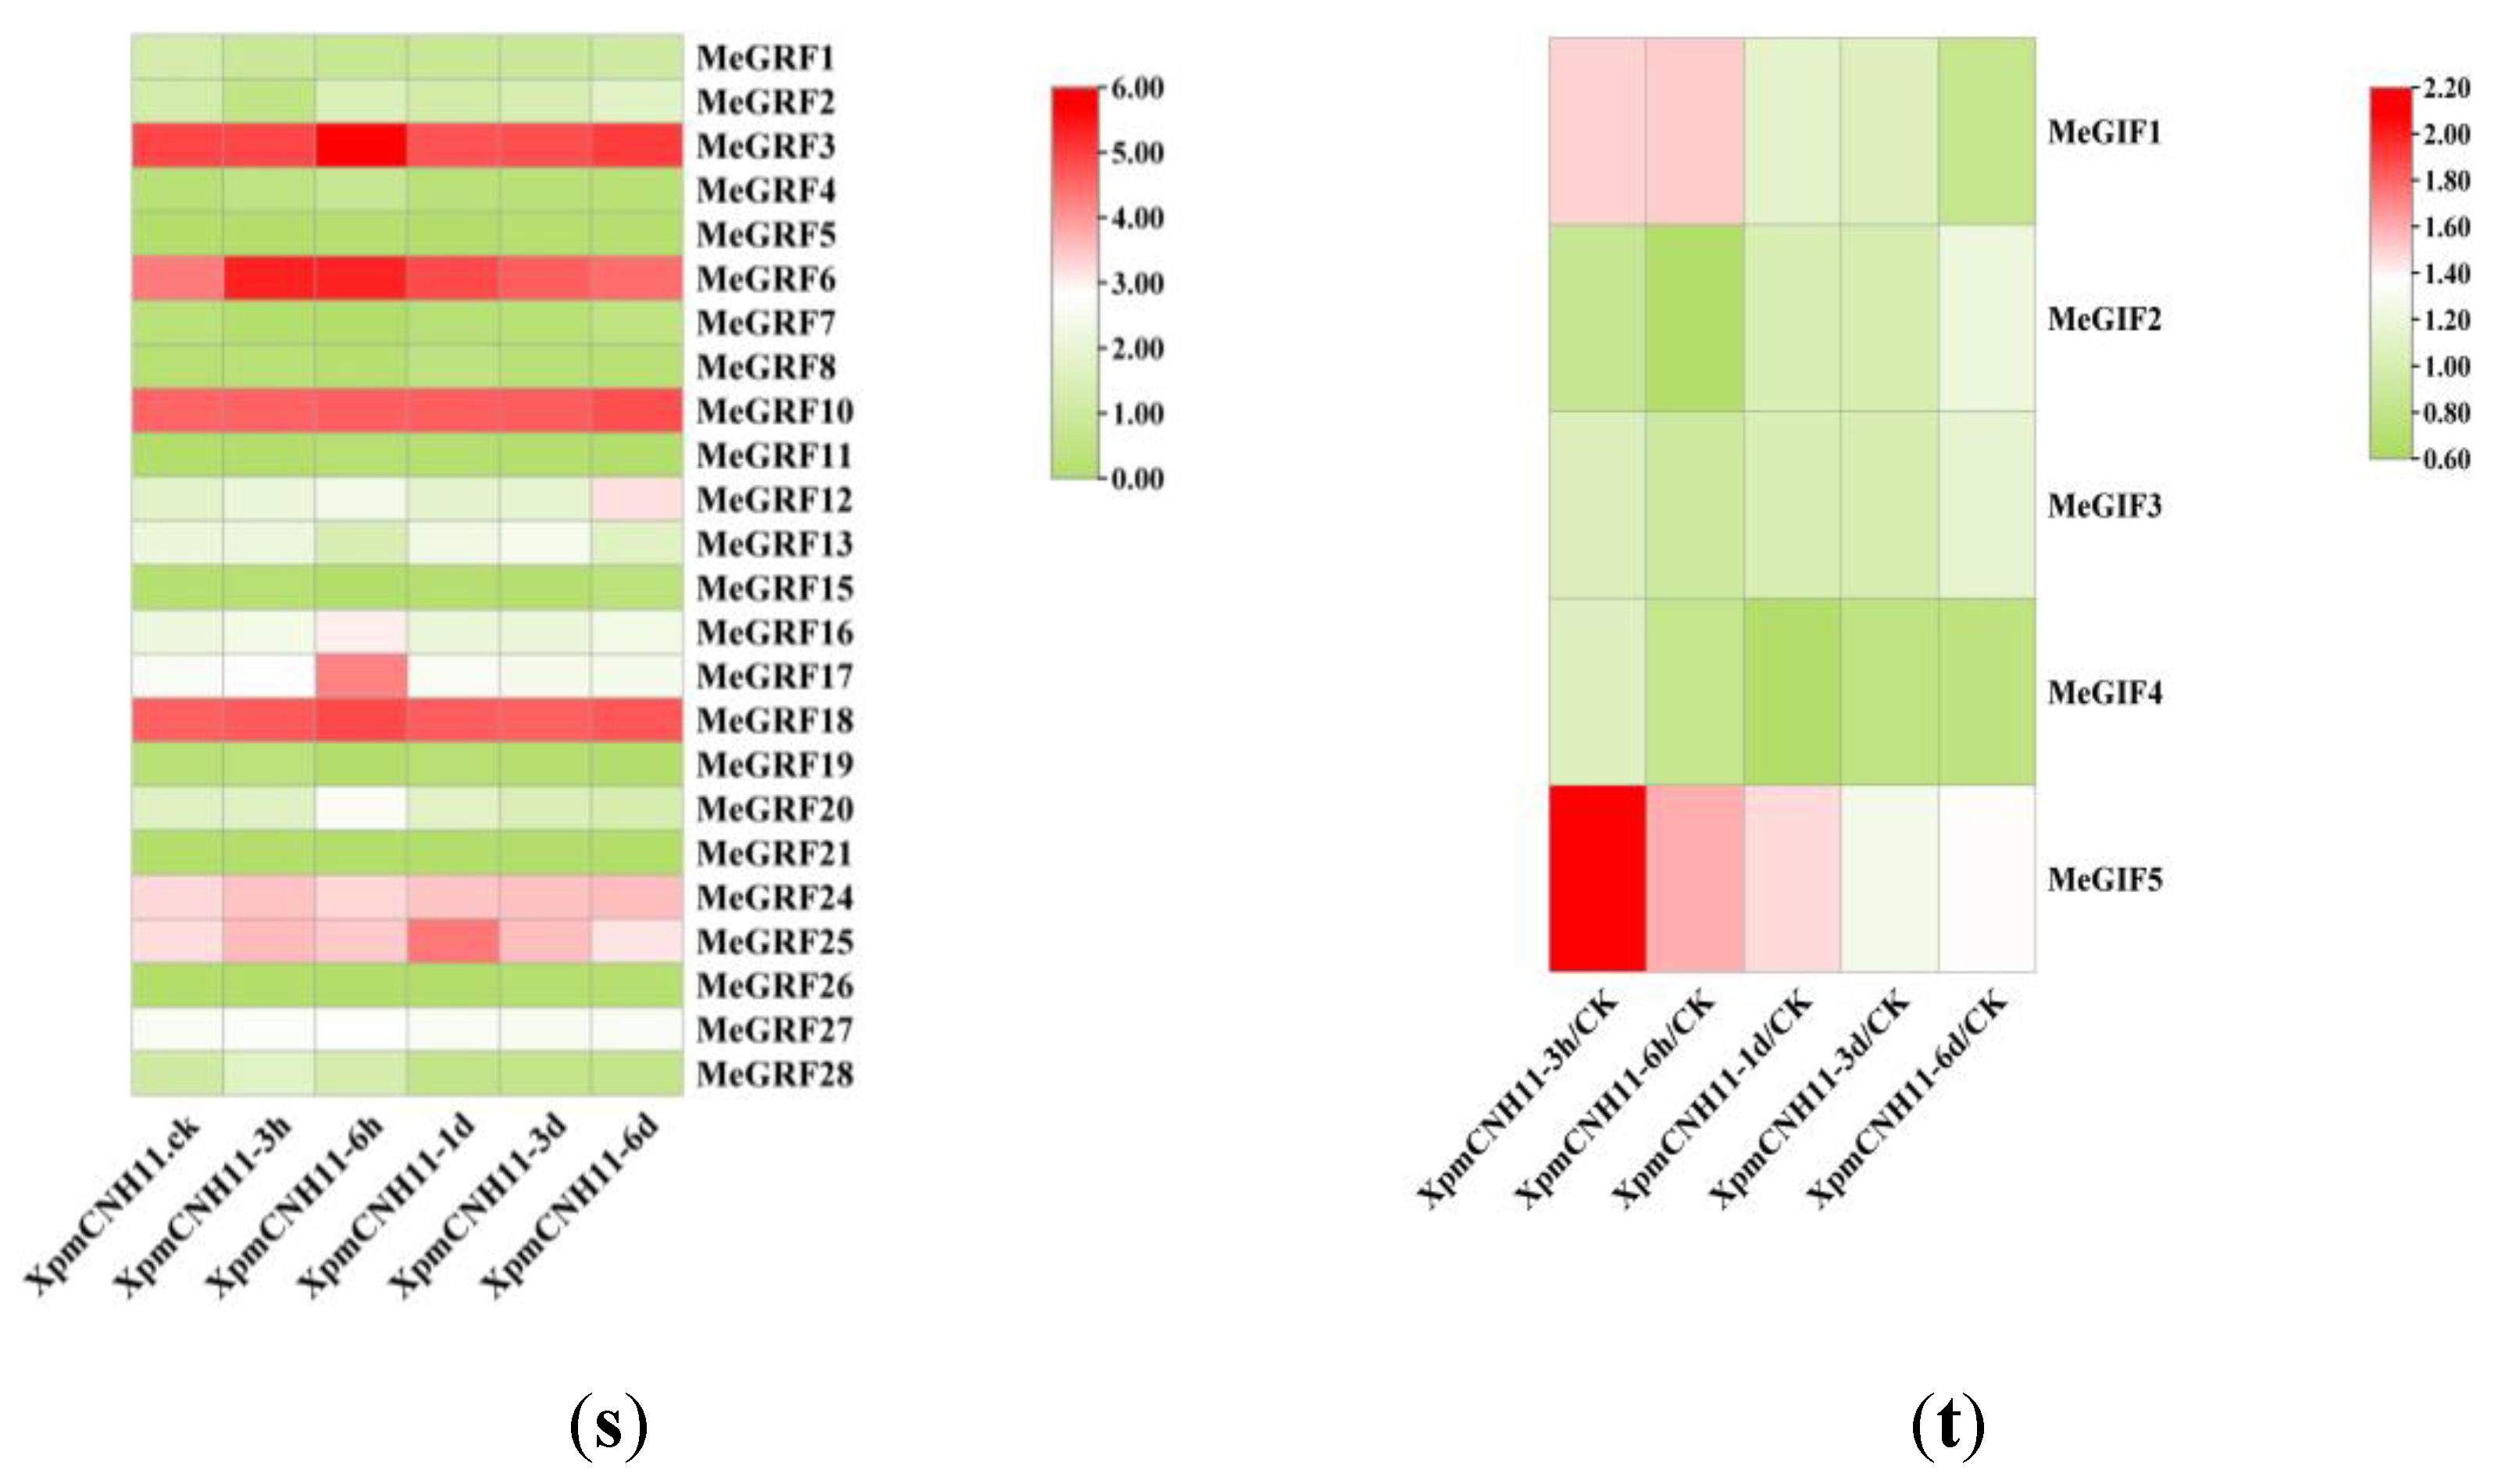
Figure 8.
Expression analysis of MeGRFs and MeGIFs in response to XpmCNH11.
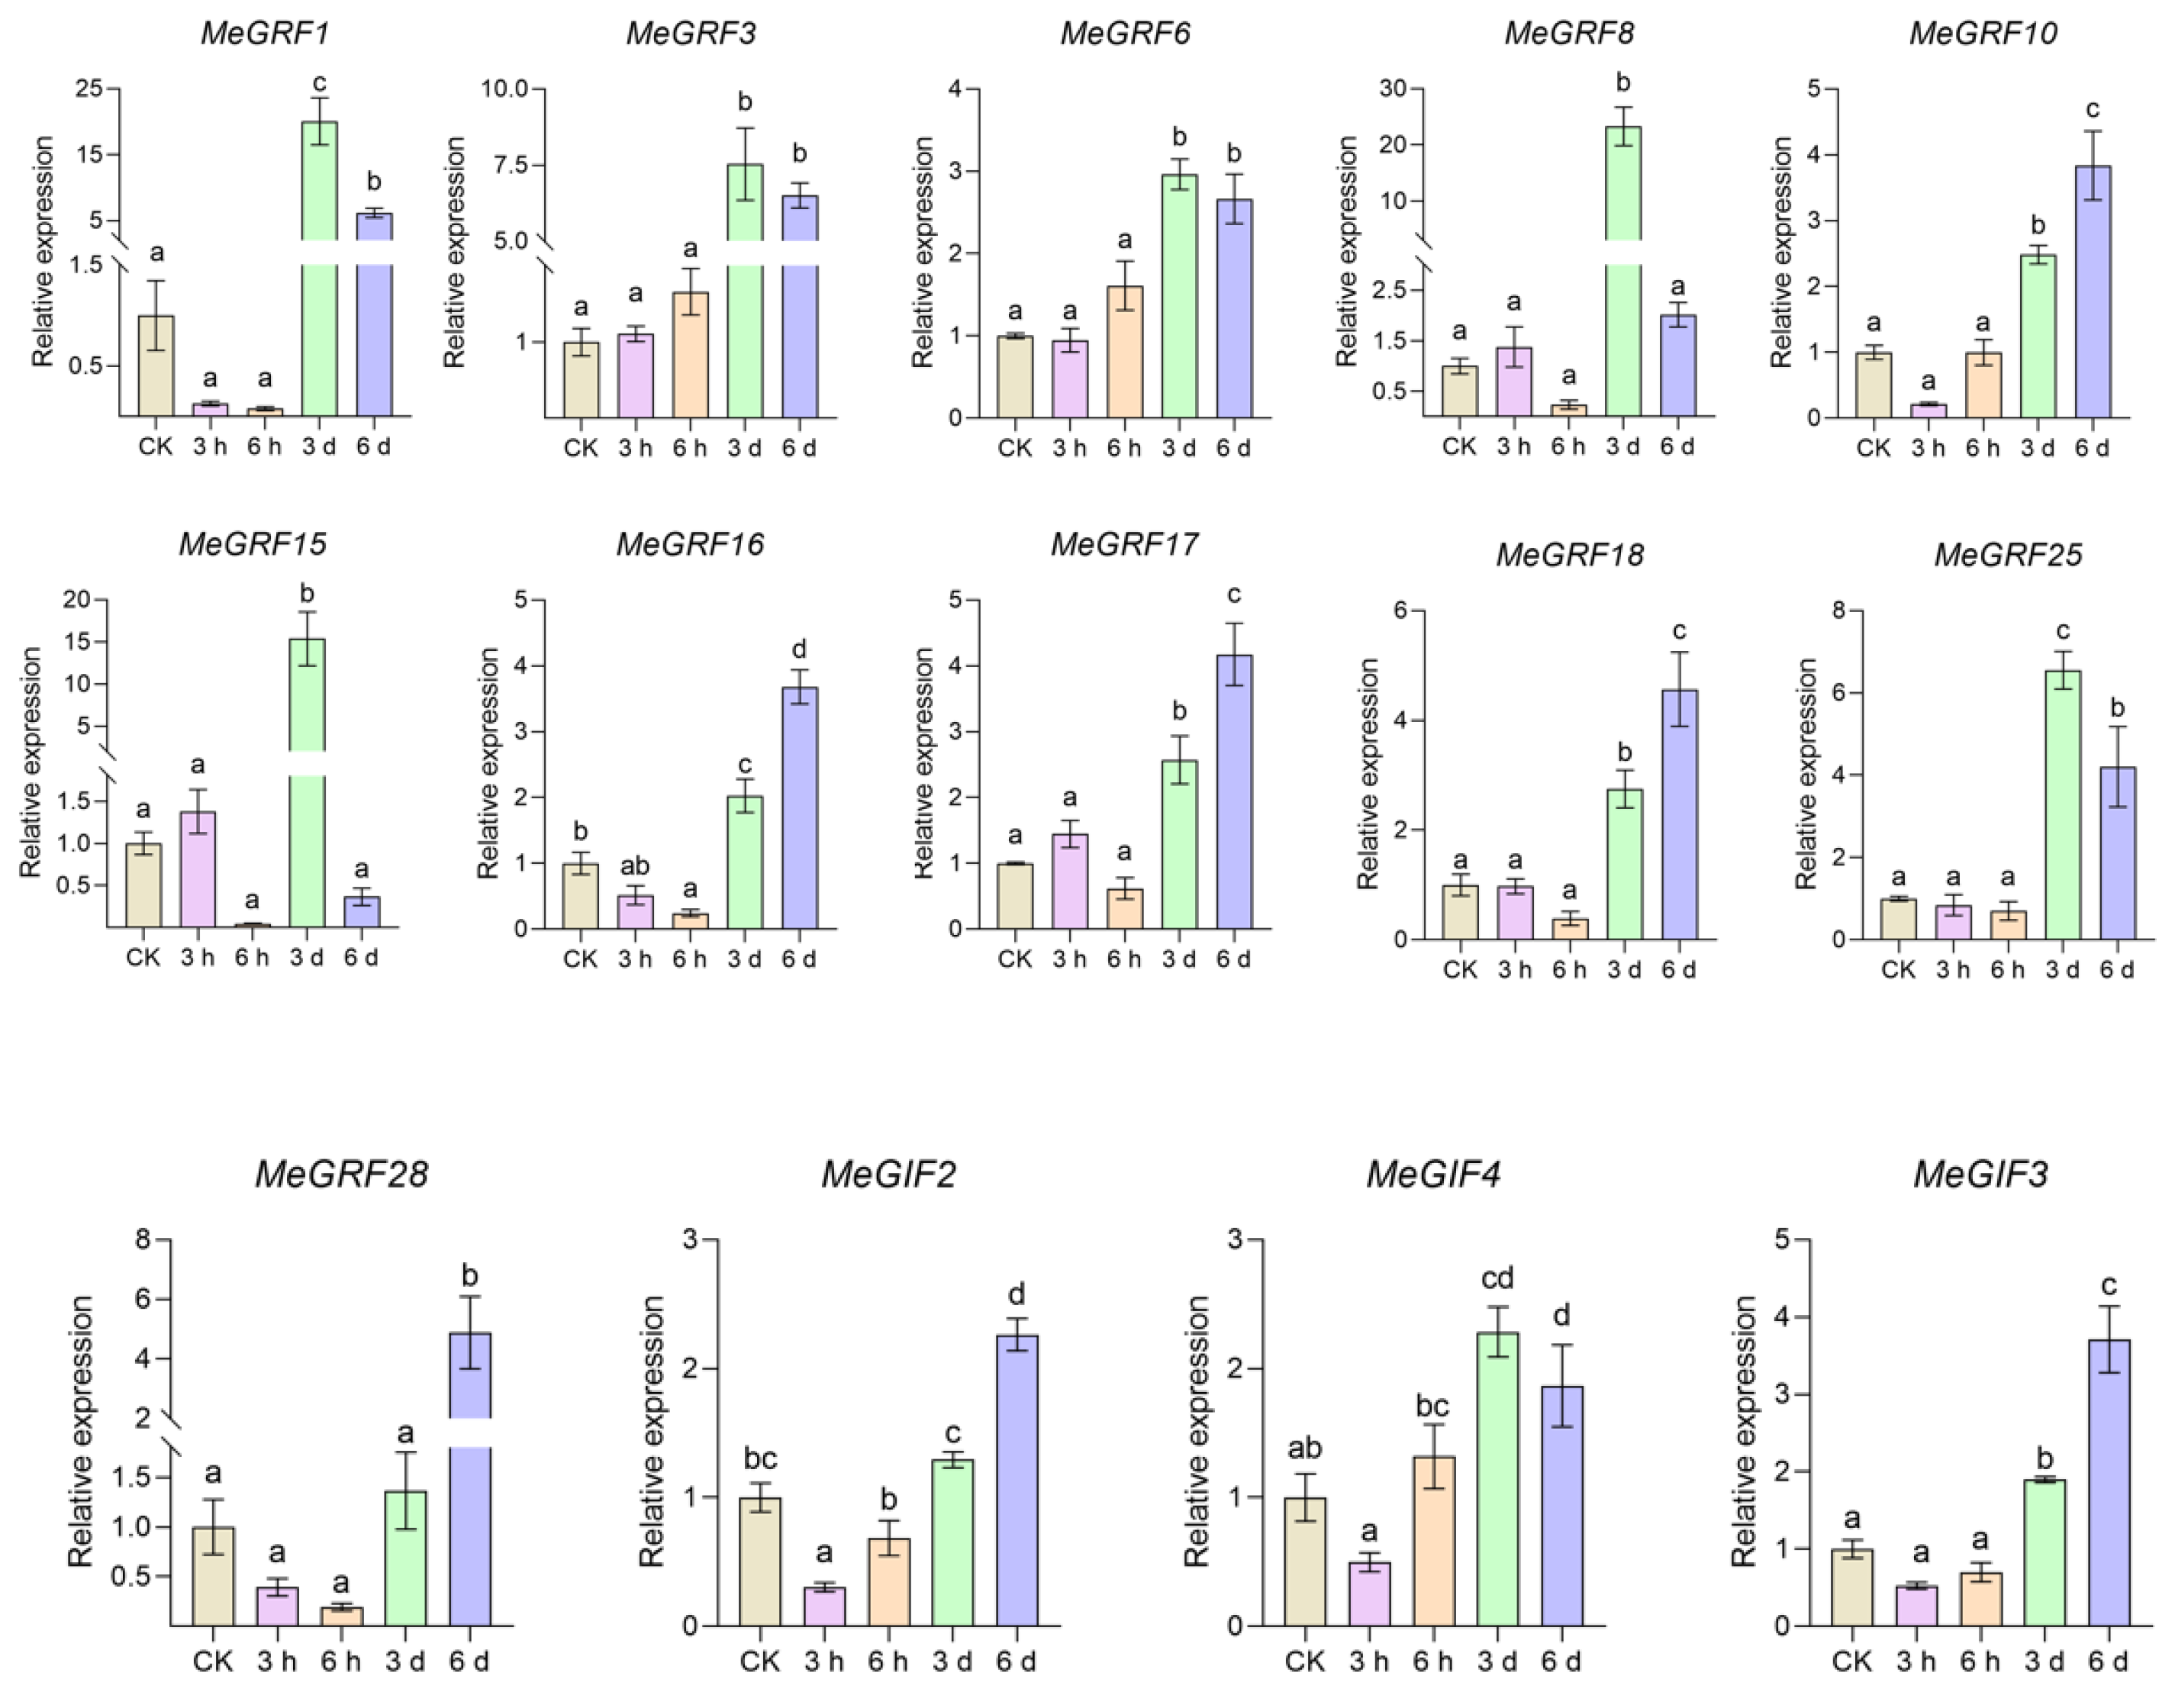
Figure 10.
Coexpression of GIF and GRF genes under pathogen stress. Red indicates a high correlation, and blue indicates a low correlation. The FPKM values of MeGRF and MeGIF gene families under XpmCNH11 infection were calculated using the R software package “Hmisc.” The Pearson correlation between the GRF and GIF families was calculated.
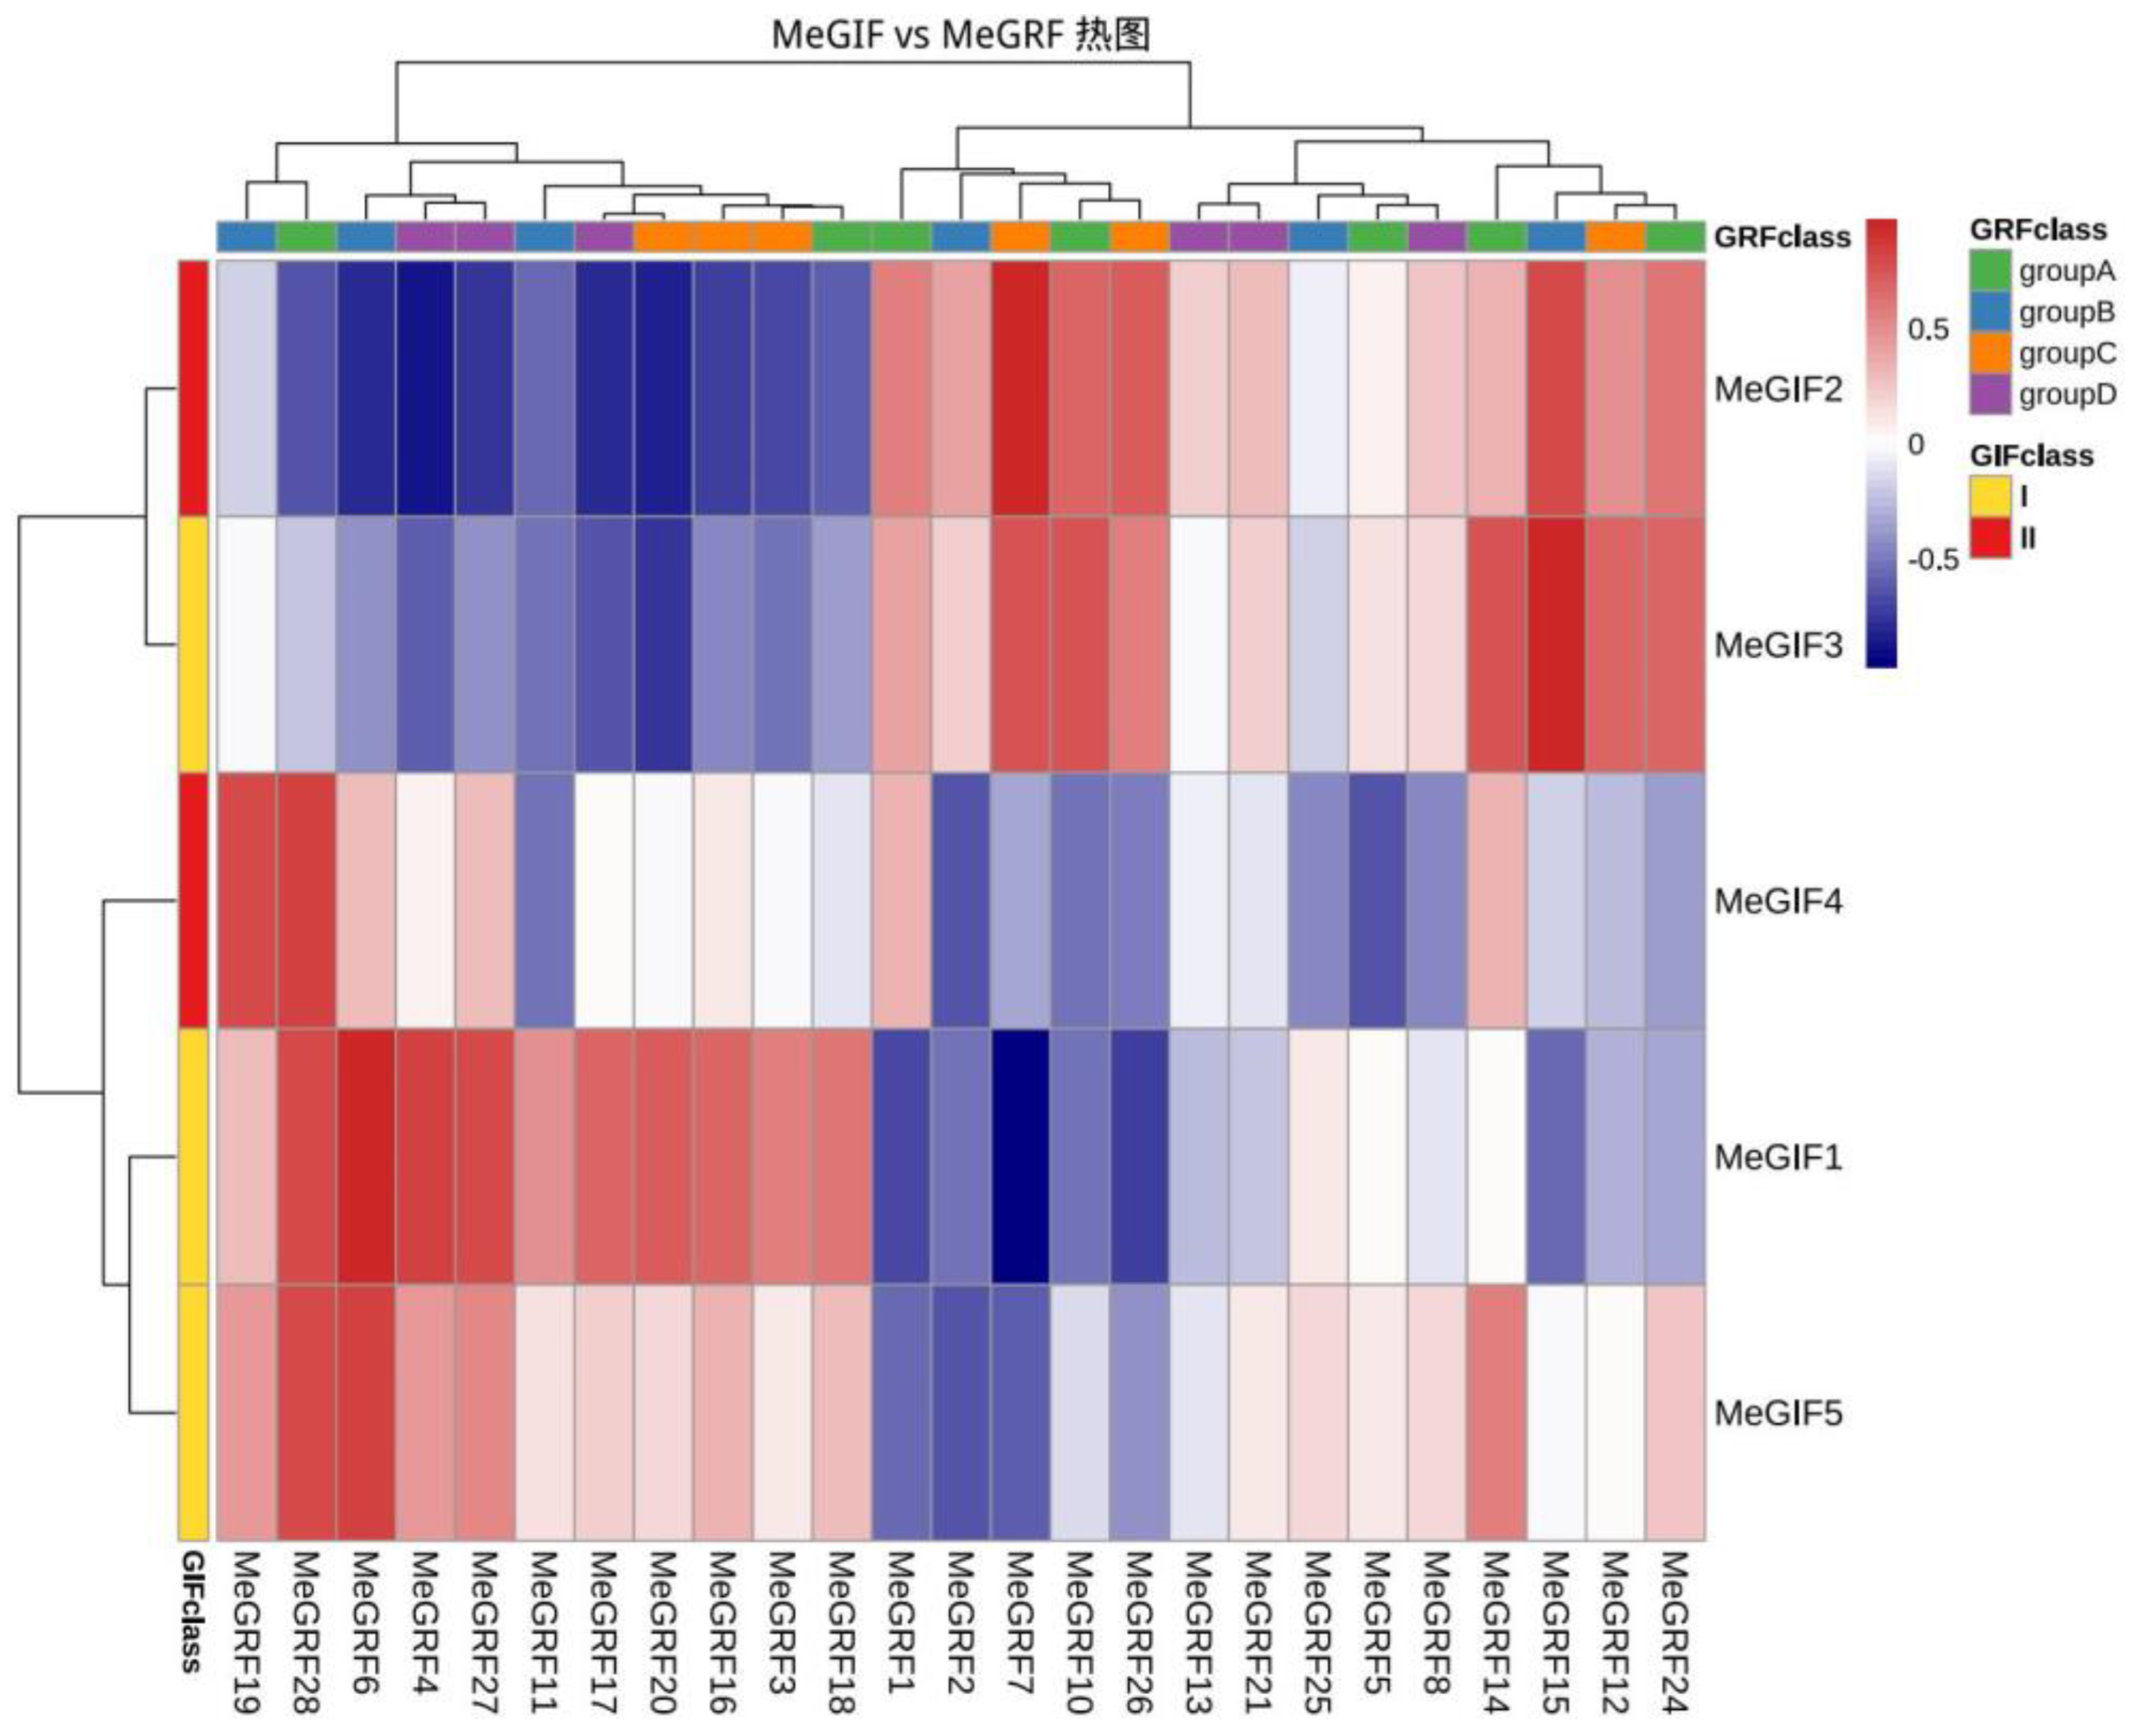
Disclaimer/Publisher’s Note: The statements, opinions and data contained in all publications are solely those of the individual author(s) and contributor(s) and not of MDPI and/or the editor(s). MDPI and/or the editor(s) disclaim responsibility for any injury to people or property resulting from any ideas, methods, instructions or products referred to in the content. |
© 2025 by the authors. Licensee MDPI, Basel, Switzerland. This article is an open access article distributed under the terms and conditions of the Creative Commons Attribution (CC BY) license (http://creativecommons.org/licenses/by/4.0/).
Copyright: This open access article is published under a Creative Commons CC BY 4.0 license, which permit the free download, distribution, and reuse, provided that the author and preprint are cited in any reuse.


