
Submitted:
09 July 2025
Posted:
11 July 2025
You are already at the latest version
Abstract
This study presents a data-driven approach to predict the three-dimensional distribution of sand-rich channels in hydrocarbon reservoirs using well log data, aiming to optimize site selection for Underground Thermal Energy Storage (UTES) and manage hot and cold well pairs effectively. Leveraging detailed petrophysical datasets from 128 hydrocarbon exploration wells within the Szolnok Formation in southern Hungary, the developed machine-learning workflow—combining XGBoost regression and spatial residual correction—accurately delineated permeable channel systems suitable for thermal energy injection and extraction. The model achieved robust predictive performance (R² = 0.92; RMSE = 0.24), and correlation analyses confirmed significant relationships between predicted channels and sand content and shale content. Clearly identified high-permeability channel zones facilitated strategic well placement, significantly reducing the risk of premature thermal breakthrough and enhancing the reliability and efficiency of UTES operations.
Keywords:
sand-rich channels
; UTES
; thermal breakthrough
; Szolnok formation
; machine learning
1. Introduction
The accelerating global shift toward renewable energy has significantly heightened the demand for effective and scalable energy storage solutions, which are essential for addressing renewable intermittency, ensuring grid flexibility, and providing reliable seasonal energy storage [1,2,3] . While short-term battery storage technologies have matured significantly, their inherent limitations in scalability and cost-effectiveness for long-duration or seasonal storage underscore the need for alternative, large-scale solutions. Geological energy storage, particularly Underground Thermal Energy Storage (UTES), is increasingly recognized as a promising alternative due to its capacity for extensive seasonal storage and its minimal environmental footprint [4,5,6] .
UTES systems, notably Aquifer Thermal Energy Storage (ATES), are now well-established worldwide, with more than 2,800 operational installations—most prominently in the Netherlands, where they collectively provide approximately 2.5 TWh of thermal storage annually [5,7,8]. Recent technological advances, including High-Temperature ATES (HT-ATES) systems that operate at temperatures above 90 °C, further extend the potential of UTES by enabling efficient integration with renewable energy sources, industrial heat supply, and district heating networks. These developments substantially expand both the practical impact and the relevance of UTES technologies [9,10].
A critical determinant of UTES system effectiveness is the strategic placement of injection and production wells, which directly influences the efficiency, reliability, and lifespan of thermal storage operations. One of the most significant operational challenges is thermal breakthrough, where injected thermal fluids prematurely reach production wells, dramatically reducing heat-storage efficiency and overall economic viability [4,11]. Preventing or mitigating thermal breakthrough fundamentally depends on precise geological characterization—specifically, understanding the spatial distribution and geometry of permeability, porosity, and, most importantly, channelized sand bodies and low-permeability barriers that dictate subsurface fluid-flow pathways [5,12].
To robustly characterize subsurface formations, the Flow Zone Indicator (FZI) has emerged as a valuable petrophysical metric, integrating permeability and porosity into a single spatially explicit indicator that describes fluid-flow capacity within geological formations [13,14,15,16] (Amaefule et al., 1993; Jin et al., 2022). However, in complex fluvial and turbidite systems such as the Szolnok Sandstone, it is the explicit geometry, connectivity, and separation of sand-rich channels and intervening low-permeability units that most directly control fluid-flow behavior, thermal breakthrough, and UTES performance [17,18]. While FZI has been historically employed within hydrocarbon reservoir analysis for enhanced oil recovery, and has proven highly effective at delineating subsurface heterogeneity into distinct permeability zones, a more targeted modeling of channel systems offers even clearer identification of both optimal regions for fluid injection and production, as well as the natural low-permeability barriers that separate them [19,20,21].
Despite its established utility in reservoir characterization, the application of explicit channel system modeling, alongside or beyond FZI analysis, for UTES system optimization—identifying injection-production well sites and assessing barrier quality for thermal breakthrough prevention—remains comparatively underdeveloped [10]. Focusing on the three-dimensional architecture of channelized sands and their separation by low-FZI barriers represents a critical advance in targeting, designing, and optimizing UTES operations. Addressing this knowledge gap presents a valuable opportunity for advancing UTES technology by precisely targeting and optimizing subsurface geological conditions [10,15,22,23].
This research builds upon FZI analysis by developing a structured, data-driven methodology that explicitly models and predicts the three-dimensional architecture of sand-rich channel systems in the Szolnok Sandstone, with direct relevance for optimizing UTES site selection and operational planning [24]. Leveraging comprehensive petrophysical datasets—including detailed records of permeability, porosity, lithological characteristics, and historical well logs—the study employs advanced geostatistical techniques such as Ordinary Kriging and Sequential Gaussian Simulation (SGS)[25]. These methods enable the generation of high-resolution, three-dimensional maps that reflect generalized heterogeneity; further, it clearly delineates the geometry and connectivity of channelized sands and their separation by low-permeability zones [23]. While FZI-based mapping remains a valuable tool, this approach advances reservoir characterization by resolving the spatial distribution of channel bodies that most directly govern UTES performance [19,21,24].
By clearly identifying the spatial extent and continuity of sand channels suitable for injection and production wells, and mapping the intervening low-FZI barriers, this approach directly addresses the critical challenge of thermal breakthrough [24]. The explicit assessment of channel geometry, barrier thickness, continuity, and spatial arrangement allows for targeted well placement that leverages natural geological compartmentalization, enhancing thermal storage efficiency and long-term system sustainability [26]. Quantitative criteria such as barrier effectiveness and spatial distribution are thus evaluated to support robust thermal storage operations [4,15,27].
Additionally, this study applies a data-driven machine learning workflow, integrating XGBoost regression with advanced spatial feature engineering and thin-plate spline correction, to explicitly predict the three-dimensional presence, continuity, and separation of sand-channel systems within the reservoir [28]. By interpolating well log-derived properties using Inverse Distance Weighting (IDW) and correcting residuals with Radial Basis Function (RBF) interpolation, the approach captures both local heterogeneity and large-scale channel connectivity [19]. This method enables the efficient evaluation of numerous well-placement scenarios, providing rigorous uncertainty quantification and detailed sensitivity analysis—key for robust strategic planning and rapid deployment of UTES systems in channelized settings [21]. Such a hybrid modeling strategy substantially reduces computational complexity while maximizing spatial accuracy and interpretability, consistent with best practices in the field [20,21,28].
Hungary represents an ideal context for this investigation due to its dense network of depleted hydrocarbon wells, moderate-to-high geothermal gradients (around 70°C initial reservoir temperatures), and close proximity to urban centers with significant district heating demands. The presence of extensive Szolnok Sandstone Formation with its channel systems and comprehensive historical well data further enhances Hungary’s suitability for channel-focused UTES modeling (Figure 1). Moreover, Hungary’s commitment to decarbonization and energy security, combined with decades of subsurface data from hydrocarbon exploration, makes it an exceptional testbed for detailed geostatistical analysis and machine-learning-driven reservoir optimization [29,30,31].
This research systematically characterizes the 3D distribution and connectivity of sand channels—supported by FZI—to identify optimal injection and production well sites for UTES. For the first time, we apply a hybrid machine-learning approach integrating XGBoost regression with spatial residual correction to explicitly predict channel architecture and barrier distribution specifically within the Szolnok Formation. Emphasizing the mapping of high-permeability channels and low-FZI barriers, the approach mitigates thermal breakthrough risks, enhancing thermal isolation. Integrating numerical simulations with supervised machine-learning techniques optimizes system design under geological uncertainty, providing a reproducible framework for scalable, efficient UTES systems aligned with global decarbonization and energy resilience goals [2,3].
2. Glossary of Terms
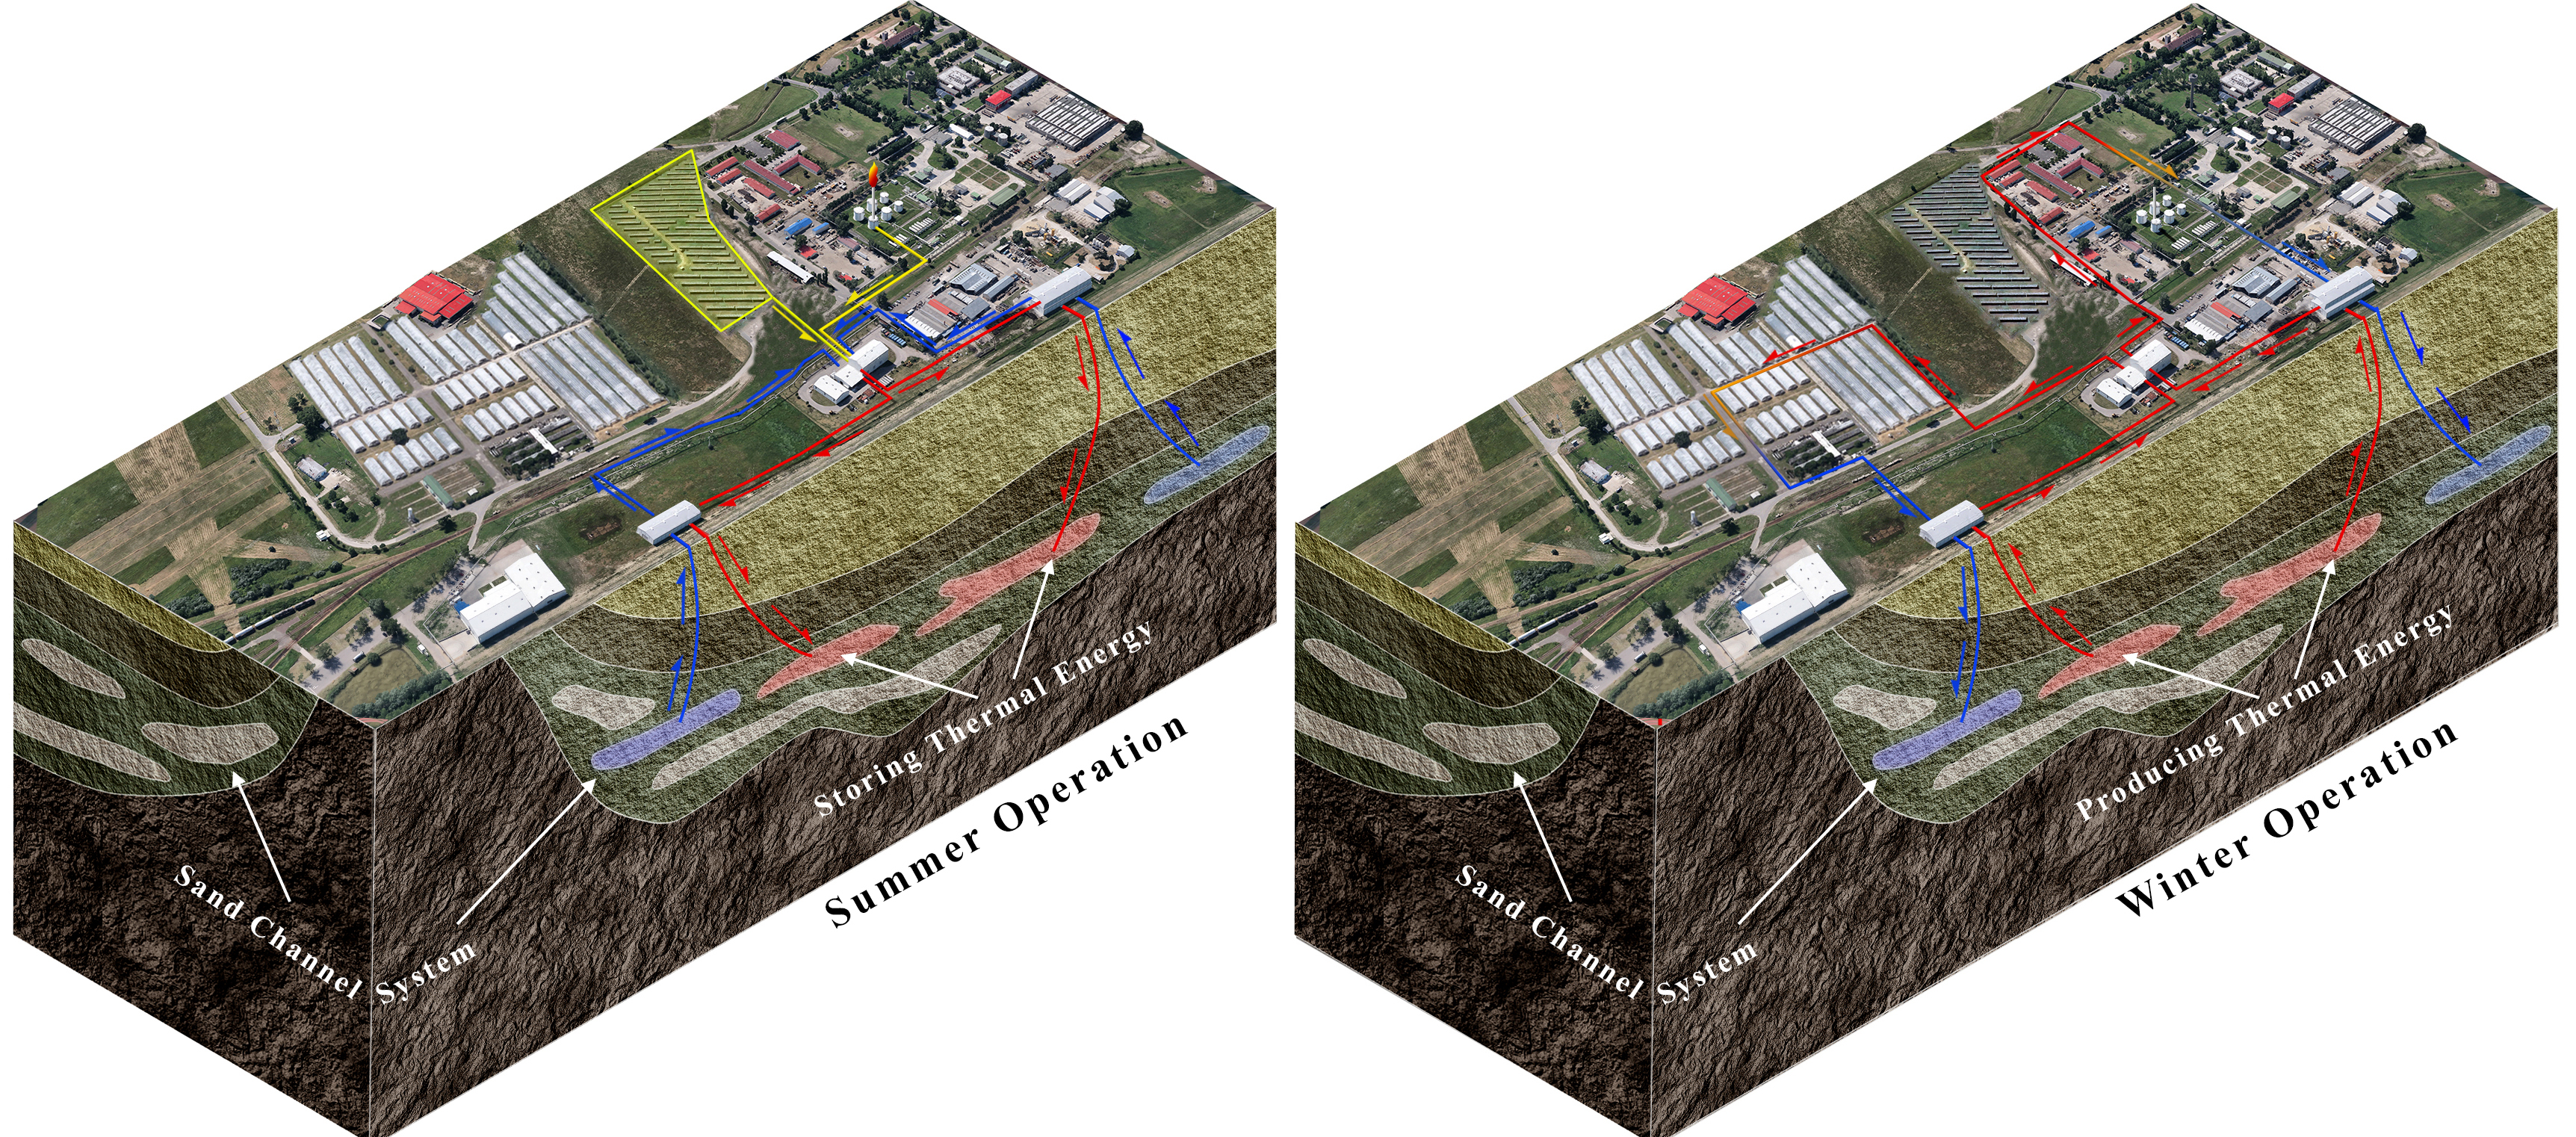
ATES (Aquifer Thermal Energy Storage): A technology for storing and retrieving thermal energy in aquifers, enabling seasonal energy management by injecting heat in summer and recovering it during winter.
HT-ATES (High-Temperature Aquifer Thermal Energy Storage): An advanced form of ATES designed for storage and recovery of thermal energy at fluid temperatures ≥90 °C, suitable for industrial and district heating applications.
Channelization: The development of laterally and vertically connected, sand-rich channel bodies within sedimentary reservoirs, which strongly control subsurface fluid-flow pathways and are critical for optimizing UTES performance and preventing thermal breakthrough.
Flow Zone Indicator (FZI): A petrophysical metric combining permeability and porosity into a single value that characterizes the fluid-flow capacity of a rock interval, widely used for identifying reservoir heterogeneity and mapping high-permeability channels and low-permeability barriers.
XGBoost: An advanced, scalable machine learning algorithm based on gradient-boosted decision trees, used for regression and classification tasks in this study to predict the three-dimensional distribution of sand channel systems from well log data.
IDW (Inverse Distance Weighting): A spatial interpolation technique that estimates unknown values at unsampled points based on the values of nearby observations, with closer points weighted more heavily; used here for spatial feature engineering of well log data.
RBF (Radial Basis Function) Interpolation: A mathematical method for smoothly interpolating values across multidimensional space; in this study, thin-plate spline RBF correction was used to improve the spatial accuracy of model residuals.
Random Forest: An ensemble machine learning method based on decision trees, used for regression and classification; valued for its robustness and ability to model complex relationships.
Gaussian Process Emulator: A statistical machine learning model used to create fast, probabilistic surrogate models of complex systems, enabling uncertainty quantification and efficient scenario evaluation.
Residual Heat Accumulation: The progressive build-up of stored heat in an aquifer over multiple ATES cycles, typically leading to higher thermal recovery efficiencies over time.
Thermal Breakthrough: The phenomenon where injected hot or cold fluid reaches the production well too quickly, reducing system efficiency and potentially shortening operational lifetime; a key risk in UTES that can be mitigated by natural or engineered barriers.
Hydrogeological Model: A numerical or conceptual model simulating groundwater flow and heat transport based on geological and hydraulic properties, used to inform site selection and UTES system design.
Hot Well: A well used to inject and store heated water during UTES charging phases and extract thermal energy during production phases.
Cold Well: A complementary well used for injecting cooler water during UTES extraction or extracting cold water during charging, essential for managing thermal gradients and system balance.
Permutation Importance: A machine learning method for quantifying the importance of individual input features by measuring the decrease in model performance when feature values are randomly shuffled.
Stress Period: A defined time interval in a hydrogeological or thermal simulation during which external stresses (e.g., injection, extraction) are assumed constant or follow a specified pattern.
MODFLOW: A modular three-dimensional finite-difference groundwater flow model developed by the U.S. Geological Survey, widely used for simulating groundwater and heat transport in aquifers.
MT3DMS: Modular Three-Dimensional Multi-Species Transport Model, used with MODFLOW to simulate the movement of heat, solutes, or contaminants in groundwater systems.
Overpressure: Subsurface pressure exceeding hydrostatic pressure, often due to geological compaction, tectonic forces, or fluid generation, affecting reservoir management.
Pannonian s.l. (sensu lato): A stratigraphic term referring broadly to the Upper Miocene sedimentary sequences in the Pannonian Basin, including formations such as Újfalu and Zagyva.
3. Background and Regional
3.1. Geological and Hydrogeological Setting
The Pannonian Basin, located in East-Central Europe, features complex geological structures, including subsided sedimentary basins separated by horst-like uplifted blocks [24,32]. The basement primarily comprises Paleozoic metamorphic rocks, occasionally overlain by Mesozoic carbonate formations, which act as significant aquifers in various locations, providing favorable conditions for geothermal exploration and thermal storage projects [30,31,33]. Within this intricate geological setting, the Szolnok Formation in southern Hungary represents an essential Lower Pannonian stratigraphic unit, widely recognized for its considerable reservoir potential and suitability for geothermal applications [33,34].
The Szolnok Formation predominantly consists of fine-grained sand turbidites interbedded with layers of siltstone and claystone, deposited within turbidite fan environments that developed partly in prodelta regions and partly in deeper basin settings of the extensive Lake Pannon basin during the Late Miocene (Lower Pannonian) [24,35,36]. This formation exhibits substantial variations in thickness, typically ranging from a few meters up to about 50 meters, reflecting complex depositional processes involving channelized turbidity flows and lobe systems sourced from adjacent paleo-deltas [37]. These depositional patterns significantly influence reservoir heterogeneity, directly impacting the effectiveness and optimization of geothermal energy storage operations, particularly for Aquifer Thermal Energy Storage (ATES) and Underground Thermal Energy Storage (UTES) systems [10,38,39,40].
Typically, the Szolnok Formation directly overlies thick marls and claystones of the Endrőd Formation, serving as regional seals, and is subsequently capped by prodeltaic silty clay sediments of the Algyő Formation [44]. This stratigraphic stacking results in substantial overpressure conditions, significantly influencing fluid dynamics and reservoir management strategies [34,45,46,47].
3.2. Hydrodynamic Systems and Pressure Regimes
The hydrodynamic environment of the Szolnok Formation is dominated by distinct flow regimes: shallow intervals influenced by gravity-driven groundwater systems and deeper intervals characterized by significant overpressure [24,30]. This overpressure is primarily generated by tectonic compaction, sediment loading, and gas formation from organic maturation processes, creating challenging conditions for subsurface fluid management. Pressure-depth relationships in the Szolnok Formation reveal significant super-hydrostatic pressures, often exceeding hydrostatic gradients by several tens of megapascals [45,47].
3.3. Reservoir Properties and Geothermal Potential
Reservoir characterization of the Szolnok Formation indicates favorable geological properties suitable for thermal energy storage [32]. Effective porosity within the formation typically ranges between approximately 15% to 17%, with permeabilities generally varying from 10 to 270 millidarcies (mD) [34,48,49]. Hydraulic conductivity, derived from permeability estimates, extends from approximately 11 to 2500 mmD, supporting considerable fluid flow capabilities and reservoir connectivity, essential for successful geothermal operations [32,50,51].
Detailed reservoir quality analysis highlights a moderate net-to-gross sand content typically between 50% and 70%, representing channelized sand bodies interspersed with finer-grained sediments such as siltstones and claystones, which act as natural intra-reservoir barriers or baffles [35,52]. The formation’s Flow Zone Indicator (FZI) typically exceeds values of 5.0, further emphasizing the excellent fluid flow potential for geothermal injection and production operations [15,21].
Geothermal gradients in the region of the Szolnok Formation are notably high, averaging approximately 50°C/km, reflecting relatively thin crustal conditions beneath the Pannonian Basin [47,53]. Consequently, reservoir temperatures are commonly around 70°C at economically viable depths of approximately 1,500–1,800 meters, with deeper intervals at around 2,000–2,500 meters potentially reaching temperatures as high as 90–120°C [22,30,34]. Such conditions strongly favor geothermal energy storage and district heating applications [5,22].
3.4. Hydrocarbon History and Well Infrastructure
The Szolnok Formation has experienced extensive hydrocarbon exploration and production since its discovery in the mid-20th century [32,54,55]. Numerous wells penetrate this formation, providing extensive geological, reservoir, and operational data critical for subsequent geothermal assessments and thermal energy storage implementation [5,56]. Typically, wells penetrating the Szolnok Formation in the studied region have employed telescopic casing designs ranging from approximately 340 mm diameter at the surface to 140–178 mm at reservoir depths [34,57].
The existing extensive well infrastructure, predominantly from past hydrocarbon production, offers significant economic advantages for repurposing wells into geothermal and seasonal thermal storage wells [22,38,58]. Although these wells vary in mechanical integrity and may require selective workover or recompletion, their presence substantially reduces initial investment requirements, making the implementation of geothermal projects more financially viable [32,59].
3.5. Relevance to Seasonal Heat Storage
The geological, hydrodynamic, and geothermal conditions of the Szolnok Formation in southern Hungary make it particularly suitable for Aquifer Thermal Energy Storage (ATES), including advanced High-Temperature ATES (HT-ATES) applications [24]. Its combination of favorable porosity (15–17%), significant permeability (up to 270 mD), and excellent hydraulic conductivity (up to 2500 mmD) supports efficient fluid movement and heat exchange essential for effective thermal storage and recovery [24,31].
The geological, hydrodynamic, and geothermal conditions of the Szolnok Formation in southern Hungary make it particularly suitable for Aquifer Thermal Energy Storage (ATES), including advanced High-Temperature ATES (HT-ATES) applications [38,59]. Its combination of favorable porosity (15–17%), significant permeability (up to 270 mD), and excellent hydraulic conductivity (up to 2500 mmD) supports efficient fluid movement and heat exchange essential for effective thermal storage and recovery [34,48,51].
The formation’s inherent stratigraphic heterogeneity, with sand-rich channel systems surrounded by finer-grained sediments, provides naturally compartmentalized conditions [24,35,52]. These heterogeneous reservoir characteristics create ideal scenarios for strategically positioning injection and extraction wells, leveraging high-permeability channelized sands for thermal storage, while low-permeability regions serve as natural barriers preventing premature thermal breakthrough [11,12]. Optimal well-spacing and operational strategies, therefore, rely on detailed geological characterization and modeling of reservoir heterogeneity.
Furthermore, the proximity of depleted hydrocarbon wells to district heating infrastructures in southern Hungary presents advantageous conditions for efficiently integrating thermal storage solutions into existing heating networks [22,60]. However, careful management of the formation’s substantial overpressure conditions and stratigraphic complexities remains critical to ensure sustainable and efficient thermal energy storage operations [54,57].
4. Materials and Methods
4.1. Methodological Framework
The methodological framework of this study began with comprehensive data curation and preparation, involving extensive modeling, cleaning, and refinement of existing hydrocarbon field datasets. Using RockWorks software, an initial Flow Zone Index (FZI) model was constructed based on reliable porosity and permeability estimates derived from detailed reservoir characterizations [61,62]. Subsequently, a machine-learning workflow was developed, leveraging well-log data to predict spatial distributions of the FZI (Figure 2). XGBoost regression was chosen for its robustness and efficiency in capturing complex geological patterns, while IDW and RBF methods effectively addressed spatial continuity and residual smoothing. The predicted FZI outputs from the initial machine-learning model served as input training data for a HistGradientBoostingRegressor [14,16,63], which was evaluated on a withheld dataset representing approximately 30% of the study area. The final predictive model demonstrated strong performance, achieving an R² of approximately 0.92, a mean absolute error (MAE) of 0.17, and a root mean squared error (RMSE) of 0.24 [14].
4.2. Data Collection and Data Preparation
The data collection phase of this study involved systematically compiling detailed subsurface geological and petrophysical data from the Szolnok Formation in southern Hungary, utilizing comprehensive historical records from 128 hydrocarbon exploration and production wells. The primary datasets included well-log measurements, core analyses, and stratigraphic interpretations, providing key information such as formation tops and bases, thickness variations, sand content distributions, effective porosity measurements, permeability data, and hydraulic conductivity values (Figure 3) [64].
4.3. Data Modelling
The data collection process for this study involved acquiring detailed subsurface data from the Szolnok Formation in southern Hungary, leveraging information derived from 128 hydrocarbon exploration and production wells. The dataset primarily comprised stratigraphic and reservoir property data, including top and base surfaces, thickness, sand content, effective porosity, effective pore volume, permeability, and reservoir quality indices (Figure 4) [32]. Stratigraphic surfaces (top and base) were estimated using kriging with a trend model [65], while sand content, porosity, and permeability were modeled using both Inverse Distance Weighted (IDW) interpolation—specifically optimized to emphasize lateral reservoir continuity—and Ordinary Kriging techniques to enhance spatial prediction reliability [66]. The effective porosity within the formation ranged between 15% and 17%, while permeability values ranged from 10 to 270 mD, corresponding to hydraulic conductivity values of approximately 11 to 2500 mmD [67]. Reservoir Quality Index (RQI) and Flow Zone Index (FZI) models were constructed by combining these spatially interpolated porosity and permeability distributions, yielding average FZI values exceeding 5.0, indicative of excellent fluid-flow capabilities within the channelized sand bodies [68,69].
4.4. Flow Zone Index Modelling
The Flow Zone Index (FZI) modelling for the Szolnok Formation involved integrating spatially interpolated porosity (ϕ) and permeability (k) datasets to quantitatively characterize and visualize reservoir fluid-flow capacities [16]. FZI was calculated using the standard reservoir engineering equation [13,70,71,72]:
where RQI is the Reservoir Quality Index, k is permeability (mD), and ϕ is effective porosity (expressed as a percentage). Spatial interpolation was conducted using both Inverse Distance Weighted (IDW) methods, optimized specifically to emphasize lateral continuity, and Ordinary Kriging supported by directional variogram analyses (Figure 5) [73,74]. These geostatistical approaches were selected to capture regional trends and localized heterogeneities effectively, ensuring accurate and reliable delineation of subsurface flow zones.
The resulting FZI models, generated independently using both IDW and Kriging methods, consistently indicated highly favorable fluid-flow conditions, particularly within channelized sand bodies. Specifically, the IDW-derived FZI values exceeded 4.5, while Kriging-derived estimates indicated slightly higher values, generally exceeding 5.0. The consistently high FZI values reflect excellent reservoir connectivity and permeability within these turbiditic channel systems, highlighting their suitability for fluid injection and extraction operations [75]. By clearly delineating areas of optimal flow capacity, the FZI modelling results provided critical guidance for strategic site selection and well placement decisions aimed at maximizing thermal storage efficiency and preventing premature thermal breakthrough [76].
4.5. Machine Learning Setting
The training dataset was meticulously prepared for modeling the Flow Zone Index (FZI) in three-dimensional space, integrating rich petrophysical features and rigorous spatial preprocessing. Initially, interval-level data extracted from multiple well logs were processed to obtain geospatially accurate samples characterized by depth (z) and crucial petrophysical attributes, including permeability (PERM), porosity (PHI), shale volume (VSHA), sandstone volume (VSND), effective thickness (HEFF), and total thickness (thickness) (Figure 6).
An essential preprocessing step was the targeted removal of outliers from both well intervals and grid node observations, employing robust statistical techniques: Z-score (±3.0) and Interquartile Range (IQR; 1.5 × IQR) filtering. This careful cleaning significantly improved data quality, stability, and model accuracy [77].
Geometrically, the spatial domain was defined and optionally refined through the application of a buffer around core wells, effectively isolating a central region for focused analysis. Within this spatially constrained area, a systematic 80/20 train-test split was performed on the available 3D grid nodes, ensuring a reliable validation framework for predictive performance [78,79].
Subsequent feature engineering leveraged Inverse Distance Weighting (IDW) interpolation to generate robust, spatially contextualized attributes for each grid node. Specifically, petrophysical features from the nearest well intervals were interpolated, forming IDW-derived features (PERM_idw, PHI_idw, VSHA_idw, VSND_idw, HEFF_idw, and thickness_idw). Further feature augmentation included logarithmic transformations (e.g., log_PERM_idw) to normalize skewed data distributions and derived ratio features (e.g., permeability-to-porosity ratio PERM_div_PHI_idw) to capture meaningful petrophysical relationships [80].
A powerful hybrid modeling approach was employed, combining XGBoost regression (trained via 5-fold cross-validation) with a spatially explicit residual correction using Thin-Plate Spline interpolation [81]. This integrated methodology significantly enhanced prediction accuracy and spatial consistency.
Comprehensive quality control and diagnostics were systematically generated, including scatter plots, residual analyses, depth slices, feature importance rankings, and geospatial prediction maps, facilitating robust model validation and interpretability [78]. Collectively, these engineered and spatially informed features provided a robust foundation for accurate, reliable, and interpretable three-dimensional FZI predictions [82].
4.6. Machine Learning Process
The machine learning process implemented in this study integrated rigorous data preprocessing, spatial feature engineering, and robust predictive modeling to accurately forecast three-dimensional sand-channel systems indicated by the Flow Zone Index (FZI) [68]. Initially, interval-level petrophysical well data, including permeability and porosity (input features), were systematically loaded and filtered for outliers using robust Z-score statistical methods to ensure the reliability of model inputs [83]. Permeability values in the training set ranged from approximately 0.01 mD to 980 mD, while porosity values spanned from approximately 5% to 28%. Subsequently, the spatial modeling domain was defined using a polygonal boundary shapefile, optionally refined by buffering to retain core, most representative reservoir areas [24]. Advanced spatial interpolation techniques, specifically Inverse Distance Weighting (IDW), generated spatially informed predictive features at each 3-D grid node, further augmented by composite attributes and log-transformed petrophysical features designed to capture geological relationships [84]. The complete workflow, including each critical step from data loading to final predictions and evaluation, is illustrated in Figure 7.
In the second stage, an optimized XGBoost regression model was rigorously trained using an 80/20 train-test split of the grid nodes, and validated via a comprehensive 5-fold cross-validation to assess predictive accuracy [78]. The output predictions of the model were subsequently improved by applying spatially explicit residual corrections using thin-plate spline interpolation (RBF), significantly enhancing spatial consistency [85]. Comprehensive evaluation metrics (R², MAE, RMSE) were calculated from the independent test set, confirming the model’s high accuracy (test R² = 0.92) [86]. Ultimately, this integrated modeling workflow yielded robust, accurate, and interpretable three-dimensional predictions of sand-channel distribution, directly informing reservoir characterization and operational decision-making for optimized UTES well management [24].
4.7. Sensitivity Analysis
A sensitivity analysis was conducted by systematically evaluating combinations of key modeling parameters, specifically the number of neighbors used in inverse distance weighting (idw_k_neigh), radial basis function interpolation (rbf_neigh), the XGBoost learning rate, and the Z-score threshold (z_thresh) applied for outlier filtering [87]. A total of 50 parameter combinations were randomly sampled from a structured parameter grid to assess their impact on predictive performance, measured by cross-validation R², test R², mean absolute error (MAE), and root mean squared error (RMSE) [88]. The analysis revealed that the model was particularly sensitive to the learning rate and the spatial complexity controlled by idw_k_neigh and rbf_neigh. The optimal predictive performance (test R² = 0.971, MAE = 0.093, RMSE = 0.178) was achieved using moderate spatial complexity (idw_k_neigh=7, rbf_neigh=40), a relatively higher learning rate (0.05), and a stringent Z-score threshold (3.0) [89]. The detailed results of this optimal parameter combination and corresponding performance metrics are presented in Table 1. These findings emphasize the critical balance required in parameter selection, highlighting that intermediate values for spatial parameters combined with higher learning rates effectively improve predictive robustness while mitigating potential overfitting or underfitting scenarios.
4.8. Model Calibration and Validation
The model calibration and validation involved analyzing the relationships between the normalized predicted FZI values (FZI_norm) and key petrophysical indicators, specifically normalized sand content (VSND_norm) and normalized shale content (VSHA_norm). Correlation analysis showed a statistically significant positive correlation between FZI_norm and VSND_norm, with Pearson’s correlation coefficient (r) of 0.333 (p=0.000461) and Spearman’s rank correlation coefficient (ρ) of 0.360 (p=0.00014). Conversely, a statistically significant negative correlation was observed between FZI_norm and VSHA_norm, yielding a Pearson’s r of -0.384 (p=4.45e-05) and Spearman’s ρ of -0.389 (p=3.41e-05). These findings confirm that the predicted normalized FZI is consistent with geological expectations, positively correlating with sandy, permeable zones and negatively with shaly, lower-quality intervals (Figure 8) [90].
5. Results
5.1. FZI Prediction Result
The three-dimensional FZI prediction model demonstrated high accuracy and stability across all depth slices in the reservoir. Aggregated performance metrics reveal that the mean absolute error (MAE) averaged just 0.056, while the mean root mean squared error (RMSE) was approximately 0.17, with the majority of predictions exhibiting errors well below these values. The distribution of MAE and RMSE across individual slices is tightly clustered, with 75% of grid predictions falling under 0.055 MAE and 0.19 RMSE, and only a handful of locations reaching a maximum MAE of 0.43 and RMSE of 0.87. These statistics underscore the overall precision and consistency of the model, ensuring that both local and global FZI variations are faithfully captured (Figure 9) [91].
The predicted Flow Zone Index (FZI) values across the three-dimensional grid display a high degree of concordance with the observed data, as demonstrated by the distribution of residuals between predictions and measurements. The majority of grid points exhibit very small residuals, with the largest concentration falling in the lowest error bins—thousands of points have absolute residuals less than 0.01, indicating that the model’s predictions are extremely close to actual FZI values for most of the reservoir [91]. The gradual increase in bin counts with increasing error, followed by a sharp decline at higher error levels, further confirms that large deviations are rare and the prediction error is dominated by minor discrepancies.
5.2. Residual Distribution and Model Robustness
A closer examination of the residual histogram reveals that over 90% of the prediction errors are less than 0.2 in absolute value, with the most populated bins spanning error ranges from 10−6 to approximately 0.2 [92]. Only a small fraction of points have larger residuals, with very few exceeding 1.0. This skewed, tightly centered error distribution reflects the robustness of the machine learning workflow, which includes extensive outlier filtering, careful spatial feature engineering, and a two-step modeling process (XGBoost regression followed by RBF residual correction)[93]. The results suggest the model successfully captures both the spatial heterogeneity and the petrophysical complexity of the reservoir, yielding predictions with minimal systematic bias (Figure 10).
Overall, the prediction outcome demonstrates both accuracy and stability across the study area, with negligible evidence of overfitting or model drift. The extremely low and sparsely distributed large residuals imply that prediction failures, when they do occur, are isolated and do not compromise the reliability of the overall FZI map [16,94]. Such a result is crucial for reservoir characterization workflows, as it provides a high-resolution, spatially continuous prediction surface with quantified uncertainty, supporting confident operational decisions and further geological analysis.
6. Discussion
6.1. Interpretation of Predicted 3D FZI Clusters
The predicted three-dimensional FZI clusters, classified into two distinct categories—Low-FZI (<4.5) and High-FZI (≥4.5)—clearly delineate reservoir units into sand-rich channel systems and surrounding low-quality lithologies (Figure 10) [16,95,96]. The Low-FZI cluster includes 363 grid nodes and 72 wells, characterized by an average FZI value of 3.85 (std=0.67), typically indicating fine-grained or cemented lithologies with reduced permeability and limited fluid transmissivity. In contrast, the High-FZI cluster comprises 366 grid nodes and 60 wells, exhibiting a higher average FZI of 4.99 (std=0.41), with maximum values up to 8.47. These high-FZI zones strongly suggest well-connected, sandy channel systems favorable for fluid flow [68].
Wells that directly penetrate the High-FZI channels are shown in red; however, some wells located within high-FZI zones remain marked in black, indicating that although they appear spatially associated, they did not penetrate the channelized system vertically (Figure 10C). This highlights the importance of precise 3D delineation for accurately identifying reservoir connectivity and optimizing well placement [20,97].
The clear separation between the Low and High-FZI clusters emphasizes the model’s ability to accurately distinguish between sand-rich channels and surrounding lower-quality lithologies, reflecting significant petrophysical contrasts [98]. The minimal overlap and tightly constrained standard deviations within each cluster confirm the robustness of the classification, indicating internally consistent reservoir properties. The balanced spatial distribution of nodes and wells across both clusters highlights the geological complexity and heterogeneity of the reservoir [99]. Crucially, the distinct delineation of High-FZI clusters provides essential insight for reservoir management, enabling targeted placement of wells within high-permeability channel systems, thus optimizing fluid flow, enhancing energy recovery, and reducing the risk of premature thermal breakthrough [99].
6.2. Subsurface Complexity of High-FZI Regions in 3D
The horizontal (depth-mean) analysis of the predicted FZI clusters identifies distinct high-FZI regions (FZI ≥ 4.5) distributed across the reservoir, but the three-dimensional visualization highlights considerably greater complexity and detail [100]. In the 3D view, the high-FZI zones form vertically stacked, laterally extensive, channel-like features, consistent with known channel deposition characteristics of the Szolnok Formation (Figure 11 Right) [101]. Specifically, out of 60,954 analyzed grid nodes, extensive regions exhibit FZI values exceeding 4.5, closely aligning with interpreted sandy channel systems [102]. Notably, 29 out of 136 wells directly penetrate these high-FZI channels (highlighted in red), while the remaining 107 wells fall outside these zones (displayed in black). This clear delineation provides valuable spatial context for reservoir characterization, reflecting geological controls on fluid-flow pathways [100].
This detailed three-dimensional understanding of the high-FZI zones offers substantial advantages for the design and optimization of UTES (Underground Thermal Energy Storage) cold and hot well duplets [103]. The naturally channelized high-FZI zones, indicative of enhanced permeability and reservoir quality, can be strategically utilized to maximize heat transfer and storage efficiency while simultaneously mitigating the risk of thermal breakthrough. By placing injection (cold) and production (hot) wells in separate, isolated channel segments, operators can effectively use the natural geologic architecture as barriers, minimizing unintended thermal communication [104]. Consequently, leveraging the inherent channel geometry of the Szolnok Formation supports optimal placement of duplet wells and also enhances overall UTES system performance and sustainability [103].
6.3. Enhancing Decision-Making for UTES Site Selection
Direct well data-driven prediction of channel systems within the Szolnok Formation significantly enhances decision-making for UTES (Underground Thermal Energy Storage) site selection and the management of cold and hot wells in depleted hydrocarbon reservoirs [24]. By utilizing high-resolution, spatially continuous models that clearly identify channelized sand bodies based on actual well log data, operators can precisely target highly permeable zones ideal for thermal energy injection and extraction. Accurate delineation of channel geometries enables strategic placement of cold and hot well duplets, effectively utilizing natural geological boundaries to minimize the risk of premature thermal breakthrough [23]. The model’s ability to reliably capture the spatial distribution and connectivity of channelized zones reduces subsurface uncertainty, ensuring that well planning aligns closely with geological reality. Ultimately, this channel-focused predictive approach promotes more efficient, sustainable, and cost-effective thermal energy storage operations within repurposed hydrocarbon reservoirs [24].
6.4. Generalizing Channelization Prediction for the Szolnok Formation
This model offers substantial potential for predicting channel systems in other basins containing the Szolnok Formation, particularly if comparable well log datasets are available [24]. Given the widespread occurrence and consistent depositional characteristics of the Szolnok Formation across the region, the established relationships between well log responses and channel presence are likely transferable to areas lacking detailed channelization data [105]. However, the methodology may require recalibration or adaptation in regions with significantly different depositional environments, sediment composition, or structural complexities. By applying the same preprocessing and feature-engineering workflows to well logs from the new basin, operators can rapidly generate high-resolution predictions of channel geometries and connectivity [19]. This approach enables efficient identification of sandy channel bodies ideal for targeted UTES, geothermal, or hydrocarbon development, even in locations where direct geological observations are limited [106]. Ultimately, the ability to generalize channel predictions significantly reduces uncertainty in reservoir characterization, guiding the optimal placement of wells and enhancing data-driven decisions across the broader Pannonian Basin [24].
6.5. Managing Model Uncertainty and Reproducibility
Although our model for predicting subsurface channel systems demonstrates high accuracy, some uncertainty inevitably remains due to potential differences in well log calibration, local geological variations, and the representativeness of training data—particularly when transferring the model to other basins or datasets [107,108]. While this study specifically focused on one oil field in southern Hungary, several other oil fields have historically produced from the Szolnok Formation, potentially benefiting significantly from the methodological framework developed here [109]. Applying this structured, data-driven approach to these additional sites could enhance reservoir characterization, optimize thermal energy storage, and facilitate effective site selection and management across the broader region [24]. To maximize transparency and enhance its applicability to new geological settings, I have shared the fully documented code and methodology, including the trained XGBoost model, RBF residual correction model, and feature engineering schema.[110] These files ensure consistent and reproducible predictions of channel systems by providing the complete workflow, including feature preparation, model application, and residual correction [111]. Users can leverage these saved artifacts to quantify uncertainty, verify each modeling step, and effectively adapt the channel prediction workflow to other regions with similar log data, ensuring robust and geologically meaningful interpretations [111,112].
6.6. Recommendations and Future Work
Future work should focus on improving the model’s predictive accuracy and transferability for identifying sand-rich channel systems across different geological settings by incorporating diverse training datasets from multiple basins. Developing a standardized well-log preprocessing pipeline—including consistent calibration checks and unified feature engineering—will reduce biases when applying the model to new areas. Furthermore, integrating seismic data could provide independent structural validation, while core analyses and previous hydrocarbon production histories would offer additional calibration points, substantially enhancing the resolution and confidence of channel delineations. Employing advanced uncertainty quantification methods, such as probabilistic modeling or ensemble predictions, will also provide valuable assessments of prediction reliability. Lastly, collaborative data sharing and integration of these validation sources will significantly enhance model validation and practical utility.
7. Conclusion
This research successfully demonstrated a structured, data-driven methodology for accurately predicting the three-dimensional distribution of sand-rich channel systems, indicated by high Flow Zone Index (FZI ≥ 4.5), within the Szolnok Formation in southern Hungary. Leveraging extensive petrophysical data from 128 wells, the study clearly delineated high-permeability sandy channels from surrounding lower-quality intervals characterized by low FZI. The resulting spatial models distinctly identified interconnected channelized sands separated by continuous, low-permeability zones, effectively forming natural barriers crucial for mitigating premature thermal breakthrough in Underground Thermal Energy Storage (UTES) systems.
Although this research focused on one representative oil field in southern Hungary, numerous other fields historically producing from the Szolnok Formation could similarly benefit from adopting this predictive framework. The application of this methodology across these additional sites would enhance reservoir management practices, reduce geological uncertainty, and significantly improve the operational effectiveness of UTES installations regionally.
The integrated modeling workflow, which included rigorous outlier filtering, spatial feature engineering using Inverse Distance Weighted (IDW) interpolation, and predictive modeling via XGBoost regression enhanced with residual corrections, achieved high predictive accuracy. Validation results revealed a robust model performance with an R² of 0.92, a mean absolute error (MAE) of approximately 0.056, and a root mean squared error (RMSE) of 0.17. The precision and reliability of these predictions ensure confident strategic planning and optimal well placement, significantly enhancing the operational sustainability and efficiency of thermal storage.
By explicitly identifying regions of high FZI suitable for hot and cold well placement and delineating effective low-FZI barriers, the methodology directly addresses the critical challenge of thermal breakthrough, enhancing UTES system longevity and thermal recovery efficiency. Future research should focus on further refining model accuracy and generalizability through standardized data preprocessing, integration with seismic surveys, and advanced uncertainty quantification. Ultimately, this robust, reproducible methodology substantially advances reservoir characterization, supporting the global expansion of UTES technology for sustainable, scalable, and economically viable thermal energy storage solutions.
Acknowledgments
I acknowledge the invaluable data contribution from the MOL database, which has been essential for this research. I also thank all co-authors for their significant contributions and collaborative efforts throughout this project.
References
- Duggal, R.; Rayudu, R.; Hinkley, J.; Burnell, J.; Wieland, C.; Keim, M. A Comprehensive Review of Energy Extraction from Low-Temperature Geothermal Resources in Hydrocarbon Fields. Renew. Sustain. Energy Rev. 2022, 154, 111865. [CrossRef]
- REN21 RENEWABLES 2019 GLOBAL STATUS REPORT Available online: https://www.ren21.net/gsr-2019 (accessed on 18 April 2023).
- WEF 5 Green Energy Milestones from around the World Available online: https://www.weforum.org/agenda/2021/04/renewables-record-capacity-solar-wind-nuclear/ (accessed on 18 April 2023).
- Bloemendal, M.; Hartog, N. Analysis of the Impact of Storage Conditions on the Thermal Recovery Efficiency of Low-Temperature ATES Systems. Geothermics 2018, 71, 306–319. [CrossRef]
- Fleuchaus, P.; Schüppler, S.; Bloemendal, M.; Guglielmetti, L.; Opel, O.; Blum, P. Risk Analysis of High-Temperature Aquifer Thermal Energy Storage (HT-ATES). Renew. Sustain. Energy Rev. 2020, 133, 110153. [CrossRef]
- Van Der Roest, E.; Beernink, S.; Hartog, N.; Van Der Hoek, J.P.; Bloemendal, M. Towards Sustainable Heat Supply with Decentralized Multi-Energy Systems by Integration of Subsurface Seasonal Heat Storage. Energies 2021, 14, 7958. [CrossRef]
- Kastner, O.; Norden, B.; Klapperer, S.; Park, S.; Urpi, L.; Cacace, M.; Blöcher, G. Thermal Solar Energy Storage in Jurassic Aquifers in Northeastern Germany: A Simulation Study. Renew. Energy 2017, 104, 290–306. [CrossRef]
- van Heekeren, V.; Bakema, G. The Netherlands Country Update on Geothermal Energy. 2015.
- Oerlemans, P. Performance of HT-ATES in Practice.
- Stricker, K.; Grimmer, J.C.; Egert, R.; Bremer, J.; Korzani, M.G.; Schill, E.; Kohl, T. The Potential of Depleted Oil Reservoirs for High-Temperature Storage Systems. Energies 2020, 13, 6510. [CrossRef]
- Sommer, W.; Valstar, J.; van Gaans, P.; Grotenhuis, T.; Rijnaarts, H. The Impact of Aquifer Heterogeneity on the Performance of Aquifer Thermal Energy Storage. Water Resour. Res. 2013, 49, 8128–8138. [CrossRef]
- Dickinson, J.S.; Buik, N.; Matthews, M.C.; Snijders, A. Aquifer Thermal Energy Storage: Theoretical and Operational Analysis. Géotechnique 2009, 59, 249–260. [CrossRef]
- Amaefule, J.O.; Altunbay, M.; Tiab, D.; Kersey, D.G.; Keelan, D.K. Enhanced Reservoir Description: Using Core and Log Data to Identify Hydraulic (Flow) Units and Predict Permeability in Uncored Intervals/Wells.; OnePetro, October 3 1993.
- Astsauri, T.; Habiburrahman, M.; Ibrahim, A.F.; Wang, Y. Utilizing Machine Learning for Flow Zone Indicators Prediction and Hydraulic Flow Unit Classification. Sci. Rep. 2024, 14, 4223. [CrossRef]
- Jin, W.; Atkinson, T.A.; Doughty, C.; Neupane, G.; Spycher, N.; McLing, T.L.; Dobson, P.F.; Smith, R.; Podgorney, R. Machine-Learning-Assisted High-Temperature Reservoir Thermal Energy Storage Optimization. Renew. Energy 2022, 197, 384–397. [CrossRef]
- Man, H.Q.; Hien, D.H.; Thong, K.D.; Dung, B.V.; Hoa, N.M.; Hoa, T.K.; Kieu, N.V.; Ngoc, P.Q. Hydraulic Flow Unit Classification and Prediction Using Machine Learning Techniques: A Case Study from the Nam Con Son Basin, Offshore Vietnam. Energies 2021, 14, 7714. [CrossRef]
- Cao, T.; Cui, J.; He, Y.; Ma, L.; Qiao, W.; Liu, Y. The Influence of Reservoir Architecture on the Connectivity of the Shahejie Formation in the Liuzhong Oilfield. Energies 2024, 17, 115. [CrossRef]
- The Importance of Physiochemical Processes in Decarbonisation Technology Applications Utilizing the Subsurface: A Review | Earth Science, Systems and Society Available online: https://www.lyellcollection.org/doi/full/10.3389/esss.2022.10043 (accessed on 5 July 2025).
- Duplyakin, D.; Beckers, K.F.; Siler, D.L.; Martin, M.J.; Johnston, H.E. Modeling Subsurface Performance of a Geothermal Reservoir Using Machine Learning. Energies 2022, 15, 967. [CrossRef]
- Liu, A.(刘奥迪); Li, J.(李靖); Bi, J.(毕剑飞); Chen, Z.(陈掌星); Wang, Y.(王岩); Lu, C.(卢春昊); Jin, Y.(金衍); Lin, B.(林伯韬) A Novel Reservoir Simulation Model Based on Physics Informed Neural Networks. Phys. Fluids 2024, 36, 116617. [CrossRef]
- Rohmer, J.; Armandine Les Landes, A.; Loschetter, A.; Maragna, C. Fast Prediction of Aquifer Thermal Energy Storage: A Multicyclic Metamodelling Procedure. Comput. Geosci. 2023, 27, 223–243. [CrossRef]
- Pellegrini, M.; Bloemendal, M.; Hoekstra, N.; Spaak, G.; Andreu Gallego, A.; Rodriguez Comins, J.; Grotenhuis, T.; Picone, S.; Murrell, A.J.; Steeman, H.J. Low Carbon Heating and Cooling by Combining Various Technologies with Aquifer Thermal Energy Storage. Sci. Total Environ. 2019, 665, 1–10. [CrossRef]
- Rangel-Jurado, N.; Hawkins, A.J.; Fulton, P.M. Influence of Extreme Fracture Flow Channels on the Thermal Performance of Open-Loop Geothermal Systems at Commercial Scale. Geotherm. Energy 2023, 11, 19. [CrossRef]
- Abdulhaq, H. Predicting Thermal Performance of Aquifer Thermal Energy Storage Systems in Depleted Clastic Hydrocarbon Reservoir via Machine Learning: Case Study from Hungary. In Proceedings of the The 16th European Geothermal PhD Days Book of Abstracts; EGPD 2025: Szeged, Hungary, 2025.
- Varouchakis, E.A. Median Polish Kriging and Sequential Gaussian Simulation for the Spatial Analysis of Source Rock Data. J. Mar. Sci. Eng. 2021, 9, 717. [CrossRef]
- Challenges and Opportunities for Aquifer Thermal Energy Storage (ATES) in EU Energy Transition Efforts—An Overview Available online: https://www.mdpi.com/1996-1073/18/4/1001 (accessed on 5 July 2025).
- Baird, K.; Arnold, D.; Doster, F.; Geiger, S.; Petrovskyy, D.; Hampson, G.J.; Jacquemyn, C.; Jackson, M.D.; Silva, J.M.; Rahman, F.; et al. Assessment of the Impacts of Multi-Scale Sedimentological Heterogeneity on Low-Enthalpy Geothermal Energy Production.
- Khosravi, R.; Simjoo, M.; Chahardowli, M. A New Insight into Pilot-Scale Development of Low-Salinity Polymer Flood Using an Intelligent-Based Proxy Model Coupled with Particle Swarm Optimization. Sci. Rep. 2024, 14, 29000. [CrossRef]
- Nádor, A. De-Risking Geothermal Exploration by Public Data Portals and Financial Incentives – Good Examples from Hungary.; European Geothermal Congress: Berlin, Germany, 2022.
- Szanyi, J.D.; Kovács, B.; Abdulhaq, H.A. Harnessing Geothermal Energy in Hungary. Geol. Soc. Lond. Spec. Publ. 2025, 555, SP555-2024–22. [CrossRef]
- Topór, T.; Słota-Valim, M.; Kudrewicz, R. Assessing the Geothermal Potential of Selected Depleted Oil and Gas Reservoirs Based on Geological Modeling and Machine Learning Tools. Energies 2023, 16, 5211. [CrossRef]
- Abdulhaq, H.A.; Geiger, J.; Vass, I.; Tóth, T.M.; Medgyes, T.; Szanyi, J. Transforming Abandoned Hydrocarbon Fields into Heat Storage Solutions: A Hungarian Case Study Using Enhanced Multi-Criteria Decision Analysis–Analytic Hierarchy Process and Geostatistical Methods. Energies 2024, 17, 3954. [CrossRef]
- Njeru, R.M.; Sofyan, A.; Halisch, M.; Kóbor, B.; Szanyi, J. Optimizing Micro-CT Resolution for Geothermal Reservoir Characterization in the Pannonian Basin. Energies 2024, 17, 3081. [CrossRef]
- Vass, I.; Tóth, T.M.; Szanyi, J.; Kovács, B. Hybrid Numerical Modelling of Fluid and Heat Transport between the Overpressured and Gravitational Flow Systems of the Pannonian Basin. Geothermics 2018, 72, 268–276. [CrossRef]
- Varga, A.; Bozsó, G.; Garaguly, I.; Raucsik, B.; Bencsik, A.; Kóbor, B. Cements, Waters, and Scales: An Integrated Study of the Szeged Geothermal Systems (SE Hungary) to Characterize Natural Environmental Conditions of the Thermal Aquifer. Geofluids 2019, 2019, 1–21. [CrossRef]
- Nagymarosy, A.; Båldi-Beke, M. The Szolnok Unit and Its Probable Paleogeographic Position. Tectonophysics 1993, 226, 457–470. [CrossRef]
- Sztanó, O.; Sebe, K.; Csillag, G.; Magyar, I. Turbidites as Indicators of Paleotopography, Upper Miocene Lake Pannon, Western Mecsek Mountains (Hungary). Geol. Carpathica 2015, 66, 331–344. [CrossRef]
- Fleuchaus, P.; Godschalk, B.; Stober, I.; Blum, P. Worldwide Application of Aquifer Thermal Energy Storage – A Review. Renew. Sustain. Energy Rev. 2018, 94, 861–876. [CrossRef]
- Kim, J.; Lee, Y.; Yoon, W.S.; Jeon, J.S.; Koo, M.-H.; Keehm, Y. Numerical Modeling of Aquifer Thermal Energy Storage System. Energy 2010, 35, 4955–4965. [CrossRef]
- Project Thermo-Hydro-Mechanical Description – Geothermal Energy and Geofluids.
- Geofizika M. Magyar geofizika 52. évf. 2. sz. (2011.). 2011.
- Nádor, A.; Lenkey, L. Geothermal Resources of Hungary: A Play-Based Review. 2023.
- B 2204-B: Pannonian Basin Province, Central Europe (Province 4808)—Petroleum Geology, Total Petroleum Systems, and Petroleum Resource Assessment Available online: https://pubs.usgs.gov/bul/2204/b/ (accessed on 8 July 2025).
- Geology of Hungary; Haas, J., Ed.; Springer Berlin Heidelberg: Berlin, Heidelberg, 2013; ISBN 978-3-642-21909-2.
- Mádl-Szőnyi, J.; Tóth, J. A Hydrogeological Type Section for the Duna-Tisza Interfluve, Hungary. Hydrogeol. J. 2009, 17, 961–980. [CrossRef]
- Szanyi, J.; Medgyes, T.; Kóbor, B.; Pál-Molnár, E. Technologies of Injection into Sandstone Reservoirs: Best Practices, Case Studies; GeoLitera; Institute of Geosciences, University of Szeged: Szeged, 2015; ISBN 978-963-306-370-5.
- Tóth, J.; Almási, I. Interpretation of Observed Fluid Potential Patterns in a Deep Sedimentary Basin under Tectonic Compression: Hungarian Great Plain, Pannonian Basin. Geofluids 2001, 1, 11–36. [CrossRef]
- Elabd, M.A.; González-Guzmán, R.; Weber, B.; Solís, C.; Bernard-Romero, R.; Velasco-Tapia, F.; Marín-Camacho, P. Determination of Permeability Data and 3-D Modelling of the Host Rock and Sinters from a Geothermal Field: Los Geysers, Northern Trans-Mexican Volcanic Field. Data Brief 2022, 45, 108637. [CrossRef]
- Permeability and Mineralogy of the Újfalu Formation, Hungary, from Production Tests and Experimental Rock Characterization: Implications for Geothermal Heat Projects Available online: https://www.mdpi.com/1996-1073/14/14/4332 (accessed on 5 July 2025).
- Jello, J.; Khan, M.; Malkewicz, N.; Whittaker, S.; Baser, T. Advanced Geothermal Energy Storage Systems by Repurposing Existing Oil and Gas Wells: A Full-Scale Experimental and Numerical Investigation. Renew. Energy 2022, 199, 852–865. [CrossRef]
- Shi, Y.; Cui, Q.; Song, X.; Liu, S.; Yang, Z.; Peng, J.; Wang, L.; Guo, Y. Thermal Performance of the Aquifer Thermal Energy Storage System Considering Vertical Heat Losses through Aquitards. Renew. Energy 2023, 207, 447–460. [CrossRef]
- Bridger, D.W.; Allen, D.M. Heat Transport Simulations in a Heterogeneous Aquifer Used for Aquifer Thermal Energy Storage (ATES). Can. Geotech. J. 2010, 47, 96–115. [CrossRef]
- Elbalawy, M.A.; Balash, M.; Eid, M.H.; Takács, E.; Velledits, F. Innovative Method Integrates Play Fairway Analysis Supported with GIS and Seismic Modeling for Geothermal Potential Evaluation in a Basement Reservoir. Sci. Rep. 2025, 15, 1325. [CrossRef]
- Czauner, B.; Mádl-Szőnyi, J. Regional Hydraulic Behavior of Structural Zones and Sedimentological Heterogeneities in an Overpressured Sedimentary Basin. Mar. Pet. Geol. 2013, 48, 260–274. [CrossRef]
- Tari, G.; Bada, G.; Boote, D.R.D.; Krézsek, C.; Koroknai, B.; Kovács, G.; Lemberkovics, V.; Sachsenhofer, R.F.; Tóth, T. The Pannonian Super Basin: A Brief Overview. AAPG Bull. 2023, 107, 1391–1417. [CrossRef]
- Réveillère, A.; Hamm, V.; Lesueur, H.; Cordier, E.; Goblet, P. Geothermal Contribution to the Energy Mix of a Heating Network When Using Aquifer Thermal Energy Storage: Modeling and Application to the Paris Basin. Geothermics 2013, 47, 69–79. [CrossRef]
- Zeghici, R.M.; Oude Essink, G.H.P.; Hartog, N.; Sommer, W. Integrated Assessment of Variable Density–Viscosity Groundwater Flow for a High Temperature Mono-Well Aquifer Thermal Energy Storage (HT-ATES) System in a Geothermal Reservoir. Geothermics 2015, 55, 58–68. [CrossRef]
- Szanyi, J.; Rybach, L.; Abdulhaq, H.A. Geothermal Energy and Its Potential for Critical Metal Extraction—A Review. Energies 2023, 16, 7168. [CrossRef]
- Wesselink, M.; Liu, W.; Koornneef, J.; van den Broek, M. Conceptual Market Potential Framework of High Temperature Aquifer Thermal Energy Storage - A Case Study in the Netherlands. Energy 2018, 147, 477–489. [CrossRef]
- Holstenkamp, L.; Meisel, M.; Neidig, P.; Opel, O.; Steffahn, J.; Strodel, N.; Lauer, J.J.; Vogel, M.; Degenhart, H.; Michalzik, D.; et al. Interdisciplinary Review of Medium-Deep Aquifer Thermal Energy Storage in North Germany. Energy Procedia 2017, 135, 327–336. [CrossRef]
- Egbele, E.; Ezuka, I.; Onyekonwu, M. Net-To-Gross Ratios: Implications in Integrated Reservoir Management Studies.; OnePetro, August 1 2005.
- Zecchin, M.; Catuneanu, O. High-Resolution Sequence Stratigraphy of Clastic Shelves III: Applications to Reservoir Geology. Mar. Pet. Geol. 2015, 62, 161–175. [CrossRef]
- Kassab, M.A.; Abbas, A.E.; Osman, I.A.; Eid, A.A. Reservoir Rock Typing for Optimum Permeability Prediction of Nubia Formation in October Field, Gulf of Suez, Egypt. J. Pet. Explor. Prod. Technol. 2024, 14, 1395–1416. [CrossRef]
- Abdallah, S.; Sid Ali, O.; Benmalek, S. Rock Type and Permeability Prediction Using Flow-Zone Indicator with an Application to Berkine Basin (Algerian Sahara). In SEG Technical Program Expanded Abstracts 2016; SEG Technical Program Expanded Abstracts; Society of Exploration Geophysicists, 2016; pp. 3068–3072.
- Czauner, B.; Szabó, Z.; Márton, B.; Mádl-Szőnyi, J. Basin-Scale Hydraulic Evaluation of Groundwater Flow Controlled Biogenic Gas Migration and Accumulation in the Central Pannonian Basin. Water 2023, 15, 3272. [CrossRef]
- Malvić, T.; Ivšinović, J.; Velić, J.; Sremac, J.; Barudžija, U. Application of the Modified Shepard’s Method (MSM): A Case Study with the Interpolation of Neogene Reservoir Variables in Northern Croatia. Stats 2020, 3, 68–83. [CrossRef]
- Sandstone Heterogeneity - 3-D Reservoir Characterization Available online: https://pubs.usgs.gov/dds/dds-033/USGS_3D/ssx_txt/heterog.htm (accessed on 4 July 2025).
- Cheng, X.; Zhao, B.; Gao, C.; Gao, Y. Reservoir Permeability Calculation under Flow Unit Control. Energies 2022, 15, 7637. [CrossRef]
- Xing, Y.; Wang, H.; Zhang, L.; Cheng, M.; Shi, H.; Guo, C.; Chen, P.; Yu, W. Depositional and Diagenetic Controls on Reservoir Quality of Callovian-Oxfordian Stage on the Right Bank of Amu Darya. Energies 2022, 15, 6923. [CrossRef]
- Abbaszadeh, M.; Fujii, H.; Fujimoto, F. Permeability Prediction by Hydraulic Flow Units—Theory and Applications. SPE Form. Eval. 1996, 11, 263–271. [CrossRef]
- Corbett, P.; Ellabad, Y.; Mohammed, K.; Pososyaev, A. Global Hydraulic Elements – Elementary Petrophysics for Reduced Reservoir Modelling.; European Association of Geoscientists & Engineers, June 2 2003; p. cp.
- Svirsky, D.; Ryazanov, A.; Pankov, M.; Corbett, P.W.; Posysoev, A. Hydraulic Flow Units Resolve Reservoir Description Challenges in a Siberian Oil Field.; OnePetro, March 29 2004.
- Baisad, K.; Chutsagulprom, N.; Moonchai, S. A Non-Linear Trend Function for Kriging with External Drift Using Least Squares Support Vector Regression. Mathematics 2023, 11, 4799. [CrossRef]
- Otchere, D.A.; Hodgetts, D.; Ganat, T.A.O.; Ullah, N.; Rashid, A. Static Reservoir Modeling Comparing Inverse Distance Weighting to Kriging Interpolation Algorithm in Volumetric Estimation. Case Study: Gullfaks Field.; OnePetro, August 9 2021.
- Al-Dousari, D.M.; Almudhhi, S.; Garrouch, A. Predicting the Flow Zone Indicator of Carbonate Reservoirs Using NMR Echo Transforms, and Routine Open-Hole Log Measurements : J. Eng. Res. 2022, 10, 330–346. [CrossRef]
- Fadel, M.; Reinecker, J.; Bruss, D.; Moeck, I. Causes of a Premature Thermal Breakthrough of a Hydrothermal Project in Germany. Geothermics 2022, 105, 102523. [CrossRef]
- Iglesias, F.; Massana, J.; Burgas, L.; Planellas, N.; Colomer, J. Methodological Advances in Temperature Dynamics Modeling for Energy-Efficient Indoor Air Management Systems. Appl. Sci. 2025, 15, 4291. [CrossRef]
- Ahmadi, M. Interpretable Machine Learning for High-Accuracy Reservoir Temperature Prediction in Geothermal Energy Systems. Energies 2025, 18, 3366. [CrossRef]
- Shen, J.; Chen, L.; Wu, Y.; Jing, N. Approach to Accelerating Dissolved Vector Buffer Generation in Distributed In-Memory Cluster Architecture. ISPRS Int. J. Geo-Inf. 2018, 7, 26. [CrossRef]
- Nieminen, P. Application of Standardized Regression Coefficient in Meta-Analysis. BioMedInformatics 2022, 2, 434–458. [CrossRef]
- Zhang, J.; Wang, R.; Jia, A.; Feng, N. Optimization and Application of XGBoost Logging Prediction Model for Porosity and Permeability Based on K-Means Method. Appl. Sci. 2024, 14, 3956. [CrossRef]
- Ge, Y.; Thomasson, J.A.; Sui, R.; Wooten, J. Regression-Kriging for Characterizing Soils with Remotesensing Data. Front. Earth Sci. 2011. [CrossRef]
- Badem, A.C.; Yılmaz, R.; Cesur, M.R.; Cesur, E. Advanced Predictive Modeling for Dam Occupancy Using Historical and Meteorological Data. Sustainability 2024, 16, 7696. [CrossRef]
- Das, A. A Data-Driven Approach Utilizing Machine Learning (ML) and Geographical Information System (GIS)-Based Time Series Analysis with Data Augmentation for Water Quality Assessment in Mahanadi River Basin, Odisha, India. Discov. Sustain. 2025, 6, 555. [CrossRef]
- Zhao, N. An Efficient Downscaling Scheme for High-Resolution Precipitation Estimates over a High Mountainous Watershed. Remote Sens. 2021, 13, 234. [CrossRef]
- Mellal, I.; Latrach, A.; Rasouli, V.; Bakelli, O.; Dehdouh, A.; Ouadi, H. Water Saturation Prediction in the Middle Bakken Formation Using Machine Learning. Eng 2023, 4, 1951–1964. [CrossRef]
- Hosamo, H.; Mazzetto, S. Performance Evaluation of Machine Learning Models for Predicting Energy Consumption and Occupant Dissatisfaction in Buildings. Buildings 2025, 15, 39. [CrossRef]
- Gao, H.; Wang, Y.; Ye, J.; Chen, A.; Wen, M.; Wang, D.; Du, B.; Li, S.; Cui, Q. Machine Learning-Based Prediction of Laser Ablation Impulse from Plasma Spectra. Phys. Plasmas 2025, 32, 063301. [CrossRef]
- Bărbulescu, A.; Saliba, Y. Sensitivity Analysis of the Inverse Distance Weighting and Bicubic Spline Smoothing Models for MERRA-2 Reanalysis PM2.5 Series in the Persian Gulf Region. Atmosphere 2024, 15, 748. [CrossRef]
- Abraham-A, R.M.; Taioli, F.; Nzekwu, A.I. Physical Properties of Sandstone Reservoirs: Implication for Fluid Mobility. Energy Geosci. 2022, 3, 349–359. [CrossRef]
- Djebbas, F.; Ameur-Zaimeche, O.; Kechiched, R.; Heddam, S.; Wood, D.A.; Movahed, Z. Integrating Hydraulic Flow Unit Concept and Adaptive Neuro-Fuzzy Inference System to Accurately Estimate Permeability in Heterogeneous Reservoirs: Case Study Sif Fatima Oilfield, Southern Algeria. J. Afr. Earth Sci. 2023, 206, 105027. [CrossRef]
- Mohammadian, E.; Kheirollahi, M.; Liu, B.; Ostadhassan, M.; Sabet, M. A Case Study of Petrophysical Rock Typing and Permeability Prediction Using Machine Learning in a Heterogenous Carbonate Reservoir in Iran. Sci. Rep. 2022, 12, 4505. [CrossRef]
- Mohammadpour, M.; Roshan, H.; Arashpour, M.; Masoumi, H. Machine Learning Assisted Kriging to Capture Spatial Variability in Petrophysical Property Modelling. Mar. Pet. Geol. 2024, 167, 106967. [CrossRef]
- Al-Dhafeeri, A.M.; Nasr-El-Din, H.A. Characteristics of High-Permeability Zones Using Core Analysis, and Production Logging Data. J. Pet. Sci. Eng. 2007, 55, 18–36. [CrossRef]
- Koroncz, P.; Vizhányó, Z.; Farkas, M.P.; Kuncz, M.; Ács, P.; Kocsis, G.; Mucsi, P.; Fedorné Szász, A.; Fedor, F.; Kovács, J. Experimental Rock Characterisation of Upper Pannonian Sandstones from Szentes Geothermal Field, Hungary. Energies 2022, 15, 9136. [CrossRef]
- Nabawy, B.S.; Basal, A.M.K.; Sarhan, M.A.; Safa, M.G. Reservoir Zonation, Rock Typing and Compartmentalization of the Tortonian-Serravallian Sequence, Temsah Gas Field, Offshore Nile Delta, Egypt. Mar. Pet. Geol. 2018, 92, 609–631. [CrossRef]
- Fu, L.; Wang, X.; Zhong, X.; Cao, X. Technology and Applications for the Interpretation and Modeling of Advanced Sand Body Architectures. Energies 2025, 18, 504. [CrossRef]
- Steventon, M.J.; Jackson, C.A.-L.; Johnson, H.D.; Hodgson, D.M.; Kelly, S.; Omma, J.; Gopon, C.; Stevenson, C.; Fitch, P. Evolution of a Sand-Rich Submarine Channel–Lobe System, and the Impact of Mass-Transport and Transitional-Flow Deposits on Reservoir Heterogeneity: Magnus Field, Northern North Sea. Pet. Geosci. 2021, 27, petgeo2020-095. [CrossRef]
- Shirinkin, D.; Kochnev, A.; Krivoshchekov, S.; Putilov, I.; Botalov, A.; Kozyrev, N.; Ozhgibesov, E. High Permeability Streak Identification and Modelling Approach for Carbonate Reef Reservoir. Energies 2024, 17, 236. [CrossRef]
- Singh, M.; Mahmoodpour, S.; Schmidt-Hattenberger, C.; Sass, I.; Drews, M. Influence of Reservoir Heterogeneity on Simultaneous Geothermal Energy Extraction and CO2 Storage. Sustainability 2024, 16, 387. [CrossRef]
- Fathy, M.; Reda, M.; Abdel-Fattah, M.I.; Raef, A.; Al-Hashim, M.H. Seismic and Petrophysical Characterization of the Sequoia Pliocene Channel Reservoirs: Insights into Hydrocarbon Potential in the West Delta Deep Marine, Egypt. Pet. Geosci. 2025, 31, petgeo2024-070. [CrossRef]
- El-Gendy, N.H.; Mabrouk, W.M.; Waziry, M.A.; Dodd, T.J.; Abdalla, F.A.; Alexakis, D.E.; Barakat, M.K. An Integrated Approach for Saturation Modeling Using Hydraulic Flow Units: Examples from the Upper Messinian Reservoir. Water 2023, 15, 4204. [CrossRef]
- Mahbaz, S.B.; Yaghoubi, A.; Dehghani-Sanij, A.; Sarvaramini, E.; Leonenko, Y.; Dusseault, M.B. Well-Doublets: A First-Order Assessment of Geothermal SedHeat Systems. Appl. Sci. 2021, 11, 697. [CrossRef]
- Wachowicz-Pyzik, A.; Sowiżdżał, A.; Pająk, L.; Ziółkowski, P.; Badur, J. Assessment of the Effective Variants Leading to Higher Efficiency for the Geothermal Doublet, Using Numerical Analysis‒Case Study from Poland (Szczecin Trough). Energies 2020, 13, 2174. [CrossRef]
- (PDF) CO2 Mineralization in a Saline Aquifer-like Environment, Pannonian Basin, Hungary. In Proceedings of the ResearchGate; July 3 2025.
- Farkas, M.P.; Magyar, G.; Hofmann, H.; Zimmermann, G.; Fedor, F. Comparison of Stimulation Techniques in a Geothermal Injection Well in a Sedimentary Aquifer in Szentes, Hungary. Geotherm. Energy 2025, 13, 20. [CrossRef]
- Brcković, A.; Orešković, J.; Cvetković, M.; Marić-Đureković, Ž. Enhancing the Understanding of Subsurface Relations: Machine Learning Approaches for Well Data Analysis in the Drava Basin, Pannonian Super Basin. Appl. Sci. 2024, 14, 6039. [CrossRef]
- Liu, H.; Wu, Y.; Cao, Y.; Lv, W.; Han, H.; Li, Z.; Chang, J. Well Logging Based Lithology Identification Model Establishment Under Data Drift: A Transfer Learning Method. Sensors 2020, 20, 3643. [CrossRef]
- Clayton, J.L.; Spencer, C.W.; Koncz, I. Tótkomlós–Szolnok(.) Petroleum System of Southeastern Hungary. In The Petroleum System—From Source to Trap; Magoon, L.B., Dow, W.G., Eds.; American Association of Petroleum Geologists, 1994; Vol. 60, p. 0 ISBN 978-1-62981-092-8.
- Abdulhaq, H. 3D FZI Prediction Pipeline and Interactive Streamlit App for Well Log Analysis. 2025.
- Digitalization of Legacy Datasets and Machine Learning Regression Yields Insights for Reservoir Property Prediction and Submarine-Fan Evolution: A Subsurface Example From the Lewis Shale, Wyoming | Published in The Sedimentary Record Available online: https://thesedimentaryrecord.scholasticahq.com/article/36638 (accessed on 5 July 2025).
- Mahjour, S.K.; Saleh, A.; Mahjour, S.S. Dimension-Adaptive Machine Learning for Efficient Uncertainty Quantification in Geological Carbon Storage Models. Processes 2025, 13, 1834. [CrossRef]
Figure 1.
Thickness map of the Pannonian sediments in Hungary, highlighting the extent of the Szolnok Formation (outlined by purple lines). The green rectangle delineates the specific area investigated in this study [41,42,43].
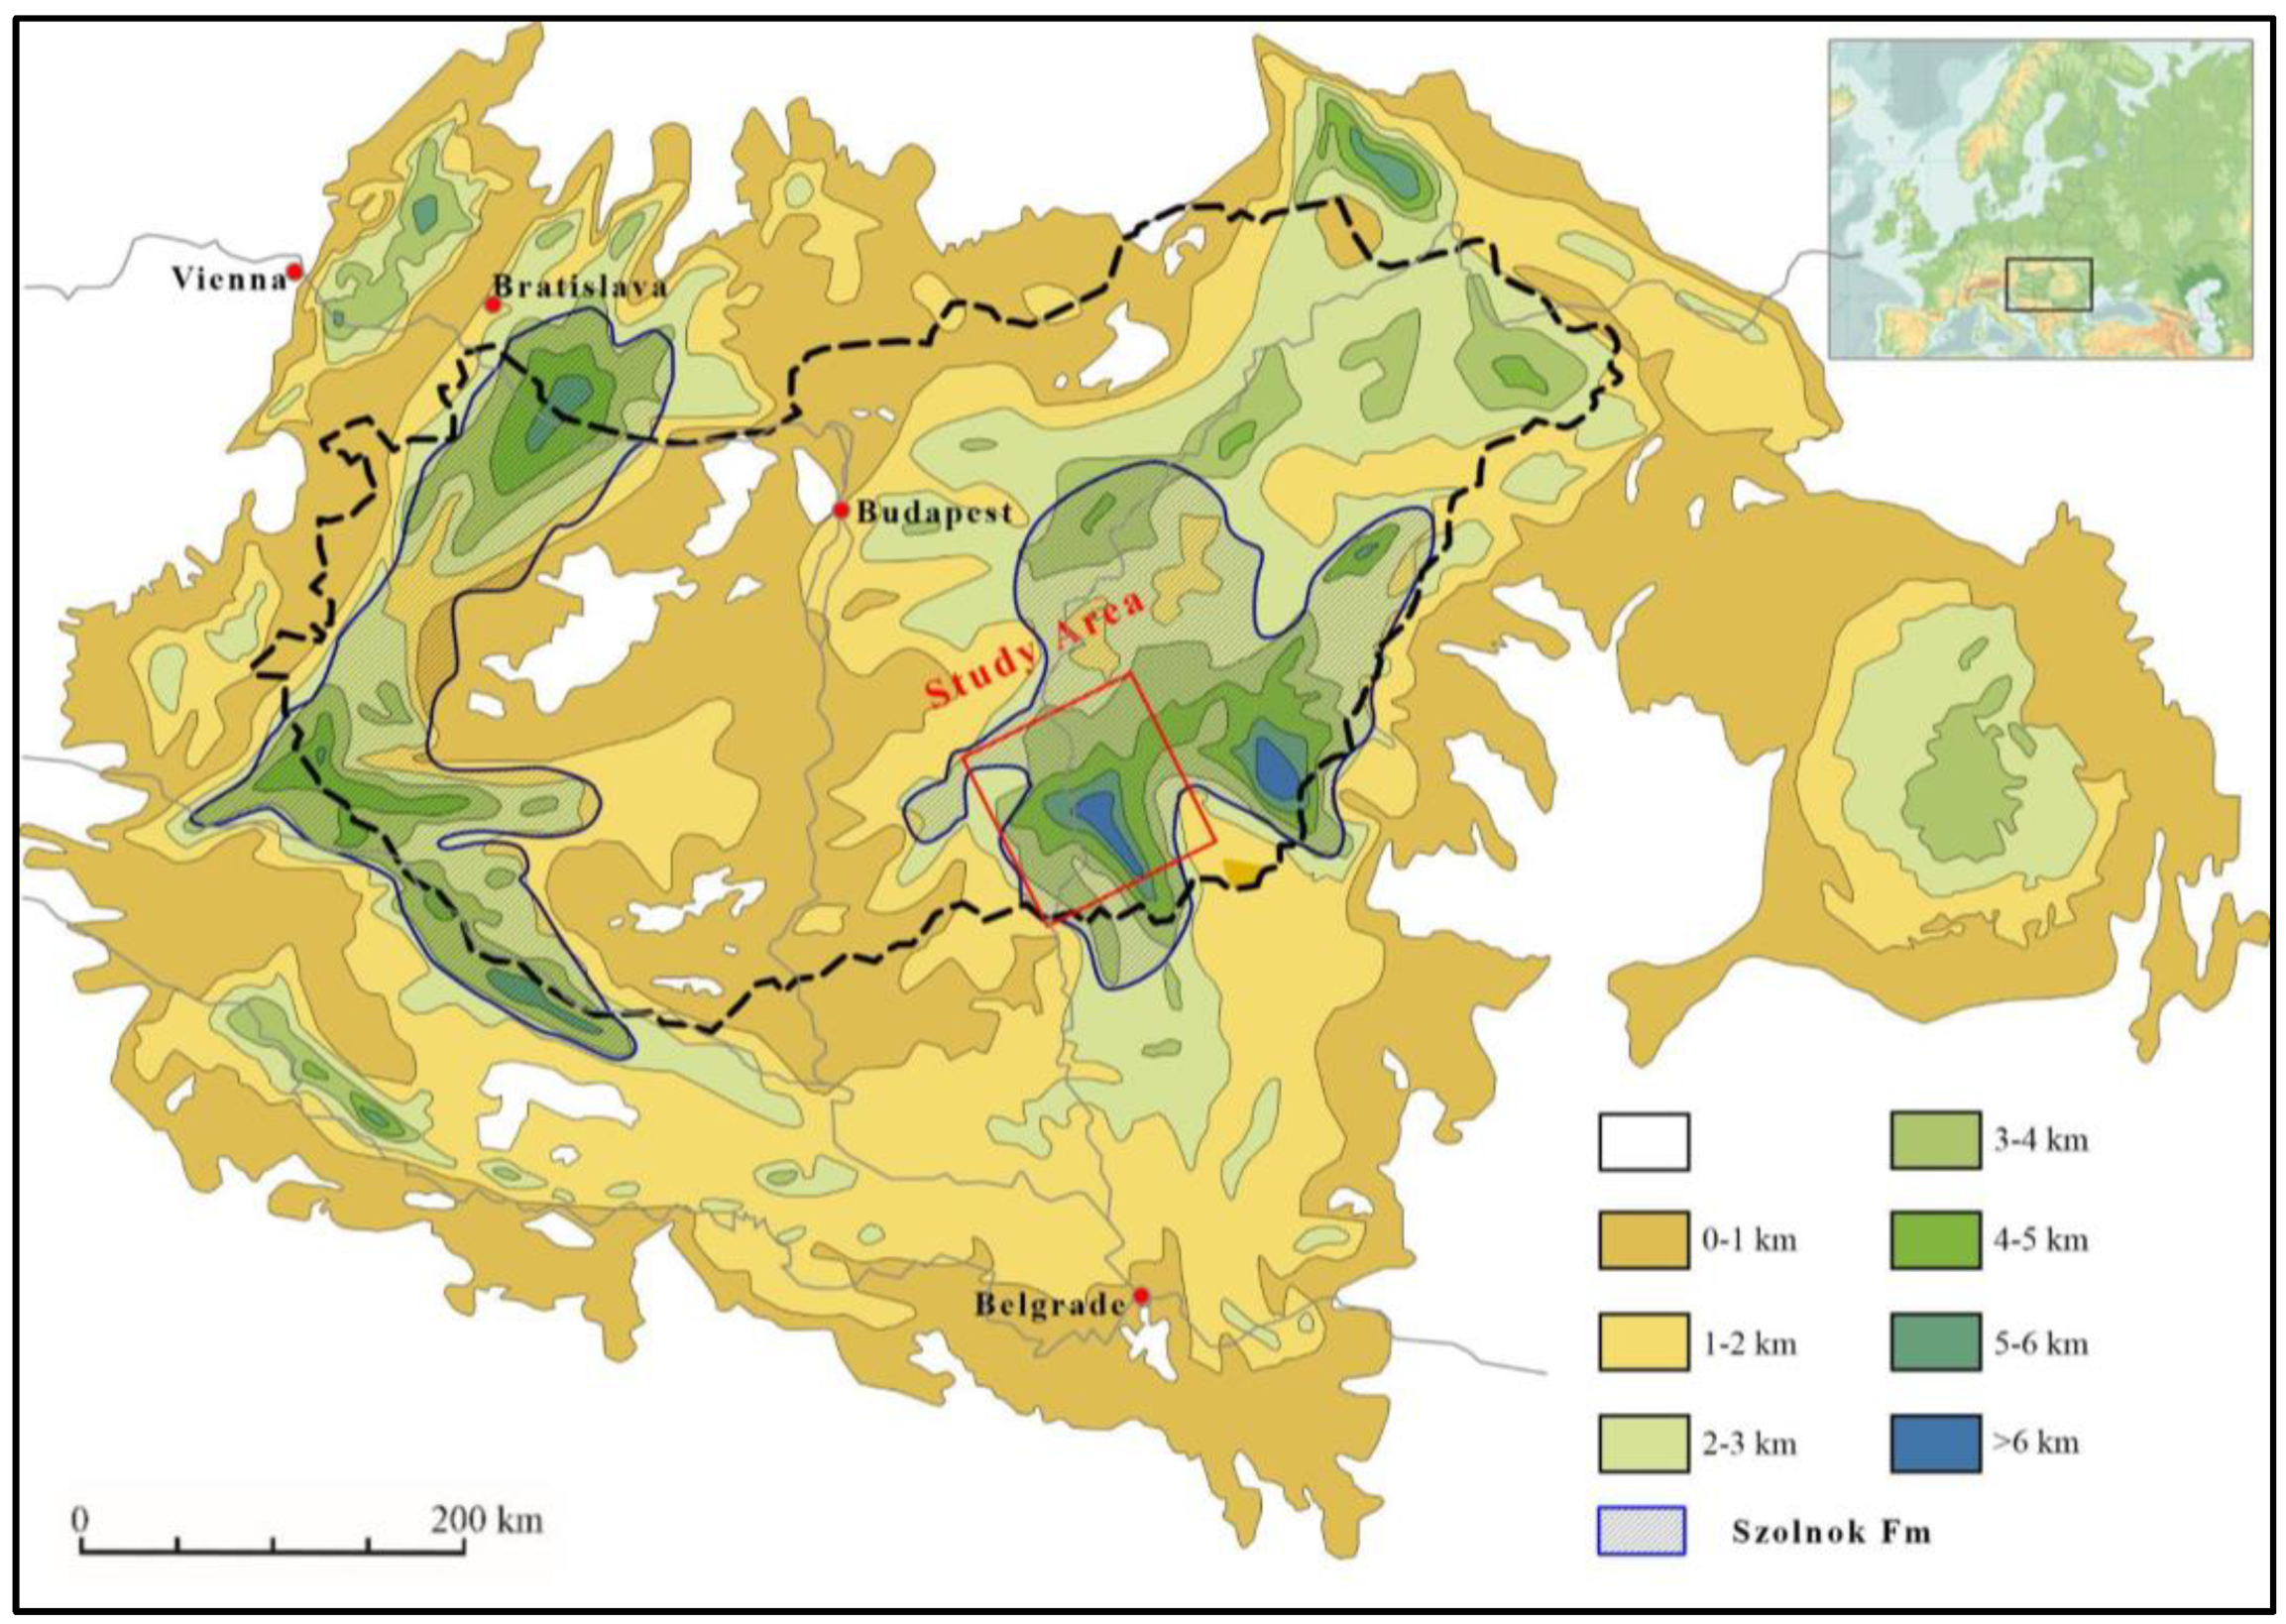
Figure 2.
Radial flow chart illustrating the workflow implemented in this research. The red arrows represent data outputs or processed information, while the blue arrows denote data inputs or feedback pathways.
Figure 2.
Radial flow chart illustrating the workflow implemented in this research. The red arrows represent data outputs or processed information, while the blue arrows denote data inputs or feedback pathways.
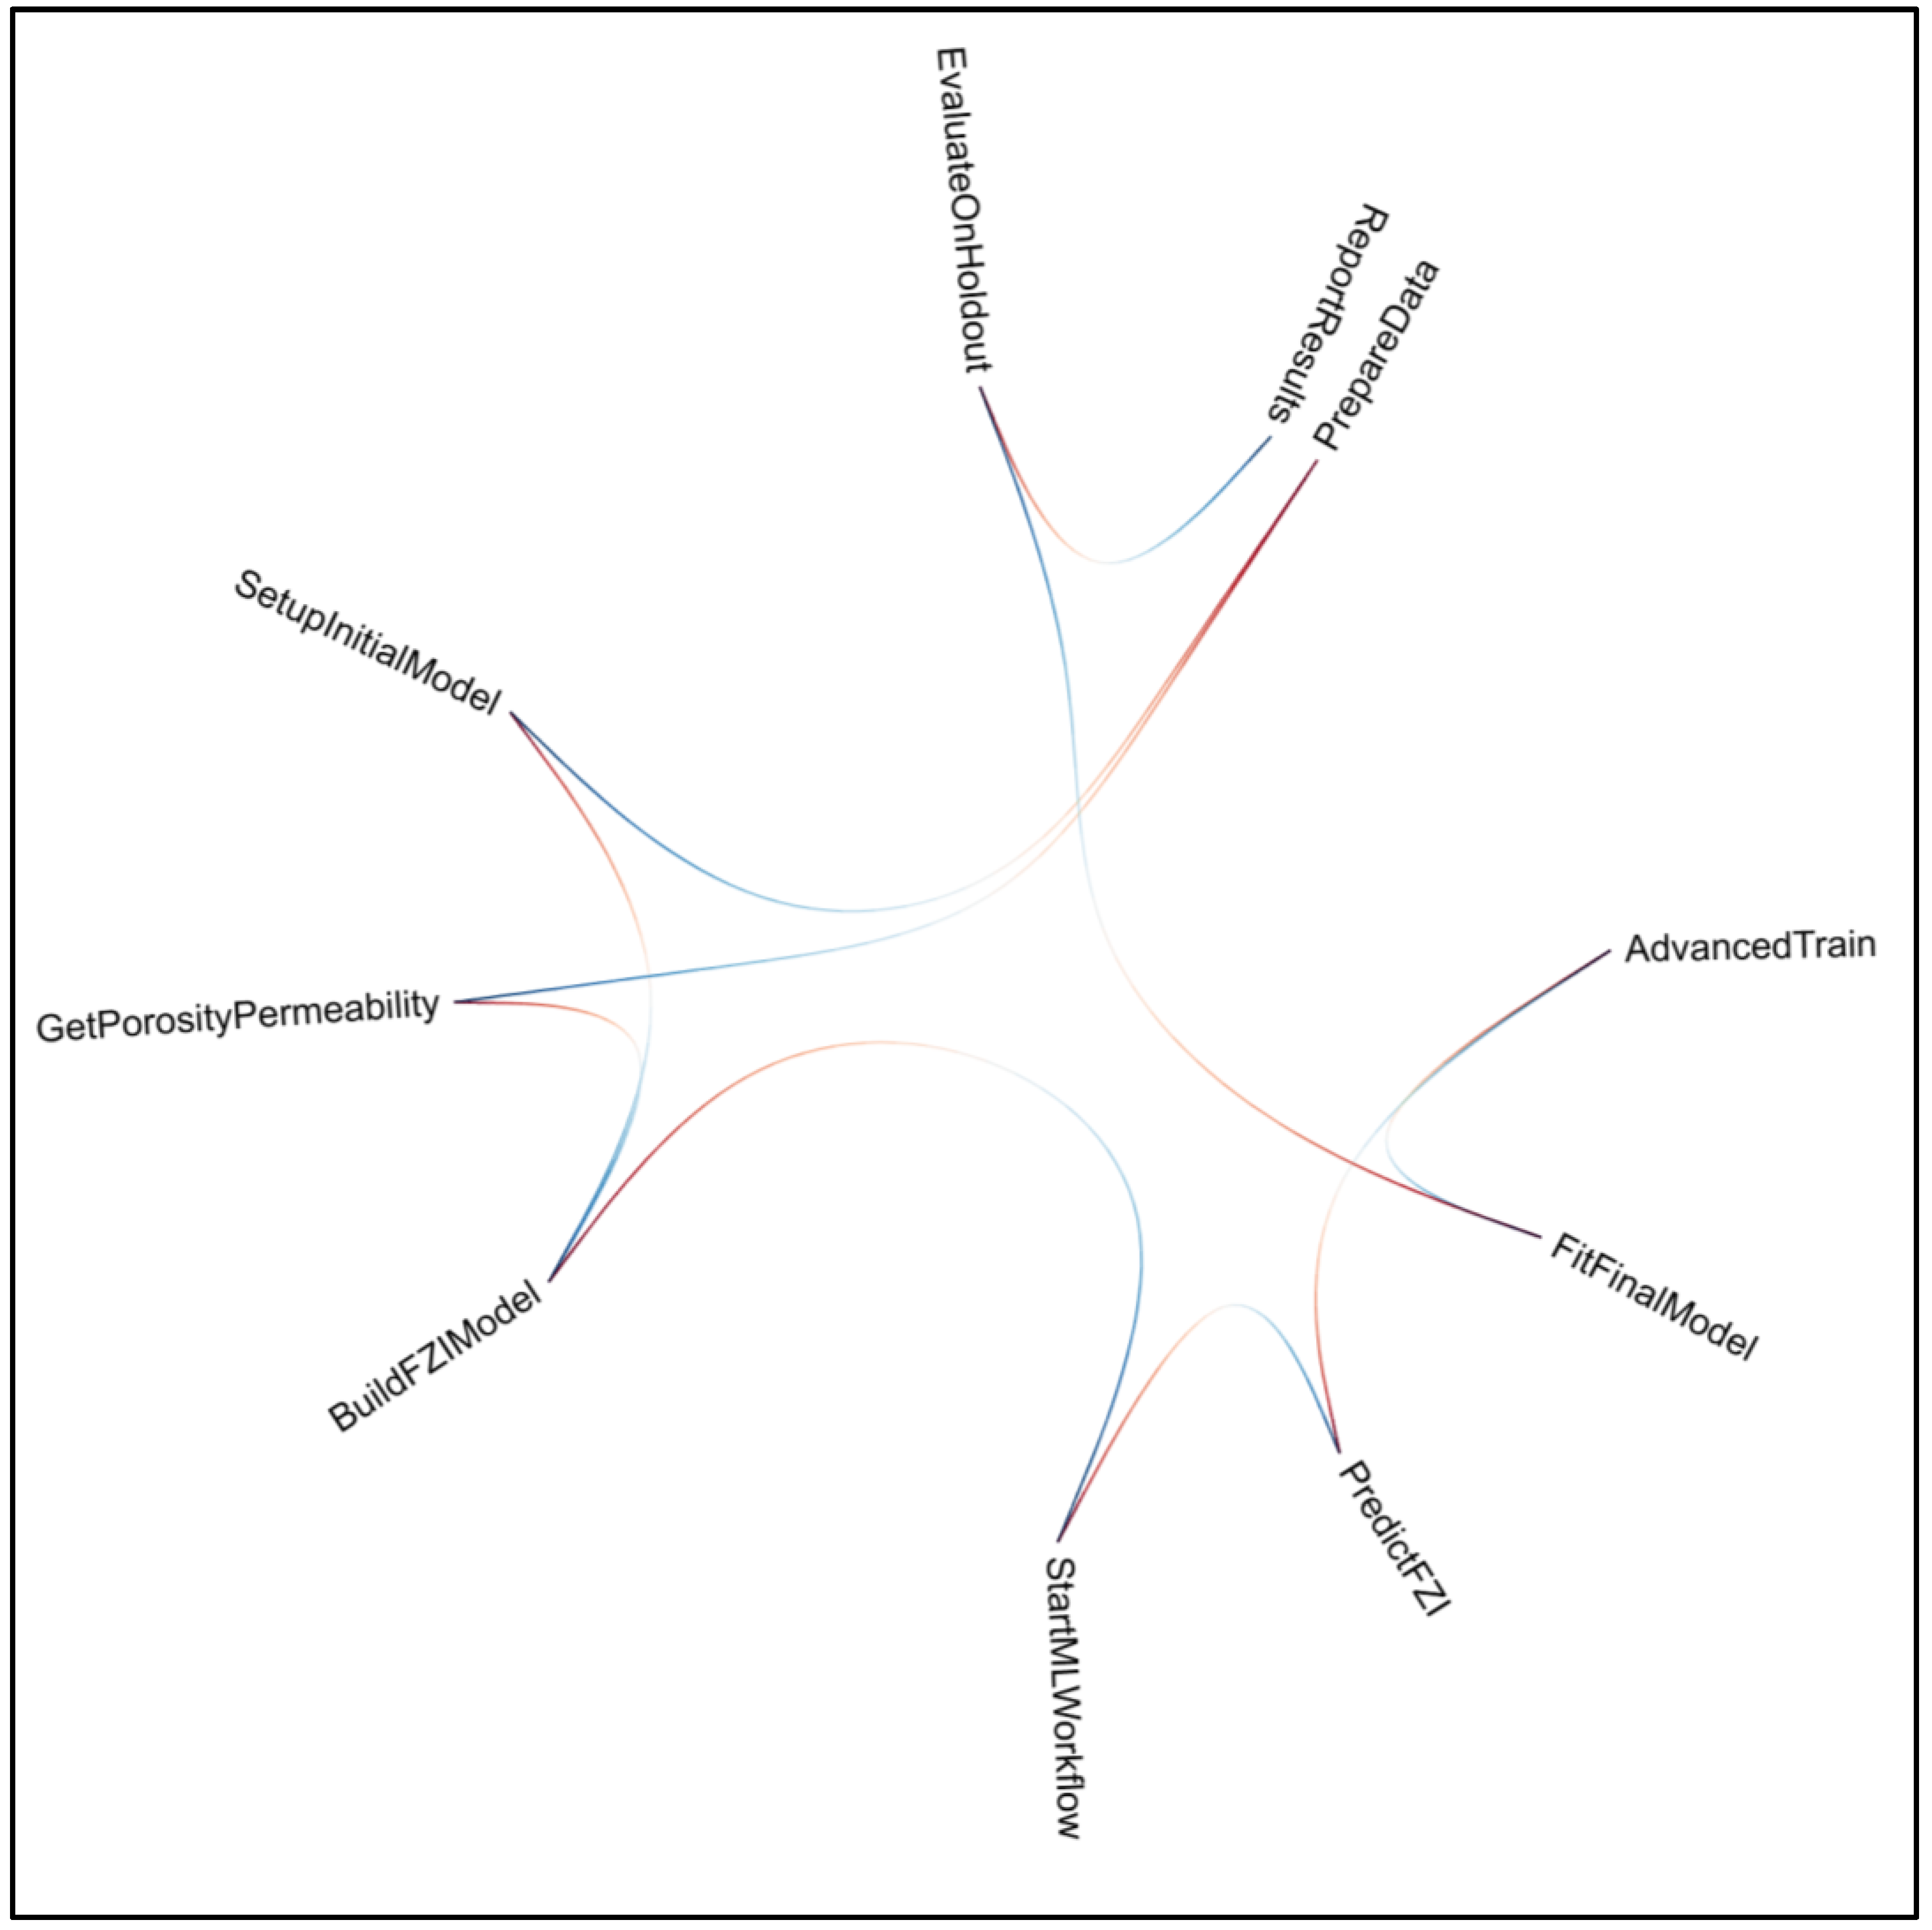
Figure 3.
Reservoir characterization plots illustrating key petrophysical properties from well data within the Szolnok Formation: (A) Permeability distribution across wells; (B) Effective porosity values; (C) Volume of shale (VSHA) content; (D) Volume of sand (VSND) content; (E) Cross-sectional representation of permeability distribution along wells, with Szolnok Formation thickness and depth indicated on the Y-axis. Wells are sorted from thickest (left) to thinnest (right).
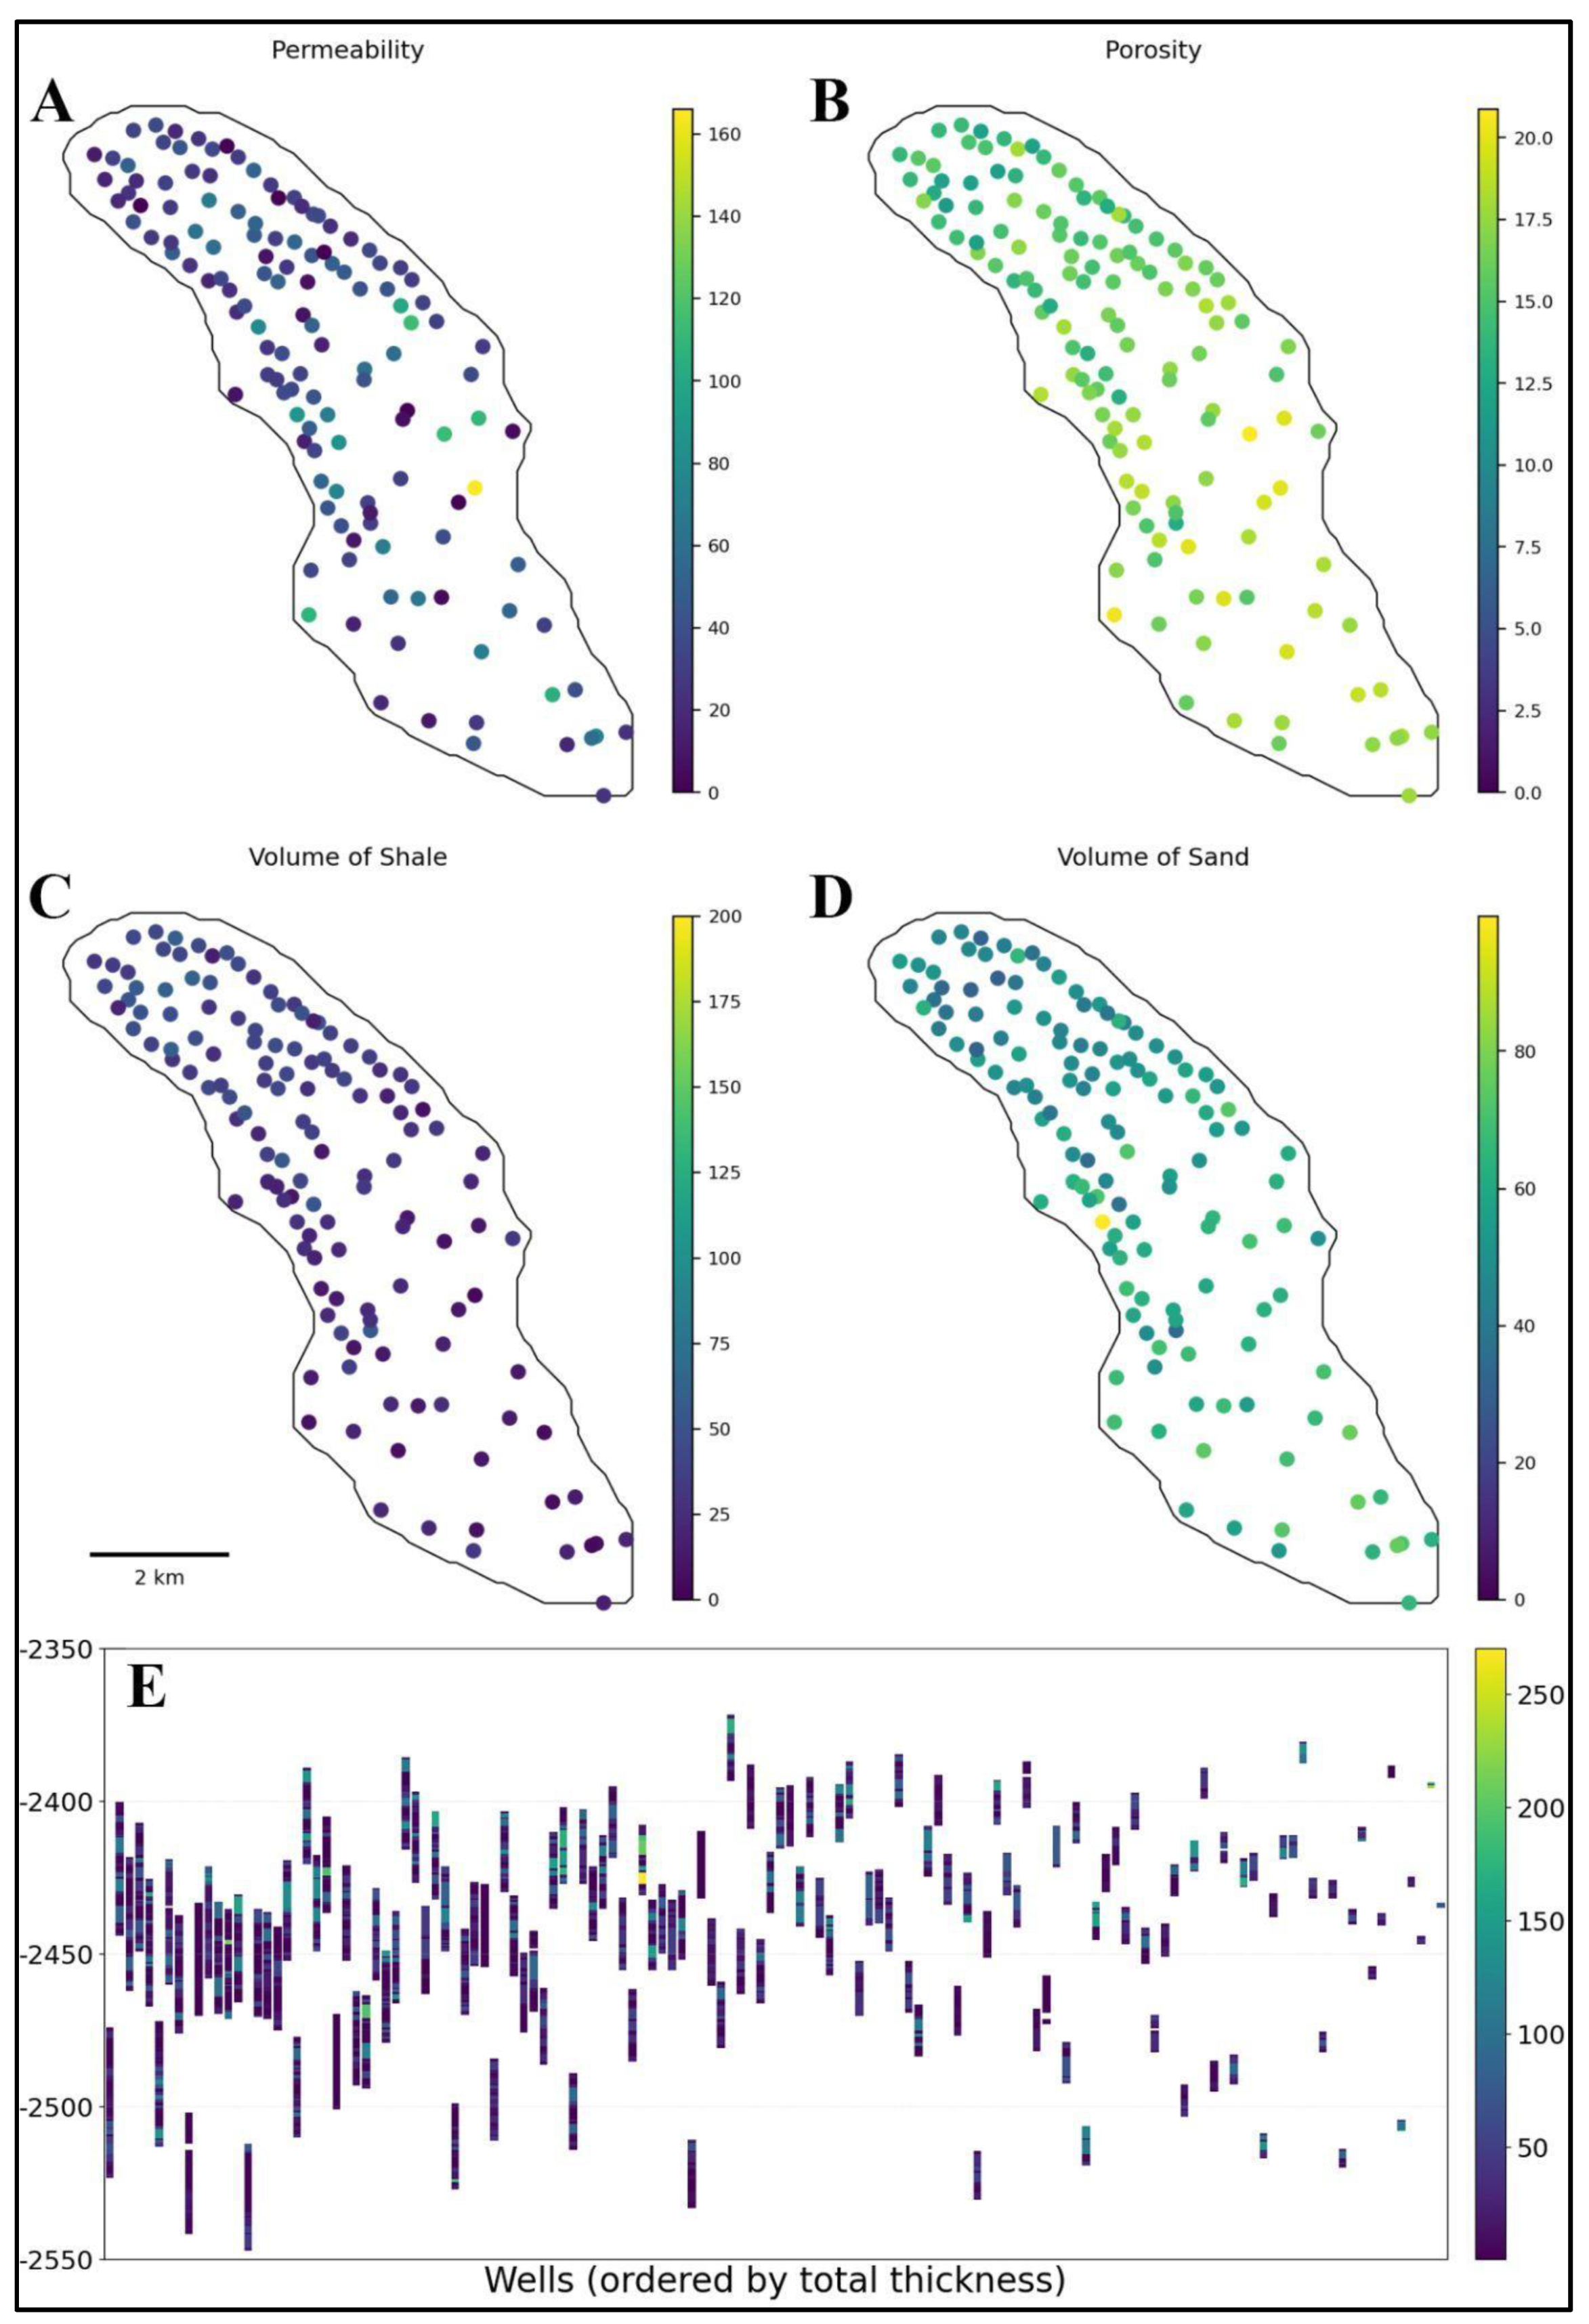
Figure 4.
Spatial and statistical representation of the Szolnok Formation thickness; the left panel displays a map illustrating reservoir thickness distribution across the study area, while the right panel shows the frequency distribution of thickness values.
Figure 4.
Spatial and statistical representation of the Szolnok Formation thickness; the left panel displays a map illustrating reservoir thickness distribution across the study area, while the right panel shows the frequency distribution of thickness values.
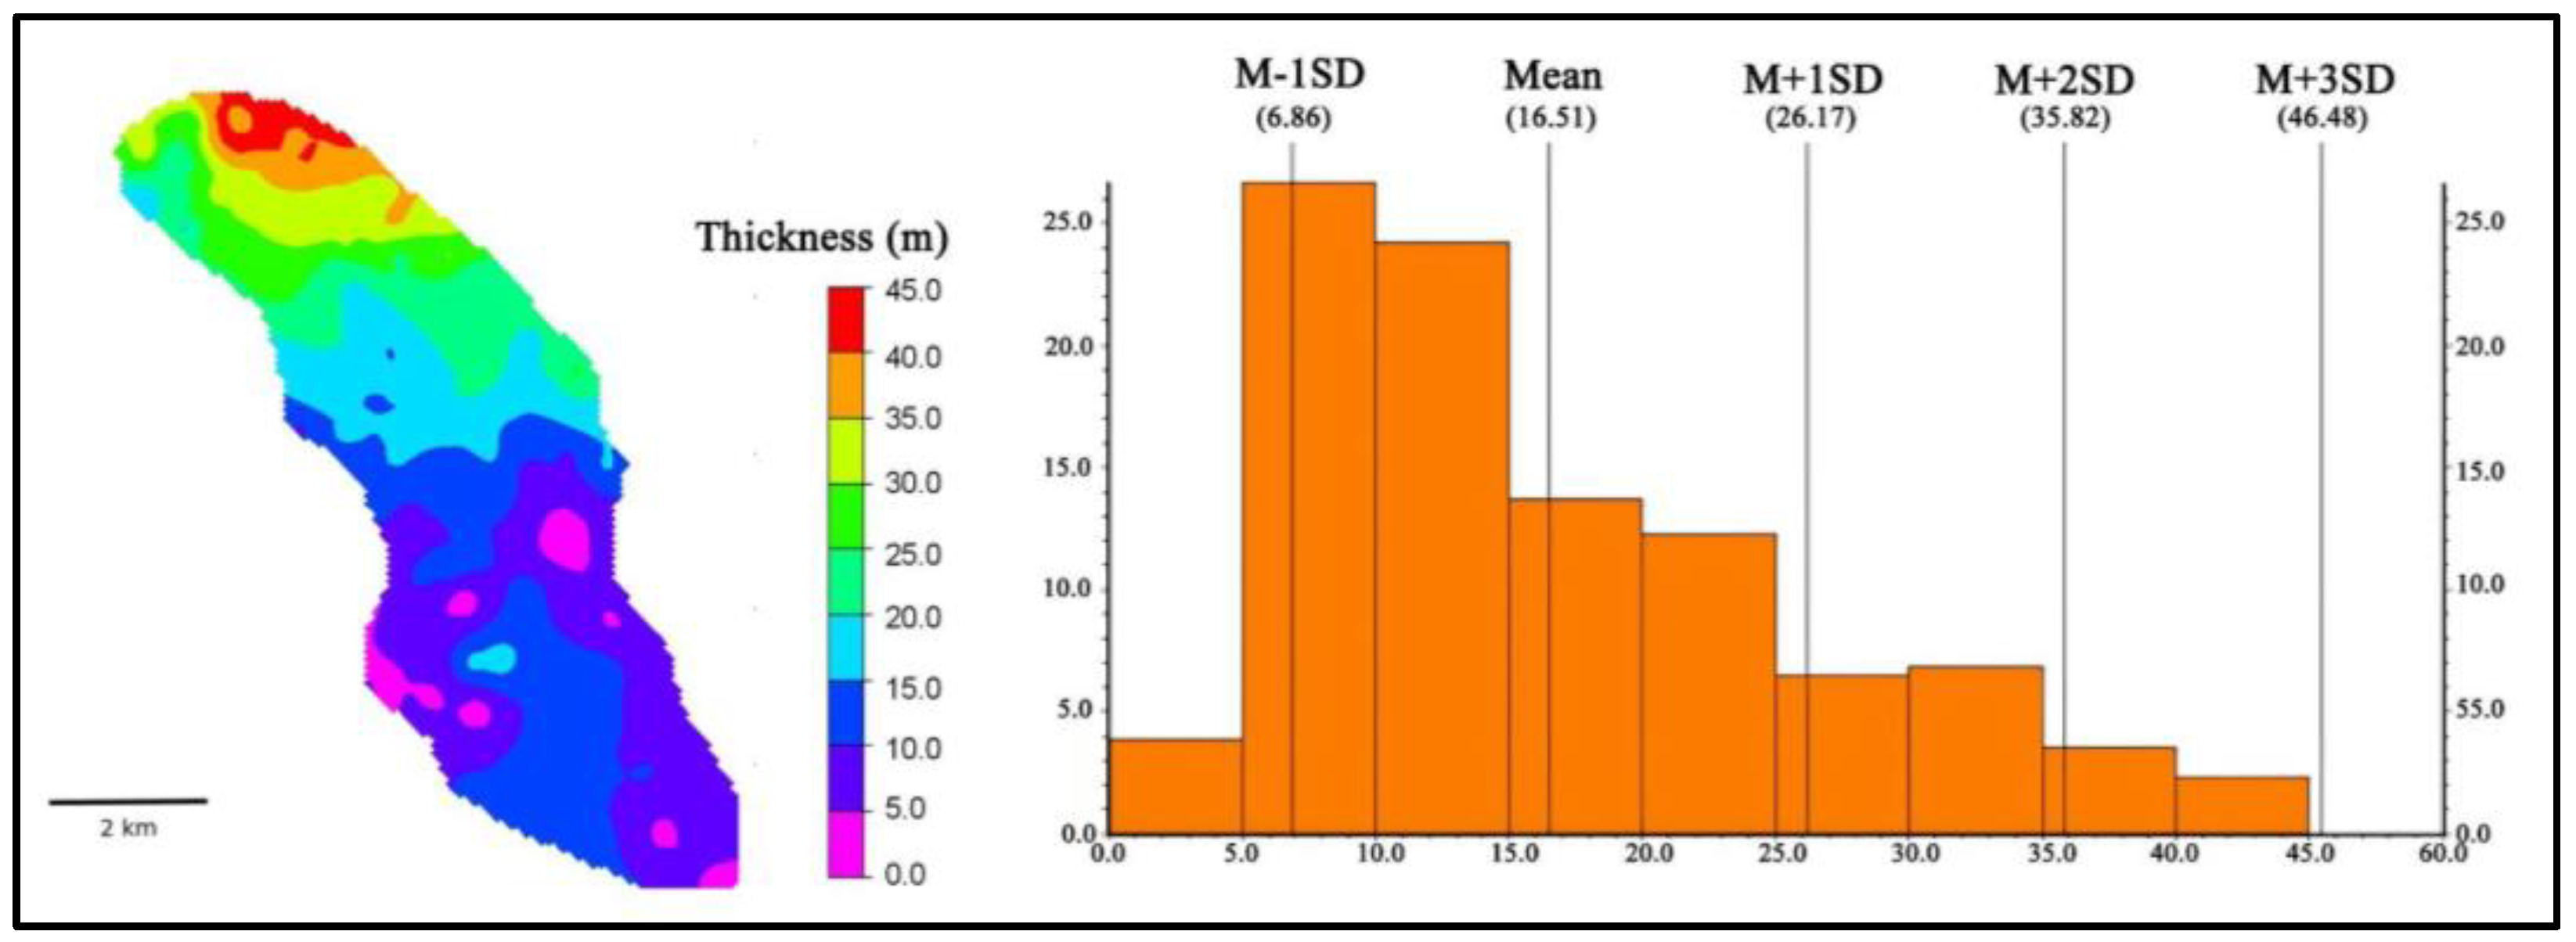
Figure 5.
Spatial distribution maps of modelled Flow Zone Index (FZI) values; the left map represents the predicted FZI values using Inverse Distance Weighted (IDW) interpolation, while the right map highlights regions with FZI greater than 4.5, indicative of potential sand-rich channel systems.
Figure 5.
Spatial distribution maps of modelled Flow Zone Index (FZI) values; the left map represents the predicted FZI values using Inverse Distance Weighted (IDW) interpolation, while the right map highlights regions with FZI greater than 4.5, indicative of potential sand-rich channel systems.
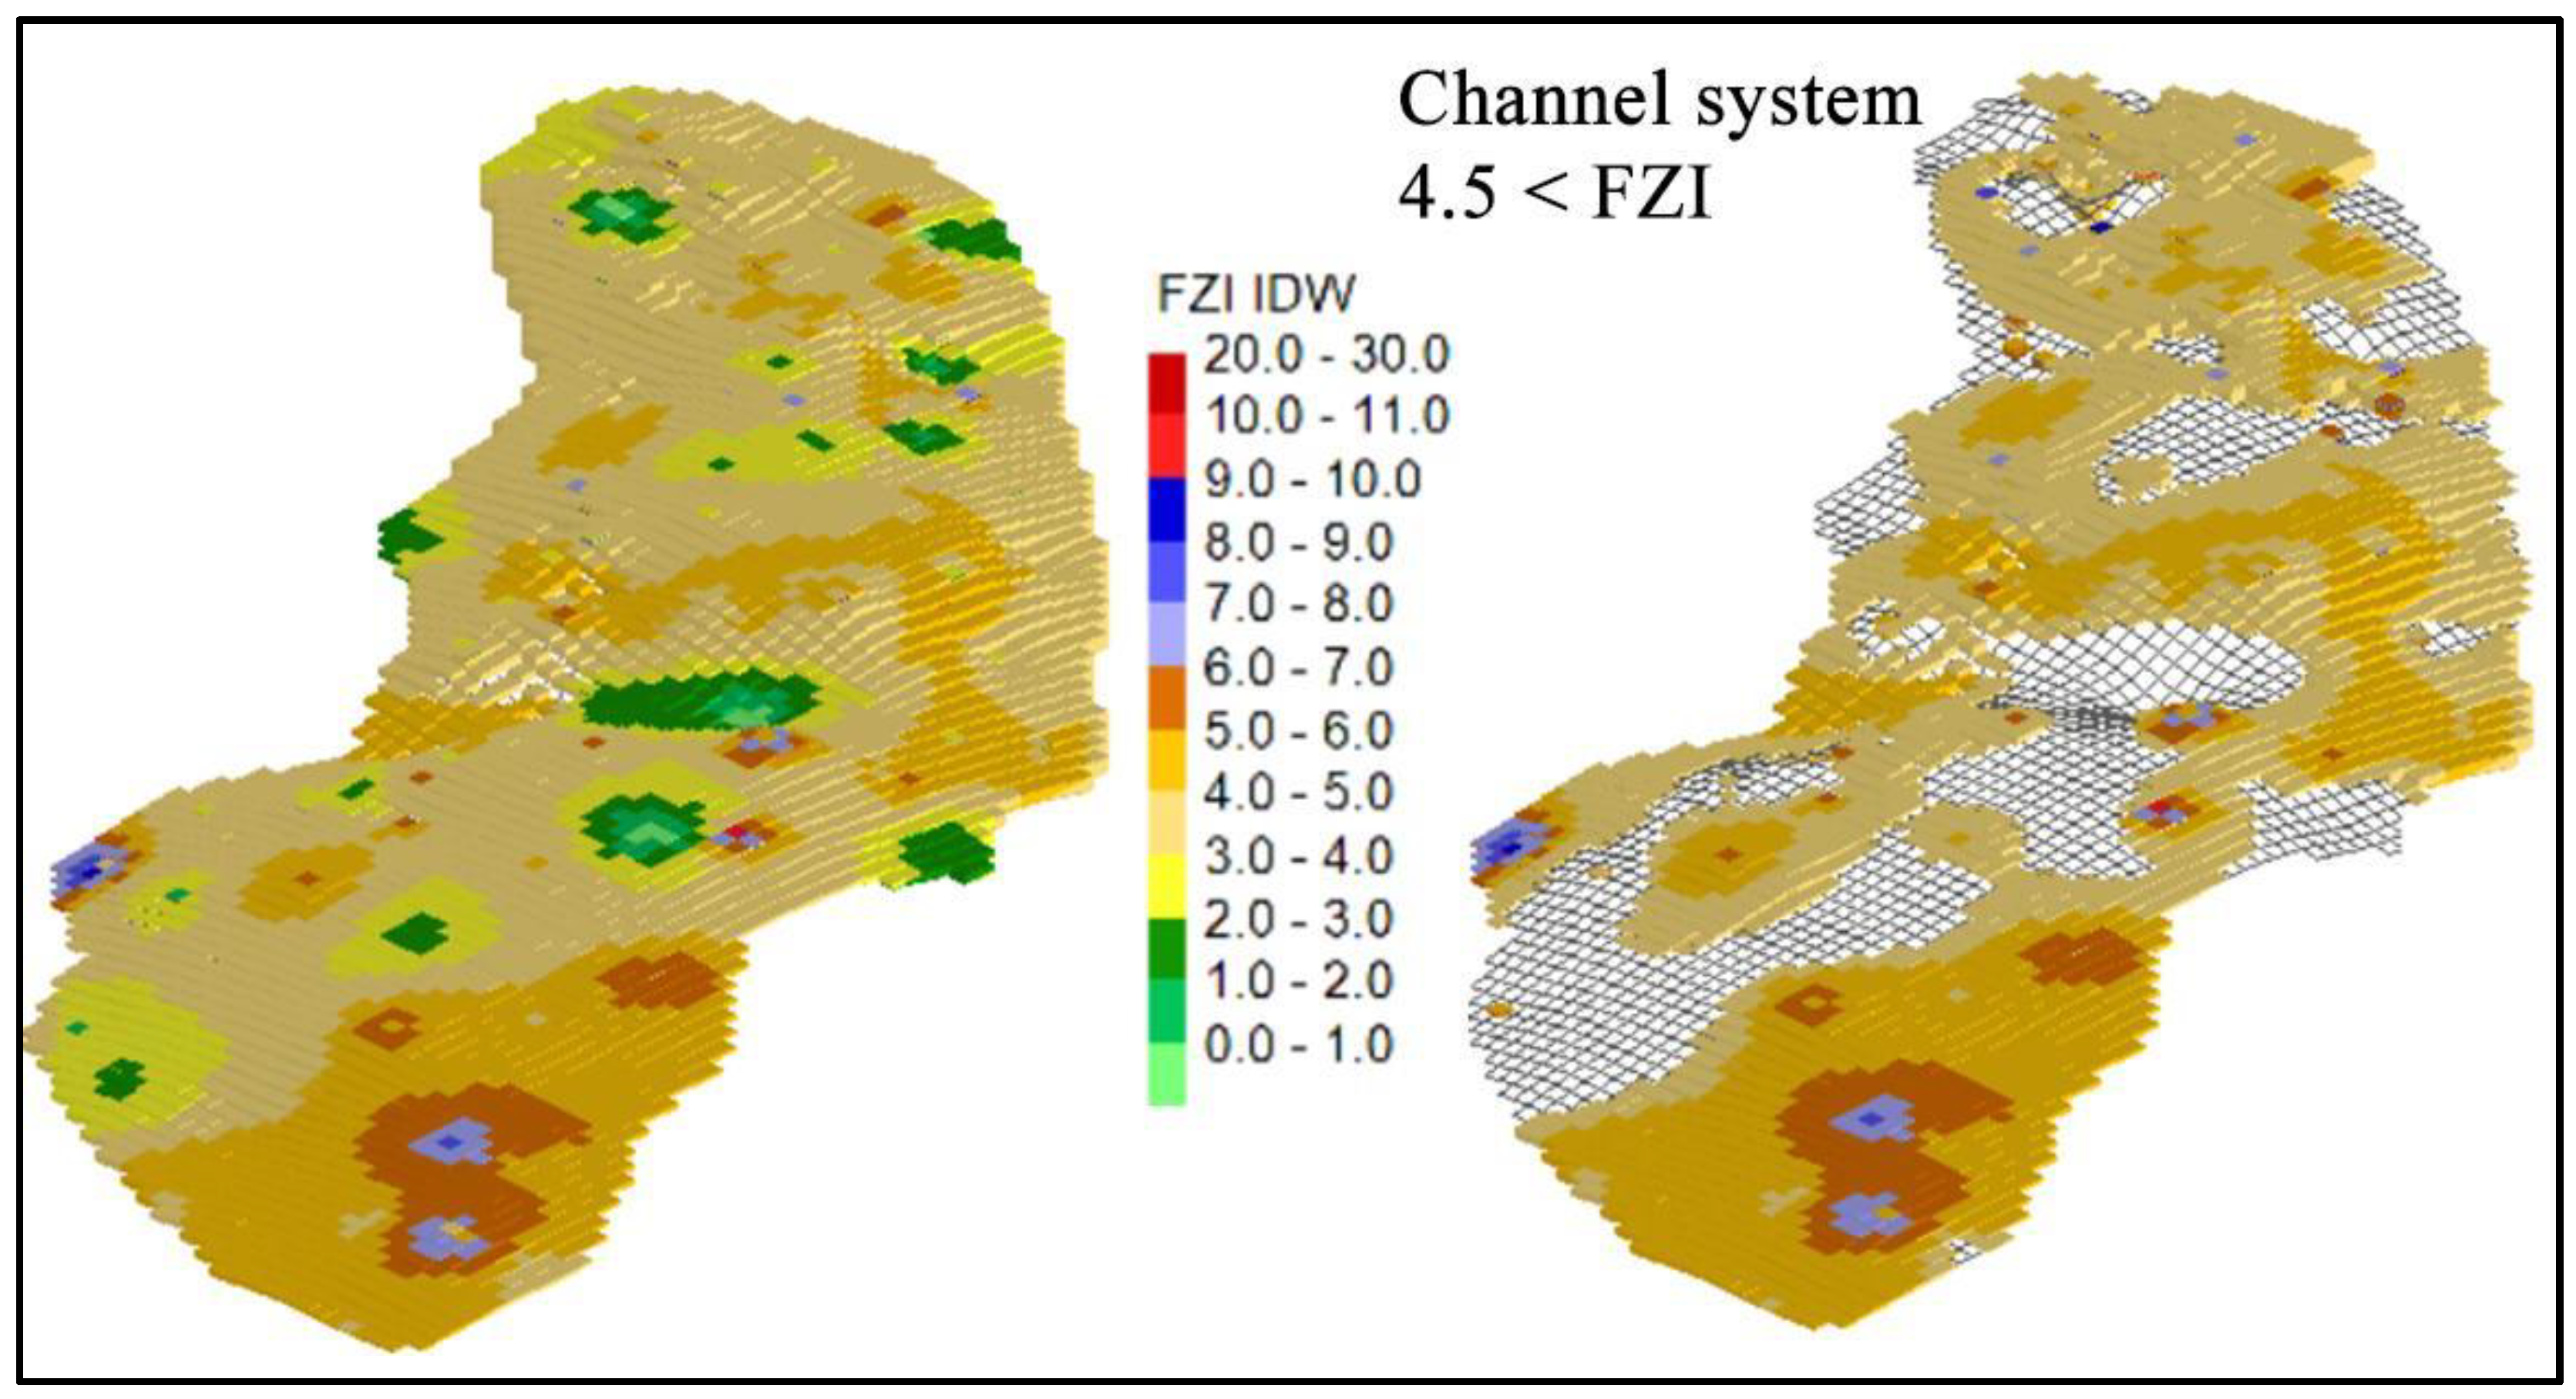
Figure 6.
Feature importance based on the XGBoost regression model, ranked by gain, highlighting key petrophysical attributes and derived features that most significantly contributed to predicting sand-channel distributions within the Szolnok Formation.
Figure 6.
Feature importance based on the XGBoost regression model, ranked by gain, highlighting key petrophysical attributes and derived features that most significantly contributed to predicting sand-channel distributions within the Szolnok Formation.
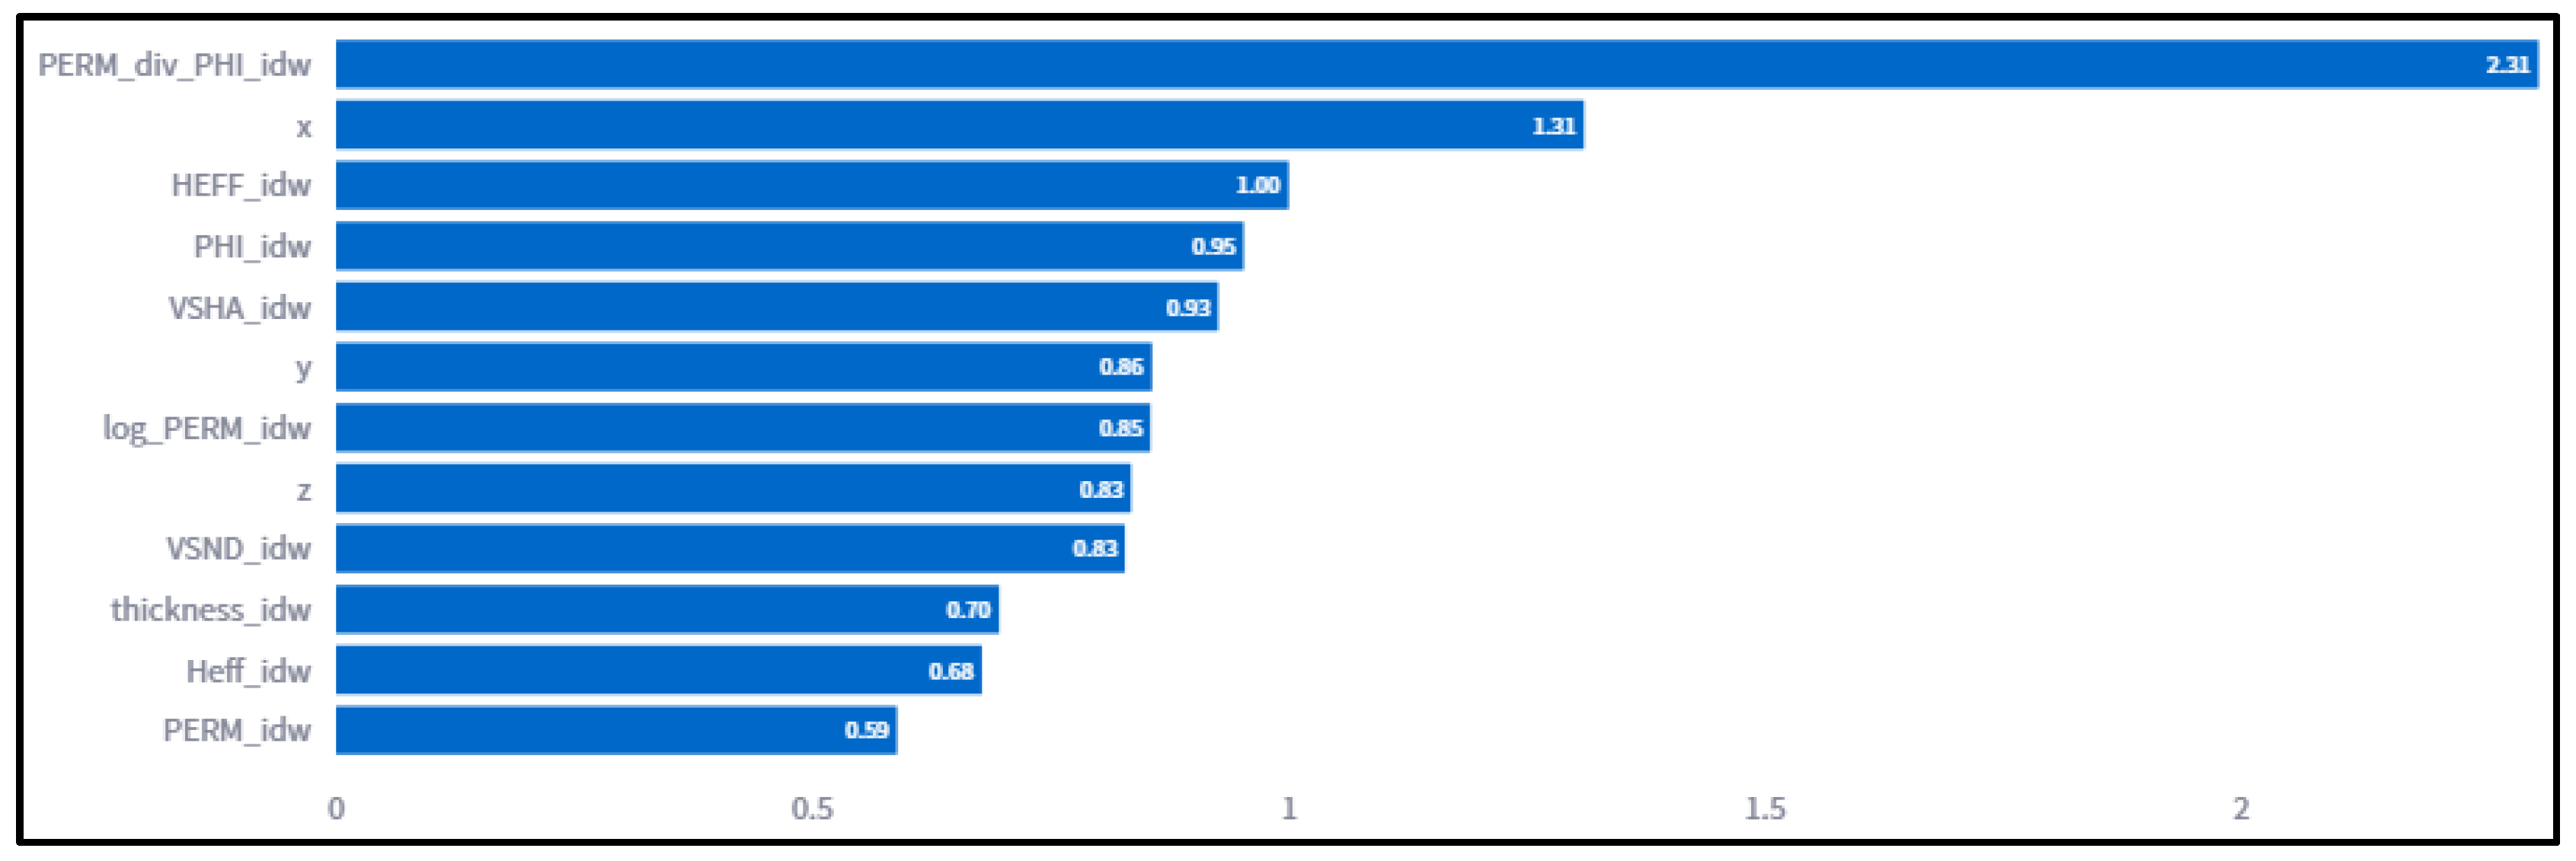
Figure 7.
Radial flow chart depicting the structured workflow of this research. Red nodes represent input stages, such as loading and preprocessing data, while blue nodes indicate output stages, including model predictions, validation, and generation of final maps and quality control charts. Arrows illustrate the directional data flow and method dependencies throughout the analysis pipeline.
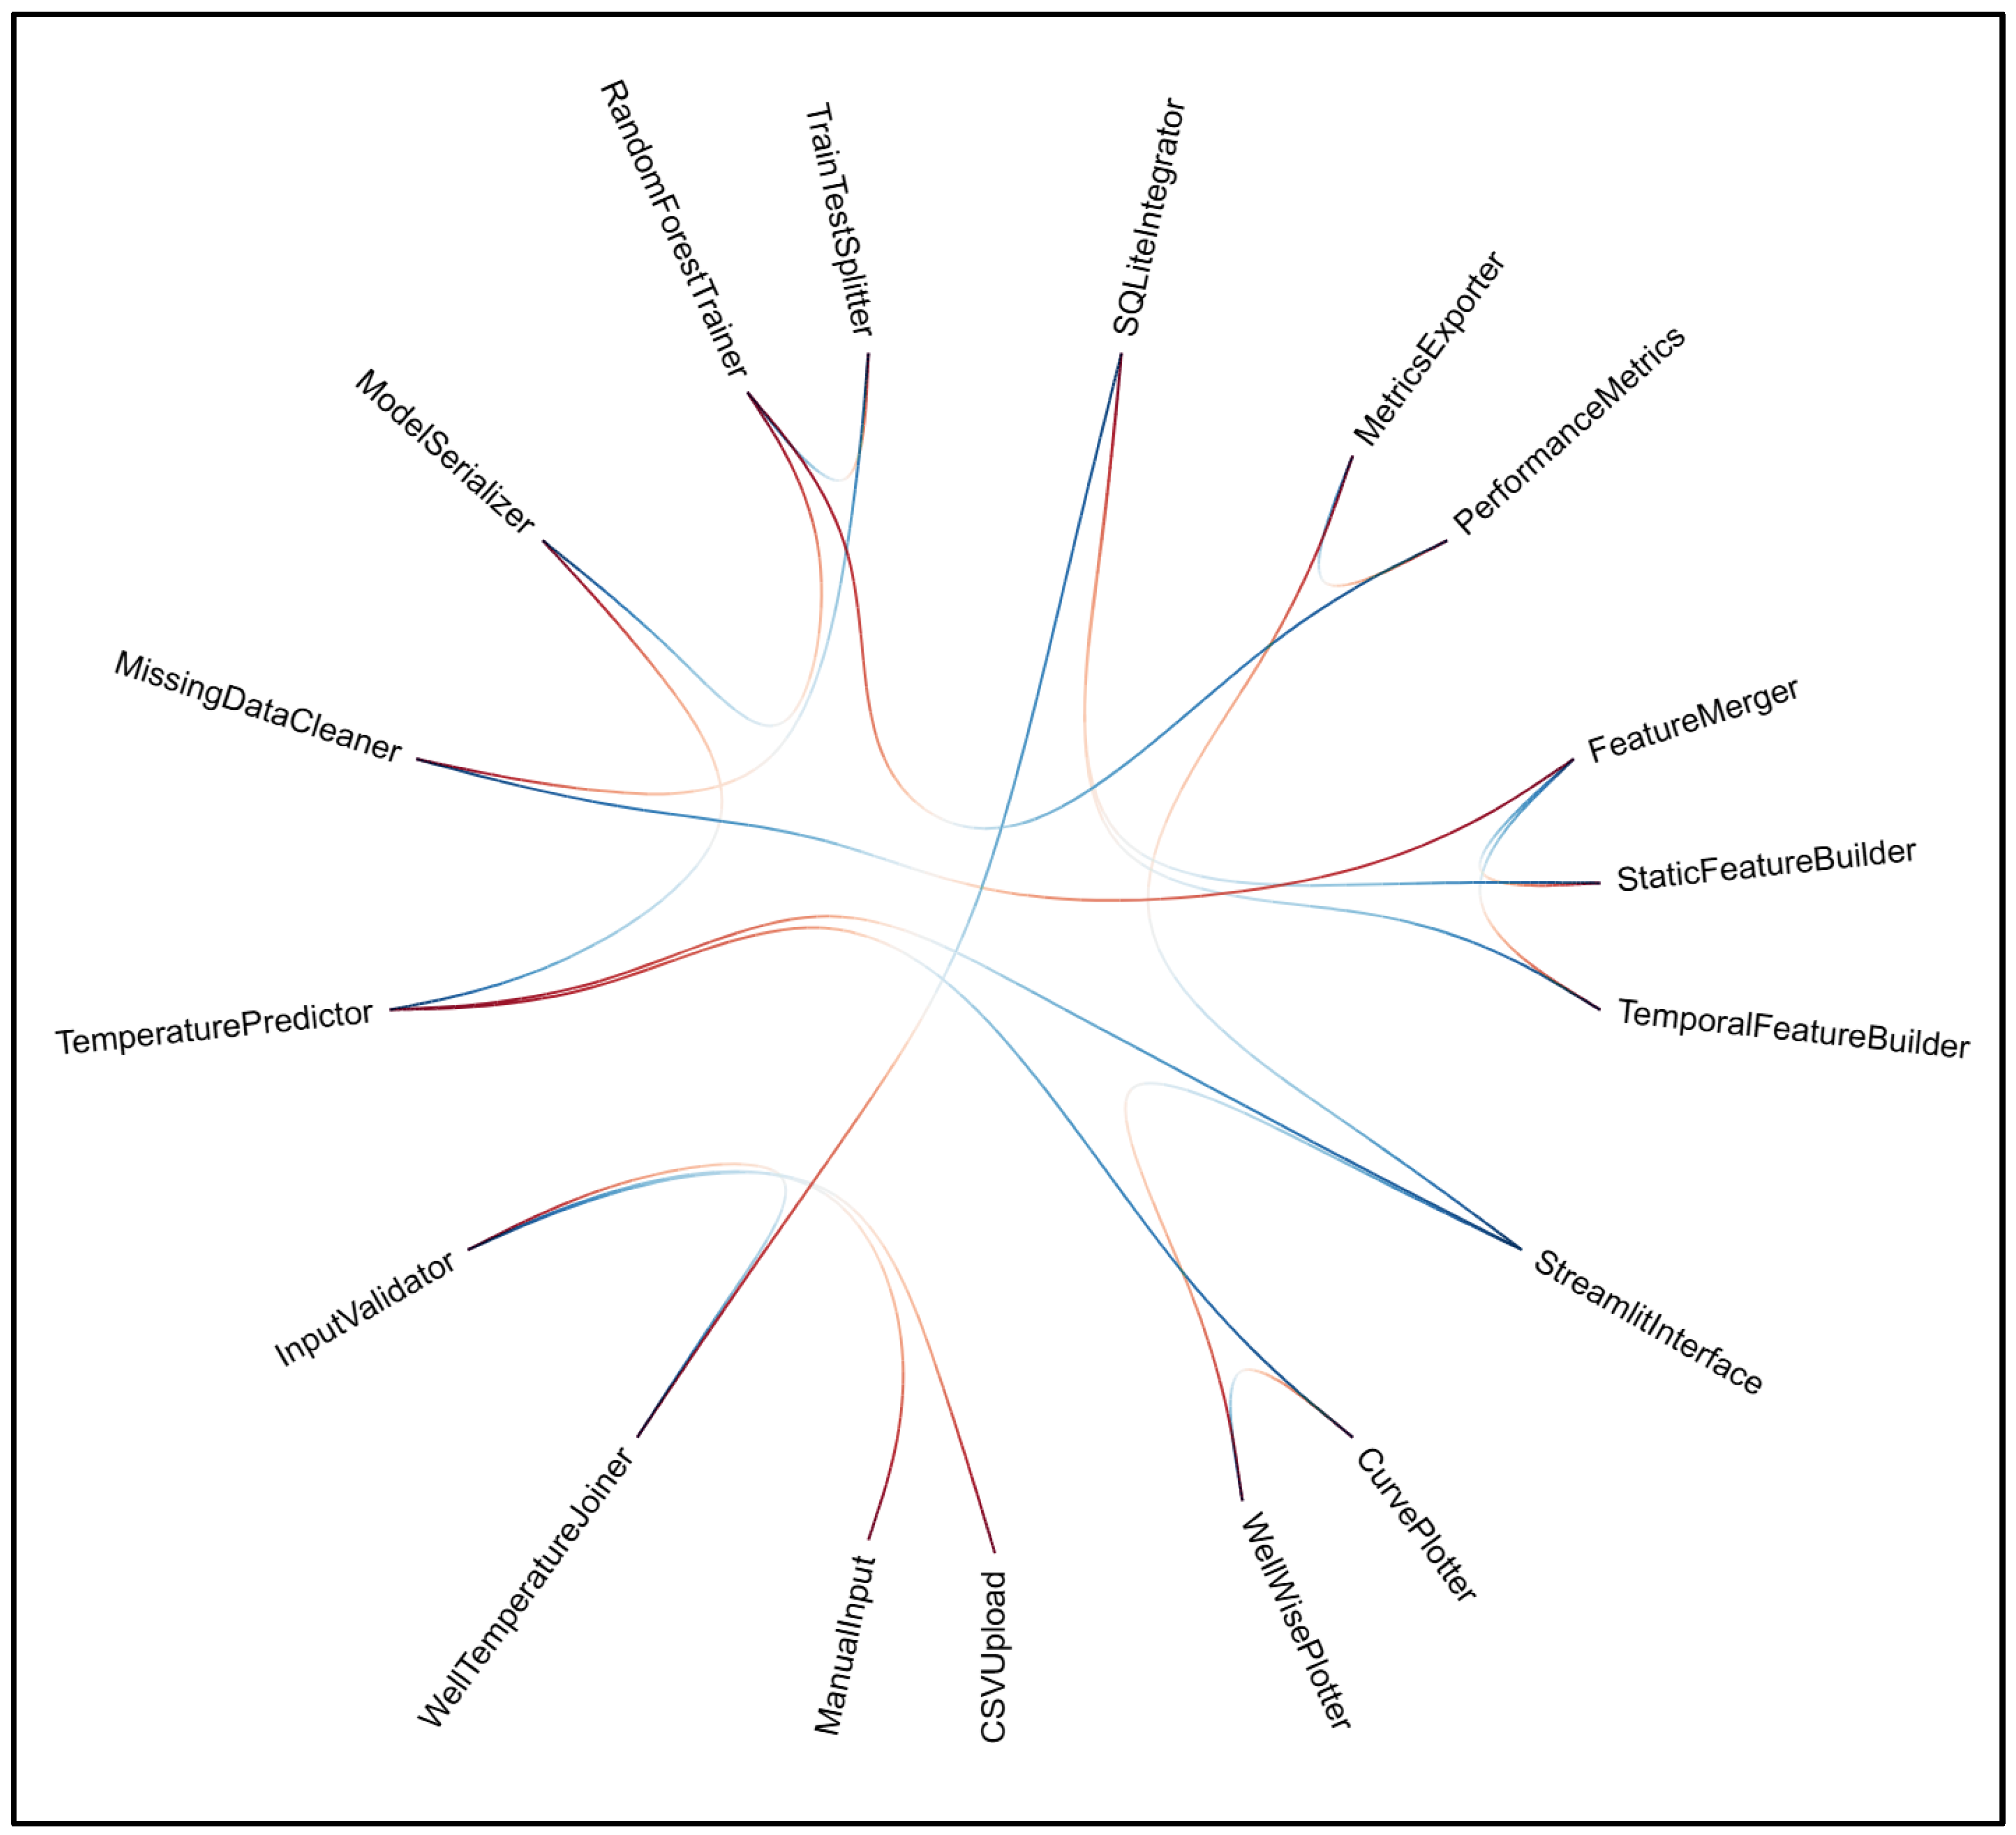
Figure 8.
A; Normalized maps illustrating spatial distributions of Flow Zone Index (FZI), B; sand content (VSND), and C; shale content (VSHA). D; Scatter plots showing correlations between normalized FZI and sand content (positive correlation, r=0.333, p<0.001) and E; shale content (negative correlation, r=-0.384, p<0.001), highlighting sandy channels.
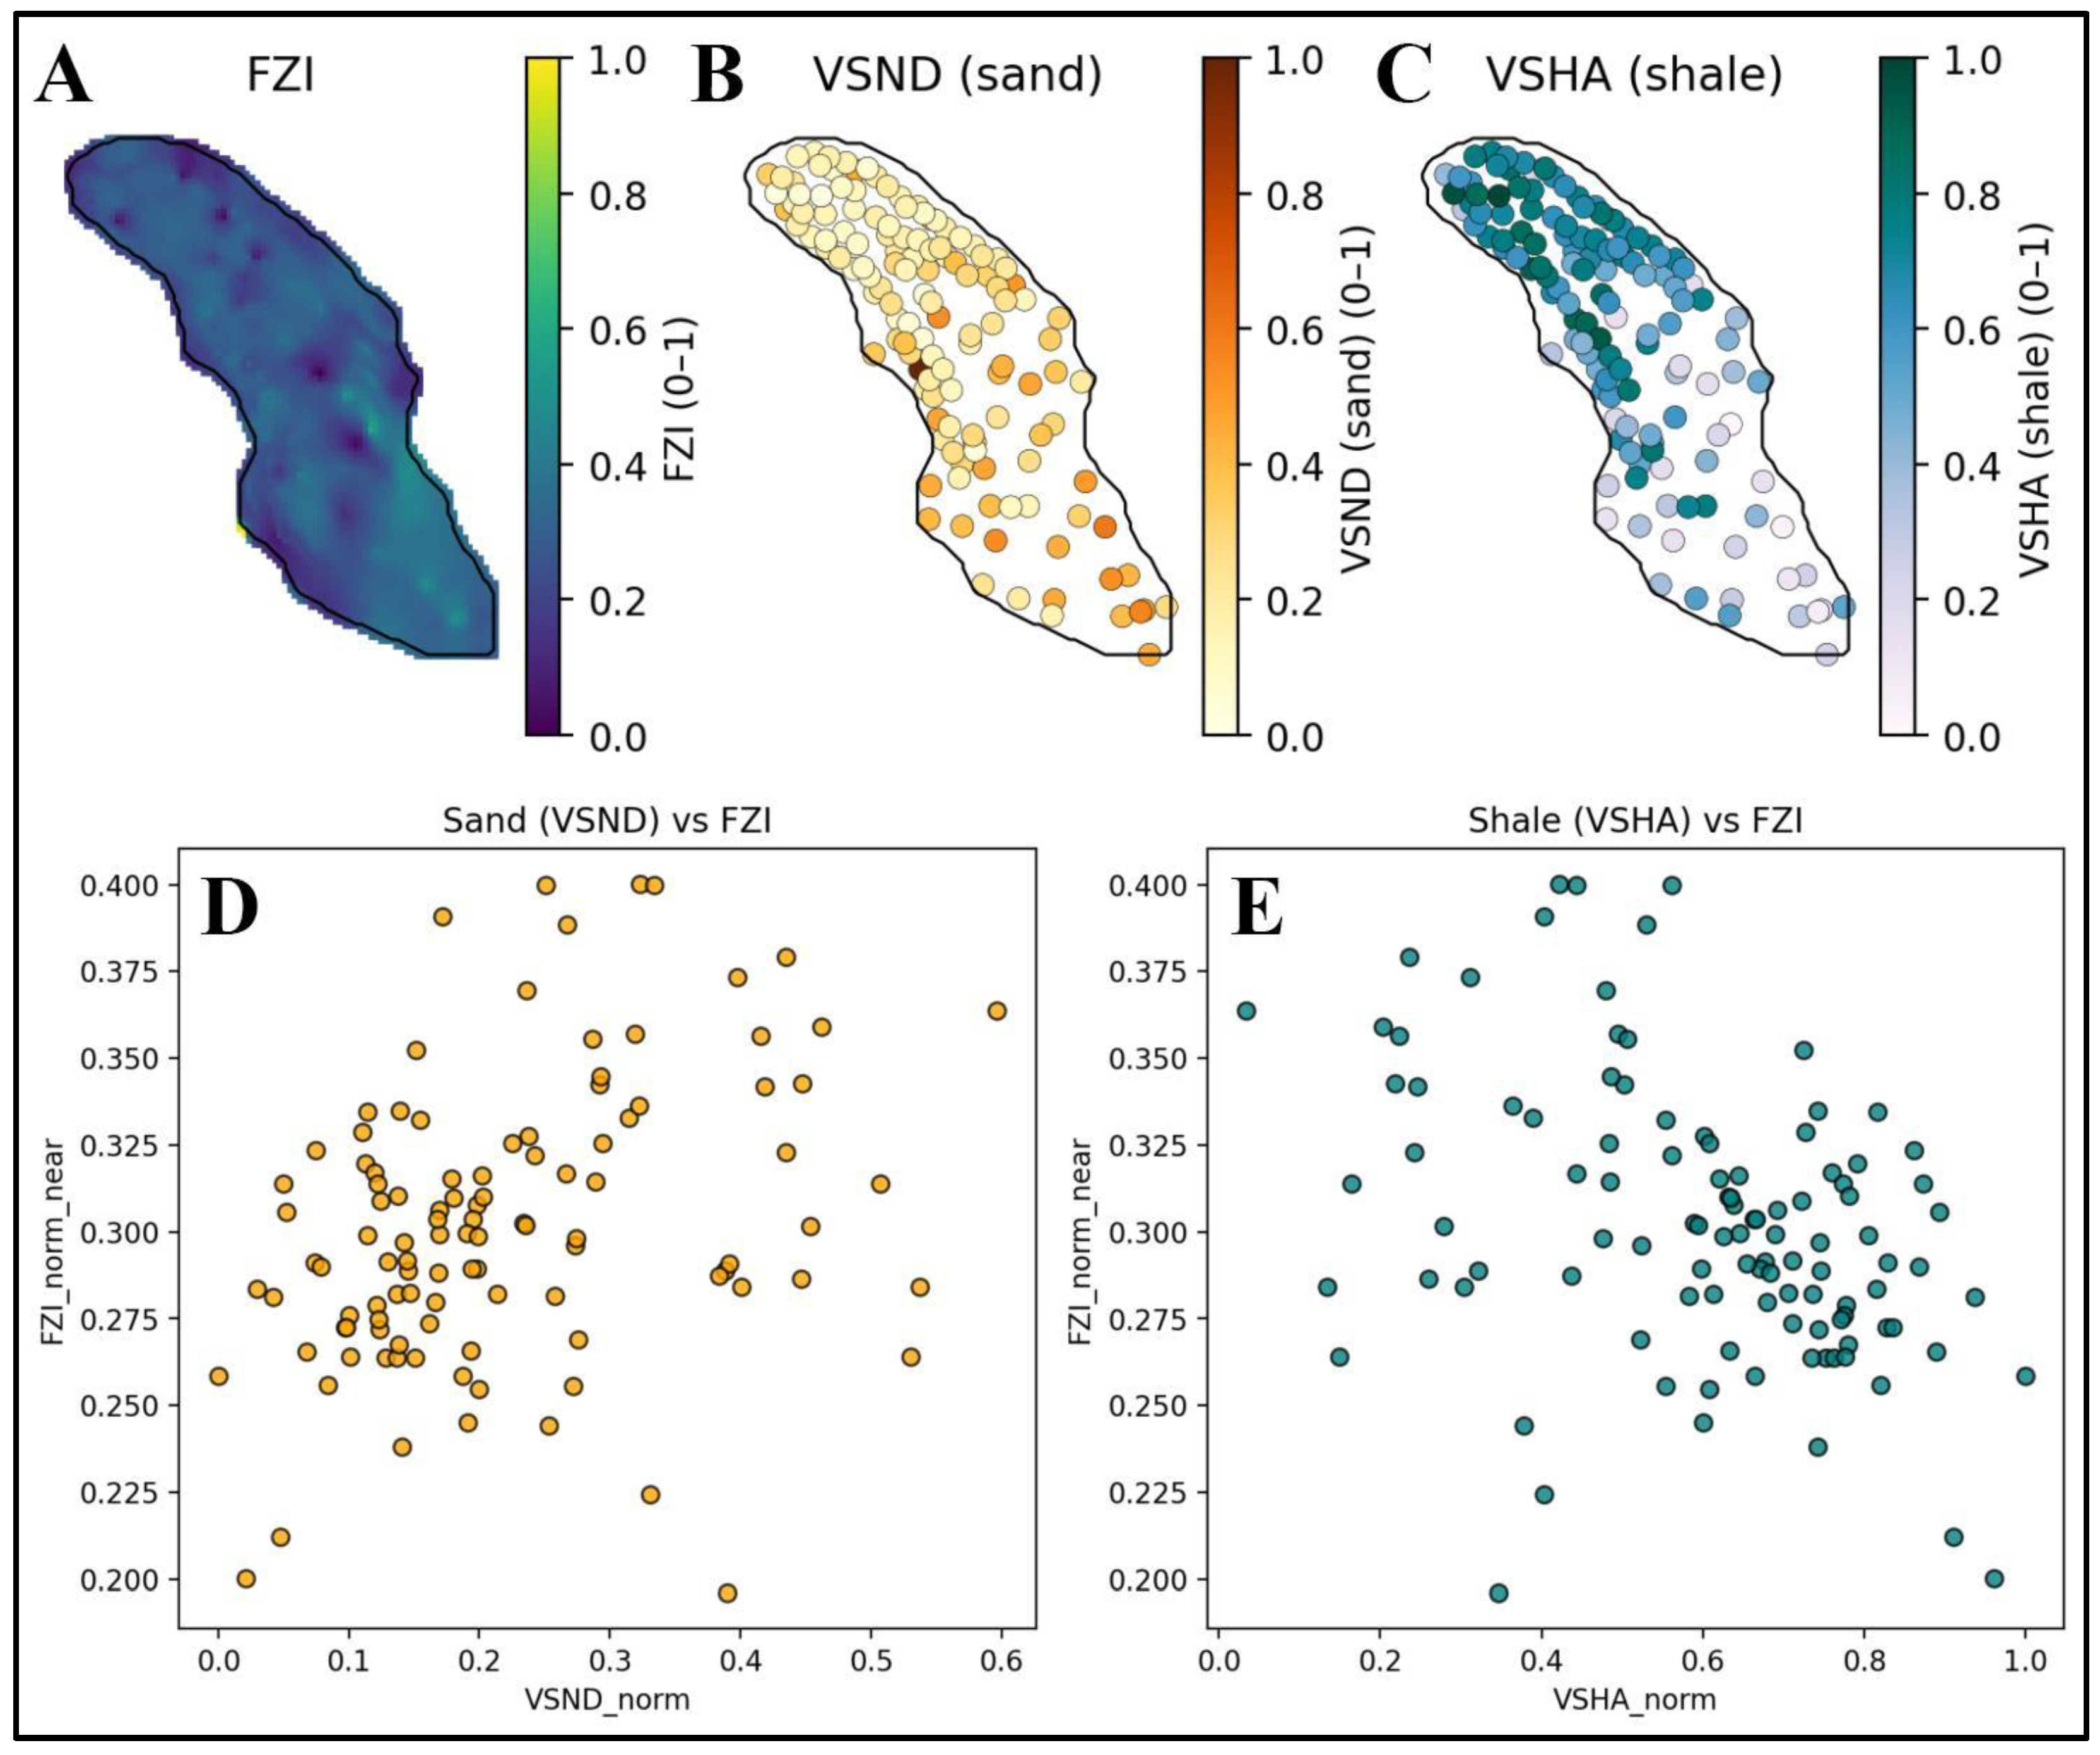
Figure 9.
Observed versus predicted Flow Zone Index (FZI) values from the 20% validation dataset, highlighting strong model performance . The dashed line indicates a perfect prediction (1:1 line), illustrating the model’s accuracy in capturing subsurface heterogeneity.
Figure 9.
Observed versus predicted Flow Zone Index (FZI) values from the 20% validation dataset, highlighting strong model performance . The dashed line indicates a perfect prediction (1:1 line), illustrating the model’s accuracy in capturing subsurface heterogeneity.
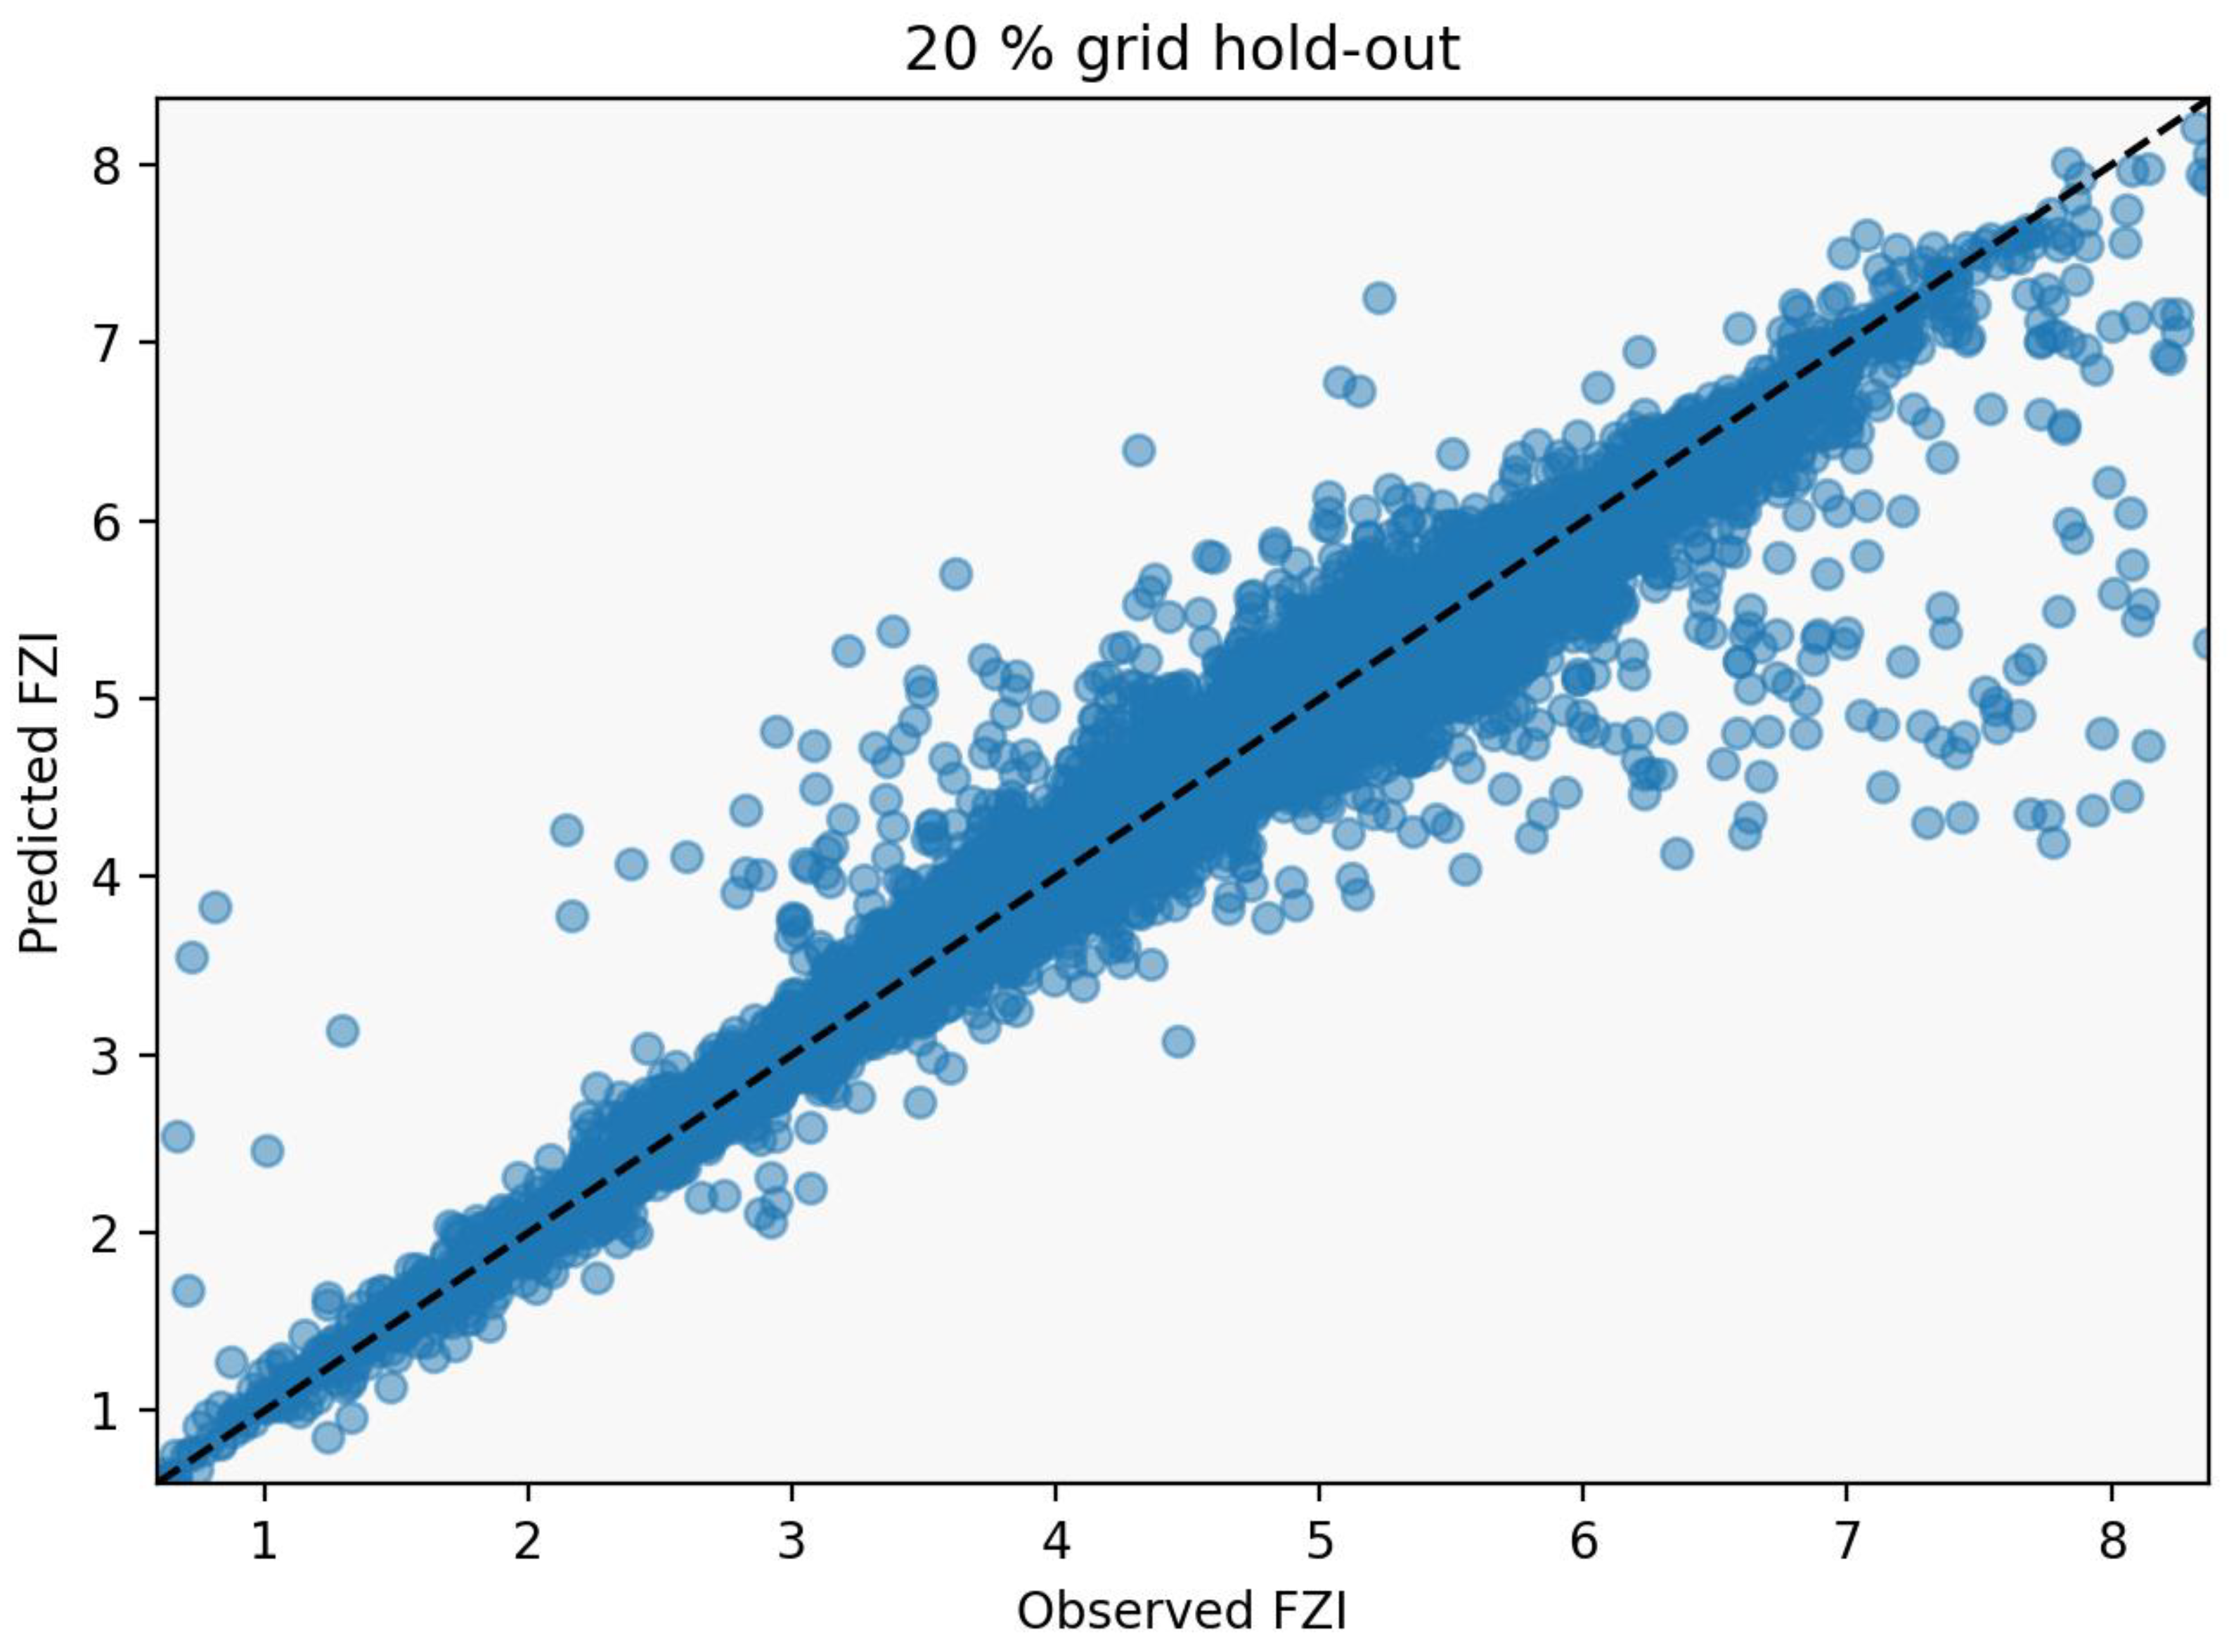
Figure 10.
Variance map showing the mean residuals (Predicted minus Actual FZI). The spatial distribution highlights minimal prediction errors, characterized by negligible bias.
Figure 10.
Variance map showing the mean residuals (Predicted minus Actual FZI). The spatial distribution highlights minimal prediction errors, characterized by negligible bias.
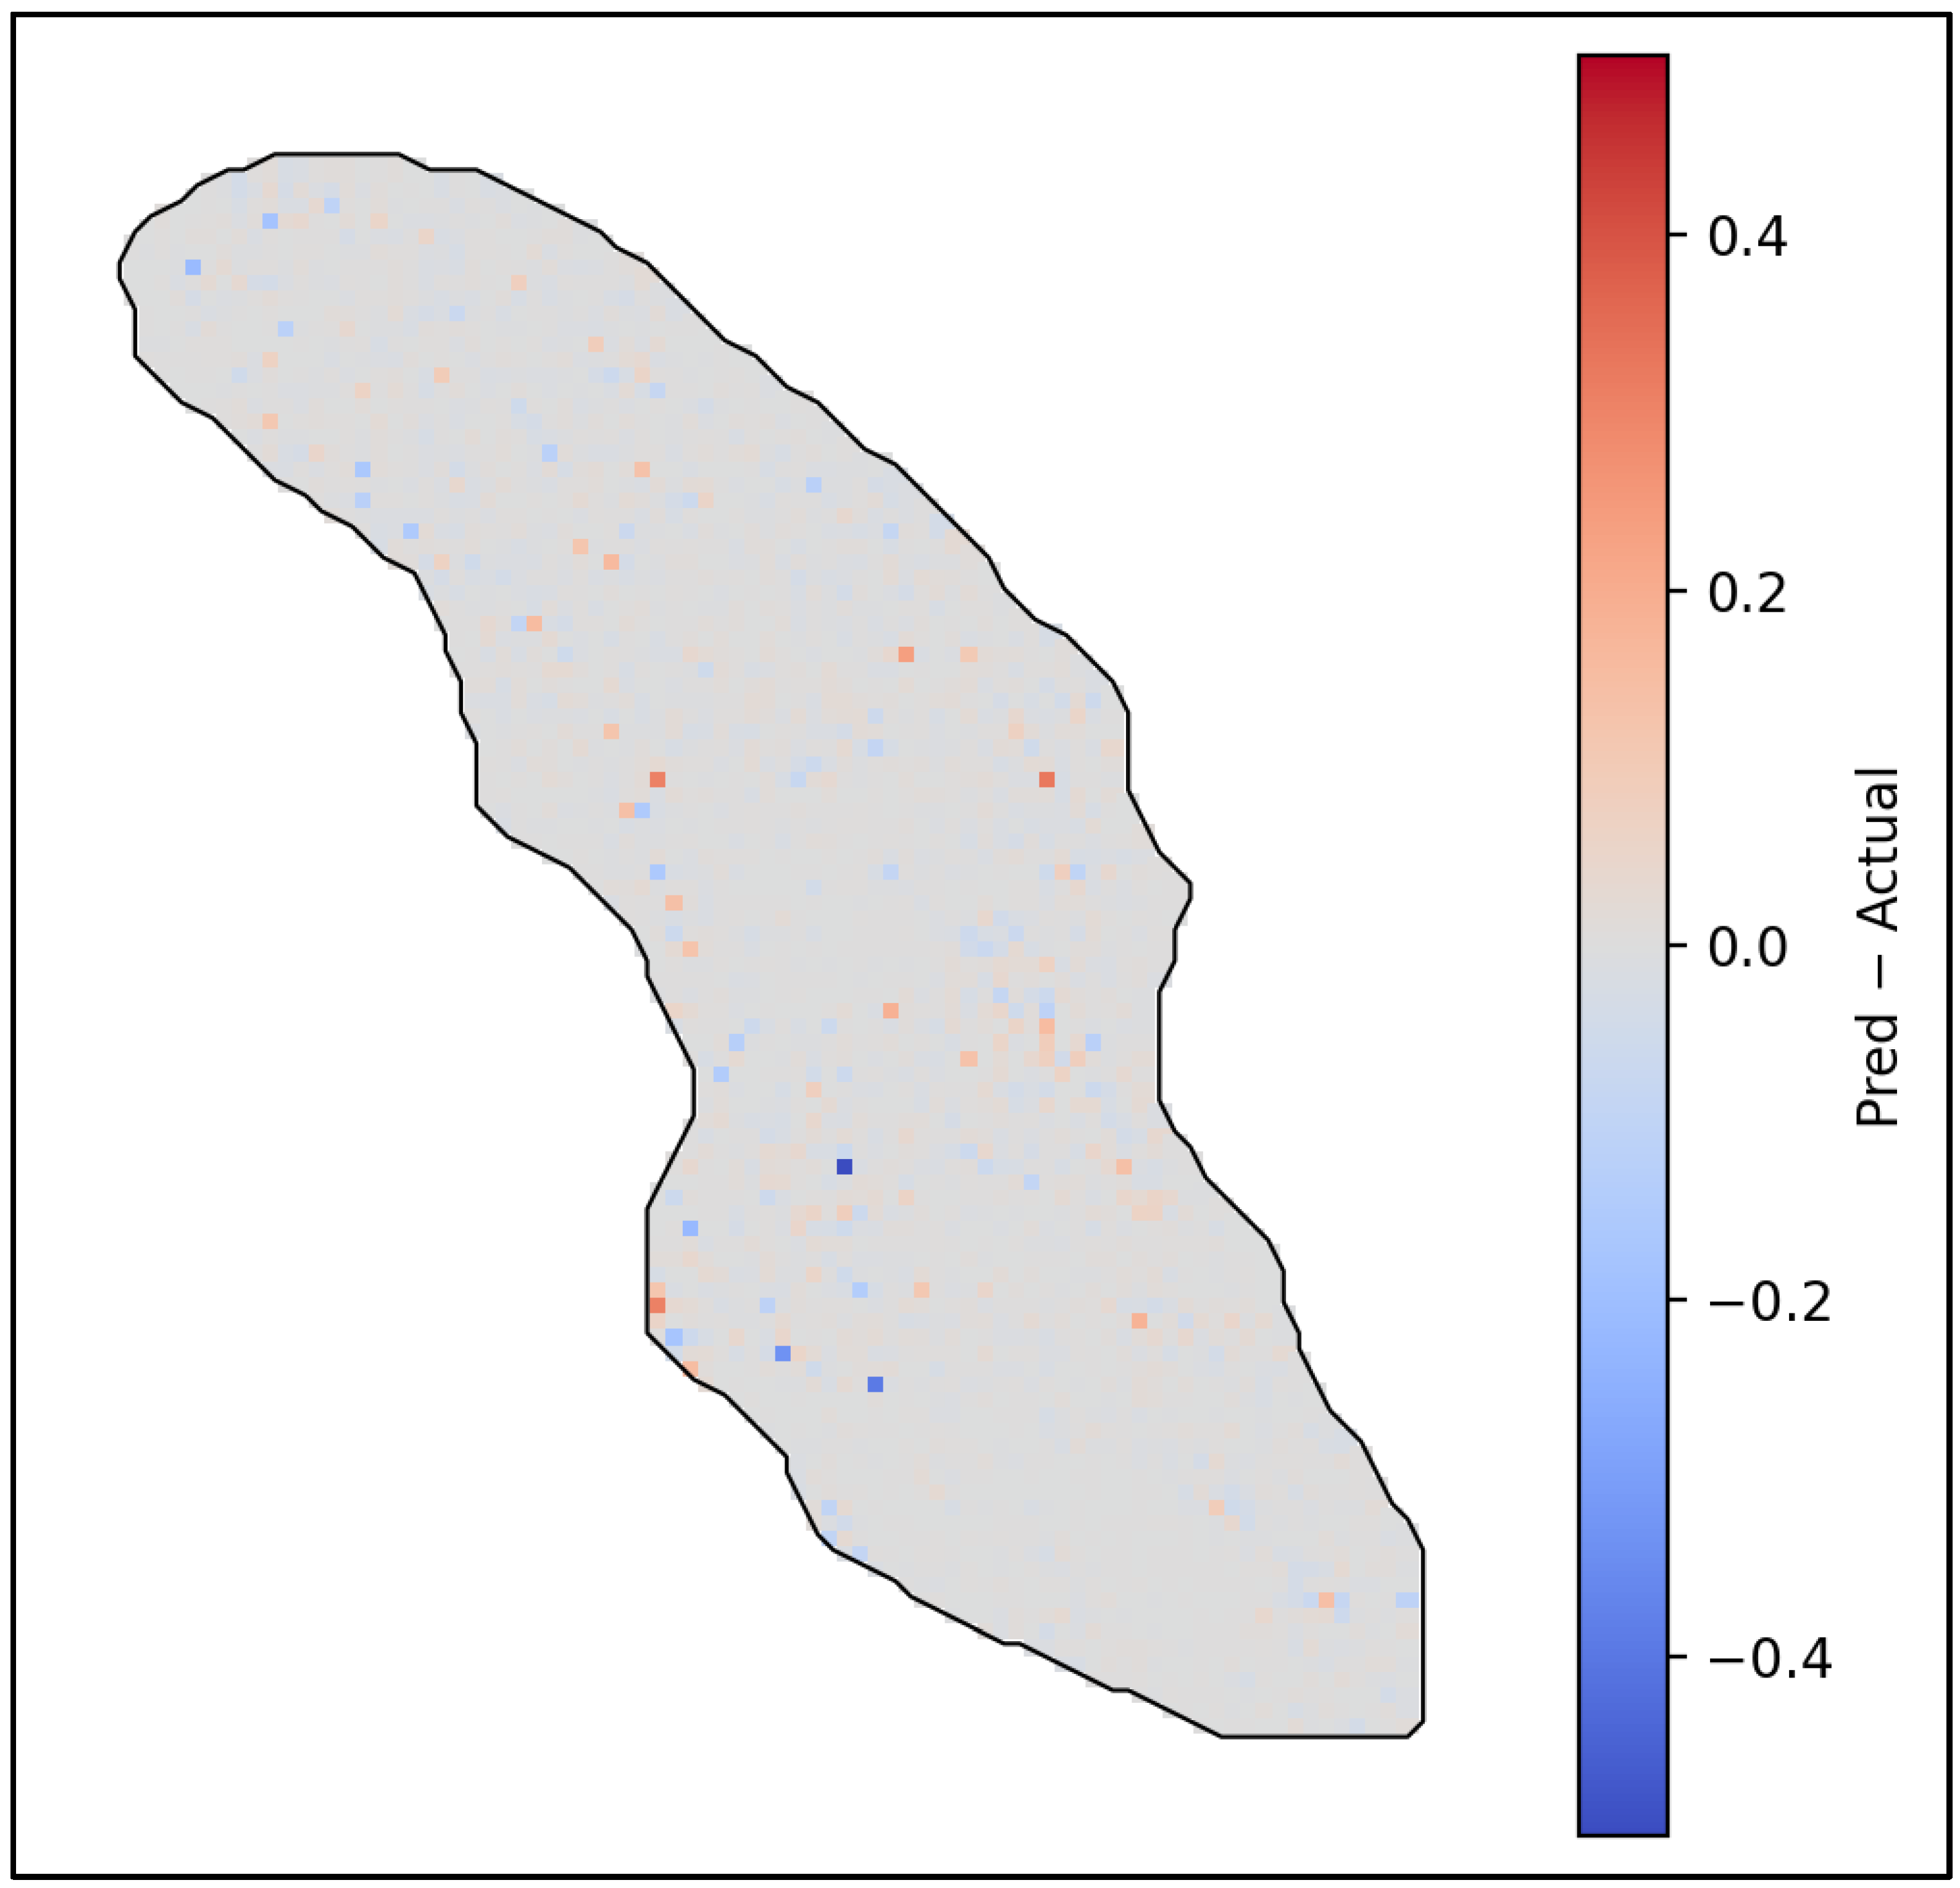
Figure 10.
Map of areas with predicted FZI values greater than 4.5, highlighting inferred sand channel systems. (A) Cumulative distribution of FZI values, (B) frequency histogram of FZI, and (C) spatial map displaying the mean distribution of FZI clusters.
Figure 10.
Map of areas with predicted FZI values greater than 4.5, highlighting inferred sand channel systems. (A) Cumulative distribution of FZI values, (B) frequency histogram of FZI, and (C) spatial map displaying the mean distribution of FZI clusters.
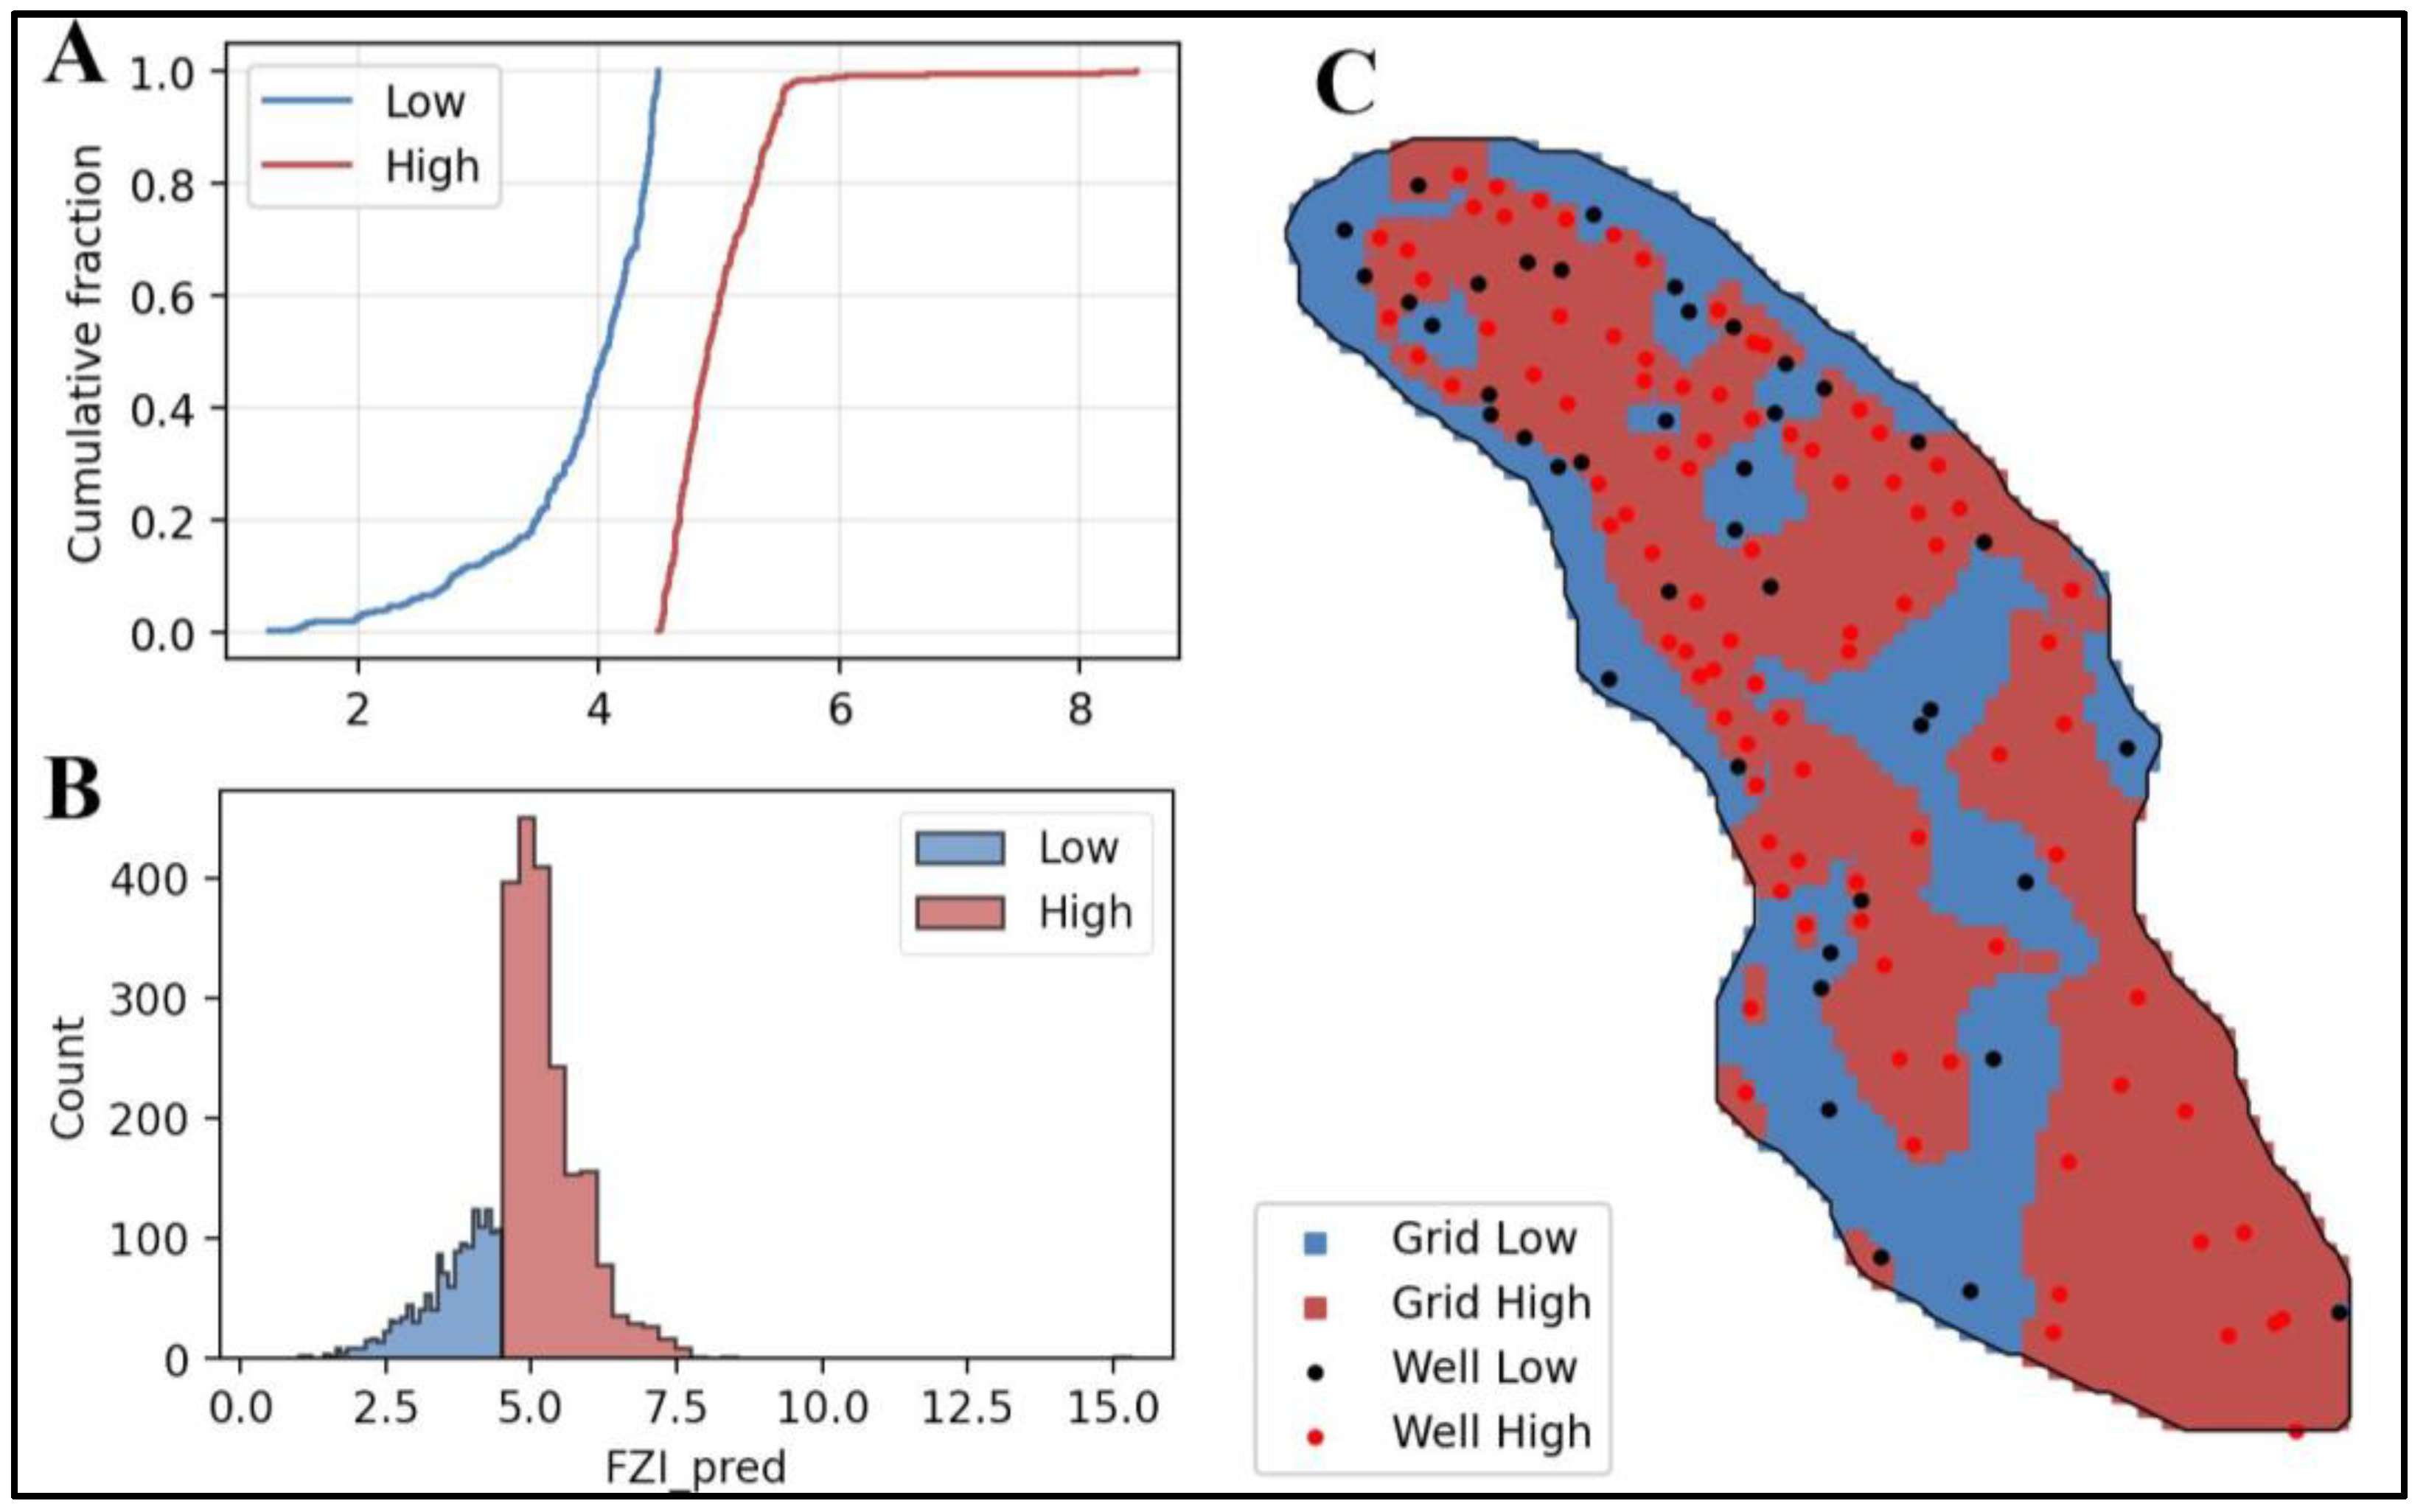
Figure 11.
(Left) Spatial distribution of mean FZI values greater than 4.5, with wells shown in red if they penetrate these predicted high-FZI zones. (Right) 3D visualization of predicted FZI values exceeding 4.5, highlighting the complex geometry of the inferred channel systems.
Figure 11.
(Left) Spatial distribution of mean FZI values greater than 4.5, with wells shown in red if they penetrate these predicted high-FZI zones. (Right) 3D visualization of predicted FZI values exceeding 4.5, highlighting the complex geometry of the inferred channel systems.
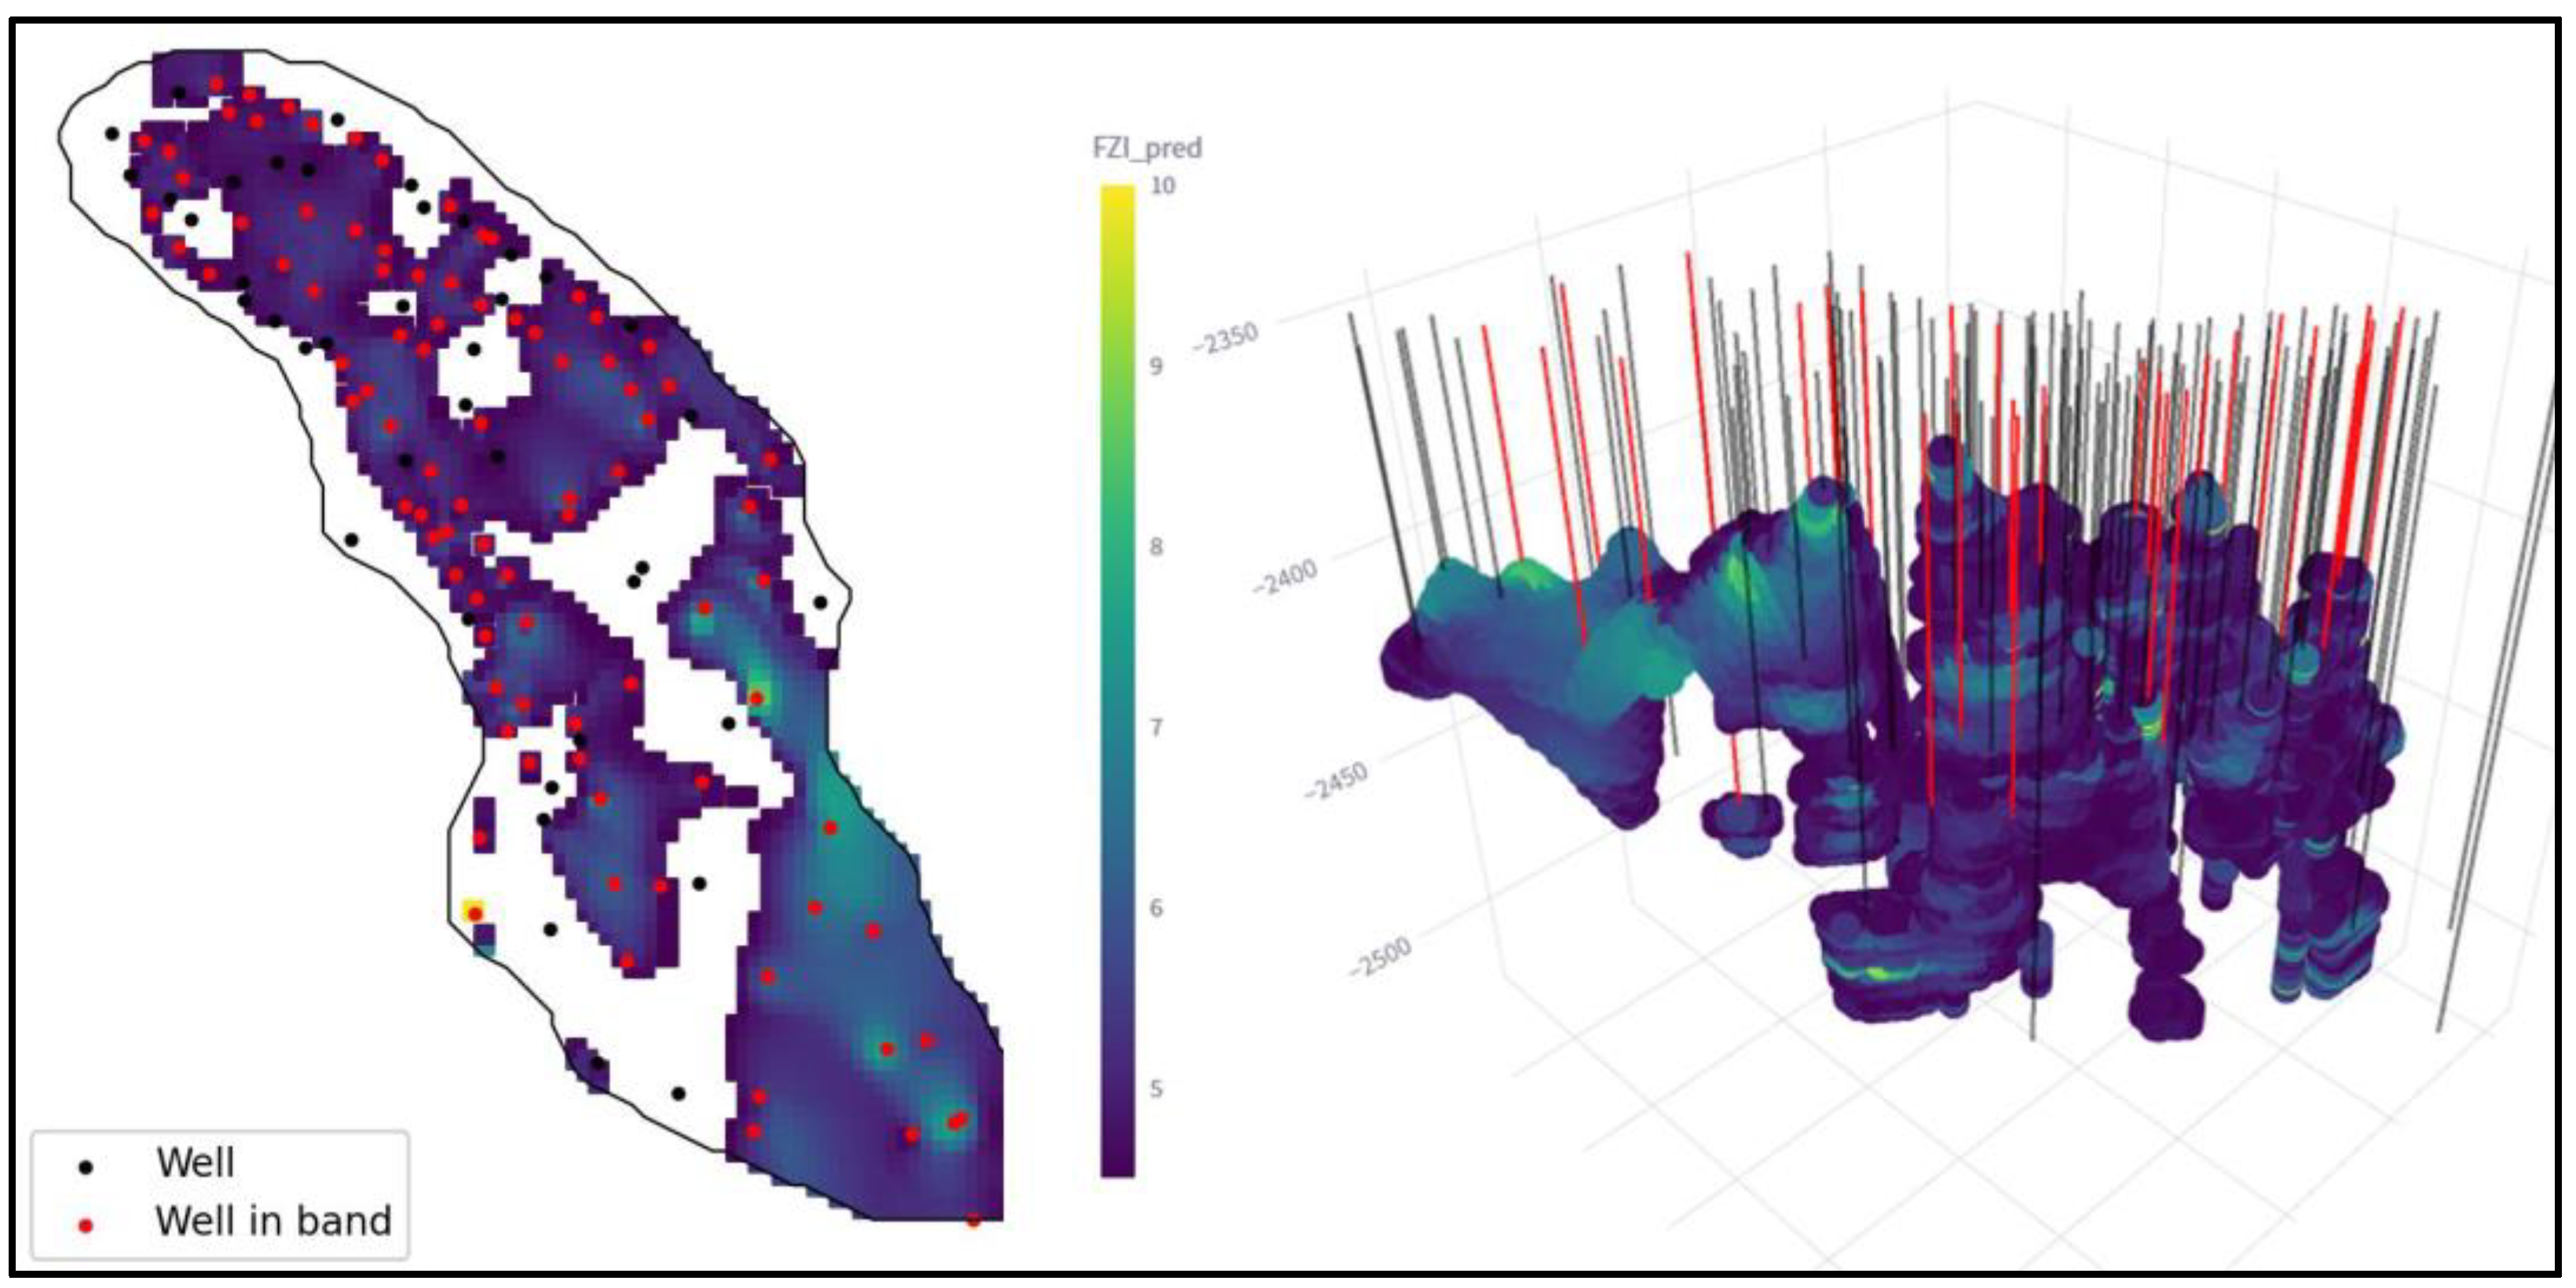

Table 1.
Optimal hyperparameters and corresponding model performance metrics from the sensitivity analysis of the FZI prediction workflow.
Table 1.
Optimal hyperparameters and corresponding model performance metrics from the sensitivity analysis of the FZI prediction workflow.
| IDW Neighbors (idw_k_neigh) | RBF Neighbors (rbf_neigh) | Learning Rate | Z-Threshold | CV R² | Test R² | Test MAE | Test RMSE |
| 7 | 40 | 0.05 | 3 | 0.961 | 0.971 | 0.093 | 0.178 |
| 9 | 40 | 0.05 | 3 | 0.961 | 0.971 | 0.094 | 0.18 |
| 9 | 60 | 0.05 | 3 | 0.961 | 0.971 | 0.094 | 0.18 |
| 5 | 60 | 0.05 | 3 | 0.961 | 0.972 | 0.093 | 0.177 |
| 5 | 20 | 0.05 | 4 | 0.955 | 0.962 | 0.098 | 0.211 |
| 3 | 40 | 0.05 | 4 | 0.954 | 0.963 | 0.098 | 0.209 |
| 5 | 40 | 0.05 | 3.5 | 0.958 | 0.965 | 0.098 | 0.2 |
| 3 | 60 | 0.05 | 3.5 | 0.957 | 0.965 | 0.098 | 0.2 |
| 9 | 20 | 0.05 | 3.5 | 0.958 | 0.964 | 0.099 | 0.202 |
| 9 | 40 | 0.05 | 4 | 0.954 | 0.962 | 0.099 | 0.212 |
Disclaimer/Publisher’s Note: The statements, opinions and data contained in all publications are solely those of the individual author(s) and contributor(s) and not of MDPI and/or the editor(s). MDPI and/or the editor(s) disclaim responsibility for any injury to people or property resulting from any ideas, methods, instructions or products referred to in the content. |
© 2025 by the authors. Licensee MDPI, Basel, Switzerland. This article is an open access article distributed under the terms and conditions of the Creative Commons Attribution (CC BY) license (http://creativecommons.org/licenses/by/4.0/).
Copyright: This open access article is published under a Creative Commons CC BY 4.0 license, which permit the free download, distribution, and reuse, provided that the author and preprint are cited in any reuse.


