
Submitted:
09 July 2025
Posted:
10 July 2025
You are already at the latest version
Abstract
This study examines the effectiveness of porous silica extracted from rice husk and chitosan modified silica in removing pesticides (Malathion and Atrazine) from wastewater to assess the efficacy and efficiency of natural-source silica in the elimination of pesticide residues. This is with a view to solid waste management and valorisation. Agricultural by-products, rice husk and periwinkle shell, were sun-dried, crushed, and pulverized. The dried rice husk sample was ashed for 6 hours at 700°C in a furnace. The chitosan was extracted from periwinkle shell while rice husk ash was acid reflux treated to produce silica. The porous silica was prepared using sol-gel method, modified with chitosan and stored in a desiccator. FTIR, TEM, SEM/EDX, and XRD were used to examine the properties of the porous silica. During batch adsorptions of pesticides, the following parameters were investigated: sorbent dose, contact time, pesticide concentration, and pH. The pesticide concentrations were determined using Gas Chromatography (Agilent 19091GC). The results obtained were subjected to appropriate isotherm and kinetic models. The study revealed that the extracted silica showed the presence of Si, and O; and the morphology revealed agglomeration of particle and porosity. For Porous Rice Husk Silica (PRHS) and Chitosan Modified Porous Rice Husk Silica (MPRHS), the percentage removal of atrazine decreased from 99.82 to 96.32 % and 100 to 99.97 %, respectively, while the percentage removal of malathion decreased from 99.22 to 96.04 % for PRHS, but the percentage removal of malathion by MPRHS was 100 % as the initial pesticide concentration increased. The modification of the adsorbent (MPRHS) caused an increase in the amount of pesticides (Atrazine and Malathion) adsorbed, over the unmodified adsorbents. Freundlich and pseudo second order models fit the adsorption of both pesticides. The study concluded that porous silica from rice husk was effective at removing pesticides from wastewater, and that its effectiveness improved with the addition of chitosan. This will serve as a waste management strategy and promote circular economy.
Keywords:
pesticide
; silica
; chitosan
; wastewater
; adsorption
; isotherm
1. Introduction
The rapid evolution and advancement of technology have exposed nature, especially humans, to a wide range of chemical substances, with pesticides being a notable group among them [1], 2016). Over the years, the removal of pesticide residues from the environment has become a major topic of concern and discussion. In recent times, this concern has escalated significantly, particularly regarding their presence in aquatic environments, notably water bodies [2]. The use of pesticides is essential to reduce crop losses and increase agricultural yields [3,4,5]. However, due to indiscriminate application, the use of pesticides for societal benefit carries the risk of leaving behind residues that can contaminate the environment [6,7]. When pesticides are used, a portion remains on the farmland, while others find their way into the surrounding air, soil, and water. Pesticide pollution has wide-ranging negative consequences, affecting not only the environment but also human health [8,9].
Atrazine, a water-soluble herbicide and one of the most frequently used herbicides, is a significant concern due to its potential carcinogenic effects, disrupting endocrine function, and reducing sperm levels in men [10]. It poses a risk to living systems and is classified as Packing Group III and Hazard Class 6.1 by the United Nations Committee of Experts on Transportation of Dangerous Goods [11,12,13,14]. Malathion, a pesticide, has been used in veterinary care, industry, and agriculture since 1980. Despite its lower acute toxicity, it is still used for pediculosis [15]. However, its widespread use exposes everyone to it, contributing to environmental pollution. Factors influencing malathion poisoning include metabolites, exposure route, nutritional status, genetics, gender, and product purity [16,17].
Pesticide residues in soil and water are categorized as carcinogenic pollutants in many countries, posing a severe threat to the environment [18]. Consequently, it is imperative to develop sustainable methods for decontaminating water and wastewater, particularly drinking water, from pesticide residues. Various treatment processes, such as photocatalytic methods, solid-phase extraction, adsorption, advanced oxidation processes, biodegradation, ion exchange, and membrane separation, have been established and reported for sequestering pesticides and their residues from contaminated aquatic environments. Among these, adsorption has proven to be an effective remediation technique, offering benefits in terms of cost-effectiveness, flexibility in design, operational simplicity, and the absence of potentially hazardous by-products [19,20,21,22,23].
There is a growing need for alternatives to activated carbon and silica gel, commonly used in adsorption processes for pollutant removal, as they are challenging to regenerate and costly. Materials with high efficiency in pesticide decontamination and environmentally friendly attributes are required. To this end, various materials, both natural and synthetic, have been employed as adsorbents for removing pesticide residues from aqueous environments. Among them, rice husk ash, derived from locally grown rice, has gained attention due to its high silica content and the abundance of rice husk waste generated in regions like Nigeria [24]. Rice husk, a major lignocellulosic by-product of rice milling, and periwinkle shells, an underutilized molluscan waste abundant in coastal communities, represent two potent candidates for value-added conversion [25,26,27].
In recent years, nanomaterials and nanostructured materials, both modified and unmodified, have garnered significant interest for their ability to efficiently remove various pollutants from water and wastewater due to their unique properties, including a large specific surface area, low diffusion resistance, high adsorption capacity, and rapid adsorption equilibrium [28,29,30]. However, there has been limited research on the use of nanostructured silica, derived from natural sources, for the removal of pesticide residues from water and wastewater. This study aims to fill this research gap by exploring the potential of nanostructured silica for environment friendly pesticide residue removal.
2. Materials and Methods
2.1. Reagents
Hydrochloric acid, acetic acid, dichloromethane (DCM) and sodium hydroxide were purchased from BDH Chemicals Limited, UK. Hexadecyltrimethylammonium bromide (HDTAB), Malathion, and Atrazine were purchased from Sigma-Aldrich Limited. Dichloromethane (DCM) was distilled before use so as to ensure contaminant free solvent. All chemicals were analytical grade and the solutions were made with deionized-distilled water.
2.2. Sample Preparation
The rice husk in which silica was extracted was collected from Ofada village in Ogun State, Nigeria while the chitosan used for modification was extracted from the periwinkle shell and was collected from Akpan Andem market, Akwa Ibom, Nigeria. The two agricultural by-products were sun-dried for a few days to a constant weight. The periwinkle shell was crushed using a Hammer mill and later pulverized at the Agricultural Engineering Department, Obafemi Awolowo University, Ile-Ife, Nigeria. The periwinkle shell powder was sieved using 2 mm mesh. The dried rice husk samples were pre-ashed at a temperature of 250 oC for three hours. The pre-ashed samples were placed in a crucible and calcined for completely ashing at 700 oC in Murffle furnace for 6 h. The rice husk ash and the sieved periwinkle shell were stored in separate air-tight containers for further processes.
2.2.1. Chitosan Extraction from Periwinkle Shell Powder
The extraction follows a four-stage process according to the modified methods of Abdeen and Mohammad [31] and Okoya et al [32]. The powdered periwinkle shell was first deproteinized by adding 200ml 4 % NaOH to 50g periwinkle shell powder in a beaker and was placed on a magnetic stirrer for 6 h at 80 oC. The mixture was filtered with Whatman no. 1 filter paper, and the residue was washed in distilled-deionized water until it was neutral using pH meter (HI9812-5 portable pH/EC/TDS temperature meter), then dried for 2 h at 100 oC. The residue (deproteinized periwinkle shell powder) was demineralized by its addition to 100ml 3 % 1 M HCl and agitated for 3 h at 30 oC. The mixture was filtered, and the residue was washed with deionized distilled water until it was acid-free (neutral pH). The acid-free residue was then dried for 1 h at 90 oC. The demineralized-deproteinized periwinkle shell was decolourized by refluxing in acetone for 3 h at 60 oC. The mixture was filtered and dried before being used. Chitin was recovered as a residue. Chitosan (2-acetamido-2-deoxy-D-glucose-N-(acetylglucosamine)) was prepared by reacting 50% (w/v) NaOH solution with the residue (chitin) on a magnetic stirrer at 30 oC for 4 h. Chitosan was rinsed with distilled-deionized water and dried at 90 oC for 1 h after filtering.
2.2.2. Silica Extraction
2.2.3. Synthesis of Porous Silica
The porous silica was prepared by a modified procedure of Bhagiyalakshmi et al. [36]. Silica powder (11 g) extracted from rice husk was mixed with 0.036 g/ml NaOH solution. The system was reflux for 12 h at 80 oC to form a solution of sodium silicate.
Separately, 3.75 g of hexadecyltrimethylammonium bromide (HDTAB) was dissolved in 62.5 ml deionized water. Under stirring, the HDTAB surfactant solution, which act as pores template through micelle formation, was slowly added to the sodium silicate solution, and the pH was adjusted to 11 with 5 M acetic acid. After pH adjustment, the mixture was vigorously agitated for 6 h at room temperature using a magnetic stirrer. A surfactant-silica gel was formed and then heated for 12 h at 100 oC. The solid product was filtered, rinsed with deionized water and ethanol, and then dried at 80 oC overnight to eliminate any residual water and ethanol. To entirely eliminate the surfactant template, calcination at 550 oC for 5 h was employed
2.2.4. Modification of Porous Silica
With continuous stirring, approximately 5 g of chitosan was slowly added to 100 ml of 10 % acetic acid for chitosan gel formation. To promote homogenization, the mixture was heated to 40-50 oC. The chitosan gel formed was heated to 40-50 oC after dilution with water. In a separate container, a porous silica (10 g) sample was added gently to the diluted chitosan gel and actively stirred for 24 hours using a magnetic stirrer. The coated porous silica was then cleansed with distilled-deionized water, dried for 2 hours at 102 oC before being cooled at room temperature and stored in a desiccator.
2.3. Characterization of the Porous Silica
The elemental analysis and the morphology of the silica and porous silica produced were performed using ESCAN VEGA 3 LM SEM coupled with EDS microanalysis (Oxford system). TEM (JEOL 1010) was also used to analyze the morphological properties and dimensional characterization of porous silica, such as lengths and diameters. The JEOL TEM 1010 was equipped with a Megaview imaging system. A Bruker D8-Advance multi-purpose X-ray diffractometer was used to investigate the structure of the extracted silica and porous silica samples. The KBr pellet method was used to perform Fourier transform infrared (FTIR) spectrophotometry (NICOLET S5 from Thermo Scientific) in the 400–4000 cm-1 range.
2.4. Batch Adsorption Process
The adsorption studies were conducted on a batch scale using PRHS and MPRHS as adsorbents. The following parameters were investigated for both pesticides; sorbent dose (0.2-1.0 g), contact time (20-60 min), pesticide concentration (10-50 mgL-1) and pH (2-10). The pH of the solutions was adjusted to the appropriate value using either NaOH (0.1 M) or HCl (0.1 M) solutions. The mixture was filtered using Whatman No. 1 filter paper. The pesticides were extracted through liquid-liquid extraction from the filterate using Dichloromethane (DCM) and were analysed spectrophotometrically using Gas chromatography (Agilent 19091GC). The adsorption capacity () and removal efficiency (%E) were determined as follows, respectively
where Ci and Ce are the initial concentration and concentration of equilibrium of the Pesticides (atrazine and malathion) in solution, respectively, w denotes the adsorbent dose used, and V represent the solution volume.
2.5. Adsorption Isotherms
The experimental data were subjected to various adsorption isotherms, such as the Langmuir isotherm (3), Freundlich isotherm (4), Temkin (5), Dubinin–Radushkevich (D–R) (6), and Scatchard isotherm (7), in order to determine the isotherm models that best fit the experimental data and parameters, as well as provide information about adsorption capacity, surface properties, and affinity of the adsorbent,
where
The adsorption energy E (kJ/mol) can be calculated using the equation below,
where is the adsorption capacity in mgg-1, and is the equilibrium pesticide concentration in mgL-1, qm is the maximum adsorption capacity in mgg-1, KL is the Langmuir isotherm constant which is also the adsorption capacity (mgg-1) Lmg-1, and KF and n are the Freundlich coefficients or exponent which can also be adsorption capacity in mgg-1 and Freundlich constant which indicate the degree of the surface heterogeneity and also describes the adsorbate distribution on the adsorbent surface, respectively. AT is Temkin isotherm equilibrium binding constant (L/g), bT is Temkin isotherm constant, R is universal gas constant (8.314 Jmol-1K-1), T is Temperature at 298K and B is a Constant related to heat of sorption(J/mol). β (mol2J-2) is the activity coefficient which signifies the adsorption free energy while Ԑ is the Polanyi (Kecili and Hussain, 2018).
2.6. Adsorption Kinetics
To resolve the controlling and diffusion mechanisms of the adsorption processes, adsorption kinetics such as the pseudo-first-order model (8), pseudo-second-order model (9), intraparticle diffusion (10), Elovich (11) and liquid film diffusion models (12) were examined. The following are the equations:
The initial sorption rate (h) can be calculated from the
where t is the time in minutes, K1 and K2 are the pseudo-first and pseudo-second order constants in min-1 and g mg-1 min-1, respectively, and qe and qt are the amount of pollutant adsorbed on the adsorbent at equilibrium and at time t, respectively. Kd (mg/gmin1/2) is the intraparticle diffusion rate constant, I is intraparticle diffusion plot intercept, α and β and are the initial adsorption rate constant (mg/g min) and the Elovich desorption constant, respectively, which are related to the extent of surface coverage and the chemisorption activation energy (g/mg). Kfd is the adsorption rate constant (mg/gmin) and F is the fractional attainment of equilibrium (F = qt/qe) [37].
ln(1 − F) = −Kfdt
3. Results and Discussion
3.1. Characterisation of Silica and Porous Silica Produced from Rice Husk
Figure 2 shows the XRD pattern for the rice husk silica (RHS) and porous rice husk silica (PRHS). Hill like patterns and sharp diffraction peaks were observed in both RHS and PRHS as shown in Figure 2. The hill like pattern ranged between 15o to 28o [2θ] for RHS and 8o to 16o [2θ] for PRHS while the sharp peaks were observed at [2θ] = 26o, 39o, 60o, 68o, and 84o for RHS and at [2θ] = 22o, 30o, 32o, 34o, 44o and 56o for PRHS. The difference in the peak position and appearance new peaks may be as a result of the pores in PRHS. These hill like and sharp peaks respectively signify the amorphous phase and crystalline structure of the RHS which was also revealed in PRHS. The XRD patterns agree with the study reported by Ghorbani et al. [35] and Okoronkwo et al. [38], who found that silica has both an amorphous and crystalline structure. These peaks imply the presence of crystalline structures of the cristobalite and tridymite forms of silica, which could be related to the melting of ash silica particle surfaces and particle bonding [39].
The samples were subjected to FTIR analysis for the confirmation of the presence of SiO2 and the results are shown in Figure 3. The results show the presence of characteristic peaks around 1100 and 800 cm-1, which are attributed to a Si-O bending vibrational band and a network of asymmetric Si-O-Si siloxane bond stretching vibrations [35,38]. The network of O-Si-O bending vibration modes is related to the band at about 500 cm-1. The absorption band of 1600-1700 cm-1 represents the H–O–H bending vibration of water molecules bound or trapped within the matrix. [38,40]. Figure 3a displays the RHS spectrum, which includes a broad band about 3070–3750 cm-1 that is missing from the PRHS spectrum (Figure 3b). Due to the adsorbed water molecules, the band corresponds to the stretching vibration of the O-H bond from the silanol groups (SiOH) [41.42, 38]. The elimination of surfactants in the furnace during the nanostructuring process could be responsible for the loss of the band in Figure 3b.
The surface morphology of the RHS and PRHS as shown in Figure 4 and Figure 5 was characterized using SEM and HRTEM respectively. The morphology of RHS (Figure 4a) showed a bulky surface texture while PRHS showed in Figure 4b reveals agglomeration and spherical shape of particles after nanostructure process which may show porosity at higher magnification. These morphological properties are good for adsorption purposes. From the TEM images of the sample PRHS, regular stripes which are visible in the vertical direction, indicate a long-range structure of the porosity (Figure 5) [43,44]. The diameter of the pore is 0.21 nm as revealed in the TEM image. The predominant degree of Si and O, spectra as revealed by EDX analysis result presented in Table 1 confirms silica (SiO2) as the paramount element in both RHS and PRHS samples. The presence of sodium in the PRHS sample, as indicated in Table 1, could be related to the substrate used during the SEM/EDX examination, whereas bromine was introduced due to the surfactant utilized in the nanostructured process. Imoisili et al. [45,46] observed a similar EDX result in the synthesis of amorphous mesoporous silica from palm kernel shell ash and its characterization.
3.2. Optimization Studies on the Pesticide Removal from Aqueous Solution
The result of the optimization study is discussed below by comparing the performance of PRHS and MPRHS adsorbents on the adsorption of pestcides (atrazine and malathion) a vis the conditions that affect adsorption
3.2.1. pH Effect on Adsorption
The impacts of pH on the adsorption of atrazine and malathion are depicted in Figure 6a,b, respectively. pH is one of the most important factors that affects the adsorption process because it changes the ionic state of the substance (adsorbate), as well as the ionization and surface charge of the adsorbent, all of which have an impact on the mechanism of reaction between adsorbate and adsorbent. The study was observed over pH range 2 to 10. Based on the findings, the percentage of pesticides removed increases as the pH of the system increases. From Figure 6a,b, the maximum removals of Atrazine and Malathion by MPRHS occurred around pH 6, while the trend seemed to be increasing across the pH range (up to pH 10) used for PRHS. The optimum pH was chosen to be 6 for MPRHS in the adsorption of Atrazine and Malathion. The gradual increase experienced between pH 2 and 6 (acidic region) for both adsorbent in removal of Atrazine and Malathion in Figure 6 implies that adsorption of the pesticide molecule is enhanced in acidic environment. This suggests that via electrostatic attraction in the acidic medium, the negatively charged pesticides (malathion, pKa is −6.8) and positive surface of the sorbents attract [47,48,49,50]. Atrazine has a pKa of 1.68, making it a mildly alkaline insecticide which may be responsible for its increased adsorption at initial stage of pH 2 [51]. The chitosan modification, where the amino groups are protonated and the chitosan modified PRHS surface becomes more positively charged, may account for the higher percentage elimination of the pesticide in the acidic media. Rissouli et al. [52] discovered similar pattern in glyphosate adsorption by chitin and chitosan.
3.2.2. Adsorption Effect of Adsorbent Dosage
The effect of adsorbent dose on atrazine and malathion removal and adsorption capacity was investigated in the range of 0.2–1 g of adsorbent, as shown in Figure 7 and Figure 8. Figure 7a and Figure 8a depicted the influence of adsorbent dose on removal percentage, while Figure 7b and Figure 8b depicted the effect of adsorbent dosage on adsorbent adsorption capacity. It is seen from Figure 7a and Figure 8a that as the dosages of PRHS and MPRHS increased, the percent removal of the pesticides increased. For PRHS, the proportion of atrazine removed increased from 96.88 to 98.316 % and 97.33 to 98.53 % for MPRHS while Malathion elimination rose from 98.06 to 99.94 percent in PRHS and from 96.63 to 98.81 percent in MPRHS. This is because increasing the adsorbent dosage increases the surface area of the adsorbent, resulting in more adsorptive sites available for adsorption and the fact that the sorption sites remain unsaturated during the sorption [50,53,54]. The results shown in Figure 7a and Figure 8a suggest that the optimum dose of MPRHS for the malathion and atrazine is 0.8 g, as the adsorption of malathion and atrazine continue to increase as the dose of PRHS increased. The optimum dose of PRHS may exceed 1.0 g for both pesticides, which is the maximum dose considered in this study, as the efficiency still showed increment till the 1.0 g dose.
The uptake capacity of the adsorbent takes a different turn compared to the percentage removal. The result (Figure 7b and Figure 8b) reveals that the uptake capacity of each adsorbent decreases as the adsorbent dose increase. The reduction observed per unit gram of PRHS and MPRHS was from 12.11 to 2.46 mg/g of atrazine and 12.26 to 2.498 mg/g of malathion respectively. Nor et al. [55] were able to remove diazinon pesticide from an aqueous solution using coconut shell-modified biochar and they observed reduction in the adsorption capacity as against the increase in adsorption efficiency as adsorbent dosage increase. Each adsorbent has the highest uptake capacity at 0.2 g dose. Shoukat et al. [56] and Ishtiaq et al. [57] had similar result of maximum adsorption capacity at low sorbent dosage (as low as 0.05 g) for the adsorption of dye and pesticide respectively. The decrease in the adsorption capacity of the adsorbents with an increase in sorbent dosage can be attributed to particle interactions. When more adsorbent is introduced into the same solution volume with a fixed pesticide concentration, it leads to the occupation of available binding sites. However, as the sorbent dosage further increases, aggregation of adsorbent particles occurs due to the interactions. This aggregation phenomenon is likely responsible for the observed reduction in the adsorption capacity of the adsorbents [58,59]. That is, aggregation leads to a reduction in the available surface area which in turn leads to an uptake capacity reduction. Another reason for the decrease in adsorption capacity as the adsorbent dose rises could be saturated active sites [60,61].
3.2.3. Effect of Agitation Time on Adsorption
The impact of agitation time on atrazine and malathion adsorption by adsorbents was investigated and illustrated in Figure 9a,b. From the result, it was observed that the adsorption of atrazine and malathion on modified and unmodified porous silica was very fast at the initial stage. Within 20 min, 93.24 % and 96.46 % of atrazine and malathion were adsorbed respectively for PRHS (Figure 9a,b). The same trend was observed for MPRHS within the first 20 min, 99.92 % and 99.62 % atrazine and malathion respectively (Figure 9a,b). For PRHS, the rapid adsorption of atrazine and malathion continues to 40 and 30 min before the gradual increment sets in. While for MPRHS, the removals seem to be almost constant for atrazine but increasing gradually for malathion after 20 mins. The percentage of atrazine removed by MPRHS dropped at 50 min (Figure 9a).
The trend observed in Figure 9 revealed that the sorption was rapid at first, then moderate as it progressed until the maximum removal was reached. This discrepancy in sorption rate could be because the active sites of the adsorbents PRHS and MPRHS were unoccupied at the start, resulting in a high sorption rate. The saturation of binding sites, with pesticide ions gradually filling the unoccupied sites, is what causes the subsequent slower adsorption. Repulsive forces between the pesticide ions and those already adsorbed on the adsorbent are the likely cause of the slower adsorption rate [62]. Hassan et al. [63] and Naushad et al. [64] observed similar trends in their respective adsorption of dye and pesticide. Jusoh et al. [65] also experienced the same trend when studying the efficacy of granular activated carbon in the removal pesticides from agricultural runoff. So also, the removal efficiency of metalyxal using clay by Azarkan et al. [66] also showed similar behaviour.
3.2.4. Kinetics Studies
The experimental data were subjected to kinetic model analysis using the pseudo-first order, pseudo-second order, intraparticle diffusion, liquid film diffusion, and elovich models. This was done in order to select the optimum model for describing the adsorption data. Table 2 shows the kinetics data of the pesticides adsorption process onto modified and unmodified porous silica extracted from rice husk (PRHS and MPRHS). This was done to better understand the mechanism at work and to discover the actual rate-controlling phase in the atrazine and malathion adsorption processes. The slope and intercept of the linear plot of the pseudo first and second order equations were used to determine the K1 and qecal, and the results were shown in Table 2. The R2 correlation coefficients for the plots were also reported in the table, indicating that the experimental data of atrazine and malathion adsorption onto PRHS and MPRHS suited the pseudo-second order model better than the pseudo-first order model. The estimated qe and the pseudo-second order qe value obtained from the experimental data are similar. This suggested that the adsorption process followed the pseudo second order kinetic model, implying that atrazine and malathion adsorption on PRHS and MPRHS is likely to exhibit electrostatic interactions. [47,67,68]. The adsorption of malathion onto De-Acidite FF-IP resin does not satisfy the pseudo first order model, according to Naushad et al. [69]. Kumar et al. [4] found something similar when they compared the removal of malathion from aqueous solution by agricultural and commercial adsorbents. Also, the adsorption of atrazine onto sepiolite and wheat straw-derived biochar fit better in the pseudo-second-order equation, according to Liu and Chen [70] and Wang et al. [71]. Furthermore, the high correlation coefficient R2 values, which were unity compared to first order kinetics, suggest that the pseudo-second order model was better obeyed, supporting the hypothesis that the rate limiting step of atrazine and malathion adsorption on the adsorbents may be chemical sorption or chemisorptions [72]. Kumar et al., [73] and [4] had similar experiences.
For intra-particle diffusion, the curve of qt vs t1/2 was employed to obtain diffusion rate parameter Kd and the intercept C in the adsorption of atrazine and malathion onto PRHS and MPRHS (Table 2). Intraparticle diffusion has lower R2 values than pseudo-second order kinetics, but still has acceptable R2 values. This suggests that there is an intraparticle diffusion mechanism at work in the sorption process. [72]. In addition, the presence of an intercept reflects the presence of a boundary layer, and the larger the intercept, the greater the contribution of the boundary layer effect to the rate-controlling step [54,74]. However, because the plots did not pass through the origin, indicating the presence of C in Table 2, it was concluded that there is some degree of boundary layer control and that intraparticle diffusion is not the rate-controlling step in the overall absorption process of atrazine and malathion onto modified and unmodified porous silica from rice husk.
The physical adsorption mechanism is indicated by the conformance of adsorption processes to Liquid film diffusion. Table 2 lists the Kfd (adsorption rate constant in mg/gmin) values obtained from the linear plot of -ln(1-F) against t. The model offered good value of R2 for the pesticides but not better when compared to Pseudo second order model. However, the liquid film diffusion model R2 values obtained for pesticide adsorption onto adsorbents (PRHS and MPRHS) demonstrated that a film diffusion mechanism is present in the adsorption process. This implies that though not solely, the adsorption process may also possess some degree of film diffusion mechanism since the plots deviate from origin i.e., there is intercept (I) (Table 2). The experimental data's little conformity to the film diffusion mechanism indicates that a physical adsorption mechanism is likely involved in the process but not. Again, because the liquid film diffusion model does not better represent the experimental data than the pseudo second order model, the adsorption mechanism is majorly chemisorption [75,76].
Elovich equation describes if the adsorption process concurs with the behaviour that represents the nature of chemical adsorption. The constants α and β as well as the corresponding R2 which were obtained for the Elovich equation are presented in Table 2. In comparison to intraparticle and liquid film diffusion models, the Elovich equation also exhibited a good fit for the experimental data of the adsorption. The implication of this is that the adsorption process concurs with the behaviour that represents the nature of chemical adsorption [74,78].
3.2.5. Effect of Pesticide Concentration on Adsorption
The adsorption data of atrazine and malathion on porous rice husk silica (PRHS), Modified Nanostructured rice husk Silica (MPRHS) are presented in Figure 10 and Figure 11. Figure 10a and Figure 11a show that when the initial pesticide concentration increased, the % removal of both atrazine and malathion by PRHS and MPRHS decreased. The percentage removal of atrazine for PRHS and MPRHS decreased from 99.82 to 96.32 percent and 100 to 99.97 percent, respectively, while the percentage removal of malathion for PRHS decreased from 99.22 to 96.04 percent, but the percentage removal of malathion by MPRHS was 100 percent as the initial pesticide concentration increased. The reduction in percentage removal as concentration increases in the case of atrazine for PRHS and malathion for PRHS indicate saturation of the adsorption sites as concentration increased leading to availability of less adsorption surface for adsorbate [4,79]. Figure 10b and Figure 11b on the other hand, which analyze the adsorbents' absorption capacity as a function of the initial concentrations of atrazine and malathion, indicate that the uptake capacity of each adsorbent increases as the initial concentration of the pesticides increases. Although the percentage removal at higher concentration may be less but the amount of atrazine and malathion adsorbed on solid phase (PRHS and MPRHS) is higher than that at lower initial concentrations [79]. Several researchers have described a similar pattern for pesticide adsorption onto various adsorbents [54,63]
With an increase in the starting concentration, the PRHS and MPRHS' equilibrium sorption capacity increased. With increasing starting concentrations, the amount of Atrazine and Malathion adsorbed per unit gram of the adsorbents (mg/g) increased. The implication is that concentration acts as a significant driving force for the pesticide to overcome all mass transfer obstacles between the aqueous and solid phases. As a result, a larger initial pesticide dosage will improve the adsorption process [80].
3.2.6. Isotherm Studies
Adsorption isotherm models are important in the design of adsorption systems because they express the equilibrium relationship that occurs between the concentrations of adsorbate in the liquid phase and those on the adsorbent surface. Table 3 shows the results of applying the Langmuir, Freundlich, Dubinin–Radushkevich (D-R), Temkin, and Scatchard isotherm models to the equilibrium sorption data, while Table 4 shows the dimensionless constant separation factor (RL), which expresses the Langmuir isotherm's essential features. The parameters of equilibrium isotherms can often reveal important details about the sorption mechanism, surface properties, and adsorbent affinity. The intercept and slope of their respective linear plots were used to calculate the Langmuir and Freundlich constants, as shown in Table 3. The R2 for the pesticide’s adsorption onto PRHS and MPRHS are also shown in Table 3. The R2 of the Freundlich isotherm model was higher than the R2 of the Langmuir isotherm model, with the exception of atrazine adsorption onto PRHS, which was lower than Langmuir and malathion adsorption onto MPRHS, which was zero for both Langmuir and Freundlich. The Freundlich isotherm fit the adsorption process better than the other models, as evidenced by the values of the correlation coefficient R2. As a result, the adsorption process is determined by the heterogeneity of the adsorbent's surface [68,69,72,81]. The experimental value of the absorption capacity as seen in Figure 10b and Figure 11b, which ranges between 2.4 mg/g and 2.5 mg/g, can also be compared to the adsorption capacity (qL) of the PRHS and MPRHS (Table 3). The adsorption process involving removal of atrazine onto PRHS gave the highest Langmuir adsorption constant (KL) value (513.558) compared to the processes involving atrazine onto MPRHS and malathion onto PRHS and MPRHS. The higher KL value exhibited by MPRHS in the removal of atrazine compared to the rest as presented in Table 3 indicate higher adsorption capacity. The adsorption process was also subjected to Langmuir dimensionless separation factor RL to evaluate whether it is favourable or not and the results are presented in Table 4. If the value of RL < 1.0, the adsorption is considered favourable, but it is unfavourable if RL > 1.0 and RL = 1 means linear isotherm. Apart from the adsorption process involving Malathion and MPRHS that exhibits linear isotherm, the RL value of other adsorption processes is less than unity and it indicates a favourable adsorption. In the study of malathion removal from aqueous solution employing De-Acidite FF-IP resin, Naushad et al. [69] found a similar result. Other researchers have had similar experiences [82,83]
The Freundlich isotherm constants (Kf and n) were determined using the intercept and slope of log qe vs. log Ce linear plots, which show the adsorption capacity and measure of deviation from linearity, respectively [47,69]. Aside from the fact that n quantifies divergence from linearity, it also indicates the favourability of adsorption. Malathion adsorption onto PRHS and atrazine adsorption onto MPRHS suggests a favorable adsorption condition, as n > 1 [84]. The value of 1⁄n gives the heterogeneity degree of the sorption sites. The nearer the 1⁄n value to zero, the higher the surface site heterogeneity [4,84]. All the adsorbents exhibit heterogeneity at the surface because the inverse of n values as presented in Table 3 give values closer to zero and zero.
The intercept and slope of the plot between ln Ce and qe were used to estimate the Temkin isotherm constants A and B. Table 3 shows the values of the constants. The R2 values for the malathion adsorption process onto PRHS were greater than the others, indicating a better fit for the adsorption process. When comparing the three isotherms, the value of the correlation coefficient (R2) revealed that the Freundlich isotherm fit the experimental data better than the Langmuir and Temkin models, with the exception of atrazine onto PRHS, which favored the Langmuir model. The Scatchard isotherm plot is required to validate whether or not heterogeneity is involved in the adsorption process. If the plot of qe/Ce vs qe shows a deviation from linearity, the adsorbent has more than one type of binding site (heterogeneous surface), but if the plot shows a straight line, the adsorbent has just one type of binding site. [85,86]. Based on the R2 values in Table 3, both pesticides deviated from linearity, indicating a heterogeneous surface of PRHS and MPRHS. This explains why the Freundlich model was able to fit the experimental data well. The D–R isotherm model is used to forecast whether the adsorption process involves a physical or chemical mechanism. The D–R constants were calculated by plotting lnqe against ℇ2. The R2 value for the correlation coefficient obtained for the D–R isotherm showed almost the same trend as the Scatchard model, but it still did not fit the adsorption data better. The mechanism of adsorption is predicted by the free energy E computed from the constant obtained from plotting lnqe against ℇ2. Because the E value exceeds 16 KJ/mol, the result obtained in Table 3 suggests that the chemical particle diffusion mechanism substantially controlled the adsorption process. This is consistent with a porous surface [87].
4. Conclusions
The findings of this research concluded that adsorption efficiency increases with an increase in pesticide concentration and increases as the adsorbents (MPRHS and PRHS) dose increases. Also, as the duration of adsorption increases, the removal efficiency and uptake capacity increase. The silica extracted from agricultural source (rice husk) used as adsorbent exhibit high selectivity for both pesticides. The addition of Chitosan to the adsorbent increased its efficacy in the adsorption of pesticides. The investigation is best represented by the Freundlich adsorption isotherm model, which supports the premise of heterogeneous coverage of the adsorbate and that there is interaction between the adsorbate molecules. Other isotherms also explain the adsorption to some extent. This study concludes that the adsorption process has a chemical particle diffusion mechanism based on the free energy (E) obtained. The adsorption follows pseudo second order kinetics, and the Elovich model supports the idea that the adsorption mechanism is chemisorption. Agricultural waste, such as rice husks, could be processed to serve as a cheaper source of silica and transformed into revenue. Instead of being a nuisance to the environment, these would serve as non-hazardous alternatives to commercially available adsorbents for the treatment of pesticide-contaminated wastewater. This will serve as a waste management strategy and promote circular economy.
Author Contributions
Conceptualization, Akinyele A. B., Okoya, A. A. and Asubiojo, O. I.; methodology, Akinyele A. B. and Okoya, A. A.; software, Akinyele A. B.; validation, Okoya, A. A. and Asubiojo, O. I..; formal analysis, X.X.; investigation, Akinyele A. B.; resources, Akinyele A. B.; writing—original draft preparation, Akinyele A. B.; writing—review and editing, Akinyele A. B., Okoya, A. A. and Asubiojo, O. I.; supervision, Okoya, A. A. and Asubiojo, O. I. All authors have read and agreed to the published version of the manuscript.
Funding
There was no external funding for the study.
Data availability statement
The original contributions presented in this study are included in the article. Further inquiries can be directed at the corresponding author.
Declaration of Competing Interest
The authors declare that they have no known competing financial interests or personal relationships that could have appeared to influence the work reported in this paper.
Compliance with ethical standards
This article does not contain any studies involving human or animal subjects.
Acknowledgments
The authors gratefully appreciated management and staff of Centre for Energy and Research Development (CERD), Obafemi Awolowo University, Ile-Ife, Nigeria for making their laboratory available to carry out this research.
References
- Özkara, A.; Akyil, D.; Konuk, M. Pesticides, environmental pollution, and health. environmental health risk - hazardous factors to living species. Intech 2016. [CrossRef]
- Valdés, O.; Ávila-Salas, F.; Marican, A.; Fuentealba, N.; Villaseñor, J.; Arenas-Salinas, M.; Argandona, Y.; Durán-Lara, E.F. Methamidophos removal from aqueous solutions using a super adsorbent based on crosslinked poly(vinyl alcohol) hydrogel. Journal of Applied Polymer Science 2017, 135(11), 45964. [CrossRef]
- Cosgrove, S.; Jefferson, B.; Jarvis, P. Pesticide removal from drinking water sources by adsorption: a review. Environmental Technology Reviews 2019, 8(1), 1–24. [CrossRef]
- Kumar, P.; Singh, H.; Kapur, M.; Mondal, M.K. Comparative study of malathion removal from aqueous solution by agricultural and commercial adsorbents. Journal of Water Process Engineering 2014, 3, 67–73. [CrossRef]
- Okoya, A.A.; Sonaike, T.O.; Adekunle, O.K. Effect of application rates of selected natural pesticides on soil biochemical parameters and litter decomposition. African Journal of Agricultural Research 2014, 9(50), 3655-3662.
- Okoya, A.A.; Ogunfowokan, A.O.; Asubiojo, O.I. Torto, N. Organochlorine pesticide residues in sediments and waters from cocoa producing areas of Ondo State, Southwestern Nigeria. International Scholarly Research Notices 2013a, Volume 2013, 12 pages. [CrossRef]
- Okoya, A.A.; Torto, N.; Ogunfowokan, A.O.; Asubiojo, O.I. Organochlorine (OC) pesticide residues in soils of major cocoa plantations in Ondo State, Southwestern Nigeria. African Journal of Agricultural Research 2013b, 8(28), 3842–3848. [CrossRef]
- Erhunmwunse, N.O.; Dirisu, A.; Olomukoro, J.O. Implications of pesticide usage in Nigeria. Tropical Freshwater Biology 2012, 21(1), 15–25. [CrossRef]
- Ojo, J. Pesticides use and health in nigeria. Ife Journal of Science 2016, 18(4), 981–991.
- Szewczyk, R.; Różalska, S.; Mironenka, J.; Bernat, P. Atrazine biodegradation by mycoinsecticide Metarhizium robertsii: Insights into its amino acids and lipids profile. Journal of Environmental Management 2020, 262, p.110304. [CrossRef]
- Pathak, R.K.; Dikshit, A.K. Atrazine and human health. Int. J. Ecosyst 2011, 1(1), 14–23.
- Hansen, S.P.; Messer, T.L.; Mittelstet, A.R. Mitigating the risk of atrazine exposure: identifying hot spots and hot times in surface waters across Nebraska, USA. Journal of Environmental Management 2019, 250, 109424. [CrossRef]
- Lu, J.; Li, R.; Chang, Y.; Zhang, Y.; Zhang, N.; Tao, L.; Xu, W. Effects of different parameters on the removal of atrazine in a water environment by Aspergillus oryzae biosorption. Journal of Pesticide Science 2021, 46(2), 214-221.
- Bhatt, P.; Sethi, K.; Gangola, S.; Bhandari, G.; Verma, A.; Adnan, M.; Singh, Y.; Chaube, S. Modeling and simulation of atrazine biodegradation in bacteria and its effect in other living systems. Journal of Biomolecular Structure and Dynamics 2022., 40(7), 3285–3295. [CrossRef]
- Varol, S.; Başarslan, S.K.; Fırat, U.; Alp, H.; Uzar, E.; Arıkanoğlu, A.; Evliyaoğlu, O.; Acar, A.; Yücel, Y.; Kıbrıslı, E.; Gökalp, O. Detection of borderline dosage of malathion intoxication in a rat’s brain. Eur. Rev. Med. Pharm. Sci 2015,19, 2318–2323.
- Bossi, R.; Vinggaard, A.M.; Taxvig, C.; Boberg, J.; Bonefeld-Jørgensen, E.C. Levels of pesticides and their metabolites in Wistar rat amniotic fluids and maternal urine upon gestational exposure. International journal of environmental research and public health 2013, 10(6), 2271–2281. [CrossRef]
- Navarrete-Meneses, M.P.; Salas-Labadía, C; Sanabrais-Jiménez, M.; Santana-Hernández, J.; Serrano-Cuevas, A.; Juárez-Velázquez, R.; Olaya-Vargas, A.; Pérez-Vera, P. Exposure to the insecticides permethrin and malathion induces leukemia and lymphoma-associated gene aberrations in vitro. Toxicology in Vitro 2017, 44, 17–26. [CrossRef]
- Okoya, A.A.; Adegbaju, O.S.; Akinyele, A.B.; Akinola, O.E.; Amuda, O.S. Comparative assessment of the efficiency of rice husk biochar and conventional water treatment method to remove chlorpyrifos from pesticide polluted water. Current Journal of Applied Science and Technology 2020, 39(2), 1-11. [CrossRef]
- Zhang, C.; Zhang, R.Z.; Ma, Y.Q.; Guan, W.B.; Wu, X.L.; Liu, X.; Li, H.; Du, L.Y.; Pan, C.P. Preparation of cellulose/graphene composite and its applications for triazine pesticides adsorption from water. ACS Sustainable Chemistry & Engineering 2015, 3(3), 396–405. [CrossRef]
- Mukherjee, A.; Mehta, R.; Saha, S.; Bhattacharya, A.; Biswas, P.K.; Kole, R.K. Removal of multiple pesticide residues from water by low-pressure thin-film composite membrane. Applied Water Science, 2020, 10, 1–8. 10:244. [CrossRef]
- Rasheed, T.; Bilal, M.; Nabeel, F.; Adeel, M.; Iqbal, H.M. Environmentally-related contaminants of high concern: potential sources and analytical modalities for detection, quantification and treatment. Environ Int 2018, . [CrossRef]
- Bilal, M.; Rasheed, T.; Nabeel, F.; Iqbal, H.M.N.; Zhao, Y. Hazardous contaminants in the environment and their laccase-assisted degradation – A review. Journal of Environmental Management 2019, 234, 253–264. [CrossRef]
- Mukherjee, A.; Saha, S.; Ghosh, S.; Purkait, A.; Biswas, P.K.; Kole, R.K. Removal of pesticide residues by mesoporous alumina from water. International Journal of Chemical Studies 2019, 7(3), 1719–1725.
- KPMG. Rice industry review https://assets.kpmg/content/dam/kpmg/ng/pdf/ audit/rice-industry-review.pdf 2019, (Accessed 7/13/2021).
- Chieng, S.; Kuan, S. H. Harnessing bioenergy and high value–added products from rice residues: a review. Biomass Conversion and Biorefinery 2022, 12(8), 35473571. [CrossRef]
- Zhou, C.; Wang, Y. Recent progress in the conversion of biomass wastes into functional materials for value-added applications. Science and Technology of Advanced Materials 2020, 21(1), 787–804. [CrossRef]
- Rudovica, V.; Rotter, A.; Gaudêncio, S.P.; Novoveská, L.; Akgül, F.; Akslen-Hoel, L.K.; Alexandrino, D.A.; Anne, O.; Arbidans, L.; Atanassova, M.; Burlakovs, J. Valorization of marine waste: use of industrial by-products and beach wrack towards the production of high added-value products. Frontiers in marine science 2021, 8, 723333. [CrossRef]
- Buzea, C.; Pacheco, I.; Robbie, K. Nanomaterials and nanoparticles: sources and toxicity. Biointerphases 2007, 2, MR17–MR71. [CrossRef]
- Jassal, V.; Shanker, U.; Kaith, B.S. Aeglemarmelos mediated green synthesis of different nano-structured metal hexacyanoferrates: Activity against photodegradation of harmful organic dyes. Scientifica 2016, 1–13. [CrossRef]
- Rani, M.; Shanker, U.; Jassal, V. Recent strategies for removal and degradation of persistent & toxic organochlorine pesticides using nanoparticles: A review. Journal of Environmental Management 2017, 190, 208–222. [CrossRef]
- Abdeen, Z.; Mohammad. S.G. Study of the adsorption efficiency of an eco-friendly carbohydrate polymer for contaminated aqueous solution by organophosphorus pesticide. Open Journal of Organic Polymer Materials 2014., 4, 16–28 DOI:10.4236/ojopm.2014.41004.
- Okoya, A.A.; Akinyele, A.B.; Amuda, O.S.; Ofoezie, I.E. Chitosan-grafted carbon for the sequestration of heavy metals in aqueous solution. American Chemical Science Journal. 2016, 11(3), 1–14. [CrossRef]
- Dare, E.O.; Bello, A.O. Extraction of nanosilica from bagasse ash. unpublished undergraduate project, 2009, university of agriculture, abeokuta.
- Shaikh, I.R.; Shaikh, A.A. Utilization of wheat husk ash as silica source for the synthesis of MCM-41 type mesoporous silicates: A sustainable approach towards valorisation of the agricultural waste stream. Research Journal of Chemical Sciences 2013, 3(11), 66–72.
- Ghorbani, F.; Younesi, H.; Mehraban, Z.; Mehmet, S.C.; Ghoreyshi, A.A.; Anbia, M. Preparation and characterization of highly pure silica from sedge as agricultural waste and its utilization in the synthesis of mesoporous silica MCM-41. Journal of the Taiwan Institute of Chemical Engineers 2013, 44, 821–828. [CrossRef]
- Bhagiyalakshmi, M.; Yun, L.J.; Anuradha, R.; Jang, H.T. Utilization of rice husk ash as silica source for the synthesis of mesoporous silicas and their application to CO2 adsorption through TREN/TEPA grafting. Journal of Hazard Materials. 2010, 175, 928–38. [CrossRef]
- Kecili, R.; Hussain, C.M. Mechanism of adsorption on nanomaterials. Nanomaterials in Chromatography. 2018, 89–115. doi:10.1016/B978-0-12-812792-6.00004-2.
- Okoronkwo, E.A.; Imoisili, P.E.; Olubayode, S.A.; Olusunle, S.O.O. Development of silica nanoparticle from corn cob ash. Advances in Nanoparticles 2016, 5, 135–139. 10.4236/anp.2016.52015.
- Saceda, J.F.; de Leon, R.L. Properties of silica from rice husk and rice husk ash and their utilization for zeolite Y synthesis. Quim. Nova 2011, 34(8), 1394–1397. [CrossRef]
- Zhang, H.; Tan, H.; Wang, H.; Zhao, B.; Wei, Y.; Sun, Z.; Zhang, H.; Tan, H.; Wang, H.; Zhao, B.; Wei, Y.; Sun, Z.; Gao, L.; Zhong, L.; Dong, Q.; Zang, H. Research on the secondary structure and hydration water around human serum albumin induced by ethanol with infrared and near-infrared spectroscopy. Journal of Molecular Structure 2023, 1275, 134684.
- Li, N.; Guo, Q.; Wang, Q.; Liao, L. Water characterization and structural attribution of different colored opals. RSC advances 2022, 12(47), 30416–30425. [CrossRef]
- Malfait, B.; Moréac, A.; Jani, A.; Lefort, R.; Huber, P.; Fröba, M.; Morineau, D. Structure of water at hydrophilic and hydrophobic interfaces: Raman spectroscopy of water confined in periodic mesoporous (organo) silicas. The Journal of Physical Chemistry C 2022, 126(7), 3520-3531 . [CrossRef]
- Foroutan, R.; Mohammadi, R.; Peighambardoust, S.J.; Jalali, S.; Ramavandi, B. Application of nano-silica particles generated from offshore white sandstone for cadmium ions elimination from aqueous media. Environmental Technology & Innovation 2020, 19, 101031–. [CrossRef]
- Kamble, M.; Salvi, H.; Yadav, G.D. Preparation of amino-functionalized silica supports for immobilization of epoxide hydrolase and cutinase: characterization and applications. Journal of Porous Materials 2020. [CrossRef]
- Imoisili, P.E.; Ukoba, K.O.; Tien-Chien, J. Synthesis and characterization of amorphous mesoporous silica from palm kernel shell ash. boletín de la sociedad española de cerámica y vidrio 2020a, 59, 159–164. [CrossRef]
- Imoisili, P.E.; Ukoba, K.O.; Tien-Chien, J. Green technology extraction and characterisation of silica nanoparticles from palm kernel shell ash via sol–gel. J Mater Res Technol 2020b, 9(1), 307–313. [CrossRef]
- Wei, X.; Wu, Z.; Du, C.; Wu, Z.; Ye, B.; Cravotto, G. Enhanced adsorption of atrazine on a coal-based activated carbon modified with sodium dodecyl benzene sulfonate under microwave heating. Taiwan Institute of Chemical Engineers 2017, 77, 257–262. [CrossRef]
- Tahir, M.A.; Bhatti, H.N.; Hussain, I.; Bhatti, I.A.; Asghar, M. Sol–Gel Synthesis of mesoporous silica–iron composite: Kinetics, equilibrium and thermodynamics studies for the adsorption of Turquoise-Blue X-GB Dye. Zeitschrift für Physikalische Chemie 2019. [CrossRef]
- Alsherbeny, S.; Jamil, T.S.; El-Sawi, S.A.; Eissa, F.I. Low-cost corn cob biochar for pesticides removal from water. Egyptian Journal of Chemistry 2022., 65(2), .639–650. [CrossRef]
- Gurmessa, B. K.; Taddesse, A.M.; Teju, E. UiO-66 (Zr-MOF): Synthesis, characterization, and application for the removal of malathion and 2, 4-d from aqueous solution. Environmental Pollutants and Bioavailability 2023, 35(1), p2222910. [CrossRef]
- Sun, J.; Ma, X.L.; Wang, W.; Zhang, J.; Zhang, H.; Wang, Y.J.; Feng, J. The adsorption behavior of atrazine in common soils in northeast China. Bulletin of Environmental Contamination and Toxicology 2019, 103, 316–322.
- Rissouli, L., Benicha, M., Chafik, T., Chabbi, M., Decontamination of water polluted with pesticide using biopolymers: Adsorption of glyphosate by chitin and chitosan. J Mater Environ Sci 2017, 8(12), 4544-4549.
- Hamadi, N.K.; Swaminathan, S.; Chen, X.D. Adsorption of paraquat dichloride from aqueous solution by activated carbon derived from used tires. Journal of Hazardous Materials 2004, 122:133–141. [CrossRef]
- Senthilkumaar, S.; Krishna, S.K.; Kalaamani, P.; Subburamaan, C.V.; Ganapathi, N. Adsorption of organophosphorous pesticide from aqueous solution using “waste” jute fiber carbon. Modern Applied Science 2010., 4(6), 67–83.
- Nor, A.B.; Hanisah, M.N.; Mohd, Y.I.; Noorain, M.I.; Mohd, A.H.; Ahmad, Z.A. Highly efficient removal of diazinon pesticide from aqueous solutions by using coconut shell-modified biochar, Arabian Journal of Chemistry 2020, 13(7), 6106–6121, . [CrossRef]
- Shoukat, S.; Bhatti, H.N., Iqbal, M., Noreen, S. Mango stone biocomposite preparation and application for crystal violet adsorption: a mechanistic study. Microporous and Mesoporous Materials 2017, 239, 180–189. [CrossRef]
- Ishtiaq, F.; Bhatti, H.N.; Khan, A.; Iqbal, M.; Kausar, A. Polypyrole, polyaniline and sodium alginate biocomposites and adsorption-desorption efficiency for imidacloprid insecticide. International Journal of Biological Macromolecules 2020, 147, 217–232. [CrossRef]
- Mushtaq, M.; Bhatti, H.N.; Iqbal, M.; Noreen, S. Eriobotrya japonica seed biocomposite efficiency for copper adsorption: Isotherms, kinetics, thermodynamic and desorption studies. Journal of Environmental Management 2016, 176, 21–33. [CrossRef]
- Sellaoui, L.; Gómez-Avilés, A.; Dhaouadi, F.; Bedia, J.; Bonilla-Petriciolet, A.; Rtimi, S.; Belver, C. Adsorption of emerging pollutants on lignin-based activated carbon: Analysis of adsorption mechanism via characterization, kinetics and equilibrium studies. Chemical Engineering Journal 2023, 452, 139399. [CrossRef]
- Elwakeel, K.Z.; Yousif, A.M. Adsorption of malathion on thermally treated egg shell material. Water science and Technology 2010, 1035–1041. [CrossRef]
- Okoya, A.A.; Diisu, D. Adsorption of indigo-dye from textile wastewater onto activated carbon prepared from sawdust and periwinkle shell. Trends Applied Sci. Res 2021, 16, 1–9. [CrossRef]
- Alrefaee, S. H.; Aljohani, M.; Alkhamis, K.; Shaaban, F.; El-Desouky, M. G.; El-Bindary, A. A.; El-Bindary, M. A. Adsorption and effective removal of organophosphorus pesticides from aqueous solution via novel metal-organic framework: Adsorption isotherms, kinetics, and optimization via Box-Behnken design. Journal of Molecular Liquids 2023, 384, 122206.
- Hassan, A.A.; Sajid, M.; Tanimu, A.; Abdulazeez, I.; Alhooshani, K. Removal of methylene blue and rose bengal dyes from aqueous solutions using 1-naphthylammonium tetrachloroferrate (III), Journal of Molecular Liquids 2021, 322, 114966, . [CrossRef]
- Naushad, M.; ALOthman, Z.A.; Khan, M.R.; ALQahtani, N.J.; ALSohaimi, I.H. Equilibrium, kinetics and thermodynamic studies for the removal of organophosphorus pesticide using Amberlyst-15 resin: Quantitative analysis by liquid chromatography–mass spectrometry. Journal of Industrial and Engineering Chemistry 2014. [CrossRef]
- Jusoh, A.; Hartini, W.J.H.; Ali, N.; Endut, A. Study on the removal of pesticide in agricultural run off by granular activated carbon. Bioresource Technology 2011, 102, 5312 – 5318.
- Azarkan, S.; Peña, A.; Draoui, K.; Sainz-Diaz, C.I. X Adsorption of two fungicides on natural clays of Morocco. Appl Clay Sci 2011, 123, 37–46. [CrossRef]
- Salvestrini, S.; Sagliano, P.; Iovino, P.; Capasso, S.; Colella, C. Atrazine adsorption by acid-activated zeolite-rich tuffs. Appl Clay Sci 2010, 49, 330–5. [CrossRef]
- Salmani, M.H.; Ehrampoush, M.H.; Eslami, H.; Eftekhar, B. Synthesis, characterization and application of mesoporous silica in removal of cobalt ions from contaminated water. Groundwater for sustainable development 2020, 11, 100425. [CrossRef]
- Naushad, M.; ALOthman, Z.A.; Khan, M.R. Removal of malathion from aqueous solution using De-Acidite FF-IP resin and determination by UPLC–MS/MS: Equilibrium, kinetics and thermodynamics studies. Talanta 2013, 115, 15–23. [CrossRef]
- Liu, H.; Chen, W. Magnetic mesoporous imprinted adsorbent based on Fe3O4-modified sepiolite for organic micropollutant removal from aqueous solution. RSC Adv 2015, 5, 27034–42. [CrossRef]
- Wang, P.; Yin, Y.; Guo, Y.; Wang, C. Preponderant adsorption for chlorpyrifos over atrazine by wheat straw-derived biochar: experimental and theoretical studies. RSC Adv 2016, 6, 10615–24. [CrossRef]
- Vijayakumar, G.; Tamilarasan, R.; Dharmendirakumar, M. Adsorption, kinetic, equilibrium and thermodynamic studies on the removal of basic dye Rhodamine-B from aqueous solution by the use of natural adsorbent perlite. J. Mater. Environ. Sci 2012, 3(1), 157-170.
- Kumar, P.S.; Ramakrishnan, K.; Kirupha, S.D.; Sivanesan, S. Thermodynamic and kinetic studies of cadmium adsorption from aqueous solution onto rice husk, Braz J Chem Eng 2010, 27, 347–355. [CrossRef]
- Kajjumba, W.G.; Emik, S.; Öngen, A.; Özcan, K.H.; Aydın, S. Modelling of adsorption kinetic processes—errors, theory and application. Advanced Sorption Process Applications 2018. [CrossRef]
- Akpomie, K.G.; Dawodu, F.A. Efficient abstraction of nickel (II) and manganese (II) ions from solution onto an alkaline-modified montmorillonite. J Taibah Uni Sci 2014, 8, 343–56. [CrossRef]
- Akpomie, K.G;, Dawodu, F.A. Potential of a low-cost bentonite for heavy metal abstraction from binary component system. Beni – Suef University Journal of Basic and Applied Sciences 2015, 4, 1–13. [CrossRef]
- Aharoni, C.; Tompkins, F.C. Kinetics of adsorption and desorption and the Elovich equation. In Advances in Catalysis and Related Subjects, Eley, D.D., Pines, H., Weisz, P.B., Eds.; Academic Press: New York, 1970, Volume 21, pp. 1–49. [CrossRef]
- Saleh, T. A. Kinetic models and thermodynamics of adsorption processes: Classification. In Interface science and technology 2022, Volume 34, pp. 65–97. [CrossRef]
- Singh, V.K.; Singh, R.S.; Tiwari, P.N.; Singh, J.K.; Gode, F.; Sharma, Y.C. Removal of malathion from aqueous solutions and waste water using fly ash. J Water Resource and Protection 2010, 2, 322–330. DOI:10.4236/jwarp.2010.24037.
- Agarwal, S.; Tyagi, I.; Gupta, V.K.; Fakhri, A.; Sadeghi, N. Adsorption of toxic carbamate pesticide oxamyl from liquid phase by newly synthesized and characterized graphene quantum dots nanomaterials. Journal of Colloid and Interface Science 2016. [CrossRef]
- Bruzzoniti, M.C.; De Carlo, R.M.; Rivoira, L.; Del Bubba, M.; Pavani, M.; Riatti, M.; Onida, B. Adsorption of bentazone herbicide onto mesoporous silica: application to environmental water purification. Environ Sci Pollut Res 2015, 1 - 11. [CrossRef]
- Aragaw, T. A.; Alene, A. N. A comparative study of acidic, basic, and reactive dyes adsorption from aqueous solution onto kaolin adsorbent: Effect of operating parameters, isotherms, kinetics, and thermodynamics. Emerging Contaminants 2022, 8, 59-74. [CrossRef]
- Mahmoudian, M.H.; Azari, A.; Jahantigh, A.; Sarkhosh, M.; Yousefi, M.; Razavinasab, S.A.; Afsharizadeh, M.; Shahraji, F.M.; Pasandi, A.P.; Zeidabadi, A.; Bardsiri, T.I. Statistical modeling and optimization of dexamethasone adsorption from aqueous solution by Fe3O4@ NH2-MIL88B nanorods: Isotherm, kinetics, and thermodynamic. Environmental Research 2023, 236, 116773. [CrossRef]
- Chen, X.; Hossain, M.F.; Duan, C.; Lu, J.; Tsang, Y.F.; Islam, M.S.; Zhou, Y. Isotherm models for adsorption of heavy metals from water-A review. Chemosphere 2022, 307, 135545.
- Yue, Y.; Adhab, A.H.; Sur, D.; Menon, S.V.; Singh, A.; Supriya, S.; Mishra, S.B.; Nathiya, D.; Mahdi, M.S.; Mansoor, A.S.; Radi, U.K.; Thermodynamic modelling adsorption behavior of a well-known gelation crosslinker on sandstone rocks. Scientific Reports 2025, 15(1), 22544. [CrossRef]
- Anirudhan, T.S.; Suchithra, P.S. Equilibrium, kinetic and thermodynamic modeling for the adsorption of heavy metals onto chemically modified hydrotalcite. Ind. J. Chem. Technol 2010, 17, 247–259.
- Yang, Y.; Wang, Y.; Zheng, C.; Lin, H.; Xu, R.; Zhu, H.; Bao, L.; Xu, X. Lanthanum carbonate grafted ZSM-5 for superior phosphate uptake: Investigation of the growth and adsorption mechanism. Chemical Engineering Journal 2022, 430, 133166. [CrossRef]
Figure 1.
Process Flow Diagram for Silica Extraction.
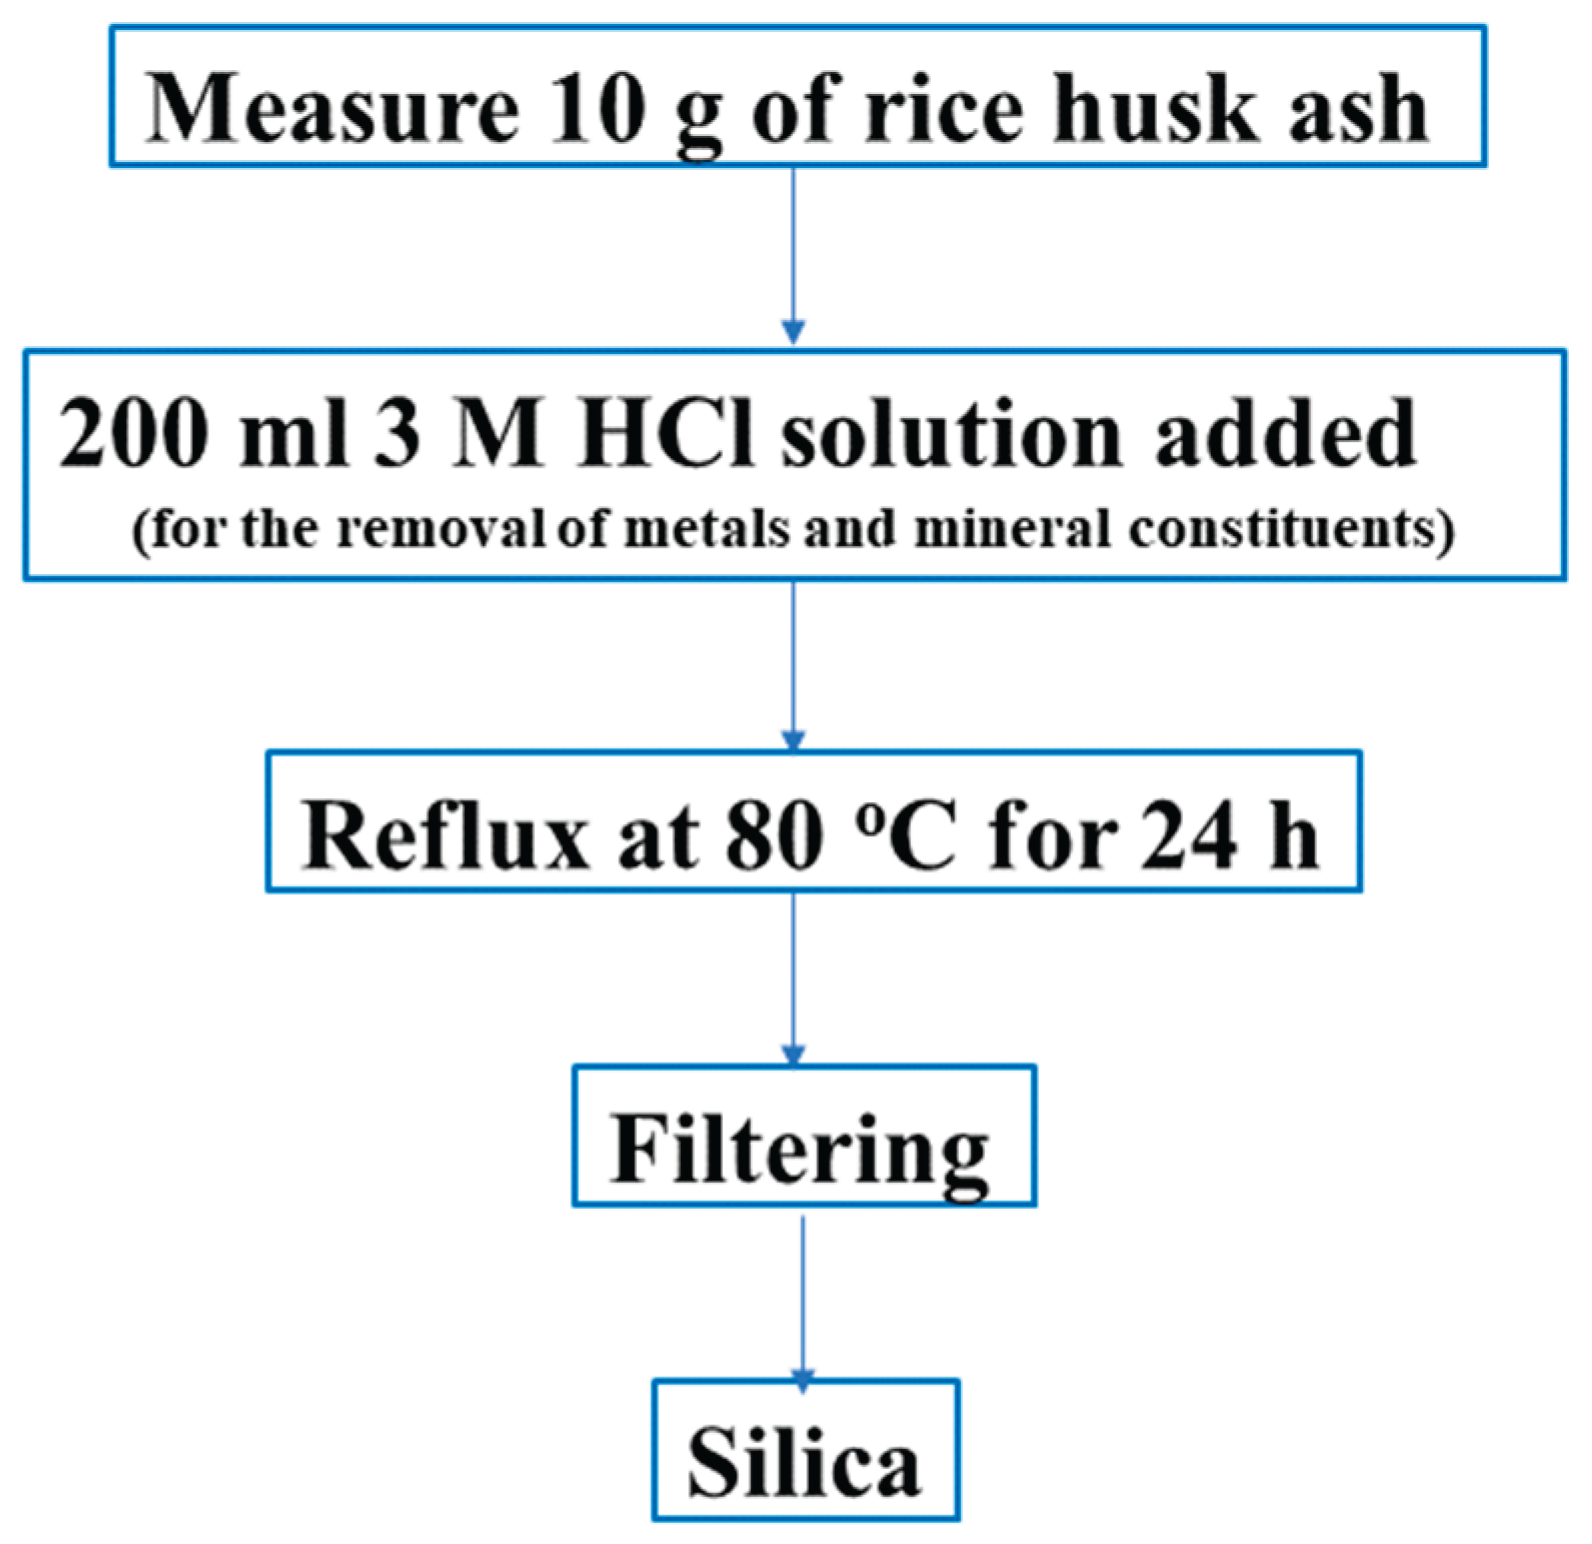
Figure 2.
The XRD pattern of RHS and PRHS.
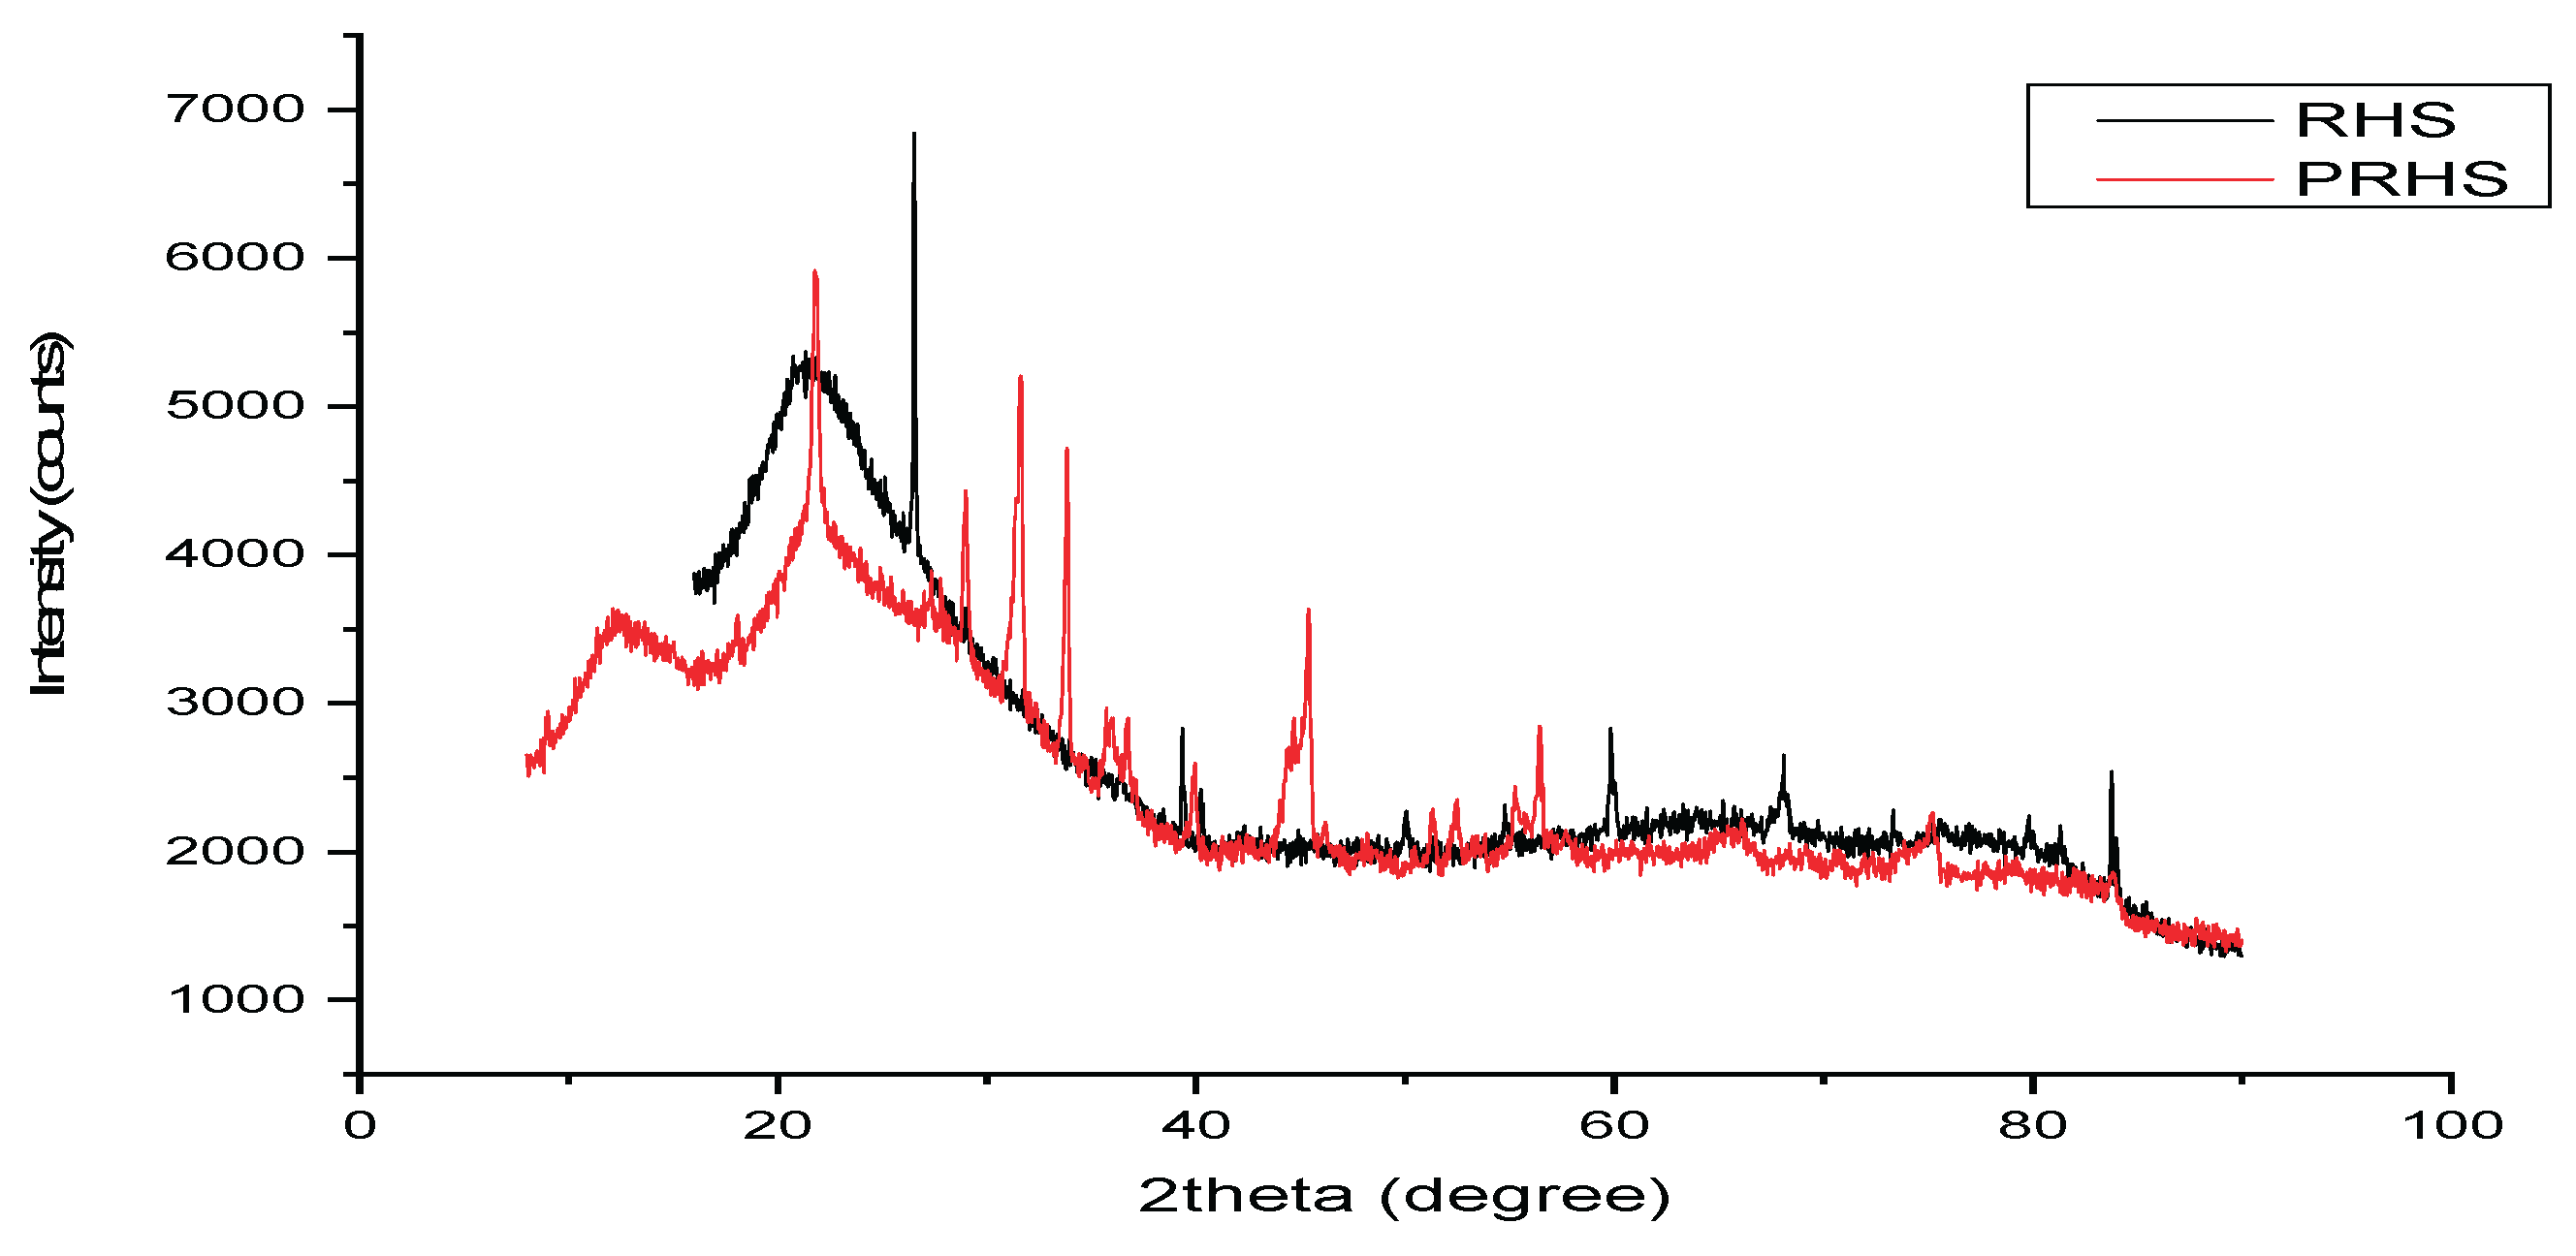
Figure 3.
FTIR Spectra of (a) RHS and (b) PRHS.
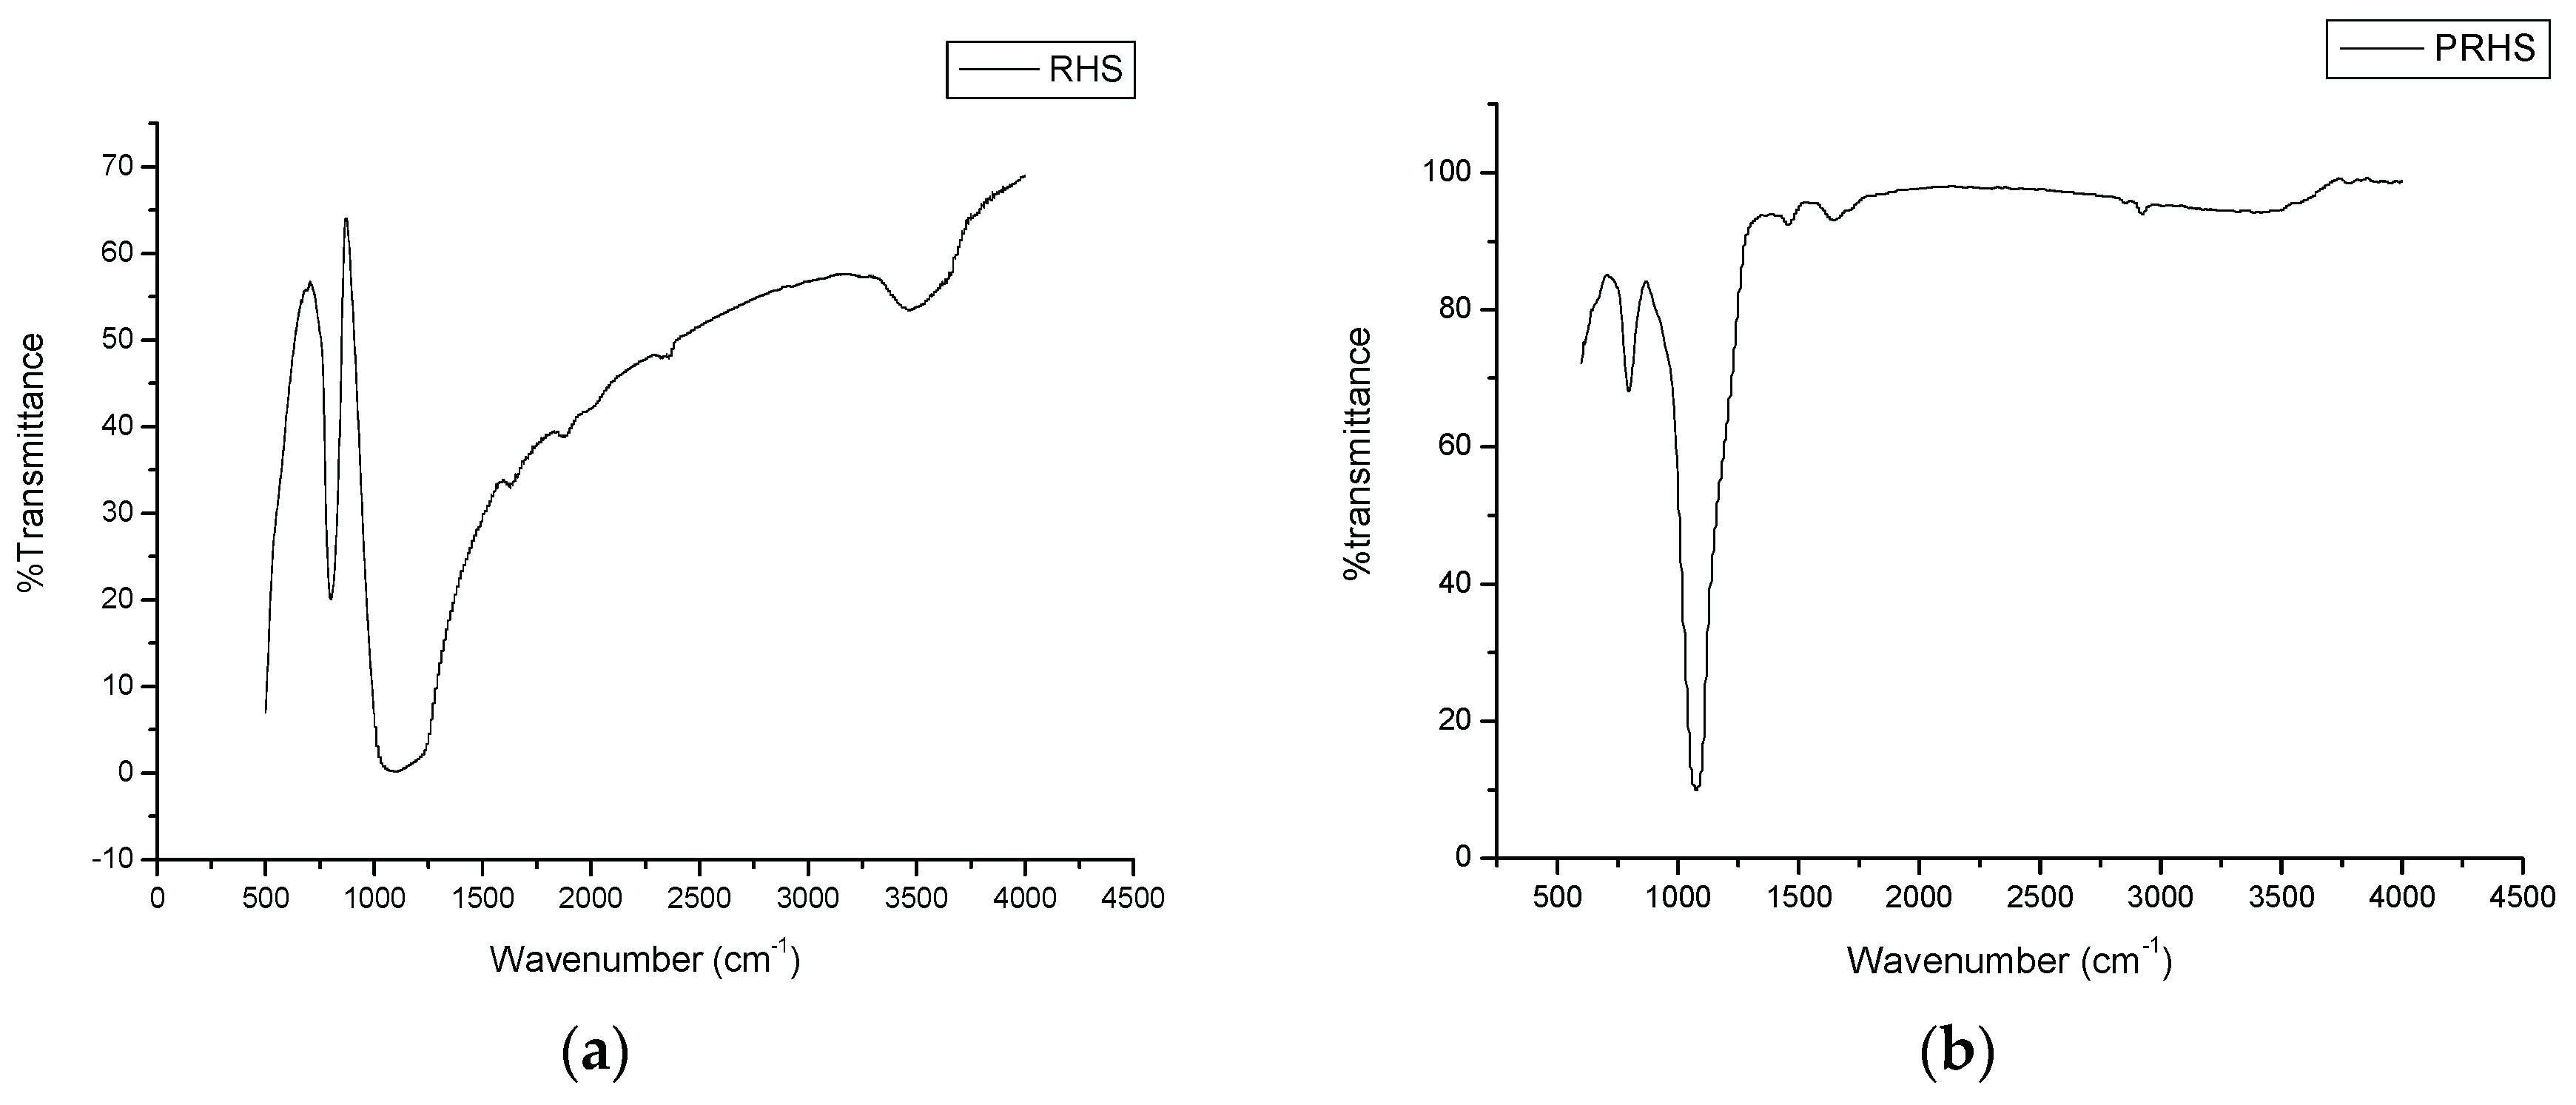
Figure 4.
SEM Image of (a) RHS (b) PRHS.
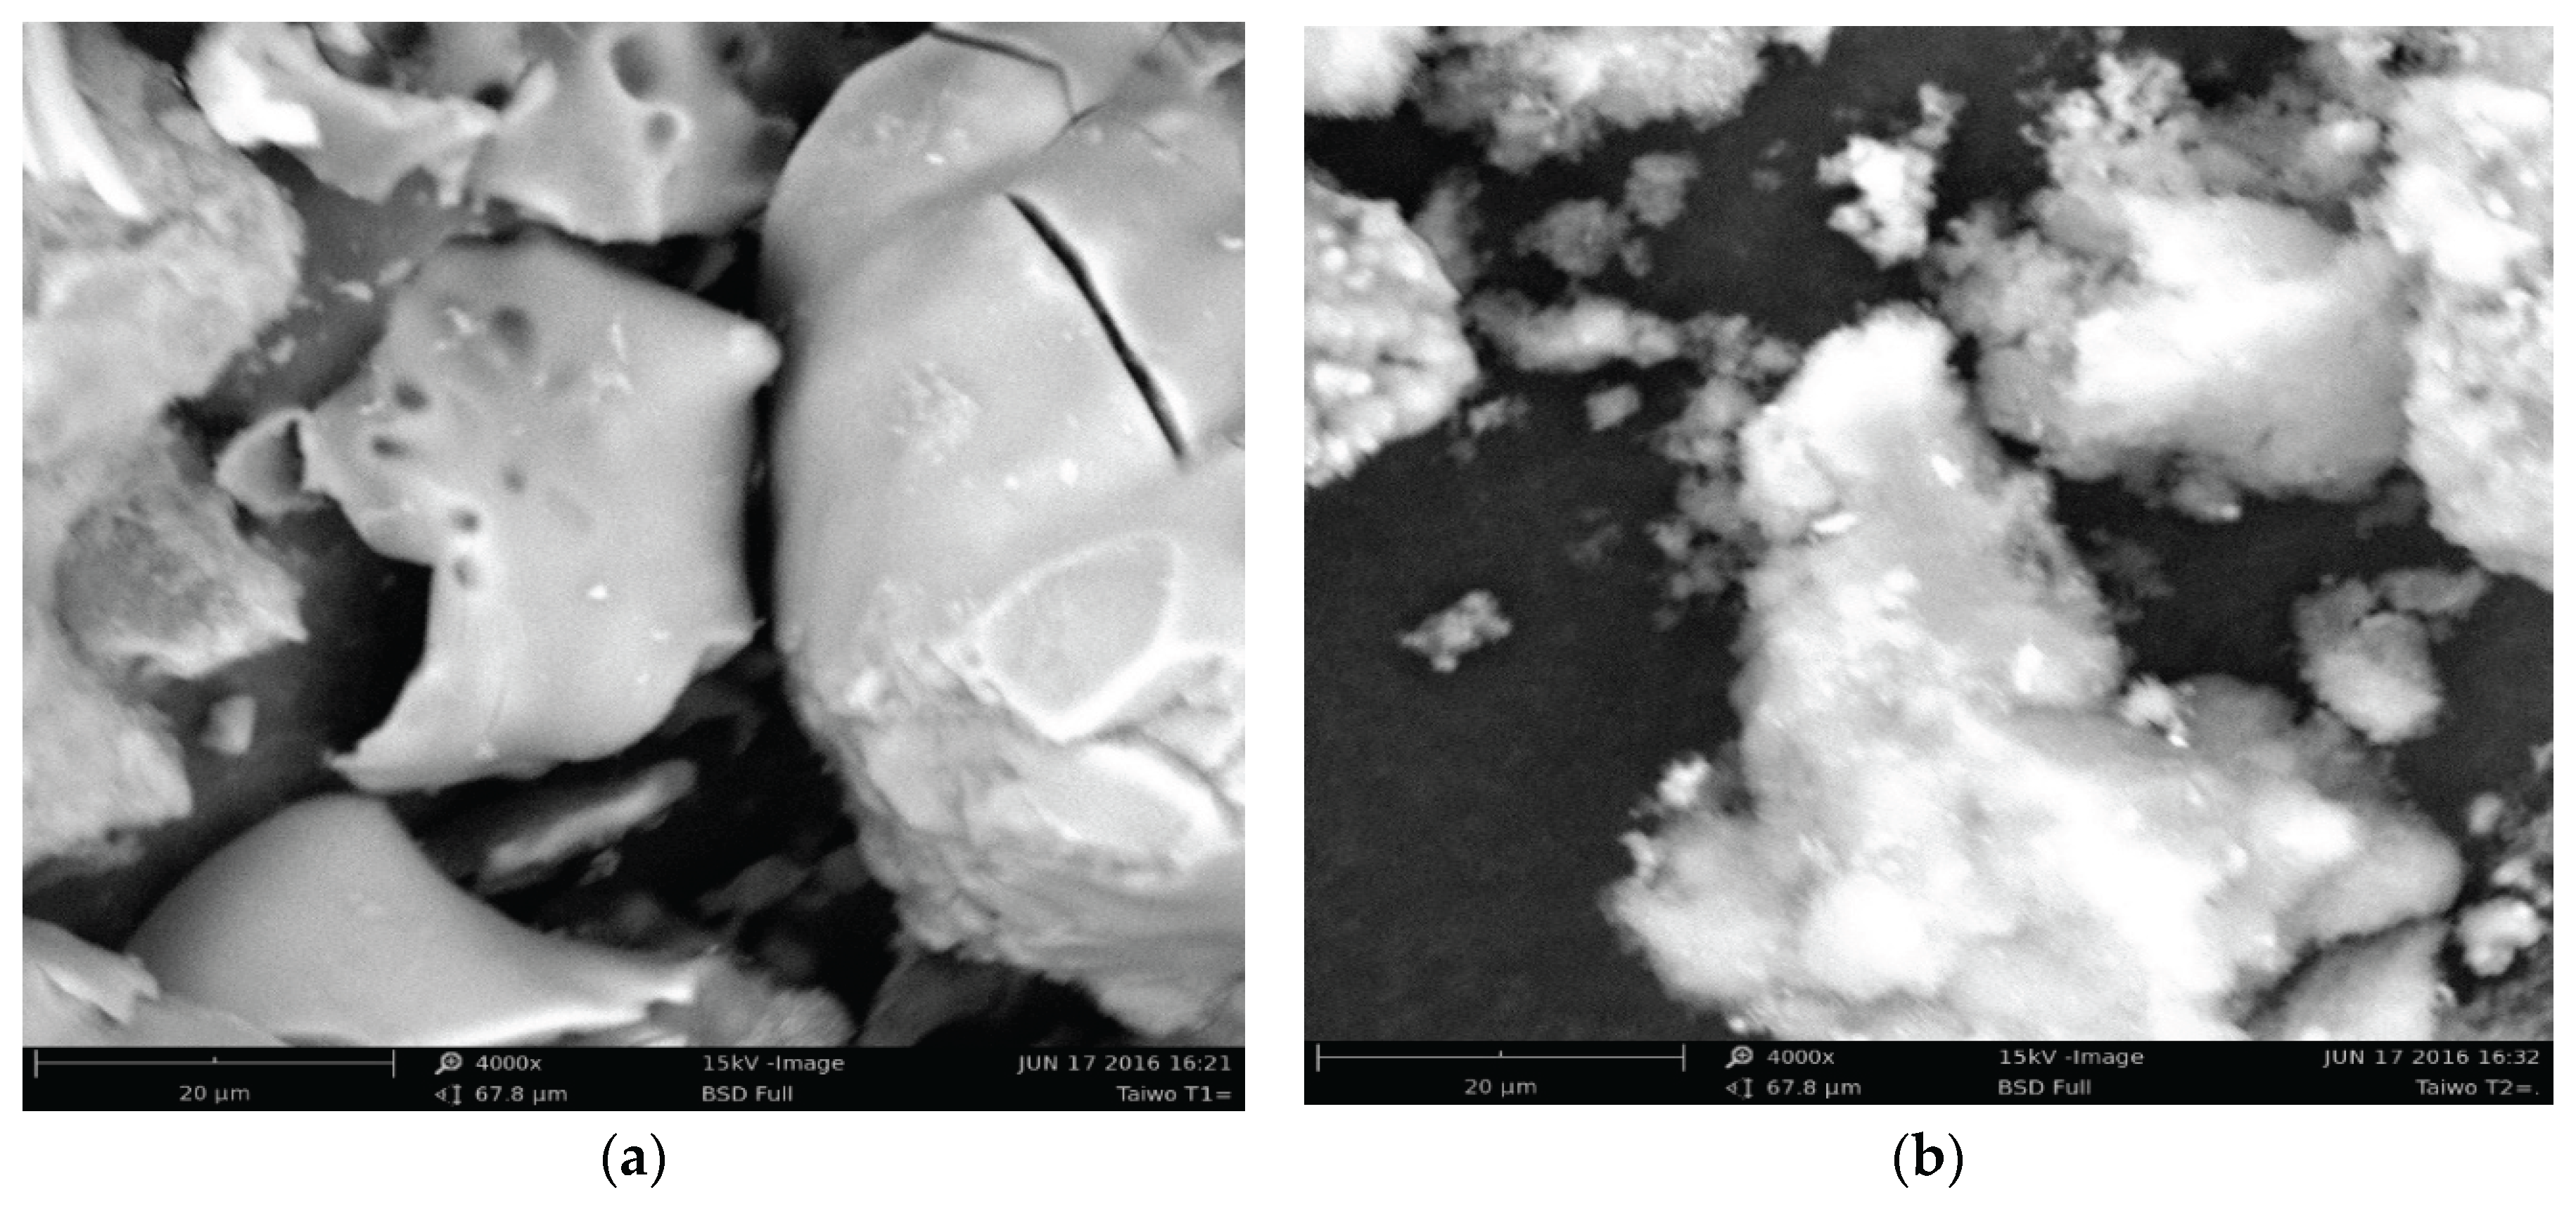
Figure 5.
HRTEM image of PRHS at (a)100 nm (b)50 nm (c) 10 nm.
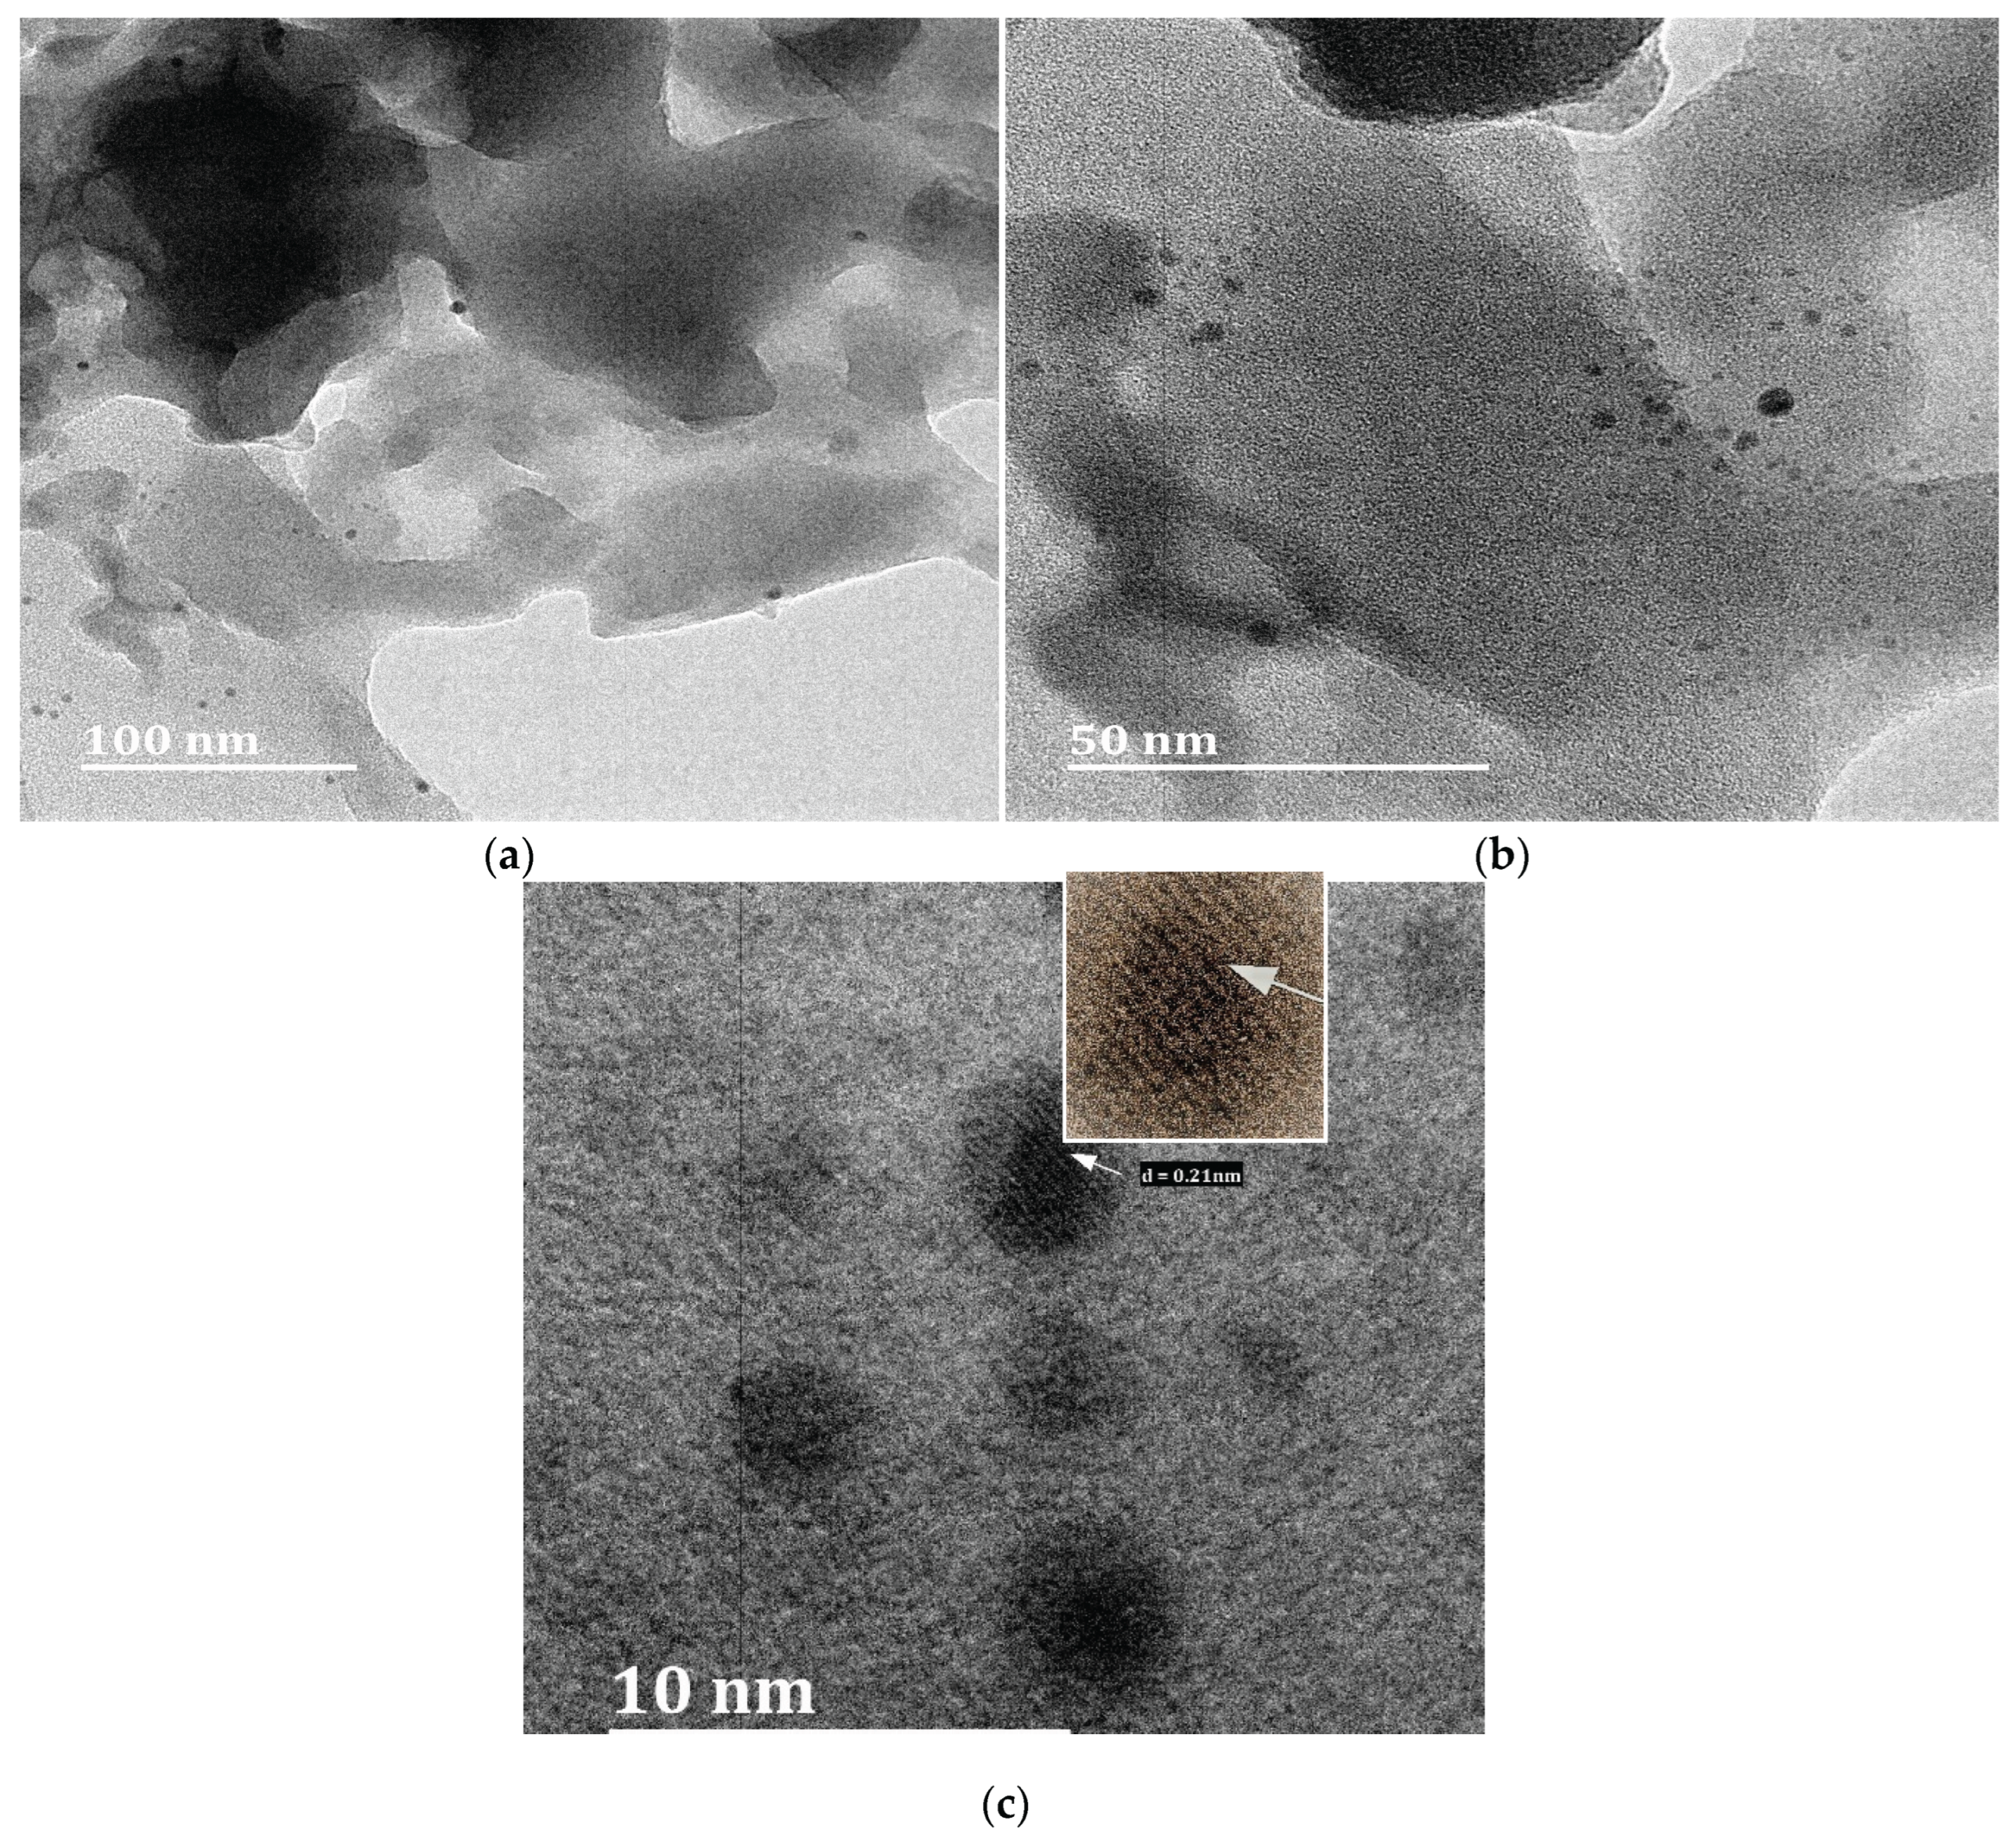
Figure 6.
Effect of pH on PRHS and MPRHS Percentage Removal of (a) Atrazine and (b) Malathion [Adsorbent dose: 0.8 g; initial concentration: 50 mg/l; contact time: 60 min; agitation speed: 150 osc/min].
Figure 6.
Effect of pH on PRHS and MPRHS Percentage Removal of (a) Atrazine and (b) Malathion [Adsorbent dose: 0.8 g; initial concentration: 50 mg/l; contact time: 60 min; agitation speed: 150 osc/min].
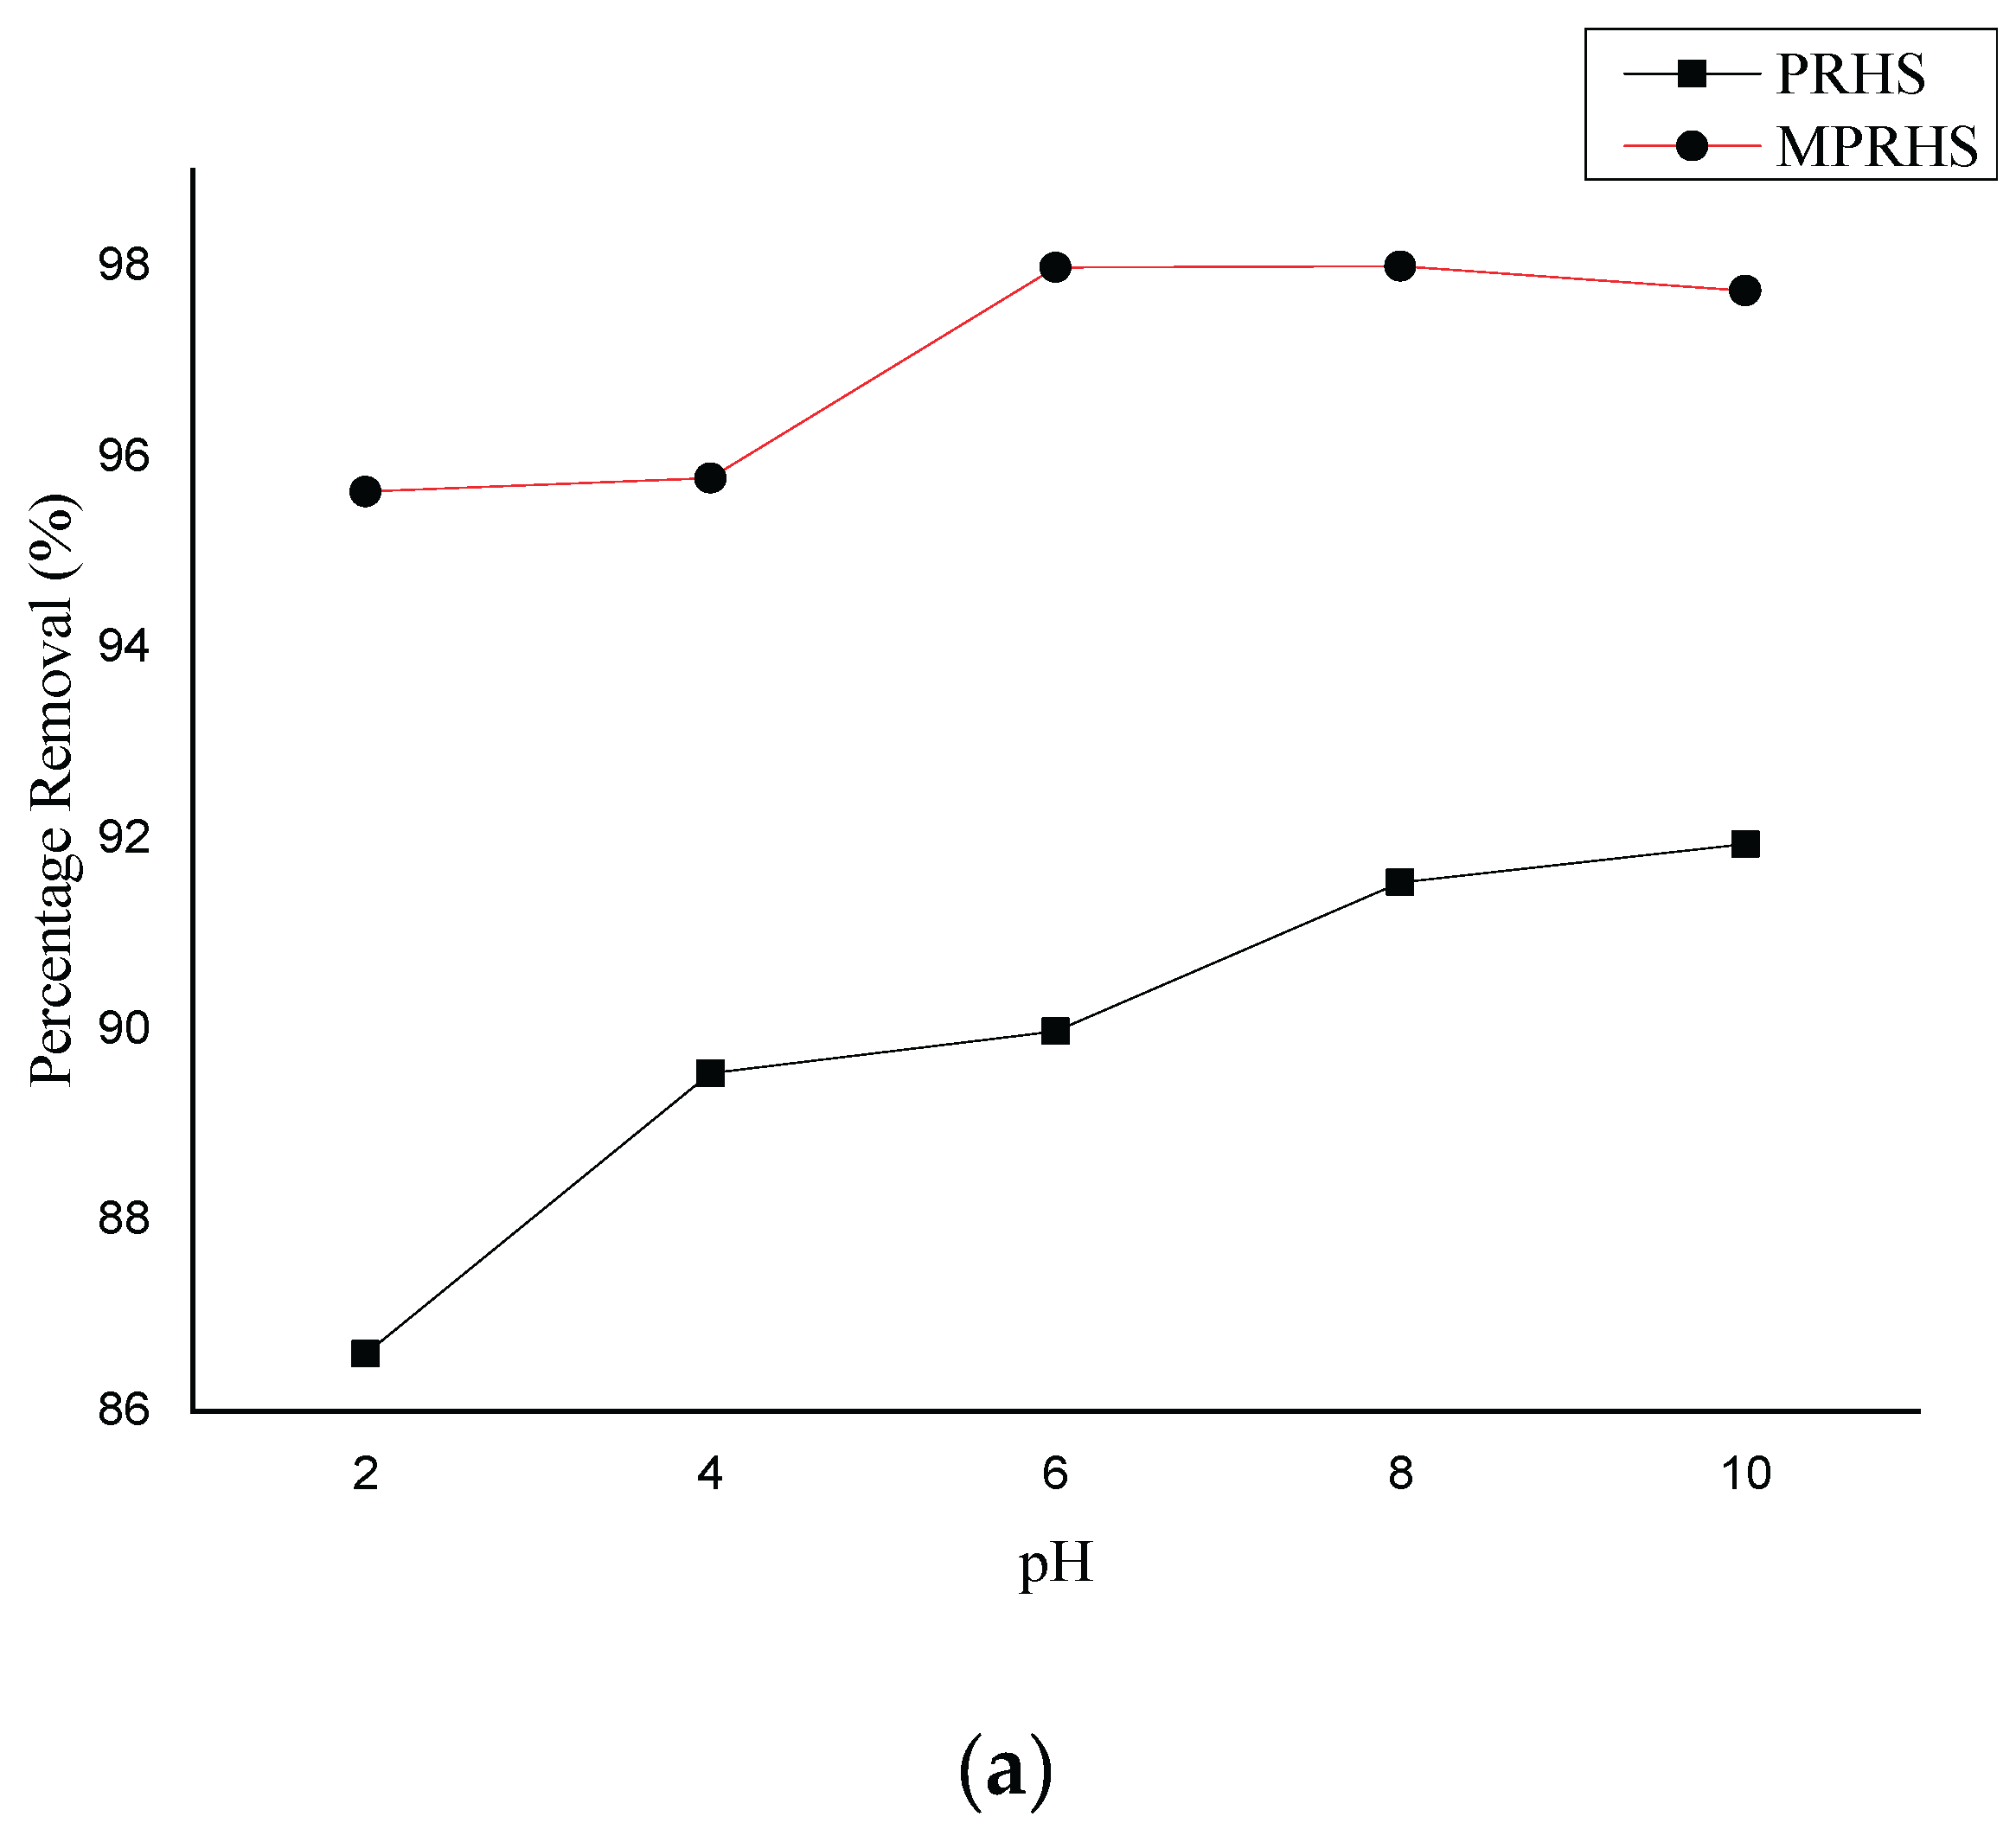
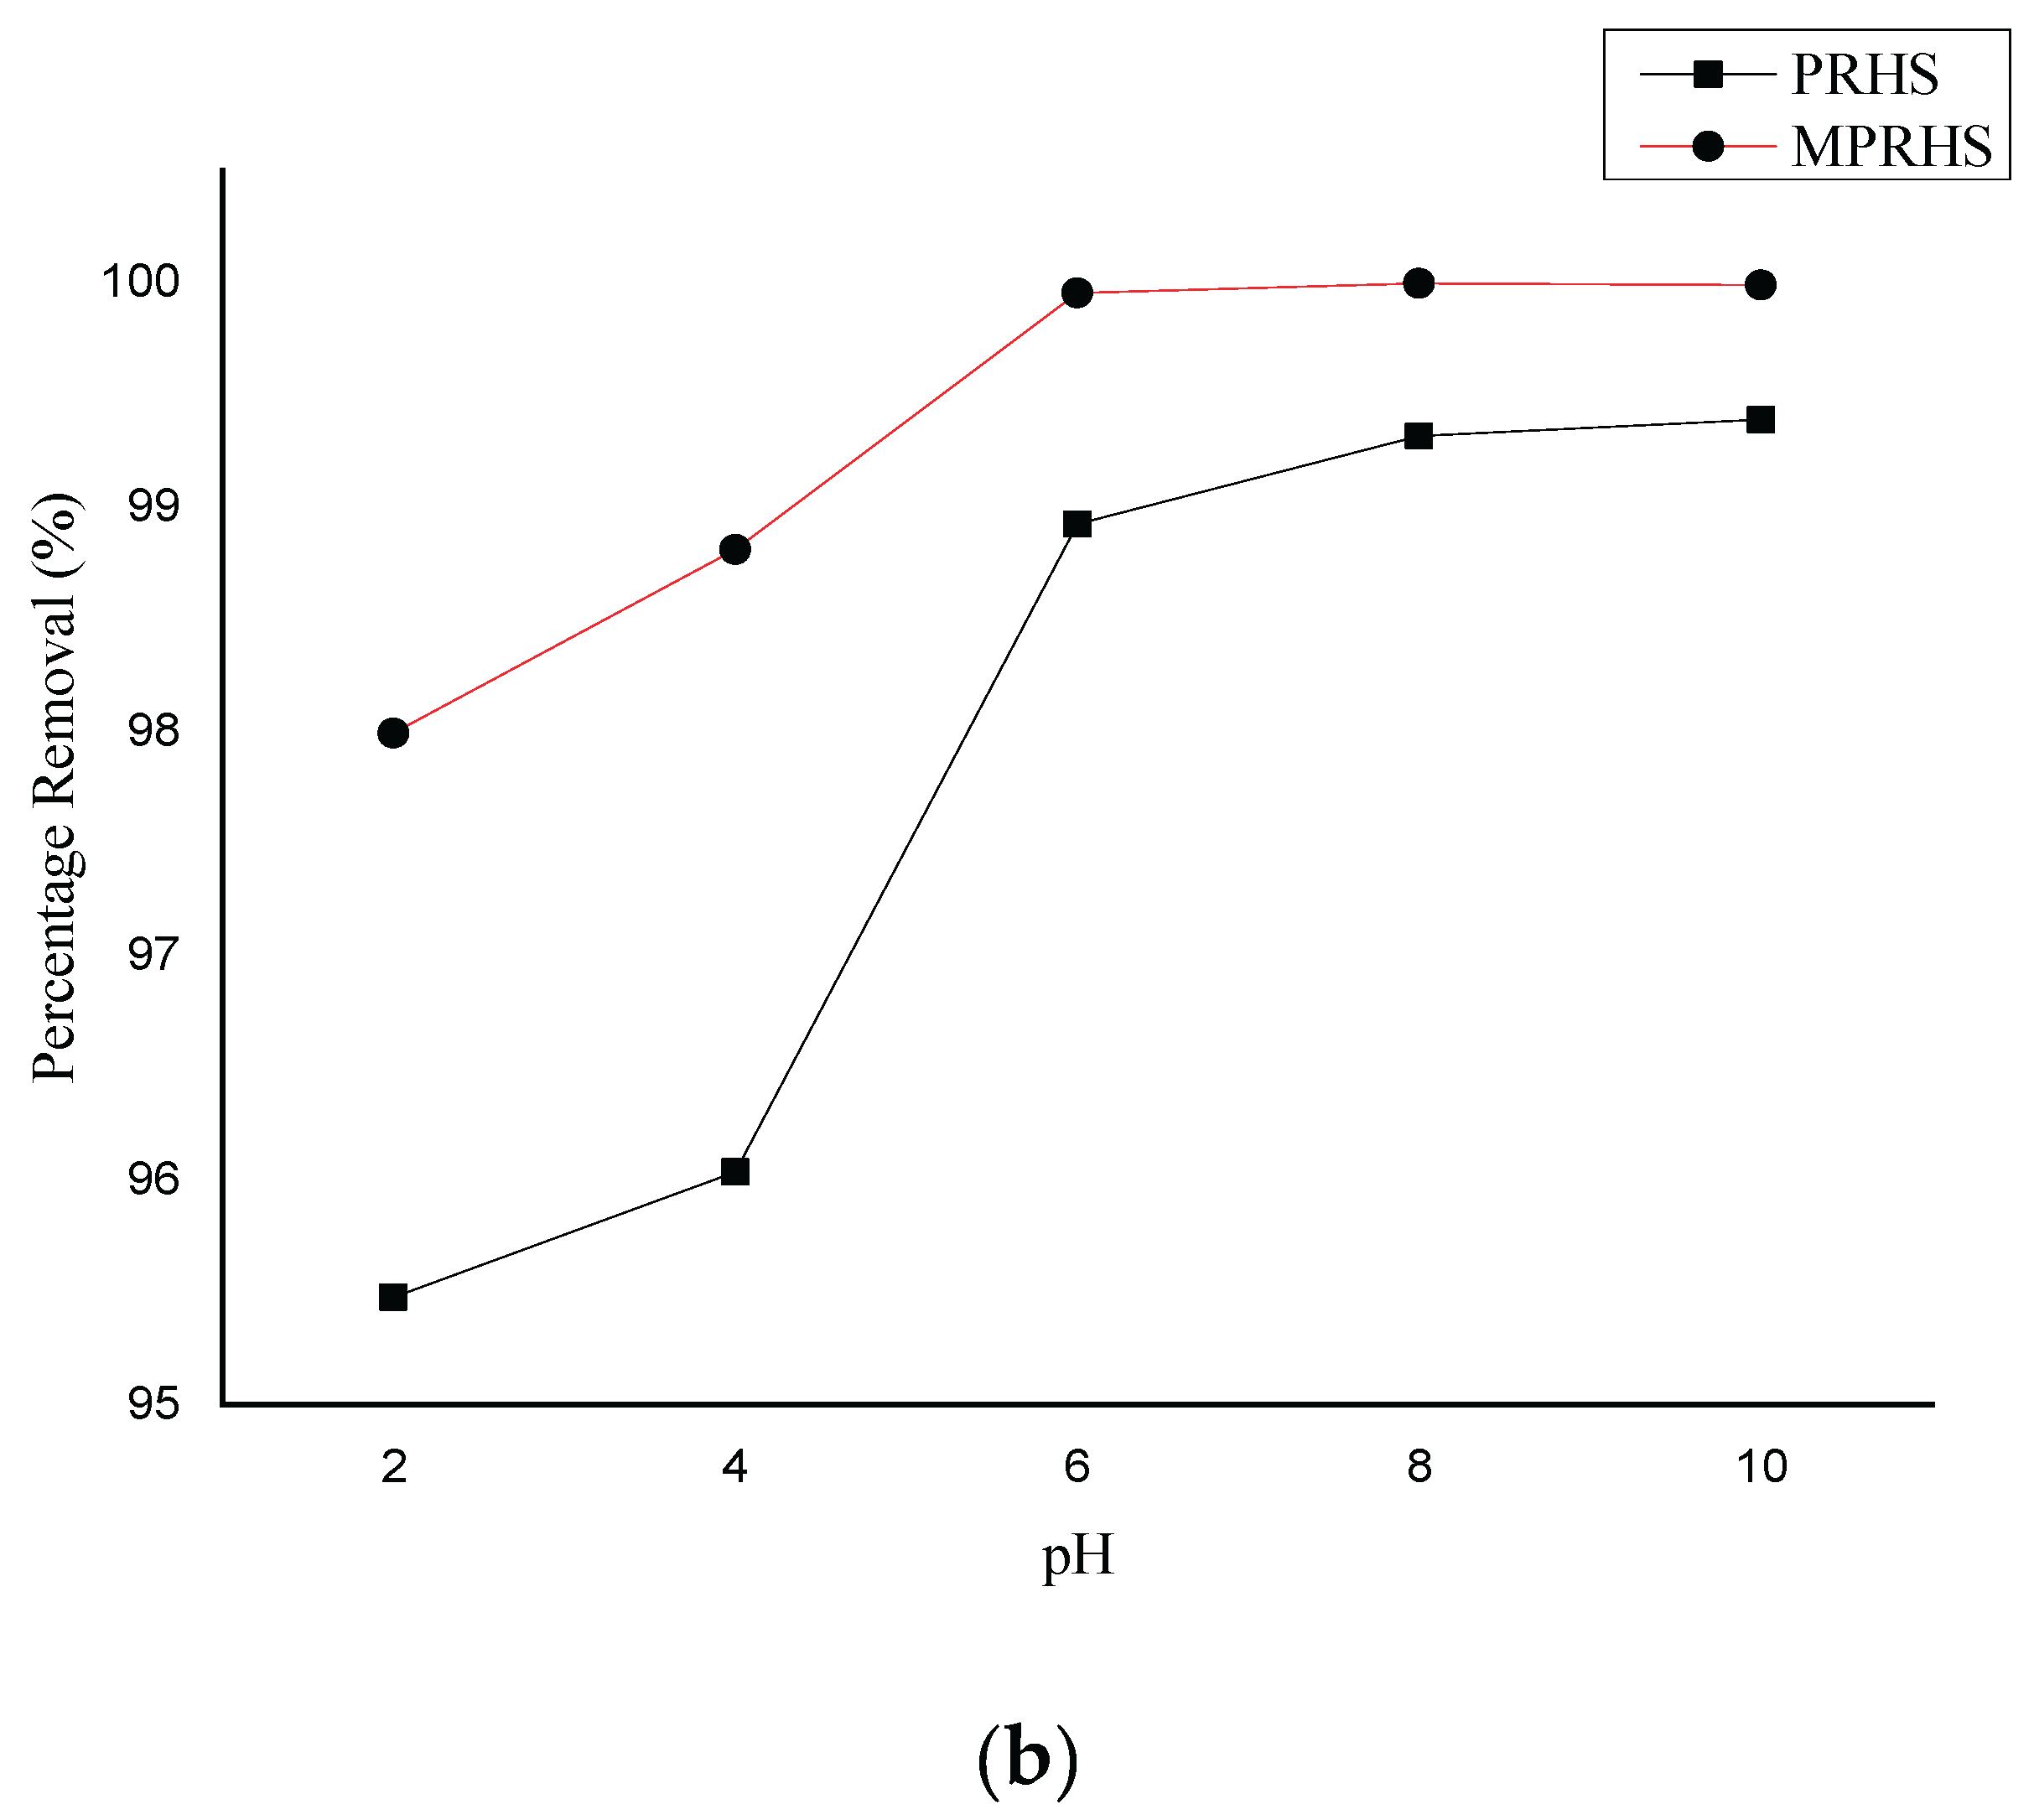
Figure 7.
Effect of adsorbent dosage on (a) Atrazine removal percentage and (b) Atrazine absorption capacity by PRHS and MPRHS. [50 mg/l initial concentration; 60 min contact time; 150 osc/min agitation speed; pH: 6.0].
Figure 7.
Effect of adsorbent dosage on (a) Atrazine removal percentage and (b) Atrazine absorption capacity by PRHS and MPRHS. [50 mg/l initial concentration; 60 min contact time; 150 osc/min agitation speed; pH: 6.0].
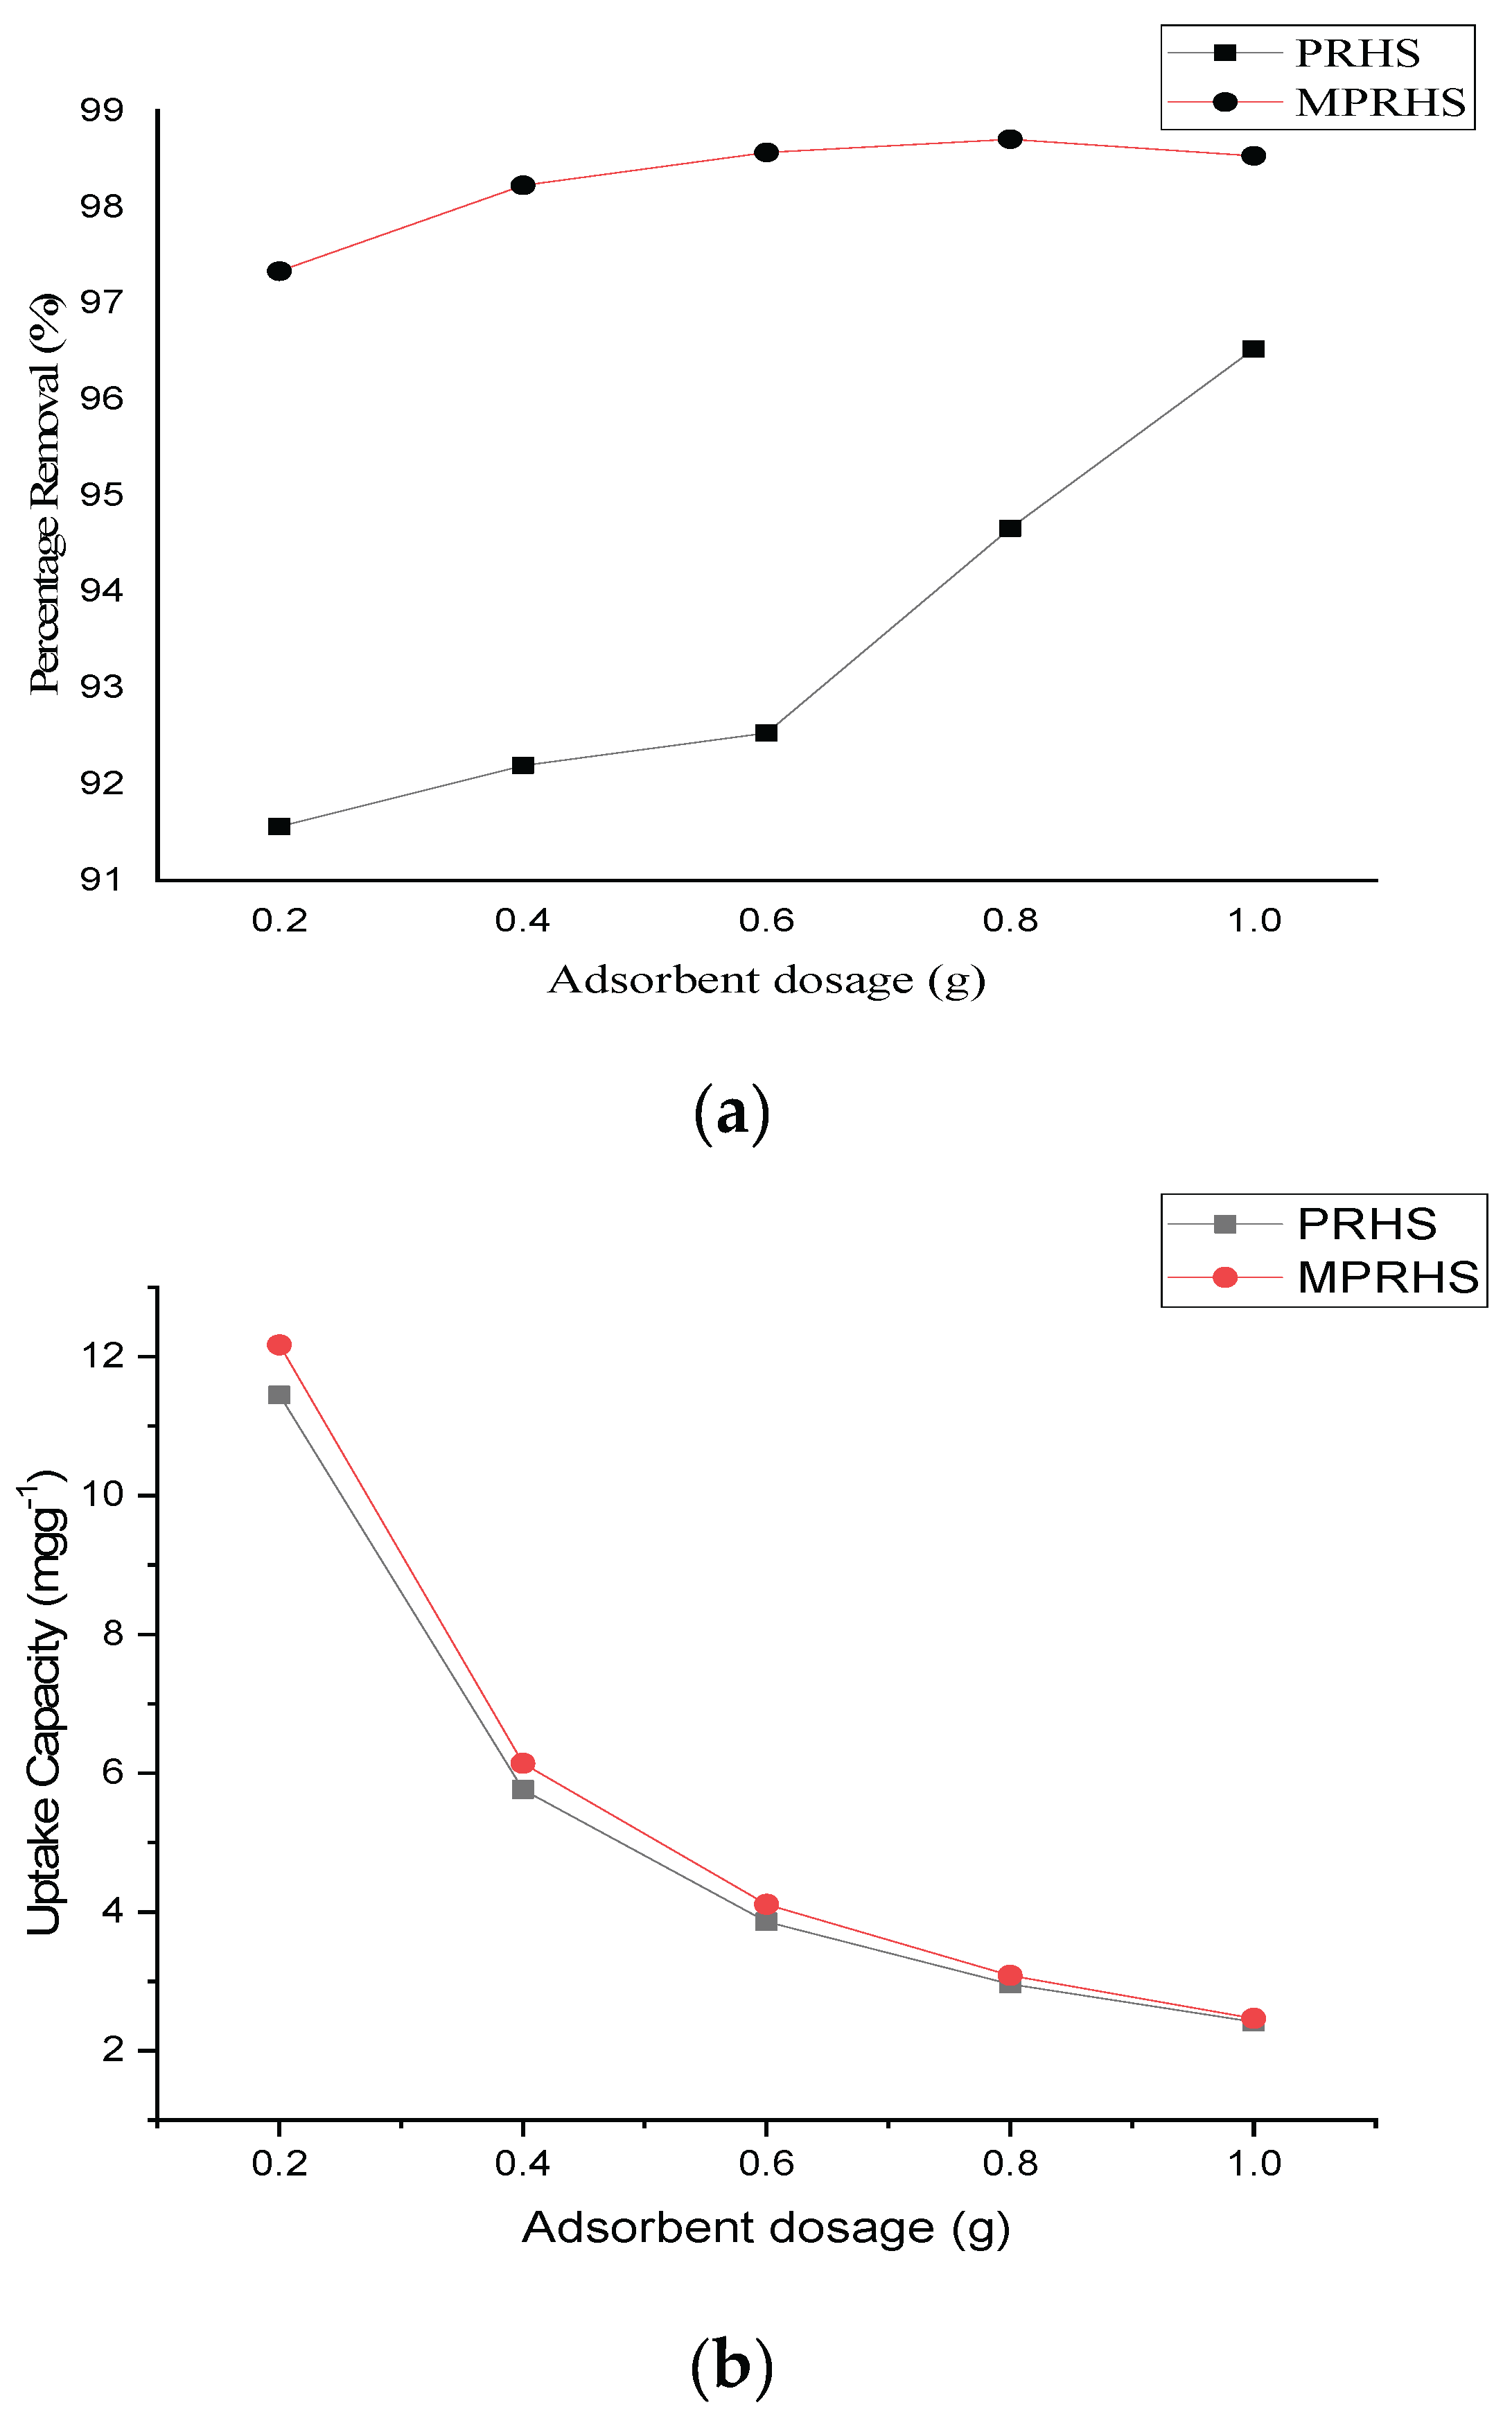
Figure 8.
Effect of adsorbent dosage on (a) Malathion removal percentage and (b) Malathion absorption capacity by PRHS and MPRHS. [50 mg/l initial concentration; 60 min contact time; 150 osc/min agitation speed; pH: 6.0].
Figure 8.
Effect of adsorbent dosage on (a) Malathion removal percentage and (b) Malathion absorption capacity by PRHS and MPRHS. [50 mg/l initial concentration; 60 min contact time; 150 osc/min agitation speed; pH: 6.0].
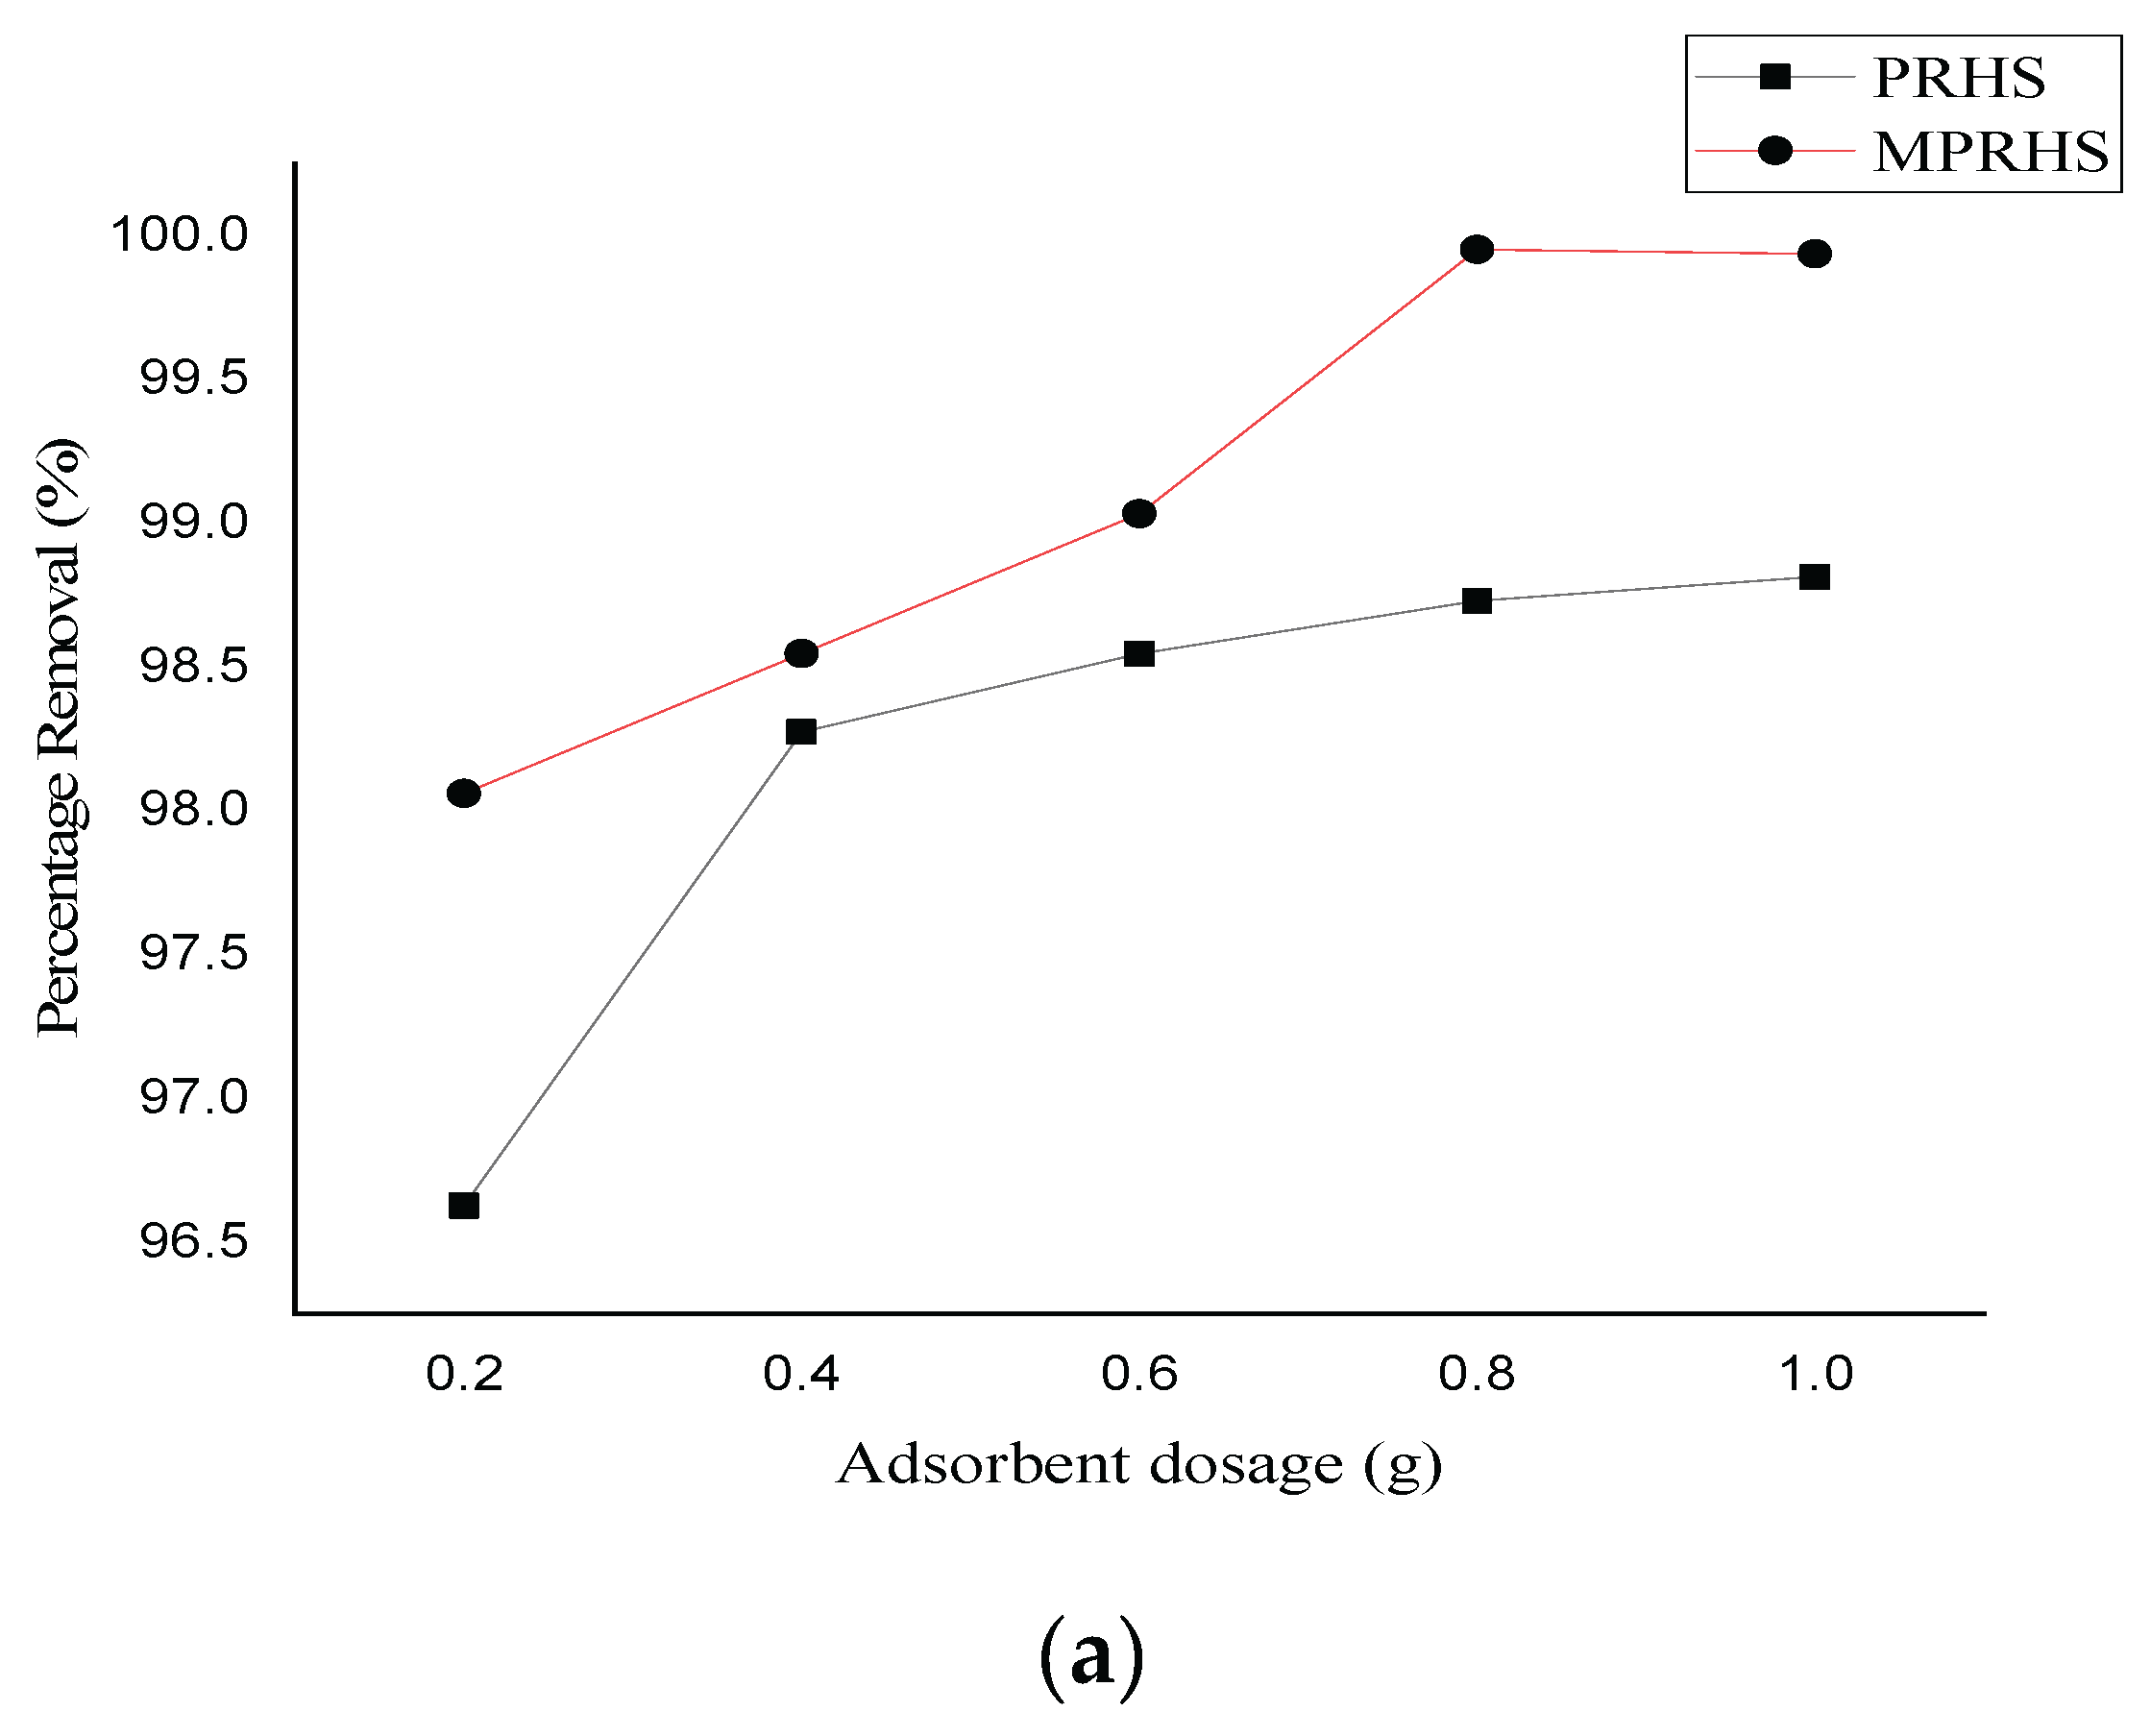
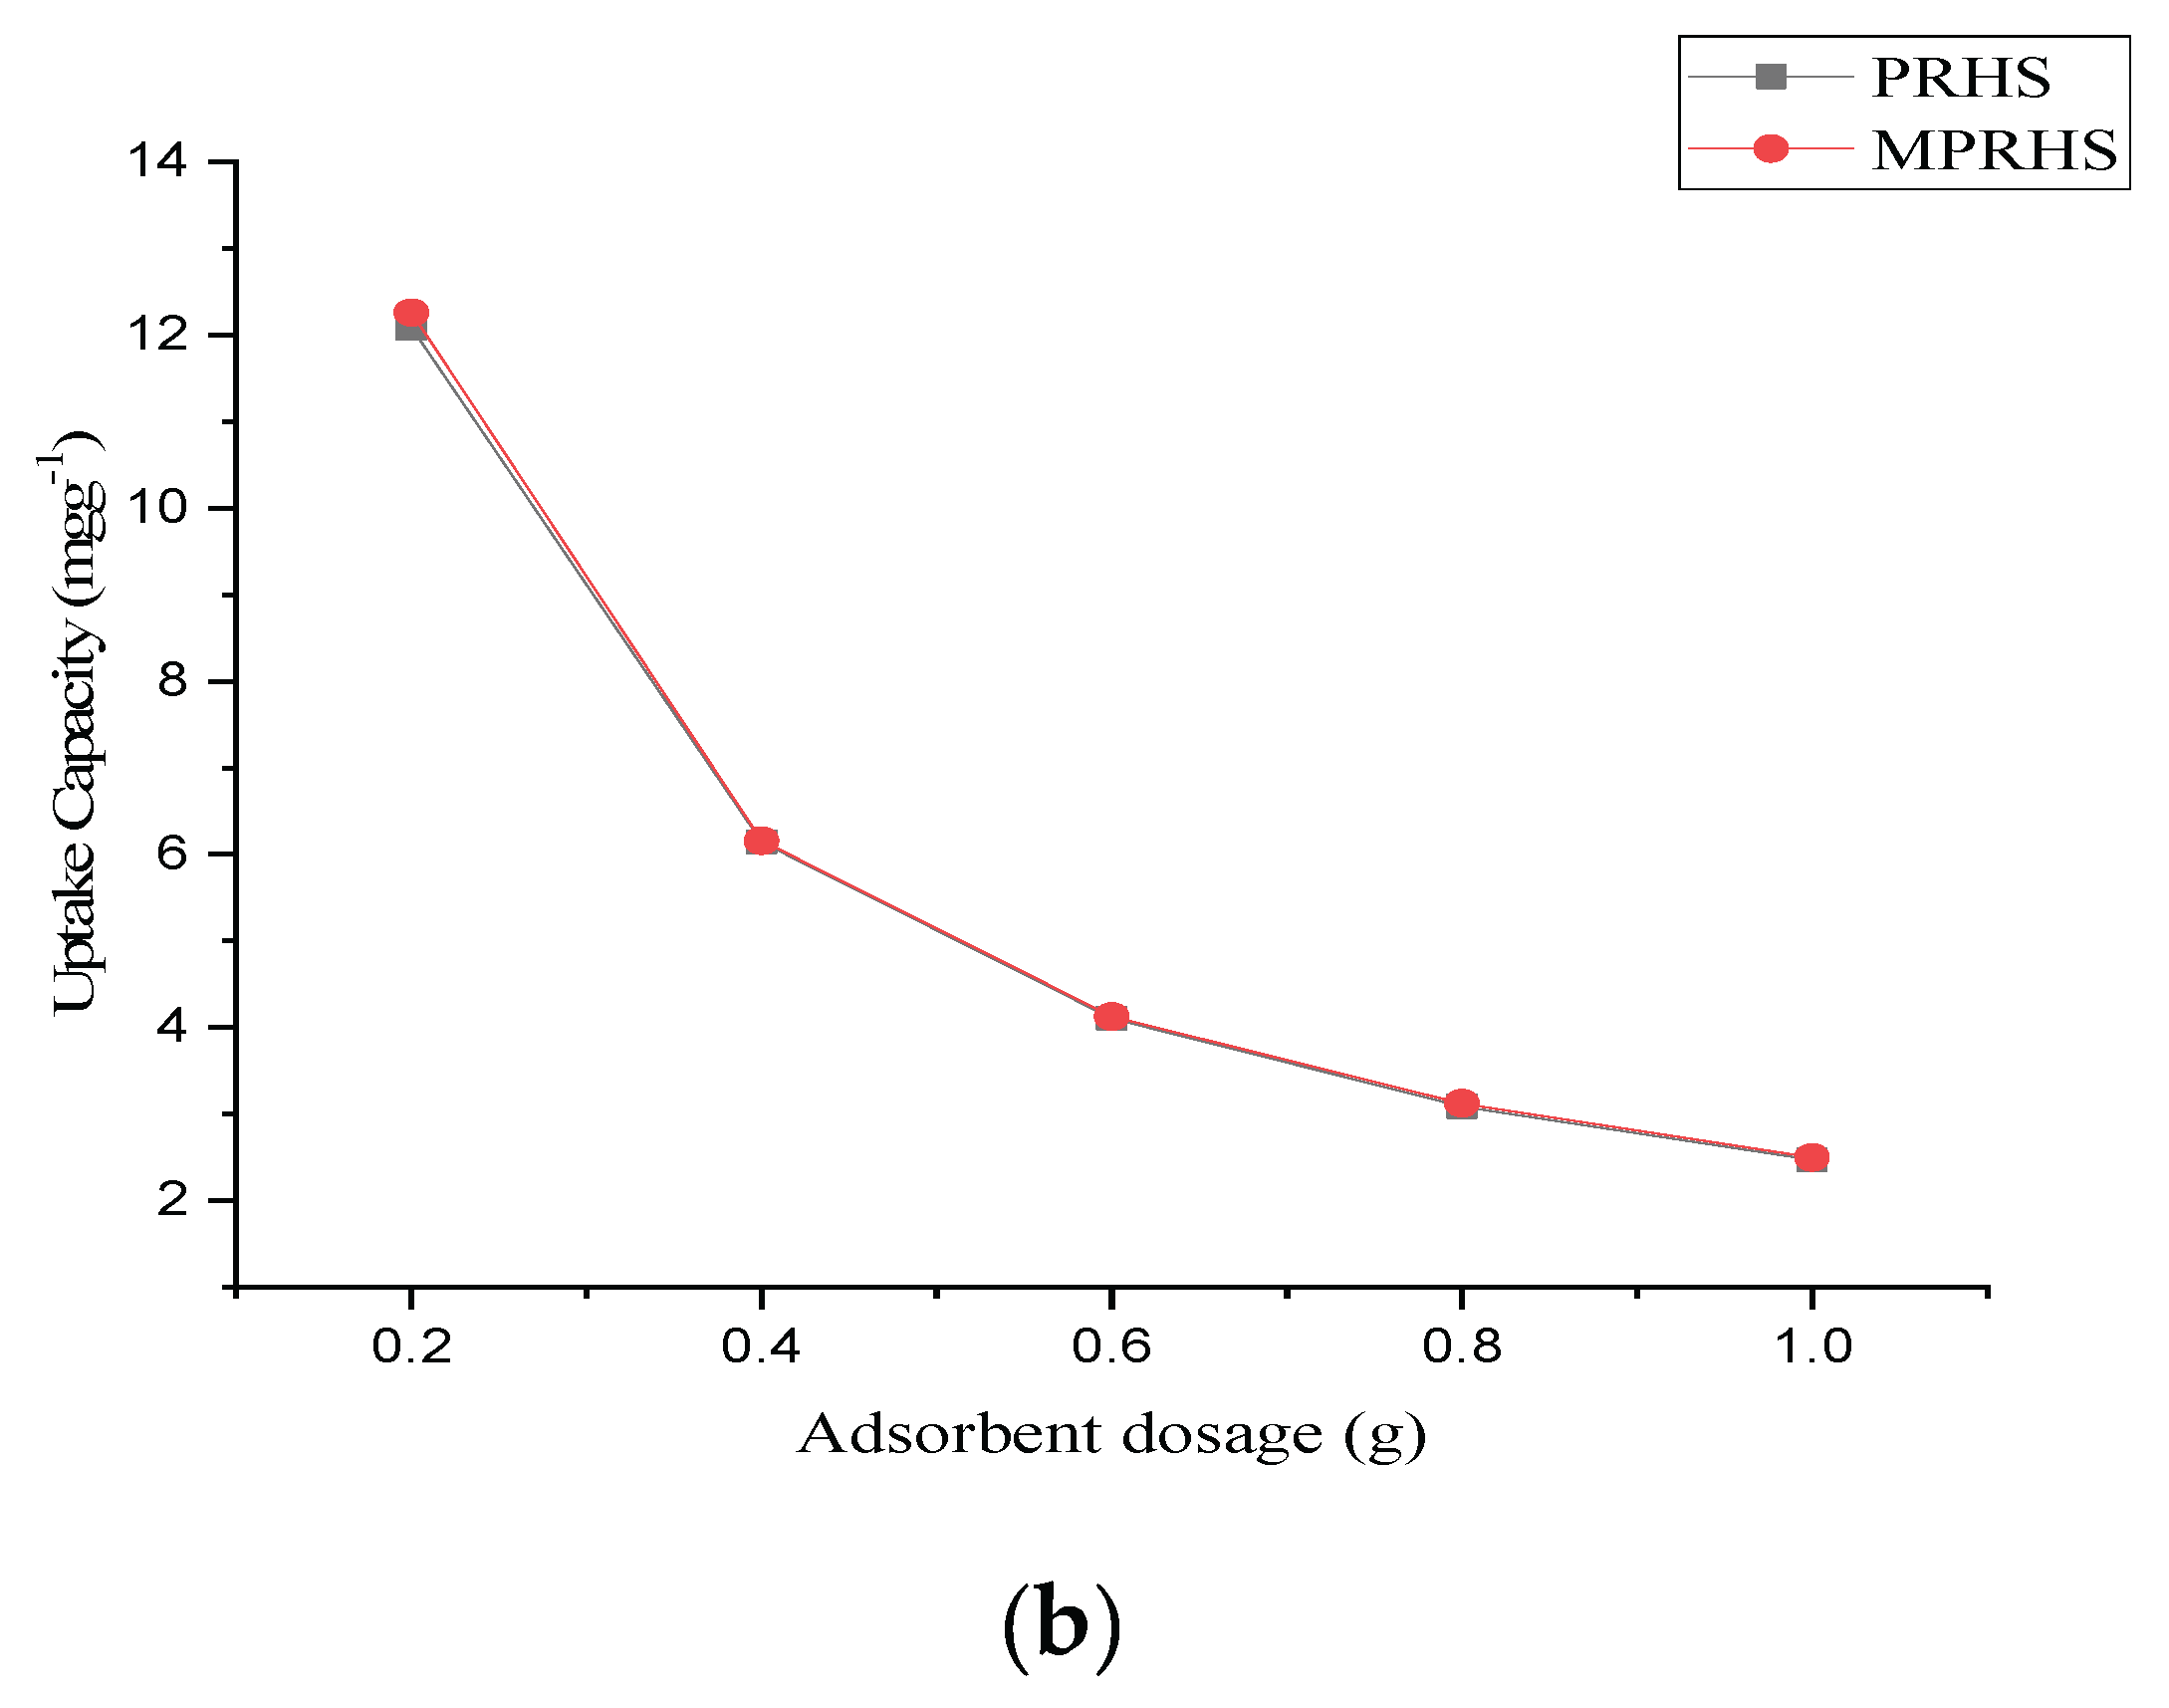
Figure 9.
The percentage removal of (a) Atrazine and (b) Malathion by PRHS and MPRHS as a function of agitation. [1.0 g adsorbent; pH 6.0; 150 osc/min agitation; starting concentration: 50 mg/L; working volume: 50 ml].
Figure 9.
The percentage removal of (a) Atrazine and (b) Malathion by PRHS and MPRHS as a function of agitation. [1.0 g adsorbent; pH 6.0; 150 osc/min agitation; starting concentration: 50 mg/L; working volume: 50 ml].
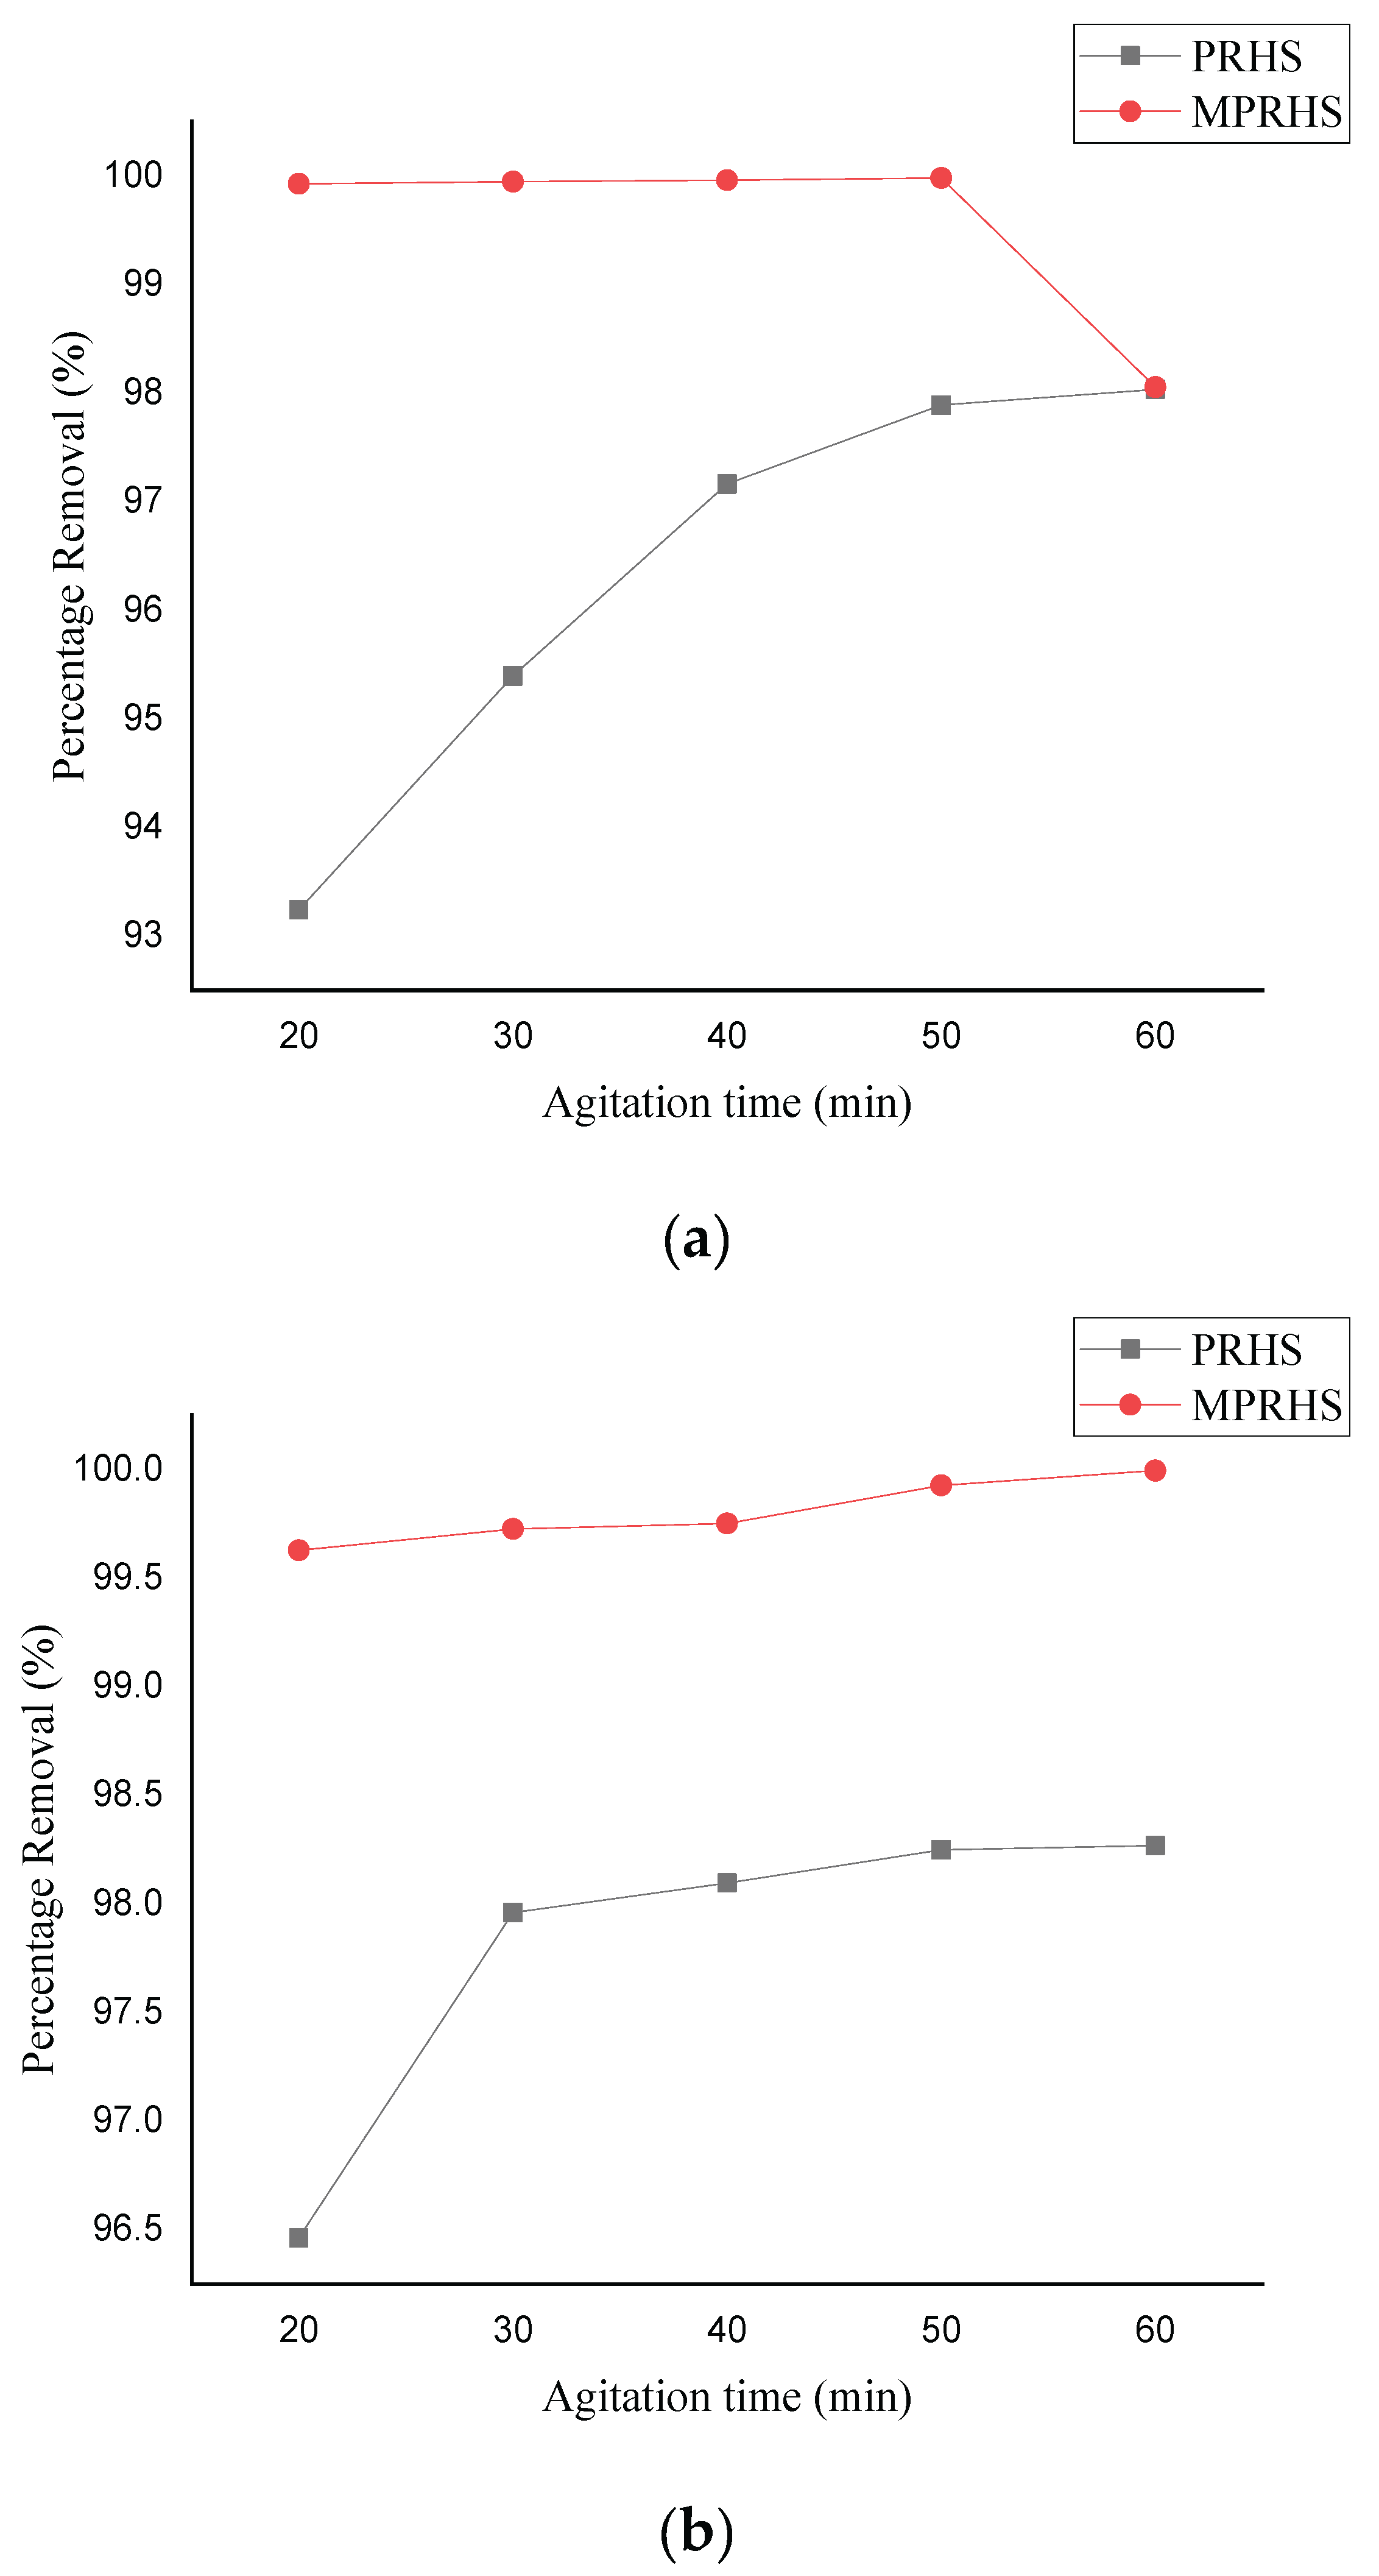
Figure 10.
The effect of the initial atrazine concentration on PRHS and MPRHS (a) percentage removal and (b) adsorption capacity. [60 min contact time; pH: 6.0; agitation speed: 150 osc/min; adsorbent dose: 0.8 g].
Figure 10.
The effect of the initial atrazine concentration on PRHS and MPRHS (a) percentage removal and (b) adsorption capacity. [60 min contact time; pH: 6.0; agitation speed: 150 osc/min; adsorbent dose: 0.8 g].
Figure 11.
Influence of initial malathion concentration on PRHS and MPRHS (a) percentage removal and (b) adsorption capacity. [60 minutes of contact time; pH of 6.0; agitation speed of 150 osc/min; adsorbent dose of 0.8 g].
Figure 11.
Influence of initial malathion concentration on PRHS and MPRHS (a) percentage removal and (b) adsorption capacity. [60 minutes of contact time; pH of 6.0; agitation speed of 150 osc/min; adsorbent dose of 0.8 g].
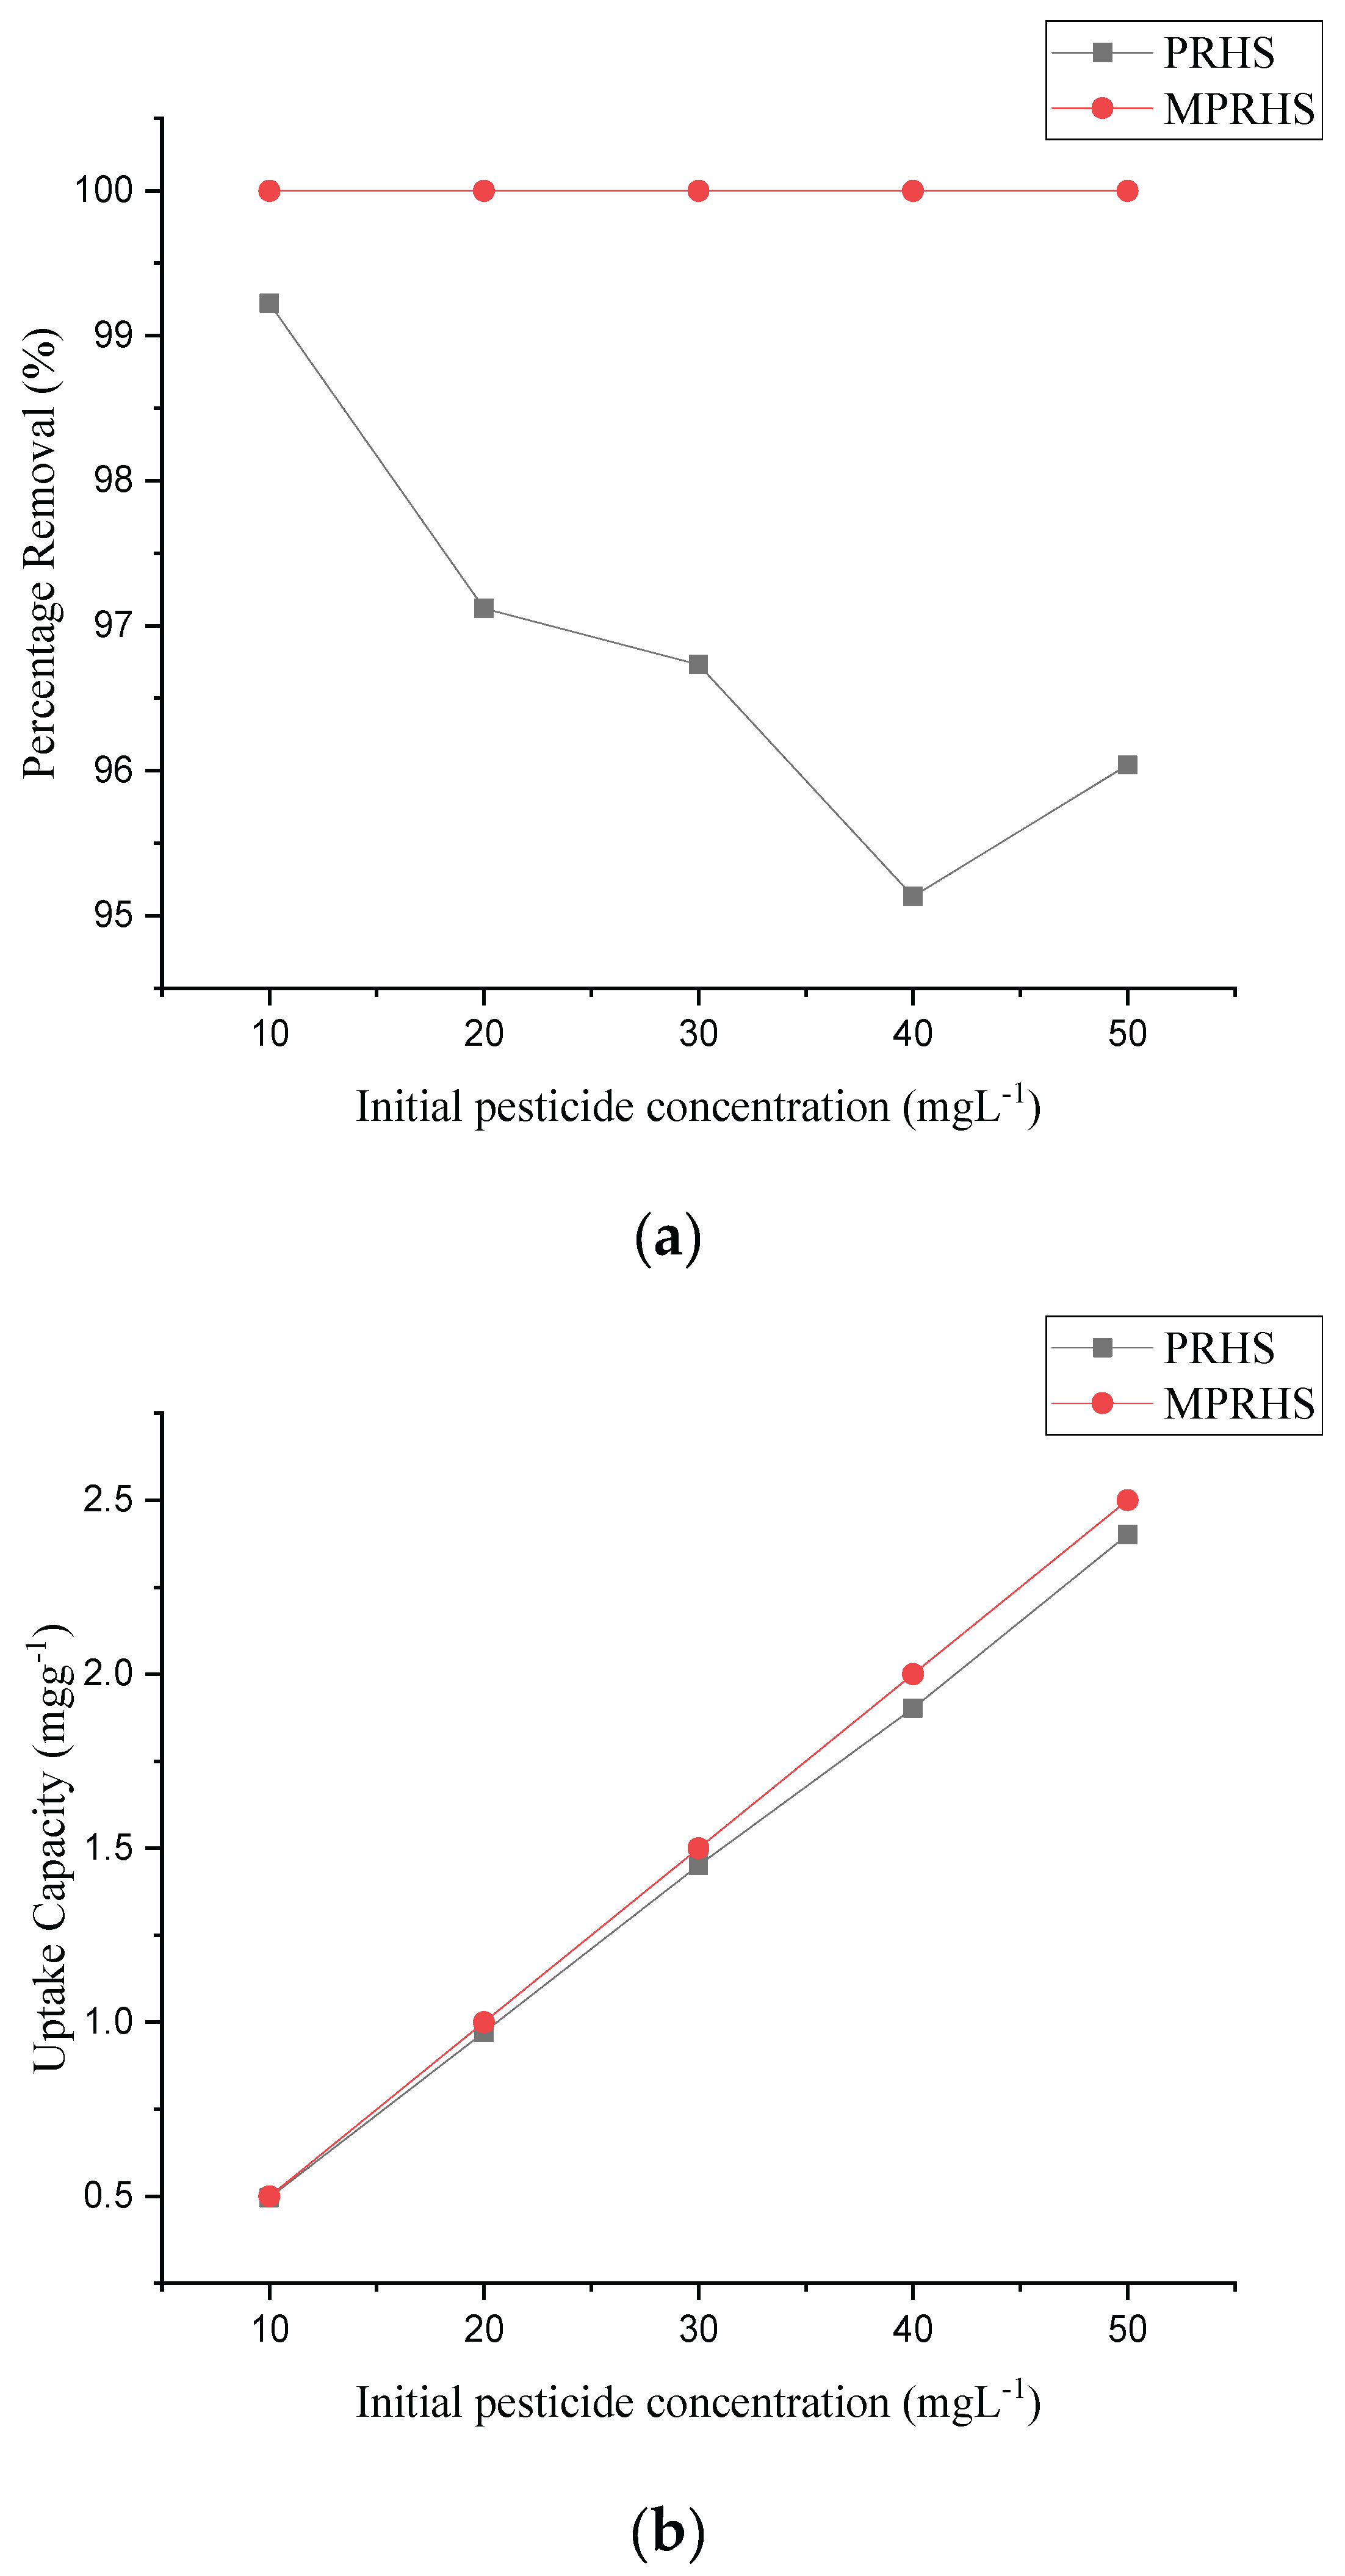

Table 1.
Elemental composition of RHS and PRHS.
| Element Symbol | Element Name | Confidence | RHS | PRHS | ||
|---|---|---|---|---|---|---|
| Concentration % | Error | Concentration % | Error | |||
| Si | Silicon | 100.0 | 23.7 | 0.9 | 18.9 | 1.2 |
| O | Oxygen | 100.0 | 76.3 | 1.5 | 73.9 | 1.6 |
| Na | Sodium | 100.0 | 6.3 | 4.2 | ||
| Br | Bromine | 100.0 | 0.9 | 4.8 | ||
Table 2.
Kinetics Rate Parameters for Pesticide Adsorption Process.
| Kinetics Models | PRHS | MPRHS | ||
|---|---|---|---|---|
| Atrazine | Malathion | Atrazine | Malathion | |
| qeexp (mg/g) | 3.06 | 3.07 | 3.12 | 3.125 |
| Pseudo-First Order | ||||
| qecal (mg/g) | 2.027 | 0.907 | 0.098 | 26.152 |
| K1 (min-1) | 0.116 | 0.141 | 0.051 | 0.052 |
| R2 | 0.9495 | 0.9591 | 1 | 0.8011 |
| Pseudo-second Order | ||||
| K2 (g/mgmin) | 0.175 | 0.602 | 22.260 | 2.980 |
| qecal (mg/g) | 3.170 | 3.106 | 3.125 | 3.128 |
| h (mg/gmin) | 1.758 | 5.807 | 217.391 | 29.156 |
| R2 | 1 | 1 | 1 | 1 |
| Intraparticle Diffusion | ||||
| Kd (mg/gmin1/2) | 0.0473 | 0.0157 | 0.0006 | 0.0035 |
| C | 2.7163 | 2.9589 | 3.1197 | 3.0969 |
| R2 | 0.9317 | 0.723 | 0.9921 | 0.9377 |
| Liquid film Diffusion | ||||
| Kfd | 0.1158 | 0.1409 | 0.0509 | 0.0518 |
| I | 0.4128 | 1.2192 | 6.481 | 4.4032 |
| R2 | 0.9495 | 0.9591 | 1 | 0.8011 |
| Elovich equation | ||||
| α (mg/gmin) | 4.821x10⁵ | 2.47x10¹⁹ | 3.02x10-843 | 1.6x10145 |
| β (g/min) | 6.139 | 16.694 | 635 | 109.890 |
| R2 | 0.9922 | 0.8373 | 0.9982 | 0.8606 |
Table 3.
Isotherm models for pesticide adsorption: correlation coefficient and constants.
| Isotherm Models | PRHS | MPRHS | ||
|---|---|---|---|---|
| Atrazine | Malathion | Atrazine | Malathion | |
| Langmuir | ||||
| qL | 2.434 | 2.832 | 2.782 | 0 |
| KL | 513.558 | 1.354 | 0.763 | 0 |
| R2 | 0.8533 | 0.8498 | 0.8516 | 0 |
| Freudlich | ||||
| KF | 0.650 | 1.483 | 1.691 | 0 |
| n | -5.740 | 2.195 | 3.085 | 0 |
| 1/n | -0.174 | 0.456 | 0.324 | 0 |
| R2 | 0.4135 | 0.9568 | 0.924 | 0 |
| Temkin | ||||
| B | -0.1604 | 0.864 | 0.3616 | 0 |
| A | 0.005 | 9.355 | 135.368 | 0 |
| R2 | 0.2265 | 0.809 | 0.7791 | 0 |
| Scatchard | ||||
| B | 16.374 | 2.3293 | -11.426 | 0 |
| Qm | 8.0836 | 2.453 | 12.314 | 0 |
| R2 | 0.0052 | 0.5899 | 0.5323 | 0 |
| Dubinin–Radushkevich (D–R) | ||||
| Β | 3x10⁻⁹ | -3x10⁻⁸ | -1x10⁻⁸ | 0 |
| qmD-R | 0.8848 | 1.764 | 1.710 | 0 |
| R2 | 0.1714 | 0.8033 | 0.7658 | 0 |
| E KJ/mol | 15909.95 | 4082.48 | 7071.07 | 0 |
Table 4.
Langmuir dimensionless separation factor RL for the pesticides.
| PRHS | MPRHS | |||
|---|---|---|---|---|
| Atrazine | Malathion | Atrazine | Malathion | |
| Co | RL | RL | RL | RL |
| 10 | 0.000195 | 0.068776 | 0.115875 | 1 |
| 20 | 9.74E-05 | 0.035613 | 0.061501 | 1 |
| 30 | 6.49E-05 | 0.024027 | 0.041859 | 1 |
| 40 | 4.87E-05 | 0.018129 | 0.031726 | 1 |
| 50 | 3.89E-05 | 0.014556 | 0.025543 | 1 |
Disclaimer/Publisher’s Note: The statements, opinions and data contained in all publications are solely those of the individual author(s) and contributor(s) and not of MDPI and/or the editor(s). MDPI and/or the editor(s) disclaim responsibility for any injury to people or property resulting from any ideas, methods, instructions or products referred to in the content. |
© 2025 by the authors. Licensee MDPI, Basel, Switzerland. This article is an open access article distributed under the terms and conditions of the Creative Commons Attribution (CC BY) license (http://creativecommons.org/licenses/by/4.0/).
Copyright: This open access article is published under a Creative Commons CC BY 4.0 license, which permit the free download, distribution, and reuse, provided that the author and preprint are cited in any reuse.


