Submitted:
09 July 2025
Posted:
10 July 2025
You are already at the latest version
Abstract
We found that, in guinea pig airway smooth muscle, the pharmacological inhibition of RTKs significantly decreased the contraction induced by 20 mM KCl. We observed that MEK pharmacological inhibitors also diminished the contraction. On the other hand, an ERK or a MLCK inhibitor did not alter the contraction generated by 20 mM KCl. When a ROCK inhibitor was tested, we found that it also significantly inhibited the KCl-induced contraction. These results were complemented with Western blot experiments, and a de-crease in ERK phosphorylation was noticed when the RTKs were inhibited. When MEK and ERK inhibitors were used, we observed a decrease in ERK phosphorylation only. In the case of MYPT1, its phosphorylation decreased when RTKs, MEK and ROCK inhibitors were used. In conclusion, we found that, in guinea pig airway smooth muscle, the con-traction induced by 20 mM KCl includes the activation of RTKs and in turn the MEK and ROCK kinases.
Keywords:
KCl
; RTKs
; MAPK
; ERK
; ROCK
1. Introduction
Airway smooth muscle (ASM) adjusts airway diameter in response to an ample variety of stimuli including neurotransmitters, inflammatory mediators, inspired air volume and temperature, stress and strain, airborne particles and other factors [1,2]. Conceivably, to really comprehend a complex pathological state like ASM hypertrophy and hyperplasia in asthmatics and its relation to airway hyperresponsiveness, ASM basic physiology needs to be thoroughly understood. Regarding ASM contraction physiology, terms like pharmacomechanical and electromechanical coupling are common lingo. Although not strictly independent in a real time contraction event, they have been conceptualized as pharmacomechanical: a membrane potential-independent, but second messenger-dependent contraction, and electromechanical: a membrane potential-dependent, but second messenger-independent contraction [3]. Because these couplings were considered independent, certain pharmacological tools were employed in vitro to study each contraction mode. Agonists activating their cognate Gαq-coupled receptor (i.e., histamine to activate H1 receptors, carbachol to activate M3 receptor, etc.) were employed to study pharmacomechanical coupling, while KCl was used to investigate electromechanical coupling, allegedly because of its capacity to depolarize the ASM membrane and induce contraction by bypassing Gαq-activated second messenger signaling cascades. Continuous and systematic research throughout many years, revealed that KCl can activate the RhoA/Rho kinase (ROCK) pathway [4,5], inducing the calcium sensitization phenomenon. In most smooth muscles, Ca2+ sensitization is carried out by the monomeric G protein RhoA and its downstream effector, ROCK. The latter phosphorylates myosin light chain phosphatase (MLCP) on its targeting subunit (MYPT1), inhibiting its activity and promoting sustained contraction without noticeable changes in intracellular Ca2+ concentrations [3]. Besides, it has been demonstrated that, by modifying ASM membrane potential, both 20 mM and 60 mM KCl contribute to enhance contraction responses to cholinergic stimulation [6]. Seemingly, ASM membrane depolarization through high K+ addition contributes to open L-type voltage dependent Ca2+ channels (L-VDCC), induces calcium sensitization and facilitates contractile responses to cholinergic agonists. Meaningfully, these findings suggest that, not only are both coupling modes interdependent, but that a slightly depolarized ASM membrane might predispose airway to hyperresponsiveness, a cardinal asthma symptom.
Notwithstanding, in vitro KCl-induced ASM depolarization remains a useful pharmacological approach to study ASM contraction. In this regard, it has been found, that depolarization triggers mitogen and protein-activated kinases, that in turn, phosphorylate other transducer proteins like TRPV1 [7]. TRPV1 is expressed on ASM [8], and recent studies point out that its blockade significantly diminishes airway hyperresponsiveness, airway inflammation, and ASM remodeling in a chronic murine asthma model [9]. These findings imply that KCl-induced depolarization is not a simple phenomenon and might be considered a complex signaling cascade that deserves abundant and rigorous investigation. In this regard, research carried out in rat caudal arterial smooth muscle, indicates that this depolarization triggers a genistein-sensitive tyrosine kinase involved in ROCK activation [10]; furthermore, genistein has been used as an unspecific inhibitor for receptors tyrosine kinase (RTKs) [11,12]. Most RTKs are single subunit receptors and ligands binding to their extracellular domain induce receptor dimerization, initiating downstream signal transduction pathways, such as the MAP kinase signaling cascade [13] and in accordance with available literature, they are activated by high potassium solutions [14,15]. Their activation triggers signaling cascades that regulate key cellular processes such as proliferation, differentiation, migration, and survival. Among the downstream signaling pathways of RTKs, the MAPK/ERK [13,16] and RhoA/ROCK [17] pathways stand out. MEK kinase is a central component of the MAP kinase pathway, responsible for phosphorylating and activating ERK1/2. This cascade is involved in ASM hyperplasia, hypertrophy, and remodeling [18], phenomena frequently observed in asthma. On the other hand, ROCK kinase, activated by RhoA, directly regulates ASM contraction through the inhibition of MLCP, promoting the maintenance of contraction through calcium sensitization mechanisms [3]. Furthermore, ROCK is involved in cytoskeletal reorganization, cell migration, and the expression of genes related to the contractile phenotype [19]. The integration of signals from RTKs and the activation of pathways such as MEK/ERK and RhoA/ROCK represent a key point in understanding the molecular mechanisms of ASM contraction, inflammation, and tissue remodeling. In this sense, KCl-induced RTKs stimulation is a handy strategy to dissect signaling pathways involved in ASM contraction; surely, their study would offer knowledge to uncover a potential therapeutic approach for chronic respiratory diseases like asthma. Therefore, we theorized that, in ASM, KCl activates RTKs and their downstream signaling cascades (i.e., MAPK and ROCK) and studied if these cascades participate in the KCl-induced ASM contraction. Our results show that, in guinea pig ASM, KCl stimulation activates MEK and ROCK through RTKs. We propose that, in this tissue, a low KCl concentration activates Ras and consequently MEK to induce immediate early genes (IEG), Rho and Rac to control actin cytoskeleton organization to aid contraction and RhoA/ROCK to induce Ca2+ sensitization. These findings warrant further and more detailed investigation.
2. Materials and Methods
Animals
Male Harley guinea pigs weighing between 200 and 300 g were used. They were grown at the animal facility of the Instituto Nacional de Enfermedades Respiratorias under standard controlled conditions: filtered conditioned air, temperature of 21 ± 1°C, with 50-70% humidity, in a sterile bed, with free access to food and water, with a light and dark cycle of 12-12 h.
Organ Bath Experiments
The animals were sacrificed by an overdose of sodium pentobarbital (30 mg/Kg, i.p) and exsanguinated by an incision of the posterior vena cava. The trachea was immediately obtained, dissected of adipose and connective tissue with a stereoscopic microscope and eight segments, each containing four cartilage rings, were obtained. Each preparation was suspended in an isolated organ bath chamber containing 5 ml of Krebs Ringer solution with the following composition (mM): NaCl 120, KCl 4.77, KH2PO4 1.2, MgSO4 1.2, NaHCO3 25, CaCl2 2 and glucose 11. The solution was continuously bubbled with a mixture of 95% O2 and 5% CO2 and kept at a pH of 7.4 at 37 °C. Each tissue was attached to an isometric tension transducer (Model FT03, Grass Instruments, Rhode Island, USA) connected to a programmable signal amplifier-conditioner (CyberAmp 380, Axon Instruments, California, USA), which in turn was connected to an analog digital converter (Digidata 1200a, Axon Instruments). Isometric tension was recorded and stored for later analysis on a computer, and the data were processed using an Axoscope v program. 7.0.
The preparations were maintained at a tension of 1 g for 30 min before starting the experiments. Each tracheal segment was stimulated three times with 60 mM KCl for 30 min until its maximal contraction response was obtained. Afterwards, a 20 mM KCl stimulus lasting 30 min was given. The tissue was then washed 3 times with Krebs solution until a baseline was reached and 30 min later, a second 20 mM KCl stimulus was administered.
In a set of experiments, tissues were incubated 30 min before the second response to 20 mM KCl with genistein or ST638 (RTK inhibitors: 10 μM, n=10 and 9, respectively); FR180204 (ERK 1/2 inhibitor: 5 and 10 μM, n=10 each); PD98059 (MEK inhibitor: 5 and 10 μM, n=10 each); U0126 (MEK inhibitor: 5 and 10 μM, n=7 each); U0124 (inactive analog of U0126: 5 and 10 μM, n= 7 each); Y-27632 (ROCK inhibitor: 5 and 10 μM, n=7 each) or ML-7 (MLCK inhibitor: 5 and 10 μM, n=7 each) (Table 1).
At the end of each experiment, tissues were placed in cryotubes and immediately frozen in liquid nitrogen. These samples were stored at −70°C until thawed for Western blot analysis.
Western Blot Assays to Define ERK1/2 and MYPT1 Phosphorylation
The frozen tissues obtained from organ baths experiments were thawed on an ice bed, and pooled: two tissues from the same experimental condition were considered as n=1. Smooth muscle from each sample was carefully dissected and placed in 400 μL of lysis buffer solution (1% Triton, 50 mM Tris at pH 7.4, 150 mM NaCl, 1 mM EDTA, 5 mM NaF, 1 mM sodium pyrophosphate, 1 mM β-glycerophosphate, 2 mM sodium orthovanadate, 1% sodium deoxycholate, 0.1% SDS) and a protease inhibitor cocktail (Protease Inhibitor Cocktail Set III, Calbiochem® Cat No. 539134, 1:200 v/v) and finely cut with scissors; afterwards, it was allowed to rest for 30 min at 4° C. Each sample was then mechanically homogenized (Omni Tip Plastic Homogenizer Probes, OMNI International, USA, Kennesaw, GA) and centrifuged at 2000 rpm for 5 min at 4° C; the supernatant was then recovered by using a micropipette. Subsequently, the supernatant was concentrated by centrifugation at 3000 rpm for 20 min at 4° C using an Amicon ® Ultra-4 membrane (30,000 Molecular Weight Cutoff; Millipore Cat. No.: UFC803096). The protein determination was carried out by the bicinchoninic acid (BCA) method using a commercial kit (PierceTM BCA Protein Assay Kit, Cat. No. 23225).
To separate the proteins through electrophoresis, 10 μg of protein per sample were used. 6 μL of loading solution (2X Laemmli Sample Buffer, Cat No.: 1610737) were added to each sample, and then heated at 100°C for 5 min in a water bath. Subsequently, protein separation was carried out using sodium dodecyl sulfate polyacrylamide gels 8% with a buffer solution (0.025 M Tris, 0.192 M glycine and 0.1 SDS %), for 2 hr at 100 V at 4°C. The proteins were transferred to a nitrocellulose membrane with a transfer buffer (0.025 M Tris, 0.192 M glycine and 20% methanol) for 1 hr at 100 V at 4°C. Afterwards, each membrane was blocked using 7% non-fat dry milk reconstituted in a saline-Tris buffer containing 0.5% Tween-20 (TBS-T) for 1 hr at room temperature. The membranes were washed with TBS-T and incubated overnight at 4°C with the corresponding rabbit polyclonal antibody (primary antibody) listed on Table 2.
The next day, membranes were washed with TBS-T and incubated with the secondary anti-rabbit antibody conjugated with peroxidase (HRP) that allowed the detection of the primary antibody (Anti-rabbit IgG HRP; 1:2000v/v, Merck Millipore). Protein detection was performed using a chemiluminescent substrate (Super Signal West Femto Maximum Sensitivity Substrate, cat. 34096; Thermo Scientific, Rockford, IL, USA) through in Molecular Imaging ChemiDoc XRS+, Model Universal Hood II, U.S.A
Densitometry Analysis
The relative levels of ERK1/2 and MYPT1 phosphorylation were normalized to total ERK and total MYPT1, respectively. Data are expressed as a percentage of the control response (20 mM KCl) and are represented as the mean +/- standard error of the mean (n = 3). The "n" corresponds to 3 separated WB. In all cases, an ad hoc Dunett's test was used to analyze the differences in ERK and MYPT1 expression during contraction induced by 20 mM KCl. *p < 0.05 and **p < 0.01 were considered significant.
3. Results
In guinea pig trachea, KCl-induced contraction includes the participation of RTKs as can be seen in Figure 1. RTKs inhibitors genistein and ST638 significantly diminished the contraction. Both antagonists were used at a 10 μM, a concentration in accordance with former reports [14,20].
Because RTKs are coupled to the MEK-ERK signaling pathway, we further explored if KCl-induced contraction was dependent on these kinases. Our results pointed out that, in guinea pig trachea, KCl-induced contraction does not depend on ERK, since its pharmacological inhibition with FR180204 did not alter it (Figure 2).
To further explore if MEK, in contrast, could be involved in this phenomenon, we employed PD98059 (a MEK inhibitor) and appreciated a significant decrease of the KCl-induced contraction (Figure 3.)
This result was further corroborated by another set of experiments in which we used U0126, another MEK inhibitor, and its inactive analogue (U0124). Our results confirmed the participation of MEK in the KCl-induced contraction, since its inhibition through U0126 significantly reduced the contraction (Figure 4A), while its U0124 had no effect (Figure 4B).
On the other hand, we demonstrated that, in guinea pig trachea, ROCK plays a role in KCl-induced contraction, because Y-27632 (a ROCK inhibitor) significantly decreased the 20 mM KCl-induced contraction (Figure 5).
Meanwhile, MLCK inhibition did not modify the KCl-induced contraction (Figure 6).
On the other hand, RTK´s inhibition through the addition of its antagonists, genistein and ST638, significantly diminished ERK phosphorylation (Figure 7A) and MYPT1 phosphorylation (Figure 7B) in accordance with the findings illustrated in Figure 1.
ERK´s phosphorylation induced by KCl 20 mM was significantly diminished by FR180204 (Figure 8A), while MYPT1 was not altered by this antagonist (Figure 8B). This finding points out that ERKs phosphorylation state seemingly does not alter KCl-induced contraction in guinea pig airway smooth muscle (Figure 2).
Meanwhile, MEK inhibition with PD98059 decreased both ERK phosphorylation (Figure 9A) and MYPT1 phosphorylation (Figure 9B) induced by KCl 20 mM. This result is congruent with the effect shown by PD98059 on the KCl-induced contraction depicted in Figure 3.
Furthermore, the use of U0126, a specific MEK inhibitor, significantly reduced ERK´s phosphorylation induced by KCl 20 mM (Figure 10A) but did not alter MYPT1 phosphorylation (Figure 10B). Both U0126 concentrations tested (5 and 10 μM) reduced ERK´s phosphorylation, but only the highest lowered the KCl-induced contraction (Figure 4A). Finally, the addition of Y-27632 (an inhibitor of the MLCP) did not modify the KCl-induced ERK phosphorylation (Figure 11A), but significantly diminished MYPT1-phosphorylation induced by the same procedure (Figure 11B). This result is in accordance with the effect produced by Y-27632 in the organ bath experiments (Figure 5).
4. Discussion
For many years, KCl was considered a trustworthy pharmacological tool to study ASM contraction bypassing G protein-coupled receptor activation and their well-known second messenger signaling cascade. However, there is evidence pointing out that in this tissue, KCl-induced contraction can include activation of ROCK and other kinases [4,5,26,27,28]. In asthmatic airways, smooth muscle is slightly depolarized [29] a circumstance that could predispose to airway hyperresponsiveness, a hallmark of this ailment that might be related to a continuous activation of certain signaling pathways. In this sense, a sustained stimulation of RTKs could contribute to ASM hypertrophy, another characteristic of the asthmatic airway. To emulate such depolarized state, we used a low KCl concentration (20 mM) and, through a pharmacological approach, investigated if receptor tyrosine kinase (RTKs) participates in the airway smooth muscle contraction induced by this substance. We found that RTKs inhibition significantly diminished KCl-induced contraction (Figure. 1) in agreement with former studies carried out in vascular smooth muscle [10] and bronchial smooth muscle [14]. Furthermore, we observed that KCl induces ERK phosphorylation in ASM (Figure. 7A, 8A, 9A, 10A, 11A), and that this phenomenon was diminished by RTKs inhibition (Figure 7A). In this sense, abundant reports consistently support the fact that RTKs activation unleashes Ras/MAPK/ERK signaling pathway [16,30,31,32] mostly coupled to synthetic signaling.
On the other hand, KCl-induced smooth muscle contraction implies the opening of L-type (long-lasting) voltage dependent Ca2+ channels (L-VDCC) [33,34,35]; in turn, Ca2+ entry through L-VDCC is followed by the formation of the Ca2+/calmodulin (CaM) complex that may directly activate Ras/MAPK/ERK signaling cascade [36]. Besides, it has been shown that CaMK regulates depolarization-induced MEK-ERK activity [37,38]. Nonetheless, this signaling pathway is mostly activated through RTKs stimulation, whether by its cognate agonist or, seemingly, by membrane depolarization. This stimulation activates the GTP-binding protein Ras, which binds and activates Raf (mitogen activated protein kinase kinase), which phosphorylates and activates MEK, responsible of phosphorylating and activating MAPK/ERK [39].
It has been observed that L-VDCC inhibition interrupts the generation of immediate early genes (IEG) [40]. In fact, its activation induces IEG in vascular smooth muscle [41], human ASM [42,43] and in airway epithelia [44]. IEG cipher for a variety of cytoplasmic enzymes, secreted proteins and transcription factors related to cell differentiation, metabolism and proliferation. They are typically stimulated by an extracellular signal (e.g., growth factors, mitogens, UV, toxins, etc.) [45,46] and their expression is rapid and transient [47]. For instance, peak expression of FOS is 30 to 60 minutes after stimulation [48]. As they do not require protein synthesis, translational inhibitors have no effect on their expression [47,49] that is known to be very low, partially due to mRNA instability and to efficient proteolytic degradation [50].
Conceivably, ASM depolarization with KCl activates Ras/MAPK/ERK signaling cascade through RTKs stimulation and to dilucidated if ERK participates in the KCl-induced contraction, we used FR180204, a selective ERK inhibitor. As illustrated in Figure. 2, this approach showed no effect on the contraction induced by 20 mM KCl in guinea pig trachea, pointing to the possibility that this kinase does not participate in the depolarization-induced contraction, even though WB assays showed that FR180204 significantly diminished KCl-induced ERK phosphorylation (Figure 8A). Based on the described results above, we employed PD98059, a potent and selective MEK inhibitor [51], which significantly decreased KCl-induced contraction (Figure 3) and ERK phosphorylation (Figure 9A). Since the primary kinase upstream of ERK is MEK, the latest is probably participating in the KCl-induced contraction in ASM. Furthermore, this finding was corroborated by another set of experiments using U0126 (another MEK inhibitor), and U0124 (a useful negative control for MEK inhibitors). Again, results shown in Figure. 4 A demonstrated that MEK´s inhibition diminishes KCl-induced contraction, while the inhibitor´s negative control had no effect (Figure 4B). Meanwhile, ERK phosphorylation was also reduced by U0126 (Figure 10A).
We also observed that, in KCl-stimulated guinea pig trachea, RTK inhibition diminished myosin phosphatase targeting subunit (MYPT1) phosphorylation (Figure 7B), a phenomenon closely related to the decrease in the tissues´ contraction seen during the same proceeding (Figure 1). In this sense, ROCK-phosphorylated MYPT1 participation in smooth muscle contraction has been reported before. In ASM, inhibition of the myosin light chain phosphatase is a key contributor to the sustained contraction phenomenon. This phosphatase is constituted by a catalytic subunit, a targeting, myosin-binding subunit (MYPT1) and a third subunit of unclear purpose. It has been established that MYPT1 phosphorylation by Rho kinase (ROCK) at T696 and T853 inhibits phosphatase activity [52].
Interestingly, a previous study carried out in bovine tracheal ASM, reports that KCl stimulation induced T853 and T696 phosphorylation, and that the latter is preferentially phosphorylated during the sustained contraction [53]. In comparison to these authors who employed 75 mM KCl, in the present work we used only 20 mM KCl in guinea pig ASM and also observed MYPT1 KCl-induced phosphorylation (Figure. 7B, 8B, 9B, 10B, 11B). Furthermore, by pharmacologically inhibiting RTKs with genistein and ST638, we observed a decrease in KCl-induced MYPT1 phosphorylation in T696 (Figure 7B), a finding that could be related to the lesser contractile response observed in organ bath experiments (Figure 1) when following the same experimental protocol.
On the other hand, MYPT1 phosphorylation state was not modified by the ERK´s antagonist FR180204 (Figure 8B), but was significantly diminished by the addition of PD98059, a MEK inhibitor (Figure 9B), and not by U0126, another MEK inhibitor (Figure 10B). In this regard, it has been reported that U0126 possesses greater potency than PD98059 [54], a fact that was also noticed in our experimental results for KCl-induced ERK phosphorylation. When comparing PD98059 effects on ERK phosphorylation (Figure 9A) against U0126 (Figure 10A), the inhibition induced by the latter is about 25% higher, illustrating its greater effect (note that both inhibitors were tested at 5 and 10 µM). Regarding U0126 inhibitory effects on KCl-induced MYPT1 phosphorylation, it did not modify it, indicating that, when MEK is efficiently inhibited, its effect on MYPT1 is null. As already mentioned, in ASM, MYPT1 phosphorylation is primordially carried out by ROCK; in this sense, when we employed a ROCK inhibitor (Y-27632), we observed a significant reduction in the KCl-induced contraction (Figure 5) and in the MYPT1 phosphorylation (Figure 11 B). This inhibitor had no effect on the ERK phosphorylation induced by KCl (Figure 11 A). Surprisingly, the inhibition of the myosin light chain kinase (MLCK) with ML-7 did not modify the KCl-induced contraction in ASM (Figure 6). In this sense, Saponara et al., [55] found, in rat vascular tissues, that ML-7 effects include inhibition of L-VDCC activity in a concentration-dependent manner and, moreover, its effect is voltage-dependent (its efficacy increased at more depolarized holding potential). Conceivably, the depolarization generated by the addition of 20 mM KCl in ASM was not high enough to generate a proper ML-7 inhibition of the MLCK. Notwithstanding, our results in Figure. 6 show a tendency regarding ML-7 concentration-dependency, since the addition of 10µM induced a lower KCl-induced contraction than 5µM. In accordance with these findings, caution in the results´ interpretation is recommended when using this kinase blocker.
In summary, in guinea pig ASM, KCl stimulation activates MEK and ROCK through RTKs and, therefore, these kinases ‘triggering mechanisms might be connected. Indeed, both signaling pathways include an upstream small GTPase, Ras in the case of MEK and Rho for ROCK. Ras and Rho are classified as small GTPases, molecular switches that are inactive while bound to GDP and active in their GTP-bound state. In this sense, the Ras superfamily of small GTPases includes Ras, Rho, Ran, Rab, and Arf. Each family is further subdivided into subfamilies with a shared G domain that confers them GTPase and nucleotide exchange capacities [56] as, for instance, the Rho family of GTPases, that includes Rac, Rho, and Cdc42 [57]. Small GTPases are located in the plasma membrane, where they transit from the GDP-bound to the GTP-bound state as a consequence of the stimulation of cell surface receptors, as for instance, RTKs [13]. This transition from GDP to GTP-bound state is aided by guanine nucleotide-exchange factors (GEFs), while GTPase-activating proteins (GAPs) convert GTP-bound small GTPase back to GDP-bound state [58,59].
It has been recognized that Ras and Rho GTPases share some important convergent cellular responses like gene expression, cellular proliferation, and actin cytoskeleton regulation. Interestingly, it has been reported that, in ASM, RhoA-activated ROCK inhibits MLC phosphatase contributing to this tissue´s sustained contraction [3], but it also regulates F-actin dynamics and actin polymerization by activating the serine–threonine kinase Pak, which, in turn, mediates the activation of Cdc42 and neuronal Wiskott–Aldrich syndrome protein (N-WASp) that participate in the nucleation of actin filaments [60,61] In fact, cytoskeleton´s dynamics play a preponderant role in ASM contraction. In this sense, it is known that prompt actin polymerization is a response to growth factors like platelet derived growth factor and that the small GTPase Rac intervenes in the plasma membrane [62], while Rho modulates focal adhesions assembly and actin stress fibers formation [63].
5. Conclusions
In conclusion, in ASM, RTKs stimulation with a low KCl concentration activates Ras and consequently MEK to induce IEG, Rho and Rac to control actin cytoskeleton organization to aid contraction and RhoA/ROCK to induce Ca2+ sensitization. The physiological importance of these signaling pathways and the crosstalk between membrane GTPases in this tissue seems highly relevant and therefore requires further and more detailed research.
Author Contributions
Conceptualization, BS. and VC.; methodology, VC.; software N/A.; validation, BS, VC. and EHA.; formal analysis, BS and VC.; investigation, BS., VC., EHA., EFS., RML., EFC, PCB; resources, BS. and VC; data curation, BS and VC; writing—original draft preparation, BS.; writing—review and editing, BS., VC., EFS; visualization, RML., EFC., PCB.; supervision, VC.; project administration, VC.; funding acquisition, BS. And VC. All authors have read and agreed to the published version of the manuscript.
Funding
This research was funded by the Instituto Nacional de Enfermedades Respiratorias “Ismael Cosío Villegas”, México City, México.
Institutional Review Board Statement
The animal study was conducted in accordance with the Guiding Principles for the Care and Use of Vertebrate Animals in Research and Training published by the American Physiological Society, accessed on January 2025, and the National Institutes of Health Guide for the Care and Use of Laboratory Animals was also consulted. The Mexican National Laws on Animal Protection and the General Health Law Related to Health Research (NOM-062-Z00-1999) were also taken into consideration. The study was approved by the Institutional Scientific and Ethics Committee (protocol code B01-22, dated July 1, 2025).
Data Availability Statement
The original contributions presented in this study are included in the article. Further inquiries can be directed to the corresponding authors.
Acknowledgments
Authors are grateful to the Instituto Nacional de Enfermedades Respiratorias “Ismael Cosío Villegas” for the support in the development and publication of the research reported herein. MSc. Eva María Angélica Herrera-Alcibar is thankful to the Programa de Maestría en Ciencias en Farmacología, Escuela de Superior de Medicina, Instituto Politécnico Nacional, for the support received during her master's degree studies. She received a scholarship (No. 802318; CVU 1151217) from the Secretariat of Science, Humanities, Technology, and Innovation (SECIHTI, formerly CONAHCYT), México. The data presented in this manuscript were reported as part of her master's degree thesis. We thank Lizet Ocampo Monzalvo for her technical support.
Conflicts of Interest
The authors declare no conflicts of interest.
Abbreviations
The following abbreviations are used in this manuscript:
| ASM | Airway smooth muscle |
| CaM | Calmodulin |
| CaMK | Calmodulin kinase |
| GAP | GTPase-activating proteins |
| GEF | Nucleotide-exchange factor |
| IEG | Immediate early genes |
| L-VDCC | L-type voltage dependent Ca2+ channels |
| MLCK | Myosin light chain kinase |
| MLCP | Myosin light chain phosphatase |
| MYPT1 | Myosin phosphatase targeting subunit |
| ROCK | Rho kinase |
| RTKs | Receptor tyrosine kinase |
References
- Amrani, Y. , Panettieri, R.A. Airway smooth muscle: contraction and beyond. Int. J. Biochem. Cell. Biol. 2003, 35, 272–2766. [Google Scholar] [CrossRef] [PubMed]
- Roth, M. , Tamm, M. Airway smooth muscle cells respond directly to inhaled environmental factors. Swiss. Med. Wkly. 2010, 27, 140–w13066. [Google Scholar] [CrossRef] [PubMed]
- Somlyo, A.P. , Somlyo, A.V. Ca2+ sensitivity of smooth muscle and nonmuscle myosin II: modulated by G proteins, kinases, and myosin phosphatase. Physiol. Rev. 2003, 83, 1325–1358. [Google Scholar] [CrossRef] [PubMed]
- Sommer, B. , Montano, L.M., Chávez, J., Carbajal, V., García-Hernandez, L.M., Irles, C., Jiménez-Garduno, A.M., Ortega, A. ROCK1 translocates from non-caveolar to caveolar regions upon KCl stimulation in airway smooth muscle. Physiol. Res. 2014, 63, 179–187. [Google Scholar] [CrossRef] [PubMed]
- Janssen, L.J. , Tazzeo, T., Zuo, J., Pertens, E., Keshavjee, S. KCl evokes contraction of airway smooth muscle via activation of RhoA and Rho-kinase. Am. J. Physiol. Lung. Cell. Mol. Physiol. 2004, 287, L852–L858. [Google Scholar] [CrossRef] [PubMed]
- Semenov, I. , Brenner, R. Voltage effects on muscarinic acetylcholine receptor-mediated contractions of airway smooth muscle. Physiol. Rep. 2018, 6, e13856. [Google Scholar] [CrossRef] [PubMed] [PubMed Central]
- Woller, S.A. , Eddinger, K.A., Corr, M., Yaksh, T.L. An overview of pathways encoding nociception. Clin. Exp. Rheumatol. 2017, 107(5), 40–46. [Google Scholar]
- Yocum, G.T. , Chen, J., Choi, C.H., Townsend, E.A., Zhang, Y., Xu, D., Fu, X.W., Sanderson, M.J., Emala, C.W. Role of transient receptor potential vanilloid 1 in the modulation of airway smooth muscle tone and calcium handling. Am. J. Physiol. Lung. Cell. Mol. Physiol. 2017, 312, L812–L821. [Google Scholar] [CrossRef] [PubMed] [PubMed Central]
- Choi, J.Y. , Lee, H.Y., Hur, J., Kim, K.H., Kang, J.Y., Rhee, C.K., Lee, S.Y. TRPV1 blocking alleviates airway inflammation and remodeling in a chronic asthma murine model. Allergy Asthma Immunol. Res. 2018, 10, 216–224. [Google Scholar] [CrossRef] [PubMed] [PubMed Central]
- Mita, M. , Tanaka, H., Yanagihara, H., Nakagawa, J., Hishinuma, S., Sutherland, C., Walsh, M.P., Shoji, M. Membrane depolarization-induced RhoA/Rho-associated kinase activation and sustained contraction of rat caudal arterial smooth muscle involves genistein-sensitive tyrosine phosphorylation. J. Smooth. Muscle. Res. 2013, 49, 26–45. [Google Scholar] [CrossRef] [PubMed] [PubMed Central]
- Yan, G.R. , Xiao, C.L., He, G.W., Yin, X.F., Chen, N.P., Cao, Y., He, Q.Y. Global phosphoproteomic effects of natural tyrosine kinase inhibitor, genistein, on signaling pathways. Proteomics. 2010, 10, 976–986. [Google Scholar] [CrossRef] [PubMed]
- Croisy-Delcey, M. , Croisy, A., Mousset, S., Letourneur, M., Bisagni, E., Jacquemin-Sablon, A., Pierre, J. Genistein analogues: effects on epidermal growth factor receptor tyrosine kinase and on stress-activated pathways. Biomed. Pharmacother. 1997, 51, 286–294. [Google Scholar] [CrossRef] [PubMed]
- Sundaram, M.V. RTK/Ras/MAPK signaling. WormBook. 2006, 11, 1–19. [Google Scholar] [CrossRef] [PubMed] [PubMed Central]
- Sakai, H. , Watanabe, Y., Honda, M., Tsuiki, R., Ueda, Y., Nagai, Y., Narita, M., Misawa, M., Chiba, Y. Involvement of the Tyr kinase/JNK pathway in carbachol-induced bronchial smooth muscle contraction in the rat. Anesthesiology. 2013, 118, 1076–1085. [Google Scholar] [CrossRef] [PubMed]
- Zubkov, A.Y. , Rollins, K.S., Zhang, J.H. KCl activates mitogen-activated protein kinase in rabbit basilar artery. Biochem. Biophys. Res. Commun. 2002, 293, 660–664. [Google Scholar] [CrossRef] [PubMed]
- McKay, M.M. , Morrison, D.K. Integrating signals from RTKs to ERK/MAPK. Oncogene. 2007, 26, 3113–3121. [Google Scholar] [CrossRef] [PubMed]
- Jeong, K.J. , Cho, K.H., Panupinthu, N., Kim, H., Kang, J., Park, C.G., Mills, G.B., Lee, H.Y. EGFR mediates LPA-induced proteolytic enzyme expression and ovarian cancer invasion: inhibition by resveratrol. Mol. Oncol. 2013, 7, 121–129. [Google Scholar] [CrossRef] [PubMed] [PubMed Central]
- Stewart, A.G. Airway wall remodelling and hyperresponsiveness: modelling remodelling in vitro and in vivo. Pulm. Pharmacol. Ther. 2001, 14, 255–265. [Google Scholar] [CrossRef] [PubMed]
- Hallgren, O. , Rolandsson, S., Andersson-Sjöland, A., Nihlberg, K., Wieslander, E., Kvist-Reimer, M., Dahlbäck, M., Eriksson, L., Bjermer, L., Erjefält, J.S., Löfdahl, C.G., Westergren-Thorsson, G. Enhanced ROCK1 dependent contractility in fibroblast from chronic obstructive pulmonary disease patients. J Transl Med. 2012, 10, 171–182. [Google Scholar] [CrossRef] [PubMed] [PubMed Central]
- Chopra, L.C. , Hucks, D., Twort, C.H., Ward, J.P. Effects of protein tyrosine kinase inhibitors on contractility of isolated bronchioles of the rat. Am. J. Respir. Cell. Mol. Biol. 1997, 16, 372–378. [Google Scholar] [CrossRef] [PubMed]
- Ohori, M. , Kinoshita, T., Okubo, M., Sato, K., Yamazaki, A., Arakawa, H., Nishimura, S., Inamura, N., Nakajima, H., Neya, M., Miyake, H., Fujii, T. Identification of a selective ERK inhibitor and structural determination of the inhibitor-ERK2 complex. Biochem. Biophys. Res. Commun. 2005, 336, 357–363. [Google Scholar] [CrossRef] [PubMed]
- Alessi, D.R. , Cuenda, A., Cohen, P., Dudley, D.T., Saltiel, A.R. PD 098059 is a specific inhibitor of the activation of mitogen-activated protein kinase kinase in vitro and in vivo. J. Biol. Chem. 1995, 270, 27489–27494. [Google Scholar] [CrossRef] [PubMed]
- Favata, M.F. , Horiuchi, K.Y., Manos, E.J., Daulerio, A.J., Stradley, D.A., Feeser, W.S., Van Dyk, D.E., Pitts, W.J., et al. Identification of a novel inhibitor of mitogen-activated protein kinase kinase. J. Biol. Chem. 1998, 273, 18623–18632. [Google Scholar] [CrossRef] [PubMed]
- Yayama, K. , Sasahara, T., Ohba, H., Funasaka, A., Okamoto, H. Orthovanadate-induced vasocontraction is mediated by the activation of Rho-kinase through Src-dependent transactivation of epidermal growth factor receptor. Pharmacol. Res. Perspect. 2014, 2, e00039. [Google Scholar] [CrossRef] [PubMed] [PubMed Central]
- Ratz, P.H. , Berg, K.M., Urban, N.H., Miner, A.S. Regulation of smooth muscle calcium sensitivity: KCl as a calcium-sensitizing stimulus. Am J Physiol Cell Physiol. 2005, 288, C769–C783. [Google Scholar] [CrossRef] [PubMed]
- Liu, C. , Zuo, J., Pertens, E., Helli, P.B., Janssen, L.J. Regulation of Rho/ROCK signaling in airway smooth muscle by membrane potential and [Ca2+]i. Am. J. Physiol. Lung. Cell. Mol. Physiol. 2005, 289, L574–L582. [Google Scholar] [CrossRef] [PubMed]
- Momin, A.A. , Mendes, T., Barthe, P., Faure, C., Hong, S., Yu, P., Kadaré, G., Jaremko, M., Girault, J.A., Jaremko, Ł., Arold, S.T. PYK2 senses calcium through a disordered dimerization and calmodulin-binding element. Commun. Biol. 2022, 5, 800. [Google Scholar] [CrossRef] [PubMed] [PubMed Central]
- Vetter, S.W. , Leclerc, E. Novel aspects of calmodulin target recognition and activation. Eur. J. Biochem. 2003, 270, 404–414. [Google Scholar] [CrossRef] [PubMed]
- Pelaia, G. , Renda, T., Gallelli, L., Vatrella, A., Busceti, M.T., Agati, S., Caputi, M., Cazzolam M,, Maselli, R., Marsico, S.A. Molecular mechanisms underlying airway smooth muscle contraction and proliferation: implications for asthma. Respir. Med. 2008, 102, 1173–1181. [Google Scholar] [CrossRef] [PubMed]
- Hossain, M.A. Targeting the RAS upstream and downstream signaling pathway for cancer treatment. Eur. J. Pharmacol. 2024, 979, 176727. [Google Scholar] [CrossRef] [PubMed]
- Ashton-Beaucage, D. , Therrien, M. How genetics has helped piece together the MAPK signaling pathway. Methods Mol Biol. 2017, 1487, 1–21. [Google Scholar] [CrossRef] [PubMed]
- Scardaci, R. , Berlinska, E., Scaparone, P., Vietti Michelina, S., Garbo, E., Novello, S., Santamaria, D., Ambrogio, C. Novel RAF-directed approaches to overcome current clinical limits and block the RAS/RAF node. Mol Oncol. 2024, 18, 1355–1377. [Google Scholar] [CrossRef] [PubMed] [PubMed Central]
- Ammon, H.P. , Heurich, R.O., Kolb, H.A., Lang, F., Schaich, R., Drews, G., Leiers, T. The phosphatase inhibitor okadaic acid blocks KCl-depolarization-induced rise of cytosolic calcium of rat insulinoma cells (RINm5F). Naunyn Schmiedebergs Arch. Pharmacol. 1996, 354, 95–101. [Google Scholar] [CrossRef] [PubMed]
- Archana, G.M. , Arunkumar, R.C., Omkumar, R.V. Assays for L-type voltage gated calcium channels. Anal. Biochem. 2022, 656, 114827. [Google Scholar] [CrossRef] [PubMed]
- Barbado, M. , Fablet, K., Ronjat, M., De Waard, M. Gene regulation by voltage-dependent calcium channels. Biochim. Biophys. Acta. 2009, 1793, 1096–10104. [Google Scholar] [CrossRef] [PubMed]
- Dolmetsch, R.E. , Pajvani, U., Fife, K., Spotts, J.M., Greenberg, M.E. Signaling to the nucleus by an L-type calcium channel-calmodulin complex through the MAP kinase pathway. Science. 2001, 294, 333–339. [Google Scholar] [CrossRef] [PubMed]
- Schmitt, J.M. , Wayman, G.A., Nozaki, N., Soderling, T.R. Calcium activation of ERK mediated by calmodulin kinase I. J. Biol. Chem. 2004, 279, 24064–24072. [Google Scholar] [CrossRef] [PubMed]
- Kim, I. , Je, H.D., Gallant, C., Zhan, Q., Riper, D.V., Badwey, J.A., Singer, H.A., Morgan, K.G. Ca2+-calmodulin-dependent protein kinase II-dependent activation of contractility in ferret aorta. J. Physiol. 2000, 526 Pt 2 Pt 2, 367–374. [Google Scholar] [CrossRef] [PubMed] [PubMed Central]
- Guo, Y.J. , Pan, W.W., Liu, S.B., Shen, Z.F., Xu, Y., Hu, L.L. ERK/MAPK signalling pathway and tumorigenesis. Exp. Ther. Med. 2020, 19, 1997–2007. [Google Scholar] [CrossRef] [PubMed] [PubMed Central]
- Tyssowski, K.M. , DeStefino, N.R., Cho, J.H., Dunn, C.J., Poston, R.G., Carty, C.E., Jones, R.D., Chang, S.M., et al. Different neuronal activity patterns induce different gene expression programs. Neuron. 2018, 98, 530–546.e11. [Google Scholar] [CrossRef] [PubMed] [PubMed Central]
- Pulver-Kaste, R.A. , Barlow, C.A., Bond, J., Watson, A., Penar, P.L., Tranmer, B., Lounsbury, K.M. Ca2+ source-dependent transcription of CRE-containing genes in vascular smooth muscle. Am. J. Physiol. Heart. Circ. Physiol. [CrossRef] [PubMed]
- McKay, S. , de Jongste, J.C., Saxena, P.R., Sharma, H.S. Angiotensin II induces hypertrophy of human airway smooth muscle cells: expression of transcription factors and transforming growth factor-beta1. Am. J. Respir. Cell. Mol. Biol. 1998, 18, 823–833. [Google Scholar] [CrossRef] [PubMed]
- Hjoberg, J. , Le, L., Imrich, A., Subramaniam, V., Mathew, S.I., Vallone, J., Haley, K.J., Green, F.H., Shore, S.A., Silverman, E.S. Induction of early growth-response factor 1 by platelet-derived growth factor in human airway smooth muscle. Am J Physiol Lung Cell Mol Physiol. 2004, 286, L817–L825. [Google Scholar] [CrossRef] [PubMed]
- Ressler, B. , Lee, R.T., Randell, S.H., Drazen, J.M., Kamm, R.D. Molecular responses of rat tracheal epithelial cells to transmembrane pressure. Am J Physiol Lung Cell Mol Physiol. 2000, 278, L1264–L1272. [Google Scholar] [CrossRef] [PubMed]
- Herschman, H.R. Primary response genes induced by growth factors and tumor promoters. Annu. Rev. Biochem. 1991, 60, 281–319. [Google Scholar] [CrossRef] [PubMed]
- O'Donnell, A. , Odrowaz, Z., Sharrocks, A.D. Immediate-early gene activation by the MAPK pathways: what do and don't we know? Biochem. Soc. Trans. 2012, 40, 58–66. [Google Scholar] [CrossRef] [PubMed]
- Lau, L.F. , Nathans, D. Expression of a set of growth-related immediate early genes in BALB/c 3T3 cells: coordinate regulation with c-fos or c-myc. Proc. Natl. Acad. Sci. U S A. 1987, 84, 1182–1186. [Google Scholar] [CrossRef] [PubMed] [PubMed Central]
- Greenberg, M.E. , Ziff, E.B. Stimulation of 3T3 cells induces transcription of the c-fos proto-oncogene. Nature. 1984, 311, 433–438. [Google Scholar] [CrossRef] [PubMed]
- Cochran, B.H. , Zullo, J., Verma, I.M., Stiles, C.D. Expression of the c-fos gene and of an fos-related gene is stimulated by platelet-derived growth factor. Science Erratum in: Science 1986, 232, 307. 1984, 226, 1080–1082. [Google Scholar] [CrossRef] [PubMed]
- Gomard, T. , Jariel-Encontre, I., Basbous, J., Bossis, G., Moquet-Torcy, G., Piechaczyk, M. Fos family protein degradation by the proteasome. Biochem. Soc. Trans, Erratum in: Biochem Soc Trans. 2013, 41, 1773. Mocquet-Torcy, Gabriel [corrected to Moquet-Torcy, Gabriel]. [CrossRef] [PubMed]
- Di Paola, R. , Galuppo, M., Mazzon, E., Paterniti, I., Bramanti, P., Cuzzocrea, S. PD98059, a specific MAP kinase inhibitor, attenuates multiple organ dysfunction syndrome/failure (MODS) induced by zymosan in mice. Pharmacol. Res. 2010, 61, 175–187. [Google Scholar] [CrossRef] [PubMed]
- MacDonald, J.A. , Walsh, M.P. Regulation of smooth muscle myosin light chain phosphatase by multisite phosphorylation of the myosin targeting subunit, MYPT1. Cardiovasc. Hematol. Disord. Drug Targets. 2018, 18, 4–13. [Google Scholar] [CrossRef] [PubMed]
- Gao, N. , Tsai, M.H., Chang, A.N., He, W., Chen, C.P., Zhu, M., Kamm, K.E., Stull, J.T. Physiological vs. pharmacological signalling to myosin phosphorylation in airway smooth muscle. J. Physiol. 2017, 595, 6231–6247. [Google Scholar] [CrossRef] [PubMed] [PubMed Central]
- Shang, J. , Lu, S., Jiang, Y., Zhang, J. Allosteric modulators of MEK1: drug design and discovery. Chem. Biol. Drug. Des. 2016, 88, 485–497. [Google Scholar] [CrossRef] [PubMed]
- Saponara, S. , Fusi, F., Sgaragli, G., Cavalli, M., Hopkins, B., Bova, S. Effects of commonly used protein kinase inhibitors on vascular contraction and L-type Ca(2+) current. Biochem. Pharmacol. 2012, 84, 1055–1061. [Google Scholar] [CrossRef] [PubMed]
- Reiner, D.J. , Lundquist, E.A. Small GTPases. WormBook. 2018, 2018, 1–65. [Google Scholar] [CrossRef] [PubMed] [PubMed Central]
- Mosaddeghzadeh, N. , Ahmadian, M.R. The RHO Family GTPases: Mechanisms of Regulation and Signaling. Cells 2021, 10, 1831. [Google Scholar] [CrossRef] [PubMed]
- Cherfils, J. , Zeghouf, M. Regulation of small GTPases by GEFs, GAPs, and GDIs. Physiol. Rev. 2013, 93, 269–309. [Google Scholar] [CrossRef] [PubMed]
- Bos, J.L. , Rehmann, H., Wittinghofer, A. GEFs and GAPs: critical elements in the control of small G proteins. Cell. 2007, 129, 865–877. [Google Scholar] [CrossRef] [PubMed]
- Zhang, W. , Bhetwal, B.P., Gunst, S.J. Rho kinase collaborates with p21-activated kinase to regulate actin polymerization and contraction in airway smooth muscle. J Physiol. 2018, 596, 3617–3635. [Google Scholar] [CrossRef] [PubMed] [PubMed Central]
- Zhang, W. , Huang, Y., Gunst, S.J. The small GTPase RhoA regulates the contraction of smooth muscle tissues by catalyzing the assembly of cytoskeletal signaling complexes at membrane adhesion sites. J. Biol. Chem. 2012, 287, 33996–4008. [Google Scholar] [CrossRef] [PubMed] [PubMed Central]
- Ridley, A.J. , Paterson, H.F., Johnston, C.L., Diekmann, D., Hall, A. The small GTP-binding protein rac regulates growth factor-induced membrane ruffling. Cell 1992, 70, 401–410. [Google Scholar] [CrossRef] [PubMed]
- Ridley, A.J. , Hall, A. The small GTP-binding protein rho regulates the assembly of focal adhesions and actin stress fibers in response to growth factors. Cell 1992, 70, 389–399. [Google Scholar] [CrossRef] [PubMed]
Figure 1.
RTKs inhibitors diminish the contraction response induced by KCl. Genistein (GEN) and ST638 (10 μM, n= 10 and n= 9, respectively) significantly diminished the contraction induced by 20 mM KCl in guinea pig tracheas. Symbols represent mean ± standard error of the mean. **p<0.01.
Figure 1.
RTKs inhibitors diminish the contraction response induced by KCl. Genistein (GEN) and ST638 (10 μM, n= 10 and n= 9, respectively) significantly diminished the contraction induced by 20 mM KCl in guinea pig tracheas. Symbols represent mean ± standard error of the mean. **p<0.01.
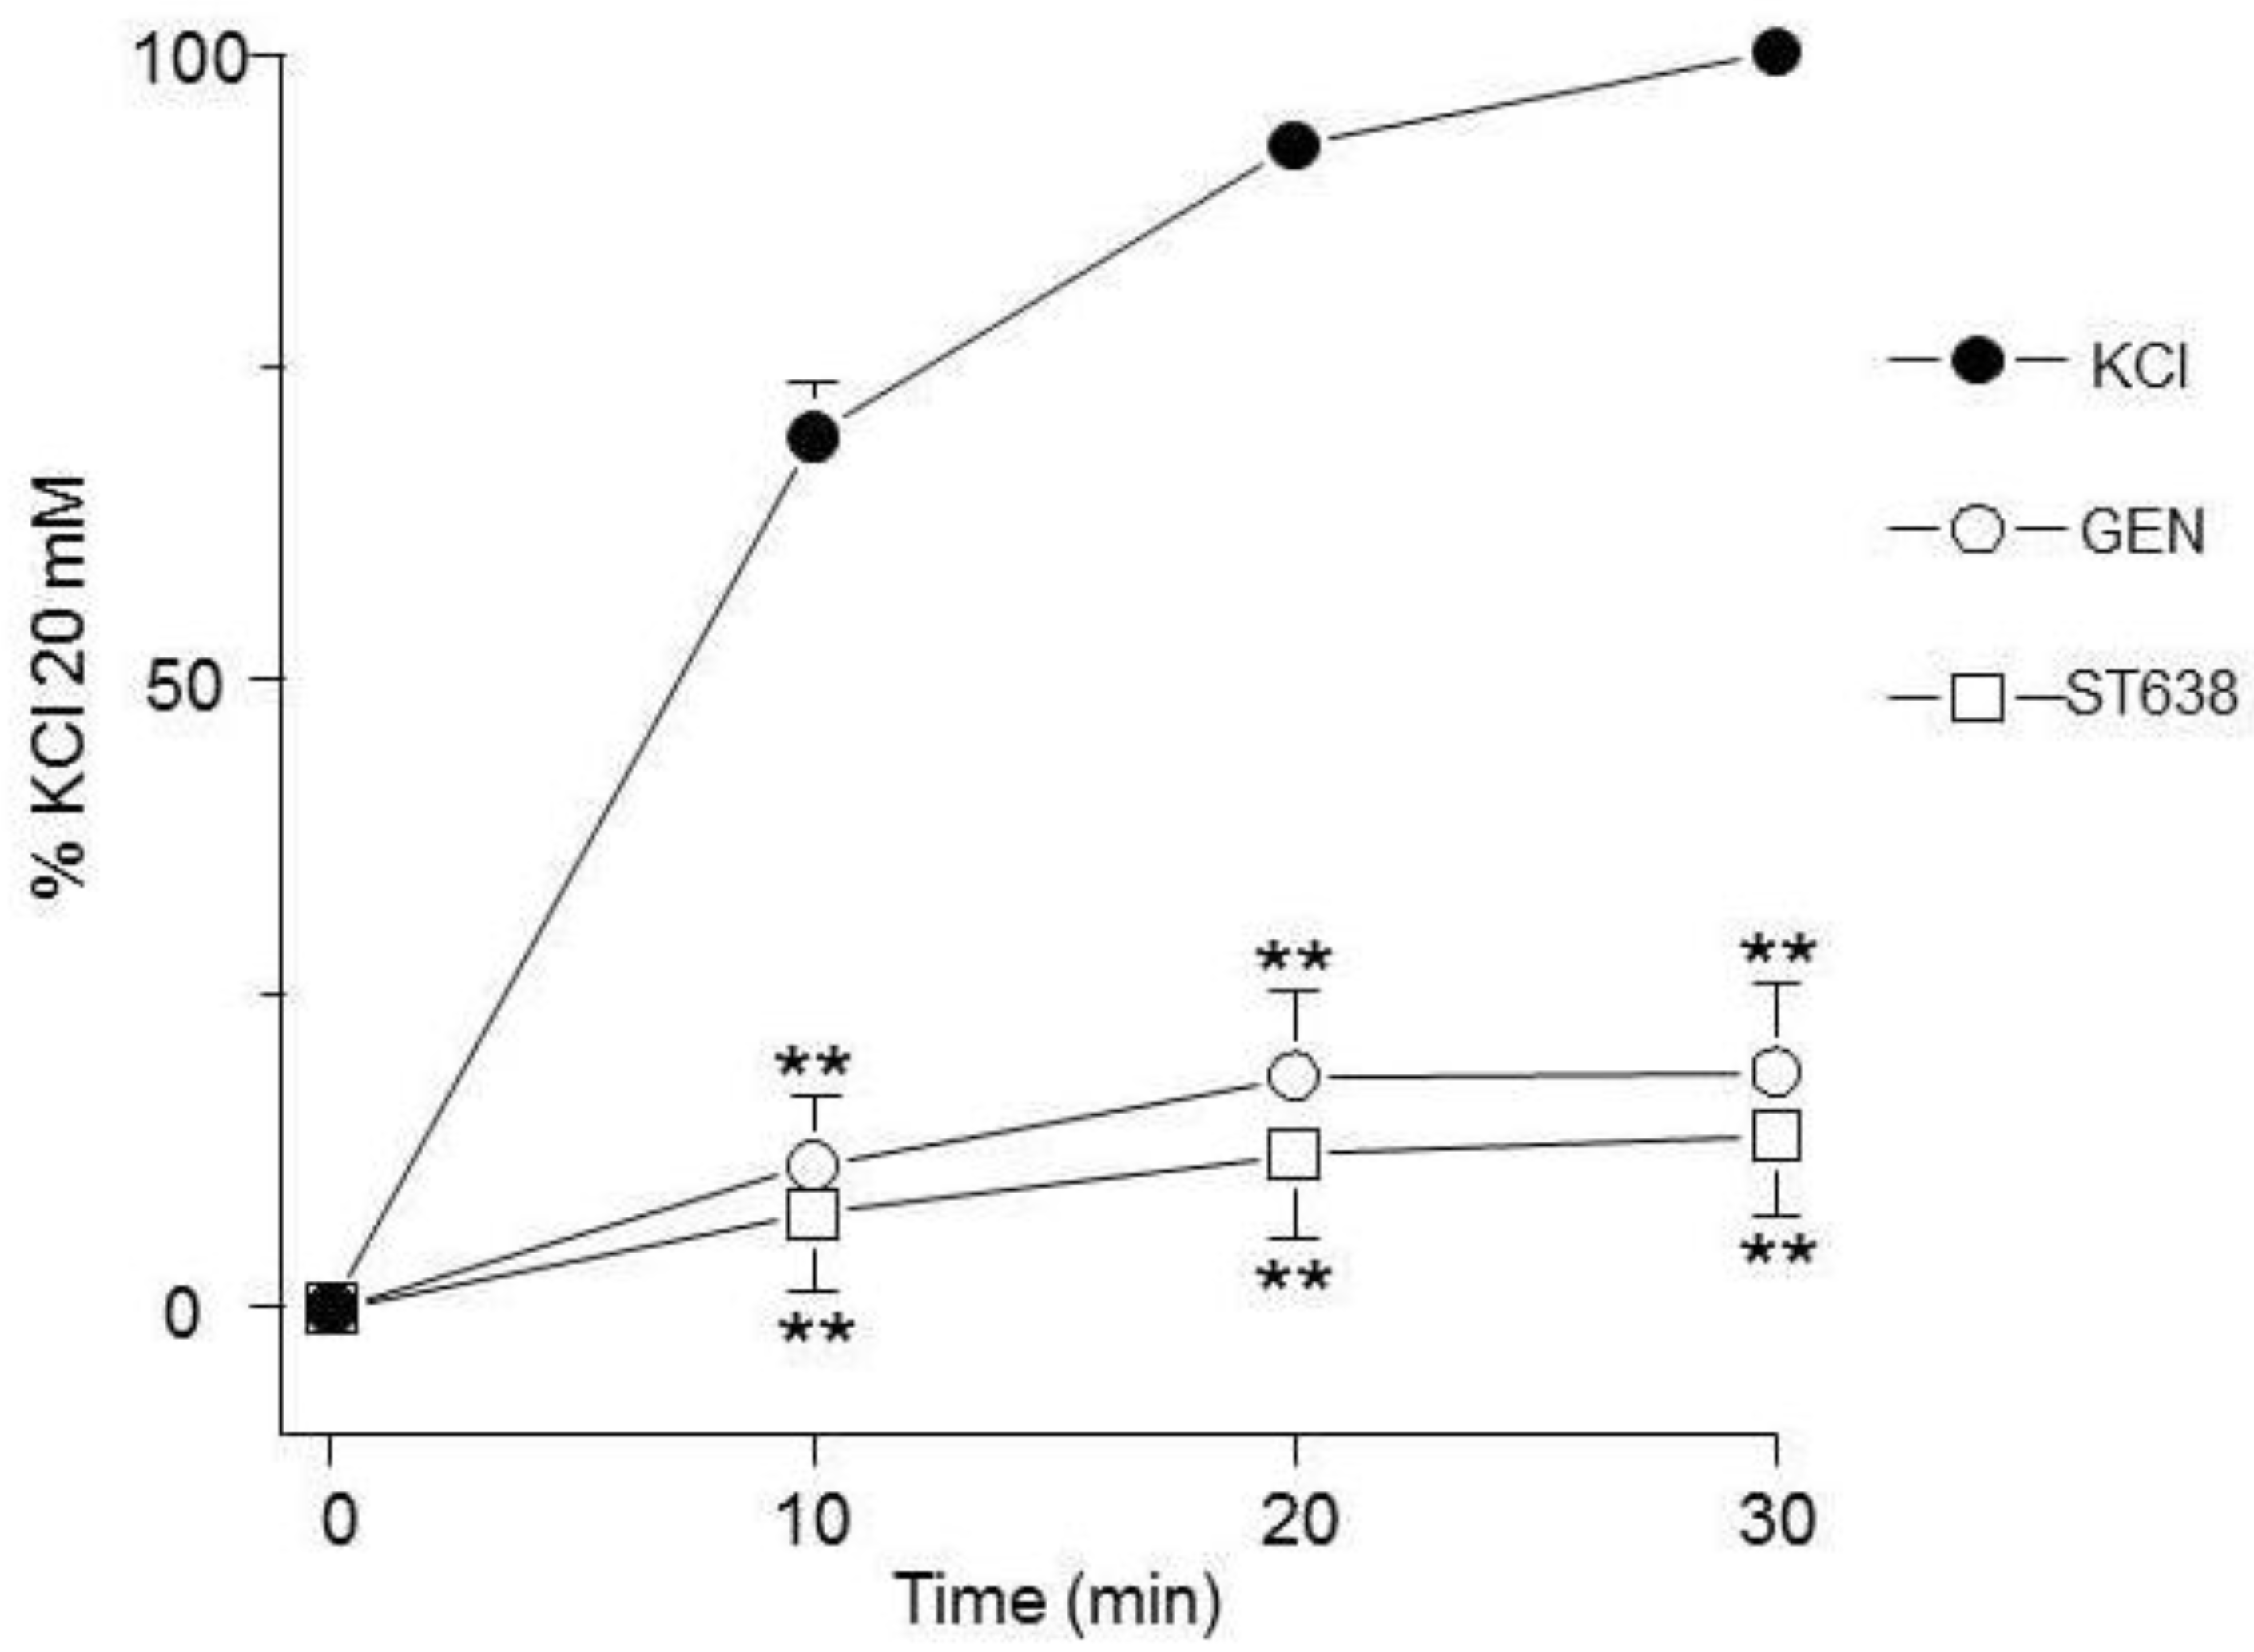
Figure 2.
Effect of an ERK inhibitor on the contraction response induced by KCl. FR180204 (5 µM, 10 µM, n=10 each) showed no effect on the contraction induced by 20 mM KCl in guinea pig trachea. Symbols represent mean ± standard error of the mean.
Figure 2.
Effect of an ERK inhibitor on the contraction response induced by KCl. FR180204 (5 µM, 10 µM, n=10 each) showed no effect on the contraction induced by 20 mM KCl in guinea pig trachea. Symbols represent mean ± standard error of the mean.
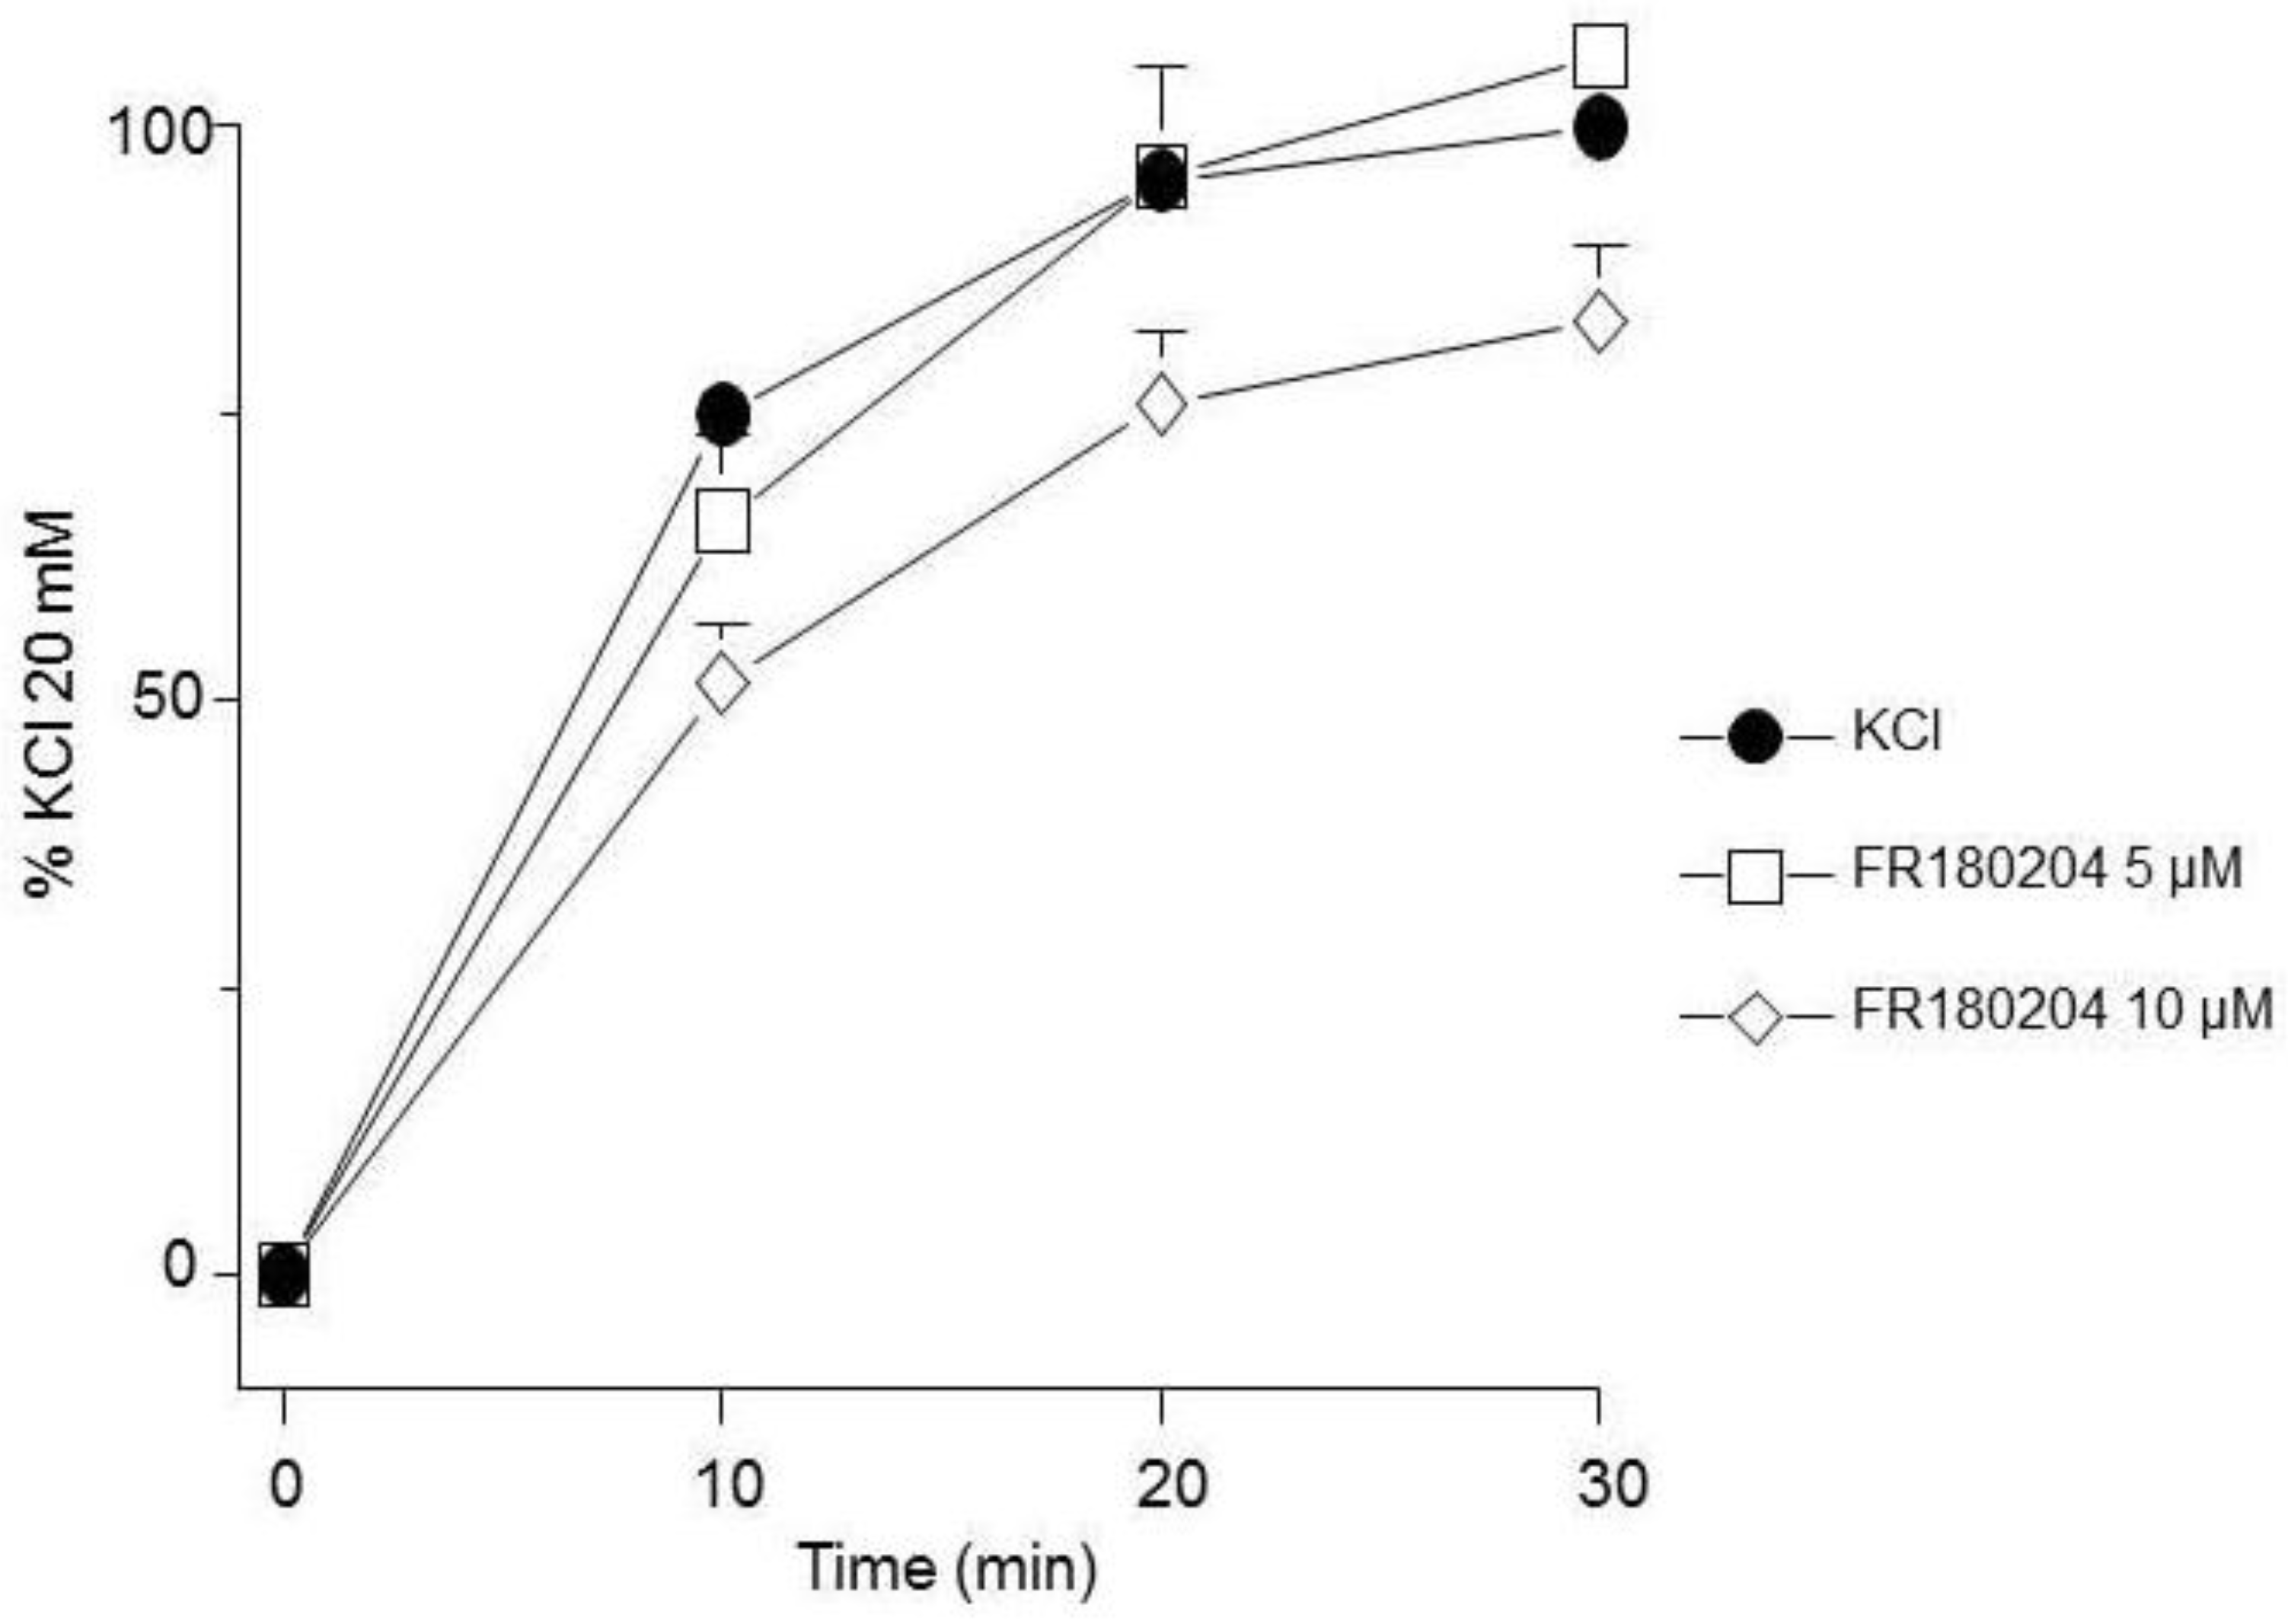
Figure 3.
MEK inhibition reduced the contraction induced by KCl. PD98059 (5 µM, 10 µM, n=10 each) diminished the contraction induced by KCl 20 mM in guinea pig trachea. Symbols represent mean ± standard error of the mean, **p<0.01.
Figure 3.
MEK inhibition reduced the contraction induced by KCl. PD98059 (5 µM, 10 µM, n=10 each) diminished the contraction induced by KCl 20 mM in guinea pig trachea. Symbols represent mean ± standard error of the mean, **p<0.01.
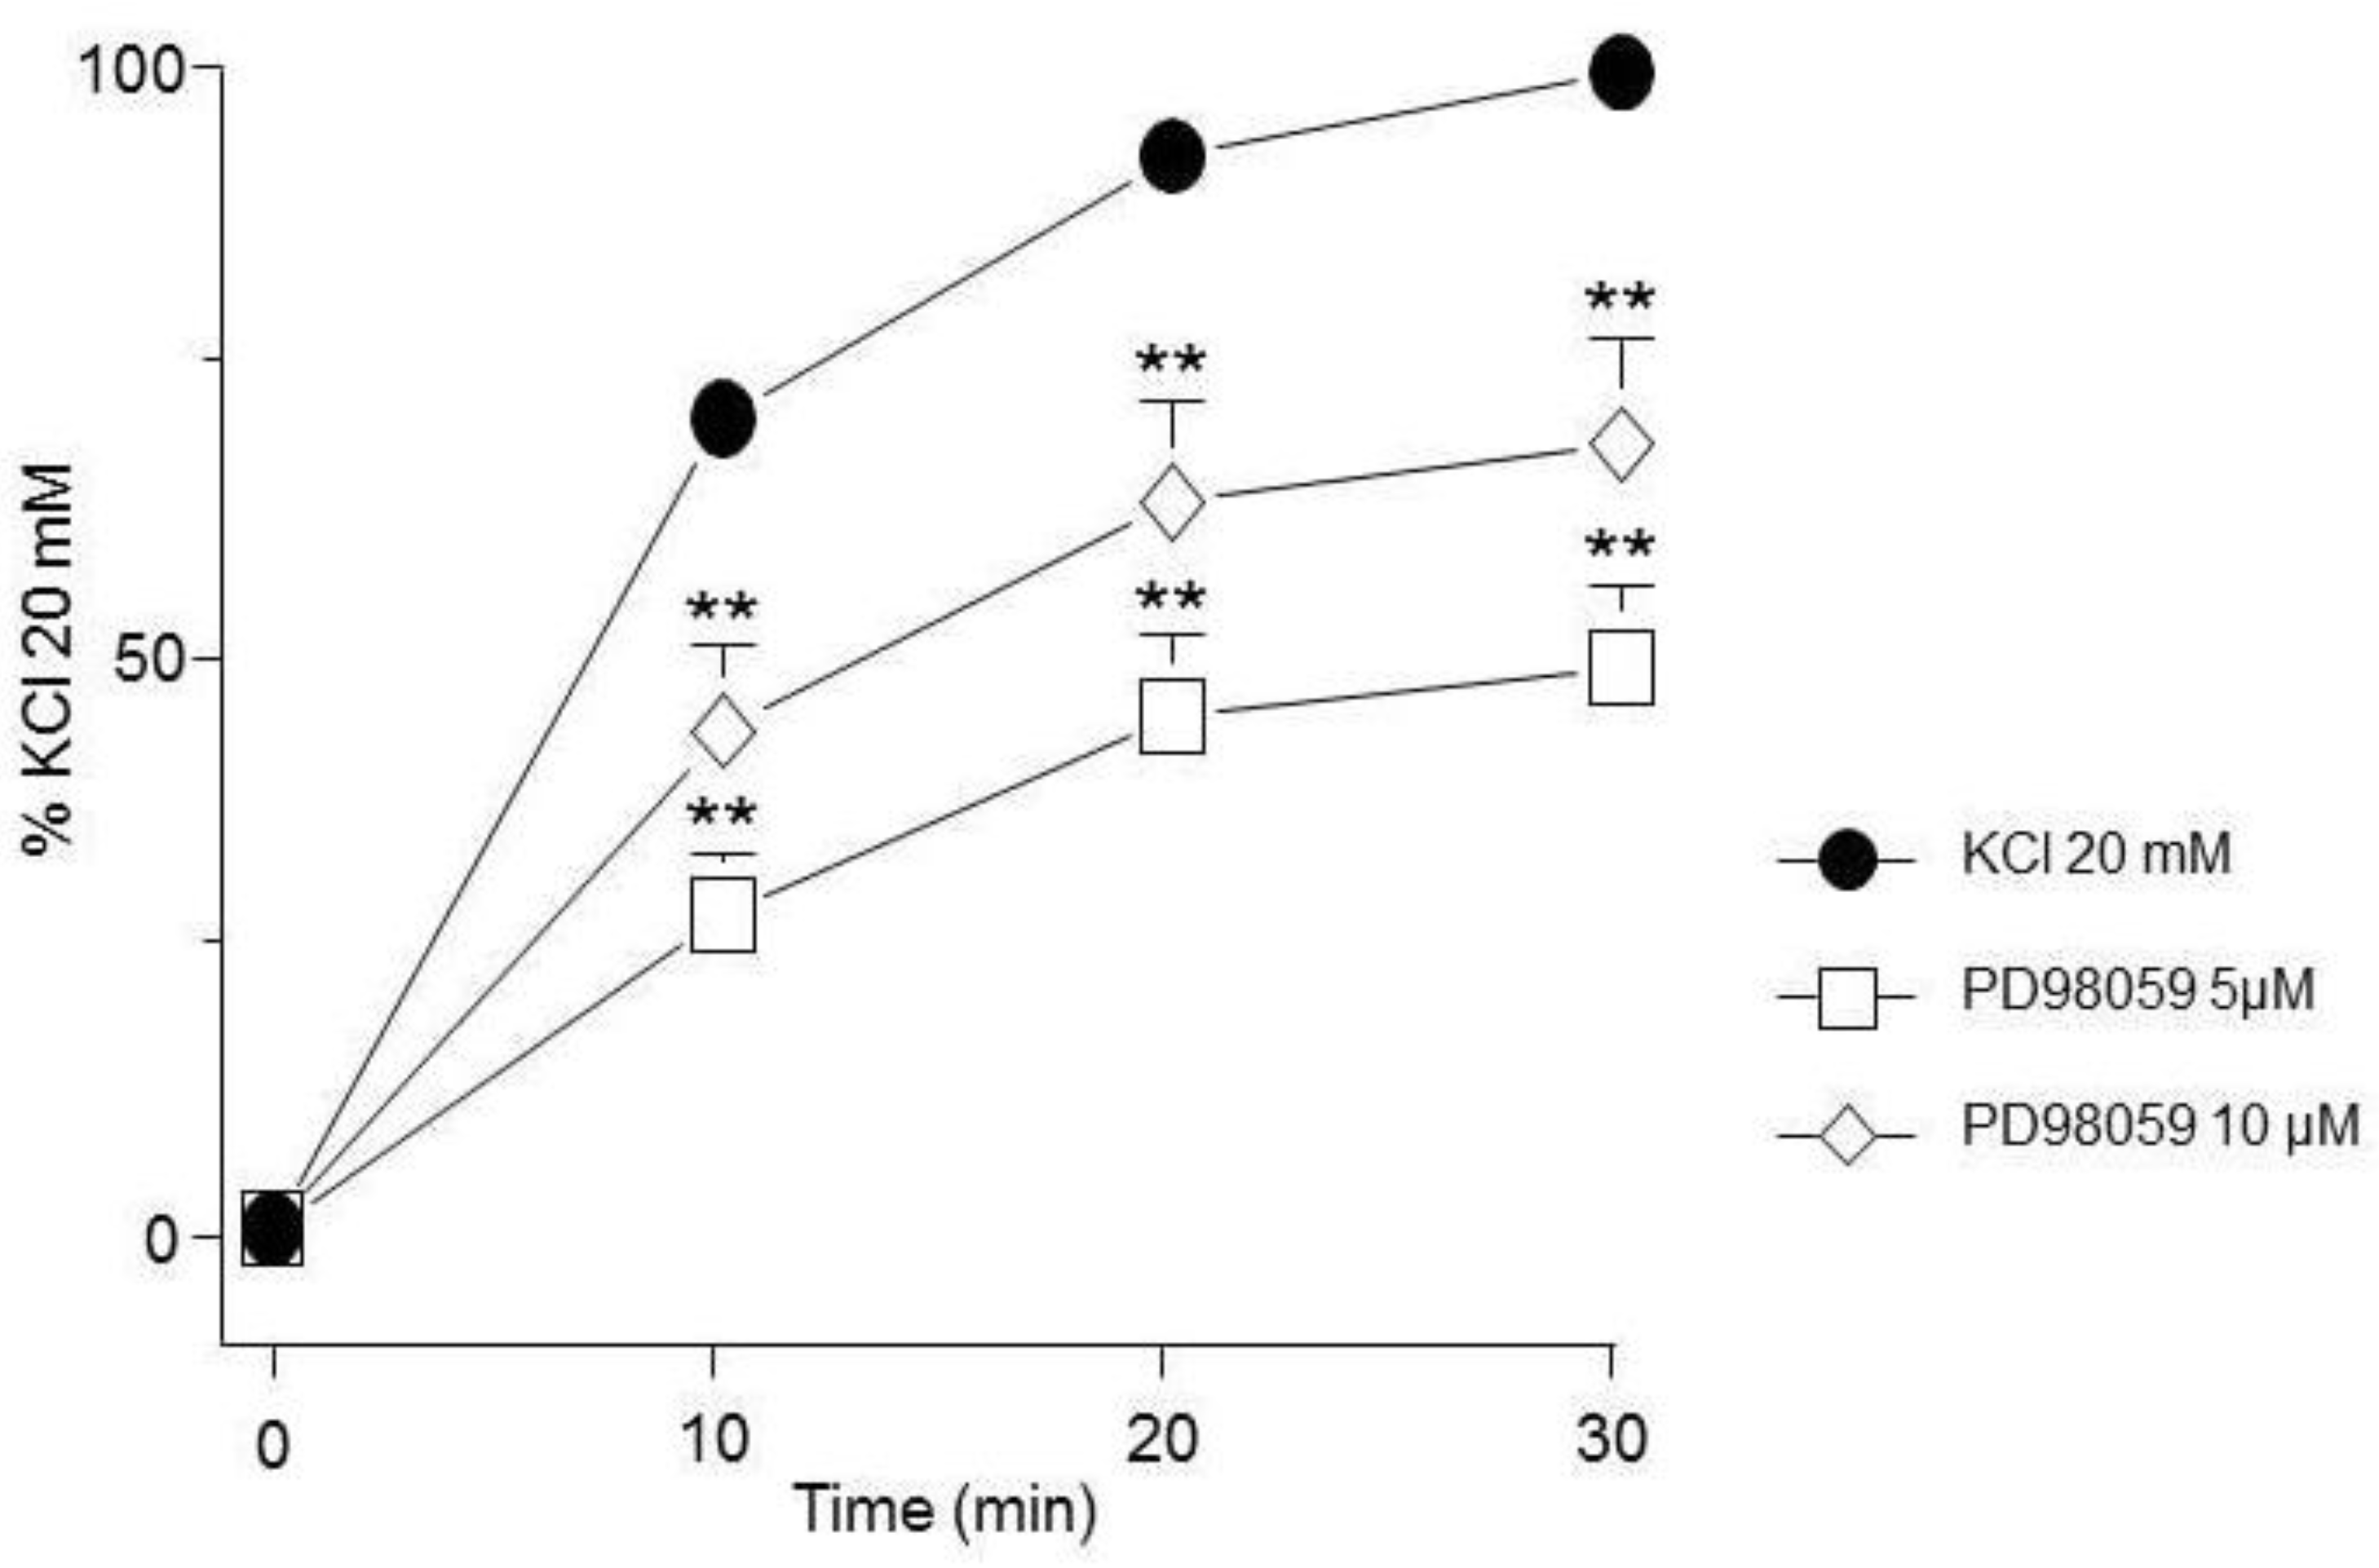
Figure 4.
MEK inhibition reduced the contraction induced by KCl. A) U0126 (5 µM, 10 µM, n=7 each) diminished the contraction induced by KCl 20 mM in guinea pig trachea. B) An inactive analogue of U0126 (U0124, 5 µM, 10 µM, n=7 each) had no effect on the contraction. Symbols represent mean ± standard error of the mean, **p<0.01.
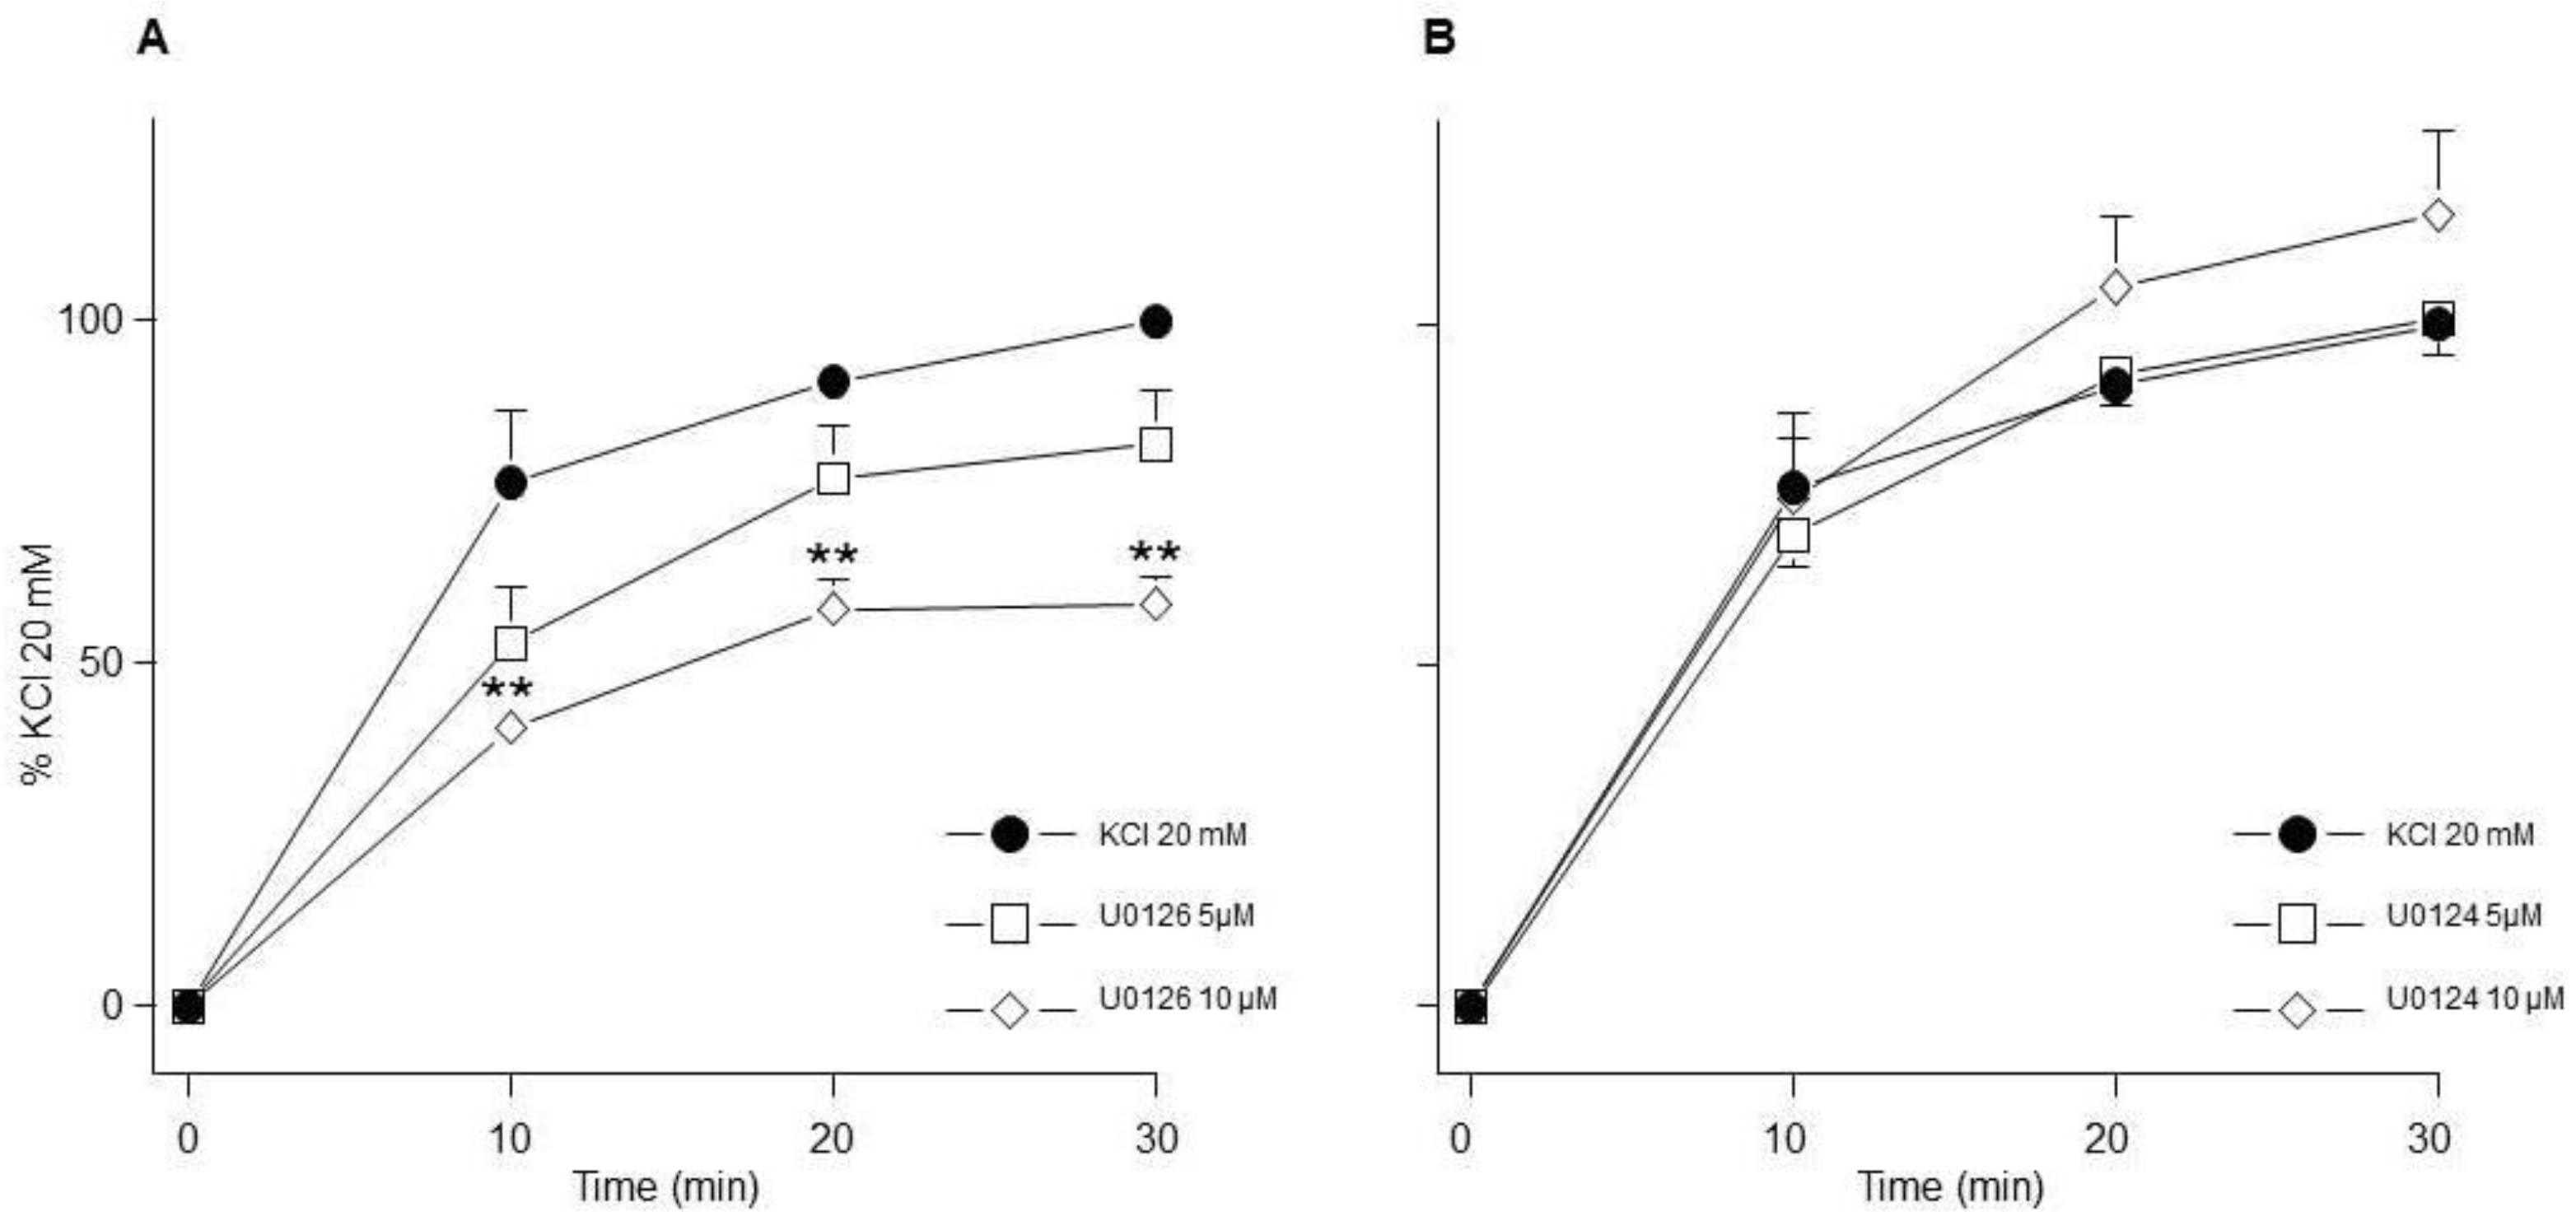
Figure 5.
ROCK inhibition reduces the contraction induced by KCl. Y-27632 (5 µM, 10 µM, n=7 each), significantly decreased the 20 mM KCl-induced contraction in guinea pig trachea. Symbols represent mean ± standard error of the mean, **p<0.01.
Figure 5.
ROCK inhibition reduces the contraction induced by KCl. Y-27632 (5 µM, 10 µM, n=7 each), significantly decreased the 20 mM KCl-induced contraction in guinea pig trachea. Symbols represent mean ± standard error of the mean, **p<0.01.
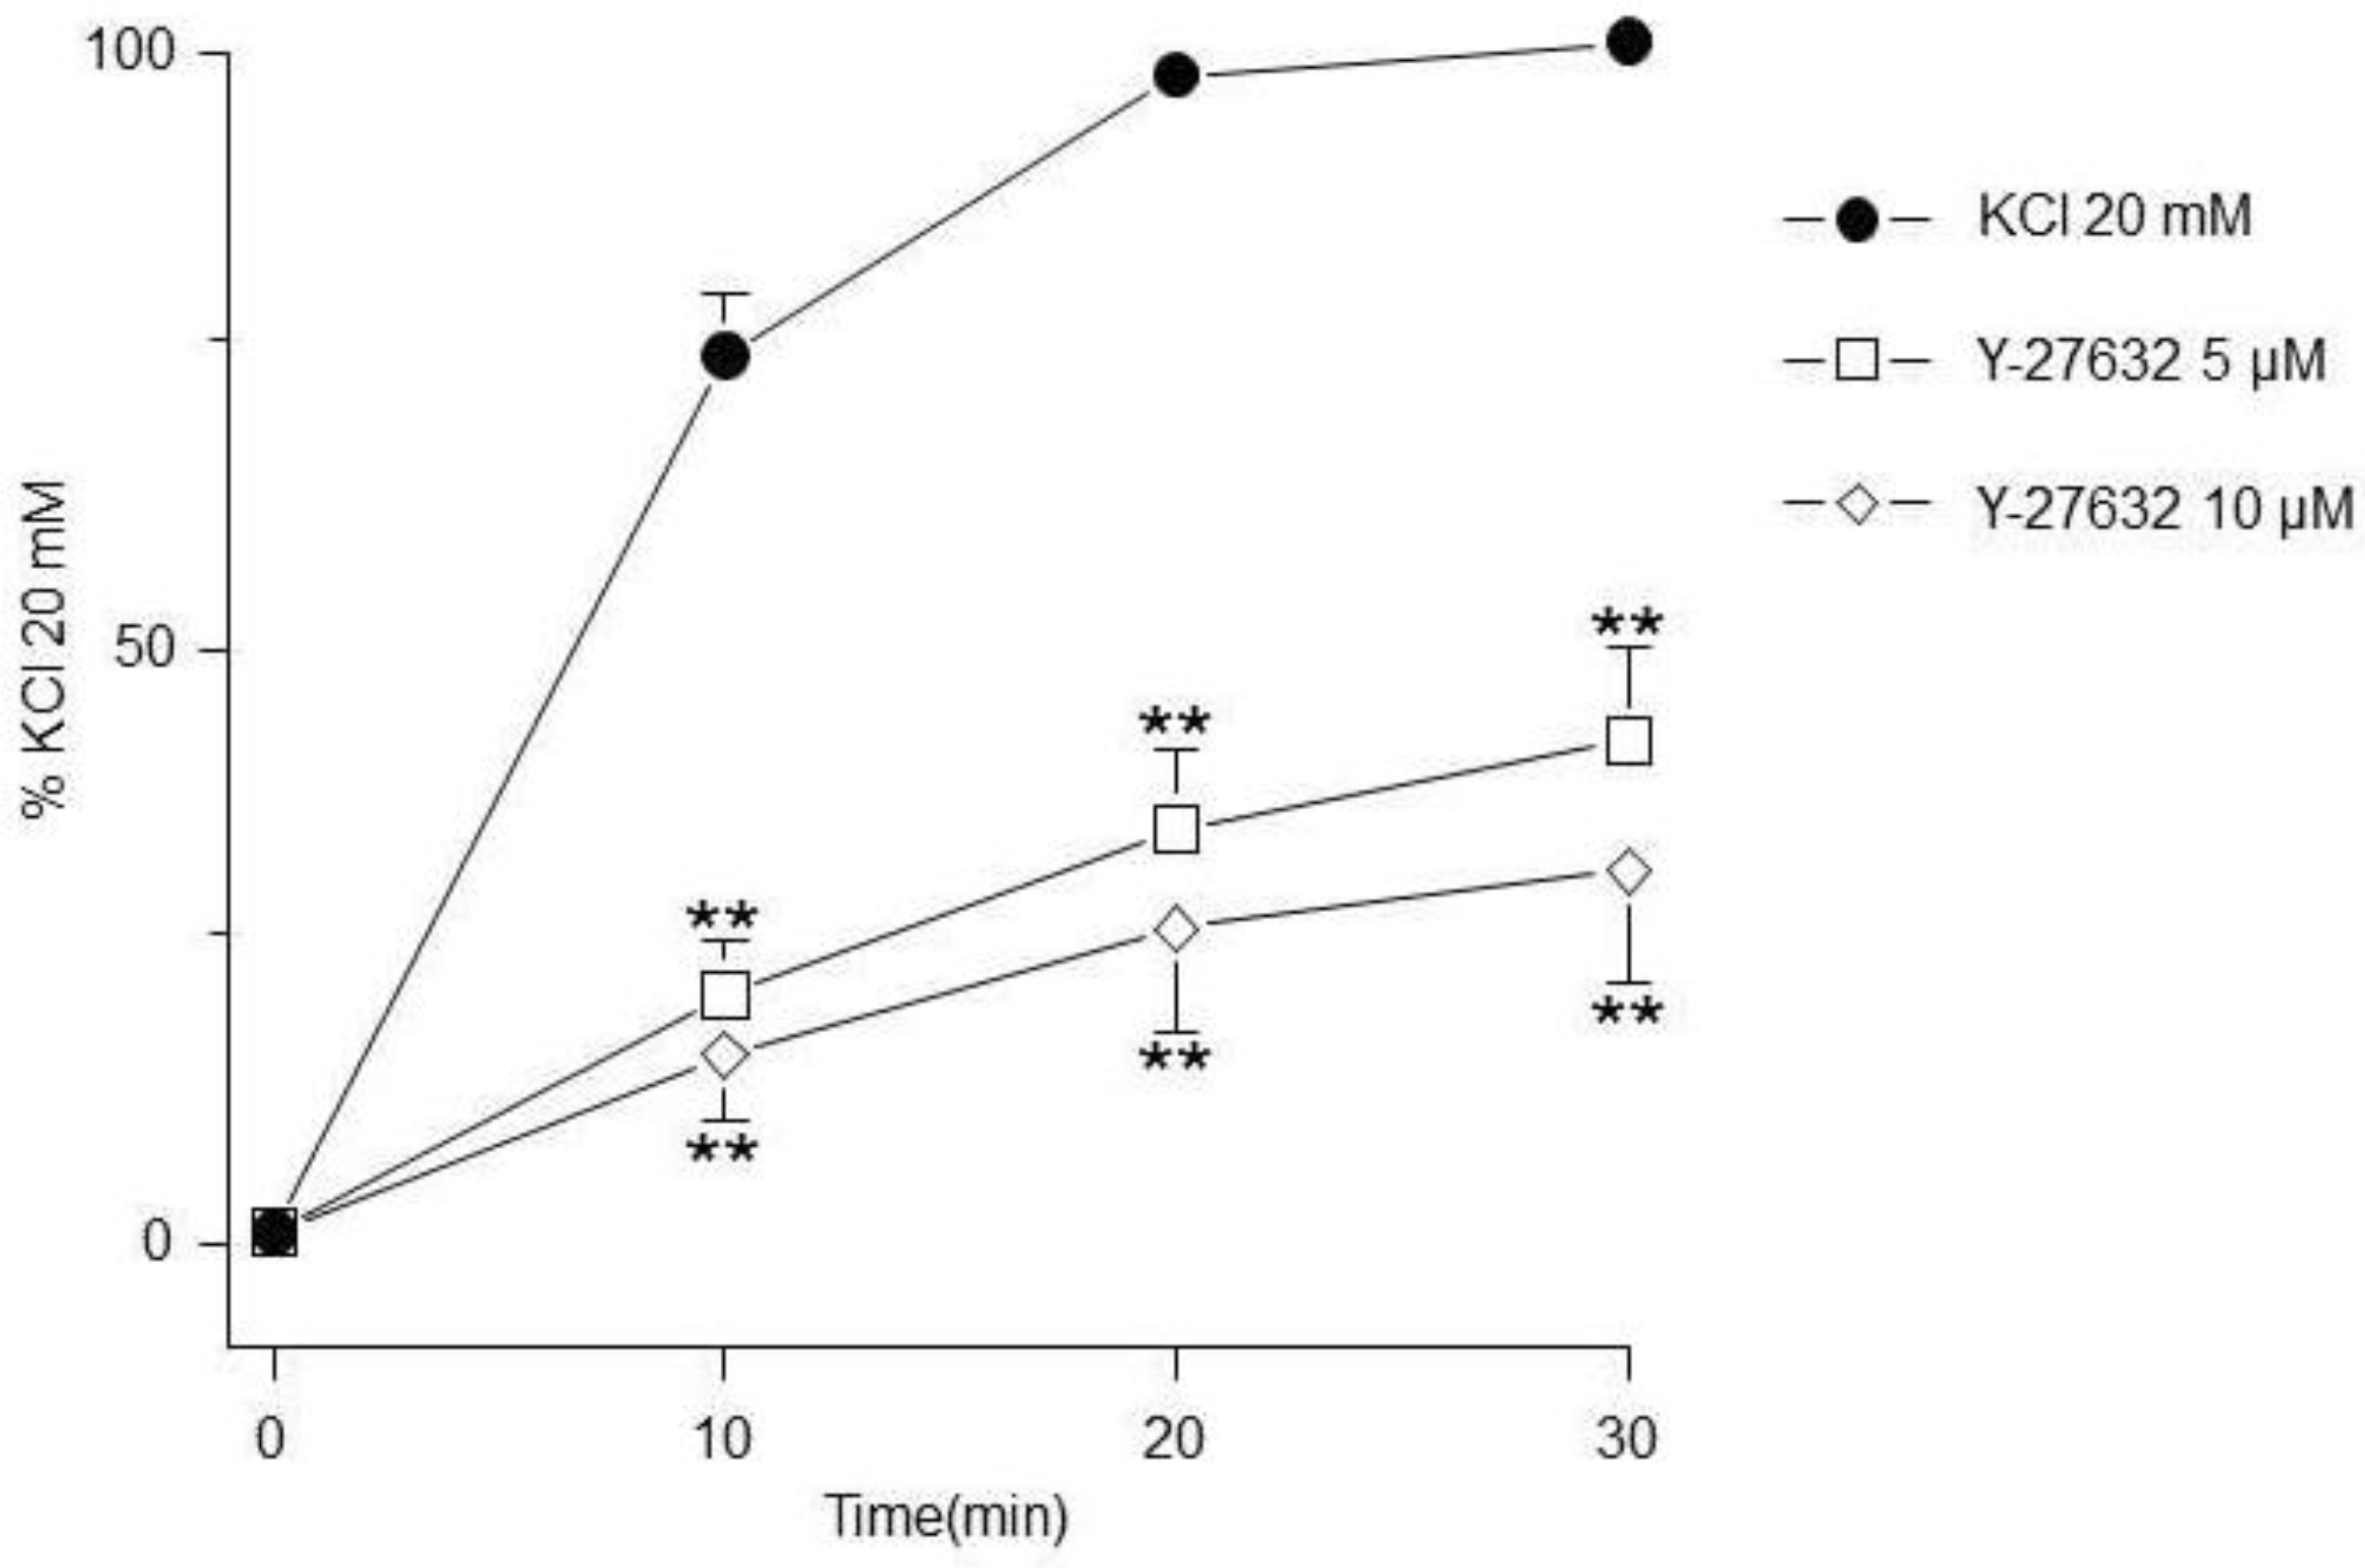
Figure 6.
MLCK inhibition did not modify the KCl-induced contraction. ML-7 (5 µM, 10 µM, n=7 each) had no effect on the contraction induced by KCl 20 mM in guinea pig trachea.
Figure 6.
MLCK inhibition did not modify the KCl-induced contraction. ML-7 (5 µM, 10 µM, n=7 each) had no effect on the contraction induced by KCl 20 mM in guinea pig trachea.
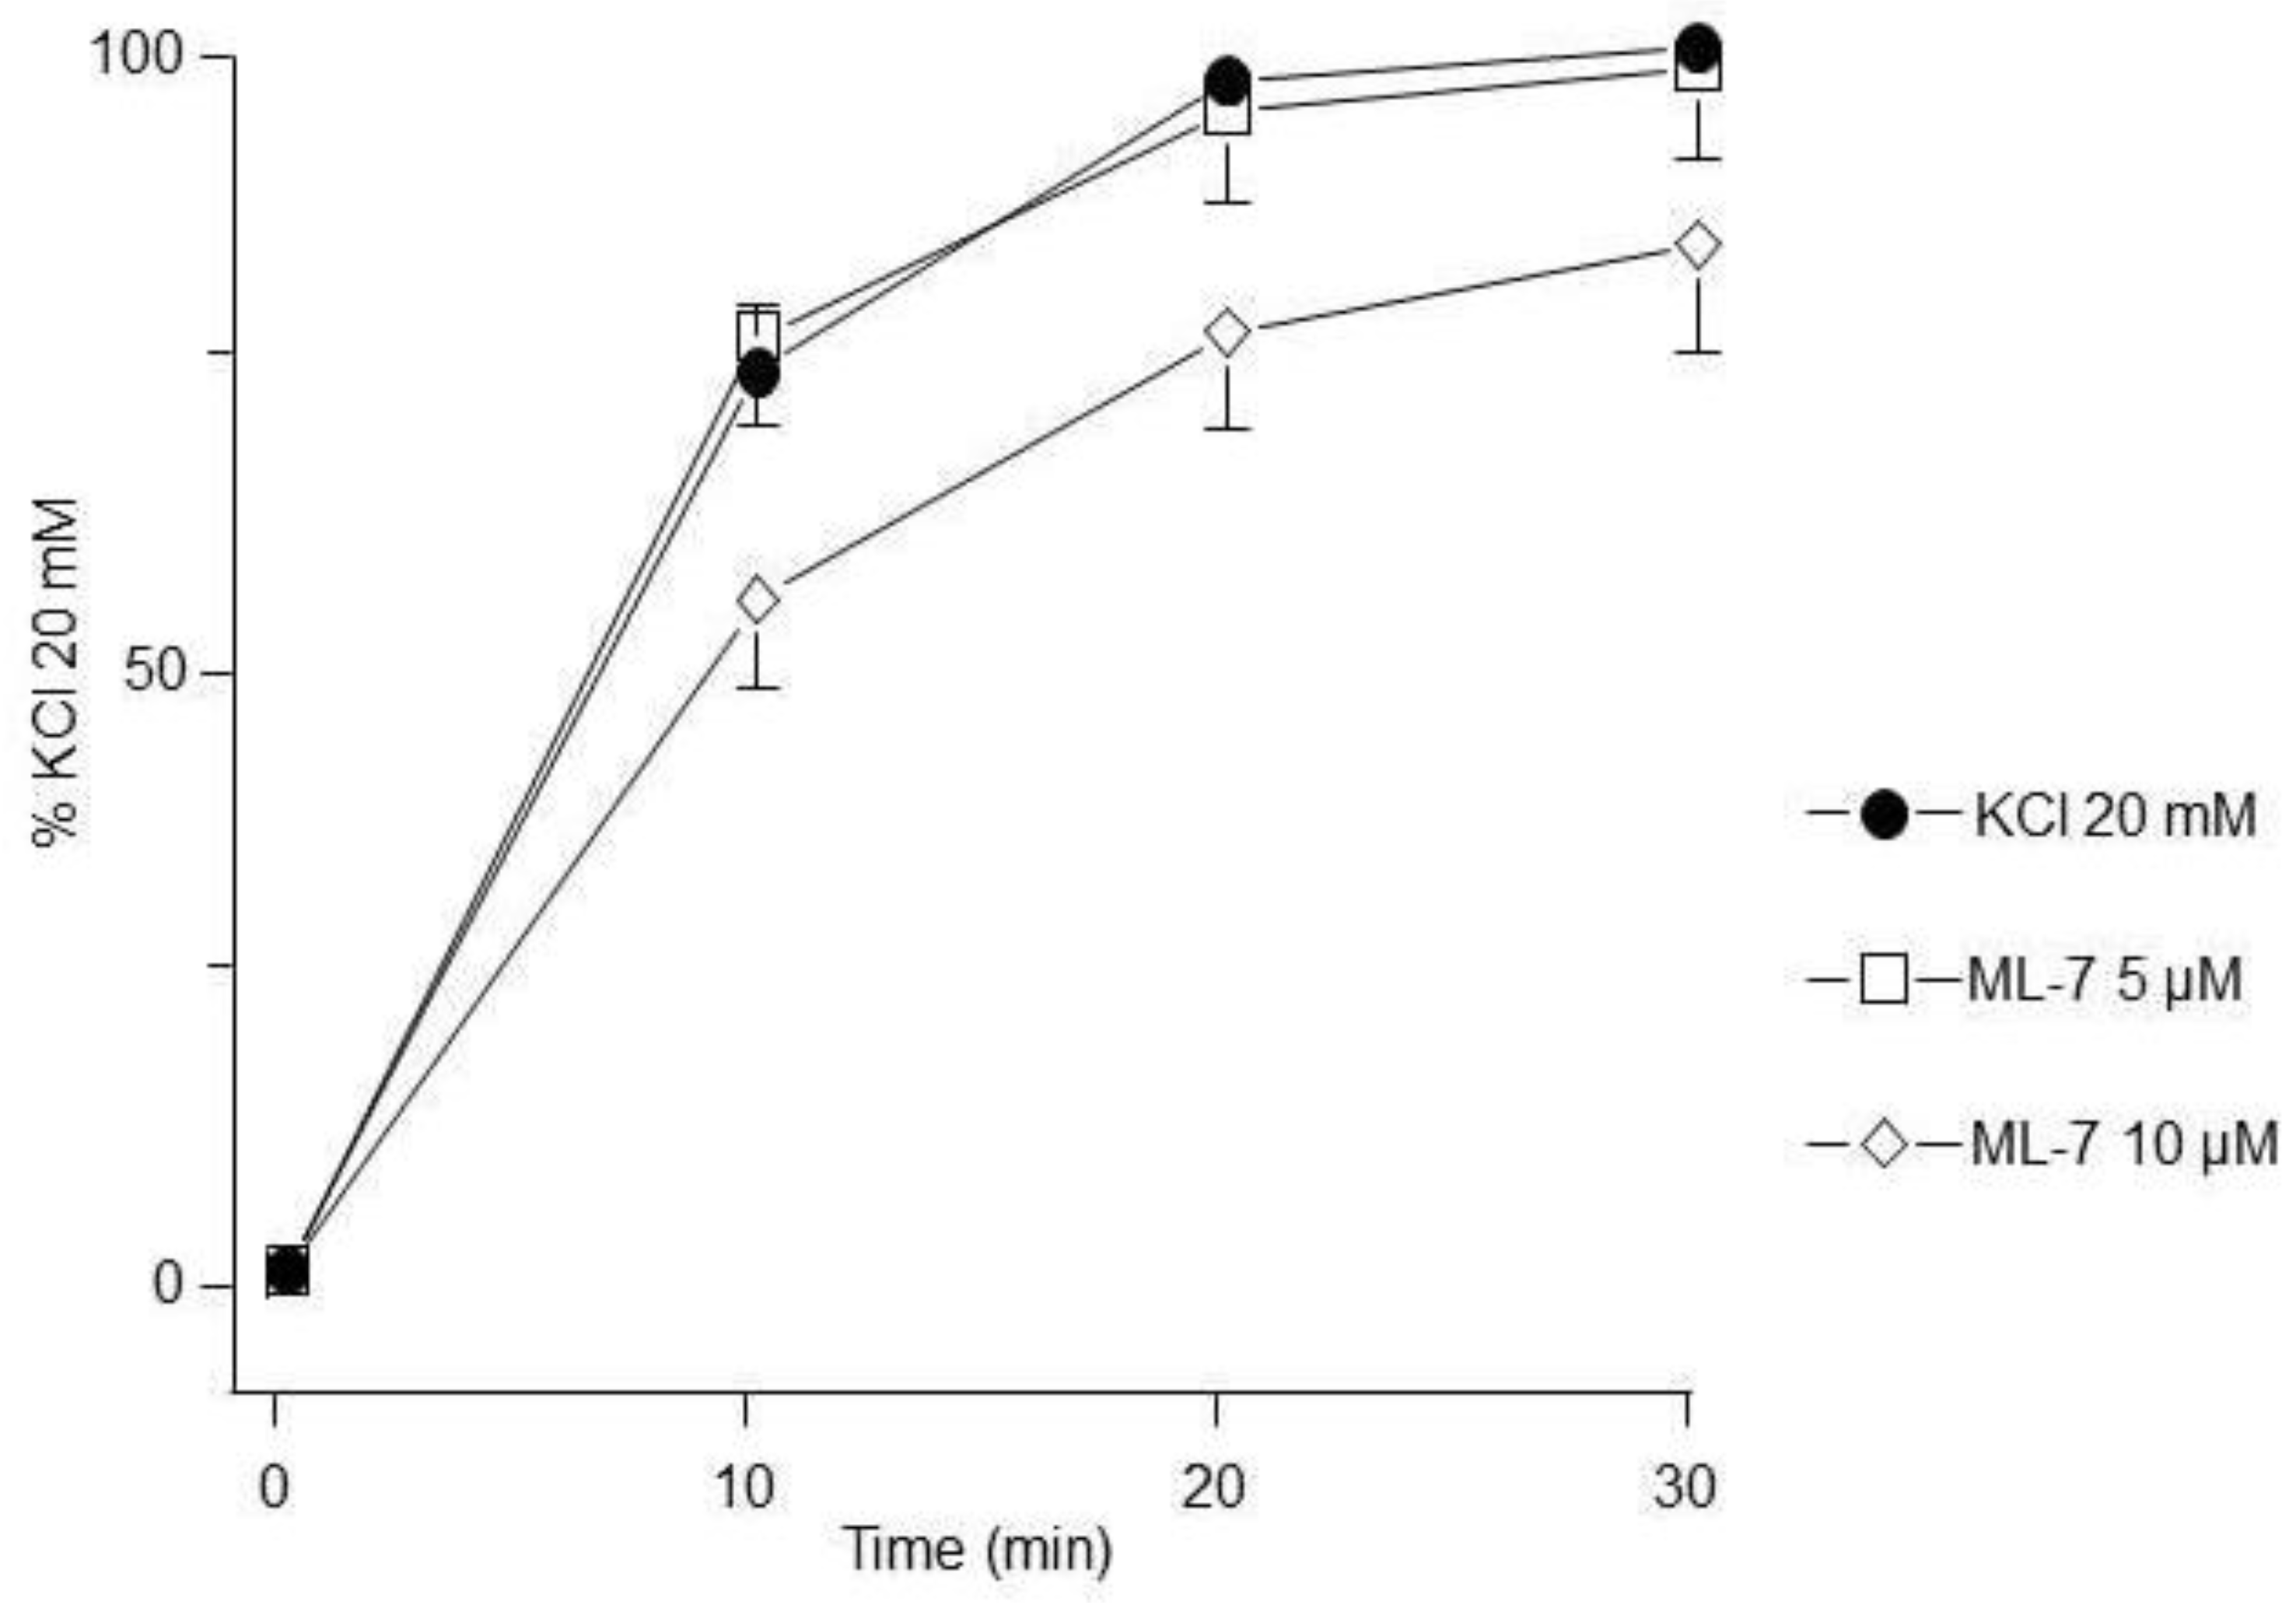
Figure 7.
Densitometric analysis to define RTKs participation in the KCl-induced phosphorylation of ERK1/2 and MYPT1 in guinea pig airway smooth muscle. A) Upper panel shows a representative Western Blot (WB) for KCl-induced phosphorylation of ERK1/2 and its modification by genistein (GEN, 10 μM) and ST638 (ST, 10 μM). Below, bar graph showing mean ± standard error of the mean of 3 WB. Differences found were statistically significant *p <0.05. B) Upper panel shows a representative Western Blot (WB) for KCl-induced phosphorylation of MYPT1 and its modification by genistein (GEN, 10 μM) and ST638 (ST, 10 μM). Below, bar graph showing mean ± standard error of the mean of 3 WB. Differences found were statistically significant **p <0.01.
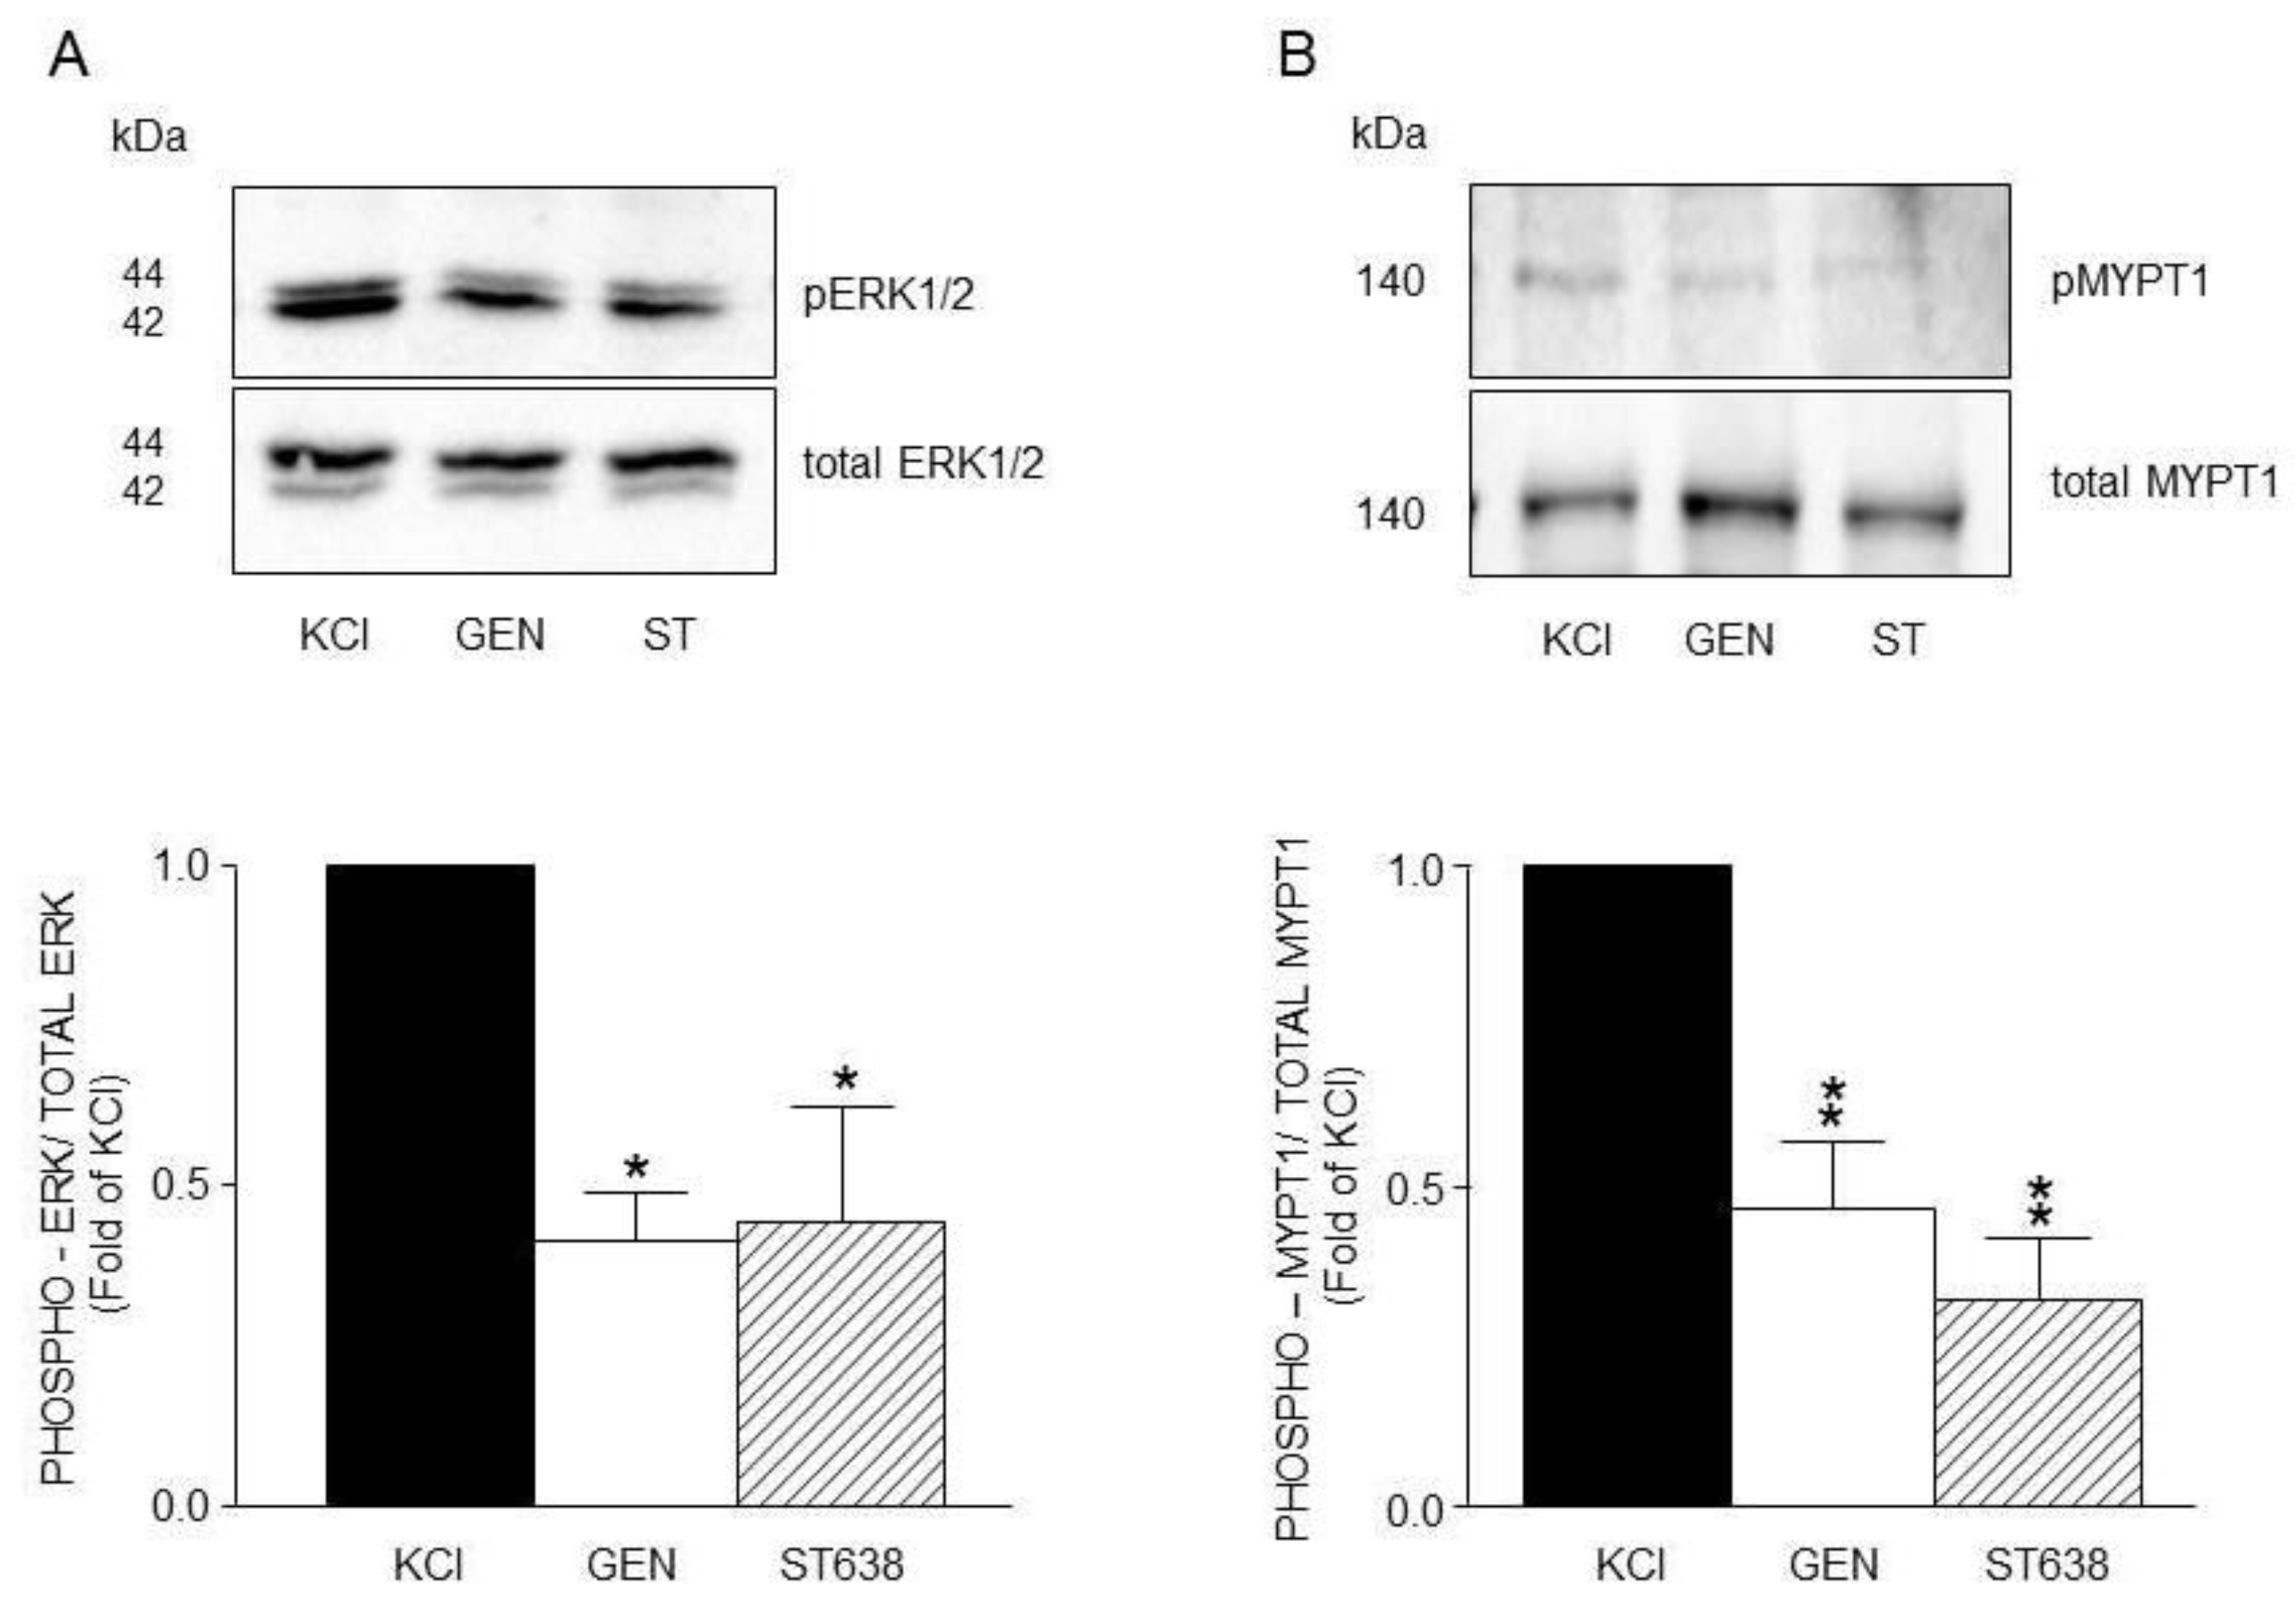
Figure 8.
Densitometric analysis to define ERK1/2 and MYPT1 phosphorylation induced by KCl in guinea pig airway smooth muscle. A) Upper panel shows a representative Western Blot (WB) for KCl-induced phosphorylation of ERK1/2 and its modification by FR180204 (FR, 5 μM and 10 μM). Below, bar graph showing mean ± standard error of the mean of 3 WB. Differences found were statistically significant **p <0.01. B) Upper panel shows a representative Western Blot (WB) for KCl-induced phosphorylation of MYPT1 and its modification by FR180204 (FR, 5 μM and 10 μM). Below, bar graph showing mean ± standard error of the mean of 3 WB.
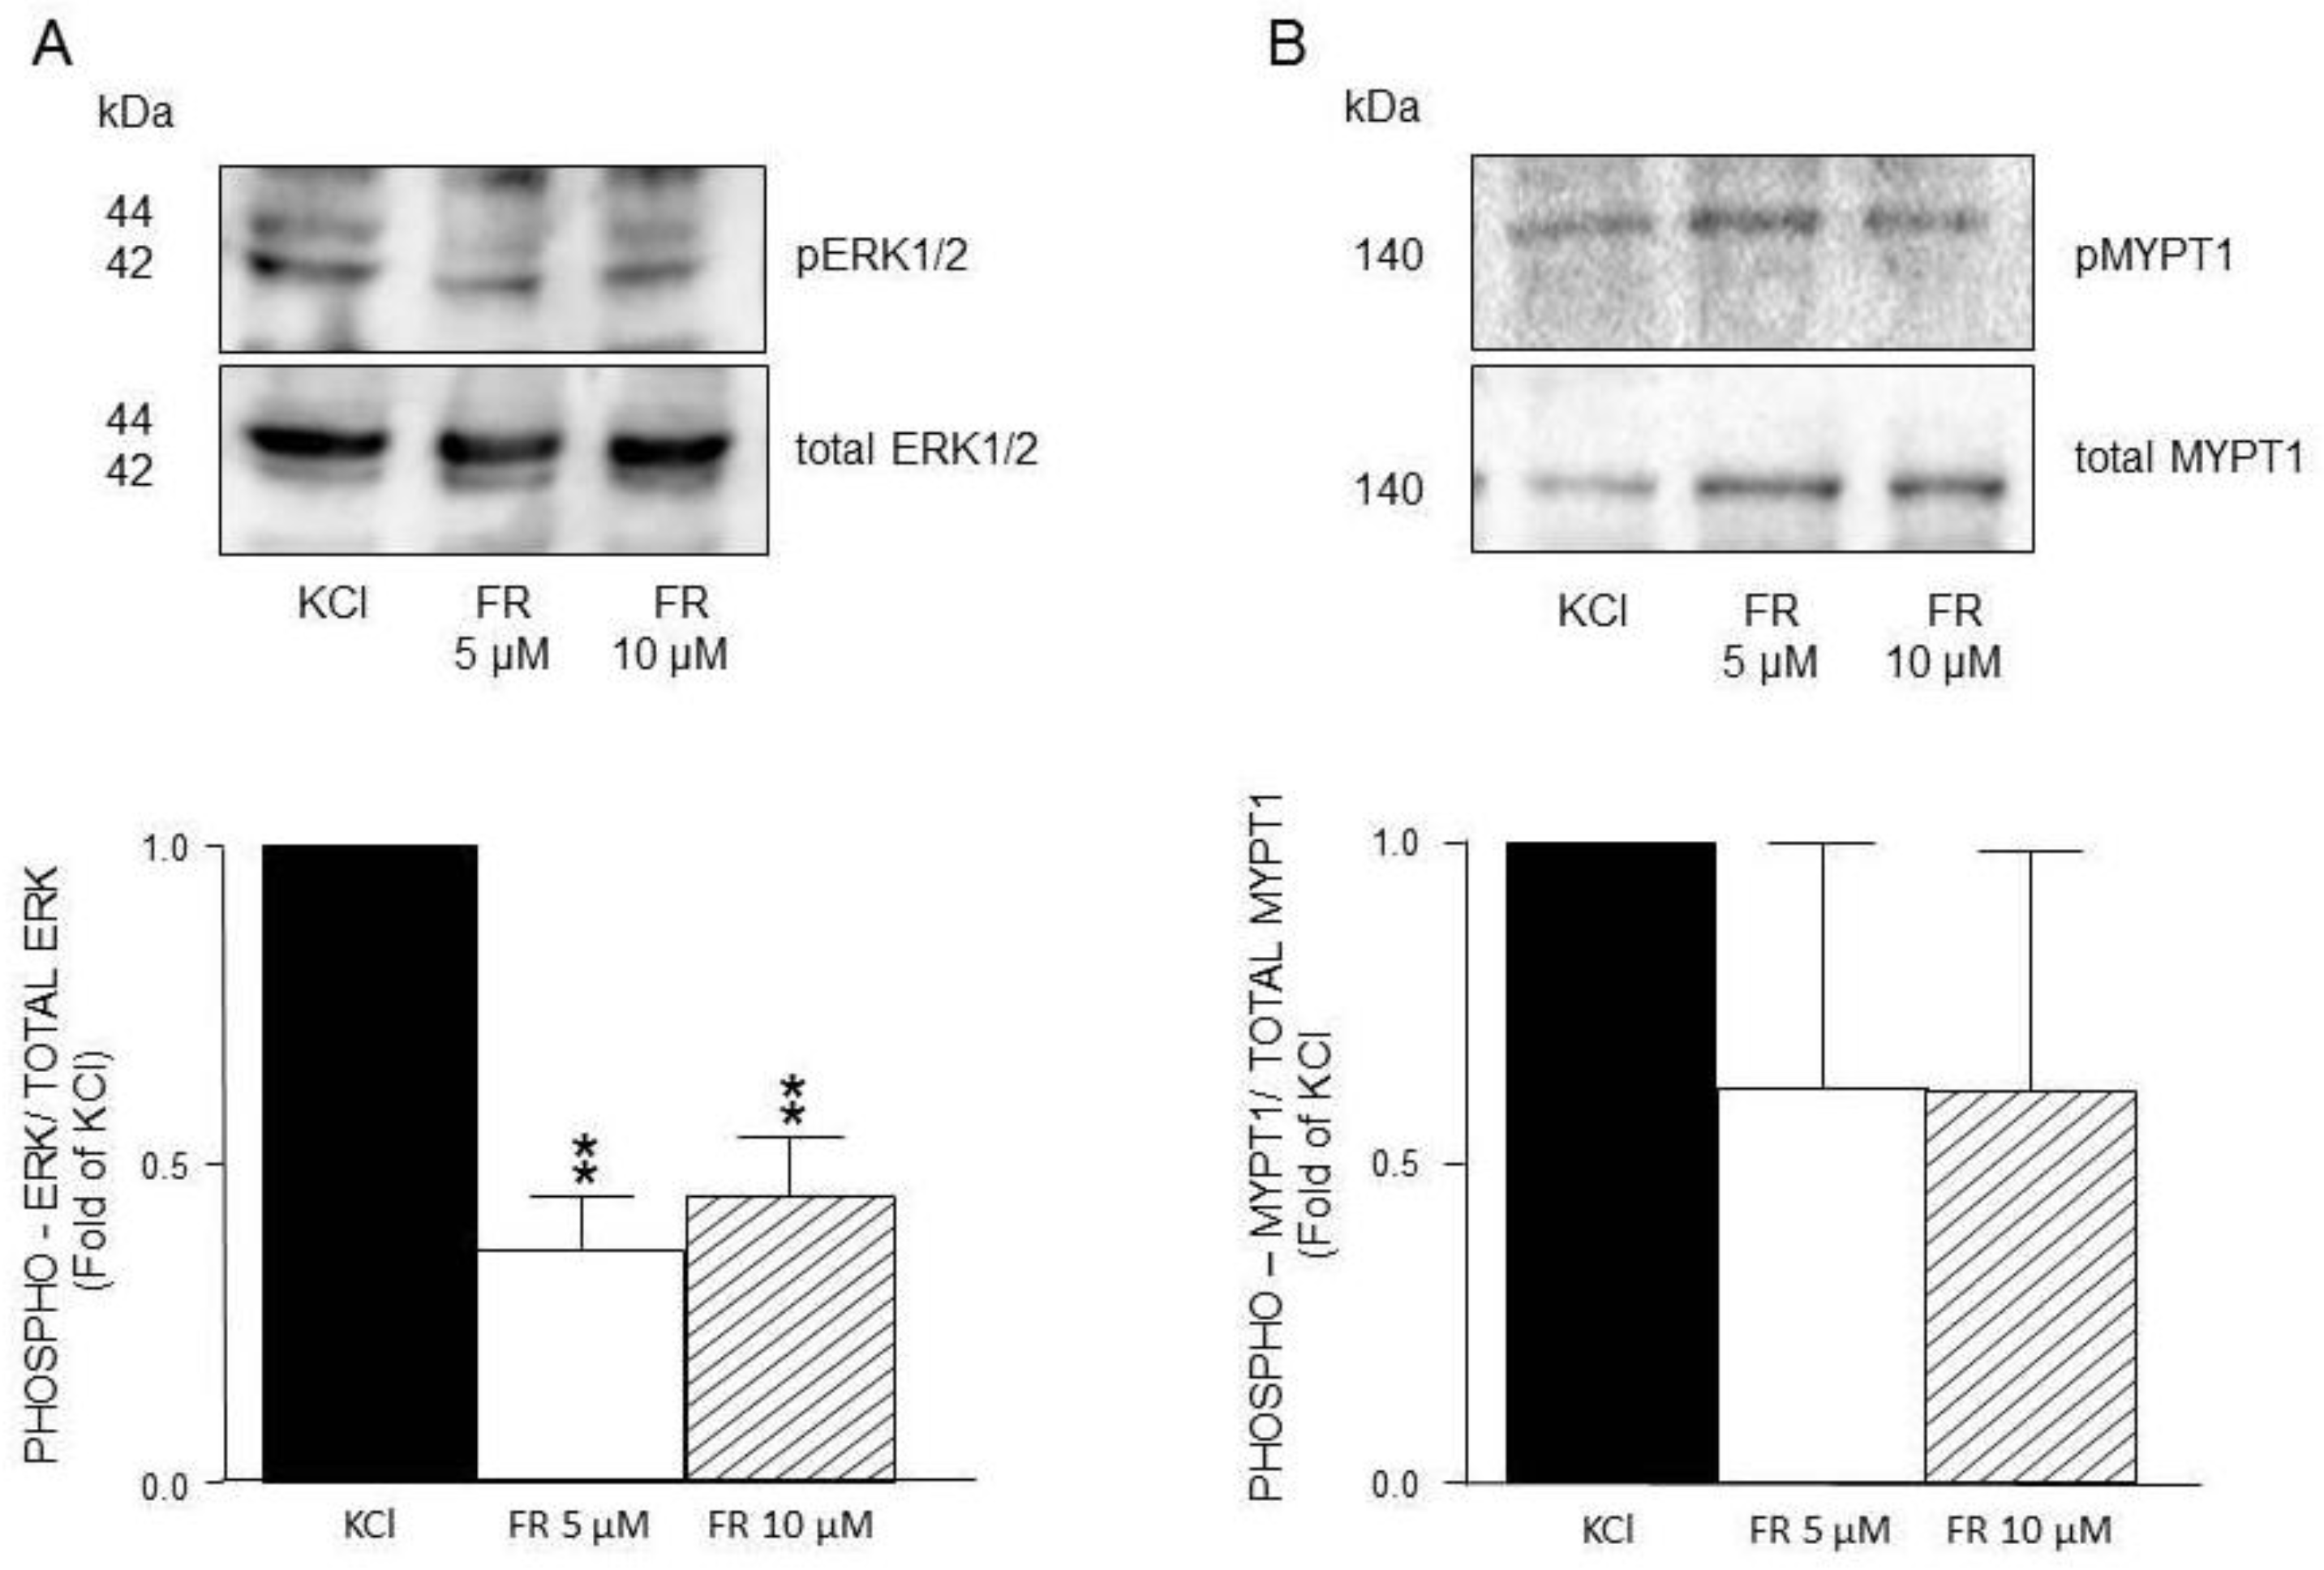
Figure 9.
Densitometric analysis to define MEK participation in the ERK1/2 and MYPT1 phosphorylation induced by KCl in guinea pig airway smooth muscle. A) Upper panel shows a representative Western Blot (WB) for KCl-induced phosphorylation of ERK1/2 and its modification by PD98059 (PD, 5 μM and 10 μM). Below, bar graph showing mean ± standard error of the mean of 3 WB. Differences found were statistically significant **p <0.01. B) Upper panel shows a representative Western Blot (WB) for KCl-induced phosphorylation of MYPT1 and its modification by PD98059 (PD, 5 μM and 10 μM). Below, bar graph showing mean ± standard error of the mean of 3 WB. Differences found were statistically significant **p <0.01.
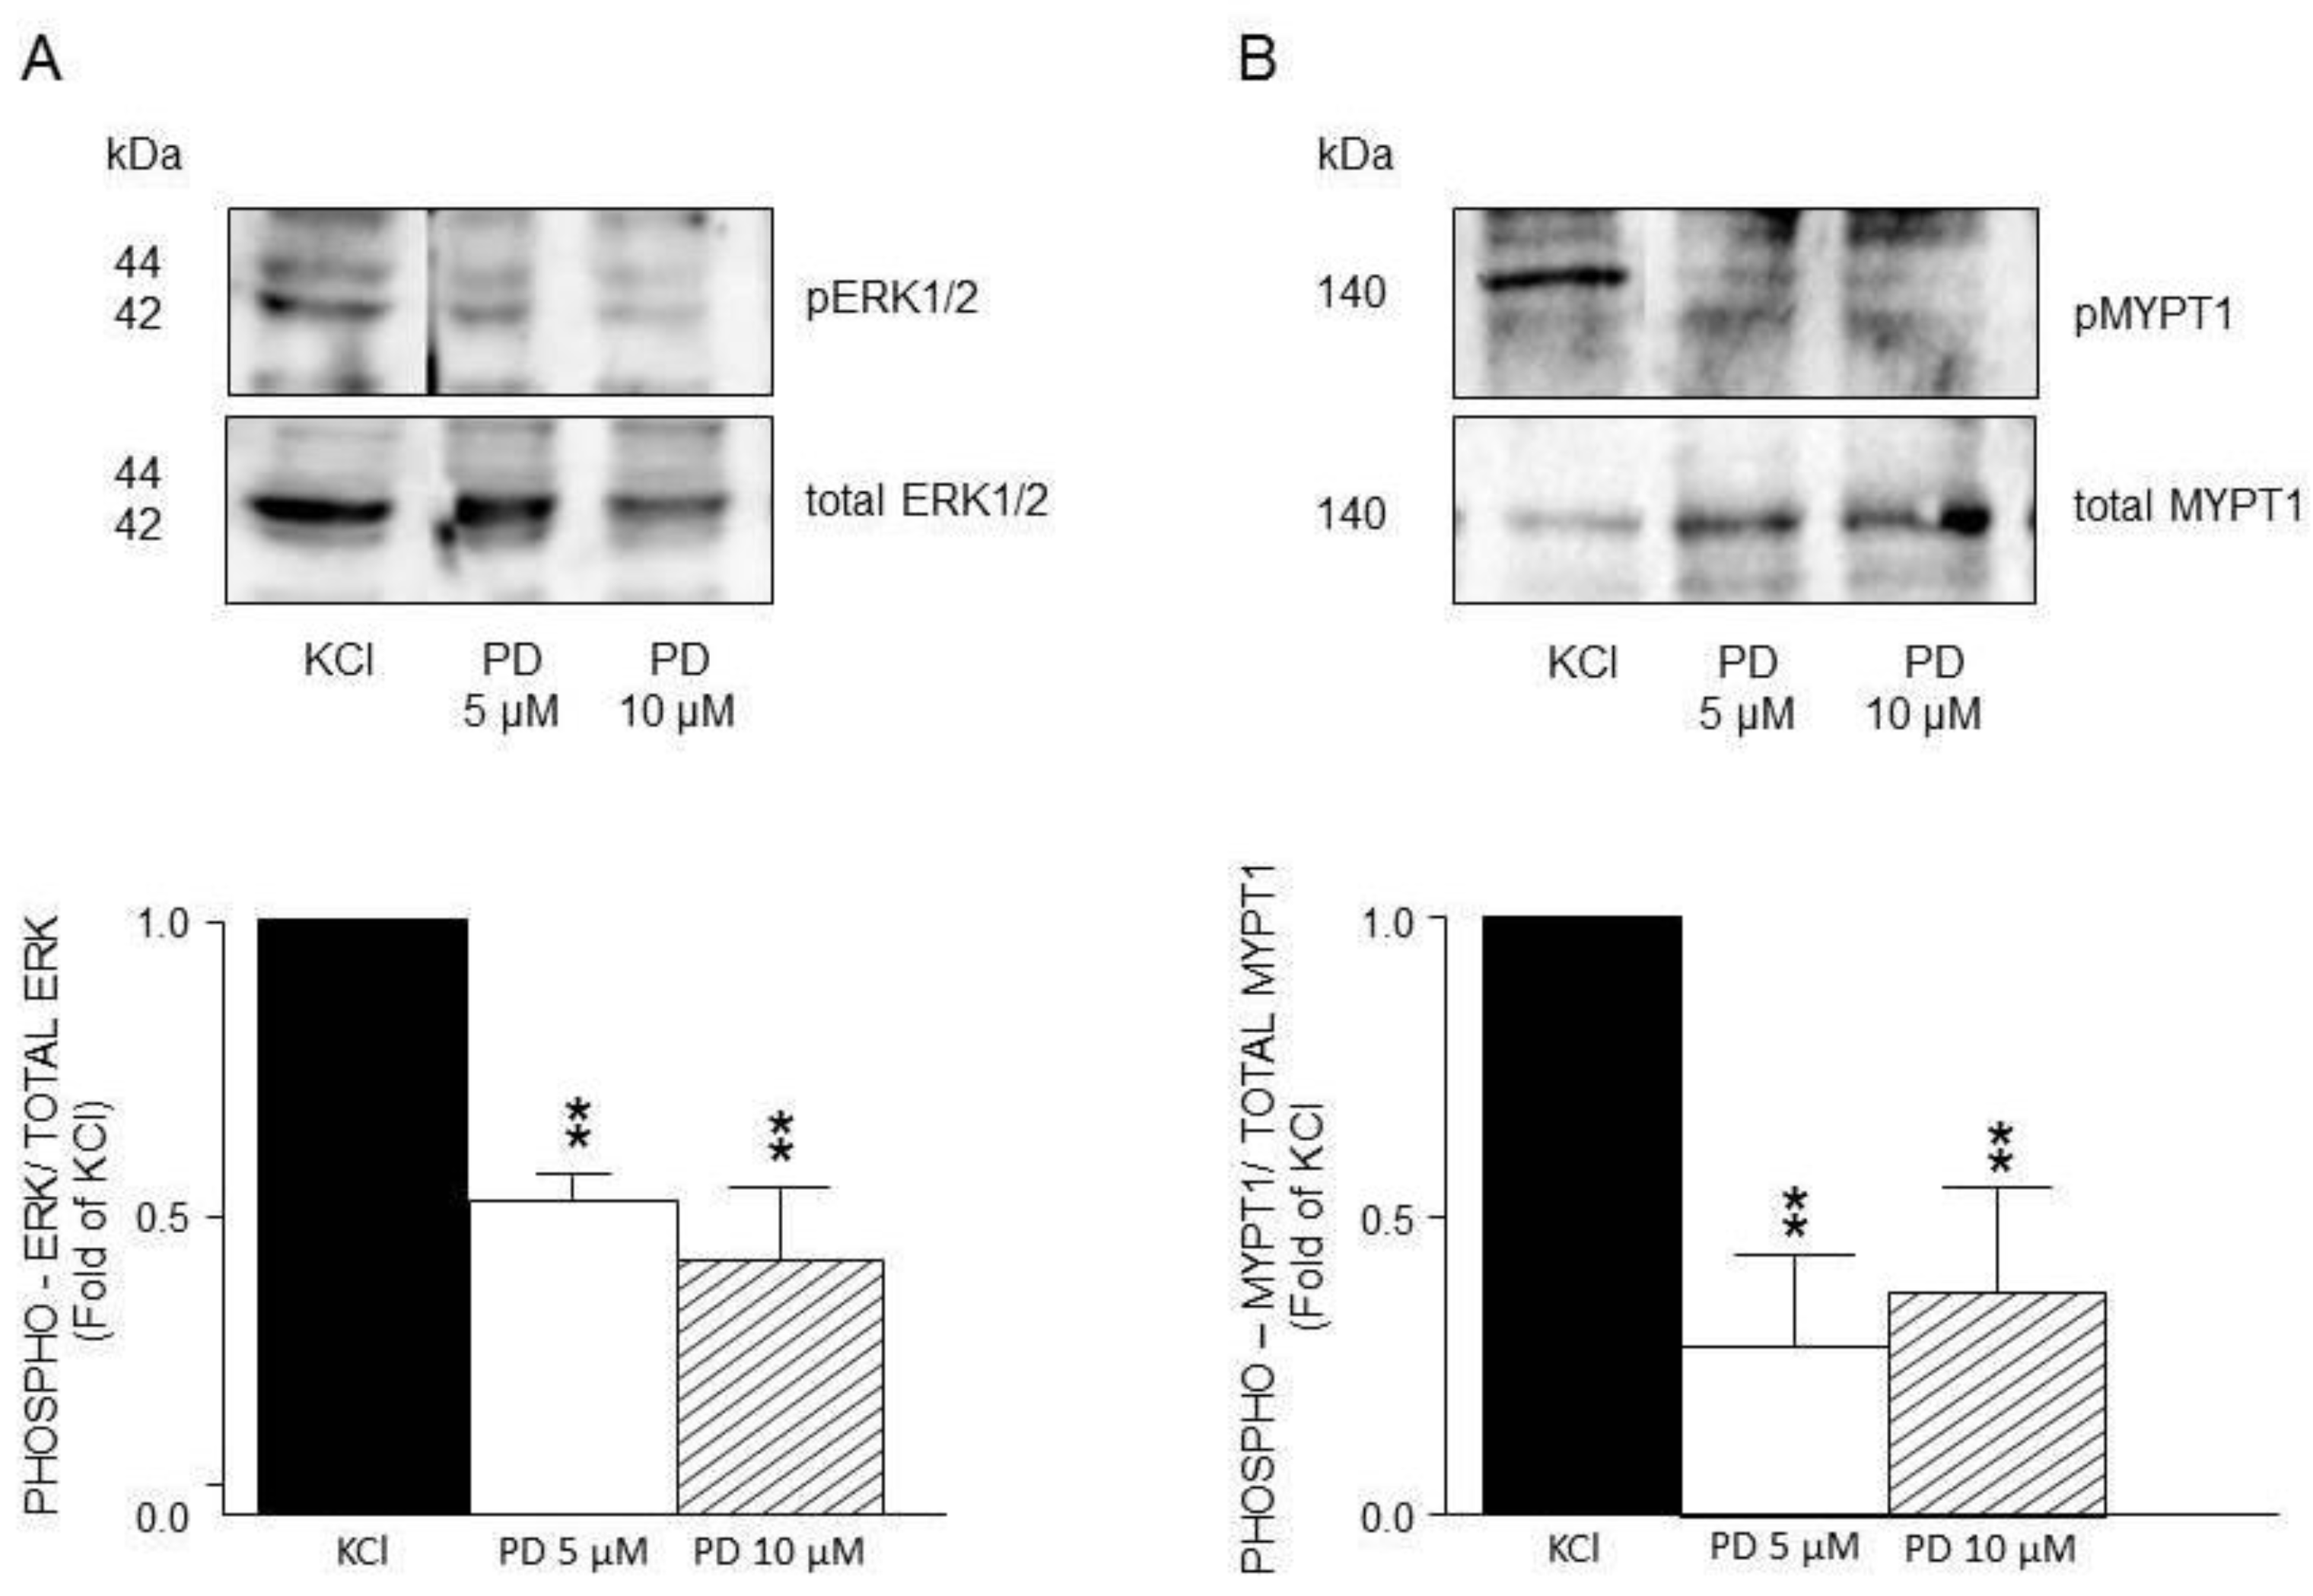
Figure 10.
Densitometric analysis to define MEK participation in the ERK1/2 and MYPT1 phosphorylation induced by KCl in guinea pig airway smooth muscle. A) Upper panel shows a representative Western Blot (WB) for KCl-induced phosphorylation of ERK1/2 and its modification by U0126 (5 μM and 10 μM). Below, bar graph showing mean ± standard error of the mean of 3 WB. Differences found were statistically significant **p <0.01. B) Upper panel shows a representative Western Blot (WB) for KCl-induced phosphorylation of MYPT1 and its modification by U0126 (5 μM and 10 μM). Below, bar graph showing mean ± standard error of the mean of 3 WB. NOTE that A and B have different scales in the Y axis.
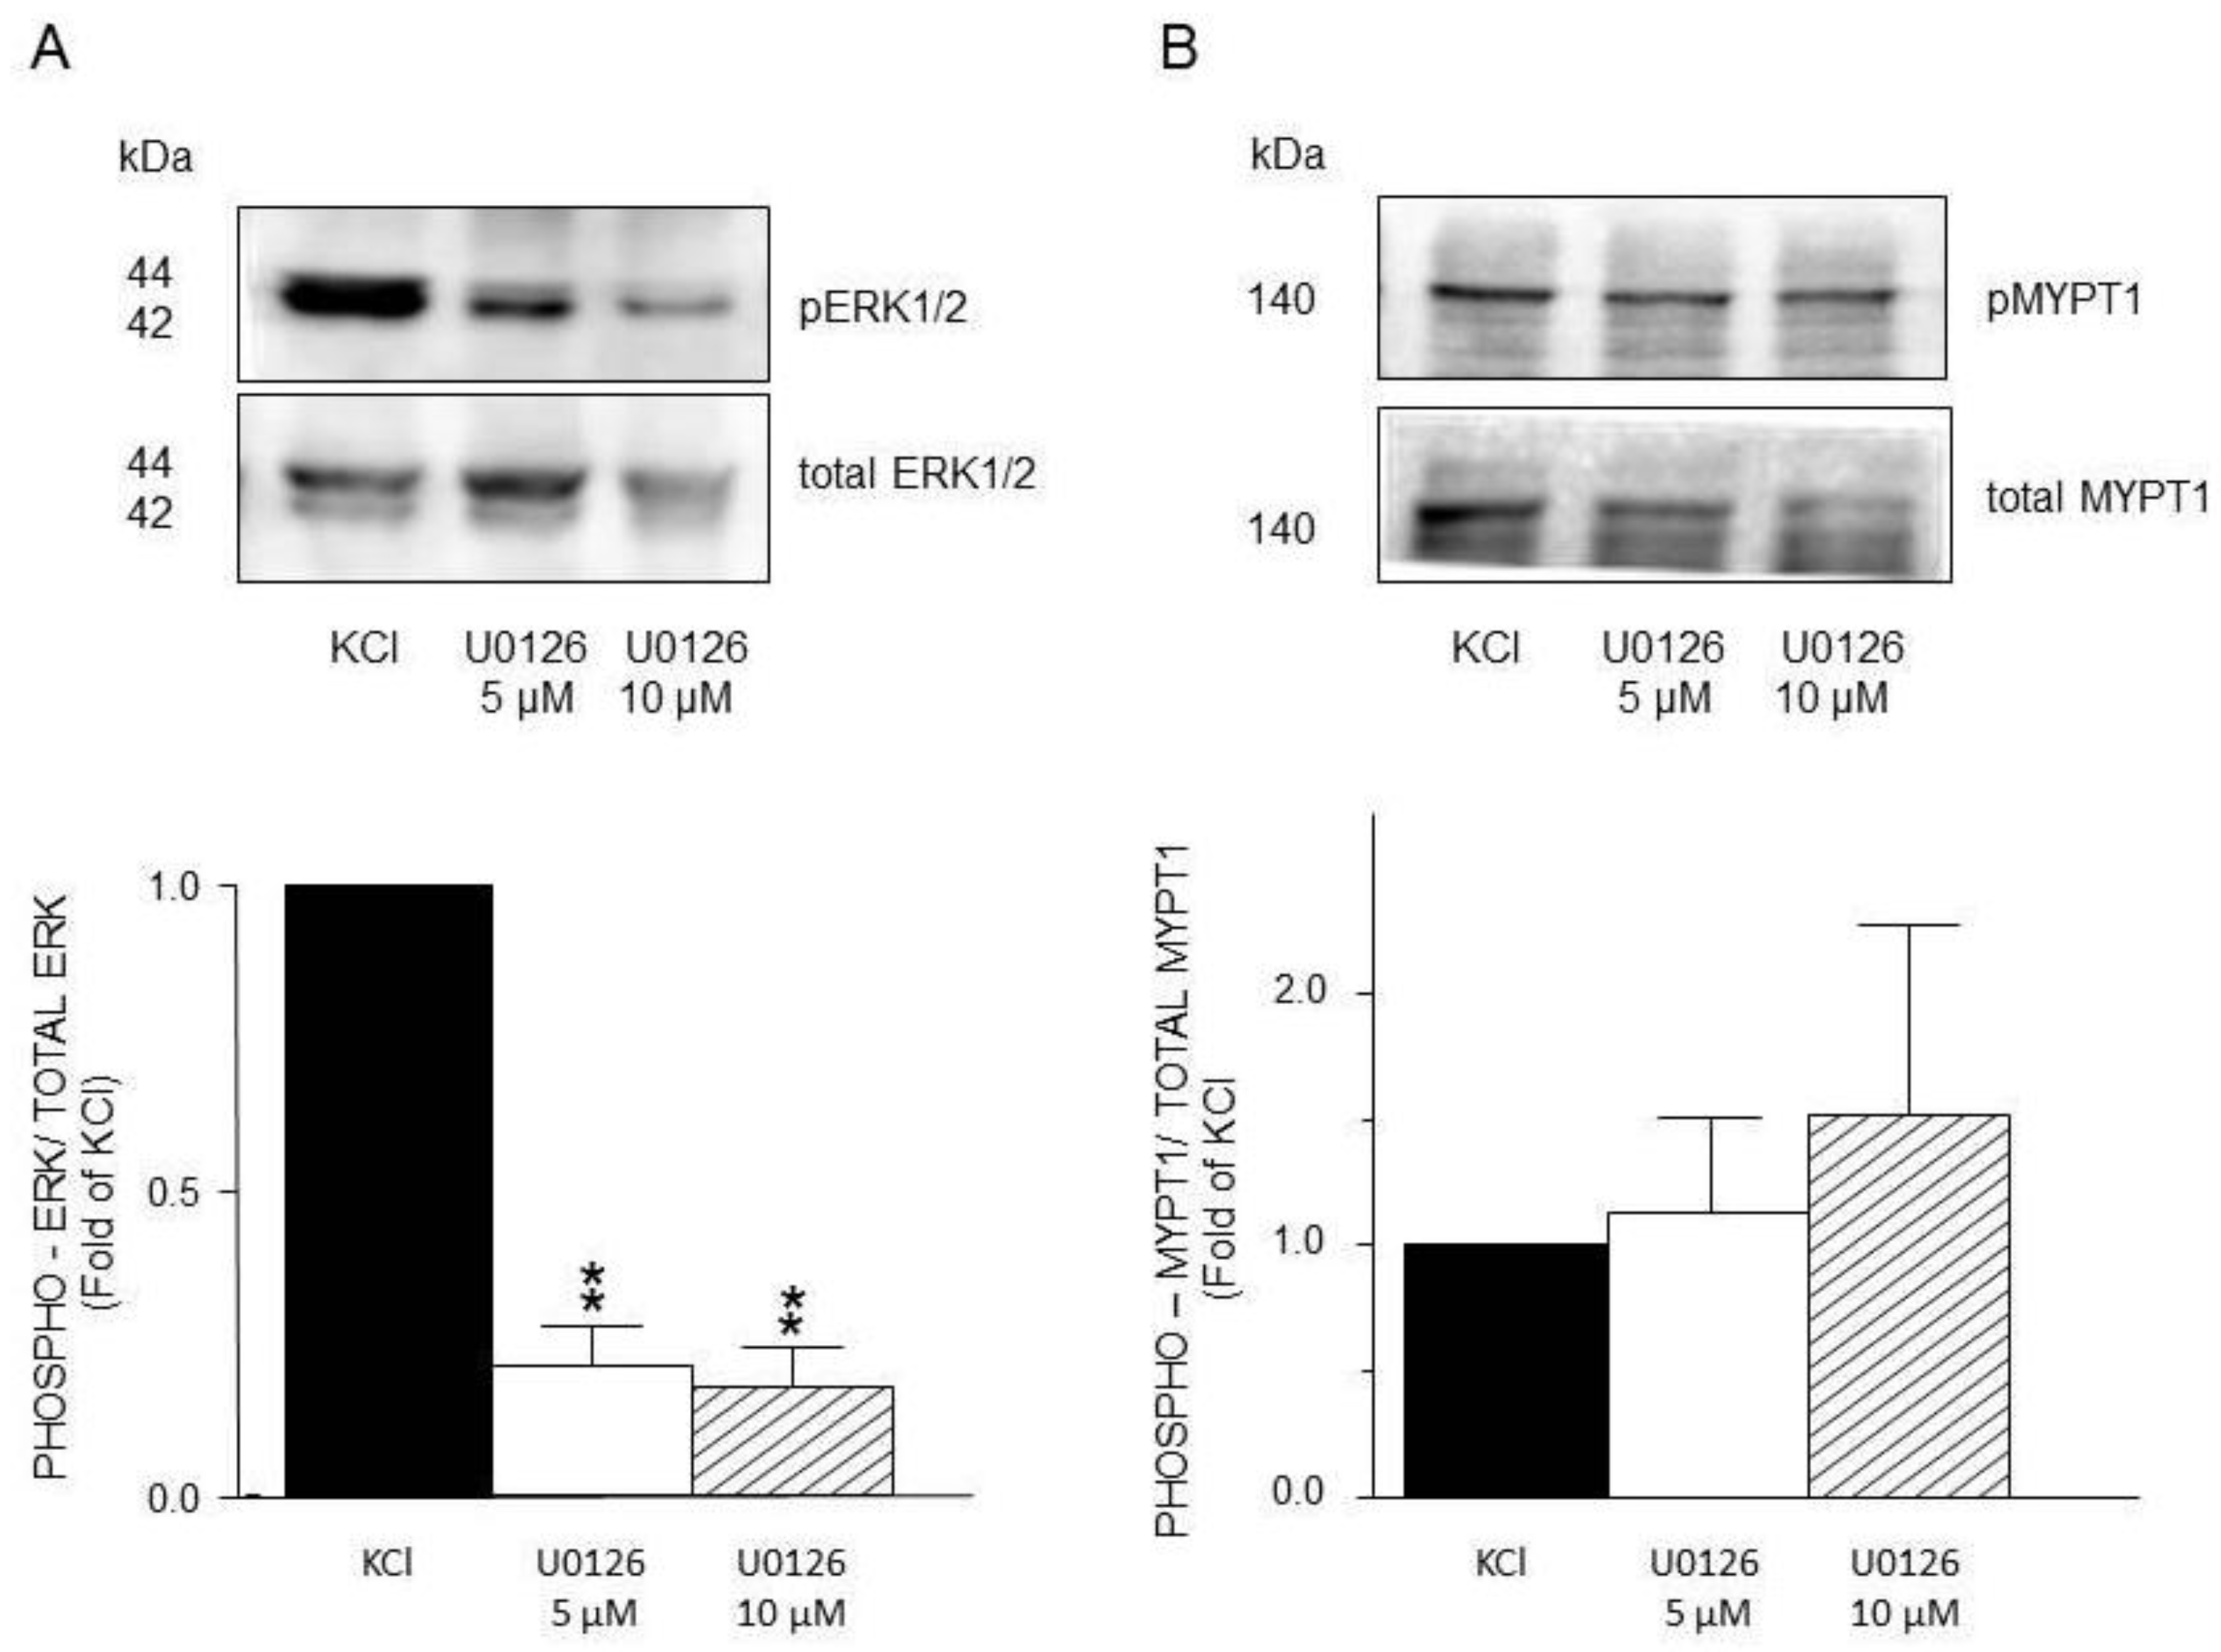
Figure 11.
Densitometric analysis to define ERK1/2 and MYPT1 phosphorylation induced by KCl in guinea pig airway smooth muscle. A) Upper panel shows a representative Western Blot (WB) for KCl-induced phosphorylation of ERK1/2 and its modification by Y27632 (Y-27, 5 μM and 10 μM). Below, bar graph showing mean ± standard error of the mean of 3 WB. B) Upper panel shows a representative Western Blot (WB) for KCl-induced phosphorylation of MYPT1 and its modification by Y27632 (Y-27, 5 μM and 10 μM). Below, bar graph showing mean ± standard error of the mean of 3 WB. Difference found was statistically significant **p <0.01. NOTE that A and B have different scales in the Y axis.
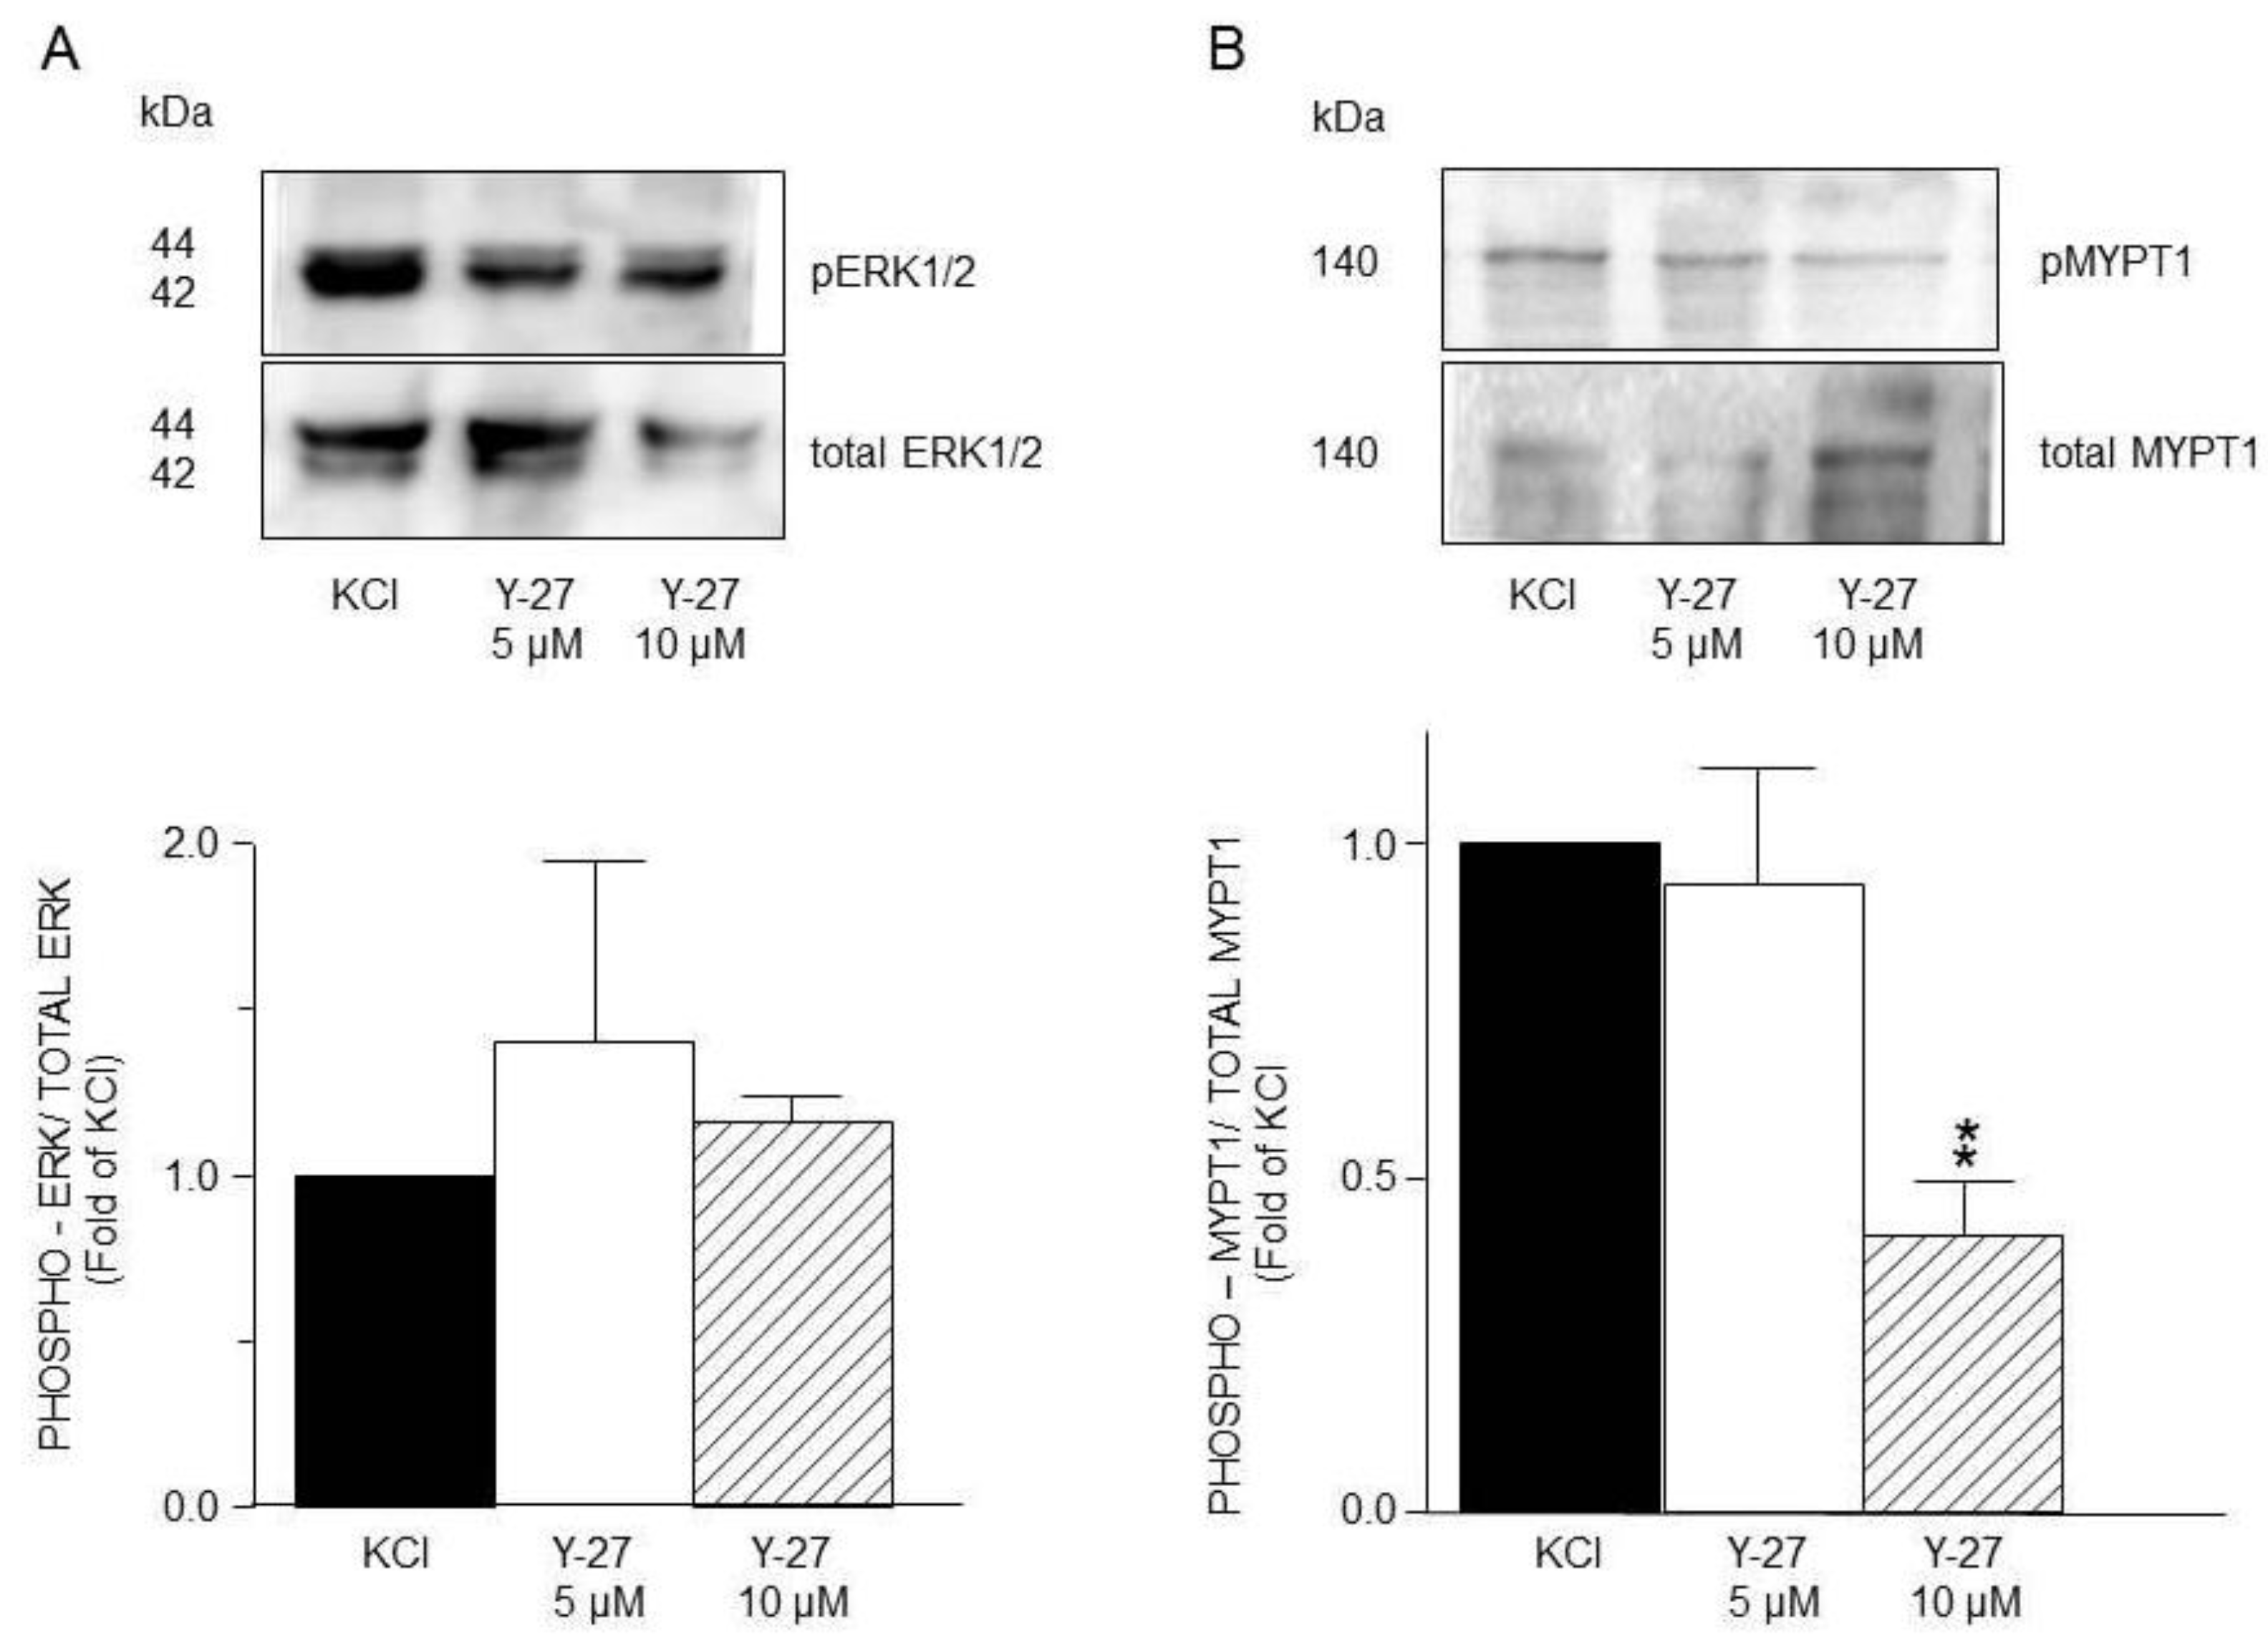

Table 1.
Antagonists.
| Inhibitor name | Target molecule | Concentration(µM) | Reference |
|---|---|---|---|
| Genistein | RTK | 10 | Sakai H, 2013 |
| ST638 | RTK | 10 | Chopra L. 1997 |
| FR180204 | ERK1/ERK2 | 5, 10 | Ohori M, 2007 [21] |
| PD98059 | MEK | 5, 10 | Alessi D, 1995 [22] |
| U0126 | MEK | 5, 10 | Favata M, 1998 [23] |
| U0124 | Inactive analog of U0126 | 5, 10 | Favata M, 1998 |
| ML-7 | MLCK | 5, 10 | Yayama K, 2014 [24] |
| Y-27632 | ROCK | 5, 10 | Ratz PH, 2005 [25] |
Table 2.
Primary antibodies.
| Antibody | Dilution | Purchased from |
|---|---|---|
| ERK 1/ERK 2 | 1:3000 | Cell Signaling Technology |
| p-ERK 1/ERK 2 | 1:3000 | Cell Signaling Technology |
| MYPT 1 | 1:1000 | Cell Signaling Technology |
| pThr-696-MYPT1 | 1:1000 | Cell Signaling Technology |
Disclaimer/Publisher’s Note: The statements, opinions and data contained in all publications are solely those of the individual author(s) and contributor(s) and not of MDPI and/or the editor(s). MDPI and/or the editor(s) disclaim responsibility for any injury to people or property resulting from any ideas, methods, instructions or products referred to in the content. |
© 2025 by the authors. Licensee MDPI, Basel, Switzerland. This article is an open access article distributed under the terms and conditions of the Creative Commons Attribution (CC BY) license (http://creativecommons.org/licenses/by/4.0/).
Copyright: This open access article is published under a Creative Commons CC BY 4.0 license, which permit the free download, distribution, and reuse, provided that the author and preprint are cited in any reuse.


