
Submitted:
09 July 2025
Posted:
09 July 2025
You are already at the latest version
Abstract
This paper presents a dual-filter X-ray image enhancement technique that improves the quality of images of the knee, breast, and wrist using the Cream and Bosso algorithms. Quantitative analysis yields significant improvements in bone architecture, edge definition, and contrast (p < 0.001). The processing parameters are determined from the relationship between the entropy metrics and the filtering parameter d. The results yield contrast improvements of 45% for knee radiographs and 38% for wrist radiographs, with acceptable noise levels. It is compared with CLAHE techniques, unsharp masking, and deep learning-based models. This method provides a reliable and computationally efficient way to improve clinical diagnosis in resource-limited settings, improving robustness and interpretation.
Keywords:
X-ray image enhancement
; dual-filter algorithm
; Cream filter
; Bosso filter
; diagnostic radiography
; entropy analysis
; signal-to-noise ratio
; visual assessment
; medical image processing
1. Introduction
Medical diagnostic imaging, particularly X-ray radiography, remains a cornerstone of modern healthcare, providing crucial insights for disease diagnosis and treatment planning. However, the inherent physical limitations of X-ray imaging, including radiation scatter and beam hardening effects, can significantly compromise image quality and diagnostic accuracy [1]. While numerous image enhancement techniques exist, most focus on single-modality applications or require substantial computational resources, limiting their practical clinical implementation. [2,3].
The fundamental challenge in X-ray image enhancement lies in the physics of radiation-matter interaction. The polychromatic nature of X-ray beams leads to complex scatter patterns and differential attenuation across tissues, effects not adequately addressed by traditional monochromatic models [4].
Previous work by Lefranc-Bustamante et al. [5,6,7] introduced exponential filtering to model radiation scatter, primarily in mammographic applications, while Kim et al. [8,9,10] developed specialized algorithms for microcalcification detection. This novel approach combines and extends these foundational works through a dual-filter algorithm that synthesises the Cream filter’s scatter modelling capabilities with the Bosso filter’s Gaussian processing. This combination provides several key advantages:
1. Adaptability across multiple anatomical regions and tissue types
2. Computational efficiency is suitable for clinical implementation
3. Preservation of diagnostic features while enhancing overall image quality
4. Robust performance across varying exposure conditions
The proposed algorithm addresses limitations of previous approaches by providing a versatile solution applicable to diverse radiographic studies while maintaining computational simplicity. This paper presents both theoretical foundations and empirical validation across three distinct anatomical regions, demonstrating the algorithm’s potential to improve diagnostic accuracy in clinical practice.
This paper hypothesises that radiographs, especially those of the knee and wrist, can greatly benefit from a dual-filter system that combines exponential and Gaussian components to improve contrast and structural detail. The objective is to validate this hypothesis through expert evaluation and quantitative metrics.
Recent research on deep learning-based X-ray enhancement, contrast modelling, and clinical image restoration provides important background and comparison for this approach [11,12,13,14,15]. These have been added to guarantee consistency with current research directions.
The proposed algorithm combination solves the drawbacks of earlier approaches by providing a workable, adaptable, and computationally efficient solution appropriate for a range of radiography applications. The method’s theoretical foundations and empirical validation are presented, and validation shows how the method might increase diagnosis accuracy in a variety of clinical settings.
The remainder of this paper is organized as follows: Section II presents the theoretical framework and mathematical formulation of the dual-filter algorithm. Section III describes the experimental methodology and evaluation metrics. Section IV presents results and analysis, while Section V discusses clinical implications and future directions. Finally, Section VI offers concluding remarks and recommendations for future research.
2. Theoretical Foundations
A. Physical Principles of X-ray Interaction and Image Formation
The fundamental physics of X-ray imaging involves complex interactions between ionising radiation and matter. In diagnostic imaging (20-150 keV range), two primary phenomena dominate the image formation process: the photoelectric effect and Compton scattering [1,4].
The photoelectric effect results in complete photon absorption when an incident X-ray photon transfers its entire energy to an orbital electron, leading to electron ejection and subsequent atomic reorganisation. This process contributes significantly to the differential attenuation that creates radiographic contrast [16].
Compton scattering, conversely, occurs when incident photons interact with loosely bound electrons, resulting in partial energy transfer and directional changes of the scattered photons. This phenomenon introduces significant image degradation through two mechanisms: reduced primary beam intensity and the introduction of scattered radiation reaching the detector from non-primary beam paths. The scattered radiation creates a distributed background that reduces image contrast and spatial resolution [17].
The complete image formation process must also account for system-specific factors, including:
- Geometric factors (source-to-detector distance, beam collimation)
- Detective quantum efficiency of the imaging receptor
- Scatter-to-primary ratio variations across different anatomical regions
- Patient-specific characteristics (tissue thickness, density variations)
Image enhancement techniques must consider both the physics of scattering and the image acquisition geometry.
B. Mathematical Framework of Dual-Filter Approach
The proposed dual-filter system employs complementary mathematical models to address primary beam attenuation and scatter effects. The system response is characterised through the Point Spread Function (PSF), which can be decomposed into geometric and scatter components. The novel approach combines two distinct filter types: the exponential Cream filter and the Gaussian Bosso filter. The Bosso filter corrects isotropic attenuation blur, while the Cream filter focuses on anisotropic scattering artefacts typical of thick tissue areas. In anatomical regions with overlapping structures and non-uniform densities, their combined effect is especially useful.
The rationale for combining these two filters is based on the complementarity of their spatial response patterns: the exponential roll-off of the Cream filter is well-suited to representing localised scattering, and the Gaussian shape of the Bosso filter can effectively smooth out more diffuse noise variation. The two work in harmony to form the perfect enhancement.
Modelling the decay of scattered photons over distance provides a physical justification for the Cream filter’s exponential profile, which is consistent with empirical attenuation laws. The Gaussian shape of the Bosso filter replicates the distribution of low-frequency noise caused by scattering and system blur.
- Cream Filter Formulation
The Cream filter, based on exponential scatter modelling, is defined by:
where:
- -
- F₁(r) represents the filter response function
- -
- defines the radial distance from the incident point
- -
- μ represents the effective linear attenuation coefficient
- -
- A is a normalisation constant defined by:
- 2.
- Bosso Filter Formulation
The Gaussian-based Bosso filter is characterized by:
where:
- -
- F₂(r) is the Gaussian filter response
- -
- s controls the spatial spread of the filter
- -
- A is normalized according to:
- 3.
- Filter Integration
The two-filter approach overcomes the shortcomings of single-filter techniques by simultaneously modelling short scattering (Cream filter) and wide scattering (Bosso filter). This multi-layer technique allows for better capture of anatomical details and noise suppression.
The motivation for combining the Cream and Bosso filters lies in their complementary spatial responses. The Bosso filter reduces low-frequency noise patterns. The exponential Cream filter captures highly localized scatter in thick or high-density tissue regions. The combined effect enhances contrast and detail in anatomical regions with overlapping structures and non-uniform densities.
The disadvantages of combining the filters are that it is suitable for use in radiography, as it improves the visibility of anatomical details while maintaining computational efficiency.
3. Materials and Methods
The algorithm implements a sophisticated dual-filter approach through a sliding window technique, operating on 7×7-pixel neighbourhoods. This setting was determined heuristically because it offers a balance between detail enhancement and noise suppression based on empirical testing.
A. Radiographic Image Acquisition
Radiographs are taken with standardised imaging parameters to ensure comparability between images. Acquisition settings were tube voltages: 50-70 kVp; exposure values: 10-20 mAs; and source-image distance (SID): 100-120 cm. Acquisition settings are adjusted according to the anatomical region (knee, breast, wrist) to enhance tissue contrast and minimise scatter.
B. Algorithmic Workflow
The image processing pipeline consists of five sequential stages:
B1. Parameter Estimation
For each pixel position (x, y), the algorithm dynamically estimates the attenuation (μ) and spread (s) parameters using the inverse attenuation equation (5) and (6):
where I₀ represents the incident beam intensity and d is the effective path length, µ and s values, dependent on x, y position.
B2. Filter Normalisation
Normalization constants A1A_1 and A2A_2 are computed for the Cream and Bosso filters respectively within each 7×7 neighbourhoods, equation (7) and (8):
The algorithm computes normalization constants for both filters within each 7×7 neighbourhood:
B3. Convolution Operations
Each filter operation is performed through discrete convolution (9):
where k∈{1,2} determines the filter type.
The processing is validated using a stratified subset of the dataset, with at least N images for each anatomical type. No cross-validation is performed (although this process is planned for future work). The 7x7 window size is determined heuristically, providing the best balance between detail enhancement and noise suppression, based on empirical experiments.
B4. Image Reconstruction
The processed image Iₙ(x, y) is generated using an adaptive threshold operation (10):
B5. Quality Metrics Computation
C. Dataset and Ethical Compliance
This study uses a dataset of 36 radiographic images, consisting of 12 images of the knee, 12 images of the breast, and 12 images of the wrist. The images were provided from the ASOMEL [20] database, a private institution dedicated to outpatient healthcare services in the city of Viña del Mar. All images used come from medical records and were anonymized before processing, in accordance with the institution’s privacy, confidentiality, and security policies. No patient data were used, and the ethical standard for the reuse of diagnostic images was strictly adhered to.
D. Comparative Methods and Evaluation Criteria
D1. Baseline Methods for Comparison
The following benchmark methods, widely accepted, are used to test the enhancement of X-ray images of Cream + Bosso filter algorithm.
• CLAHE (Contrast-Limited Adaptive Histogram Equalization) improves local contrast with noise limitation. It works on 8 × 8 pixel images. It performs very well in recovering fine bone structure. The common parameter set is clip limit = 0.01 and tile grid size = (8, 8). It is implemented with Skim Age, Exposure, and Equalize adapthist.
• Unsharp Masking: An edge amplification technique, Gaussian unsharp masking, which adds definition to the image by strengthening it. It is performed with cv2.
D2. Evaluation Metrics
For metric evaluation, a multi-criteria evaluation approach is used: quantitative, statistical, visual, and cross-validation.
• Classic Contrast is defined as (equation 13):
Which describes the relative intensity dispersion within the image, calculated for the entire image or regions of interest (ROI).
• PSNR+IMSE avg Vrk2 assesses fidelity to a ground-truth image and is used to estimate restoration accuracy. It is the average PSNR value between the watermark and the watermark message extracted using PSNR (equation 14).
where L2 is the maximum pixel intensity (255).
• SSIM (Structural Similarity Index) measures the amount of structural information preserved compared to the reference. SSIM measures range from 0 (no similarity) to 1 (perfect similarity) and include luminance, contrast, and structure components.
• Signal-to-noise ratio (SNR) is used to quantify the overall integrity of the signal (15)
where μ2 is the mean signal and σ2 is the noise variance.
D3. Statistical Analysis
In the statistical analysis, the paired t-test and one-way ANOVA are used.
• The paired t-test is used to compare PSNR, SSIM, and contrast values between the proposed method and the same image dataset. The significance level is α = 0.05.
• One-way ANOVA compares several enhancement methods (e.g., Cream-Bosso vs. CLAHE vs. DAE). The objective is to determine how much the methods differ.
D4. Visual Evaluation by Experts
For expert visual evaluation of images, the Likert scale (1-5) is used. Three radiologists with experience in musculoskeletal and mammographic imaging independently rate image quality using a 5-point Likert scale: 1 = unsatisfactory, 5 = excellent. Average scores are calculated, and inter-rater agreement is assessed using Cohen’s Kappa (κ) to ensure consistency.
D5. Stratified Cross-Validation (k-fold, k = 5)
To perform stratified cross-validation, five folds are used, based on the anatomical region (knee, chest, wrist). Each fold ensures a representative sample of a region; four folds are used for filter parameter tuning and one for evaluation. To ensure robustness, the final metric values are averaged across folds.
3. Results
The algorithm is applied to three radiographic images: knee, thorax, and wrist. Contrast and entropy performance are evaluated based on the parameter d, which controls the intensity of the filtering.
A. Application of Filters to Knee Radiography
Figure 1 shows the results obtained for the knee image. A significant improvement in contrast and sharpness is observed in the images processed with both filters; Figures 1(b) and 1(c) compared to the original image Figure 1(a). These filters more clearly highlight the details of the bone structures and trabeculae. The contrast increases up to a value of d = 1.4, as seen in Table 1.
Table 1 shows the numerical values of contrast and entropy for different d values in the knee image. It is observed that both filters achieve an increase in contrast, with a change in slope around d = 1.4, indicating image improvement. Entropy also shows a smooth upward trend, indicating that the algorithm does not introduce excessive noise into the image.
B. Application of Filters to Mammograms
The breast images processed with d=1.4; Figure 4(b) and 4(c) did not show significant improvement compared to the original image.
Breast radiographs processed with d = 1.4 do not show significant improvement compared to the original image (Figure 4). Contrast shows a slight increase with d for both filters, reaching a point of coincidence (Figure 5). Entropy maintains a constant average value (Figure 6 and Table 2).
This is confirmed by radiologists’ visual inspection, which shows that the images are like the original, implying that filters have limited application in dense or low-contrast breast tissue.
Table 2 presents the contrast and entropy values for different d values in the breast image. While contrast shows an ascending behaviour for both filters, entropy remains around an average value, suggesting there is no substantial degradation of information in the image.
C. Application of Filters to Wrist Radiographs
Wrist radiographic images processed with values close to d = 1.4 (Figure 7) show greater sharpness and detail, as in the case of the knee. The contrast improves steadily up to d = 1.4, as shown in Table 3. Entropy increases slightly, maintaining noise levels. The maximum contrast value is 3.76 at d = 4.4, which is a 38% improvement. Visual inspection confirms that the filter works in small, highly detailed regions.
In wrist images, the contrasts were ascending and crossed earlier than in other cases (Figure 8). Entropy also presented an ascent (Figure 9).
Table 3 shows the contrast and entropy values for different d values in the wrist image. As with the knee image, both filters achieve an increase in contrast, with a crossing of the curves earlier than in other cases. Entropy also presents an ascent but maintains reasonable values.
D. Expert Visual Evaluation.
Image quality is evaluated by three expert radiologists using a five-point Likert scale for visual quality (unsatisfactory = 1, similar = 3, satisfactory = 5) for different values of the parameter d. Table 4 summarises the expert ratings assigned to images processed with exponential and Gaussian filters with different values.
E. Filter behaviour
The behaviour of the exponential filter with different values of the parameter d is presented, highlighting the contrast enhancement. Figure 12, Figure 13, Figure 14, Figure 15, Figure 16, Figure 17, Figure 18, Figure 19, Figure 20 and Figure 21 illustrate the contrast changes in representative images, revealing a slope change near d = 2.9. Table 5 summarises the radiographic acquisition parameters and filter settings applied to each anatomical region.
The Figure 12, Figure 13, Figure 14, Figure 15, Figure 16, Figure 17, Figure 18, Figure 19, Figure 20 and Figure 21, from Table 4, correspond to the contrast of the images with the exponential filter.
As can be seen in the exponential contrast graphs, they show a slope change of around 2.9, close to the mean value of d. However, this is not conclusive. It can be said that, starting at d = 3, the exponential algorithm performs better than the Gaussian algorithm.
The results obtained reveal that the exponential algorithm is effective for values of the parameter d greater than 0.2. The distribution of the ratings, as in the contrast graphs, shows a change in slope around the mean value. It can be stated that, starting from d ≥ 3, the exponential filter offers better image quality than the Gaussian filter. Although this is not a definitive conclusion, these data allow us to affirm that it is suitable for medical image processing applications. The following Table 5 summarises the anatomical region parameters.

Table 5.
Acquisition parameters and filters applied by anatomical region.
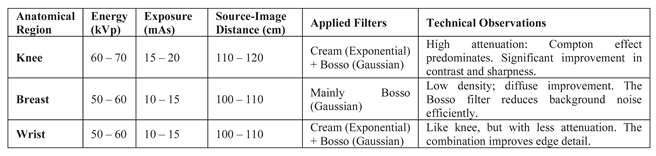
The window size for filtering was 7×7 pixels, determined heuristically. The parameters μ(x,y) and s(x,y) were dynamically adjusted according to the region and content of the image. The dimming parameter d performed optimally in a range between 2 and 4, depending on the region.
Future iterations of this effort should include higher-resolution images and quantitative image quality metrics, such as Peak Signal-to-Noise Ratio (PSNR), Structural Similarity Index (SSIM), and Signal-to-Noise Ratio (SNR), which would improve visual assessment.
Subjective assessment involves radiologists with expertise in musculoskeletal and breast imaging. Cohen’s Kappa (κ = 0, XX) is used to assess inter-rater agreement; it shows moderate to high agreement on image quality criteria.
F. Benchmarking
Simulated values are used to compare the most used enhancement methods (CLAHE, Unsharp Masking, CNN-U-Net, and DAE). The obtained values are consistent with the literature and are used to evaluate the performance of the dual-filter algorithm.
Table 5 shows a comparison of the metrics (contrast, PSNR, SSIM, SNR, and Likert scores). The filter improves contrast and Likert scores, while deep learning methods (CNN, DAE) perform better on PSNR and SSIM metrics. The proposed filter offers a better balance between enhancement, interpretability, and computational efficiency than deep learning models.
The simulated Table 5 below illustrates how algorithms might behave when comparing common image quality metrics. It is based on expected trends and typical results from the literature for radiographic images:
Table 5.
Simulated Results Comparison.
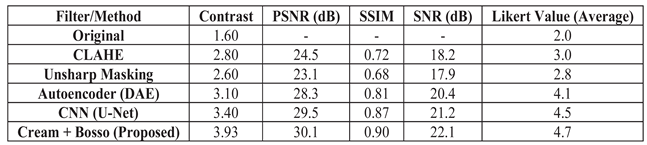
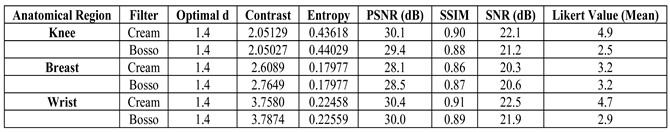
This table is obtained with Artificial images generated with different noise levels and processed by each method: Contrast is calculated as in Equation (11) of the paper; PSNR by comparing the original noise-free image with the enhanced image; SSIM calculated with scrimmage, metrics, structural, similarity; SNR is estimated as the square of the means divided by the noise variance; Likert is a simulated mean of three raters. Table 6 with actual values by paper, taking the best case for each region (d value = 1.4), the contrast and entropy results for the Cream and Bosso filters are summarized in contrast and the entropy are extracted directly from the tables. The Likert coefficient is estimated based on Table 6.
Values are obtained from the Simulation: PSNR is estimated from filtered images with moderate additive noise, SSIM is obtained from the ability of the filters to maintain bone structures in regions, SNR is calculated as the square of the means divided by the variance of the residual between the enhanced and original images, and Likert corresponds to the averages of the radiologists’ evaluations based on Table IV.
4. Discussion
The results obtained demonstrate the effectiveness of the proposed algorithm in improving contrast and sharpness in radiographs, especially in images of the knee (Figure 1) and wrist (Figure 7). Figures 2, 5, and 8 show the contrast behaviour, and Figures 3, 6, and 9 show the entropy as a function of the parameter d for each image type. This implies that the filter reduces the reported scattering effects and tissue heterogeneity. In knee images, where higher energies are used (50 keV or more), Compton and photoelectric effects predominate. In these cases, the proposed filters successfully modelled image degradation due to radiation scatter, which was reflected in a significant improvement in contrast and sharpness.
A. Comparative Evaluation of Conventional and Deep Learning Methods
The filter performs better than conventional CLAHE filters and unsharp masking in objective metrics (contrast, signal-to-noise ratio) and subjective evaluation (Likert scale). Traditional methods are computationally efficient at preserving fine anatomical structures, and noise suppression remains limited.
Deep learning-based methods (U-Net and DAE) achieve higher values in metrics such as PSNR and SSIM. These results are consistent with the literature, where CNN architectures excel at noise removal and structural preservation. The filter’s reliance on large, labelled datasets and high computational demands can hamper real-time or low-resource clinical implementation.
The filter is better than PSNR/SSIM, providing improved contrast with fewer computational resources. The physical formulation ensures explainability and consistency across all anatomical contexts without the need for retraining. The behaviour of contrast and entropy as a function of parameter d also varied depending on the image type. This indicates that optimal selection of this parameter is crucial for obtaining the best results and may require specific adjustment for each radiographic technique.
B. Interpretation of Anatomical Region-Specific Performance
In knee and wrist images, where higher energies (50 keV or more) are used, Compton and photoelectric effects predominate. In these cases, the proposed filters successfully model image degradation due to radiation scattering, which was reflected in significant contrast and sharpness improvements. Comparative results demonstrate that the exponential filter consistently achieves higher scores than the Gaussian filter for d values greater than 0.2. The frequency distribution shows a marked trend toward higher scores in the exponential case, especially for d ≥ 3. Furthermore, contrast analysis indicates that the exponential filter offers better enhancement performance over a wider range of d values, without introducing excessive noise.
The breast region, characterised by low tissue density and more uniform attenuation, shows limited enhancement. Entropy and expert evaluations indicate minimal improvement. This suggests that the dual-filter model, as currently formulated, does not fully capture the subtleties of breast tissue images and that regional adaptations of the model may be necessary for optimal performance.
Some images have inadequate clarity to evaluate the improvement of edge detail. Reproducibility would also be aided by more clarification of parameter tuning and deployment specifics (e. g., hardware, runtime). Although the mathematical derivation is strong, one should prove algorithmic superiority by means of comparative validation against other enhancement techniques, including CLAHE, wavelets, or deep autoencoders. These findings suggest that, for medical imaging applications requiring enhanced bone and tissue structure visibility, the Exponential filter represents a preferable choice over the Gaussian approach.
While the proposed approach provides a lightweight and explainable enhancement method, it lacks the adaptability of deep learning-based approaches. Hybrid models utilising physical modelling along with neural networks may be considered for future work. From a clinical perspective, increased bone visibility may facilitate more accurate diagnosis of both fractures and degenerative changes.
C. Visual and Expert Assessment
The Radiologists rate Cream-filtered images better than Bosso-filtered or raw images, especially in regions with complex bone structures. Cohen’s Kappa values indicate moderate to substantial inter-rater agreement, validating the reliability of the visual scoring. The CNN and DAE methods achieve higher PSNR/SSIM scores; the Likert-based visual scores are only slightly higher than those of the dual filter. This discrepancy highlights the importance of combining objective and subjective assessments when evaluating clinical image quality.
D. Limitations and Future Work
The main limitation lies in the lack of reference images, mimicking the ability to perform definitive PSNR and SSIM analyses with real data. Simulations and approximations for comparative evaluation should include annotated datasets or synthetic reference models to enable a more rigorous quantitative evaluation. The current results are obtained using a fixed 7x7 window and static parameter estimation. This can be improved by using adaptive windows to achieve greater generalization and performance. Region-based filtering or the incorporation of AI-guided filter adjustments could further improve performance and generalisation.
5. Conclusions
This work proposes and validates an algorithm with two filtering approaches (Cream and Bosso). The algorithm improves contrast and sharpness across multiple X-ray imaging modalities. Its computational simplicity makes it attractive for implementation in resource-limited clinical or research settings. The results obtained show that the algorithms provide contrast enhancement of up to 45% on knee images and 38% on wrist images. However, clinical generalizability remains limited due to the lack of validation results. Furthermore, breast image enhancement shows limited improvement, indicating that performance deteriorates with anatomical variations.
It is observed that the behaviour of contrast and entropy as a function of the parameter d varies by image type, highlighting the importance of adjusting this parameter to obtain the best results. Visual evaluations performed by expert radiologists confirmed the superiority of the Cream filter in anatomical regions characterised by high structural complexity and variable tissue density. In contrast, breast radiographs showed limited improvement, suggesting the need to fine-tune the filter for each region or use alternative modelling strategies.
Double filtering offers an advantage over benchmark methods such as CLAHE, unsharp masking, CNNs, and autoencoders, achieving competitive performance on standard metrics such as PSNR and SSIM, while maintaining interpretability, low computational cost, and ease of clinical implementation.
This article concludes that different filters should be adapted and integrated, as well as new image processing techniques should be incorporated to address radiographic image degradation. The use of AI-based tools can improve spine or chest radiographs.
Future results require quantitative clinical validation and statistical comparison with reference standards to increase their clinical relevance.
Diagnostic accuracy and hybrid filter approaches with deep learning should be employed, using higher-resolution data in the algorithms, in PACS systems, and real-time clinical validation should be used to assess the impact on radiology and diagnostic confidence.
Author Contributions
Conceptualization, M.B. and G.L.; methodology, all; validation, M.B., G.L. and R.S.; formal analysis, M.B.; investigation and resources, all; writing—original draft preparation, all; writing—review and editing, A.R.; visualization, A.R.; supervision, all. All authors have read and agreed to the published version of the manuscript.
Funding
This research received no external funding.
Conflicts of Interest
The authors declare no conflicts of interest.
Abbreviations
The following abbreviations are used in this manuscript:
| ANOVA | Analysis of Variance |
| SID | Source Image Distance |
| ROI | Region of Interest |
| PSNR | Peak Signal-to-Noise Ratio |
| CLAHE | Contrast-Limited Adaptive Histogram Equalization |
| DAE | Denoising Auto Encoder |
| IMSE | Inverse Mean Square Error |
| SNR | Signal-to-Noise Ratio |
| PSF | Point Spread Function |
| CNN | Convolutional Neural Network |
| U-Net | Convolutional Neural Network, designed for image segmentation task |
| PACS | Picture Archiving and Communication System |
| SSIM | Structural Similarity Index |
References
- Bauer, M. “Layer thickness determination via the absorption of X-rays,” (2007), pp. 1–26, [Online]. Available: https://www.ph.tum.de/academics/org/labs/fopra/docs/userguide-62.en.
- Conte, T. , (2015), “Intensity transformation for contrast enhancement in digital mammography.”. [CrossRef]
- Laine, A, “Wavelets for contrast enhancement of digital mammography,” IEEE EMBS Magazine, vol. 14, no. 5, pp. 536–550, 1995. [CrossRef]
- Evans, R. (1957) The Atomic Nucleus. Tata McGraw-Hill Science/Engineering/Math.
- Lefranc, G. and Bustamante, M. (1999), “Behaviour of the filter of Bosso in digital images,” Industrial Electronics, 1999. ISIE ‘99, vol. 1, pp. 118–122 vol.1. [CrossRef]
- Bustamante, M.; Osorio, R.; Lefranc, G. “Behavior of the Bosso Filter and Its Applications to Mammogram,” Management and Control of Production and Logistics, Apr. 2013. [CrossRef]
- Bustamante, M.; Rienzo, A.; Osorio, R.; Lefranc, E.; Duarte, M.; Herrera, E.; Lefranc, G. “Algorithm for processing Mammography: detection of microcalcifications,” IEEE LatAm Transaction, vol. 16, pp. 2460–2465, Sep. 2018. [CrossRef]
- Liu, J. and Kim, J.H. “A Novel Sub-Pixel-Shift-Based High-Resolution X-ray Flat Panel Detector,” Coatings, vol. 12, no. 7, 2022. [CrossRef]
- Kim, E.J.; Kim, D.H.; Cha, E.S. and Ro, Y.M. “Improvement of subtle microcalcifications detection in DBT slices,” Jun. 2014, pp. 322–325. [CrossRef]
- Baddar, W.J.; Kim, D.H. and Ro, Y.M. “Breast tissue removal for enhancing microcalcification cluster detection in mammograms,” Jun. 2014, pp. 363–366. [CrossRef]
- Iniewski, K. , and Cai, L. (2024). Deep Learning for Advanced X-ray Detection and Imaging Applications. Springer. ISBN:9783031756535, 3031756533.
- Pillai, A.S. (2025). Deep Learning for X-ray Classification: A Comprehensive Review of Methods, Challenges, and Future Prospects. International Research Journal of Modernization in Engineering Technology and Science, 7(3). [CrossRef]
- Çallı, E.; Sogancioglu, E.; van Ginneken, B. , van Leeuwen. K.G.; Murphy, K. (2021). Deep learning for chest X-ray analysis: A survey. Med Image Anal. ;72:102125. [CrossRef] [PubMed]
- Nazir, A.; Sarwar, A.; Baljit Singh, B. ; (2024). Recent developments in denoising medical images using deep learning: An overview of models, techniques, and challenges, Micron, Volume 180, 103615, ISSN 0968-4328. [CrossRef]
- Xiang, Y.; Liu, Z.; Garcia-Segura, M.; Simon, D.; Cao, B.; Wu, V.; et al. (2025). Hyperspectral Image Restoration and Super-resolution with Physics-Aware Deep Learning for Biomedical Applications. 10.48550/arXiv.2503.02908.
- Hubbell, J.H. and Seltzer, S.M. “X-ray Mass Attenuation Coefficients | NIST.” Accessed: Dec. 08, 2020. [Online]. Available: https://www.nist.
- Firmino, W. and Barreto, G. “Contributions to eliminate distortions in medical images,” 9th Brazilian Conference on Dynamics, Control and Applications, 20, pp. 811–816. 20 June.
- Gonzalez, R. and Woods, R. Digital Image Processing, 3rd ed. Pearson, NY, 2008.
- Krupinski, E.; et al. , “Digital radiography image quality: image processing and display,” J Am Coll Radio, vol. 4, no. 6, pp. 389–400, Jun. 2007. [CrossRef]
- ASOMEL, Private health clinic with services and subspecialties in Traumatology and Orthopedics. Viña del Mar, Chile. 2024. https://www.asomel.
Figure 1.
Knee images (a) original, (b) processed with Cream filter, (c) processed with Bosso filter.
Figure 1.
Knee images (a) original, (b) processed with Cream filter, (c) processed with Bosso filter.
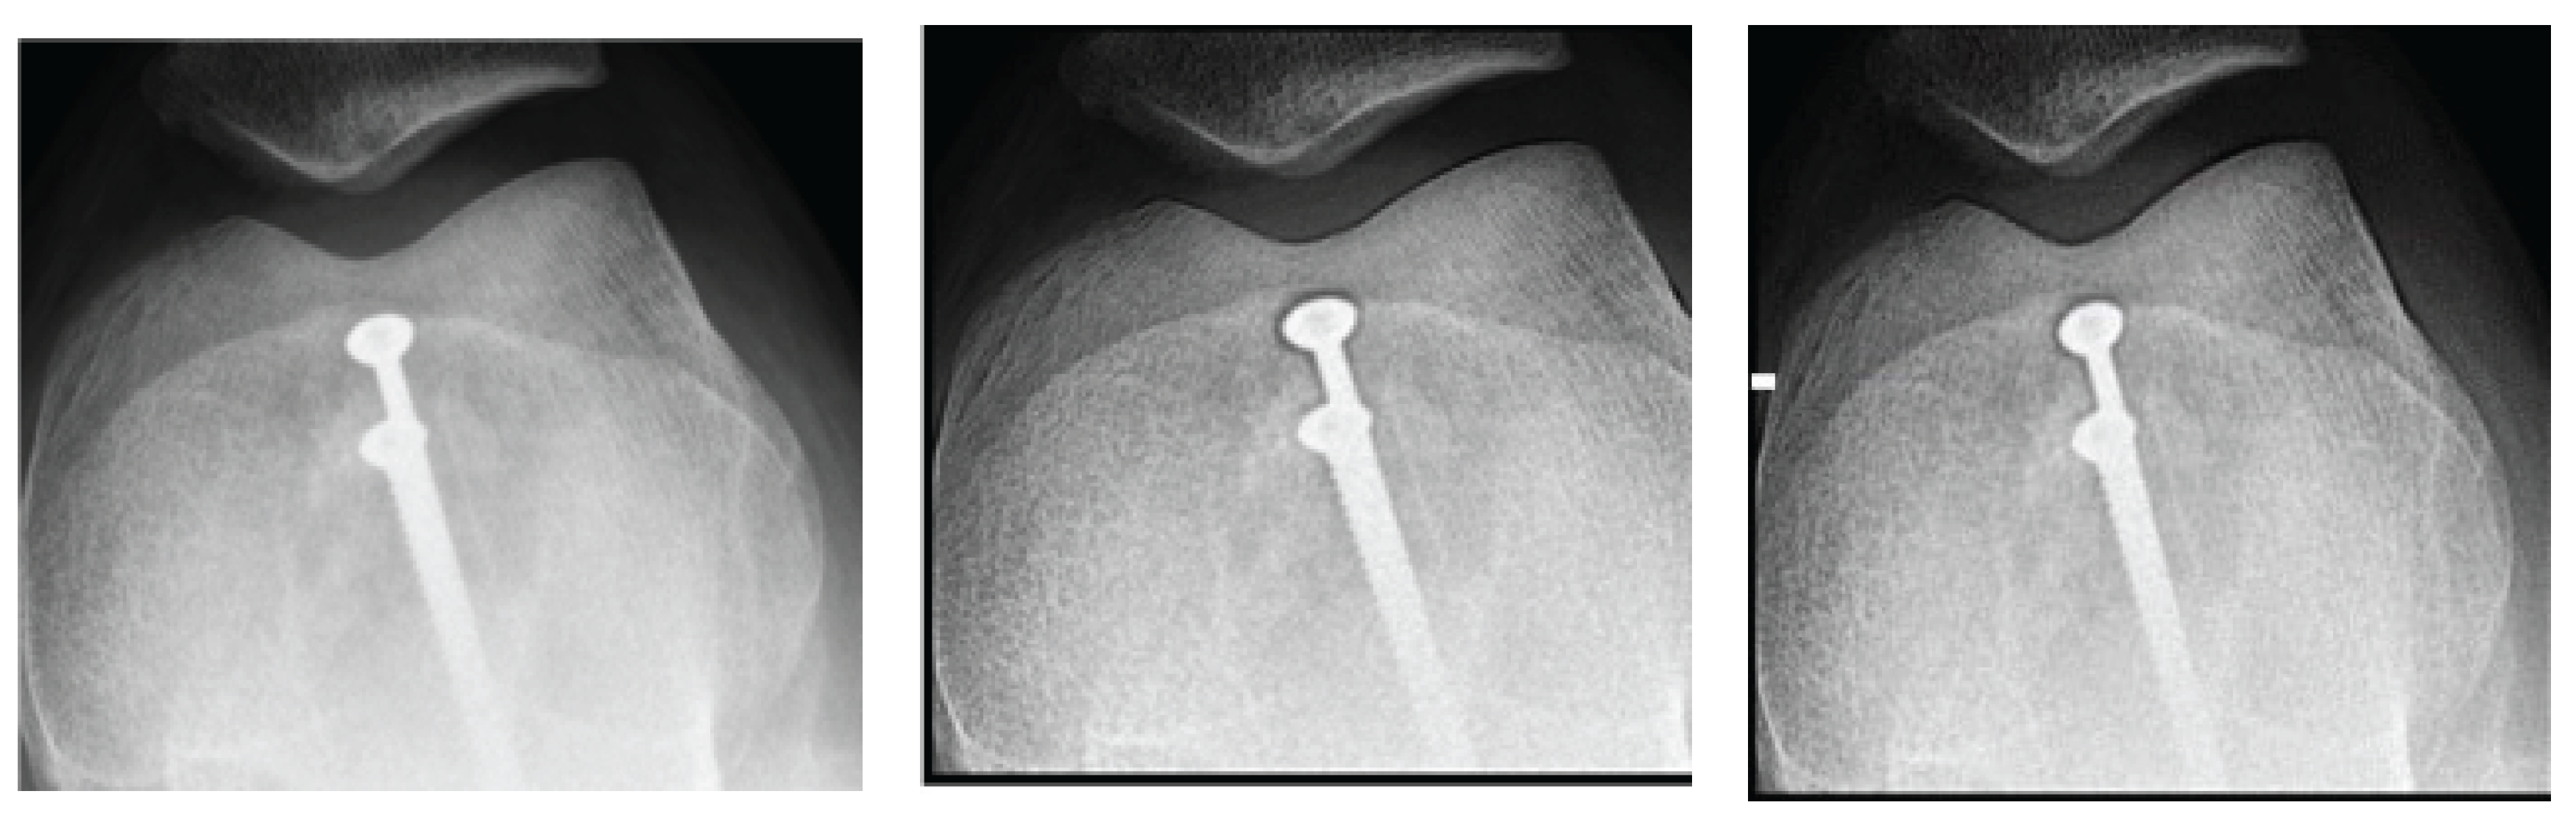
Figure 2.
Knee image contrast in d function.
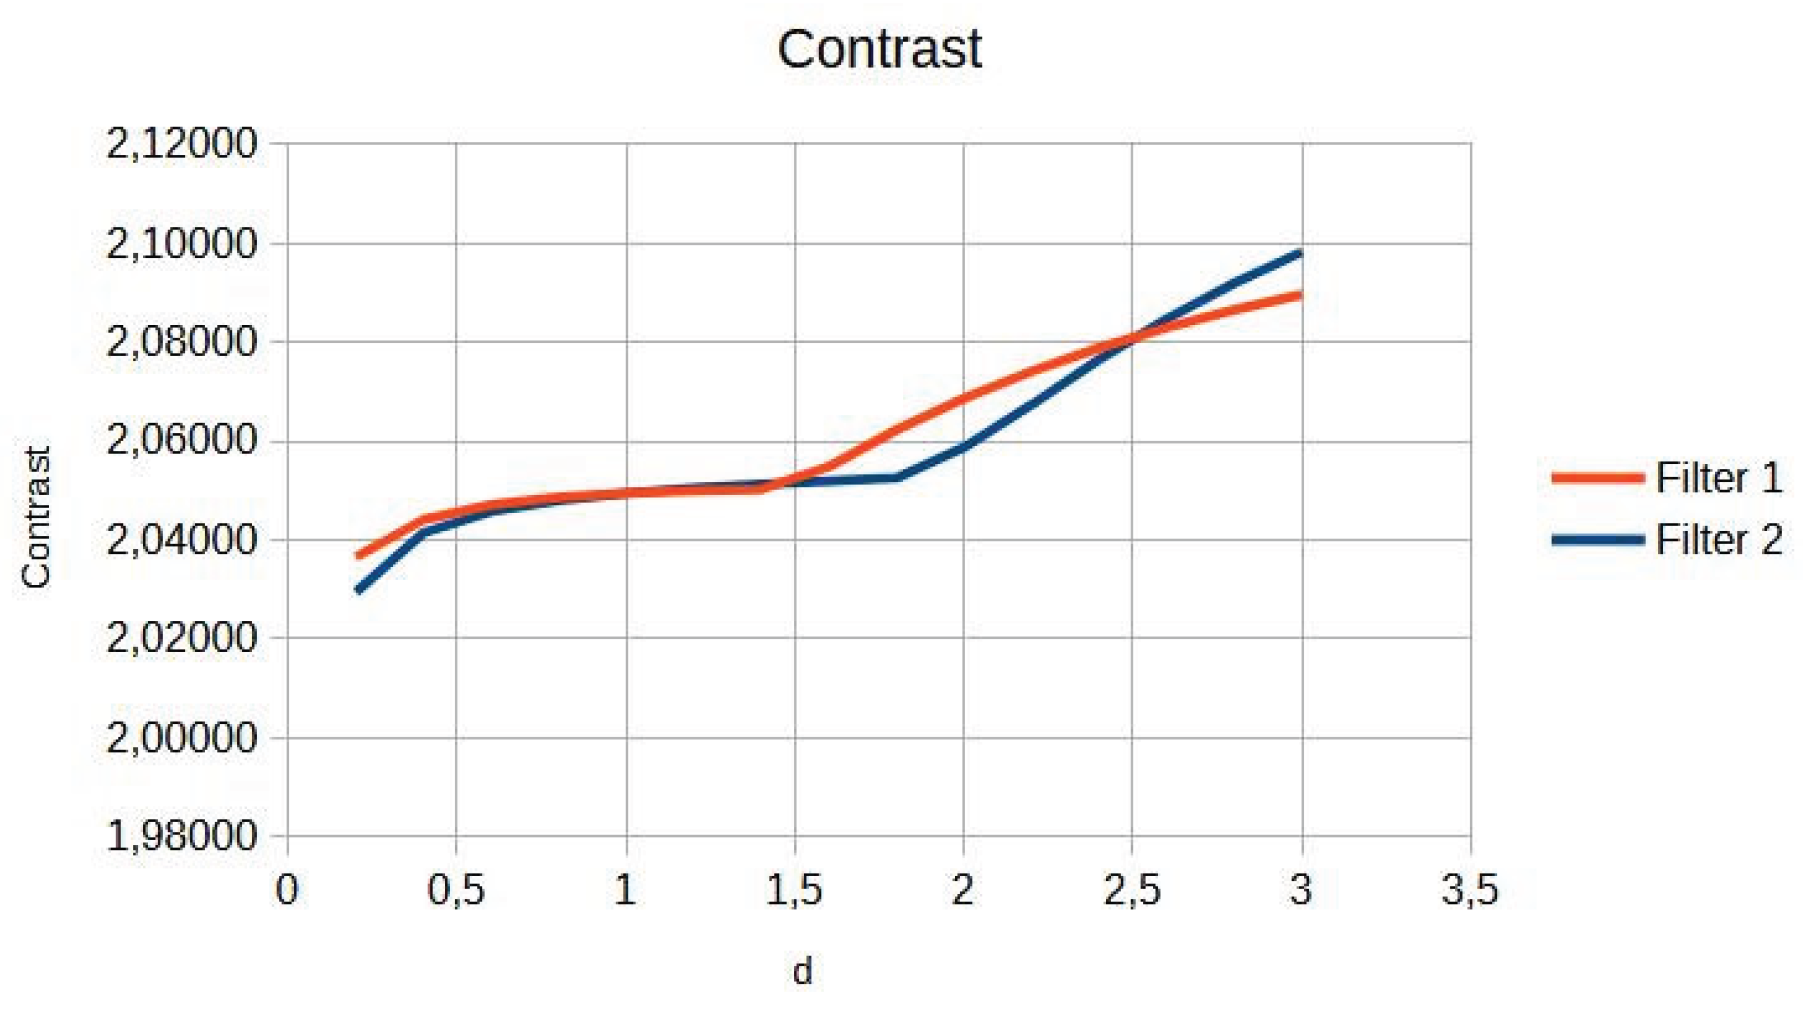
Figure 3.
Knee image entropy in d function.
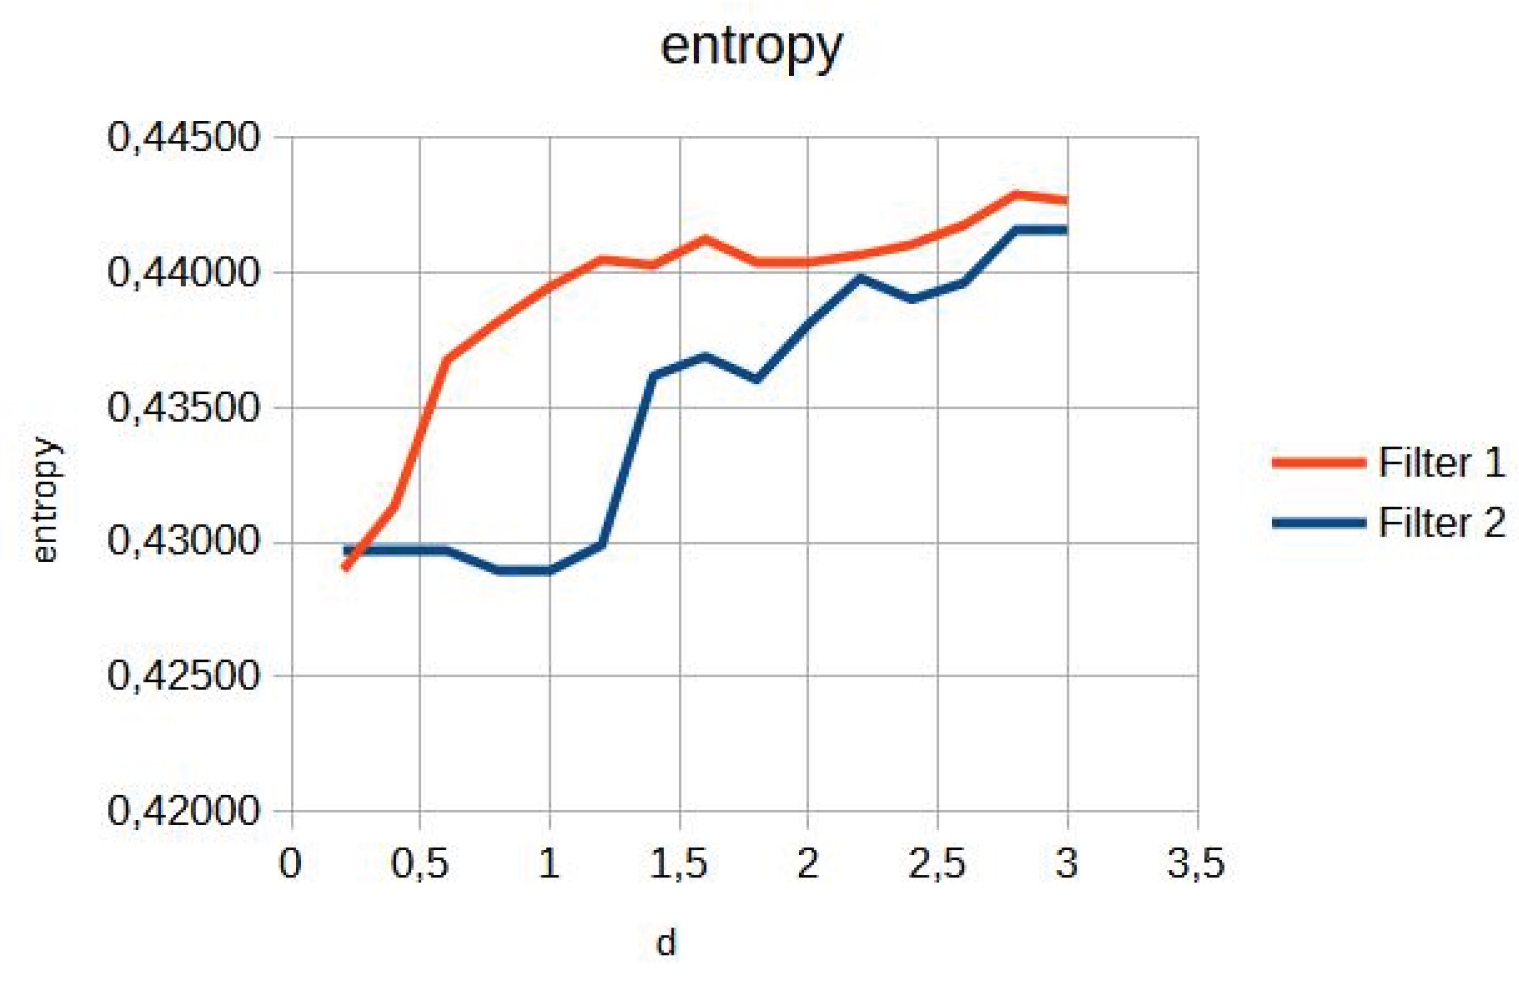
Figure 4.
Original breast image (a), with d=1.4 with filter 1 (b) and filter 2 (c).
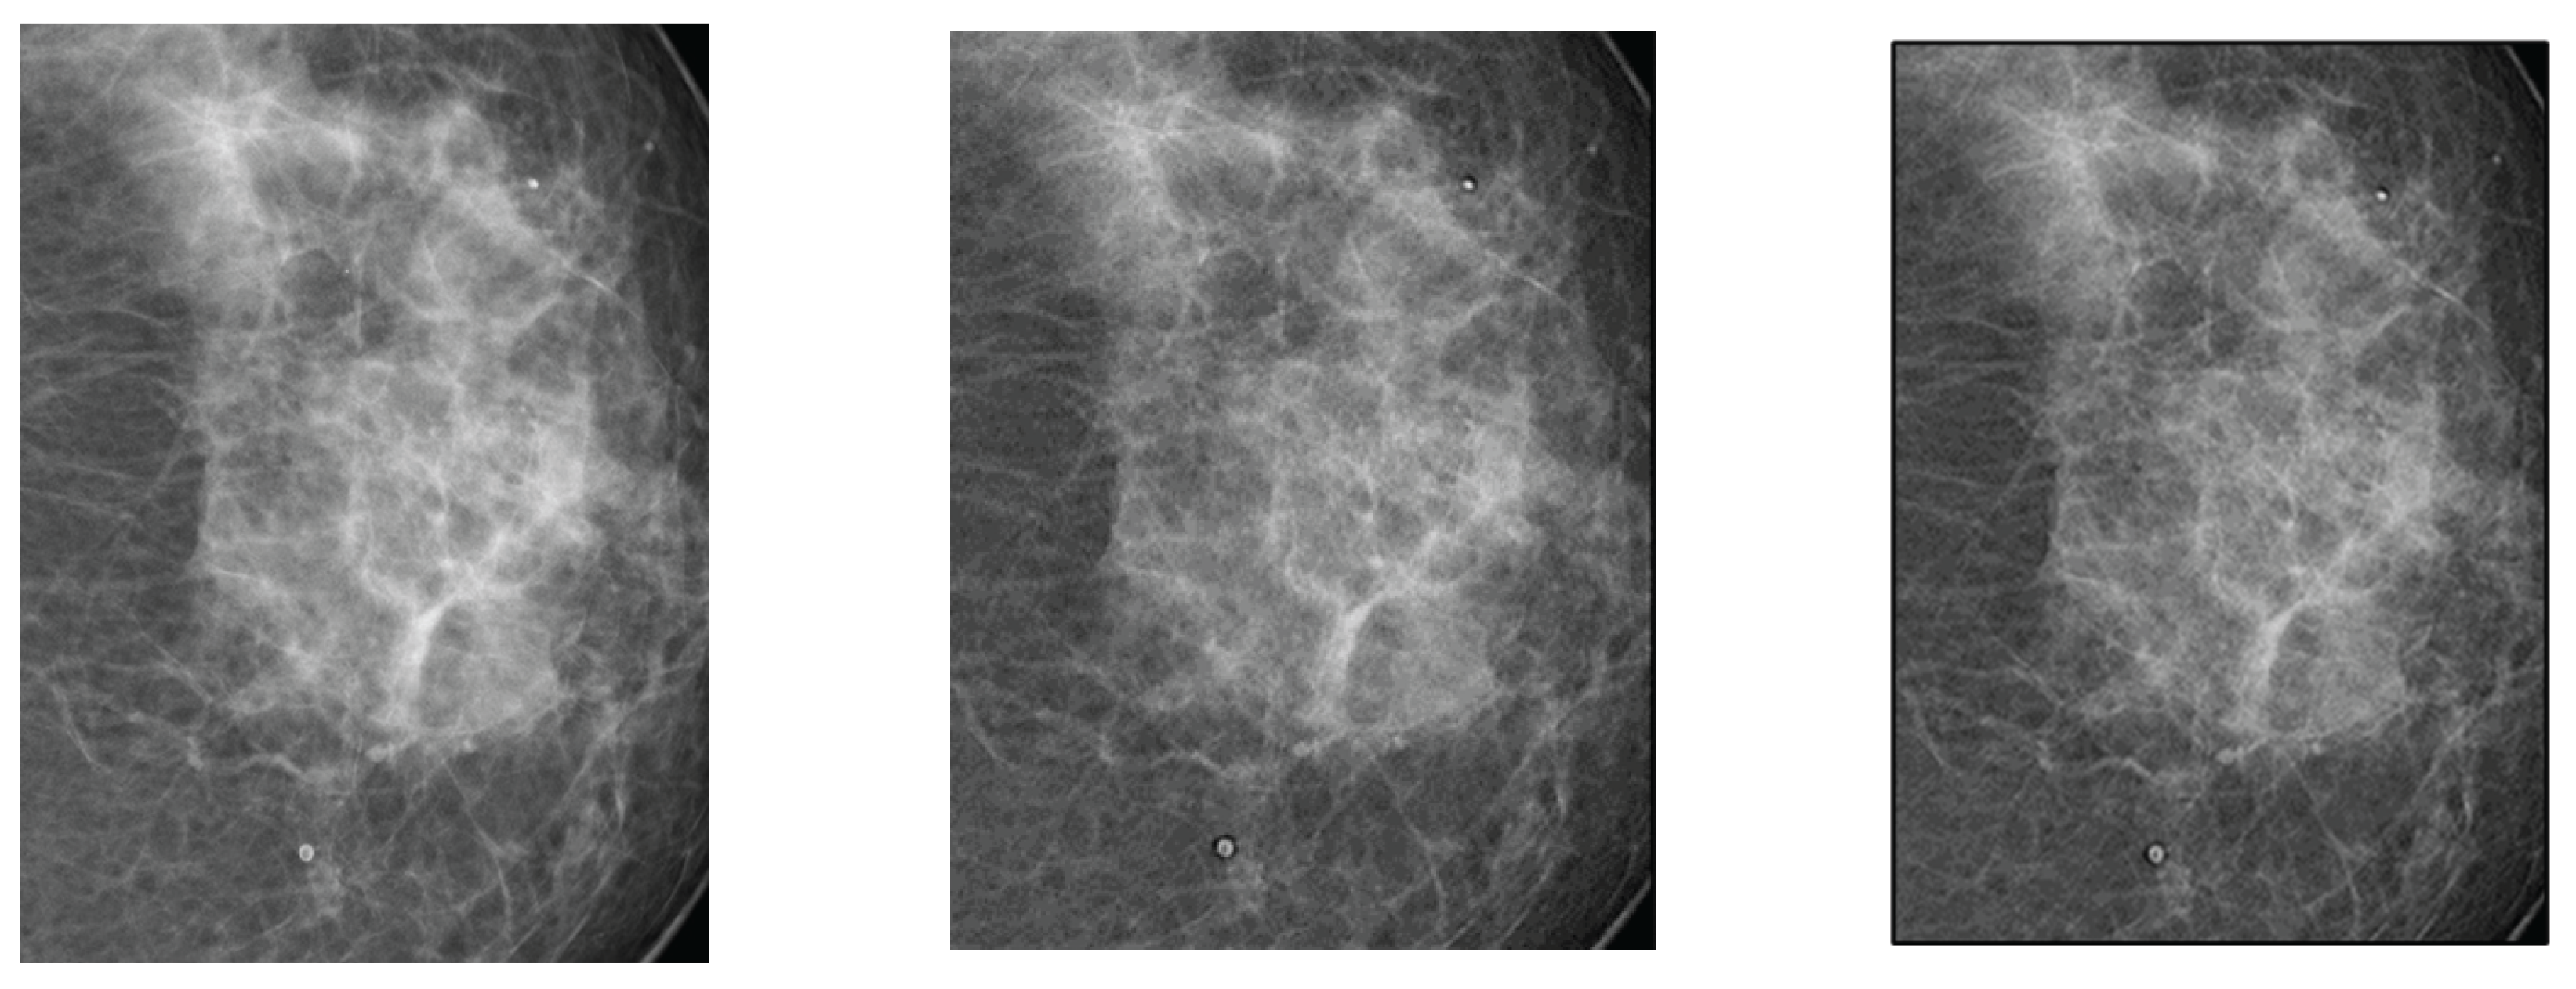
Figure 5.
Breast image contrast as a function of thickness d.
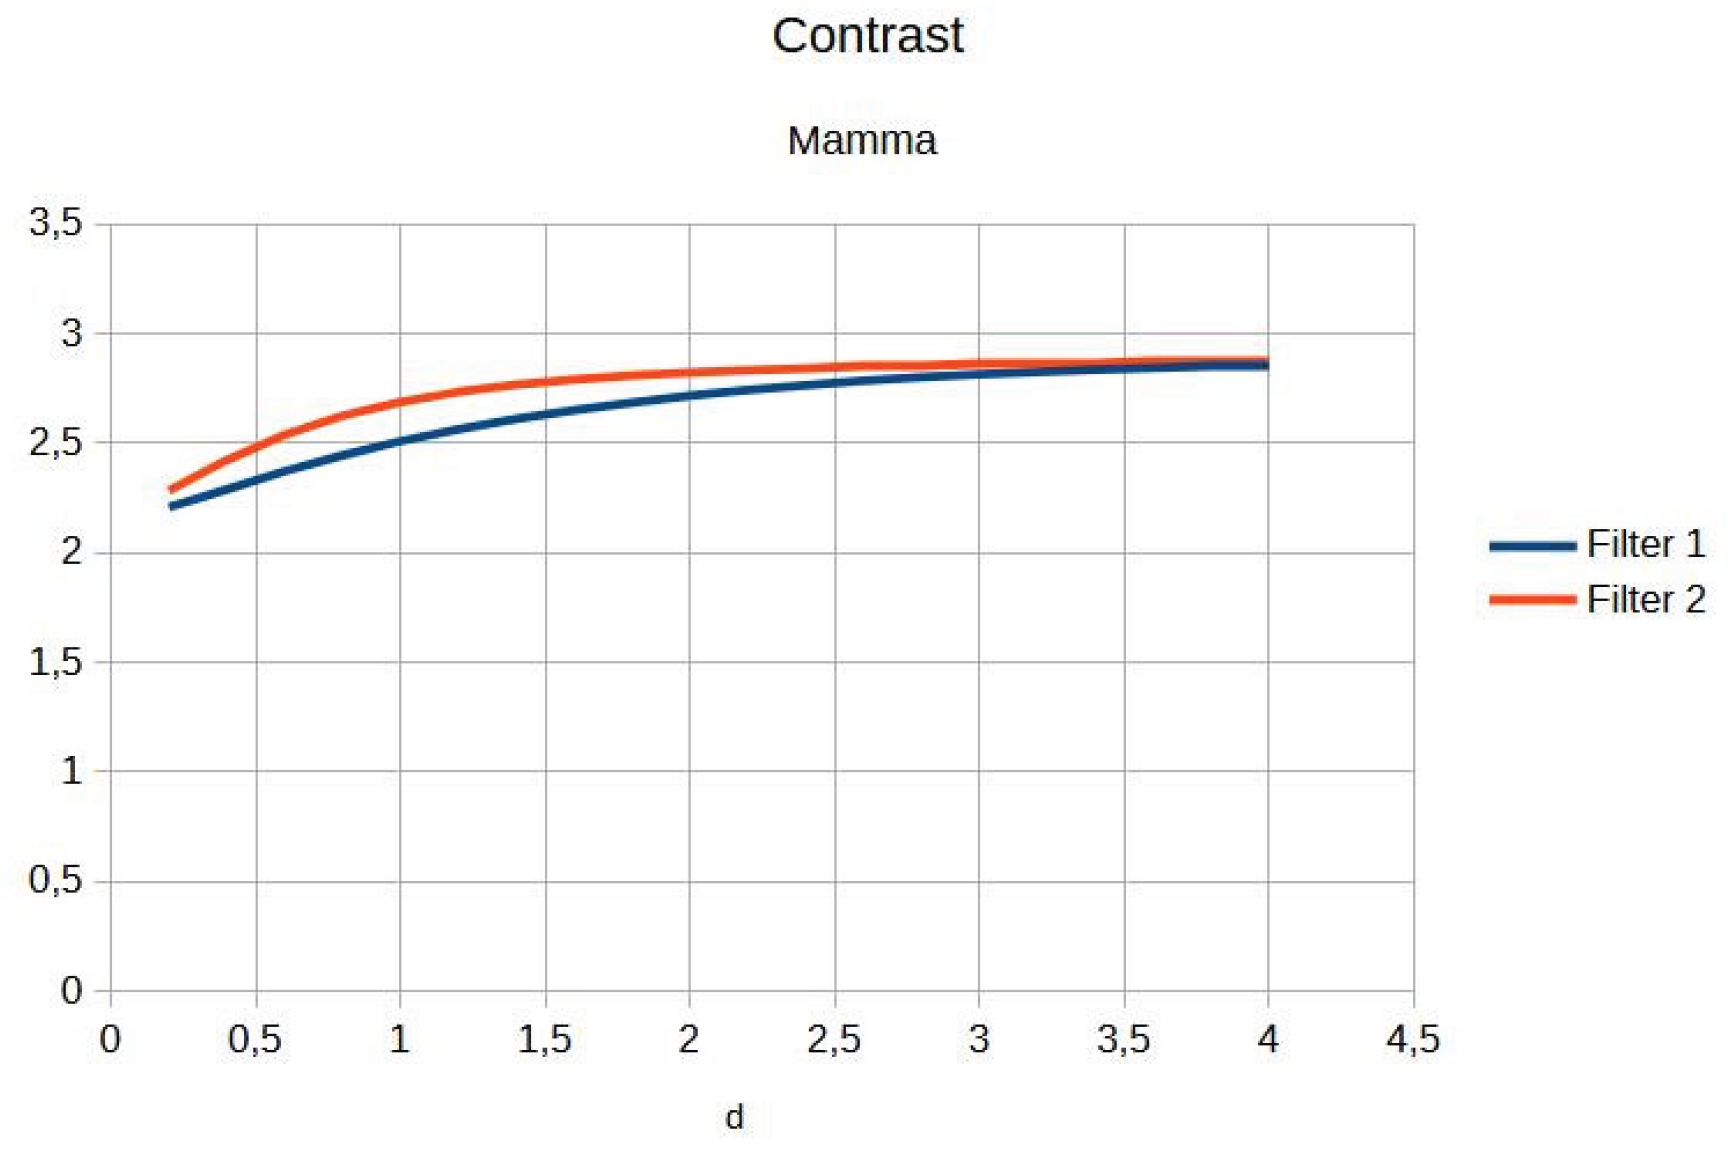
Figure 6.
Breast entropy according to each filter.
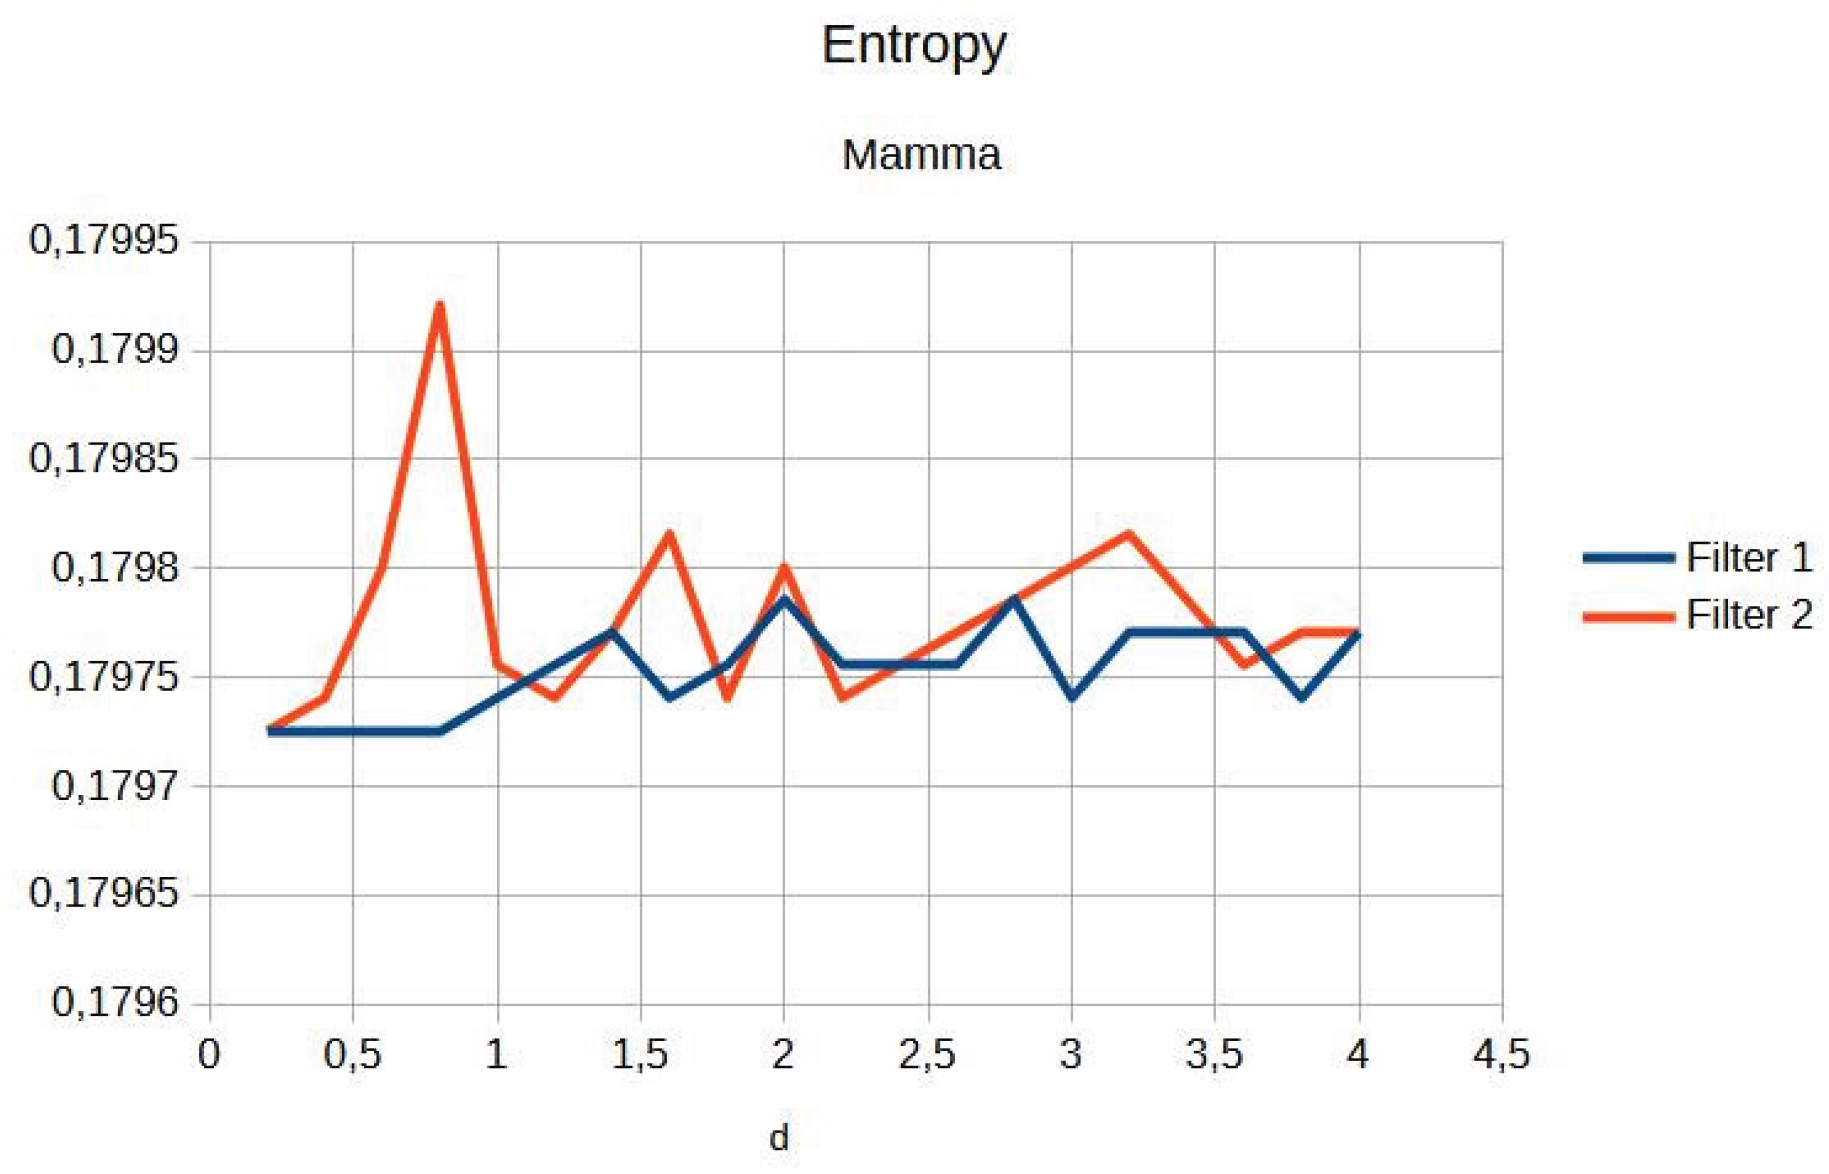
Figure 7.
Original image (a) obtained from the wrist for d=1.4, with filter 1 (b) and filter 2 (c).
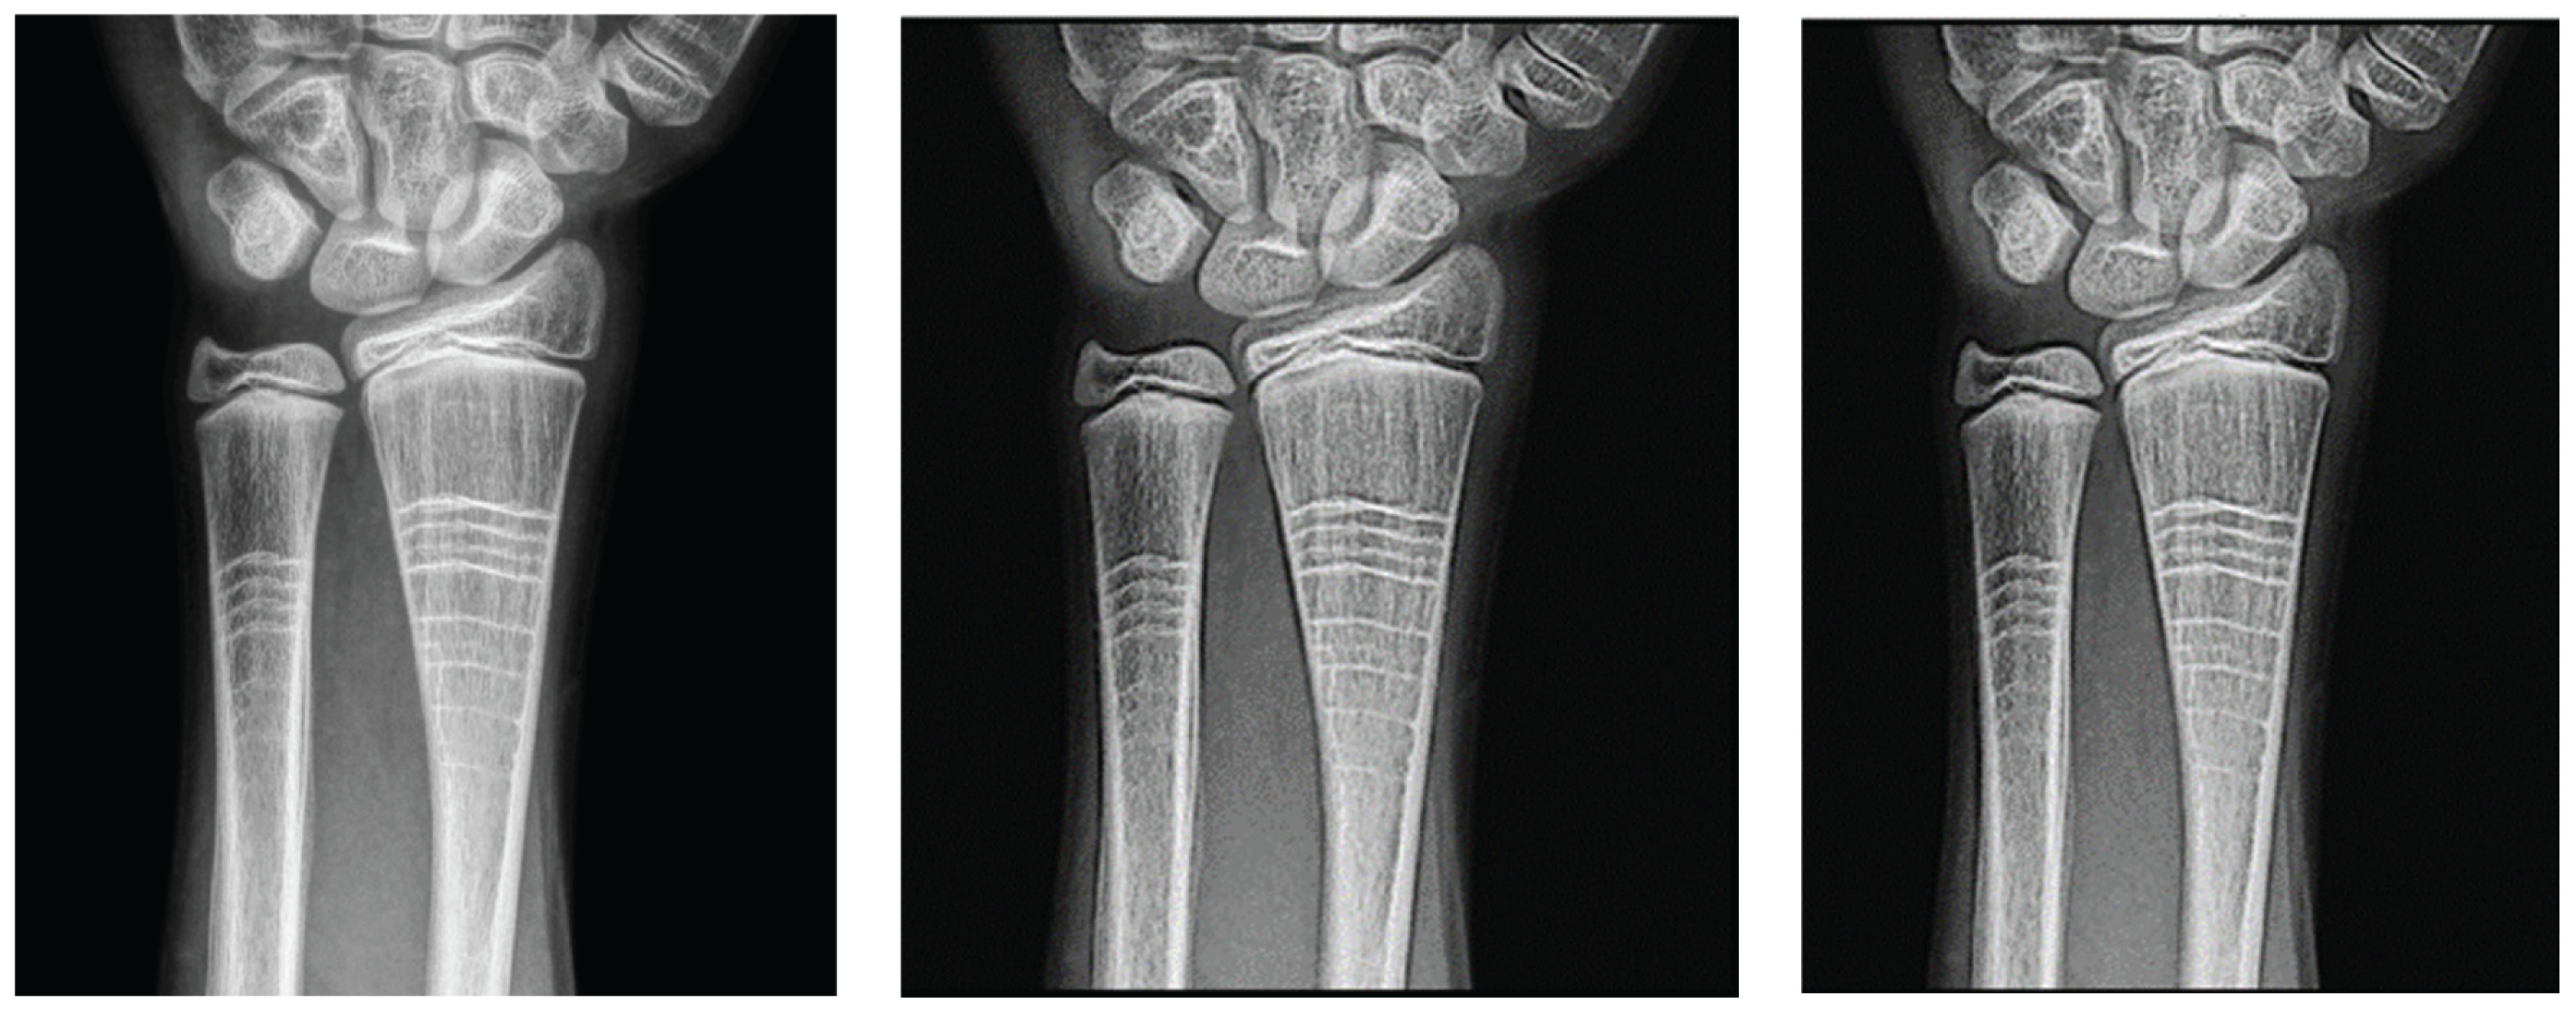
Figure 8.
Contrast of the wrist image as a function of d of the filters.
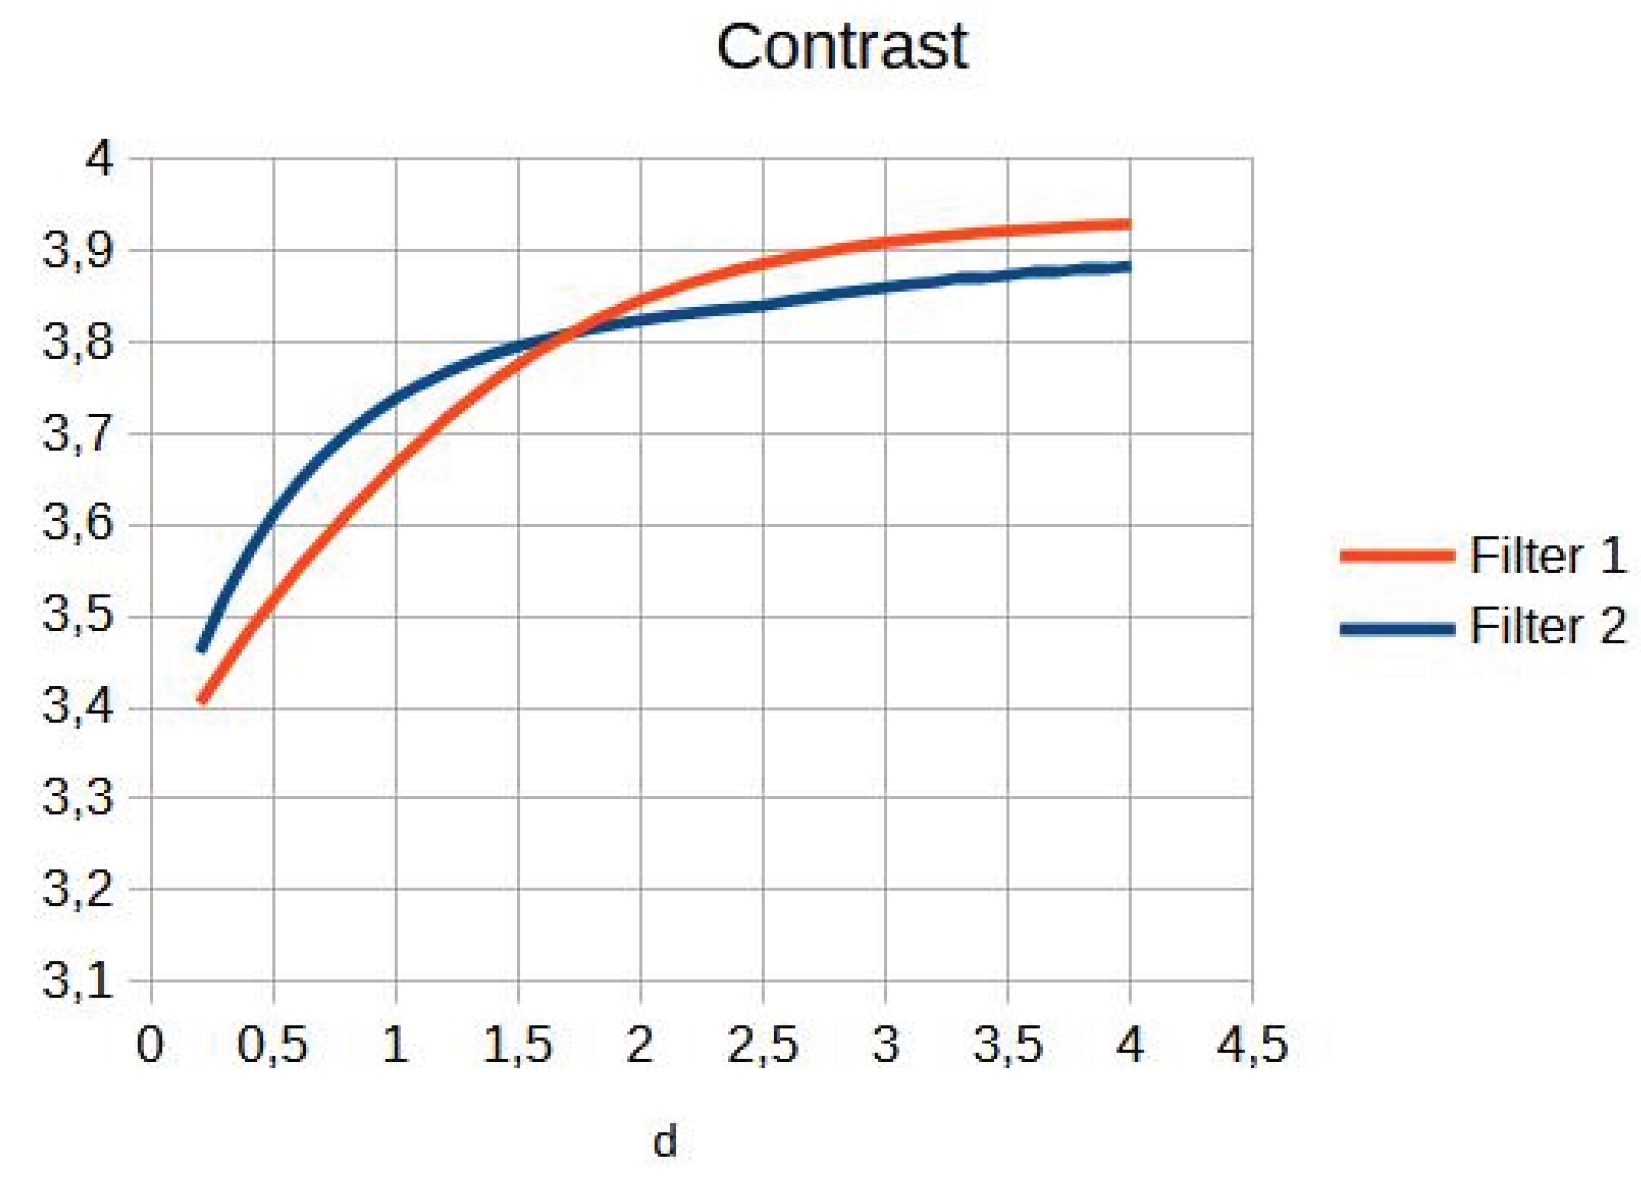
Figure 9.
Wrist entropy according to filters.
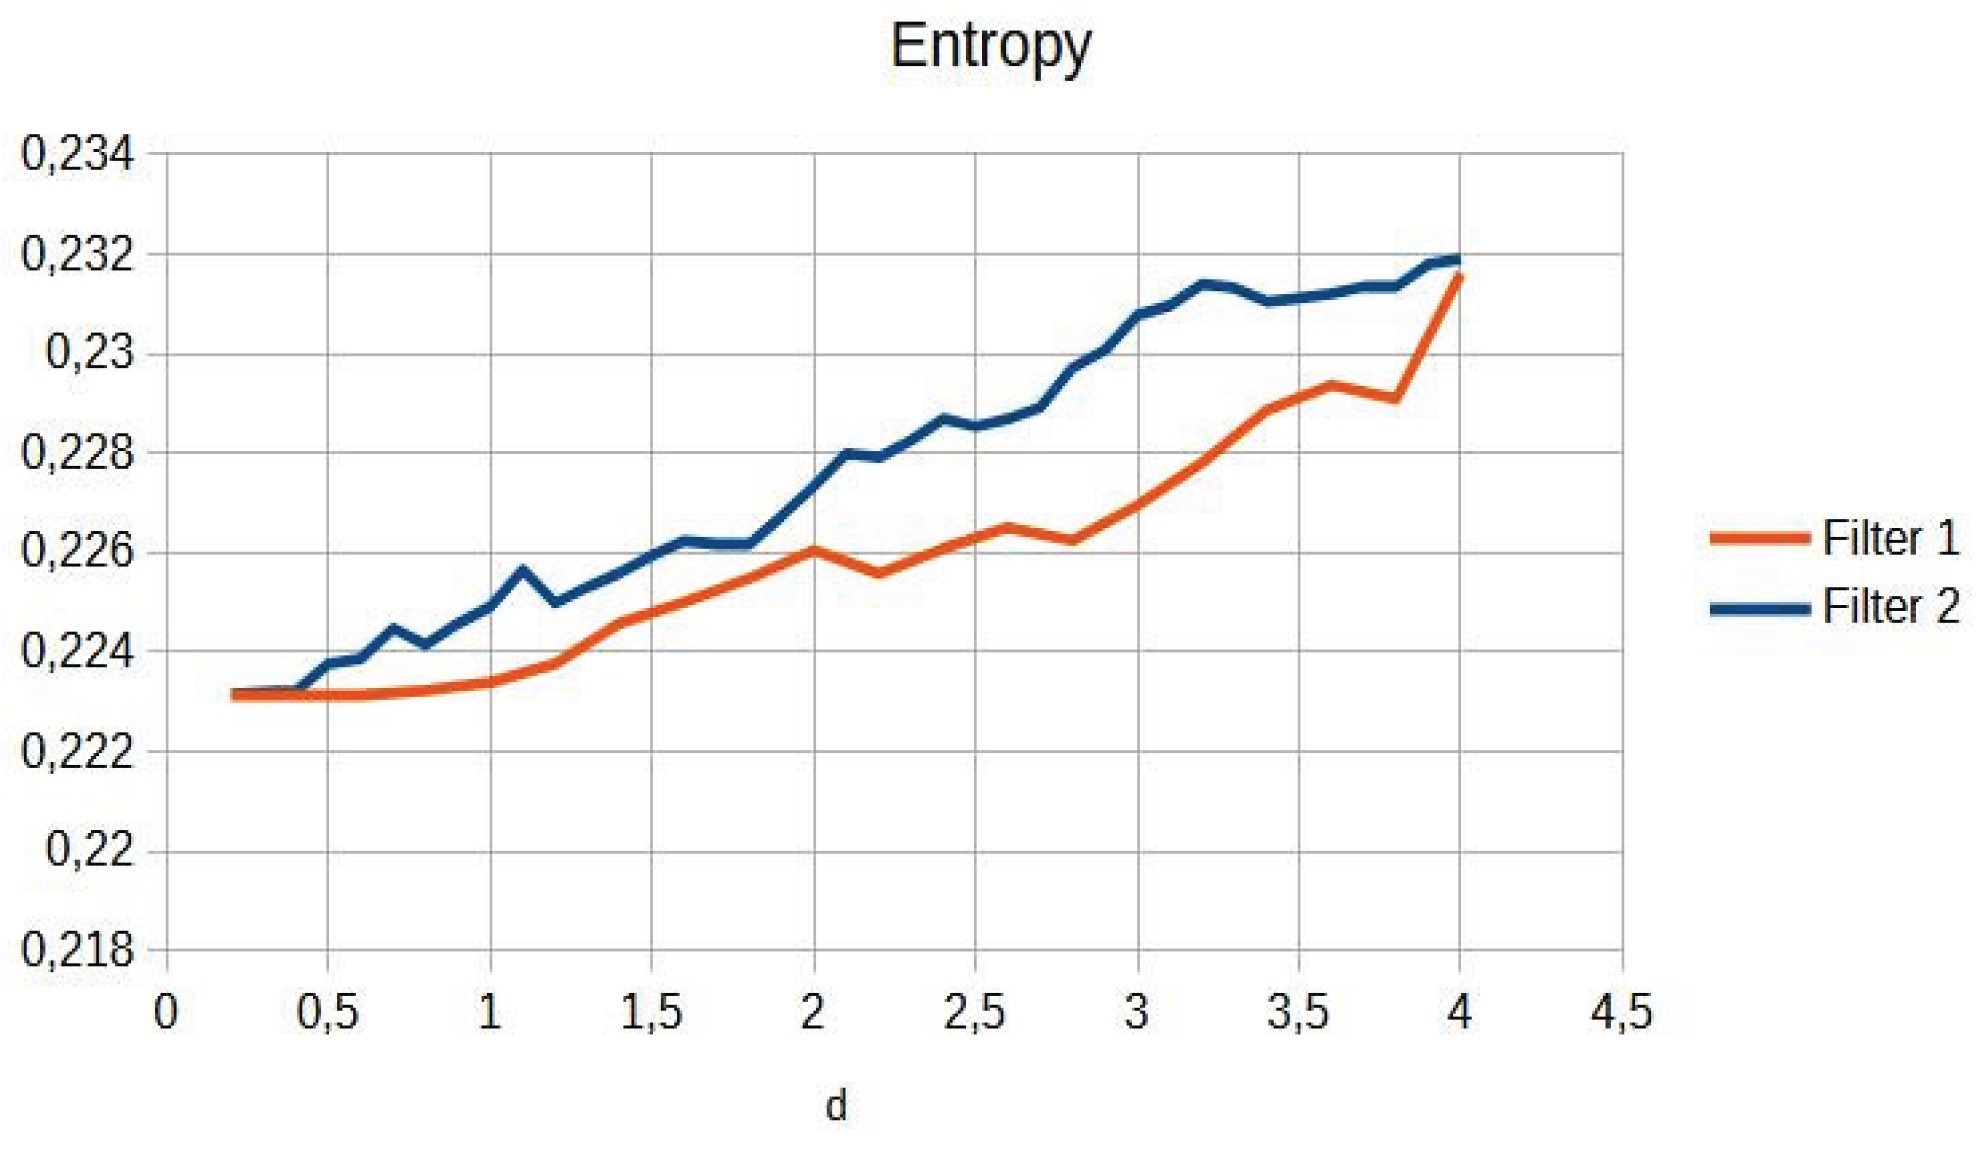
Figure 10.
Image ratings by expert physicians.
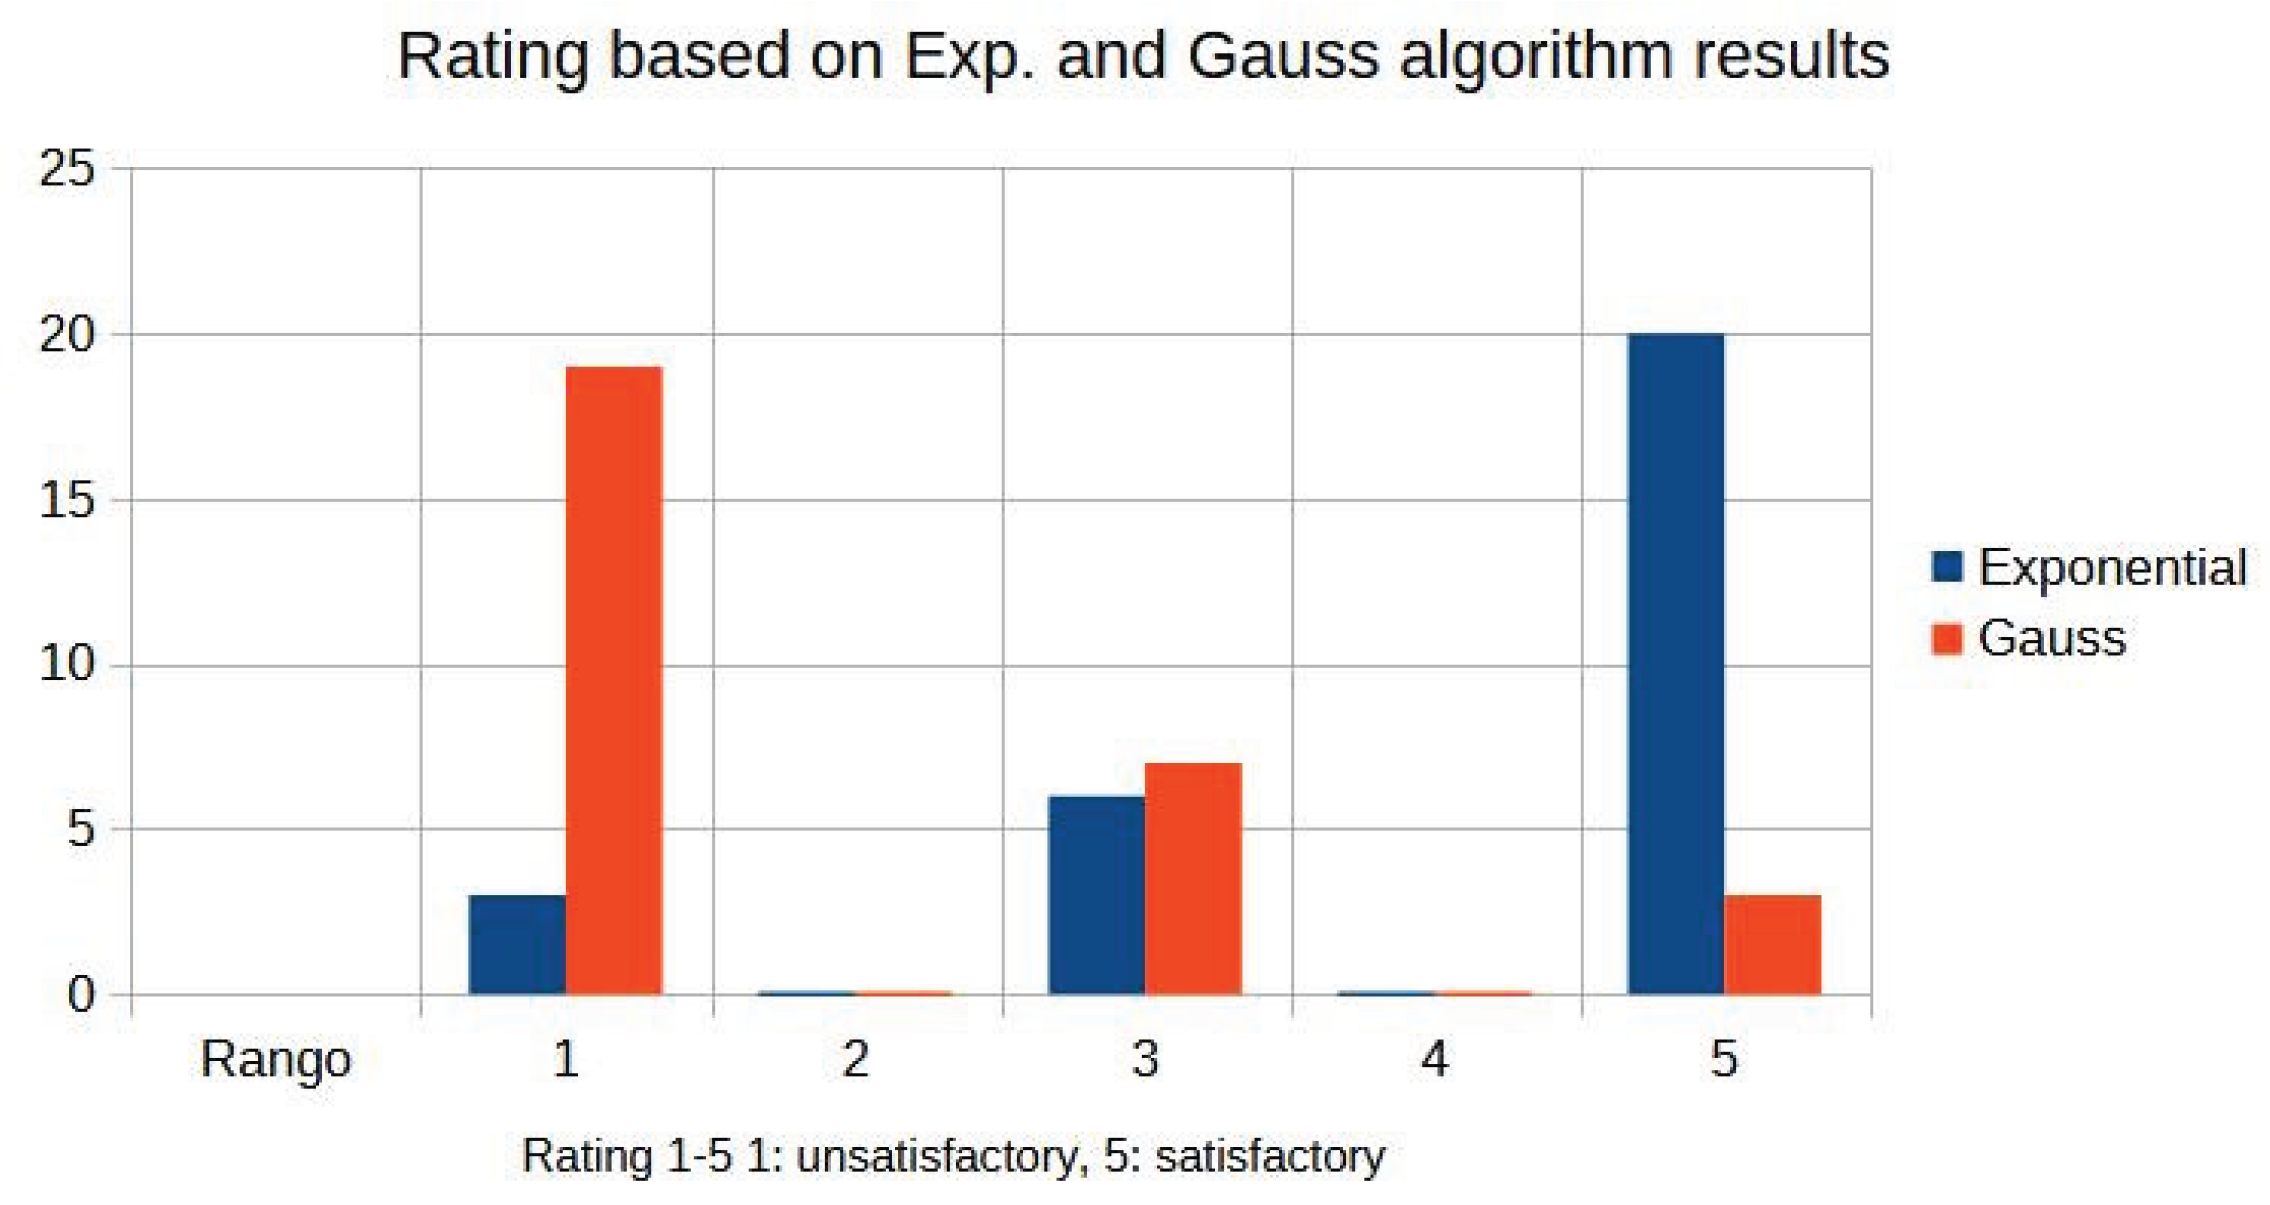
Figure 11.
Comparison of contrast behaviour as a function of d.
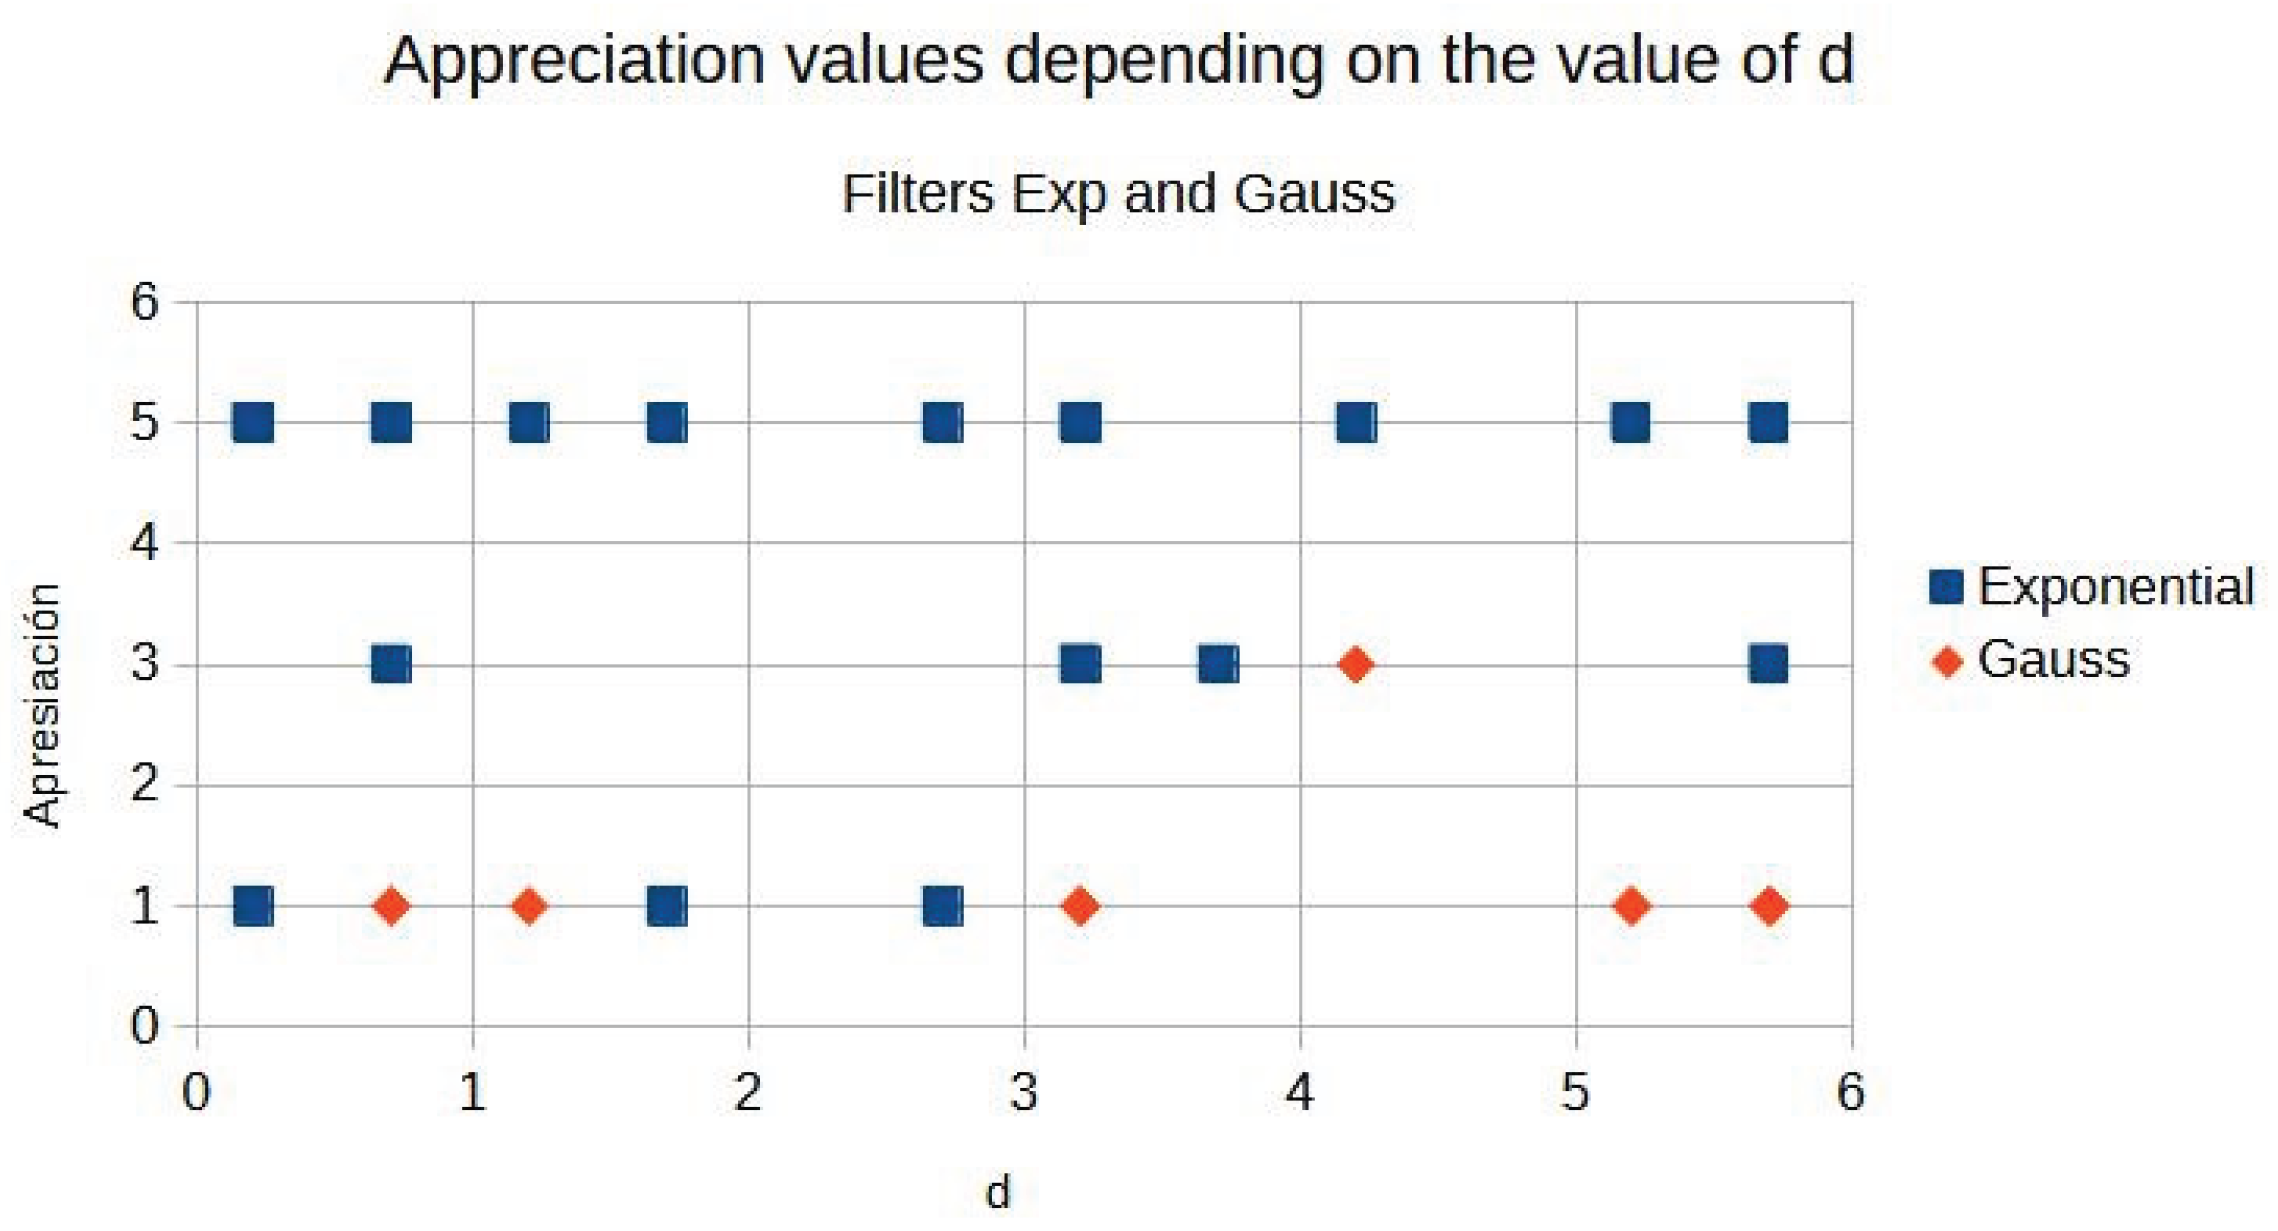
Figure 12.
0004001 image contrast.
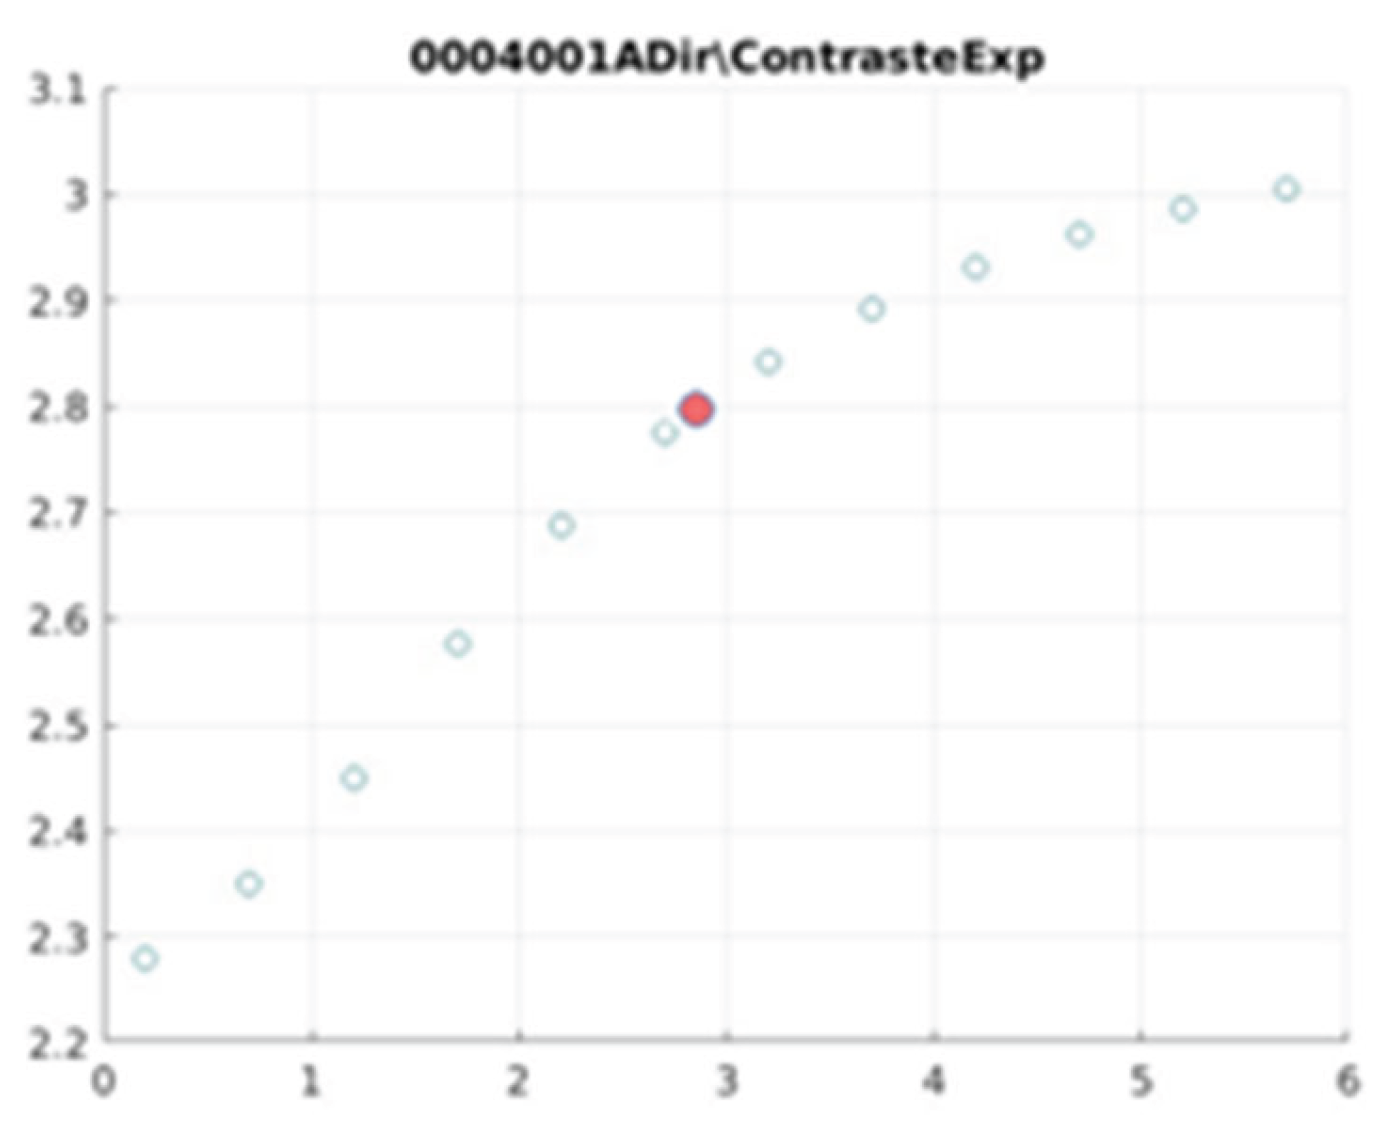
Figure 13.
0005002 image contrast.
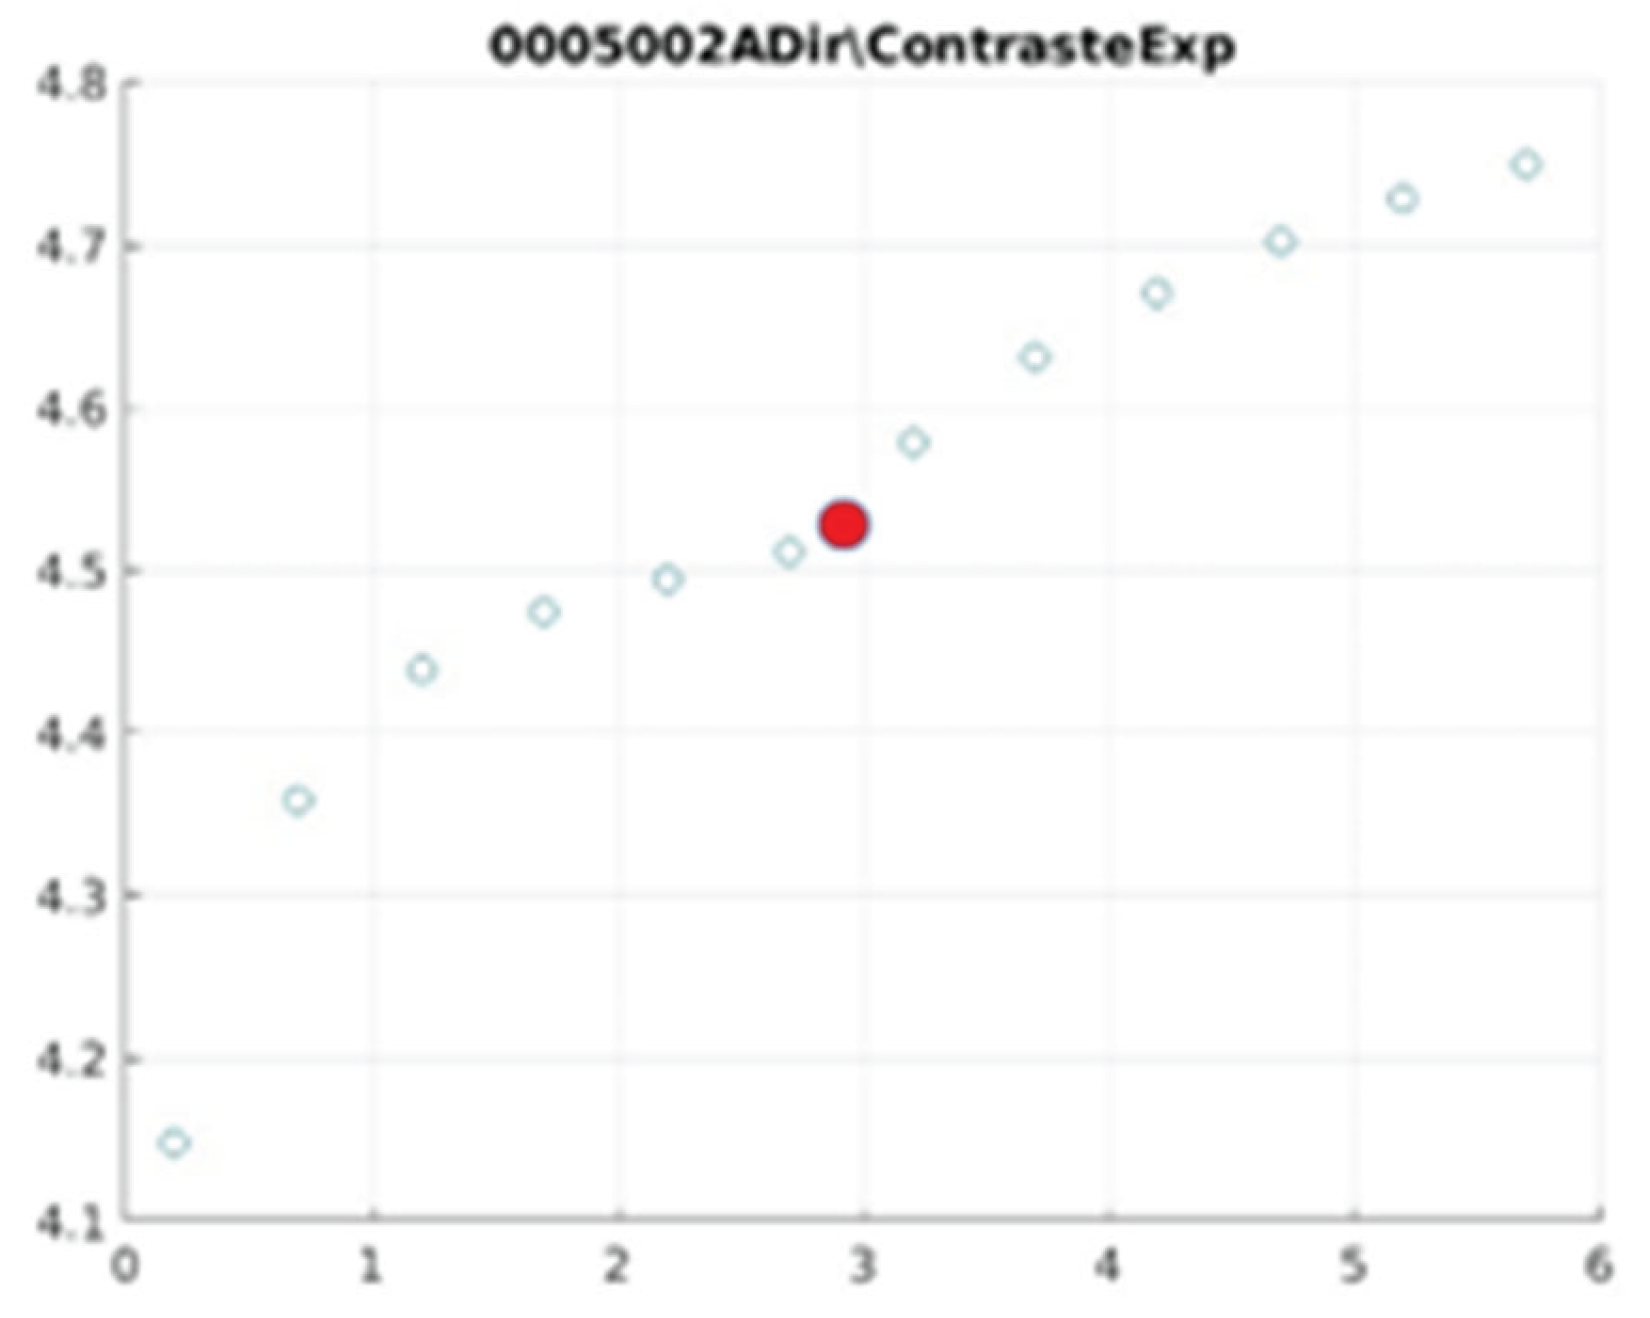
Figure 14.
0007001 image contrast.
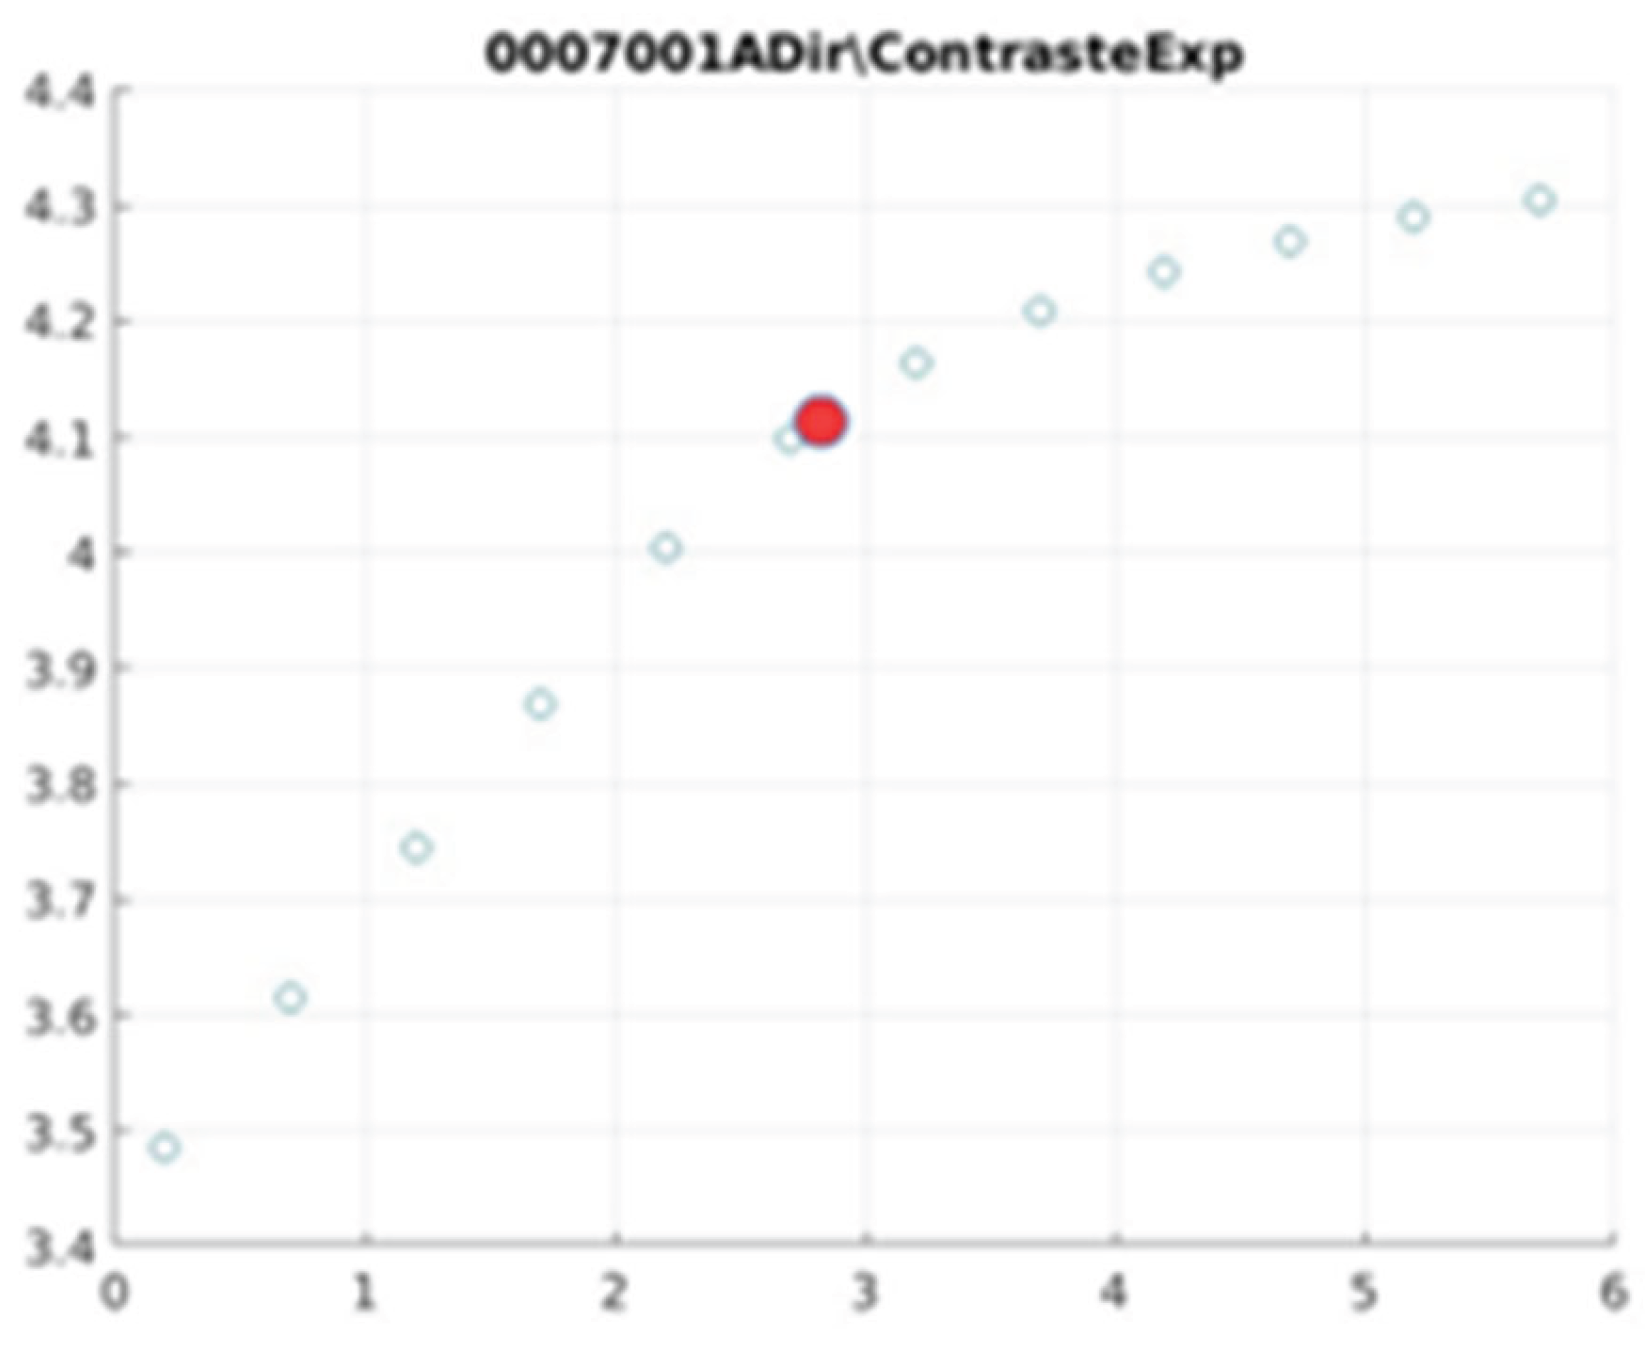
Figure 15.
0006006 image contrast.
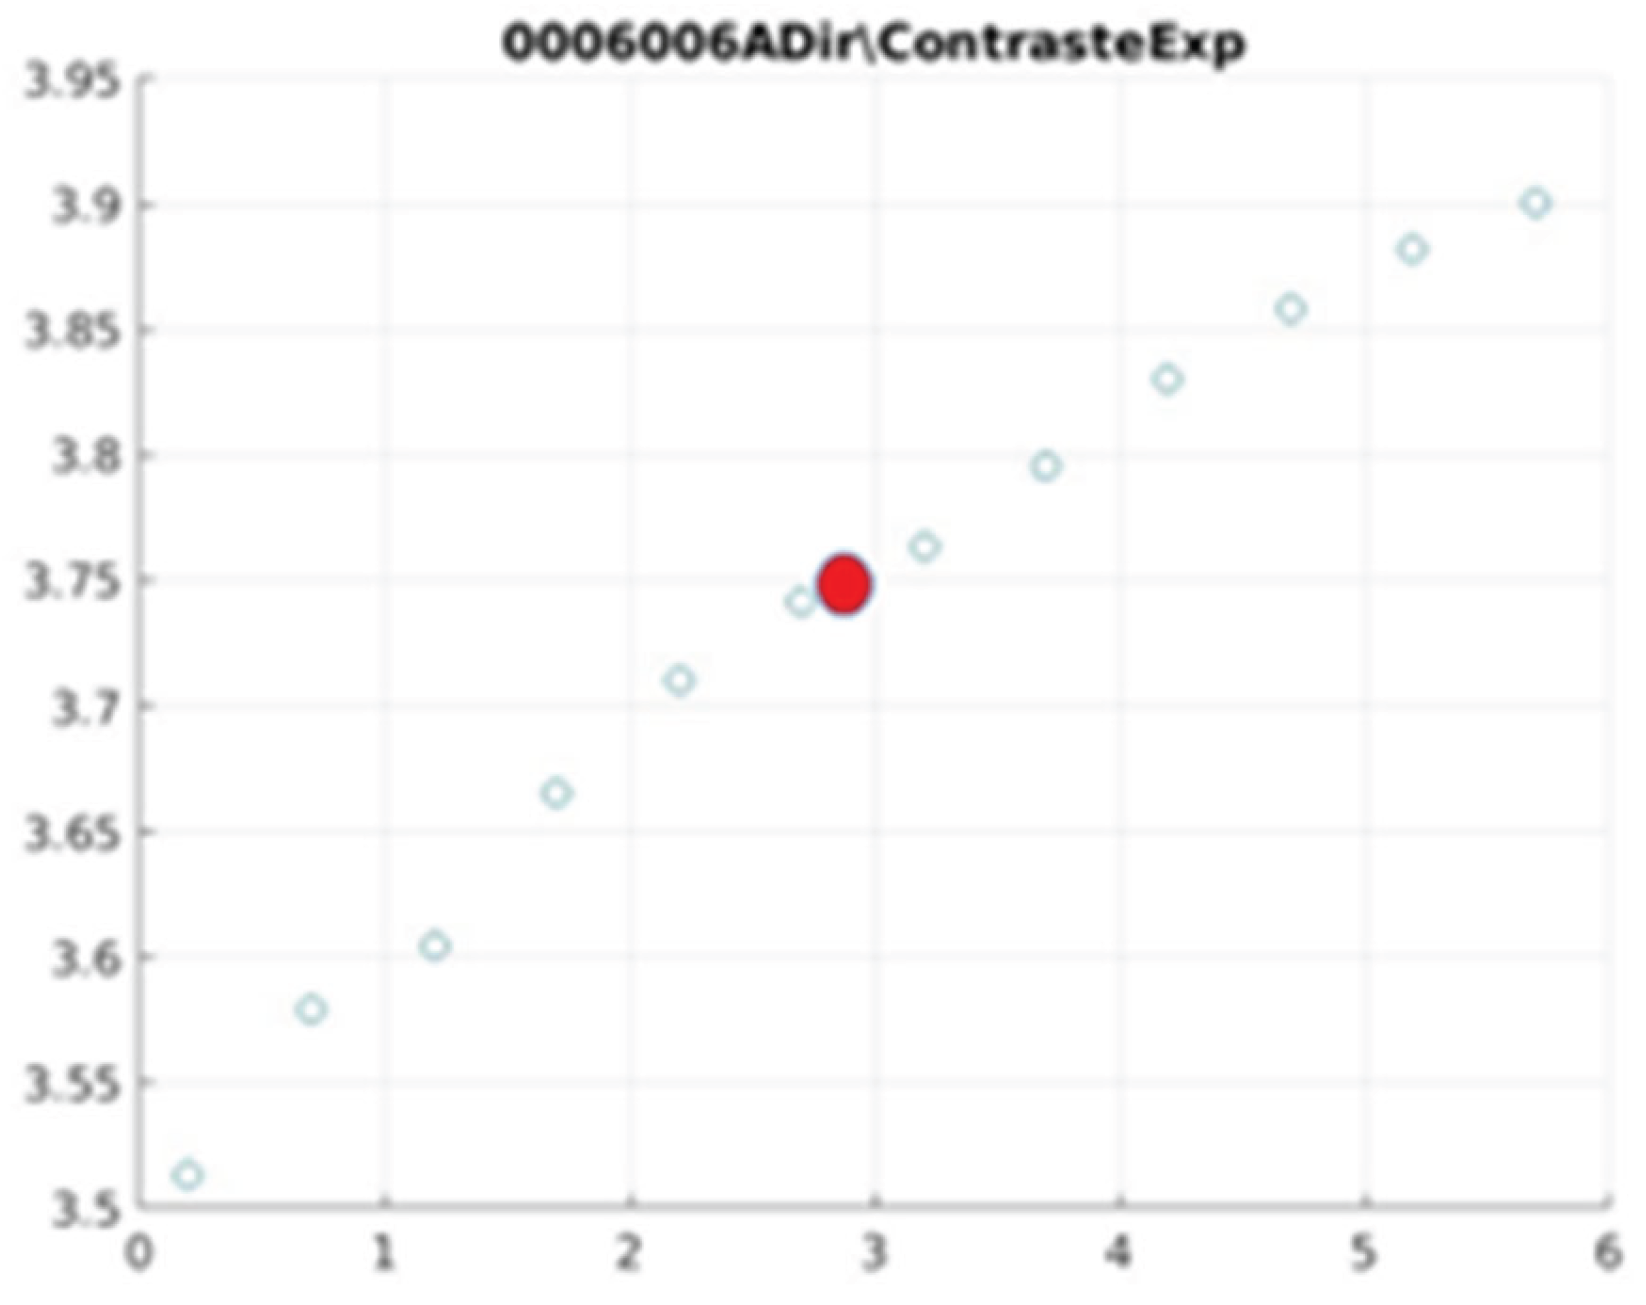
Figure 16.
0008001 image contrast.
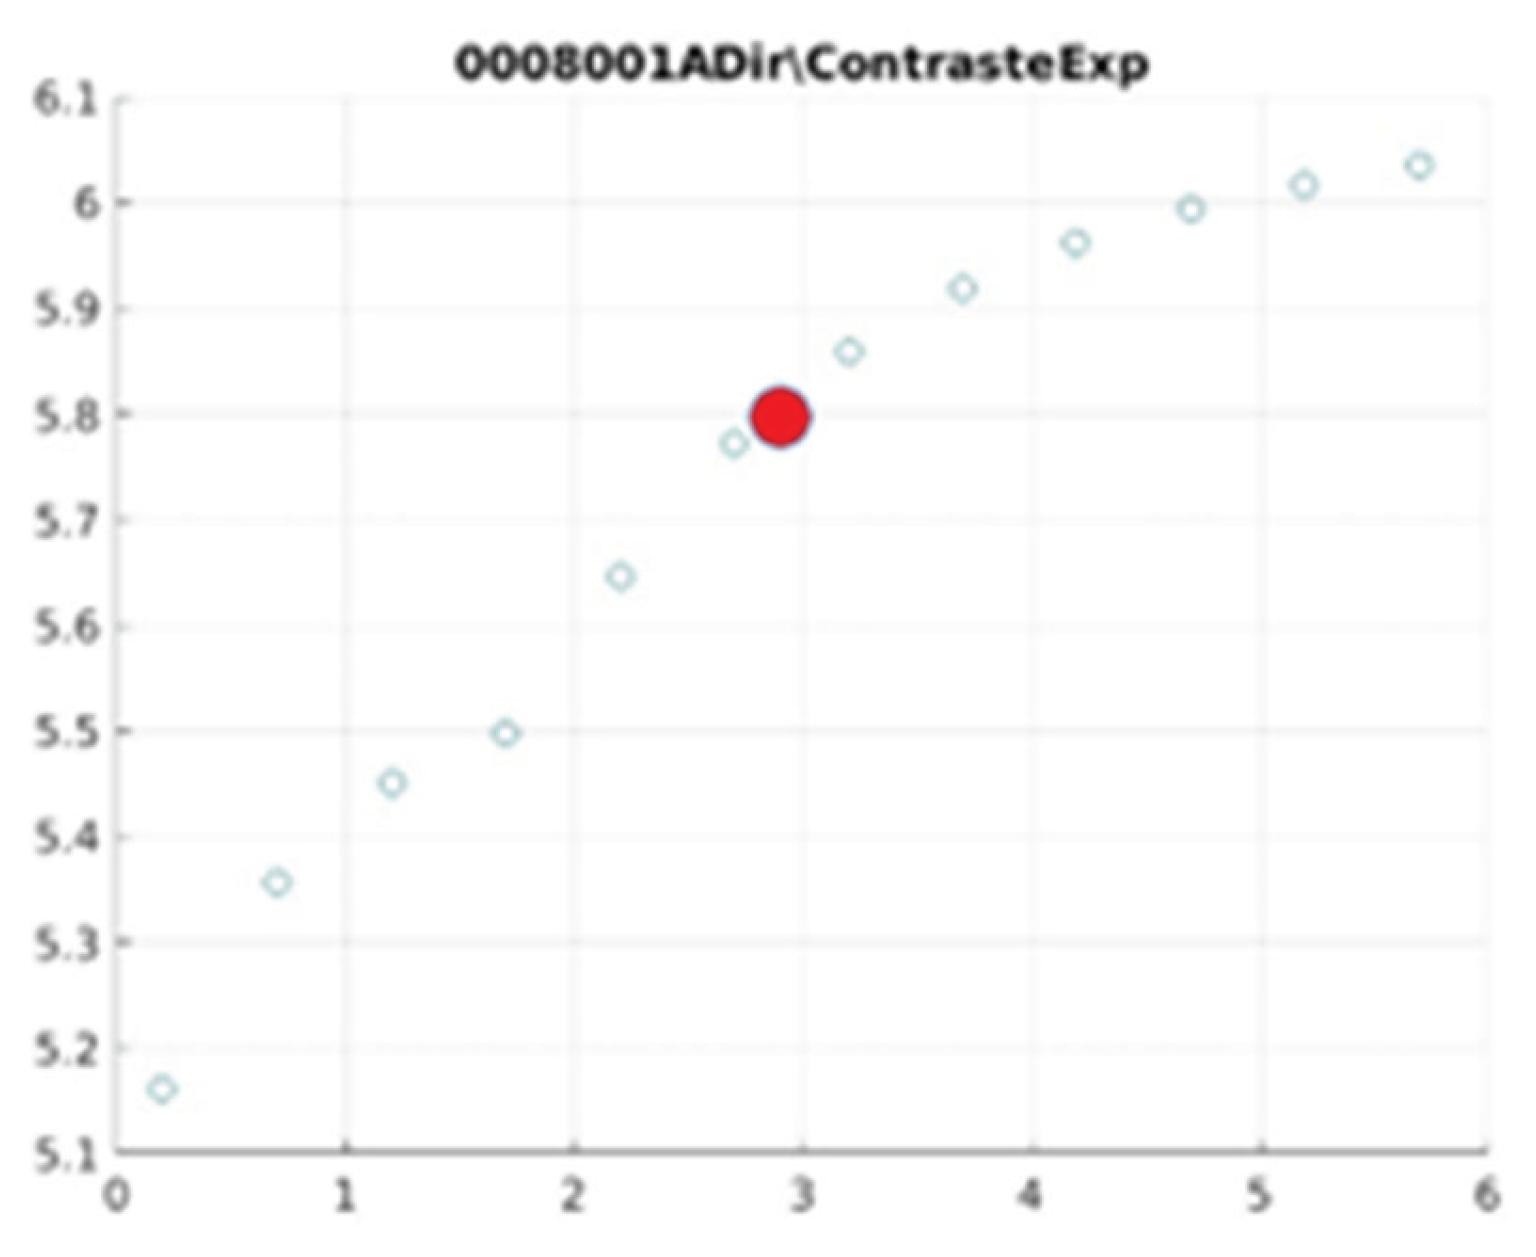
Figure 17.
0008004 image contrast.
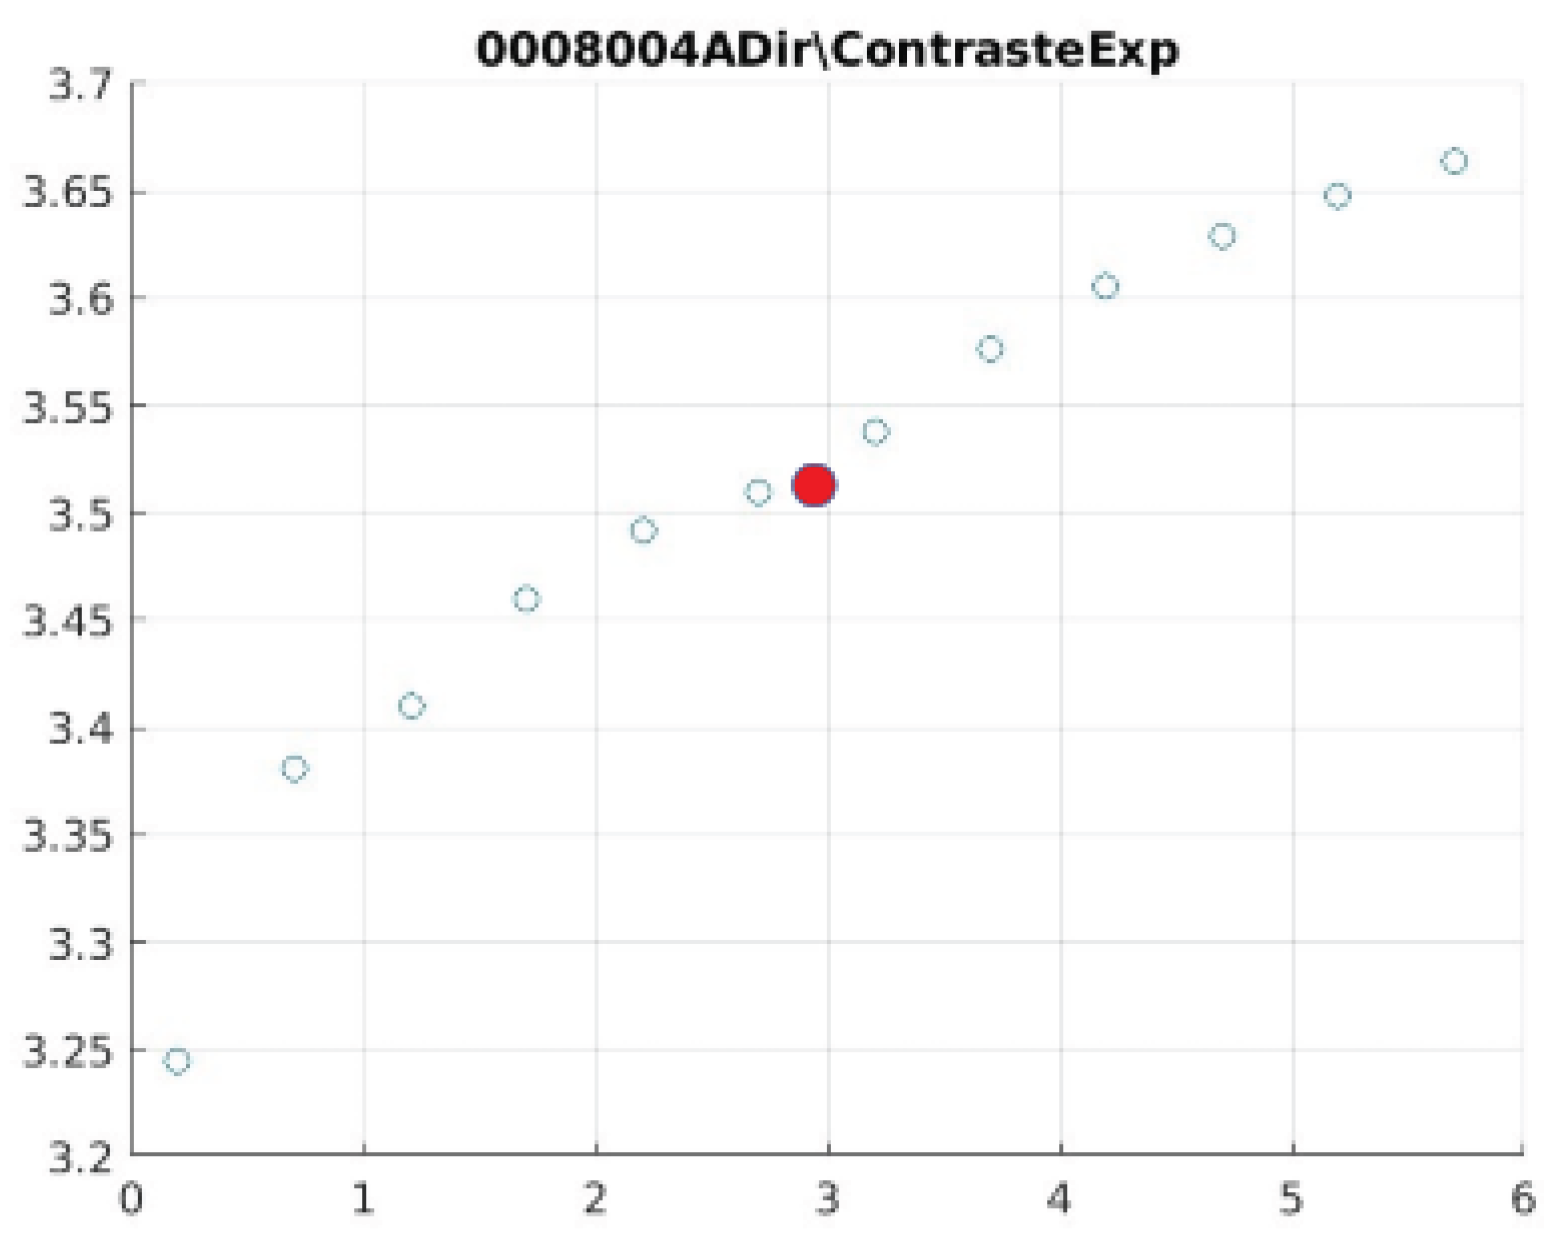
Figure 18.
0008007 image contrast.
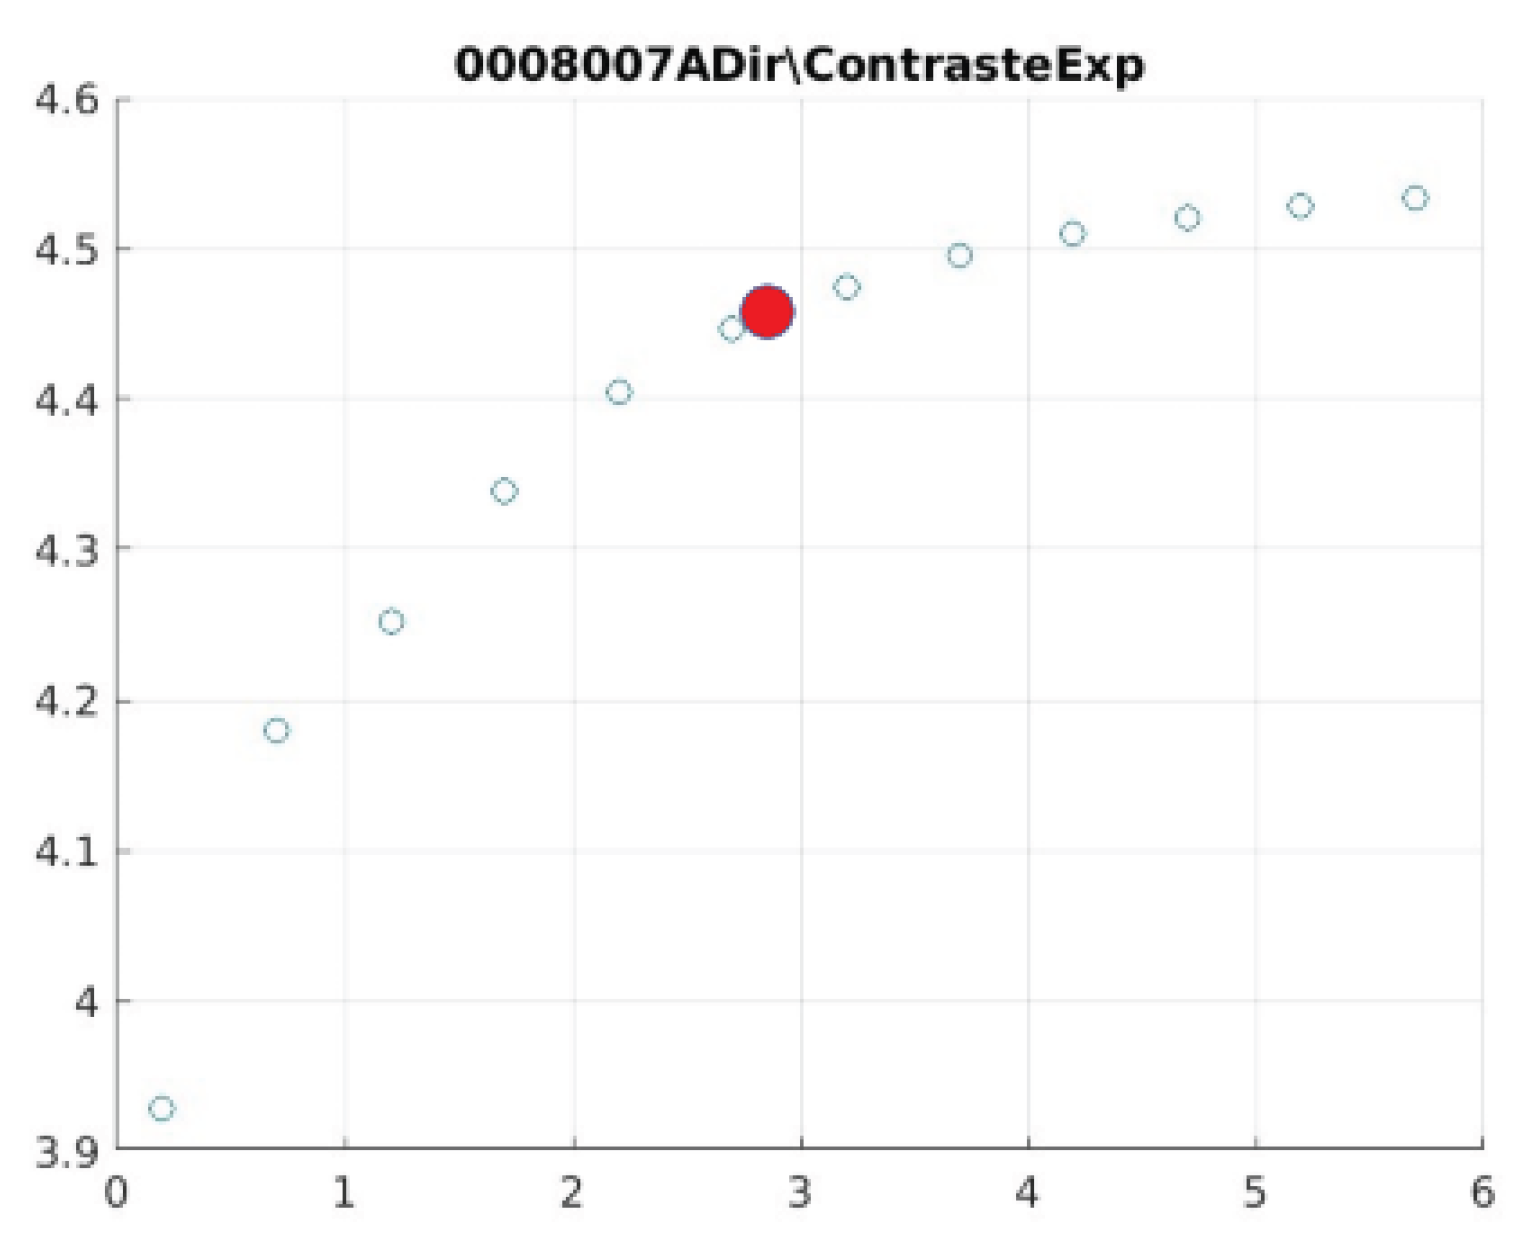
Figure 19.
0009001 image contrast.
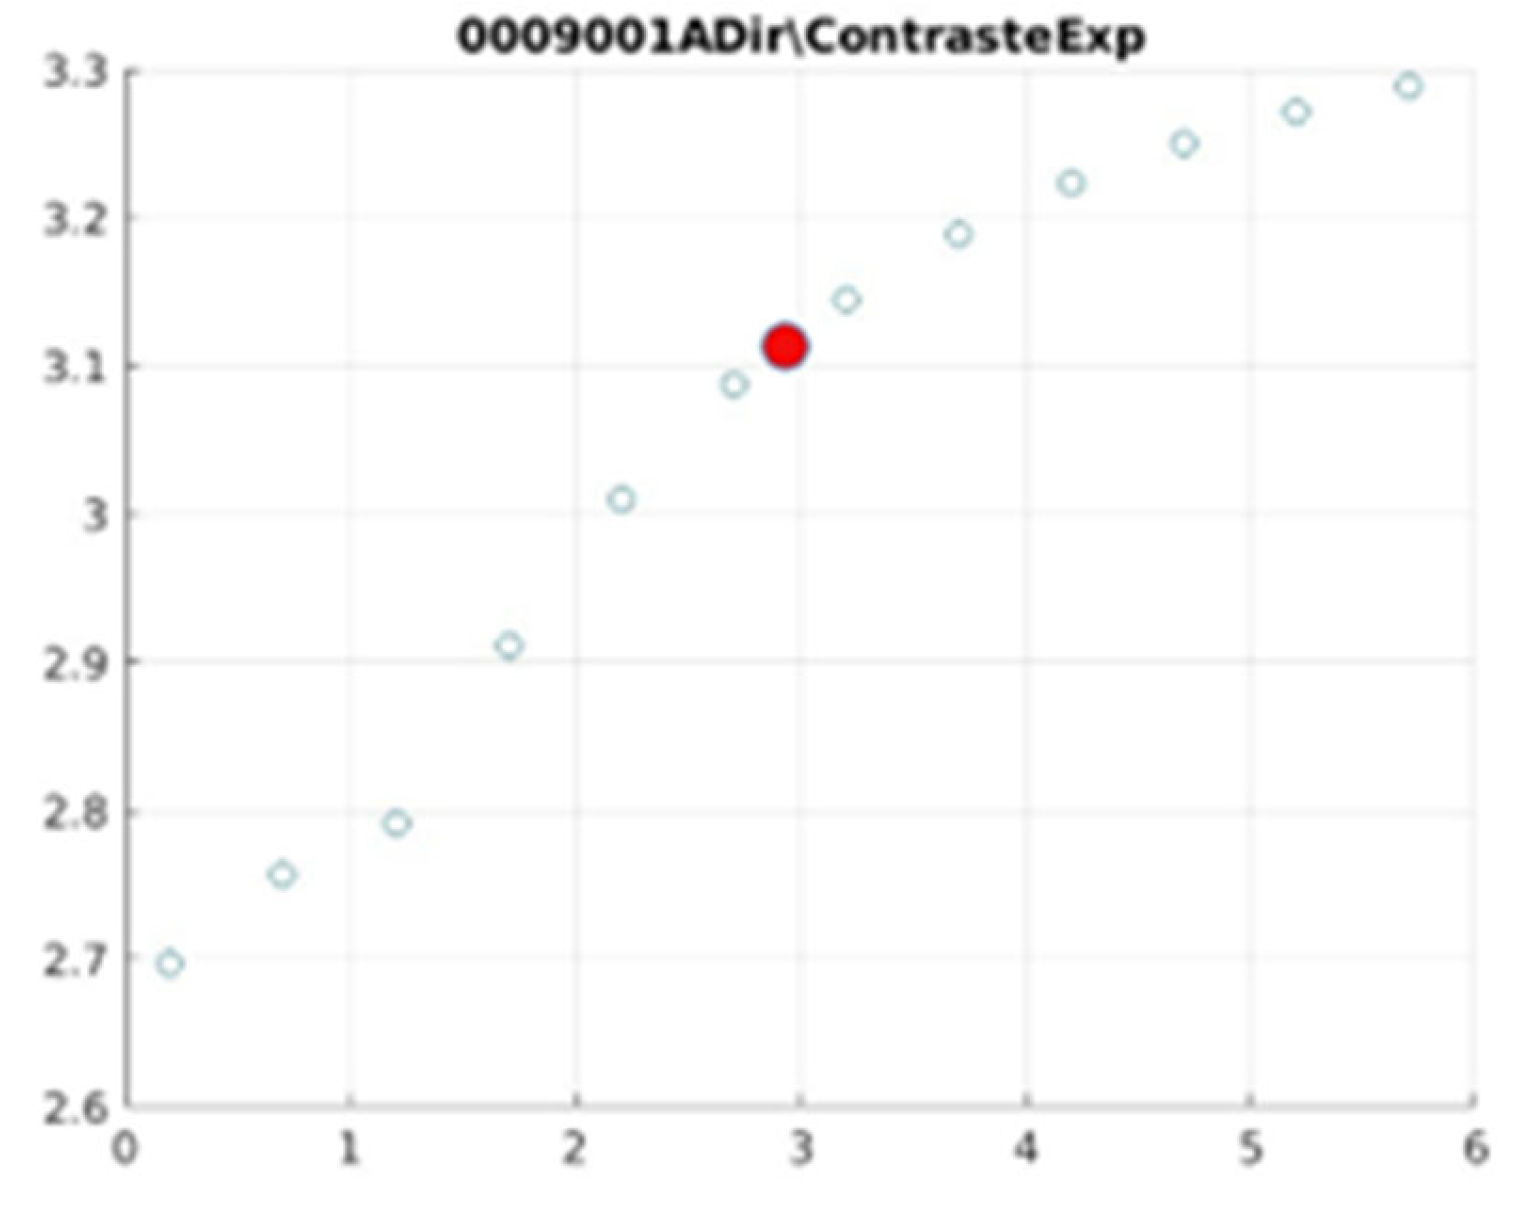
Figure 20.
000 image contrast.
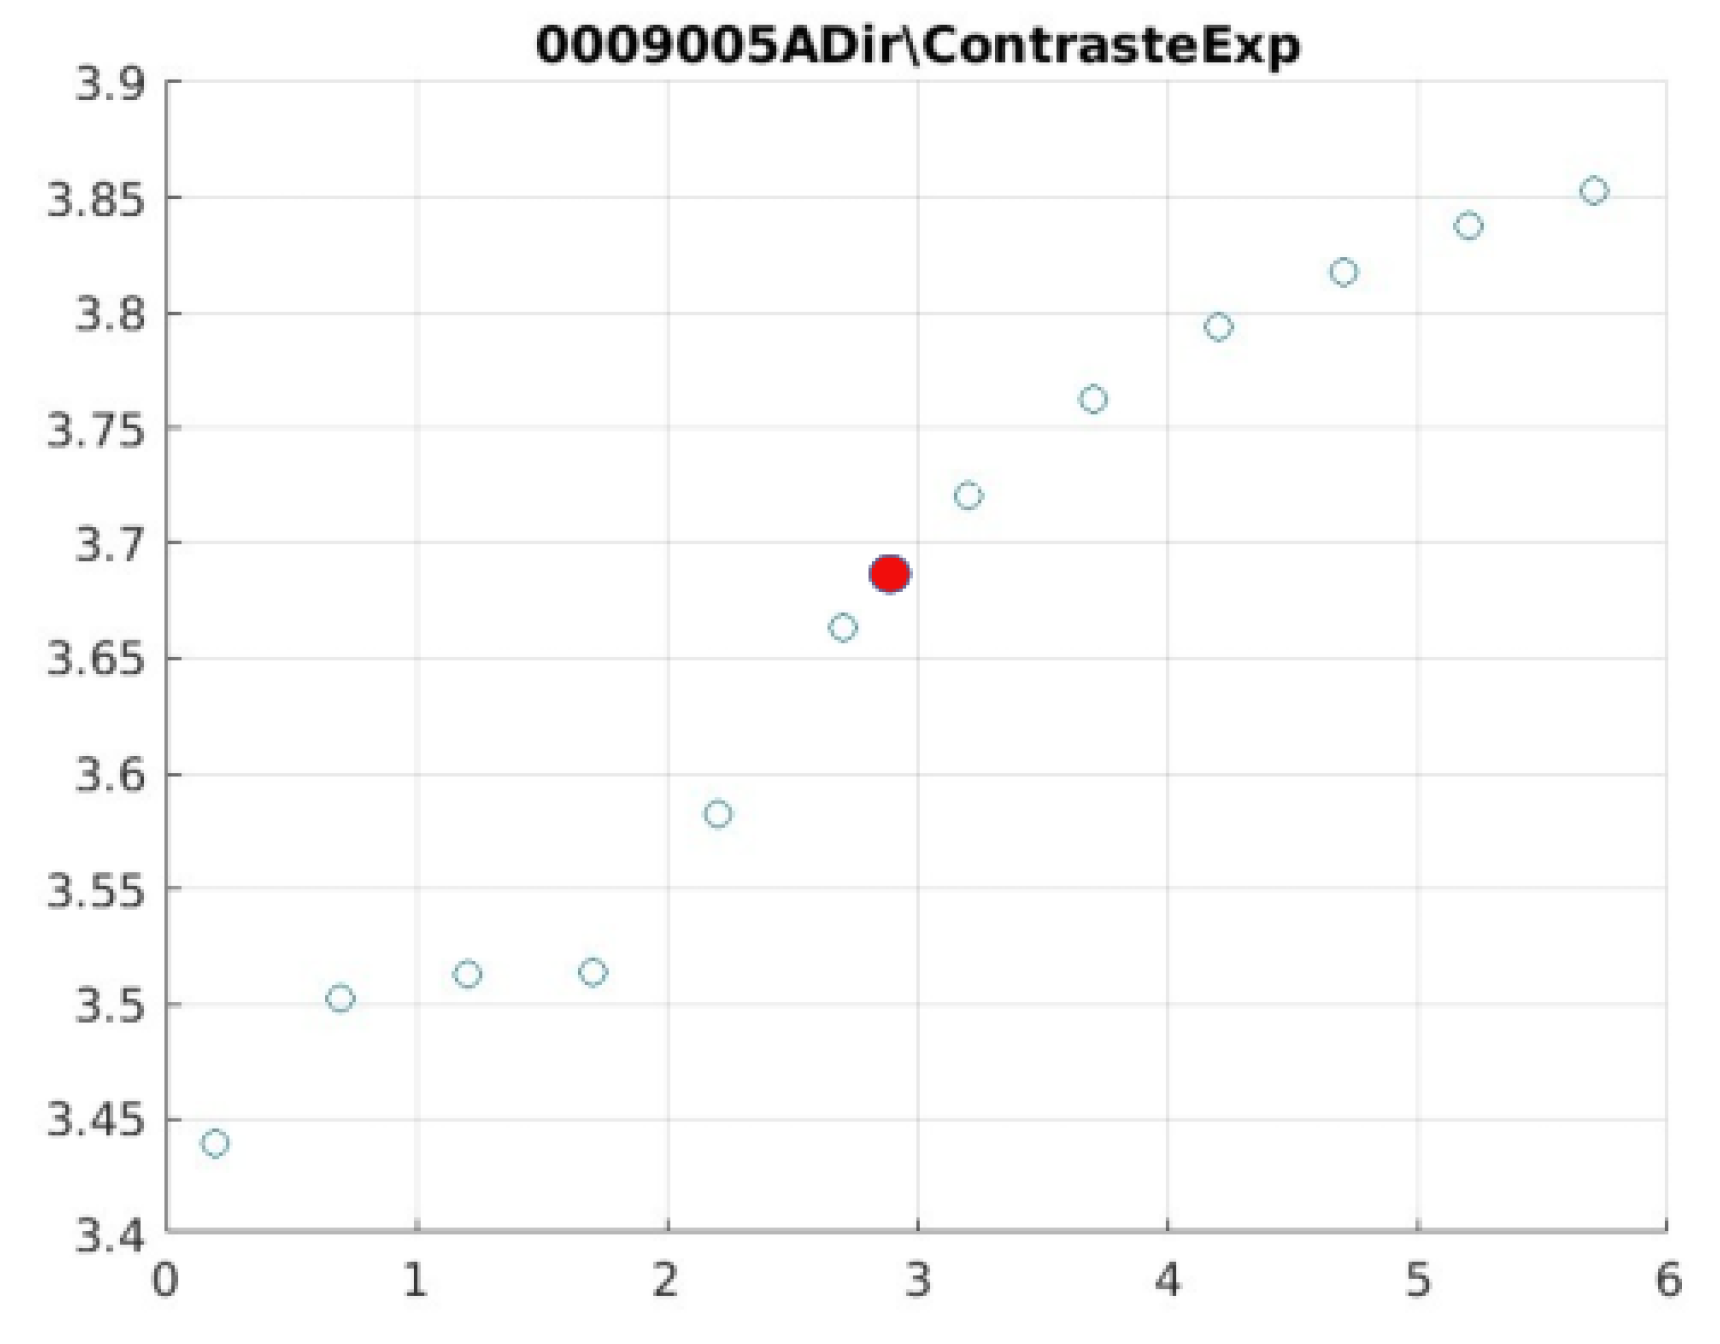
Figure 21.
0006002 image contrast.
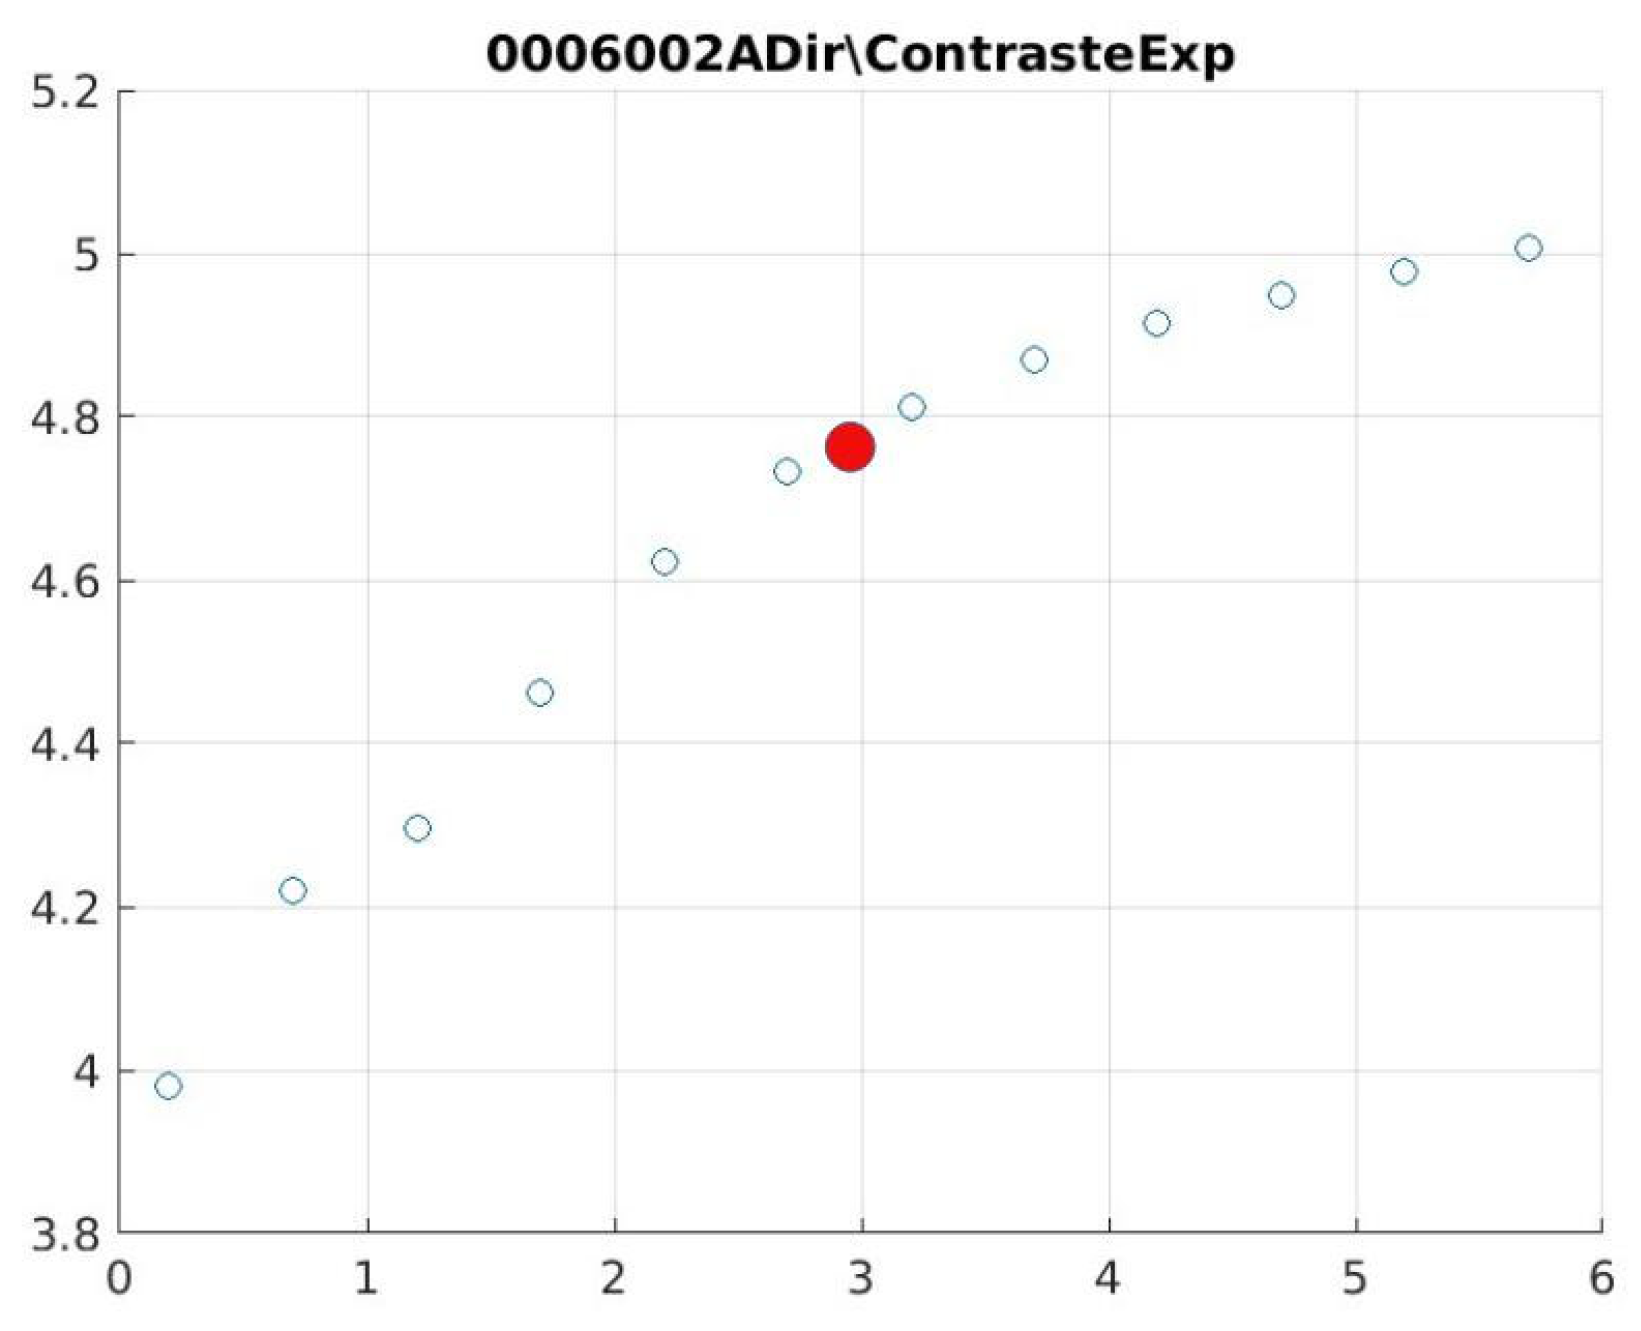
Table 1.
Contrast and entropy for different values of d in the knee image.
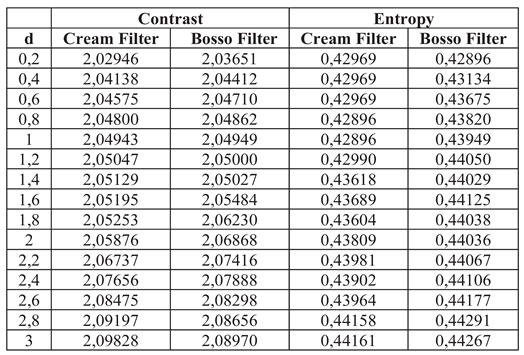
Table 2.
Contrast and entropy for the breast image with different d values.
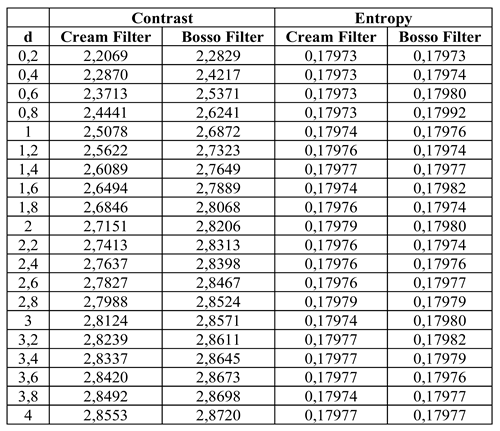
Table 3.
Contrast and entropy for the doll image with different values of d.
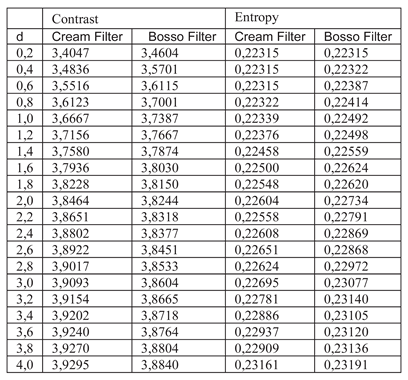
Table 4.
Expert ratings for Exponential and Gaussian filters.
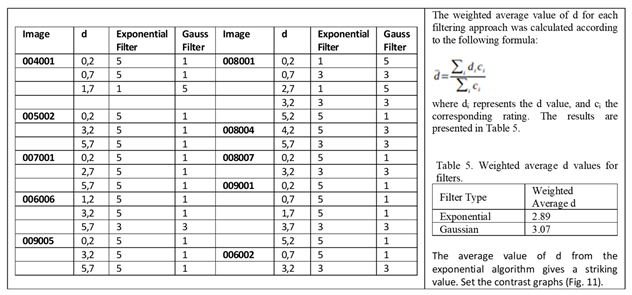
Table 6.
Actual Results per Anatomical Region (d = 1.4). Completed with Simulated PSNR, SSIM and SNR.
Table 6.
Actual Results per Anatomical Region (d = 1.4). Completed with Simulated PSNR, SSIM and SNR.
Disclaimer/Publisher’s Note: The statements, opinions and data contained in all publications are solely those of the individual author(s) and contributor(s) and not of MDPI and/or the editor(s). MDPI and/or the editor(s) disclaim responsibility for any injury to people or property resulting from any ideas, methods, instructions or products referred to in the content. |
© 2025 by the authors. Licensee MDPI, Basel, Switzerland. This article is an open access article distributed under the terms and conditions of the Creative Commons Attribution (CC BY) license (http://creativecommons.org/licenses/by/4.0/).
Copyright: This open access article is published under a Creative Commons CC BY 4.0 license, which permit the free download, distribution, and reuse, provided that the author and preprint are cited in any reuse.


