
Submitted:
09 July 2025
Posted:
09 July 2025
You are already at the latest version
Abstract
Background: We have previously demonstrated that the function and expression of the Na+/taurocholate cotransporting polypeptide (NTCP) and the organic cation transporter 1 (OCT1) are affected by increasing free cholesterol in the plasma membrane by an acute incubation with cholesterol for 30 minutes. In the current study we wanted to extend these findings to a more chronic condition to mimic what would be seen in obese patients. Methods: We incubated HEK293 cells that stably express NTCP or OCT1 for 24 hours with 0.05 mM cholesterol and determined their function by measuring uptake of radioactive taurocholate or MPP+. Expression at the plasma membrane was quantified with a biotinylation assay combined with Western blots. Results: Incubation with cholesterol increased the cholesterol content of the cells by about 2-fold. Transport mediated by NTCP and OCT1 was decreased. Membrane expression for both transporters showed a slight decrease and when kinetics were normalized for the membrane expression, the Vmax for NTCP-mediated taurocholate uptake slightly decreased but the Vmax and the capacity (Vmax/Km) for OCT1-mediated MPP+ uptake increased by 2.5-fold and 3-fold, respectively. Acyl-Coenzyme A acyltransferase inhibitors enhanced the decrease in transport function, potentially due to retention of more free cholesterol in the plasma membrane. Conclusions: Chronic increases in free cholesterol in the plasma membrane can result in increased or decreased transporter function and expression. In the case of OCT1, which is involved in the uptake of the anti-diabetic drug metformin into hepatocytes, the 3-fold increase in transport capacity suggests that patients might benefit from dose adjustments.
Keywords:
NTCP
; OCT1
; transporter
; cholesterol
; fatty liver
1. Introduction
Increases in free cholesterol content are a hallmark of obesity and are associated with metabolic dysfunction-associated steatotic liver disease (MASLD) and metabolic dysfunction-associated steatohepatitis (MASH) [1,2]. The onset of MASLD and MASH, along with the increase in cholesterol content, is a gradual process and has been linked to various disease states including hypercholesterolemia, cardiovascular and neurodegenerative diseases, and cancer [3,4,5,6,7]. The Na+/taurocholate cotransporting polypeptide (NTCP; SLC10A1) and the organic cation transporter 1 (OCT1; SLC22A1) are expressed at the basolateral membrane of human hepatocytes [8,9]. NTCP maintains the enterohepatic circulation of bile acids [10,11,12], but can also transport conjugated steroid hormones [13,14] and drugs like pitavastatin, rosuvastatin, and fluvastatin [15,16,17,18]. OCT1 is an organic cation transporter that mediates the uptake of numerous endo- and xenobiotic organic cations including the drug metformin which is frequently taken by patients with MASLD, particularly those with type 2 diabetes [19,20]. Thus, changes in the function of these transporters due to increased levels of free cholesterol in the plasma membrane could affect drug therapy and thus treatment outcome. We have previously demonstrated that an acute 30-minute increase in cholesterol content impaired NTCP- and OCT1-mediated substrate uptake [21]. In the present study, we expanded our analysis to a more chronic situation by investigating the effect of increased concentrations of free cholesterol for 24 hours, more reminiscent of humans with fatty liver disease, on NTCP and OCT1 function and localization.
2. Materials and Methods
2.1. Experimental Materials
Radiolabeled [3H]-Taurocholic acid was purchased from Revvity (Waltham, MA, USA), and radiolabeled [3H]-Methyl-4-phenylpyridinium iodide (MPP+) from American Radiolabeled Chemicals, Inc. (St. Louis, MO, USA). Water-soluble cholesterol, and the Acyl-Coenzyme A acyltransferase (ACAT) inhibitors Sandoz 58-035, Avasimibe, and Cl976 were obtained from Sigma Aldrich (St. Louis, MO, USA).
Mouse anti-Alpha 1 Sodium Potassium ATPase antibody (Ab7671, 1:2,000) was from Abcam (Waltham, MA, USA), and rabbit anti-Flotillin-1 antibody (F1180, 1:2,000) was obtained from Sigma Aldrich. Mouse anti-Clathrin Heavy Chain antibody (610499, 1:1,000) was purchased from BD Biosciences (Franklin Lakes, NJ, USA). Mouse Tetra His antibody (34670, 1:2,000) was bought from QIAGEN (Germantown, MD, USA). The mouse anti-SLC22A1 antibody (NBP1-51684, 1:1,000) was obtained from Novus Biologicals (Littleton, CO, USA). HRP-conjugated goat anti-mouse (31430, 1:10,000) or anti-rabbit (A16096, 1:10,000) secondary antibodies were from Thermo Fisher Scientific (Carlsbad, CA, USA).
2.2. Cell Culture, Cholesterol Treatment, and Uptake Experiments
HEK293 cells stably expressing His-tagged NTCP and OCT1 as well as empty vector transfected control cells were cultured and maintained as described previously [22,23].
To mimic chronic cholesterol conditions, cells were incubated in DMEM containing lipid depleted fetal bovine serum (Biowest USA, Bradenton, FL, #S148L) supplemented with 0.05 mM cholesterol (cholesterol water-soluble, Sigma Aldrich) for 24 hours. For the treatment with ACAT inhibitors, either 12.5 μg/mL Sandoz 58-035, 10 μM Avasimibe, or 10 μM Cl-976 were added. To measure uptake, HEK293 cells were plated on poly-D-lysine-coated plates or in the presence of 2 μg/μL poly-ethylenimine [24]. NTCP-mediated uptake of [3H]-taurocholate and OCT1-mediated uptake of [3H]-MPP+ were measured as described previously [21].
For kinetic determinations, uptake was performed at 15 seconds, under initial linear rate conditions for NTCP and OCT1 at 37 °C.
2.3. Cholesterol Quantification
The AmplexTM Red Cholesterol Assay Kit from Thermo Fisher Scientific was used following the manufacturer’s instructions. Fluorescence was measured at an excitation of 540 nm and an emission of 620 nm.
2.4. Surface Biotinylation and Western Blotting
2.5. Statistical Analysis
Data were analyzed using one-way ANOVA followed by “Dunnett’s multiple comparisons test” in GraphPad Prism 10 (GraphPad Software Inc., San Diego, CA, USA). Significance and p-values are given in the figure legends.
3. Results
3.1. Functional Consequences of a Chronic Increase in Plasma Membrane Free Cholesterol Levels
To assess the impact of chronic cholesterol exposure on transporters, we established a cholesterol concentration and exposure time that did not impact cell viability or cell adhesion for functional studies. Initial experiments demonstrated that after a 24-hour treatment with 0.05 mM cholesterol NTCP- and OCT1-expressing HEK293 cells still adhered to the plates, while cells lifted off the plates at longer time points or higher cholesterol concentrations. We measured free cholesterol levels of NTCP- and OCT1-expressing HEK293 cells to quantify the increase in plasma membrane-free cholesterol. The impact of a 24-hour exposure to 0.05 mM cholesterol was determined using the Amplex Red Cholesterol Assay Kit without cholesterol esterase. Figure 1 demonstrates that in empty vector transfected HEK293 cells, free cholesterol increased by 124%, in NTCP-expressing cells cholesterol increased by 75%, while in OCT1-expressing cells, the increase was 94%. Thus, we conclude that a 24-hour incubation with 0.05 mM cholesterol can almost double the free cholesterol levels in NTCP- and OCT1-expressing HEK293 cells. This increase in free cholesterol content of the transporter-expressing cells after a 24-hour 0.05 mM cholesterol treatment was similar to what we determined previously for an acute condition where cells were incubated for 30 minutes with much higher concentrations (0.8mM for NTCP and 0.4 mM for OCT1) [21].
To determine what impact the chronic increase of free cholesterol would have on the function of NTCP and OCT1 we measured substrate uptake. After a 24-hour incubation in the presence of 0.05 mM cholesterol, uptake of 100 µM taurocholate for NTCP-expressing cells and 16.7 nM methyl-4-phenylpyridinium iodide (MPP+) for OCT1-expressing cells was measured. The results shown in Figure 2 demonstrate that increasing the cholesterol content decreased uptake mediated by both transporters compared to the control. These effects were consistent with those observed following the acute cholesterol incubation reported previously [21]; however, the decrease in OCT1-mediated uptake was not as pronounced.
3.2. Characterizing the Effect of a Chronic Increase in Free Cholesterol on Transporter Expression and Function
We previously reported that increasing the plasma membrane cholesterol content acutely, during a 30-minute incubation with 0.8 mM or 0.4 mM cholesterol for NTCP and OCT1, respectively, resulted in decreased transporter surface expression [21]. To investigate how chronic elevation of cholesterol would affect the plasma membrane expression of NTCP and OCT1, we assessed transporter expression at the plasma membrane after a 24-hour incubation with 0.05 mM cholesterol using surface biotinylation and western blotting. Expression of both transporters tended towards a decrease (Figure 3). NTCP expression was about 20% lower after cholesterol treatment (Figure 3A), while OCT1 was about 30% lower (Figure 3B). Representative western blots for NTCP and OCT1 surface expression are shown in Figure 3C and 3D, with Na+/K+ ATPase as the loading control. The diminished surface expression of NTCP and OCT1 was used to normalize the transporter function in the following experiments.
After normalization, NTCP-mediated taurocholate uptake was still significantly lower than the control (Figure 4A). However, normalized OCT1-mediated MPP+ uptake was similar to control values (Figure 4B). These findings are very similar to what we saw following a 30-minute incubation at the higher cholesterol concentrations [21].
To further characterize the functional impact of chronic cholesterol exposure on NTCP- and OCT1-mediated uptake, we performed kinetic experiments. Time-dependent experiments revealed that uptake for NTCP and OCT1 was linear at least for 15 seconds (data not shown). Therefore, concentration dependent uptake was measured after 24 hours of 0.05 mM cholesterol treatment at 15 seconds. Figure 5 and Table 1 summarize the results.
The control NTCP-mediated taurocholate uptake was saturable with a Km of 24 ± 4.0 µM and a Vmax of 3.3 ± 0.1 nmol/mg/min. Following treatment with 0.05 mM cholesterol, the Km stayed the same at 22.7 ± 6.7 µM while the Vmax decreased slightly to 2.7 ± 0.2 nmol/mg/min (Table 1). For OCT1-mediated uptake of MPP+ the control uptake saturated with a Km value of 44.4 ± 9.7 µM and a Vmax of 6.4 ± 0.5 nmol/mg/min. Treatment with 0.05 mM cholesterol did not affect the Km value (38.0 ± 6.3 µM) but increased the Vmax to 16.7 ± 0.9 nmol/mg/min (Table 1). Thus, for NTCP there were no significant changes in the kinetic parameters while for OCT1 the Vmax increased by about 2.5-fold, resulting in an almost 3-fold higher capacity (Table 1).
3.3. Effect of ACAT Inhibitors on Function and Expression of NTCP and OCT1
Incubation with 0.05 mM cholesterol for 24 hours could result in the formation of cholesterol esters and reduce the concentration of free cholesterol in the plasma membrane. To prevent such esterification, Acyl-Coenzyme A acyltransferase (ACAT) inhibitors were included during the 24-hour incubation with cholesterol. We used three different ACAT inhibitors: Sandoz 58-035 (12.5 μg/mL) [26], Avasimibe (10 μM) [27], or Cl-976 (10 μM) [28]. As shown in Figure 6, treatment with all three ACAT inhibitors resulted in decreased substrate uptake by both transporters.
4. Discussion
We previously demonstrated that an acute increase (30 minutes) in free cholesterol slightly increased substrate affinity and decreased Vmax for NTCP resulting in a decreased transport capacity. For OCT1 the effect on the Km value was more pronounced and overall, the capacity clearly decreased [21]. In the present study we wanted to expand these findings to a more chronic situation where we incubated the cells with free cholesterol for 24 hours, more closely mimicking the situation of patients with MASLD or MASH [2].
The major findings of these more chronic conditions are the following: increasing the free cholesterol concentration for 24 hours resulted in a trend towards decreased Km and Vmax, and consequently towards a decrease in the transport capacity of NTCP, similar to what we have reported for the acute condition [21]. In contrast, for OCT1 increasing cholesterol for 24 hours resulted in a 3-fold increased capacity which was opposite to the acute condition. This result was mainly driven by an increase in Vmax which corresponds to an increased turnover number since the results were normalized for protein at the plasma membrane. Patients with metabolic syndrome or MAFLD are frequently treated with metformin for their type 2 diabetes. Therefore, an increased transport capacity of OCT1 suggests that metformin would be taken up into hepatocytes more efficiently in patients with increased free cholesterol, and therapeutical doses in such patients might have to be adjusted.
Our findings with NTCP and OCT1 where increasing cholesterol in the cell membrane had different effects, are consistent with previous published studies. Bastiaanse et al. (1997) who reviewed the effects of membrane cholesterol on transport processes in the plasma membrane [29] found that increasing the cholesterol in the plasma membrane decreased the function of ATPases but increased the function of most other transporters studied. More recently, Scanga et al. (2025) reported that an increase in cholesterol resulted in an increase in the Vmax for histidine transport by purified LAT1 in proteoliposomes [30]. Given that increasing free cholesterol in the membrane results in lower fluidity or higher rigidity [31] the increase in the turnover for OCT1 is kind of unexpected. One would expect that a transmembrane protein would turn over quicker at a lower rigidity or higher fluidity. However, it has to be taken into consideration that the observed changes could be due to different localization of the transporters in lipid rafts or plasma membrane microdomains, as we saw after a 30-minute incubation with cholesterol [21] and that the lipid composition of the plasma membrane changes with the increased cholesterol content.
Another possibility is that cholesterol interacts directly with the transport proteins. Previous studies identified a cholesterol recognition/interaction amino acid consensus sequence (CRAC) as (L/V)-X1-5-(F/Y/W)- X1-5-(K/R) [32,33] or its reverse as CARC. Recently, such a CRAC was identified in OCT2, an organic cation transporter mainly expressed in the kidney [34]. Preventing cholesterol interaction by site-directed mutagenesis abolished allosteric features of OCT2 due to cholesterol binding. This identified CRAC sequence is highly conserved in OCT1. Therefore, future experiments will need to investigate whether the effect of cholesterol on OCT1 function is the same after the CRAC sequence has been changed using site-directed mutagenesis.
Loading the plasma membrane with free cholesterol can result in esterification of cholesterol and storage of the esterified cholesterol in lipid droplets [35]. To prevent this esterification and investigate the effect of its inhibition, we added three different ACAT inhibitors during the 24-hour incubation with cholesterol. For both transporters a further decrease in normalized function was seen. One possible interpretation of these findings is that due to the inhibition of ACAT more free cholesterol stays in the plasma membrane and the effects on transporter function are enhanced. Another option is that these ACAT inhibitors have a direct effect on the transporter and act as acute inhibitors. In preliminary experiments we did not see any inhibition of OCT1-mediated uptake but a clear inhibition of NTCP-mediated taurocholate uptake (data not shown). Future experiments will be needed to determine the type and potency of inhibition. It is interesting to note that Avasimibe was evaluated as a lipid-lowering drug back in the 1990s, but clinical trials did not result in positive outcomes [36]. However, Post et al. (1999) reported that in rats, Avasimibe stimulated bile acid synthesis and 7alpha-hydroxylase activity [37]. This stimulation of bile acid synthesis could potentially, at least in part, be explained by the inhibition of NTCP-mediated bile acid uptake, leading to lower intracellular bile acid concentrations and thus stimulating the conversion of cholesterol to bile acids.
Our studies have the limitation that the experiments were performed in HEK293 cells that expressed NTCP or OCT1 and not in human hepatocytes. Unfortunately, we could not plate human hepatocytes that were isolated from fatty livers, because they did not adhere to the plates. We are in the process of developing HepG2 cells that express these transporters via activation of the intrinsic promoter. Such HepG2 cells would be more hepatocyte-like cells than the HEK293 cells and the results should better represent what would be expected from human hepatocytes.
In conclusion, increasing the free cholesterol content in the plasma membrane for 24 hours, mimicking a more chronic situation than the previously reported 30-minute incubation, resulted in a 3-fold increase in the capacity of OCT1 to transport its substrate. These findings suggest that patients treated with OCT1-transported drugs might benefit from dose adjustments. For NTCP, the effects were not as pronounced as during the 30-minute acute treatment. Interestingly, treating the cells with Avasimibe, which was a lipid lowering drug candidate, resulted in a significant reduction of NTCP-mediated taurocholate transport. Future experiments in a more hepatocyte-like cell line or in MASLD animal models will be needed to explain the underlying mechanisms and further elucidate potential consequences for patients with obesity and type 2 diabetes.
Author Contributions
Conceptualization, J.Y.I. and B.H.; methodology, J.Y.I. and C.M.; formal analysis, J.Y.I., C.M. and B.H.; investigation, J.Y.I. and C.M.; resources, B.H.; writing—original draft preparation, J.Y.I.; writing— review and editing, J.Y.I., C.M. and B.H.; visualization, J.Y.I. and C.M.; supervision, B.H.; project administration, B.H.; funding acquisition, B.H. All authors have read and agreed to the published version of the manuscript.
Funding
This research was funded by the National Institute of Health grants P30GM118247, R01GM077336, and R01GM149665.
Institutional Review Board Statement
Not applicable.
Informed Consent Statement
Not applicable.
Data Availability Statement
All data are contained within the article.
Conflicts of Interest
The authors declare no conflict of interest.
References
- Clarke, J.D.; Novak, P.; Lake, A.D.; Hardwick, R.N.Cherrington, N.J. Impaired N-linked glycosylation of uptake and efflux transporters in human non-alcoholic fatty liver disease. Liver Int. 2017, 37, 1074-1081.
- Puri, P.; Baillie, R.A.; Wiest, M.M.; Mirshahi, F.; Choudhury, J.; Cheung, O.; Sargeant, C.; Contos, M.J.Sanyal, A.J. A lipidomic analysis of nonalcoholic fatty liver disease. Hepatology. 2007, 46, 1081-90.
- Duan, Y.; Gong, K.; Xu, S.; Zhang, F.; Meng, X.Han, J. Regulation of cholesterol homeostasis in health and diseases: from mechanisms to targeted therapeutics. Signal Transduct Target Ther. 2022, 7, 265.
- Ioannou, G.N. The Role of Cholesterol in the Pathogenesis of NASH. Trends Endocrinol Metab. 2016, 27, 84-95. [CrossRef]
- Li, H.; Yu, X.H.; Ou, X.; Ouyang, X.P.Tang, C.K. Hepatic cholesterol transport and its role in non-alcoholic fatty liver disease and atherosclerosis. Prog Lipid Res. 2021, 83, 101109.
- Luo, J.; Yang, H.Song, B.L. Mechanisms and regulation of cholesterol homeostasis. Nat Rev Mol Cell Biol. 2020, 21, 225-245. [CrossRef]
- van der Wulp, M.Y.; Verkade, H.J.Groen, A.K. Regulation of cholesterol homeostasis. Mol Cell Endocrinol. 2013, 368, 1-16. [CrossRef]
- Kullak-Ublick, G.A.; Glasa, J.; Boker, C.; Oswald, M.; Grutzner, U.; Hagenbuch, B.; Stieger, B.; Meier, P.J.; Beuers, U.; Kramer, W.; Wess, G.Paumgartner, G. Chlorambucil-taurocholate is transported by bile acid carriers expressed in human hepatocellular carcinomas. Gastroenterology. 1997, 113, 1295-305.
- Nies, A.T.; Koepsell, H.; Winter, S.; Burk, O.; Klein, K.; Kerb, R.; Zanger, U.M.; Keppler, D.; Schwab, M.Schaeffeler, E. Expression of organic cation transporters OCT1 (SLC22A1) and OCT3 (SLC22A3) is affected by genetic factors and cholestasis in human liver. Hepatology. 2009, 50, 1227-40.
- Hagenbuch, B.Meier, P.J. Molecular cloning, chromosomal localization, and functional characterization of a human liver Na+/bile acid cotransporter. J Clin Invest. 1994, 93, 1326-31.
- Claro da Silva, T.; Polli, J.E.Swaan, P.W. The solute carrier family 10 (SLC10): beyond bile acid transport. Mol Aspects Med. 2013, 34, 252-69.
- Slijepcevic, D.; Kaufman, C.; Wichers, C.G.; Gilglioni, E.H.; Lempp, F.A.; Duijst, S.; de Waart, D.R.; Elferink, R.P.; Mier, W.; Stieger, B.; Beuers, U.; Urban, S.van de Graaf, S.F. Impaired uptake of conjugated bile acids and hepatitis b virus pres1-binding in na(+) -taurocholate cotransporting polypeptide knockout mice. Hepatology. 2015, 62, 207-19.
- Craddock, A.L.; Love, M.W.; Daniel, R.W.; Kirby, L.C.; Walters, H.C.; Wong, M.H.Dawson, P.A. Expression and transport properties of the human ileal and renal sodium-dependent bile acid transporter. Am J Physiol. 1998, 274, G157-69.
- Kullak-Ublick, G.A.; Ismair, M.G.; Kubitz, R.; Schmitt, M.; Haussinger, D.; Stieger, B.; Hagenbuch, B.; Meier, P.J.; Beuers, U.Paumgartner, G. Stable expression and functional characterization of a Na+-taurocholate cotransporting green fluorescent protein in human hepatoblastoma HepG2 cells. Cytotechnology. 2000, 34, 1-9.
- Fujino, H.; Saito, T.; Ogawa, S.Kojima, J. Transporter-mediated influx and efflux mechanisms of pitavastatin, a new inhibitor of HMG-CoA reductase. J Pharm Pharmacol. 2005, 57, 1305-11.
- Ho, R.H.; Tirona, R.G.; Leake, B.F.; Glaeser, H.; Lee, W.; Lemke, C.J.; Wang, Y.Kim, R.B. Drug and bile acid transporters in rosuvastatin hepatic uptake: function, expression, and pharmacogenetics. Gastroenterology. 2006, 130, 1793-806.
- Greupink, R.; Dillen, L.; Monshouwer, M.; Huisman, M.T.Russel, F.G. Interaction of fluvastatin with the liver-specific Na+ -dependent taurocholate cotransporting polypeptide (NTCP). Eur J Pharm Sci. 2011, 44, 487-96.
- Bi, Y.A.; Qiu, X.; Rotter, C.J.; Kimoto, E.; Piotrowski, M.; Varma, M.V.; Ei-Kattan, A.F.Lai, Y. Quantitative assessment of the contribution of sodium-dependent taurocholate co-transporting polypeptide (NTCP) to the hepatic uptake of rosuvastatin, pitavastatin and fluvastatin. Biopharm Drug Dispos. 2013, 34, 452-61.
- Chen, H.; Huang, M.; Zhang, D.; Wang, H.; Wang, D.; Li, M.; Wang, X.; Zhu, R.; Liu, J.Ma, L. Metformin’s effect on metabolic dysfunction-associated steatotic liver disease through the miR-200a-5p and AMPK/SERCA2b pathway. Front Pharmacol. 2024, 15, 1477212. [CrossRef]
- Sawalha, K.; Gautam, N.; Sivakumar, K.; Paydak, H.Mehta, J.L. Metformin: Its salutary effects beyond diabetes mellitus. J Investig Med. 2025, 73, 363-375.
- Idowu, J.Y.Hagenbuch, B. Free Cholesterol Affects the Function and Localization of Human Na(+)/Taurocholate Cotransporting Polypeptide (NTCP) and Organic Cation Transporter 1 (OCT1). Int J Mol Sci. 2022, 23.
- Ruggiero, M.J.; Miller, H.; Idowu, J.Y.; Zitzow, J.D.; Chang, S.C.Hagenbuch, B. Perfluoroalkyl Carboxylic Acids Interact with the Human Bile Acid Transporter NTCP. Livers. 2021, 1, 221-229.
- Boxberger, K.H.; Hagenbuch, B.Lampe, J.N. Ligand-dependent modulation of hOCT1 transport reveals discrete ligand binding sites within the substrate translocation channel. Biochem Pharmacol. 2018, 156, 371-384.
- Faussner, A.; Deininger, M.M.; Weber, C.Steffens, S. Direct addition of poly-lysine or poly-ethylenimine to the medium: A simple alternative to plate pre-coating. PLoS One. 2022, 17, e0260173.
- Ruggiero, M.J.; Malhotra, S.; Fenton, A.W.; Swint-Kruse, L.; Karanicolas, J.Hagenbuch, B. A clinically relevant polymorphism in the Na(+)/taurocholate cotransporting polypeptide (NTCP) occurs at a rheostat position. J Biol Chem. 2021, 296, 100047.
- Iaea, D.B.; Mao, S.; Lund, F.W.Maxfield, F.R. Role of STARD4 in sterol transport between the endocytic recycling compartment and the plasma membrane. Mol Biol Cell. 2017, 28, 1111-1122.
- Llaverias, G.; Laguna, J.C.Alegret, M. Pharmacology of the ACAT inhibitor avasimibe (CI-1011). Cardiovasc Drug Rev. 2003, 21, 33-50.
- Field, F.J.; Albright, E.Mathur, S. Inhibition of acylcoenzyme A: cholesterol acyltransferase activity by PD128O42: effect on cholesterol metabolism and secretion in CaCo-2 cells. Lipids. 1991, 26, 1-8.
- Bastiaanse, E.M.; Hold, K.M.Van der Laarse, A. The effect of membrane cholesterol content on ion transport processes in plasma membranes. Cardiovasc Res. 1997, 33, 272-83.
- Scanga, R.; Scalise, M.; Xiu, F.; Galluccio, M.; Console, L.; Visentin, M.Indiveri, C. Impact of 7-ketocholesterol on the function and stability of the LAT1 transporter. Biochem Pharmacol. 2025, 117075.
- Demel, R.A.De Kruyff, B. The function of sterols in membranes. Biochim Biophys Acta. 1976, 457, 109-32. [CrossRef]
- Li, H.Papadopoulos, V. Peripheral-type benzodiazepine receptor function in cholesterol transport. Identification of a putative cholesterol recognition/interaction amino acid sequence and consensus pattern. Endocrinology. 1998, 139, 4991-7.
- Epand, R.M. Cholesterol and the interaction of proteins with membrane domains. Prog Lipid Res. 2006, 45, 279-94. [CrossRef]
- Sutter, M.L.; Console, L.; Fahner, A.F.; Samodelov, S.L.; Gai, Z.; Ciarimboli, G.; Indiveri, C.; Kullak-Ublick, G.A.Visentin, M. The role of cholesterol recognition (CARC/CRAC) mirror codes in the allosterism of the human organic cation transporter 2 (OCT2, SLC22A2). Biochem Pharmacol. 2021, 194, 114840.
- Kumari, R.M.; Khatri, A.; Chaudhary, R.Choudhary, V. Concept of lipid droplet biogenesis. Eur J Cell Biol. 2023, 102, 151362.
- Meuwese, M.C.; Franssen, R.; Stroes, E.S.Kastelein, J.J. And then there were acyl coenzyme A:cholesterol acyl transferase inhibitors. Curr Opin Lipidol. 2006, 17, 426-30.
- Post, S.M.; Zoeteweij, J.P.; Bos, M.H.; de Wit, E.C.; Havinga, R.; Kuipers, F.Princen, H.M. Acyl-coenzyme A:cholesterol acyltransferase inhibitor, avasimibe, stimulates bile acid synthesis and cholesterol 7alpha-hydroxylase in cultured rat hepatocytes and in vivo in the rat. Hepatology. 1999, 30, 491-500.
Figure 1.
Free cholesterol content in stably expressing HEK293 cells. Empty vector (EV) transfected, NTCP- and OCT1-expressing HEK293 cells were treated for 24 hours in media containing delipidated FBS (control) or 0.05 mM cholesterol. The graphs represent the mean ± SD of at least 3 independent experiments; * p < 0.05 and ** < 0.01 compared to control.
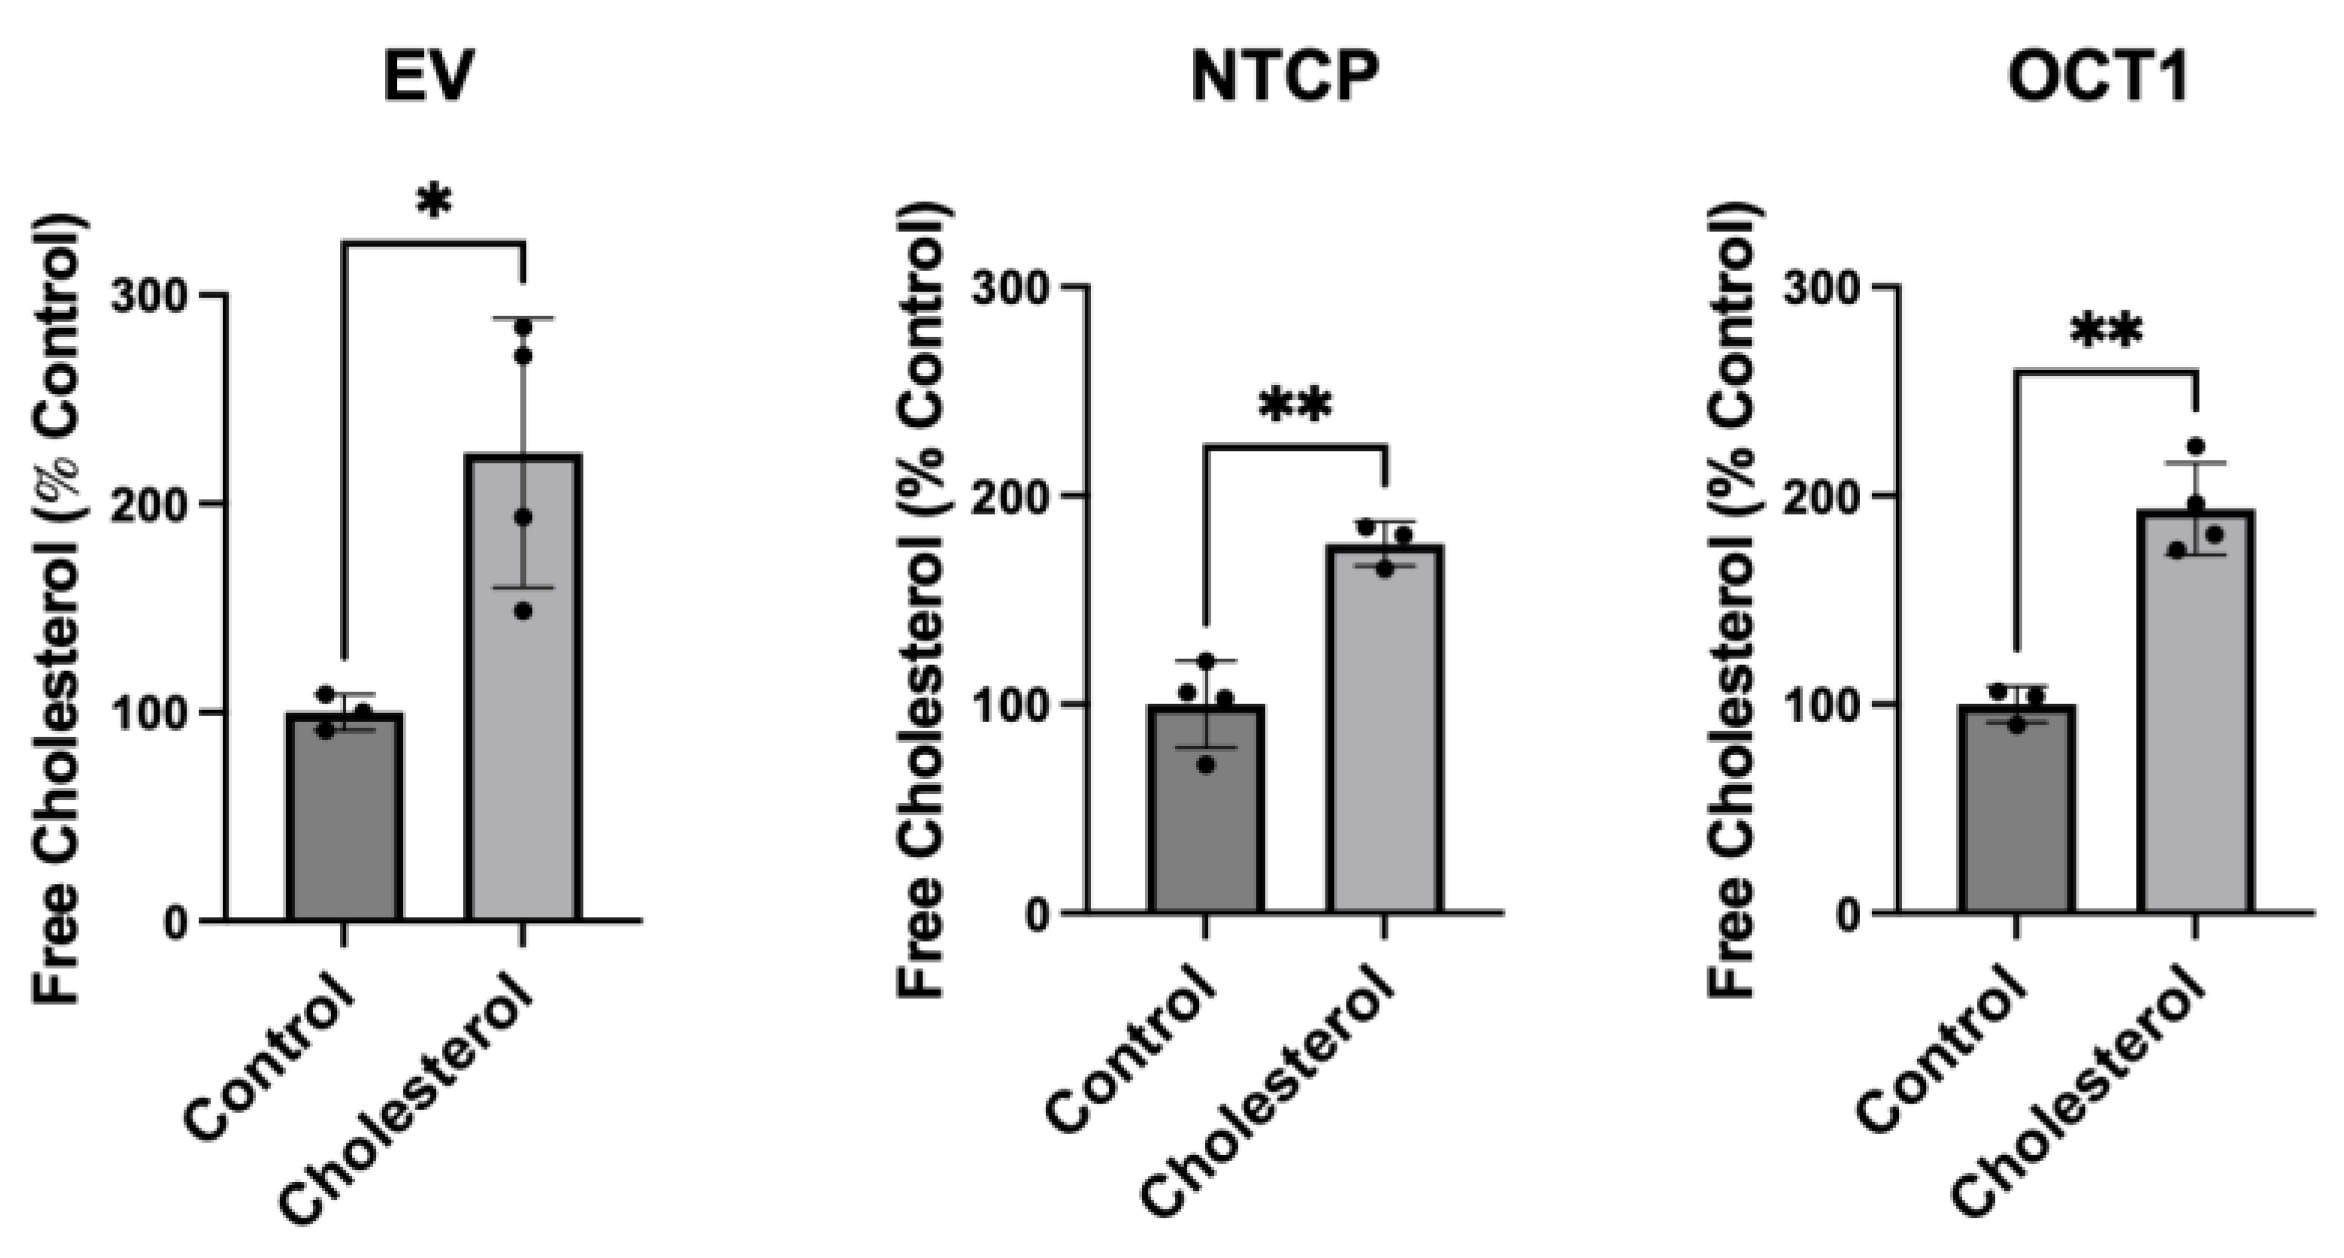
Figure 2.
Transporter-mediated substrate uptake following chronic cholesterol exposure. Uptake of (A) (100 μM) [3H]-taurocholate for NTCP- and (B) (16.7 nM) [3H]-MPP+ for OCT1-expressing HEK293 cells was measured for 30 s at 37 °C, 24 hours after treatment with 0.05 mM cholesterol. Net uptake was determined by subtracting the uptake measured in a sodium-free buffer from the uptake measured in a sodium-containing buffer for NTCP, or by subtracting the uptake of empty vector (EV) transfected cells from OCT1-expressing cells for OCT1. Results are reported as the mean ± SD of three independent experiments performed with triplicate determinations: * p < 0.05 and **** p < 0.0001.
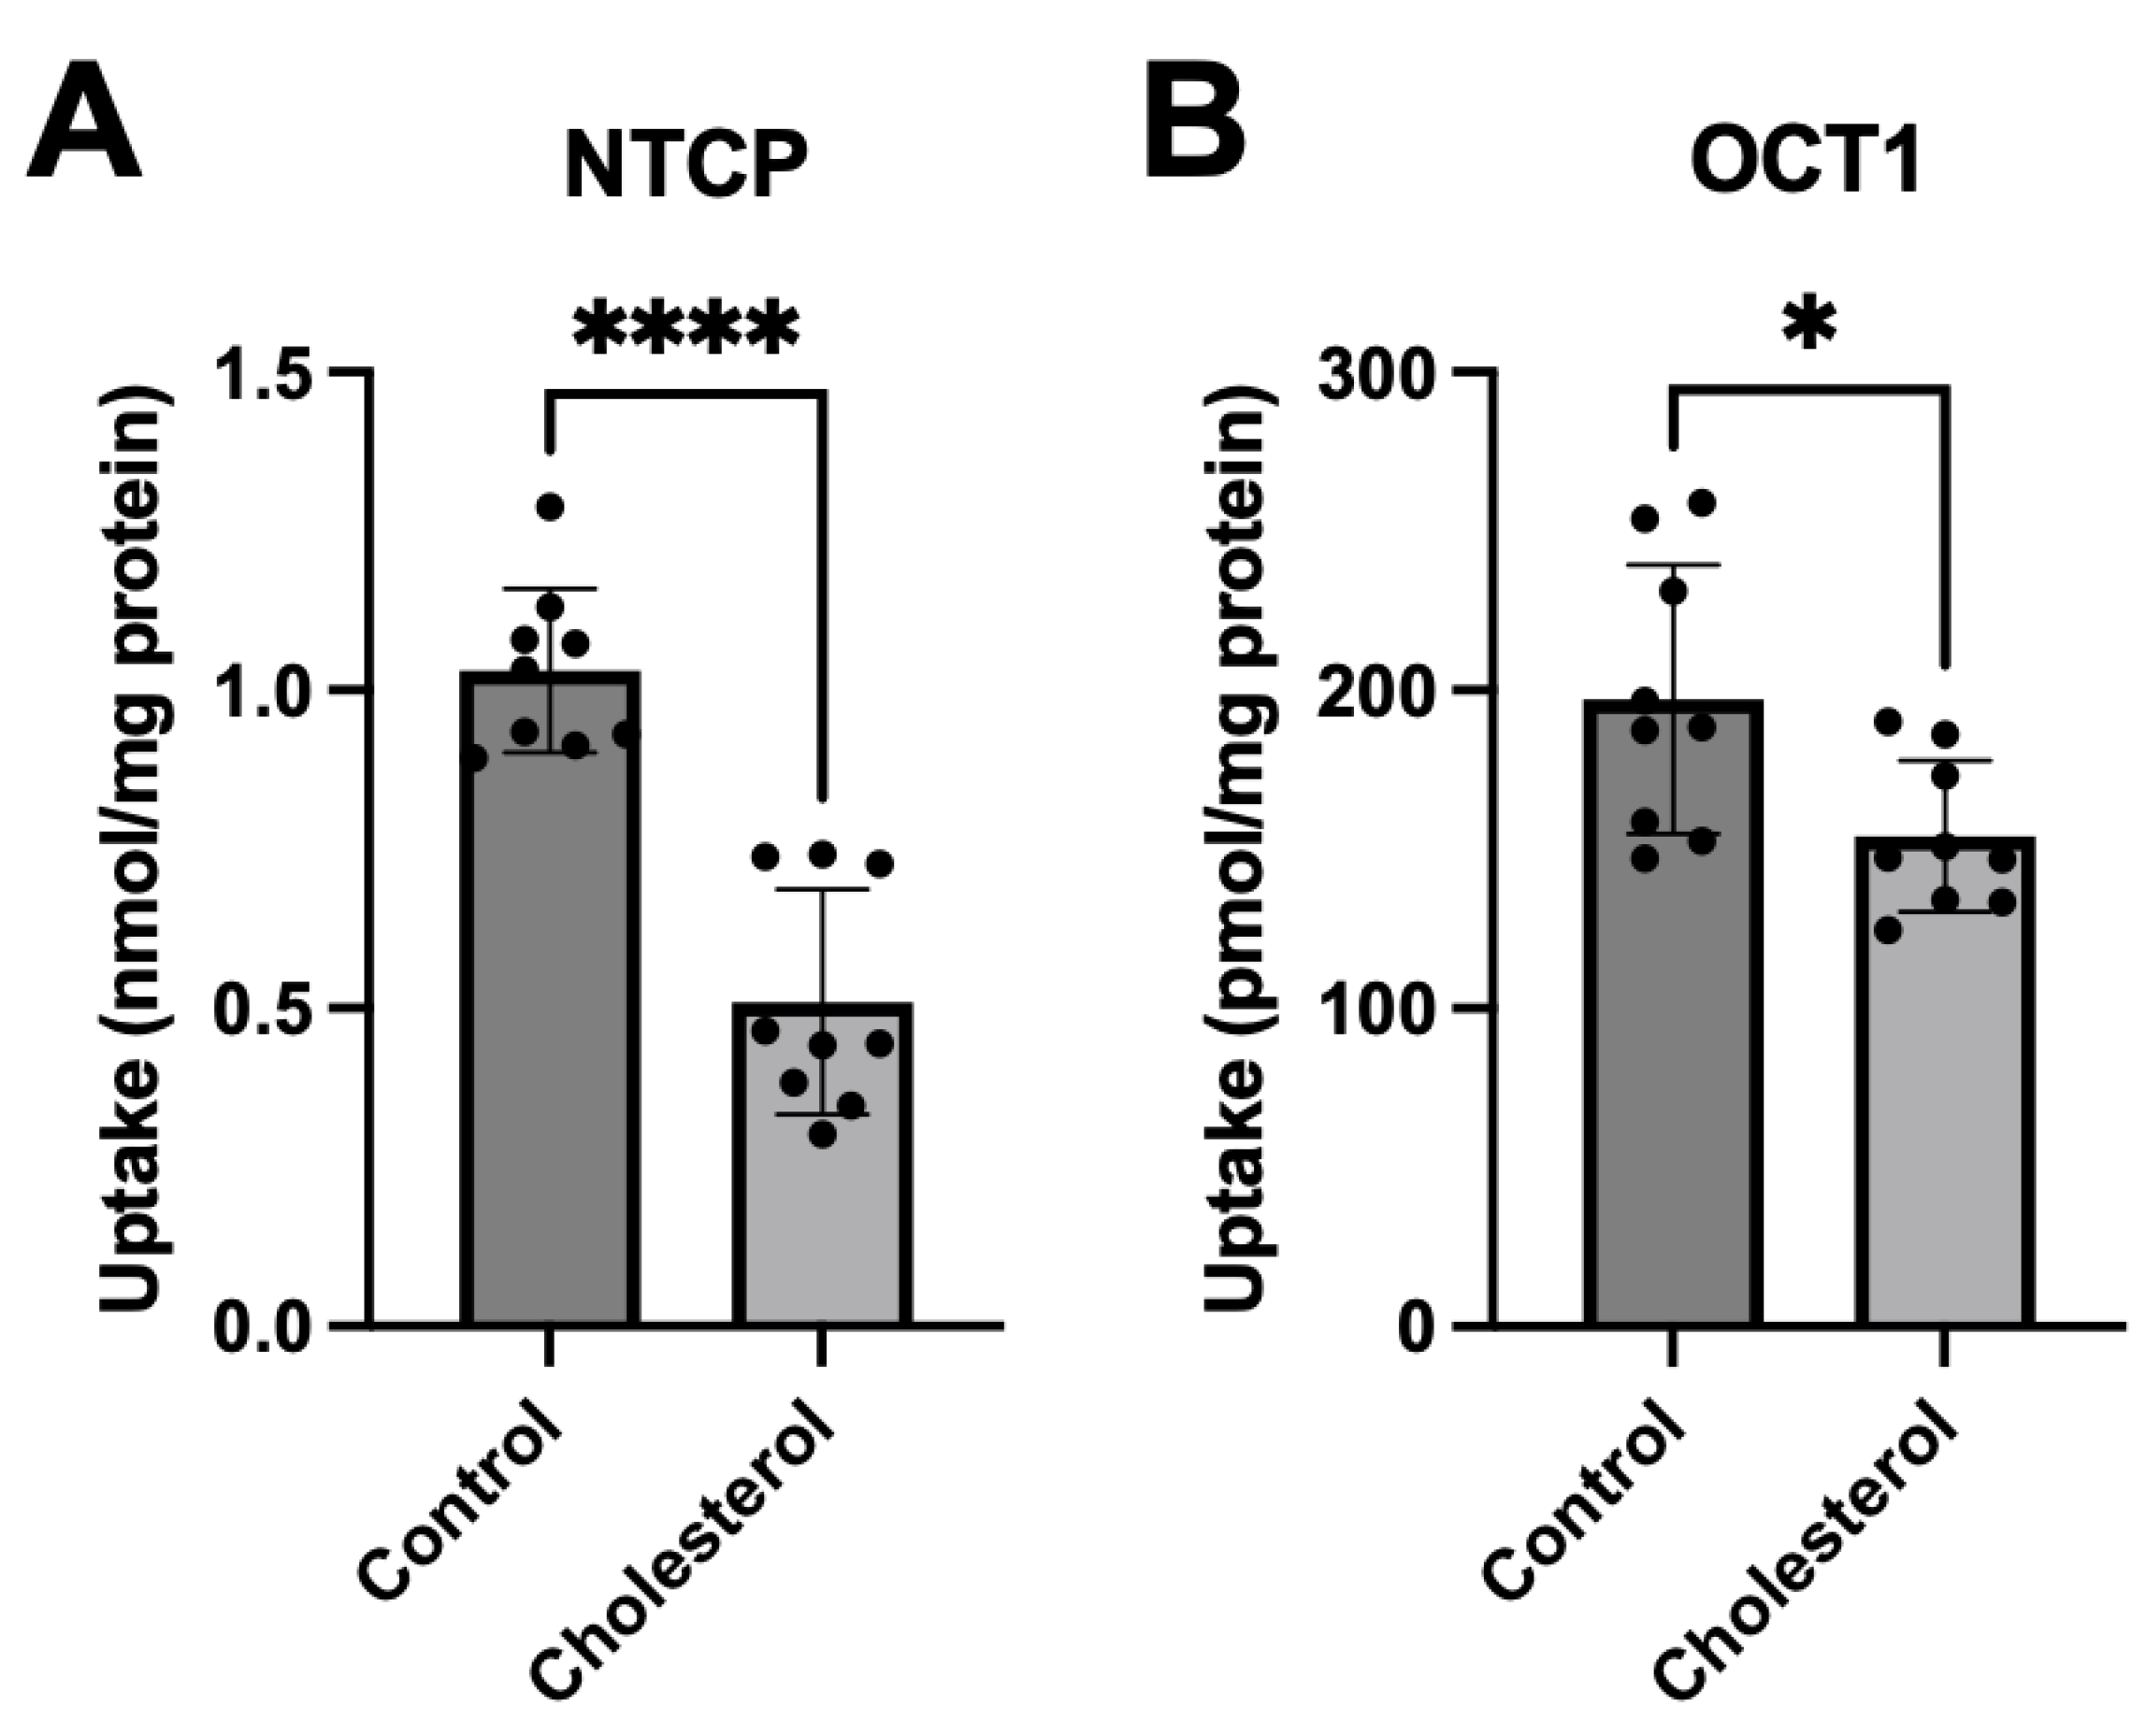
Figure 3.
Surface expression of transporters following chronic cholesterol exposure. Plasma membrane surface expression was quantified for (A) NTCP- and (B) OCT1-expressing HEK293 cells. Cells were treated for 24 hours with DMEM containing lipid-depleted FBS (control), or 0.05 mM cholesterol. Surface expression for (C) NTCP and (D) OCT1 is depicted using a representative western blot. Results are displayed as percent of control and reported as the mean ± SD of five (NTCP) or four (OCT1) independent experiments.
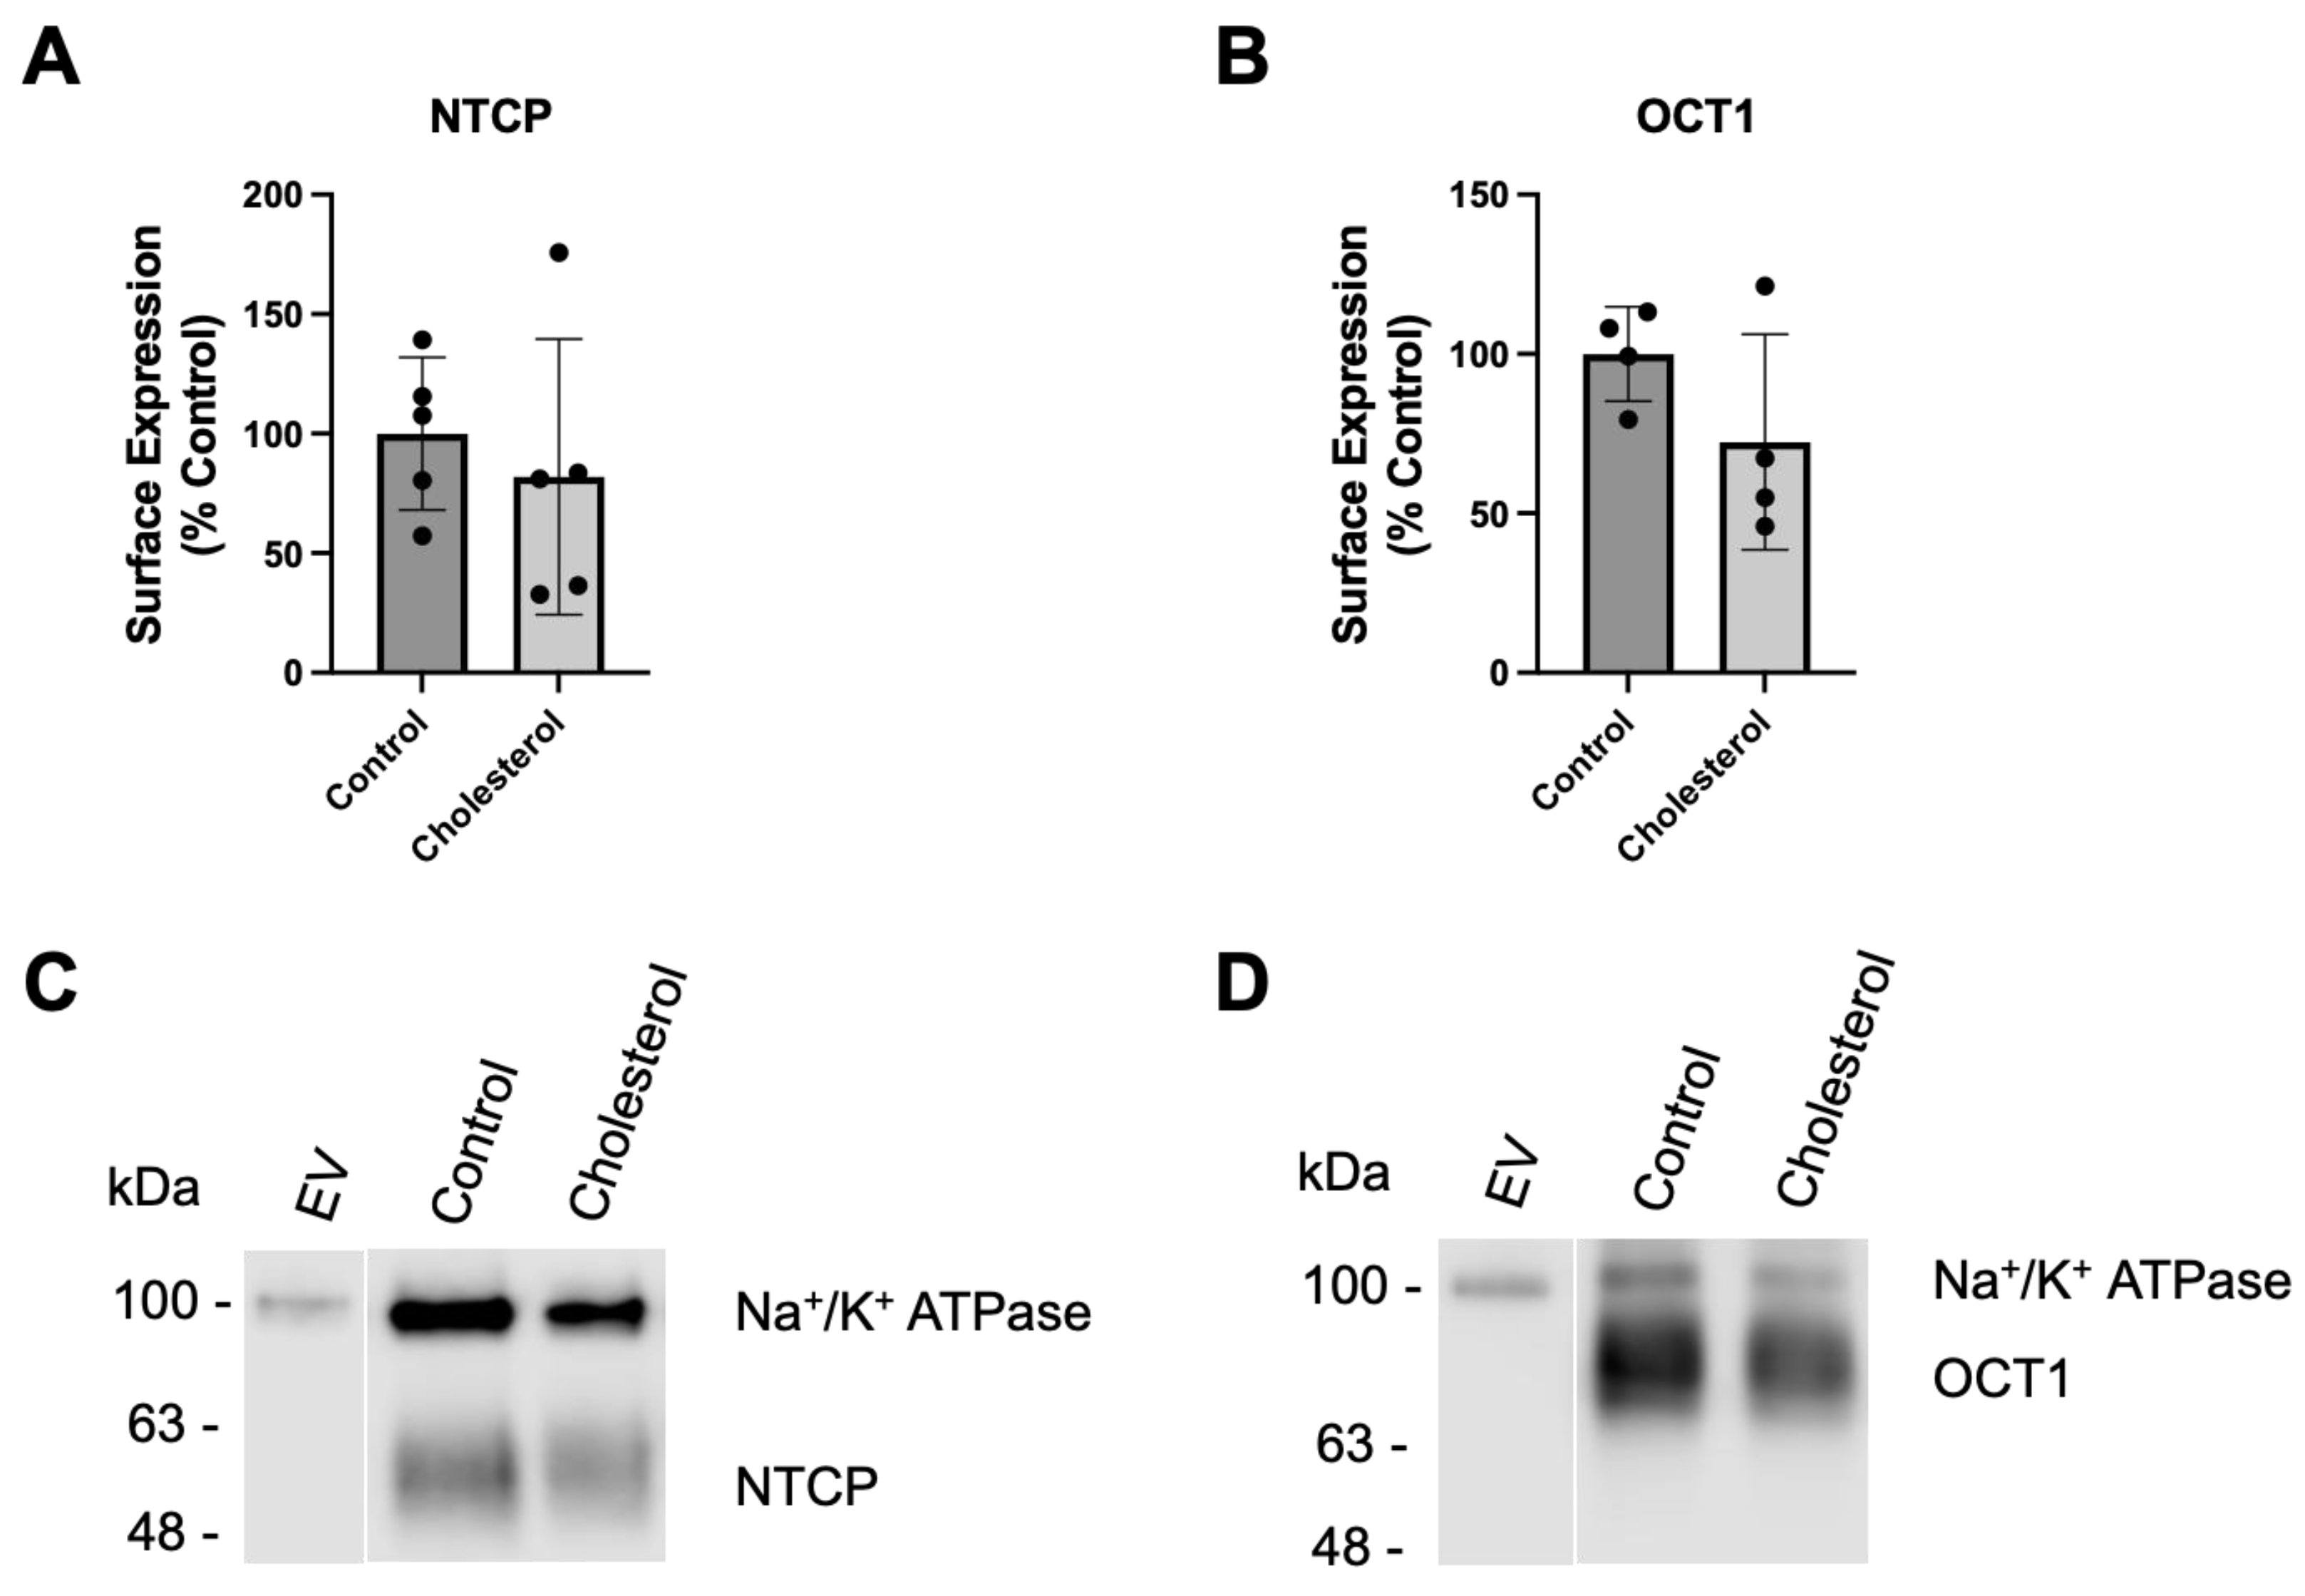
Figure 4.
Normalized transporter-mediated substrate uptake following chronic cholesterol exposure. Uptake of (A) (100 μM) [3H]-taurocholate for NTCP- and (B) (16.7 nM) [3H]-MPP+ for OCT1-expressing HEK293 cells 24 hours after treatment with 0.05 mM cholesterol. Transport shown in Figure 2 was corrected for surface expression. The graphs represent the mean ± SD of 3 independent experiments performed with triplicate determinations: *** p < 0.001.
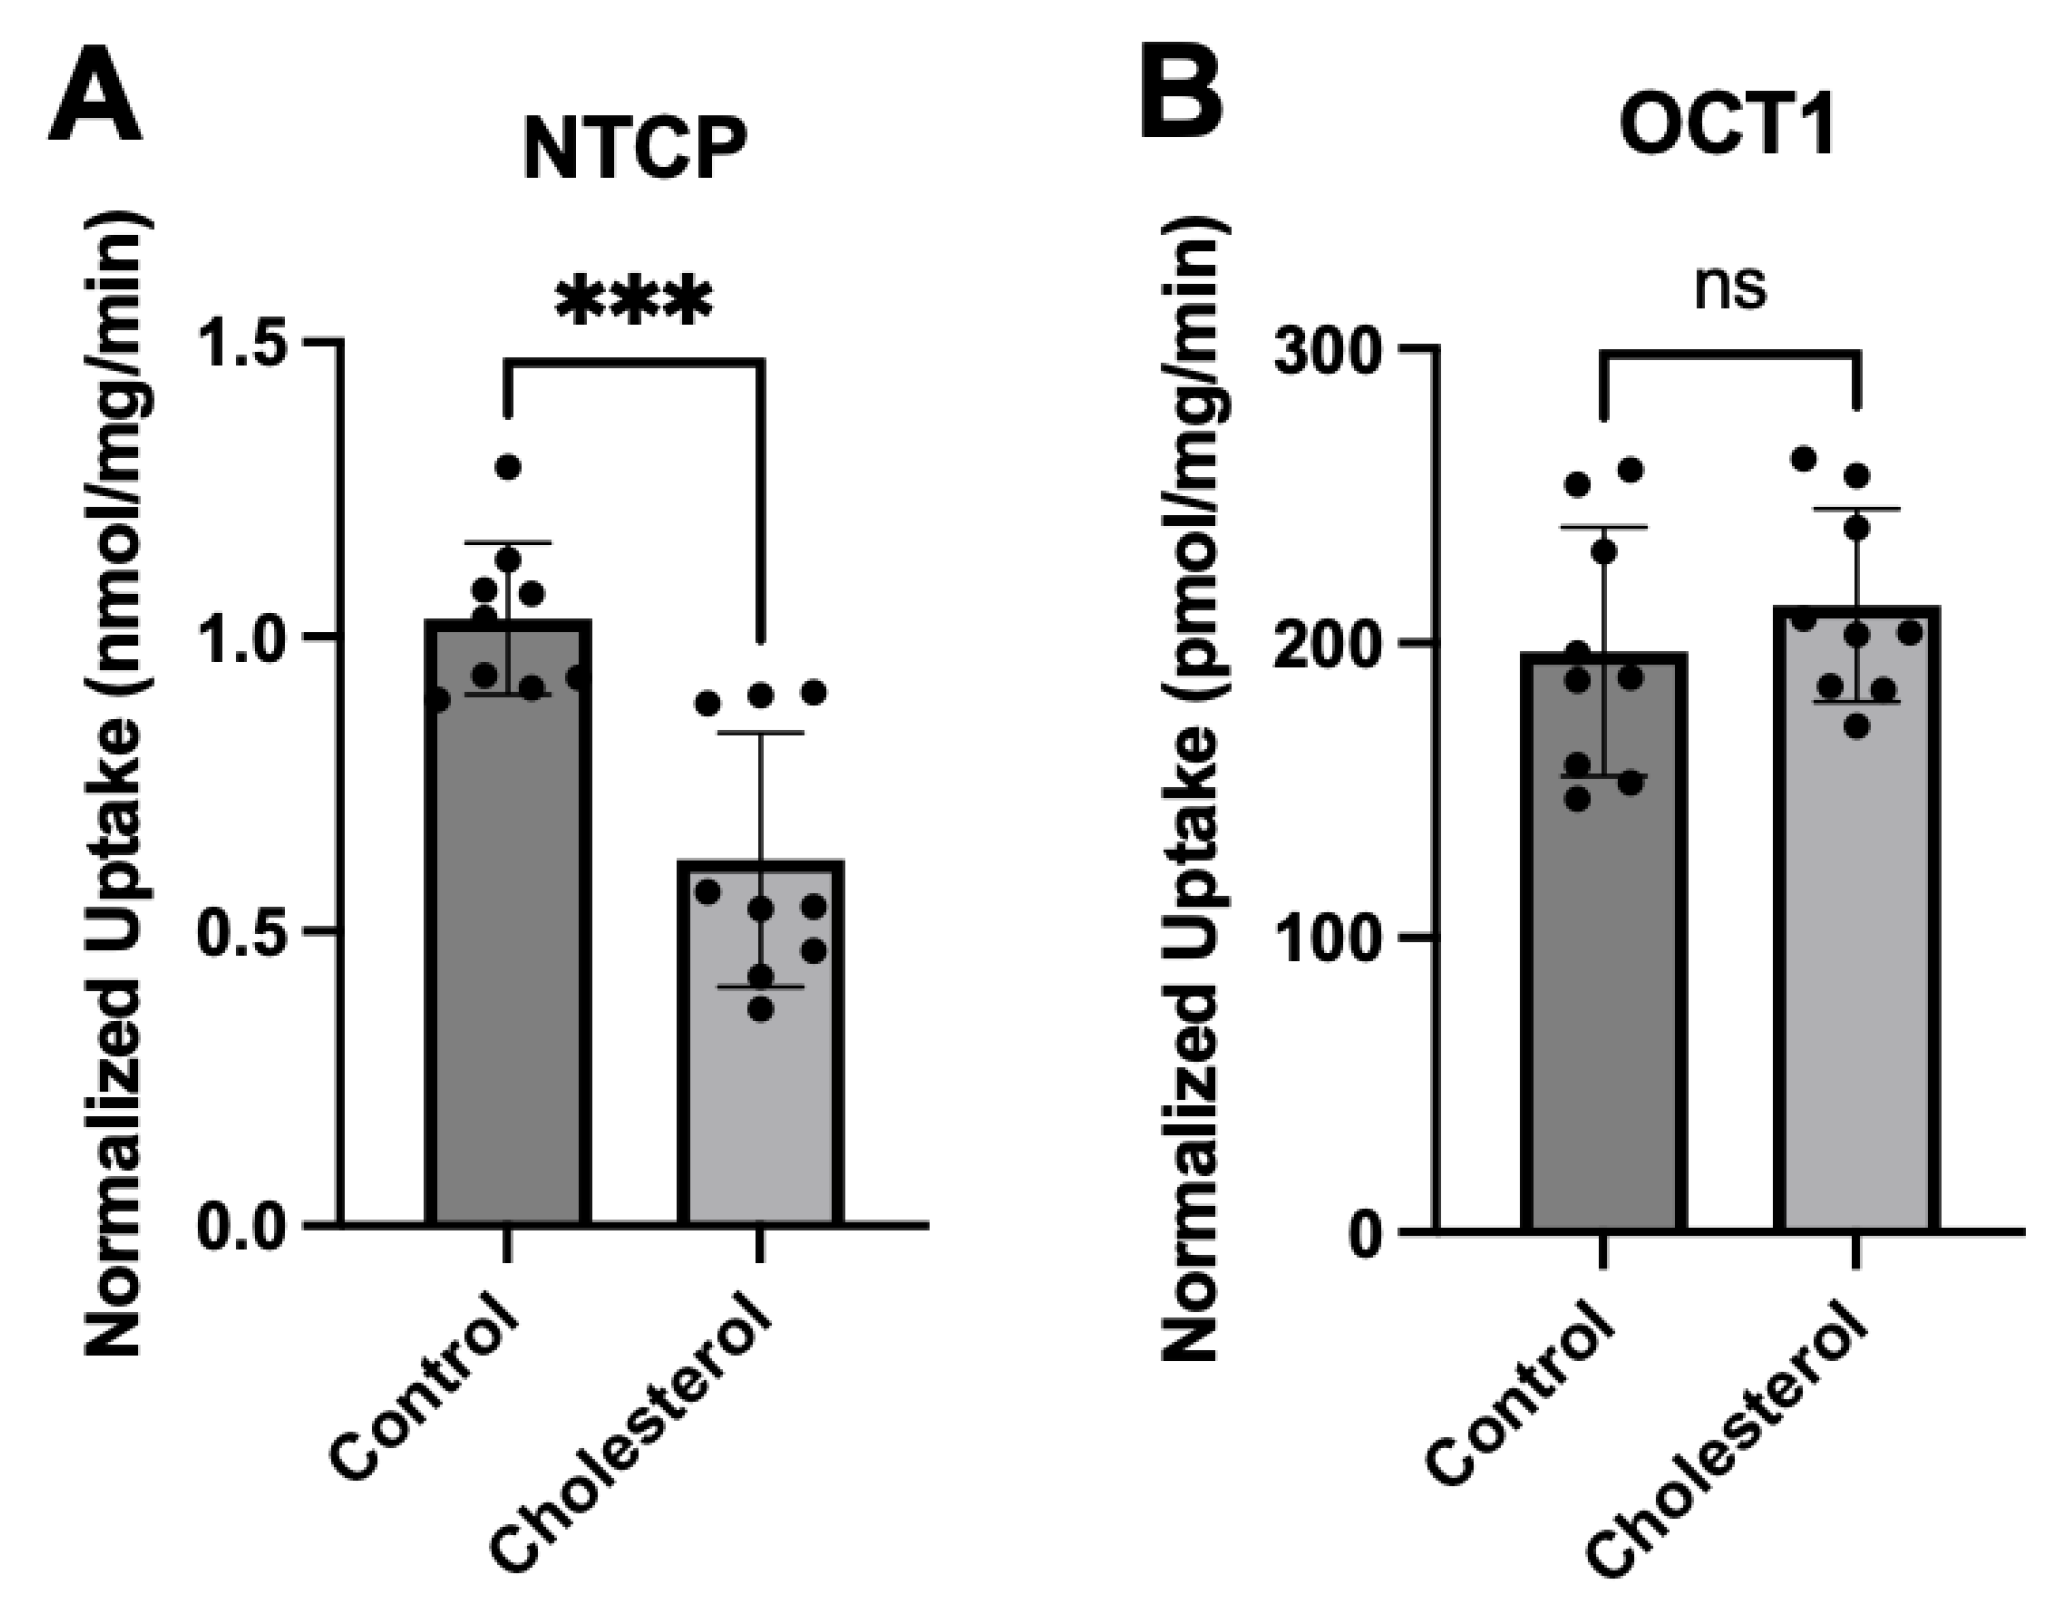
Figure 5.
Normalized kinetics of transporter-mediated substrate uptake following chronic cholesterol exposure. Uptake of increasing concentrations of (A) taurocholate or (B) MPP+ was measured at 37°C for 15 s in NTCP-expressing or OCT1-expressing HEK293 cells, respectively, and corrected for protein expression. Net uptake was calculated as mentioned previously. Values are means ± SEM of three independent experiments performed in triplicates. Circles represent the control conditions, triangles the added cholesterol conditions. The Michaelis–Menten equation in GraphPad Prism was used to fit the curves.
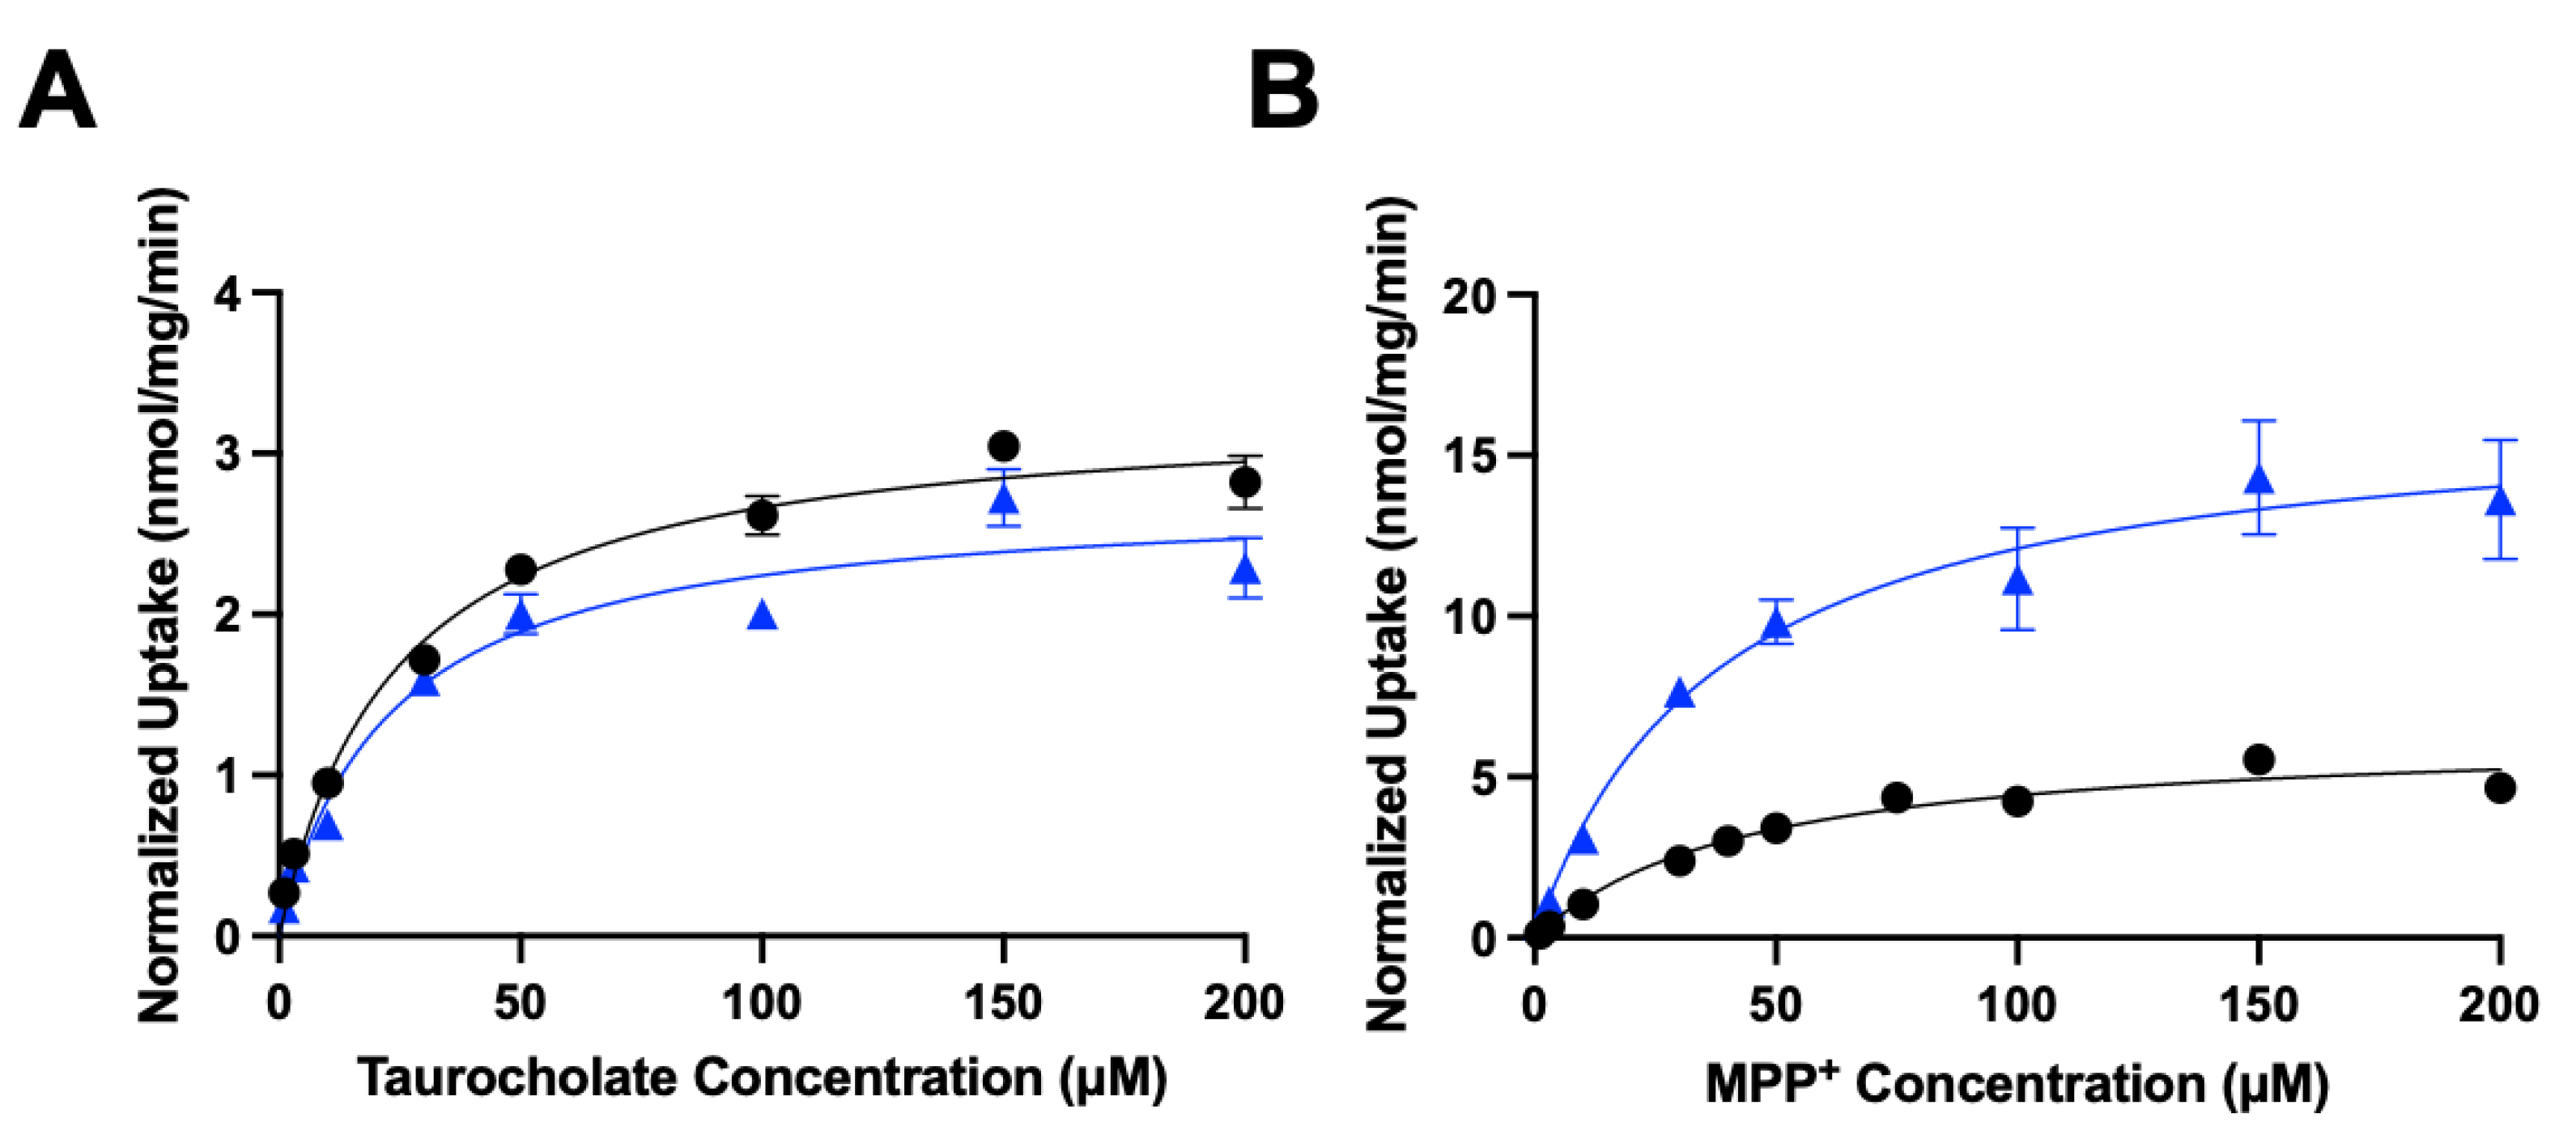
Figure 6.
Effect of ACAT inhibitors on the function and expression of (A) NTCP and (B) OCT1 after treatment with 0.05 mM for 24 hours. Cells were treated for 24 hours with 0.05 mM cholesterol in DMEM containing lipid-depleted FBS, in the absence (Control) or presence of the three ACAT inhibitors Sandoz 58-035 (12.5 μg/mL), Avasimibe (10 μM), or Cl-976 (10 μM). After the treatment uptake of 100 μM [3H]-taurocholate (NTCP) or 16.7 nM [3H]-MPP+ (OCT1) was measured (left panels). Using surface biotinylation, the transporter expression at the plasma membrane was quantified (middle panel) and used to normalize uptake (right panel). Three to five independent experiments were performed. Mean ± SD is shown. * p < 0.05, ** < 0.01, *** p < 0.001, **** p < 0.0001.
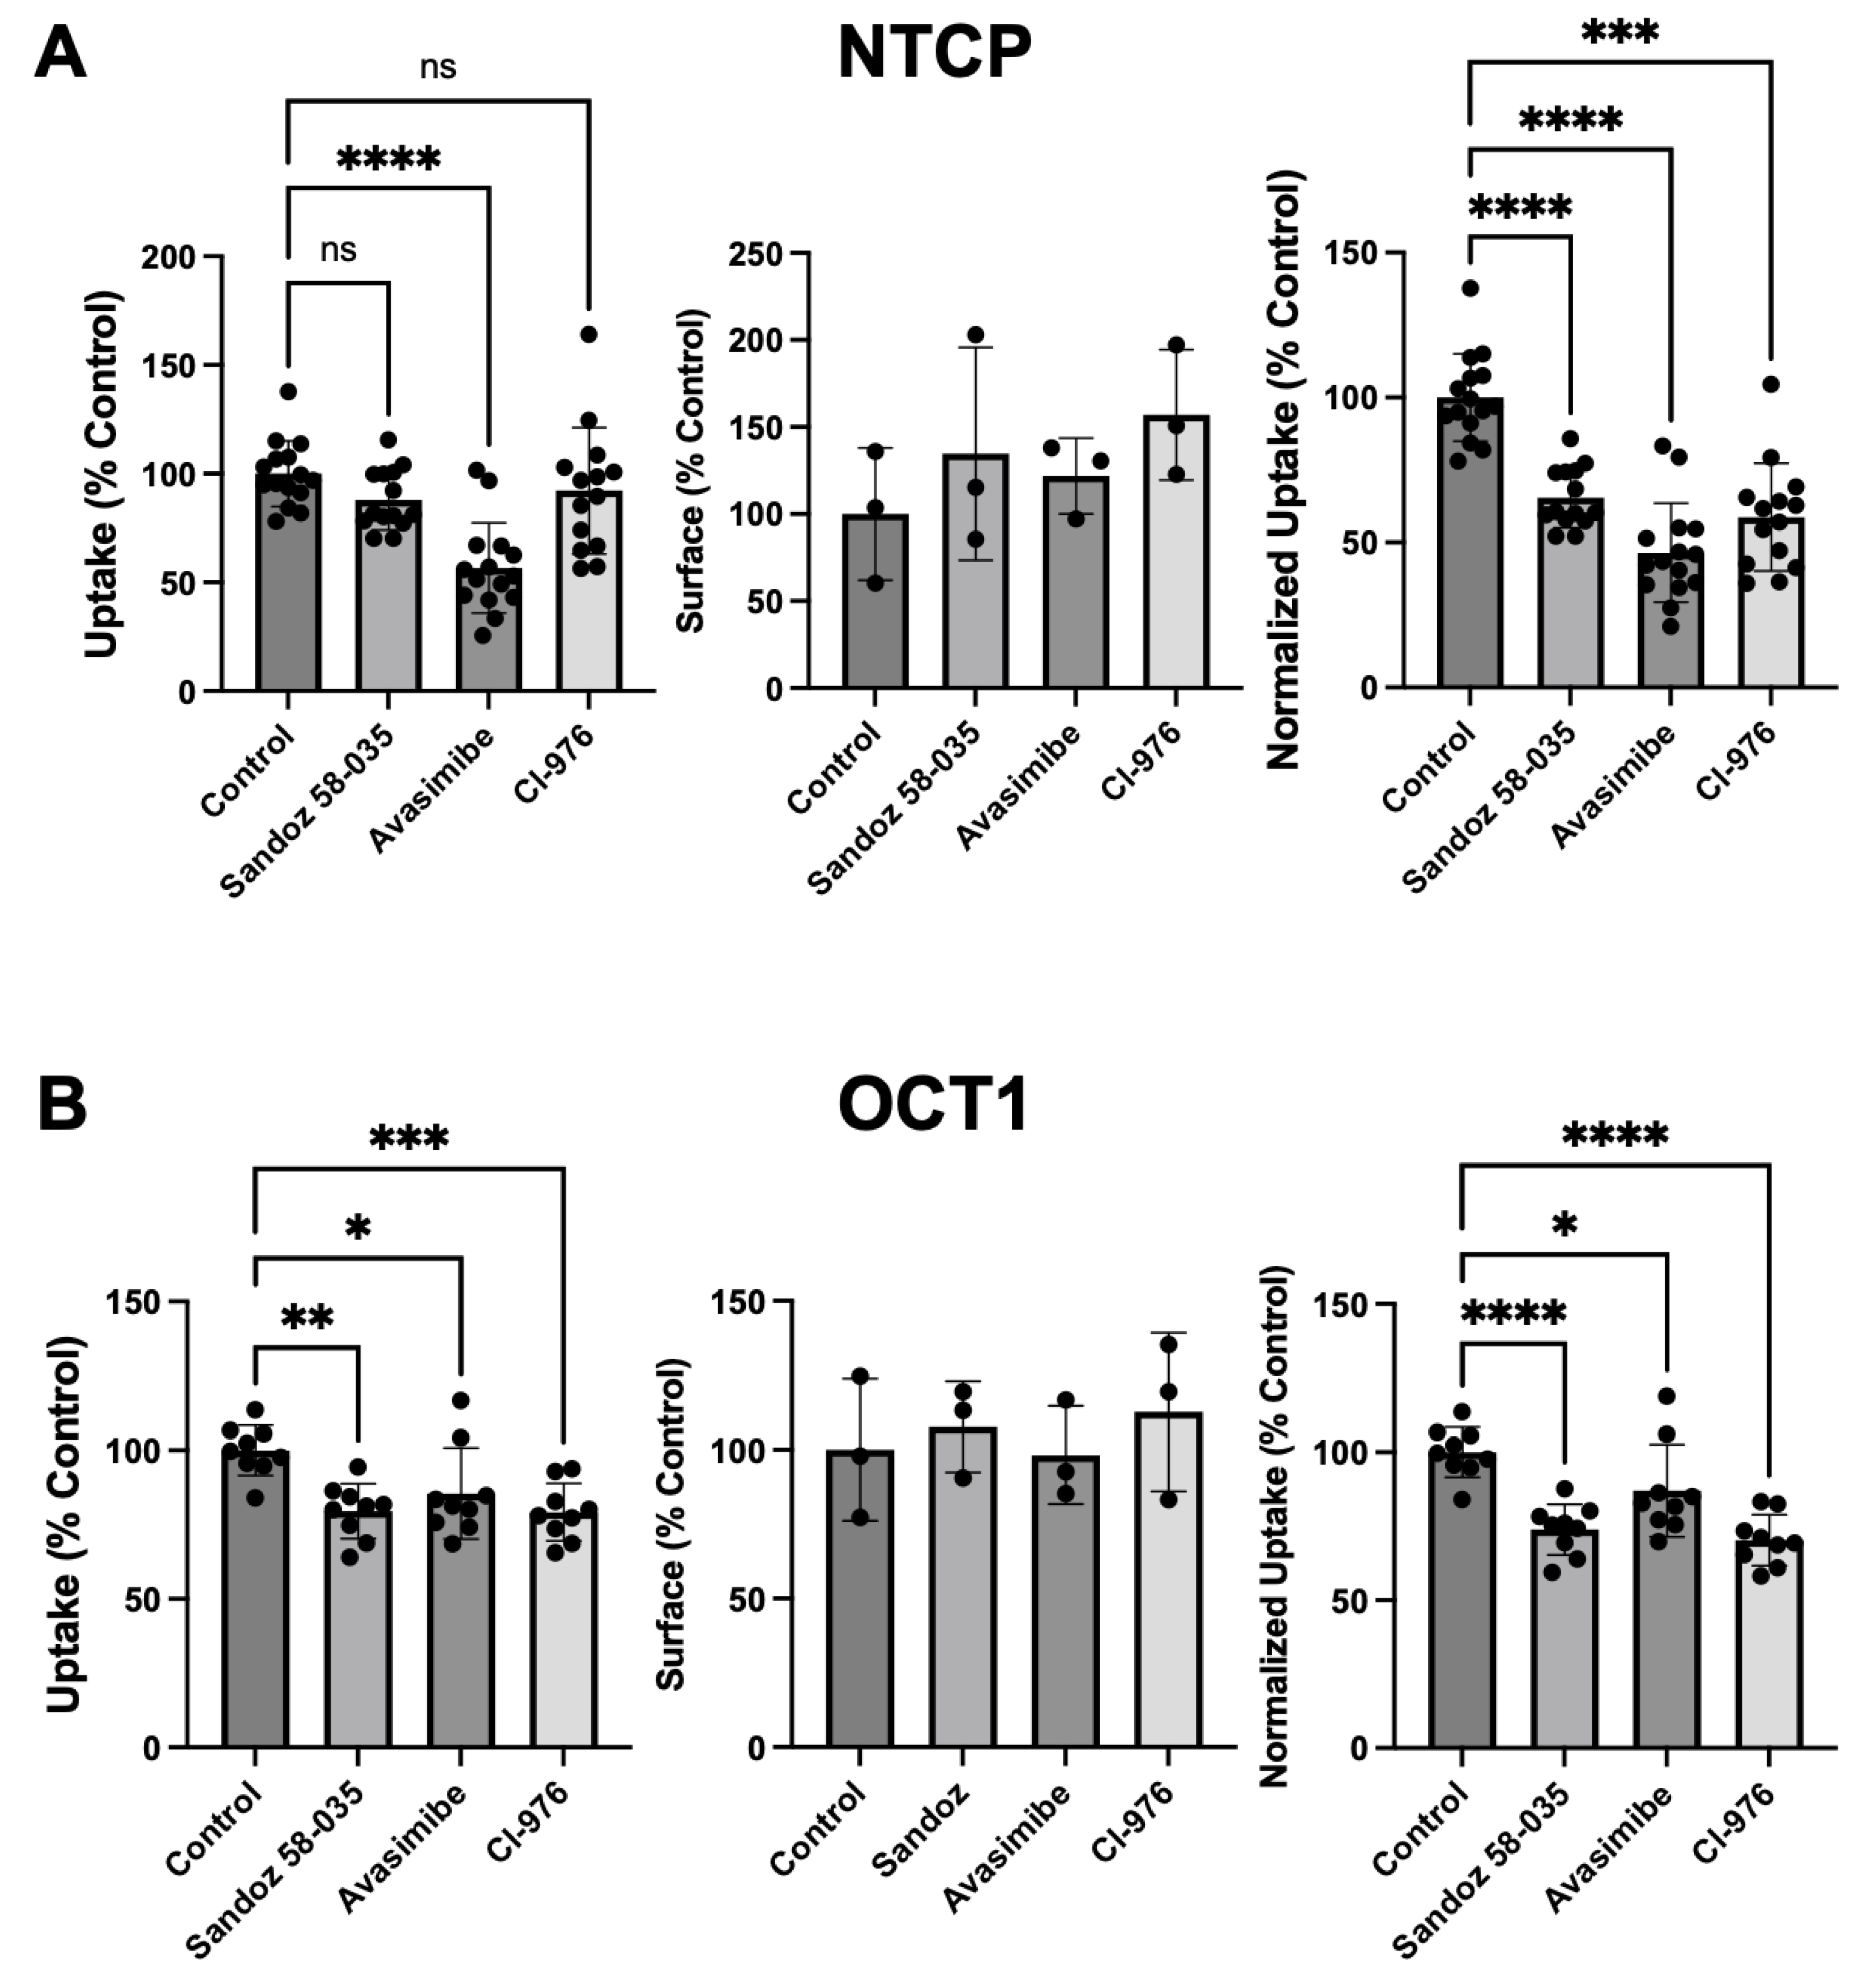

Table 1.
Kinetic parameters for NTCP- and OCT1-expressing HEK293 cells. Kinetic parameters, Km, Vmax, and the capacity (Vmax/Km), were calculated using the Michaelis–Menten equation in GraphPad Prism and are reported as the average ± SEM of at least three independent experiments performed in triplicates, * p < 0.05.
| Transporter | Parameters | Control | Cholesterol |
|---|---|---|---|
|
NTCP |
Km (µM) Vmax (nmol/mg/min) Vmax/Km (µl/mg/min) |
24.0 ± 4.0 3.3 ± 0.1 138 ± 23 |
22.7 ± 6.7 2.7 ± 0.2 119 ± 36 |
|
OCT1 |
Km (µM) Vmax (nmol/mg/min) Vmax/Km (µl/mg/min) |
44.4 ± 9.7 6.4 ± 0.5 144 ± 33 |
38.0 ± 6.3 16.7 ± 0.9 439 ± 77* |
Disclaimer/Publisher’s Note: The statements, opinions and data contained in all publications are solely those of the individual author(s) and contributor(s) and not of MDPI and/or the editor(s). MDPI and/or the editor(s) disclaim responsibility for any injury to people or property resulting from any ideas, methods, instructions or products referred to in the content. |
© 2025 by the authors. Licensee MDPI, Basel, Switzerland. This article is an open access article distributed under the terms and conditions of the Creative Commons Attribution (CC BY) license (http://creativecommons.org/licenses/by/4.0/).
Copyright: This open access article is published under a Creative Commons CC BY 4.0 license, which permit the free download, distribution, and reuse, provided that the author and preprint are cited in any reuse.


