
Submitted:
07 July 2025
Posted:
08 July 2025
You are already at the latest version
Abstract
This study develops and analyzes an optimal control model for the transmission dynamics of Mpox
across four countries (Nigeria, Spain, Italy, and the Democratic Republic of Congo (DRC)) with a focus
on evaluating the cost-effectiveness of awareness, effective treatment, and a combination of both control
strategies. Using a compartmental model and Pontryagin’s Maximum Principle, we implement numerical
simulations to assess the efficiency indices (EI), total cost (TC), and incremental cost-effectiveness ratios
(ICER) for awareness control only, treatment only, and combined control interventions. Results reveal
that while combined strategies achieve higher infection prevention, effective treatment only strategies
exhibit lower ICER values, indicating greater cost-effectiveness in all countries. These findings highlight
that while integrated approaches are epidemiologically impactful, targeted effective treatment interven-
tions may offer optimal public health value, particularly in settings with limited healthcare resources
like DRC and Nigeria.
Keywords:
Mpox transmission dynamics
; mathematical modeling
; strain-specific epidemiology
; optimal control
; incremental cost effectiveness ratio
; efficiency index
1. Introduction
Mpox, previously known as monkeypox, is a zoonotic viral infection caused by the monkeypox virus (MPXV), classified under the genus Orthopoxvirus in the Poxviridae family [1,2]. First identified in 1958 in laboratory monkeys in Copenhagen, Denmark, the disease was recognized as a human health concern in 1970, following the first confirmed human case in the Democratic Republic of Congo (DRC) [1,2,3]. In 2022, the World Health Organization (WHO) officially renamed the disease Mpox to mitigate the stigmatization associated with its former name [4]. Despite its classification as a neglected tropical disease, the resurgence of Mpox cases beyond endemic regions underscores the urgent need for targeted public health interventions, particularly in resource-limited settings where access to healthcare remains a challenge.
Epidemiologically, mpox remains endemic in several African countries, particularly in central and western Africa, where sporadic outbreaks have been documented since its discovery. The virus is characterized by two genetically distinct clades: Clade I (Congo Basin) and Clade II (West African). Clade I (with subclades Ia and Ib) is associated with a higher fatality rate for cases of approximately 10% and increased transmissibility, making it a critical public health concern in regions with limited healthcare infrastructure [2,5,6]. Clade II (with subclades IIa and IIb), specifically Clade IIb, is responsible for the global outbreak of 2022, exhibits a lower virulence but remains a significant epidemiological threat due to its potential for human-to-human transmission, particularly in densely populated urban centers [2,5,6]. These clades have spread significantly to Europe and North America; however, the threat posed by clade I remains low, while clade II mpox is still circulating at low levels.
The re-emergence of mpox beyond its endemic regions serves as a stark reminder of the global interconnectedness of infectious diseases. It underscores the importance of integrated surveillance systems, rapid response frameworks, and international cooperation to prevent and manage emerging zoonotic threats effectively. The 2022 outbreak marked a pivotal moment in mpox epidemiology, as the disease spread rapidly beyond its endemic regions to more than 100 countries, including Europe, the Americas, and Asia. This unprecedented spread highlighted the potential for global dissemination of the virus, driven by increased international travel, urbanization, and possibly asymptomatic transmission. The outbreak also underscored the urgent need for comprehensive surveillance, rapid diagnostic testing, and targeted public health interventions to curb the spread, particularly in settings with limited resources [7,8,9].
Moreover, mathematical modeling studies have been instrumental in elucidating the transmission dynamics of Mpox and identifying optimal control strategies. Ngungu et al. [10] developed a mathematical epidemiological model using real data from the United Kingdom to assess the impact of non-pharmaceutical interventions on the transmission dynamics of Mpox, highlighting the effectiveness of targeted control measures in mitigating infection spread. Furthermore, the dynamics of mpox transmission have been extensively studied through some novel modeling approaches, emphasizing the role of contaminated surfaces, asymptomatic infection, and co-infections with other diseases such as COVID-19. For instance, Hassan et al. [11] developed a deterministic model incorporating environmental transmission pathways and contaminated surfaces to emphasize the role of fomite transmission in sustaining outbreaks and to assess the stability of the disease-free and endemic equilibria. Their findings highlight that while effective control measures can reduce disease prevalence, the persistence of contaminated surfaces remains a significant risk factor for Mpox transmission. Similarly, Li et al. [7] assessed the impact of asymptomatic infection on disease spread in Nigeria, demonstrating that personal protection coupled with effective vaccination is crucial for mitigating outbreaks. Co-infection scenarios involving Mpox and other viral diseases such as COVID-19 have also been examined. Acheneje et al. [12] analyzed the concurrent transmission dynamics of both diseases, incorporating optimal control strategies aimed at reducing co-infection rates through social distancing, rodenticides, and vaccination. Their cost–benefit analysis underscores the importance of integrated control measures in minimizing both infection rates and associated costs.
Environmental factors have also been incorporated into mpox transmission models. Alshehri and Ullah [9] emphasized the impact of environmental viral concentration, showing that environmental contamination can significantly influence disease dynamics, particularly in densely populated urban settings. Their model recommends implementing optimal control strategies targeting environmental viral loads to effectively contain outbreaks.
Recent studies have further explored the application of optimal control theory to Mpox transmission dynamics and have assessed the effectiveness of intervention strategies such as vaccination, personal protective equipment, and isolation measures, underscoring the importance of context-specific control measures tailored to different epidemiological settings. Adepoju and Ibrahim [13] focused on vaccination and immunity loss following recovery, employing Pontryagin’s maximum principle to determine cost-effective control strategies. Rashid et al. [8] extended these efforts by developing a hybrid fractional Mpox model that integrates external factors, illustrating the benefits of targeted interventions in reducing the basic reproduction number and associated healthcare costs. Building on their team’s previous work on mathematical modeling approaches to investigate the transmission dynamics of the Mpox virus [14], Peter et al. [15] conducted a comparative analysis of cost-effective strategies for Mpox control, identifying the optimal combination of treatment and public awareness campaigns. Their findings indicate that while combined strategies are effective in reducing disease prevalence, targeted treatment-only interventions exhibit lower incremental cost-effectiveness ratios (ICERs), particularly in resource-limited settings like Nigeria and the DRC.
Building on these foundational studies and our previous work in [16], the present study develops and analyzes an optimal control model for Mpox transmission dynamics across four countries: Nigeria, Spain, Italy, and the DRC. By implementing a compartmental model and Pontryagin’s Maximum Principle, we aim to assess the cost-effectiveness of awareness, treatment, and combined control strategies through numerical simulations. The efficiency indices (EI), total cost (TC), and ICER for each intervention are evaluated, providing insights into the optimal public health strategies for mitigating Mpox outbreaks in diverse epidemiological contexts.
The remainder of this study is organized as follows: In Section 2, we develop a mathematical model to analyze the transmission dynamics of Mpox, extending it to include optimal control strategies focused on awareness, treatment, and a combination of both interventions. This section also derives the control reproduction number and characterizes the optimal control strategies using Pontryagin’s Maximum Principle. Section 3 presents numerical simulations to assess the impact of the proposed control strategies across four countries — Nigeria, Spain, Italy, and the Democratic Republic of Congo — evaluating the effectiveness of awareness-only, treatment-only, and combined control measures in reducing Mpox transmission. In Section 4, a cost-effectiveness analysis is conducted, involving the computation of Efficiency Indices (EI), Total Cost (TC), and Incremental Cost-Effectiveness Ratios (ICER) for each intervention scenario, identifying the most economically viable strategies in both resource-rich and resource-limited settings. Finally, in Section 5, we discuss the key findings, highlighting their implications for public health policy and identifying potential avenues for future research, particularly in optimizing intervention strategies for emerging zoonotic diseases in settings with limited healthcare resources.
2. Mathematical Model Formulation
The model we developed in this article takes into consideration the two strains (Clade I and Clade II) of the Mpox virus, which are based on two different infection pathways in the human population of the model. The total human population at time t, denoted by , is subdivided into susceptible humans , exposed humans , infectious humans based on Clade I , infectious humans based on Clade II , hospitalized humans , and recovered humans . So, the total human population is given by
while the mammal population is sub-divided into two compartments, susceptible and infectious , such that the total mammal population is given by
The total population of both human and mammal populations considered in the model dynamics is given as
Thus, the transmission model with two strain infection dynamics is represented by the following system of non-linear ordinary differential equations:
under the following initial conditions:
The effective contact rate with an infectious human or infectious mammal is defined as:
The schematic diagram of the model is presented in Figure 1 and the state variables and parameters of the model are described in Table 1. In the appendix, we present some mathematical analysis of model (4).
2.1. Development of Optimal Control Model
In this section, we aim to develop an optimal control model designed to reduce the incidence of Mpox in the selected countries Italy, Spain, the Democratic Republic of the Congo (DRC), and Nigeria. This model incorporates three distinct control variables:
- Awareness Campaign : This control represents initiatives aimed at preventing Mpox through educational measures. It leverages social media, mainstream media, and civil society organizations, including religious groups, to disseminate information and promote preventive behaviors.
- Effective Treatment and Management : This control focuses on specific antiviral treatments for Mpox, including tecovirimat (TPOXX), brincidofovir, and cidofovir, to improve patient outcomes and reduce disease transmission.
These control measures are integrated into the model 4 to optimize the mitigation strategies of Mpox in selected countries.
under the following initial conditions:
The goal is to reduce the number of infected individuals for both Clade I and Clade II while keeping intervention costs minimal. The control measures include for awareness campaigns, for effective treatment. Mathematically, this objective is achieved by minimizing the following cost function, formulated as a quadratic function of the control variables to align with established standards in the literature [17,18,19,20]. Thus, the model’s objective functional is given by:
and
Thus, the control set is defined as
where are Lebesgue measurable functions satisfying
From Equation (9), and denote the initial and final time, respectively. The parameters and represent weight constants corresponding to the exposed individuals, individuals infected with strain I, individuals infected with strain II, and hospitalized individuals, respectively. These weights reflect the relative importance of reducing specific population groups to effectively mitigate the spread of Mpox in selected countries. Additionally, (for ) are weights designed to capture the relative costs or efforts associated with implementing each time-dependent control strategy.
For the purpose of this study, we assume hypothetical values for the upper limits of the control functions:
However, these values are selected based on the assumption that they are realistically achievable given the available resources.
2.2. Control Reproduction Number
We establish a threshold parameter to control Mpox spread in selected countries using the next-generation matrix method. This approach is widely recognized and reliable, as demonstrated in related works [3,19,21,22]. To achieve this, model Equation (11) is simplified to focus on the compartments relevant to disease transmission.
for simplification while the control reproduction number is computed as:
in the absence of control measure to mitigate the spread of Mpox in each of the countries, the control reproduction number computed becomes the basic reproduction number computed as:
In Figure 2, the effect of the control measure on the control reproduction number in Equation (12) is illustrated by plotting the transmission rate () against the control measure () for selected countries. The visualization shows that as the transmission rate decreases and disease awareness increases, the reproduction number gradually declines over time.
2.3. Characterization of the optimal control
The optimal control variables , associated with the three intervention strategies, along with their corresponding state variables , are determined by applying Pontryagin’s Maximum Principle [17,23]. The necessary conditions for optimality are derived accordingly, while the terminal conditions for the adjoint variables are specified using the transversality conditions as described by Hartl [18]. Thus, the Hamiltonian is given by:
where are the adjoint variables. Thus, the Pontryagins maximum principle [18] is applied.
The optimal solution for can be determined by applying the necessary conditions established by Pontryagin’s principle. This process entails differentiating with respect to each control variable and solving the resulting equations. Through this approach, we obtain the expressions for the optimal control variables as follows:
Then the following optimal conditions for are obtained as:
ensuring the optimal values obtained in Equation (15) is always in the interval the optimal value for each control is then defined as follows:
By substituting into Equation (14), the optimal condition for the Hamiltonian is obtained. Furthermore, the adjoint system is derived by computing the partial derivatives of with respect to each state variable
leading to the following expressions:
With the transversal condition that for
3. Numerical analysis
This section explores the impact of the two optimal control strategies in mitigating the spread of monkeypox within the human population. The primary focus is on evaluating the effectiveness of combined control measures in halting disease transmission. To achieve this, we conduct a numerical simulation of the monkeypox model, comparing scenarios with and without optimized control interventions to assess the influence of the control variables introduced earlier. However, the effects of different control strategy are represented by and . These strategies are systematically categorized into two groups: single control, and combine controls allowing for a structured analysis of the three possible control strategies considered in this research. Specifically, the strategies are defined as follows:
- Strategy 1: Implements only awareness strategy .
- Strategy 2: Implements only recommended effective treatment strategy .
- Strategy 3: Implements both awareness and recommended treatment strategies combine and .
The model simulations utilize parameter values from existing literature [16] for selected countries, The optimality system integrates the model equations, adjoint equations, and control characterizations, solved in MATLAB R2022B using the forward-backward sweep method. This approach involves a 16-dimensional system of ordinary differential equations solved iteratively with the fourth-order Runge-Kutta method. Paramater values use for the numerical simulation are presented in Table 2 and Table 3 with a final time horizon of 100 days. The weight coefficients and cost functional are assigned as ().
Here, we clarify the choice to choose our cost. The higher expenditure associated with awareness efforts, as compared to treatment and zoonotic control, is largely due to the extensive scope and continuity required for effective implementation. Public education campaigns often involve repeated communication through various channels such as radio, television, social media, and community outreach programs. These activities demand ongoing investments in logistics, personnel, training, and materials to ensure the message reaches diverse and widespread populations.While treatment and zoonotic control typically involve more direct, targeted actions such as administering medication to confirmed cases or managing animal reservoirs in specific areas which can be executed with more contained costs. As a result, promoting awareness on a large scale tends to incur greater overall financial commitment.
Thus, we assume that , indicating that the cost of awareness is higher than the cost of treatment and zoonotic control.
Model (4) parameter values are cited from the literature for Spain, Italy, Nigeria, and the Democratic Republic of the Congo. The parameters are hypothetically chosen, while others are taken from the literature: [24], [1], and [2,3,25].
3.1. Optima Control Simulation
In the following sections, a detailed simulation is presented, along with an in-depth analysis and discussion of intervention strategies.
As depicted in Figure 3a Nigeria, with its large and densely populated regions, faces increased risk of rapid Mpox transmission, especially in urban centers where close contact is common. The No control scenario (in solid red line), which shows the highest peak and slowest decline, reflects what could happen in the absence of intervention widespread transmission and prolonged outbreaks. The Treatment Only control and Awareness Control Only strategies offer moderate benefits, but alone they are insufficient to quickly suppress Mpox outbreaks, likely due to logistical challenges to access healthcare care and the reach of treatment. Interestingly, treatment alone performs better than awareness, suggesting that strengthening clinical response infrastructure may yield faster short term impact in Nigeria. The most effective result comes from the combination of Treatment and Awareness (green line), which achieves the fastest decline in Mpox disease prevalence. This aligns with Nigeria’s need for comprehensive strategies that include not just clinical treatment, but strong public awareness campaigns to reduce risky behavior, encourage early reporting, and counter misinformation.
In light of the current Mpox situation in Italy characterized by low but ongoing reported cases, the control plot depicted in Figure 4a highlights the comparative effectiveness of various intervention strategies. The simulation indicates that while treatment alone moderately reduces disease burden, public awareness campaigns (black solid line) have a stronger initial impact by limiting exposure and transmission. Notably, the combination of treatment and awareness achieves the most substantial and rapid decline in Mpox prevalence. This outcome supports the implementation of integrated public health measures in Italy, reinforcing the need for both medical readiness and sustained risk communication to prevent a potential resurgence.
The optimal control analysis for the Spain population as depicted in Figure 5a reveals that combining treatment and public awareness significantly reduces Mpox disease prevalence more effectively than either strategy alone. Without any control measures (dotted line in red), the disease peaks higher and declines slowly, indicating a severe outbreak. Implementing treatment alone moderately reduces prevalence of Mpox disease in spain, but awareness campaigns alone outperform treatment by promoting early prevention. However, the synergy of both controls results in the fastest and steepest decline in cases, achieving near-eradication within 60 days. Therefore, integrated intervention is the most effective strategy for controlling Mpox in Spain. Furthermore, In Figure 5b both awareness and treatment controls were used at full strength for most of the 100 days. This helped reduce Mpox cases quickly and effectively. The controls dropped near the end as the disease was brought under control.
In Figure 6a, the plot illustrates the effectiveness of various control strategies on Mpox prevalence in the Democratic Republic of the Congo (DRC). The red curve, representing no control, shows a sustained high burden of disease, reflecting the current challenges faced by the DRC, such as limited healthcare access and weak surveillance systems. The black curve (awareness only) offers a better improvement in the prevalence of the Mpox disease, indicating the importance of public education and publicity alone has positive impact in curtailing the disease. The blue dashed line (treatment only) demonstrates slight improvement, emphasizing the importance of timely medical intervention. However, the green dotted curve (treatment and awareness) shows the most significant reduction in Mpox cases, highlighting that a combined strategy is the most effective. This supports the need for integrated policies that improve both public health education and access to treatment in DRC.
4. Cost Effectiveness Analysis
Evaluating the cost dynamics of monkeypox management (Mpox) in this study involves analyzing two main controls: awareness (prevention) costs and treatment (curative) costs. Both are integral to a country’s public health strategy, but they have different structures and financial implications in selected countries. Awareness campaigns are primarily focused on prevention reducing the spread of the disease through education and behavior change. On the other hand, treatment costs are incurred when individuals are diagnosed and require medical intervention. These costs can be significant, especially for moderate to severe cases. The cost of hospitalization includes expenses related to inpatient care, bed space, feeding, and utilities. Symptomatic treatments, such as antipyretics, antivirals, and antibiotics to manage secondary bacterial infections, contribute to the overall cost of treatment.
In countries like Nigeria, Spain, Italy, and the Democratic Republic of Congo (DRC), the per-case cost of treating Mpox is generally higher than that of conducting awareness campaigns, mainly due to the financial burden of hospitalization and specialized healthcare services. Although awareness interventions are typically more affordable on a per-unit basis, their cumulative cost can exceed that of treatment when deployed extensively over time, especially in regions with low incidence rates. These economic considerations are reflected in the construction of the objective functional in Equation (9), where weights are assigned to each compartment as follows: , , , and . To reflect realistic cost differences, the cost coefficients for awareness and treatment are hypothetically set such that awareness () is less costly than treatment (). Accordingly, Figure 7 presents the efficiency indices for different control strategies—awareness alone, treatment alone, and combined control—highlighting their respective effectiveness in minimizing infections across the countries studied, independent of cost considerations.
However, in Figure 7 control is the most effective in all countries due to its number of averted infections, especially in DRC. However, Control adds value mainly in Spain and Nigeria but is weak alone in DRC. Combining both controls () gives the highest efficiency, showing strong synergy in most countries.
4.1. Incremental Cost Effectiveness Ratio
The Incremental Cost-Effectiveness Ratio (ICER) is a metric used to assess the relative cost and health benefits of two competing interventions, particularly when resources are limited. It is computed using the following expression:
When comparing two strategies (L and M), and M proves to be more effective than L (i.e., ), ICER becomes a key indicator for evaluating their relative value. Specifically, ICER quantifies the additional cost required to gain one extra unit of effectiveness when transitioning from strategy L to strategy M.
The ICER for the baseline strategy L is calculated as the ratio of its total cost () to its total effectiveness ():
For the more effective strategy M, the ICER is determined by assessing the cost and effectiveness differences between it and the baseline strategy L. This is calculated as:
It is essential to clearly define the column headers for Table ( Table 4, Table 5 and Table 6). Column (A) represents the total infection in the absence of any control measures. Column (B) denotes the total infection associated with the implementation of a specific control strategy. The Total Infection Averted (TIA), given by the difference (), quantifies thetotal number of infection averted through the application of the control strategy.
To determine the most cost-effective control strategy between the combined control () and the awareness-only strategy (), we apply the incremental cost-effectiveness ratio (ICER) formulas as defined in Equations (26) and (27), using the data presented in Table 4. Specifically, for Nigeria, the ICER values are computed as follows:
Since , the awareness-only strategy () is considered less cost-effective and is thus eliminated from further consideration in Table 4. This indicates that the combined application of awareness and treatment controls yields a greater reduction in infection at a lower cost per case averted, making it the more economically efficient option.
Similarly, to assess the cost-effectiveness of the control strategies in Spain, we apply Equations (26) and (27) using the corresponding values from Table 4. The ICER values for the combined strategy () and the awareness-only strategy () are calculated as follows:
Given that , the awareness-only control strategy () is considered less cost-effective in the Spanish context. Therefore, it is excluded from further evaluation in Table 4, reaffirming the economic advantage of the combined control strategy in achieving greater infection reduction per unit cost.
For Italy, the cost-effectiveness of the combined control strategy () compared to the awareness-only strategy () is evaluated using the ICER formulas. Using the data in Table 4, the computations are as follows:
Since , the awareness-only control strategy () is deemed less cost-effective for Italy and is thus excluded from Table 4. The combined control () offers a more efficient use of resources in minimizing infections.
For the Democratic Republic of Congo (DRC), we analyze the ICER values to determine the more cost-effective strategy between () and (), using the values from Table 4:
As , the awareness-only strategy () is again considered less cost-effective in the DRC and is excluded from further analysis. The combined strategy () is identified as the more cost-efficient approach for controlling Mpox infections. Thus, based on earlier ICER analyses obtained for each country, the awareness-only strategy () was eliminated and the result presented in Table 5.
To further evaluate the cost-effectiveness of the implemented control strategies, we apply the incremental cost-effectiveness ratio (ICER) formulas defined in Equations (26) and (27). Using the data from Table 5, we compare the combined control strategy () with the treatment only strategy (). The resulting ICER values, alongside key efficiency and cost metrics, are presented in Table 6.
From Table 6, it is evident that the treatment only strategy () consistently exhibits a lower ICER value compared to the combined control () across all countries. This indicates that, from a cost effectiveness perspective, implementing effective treatment and management control alone yields greater economic efficiency in preventing infections than the more resource intensive combined strategy ().
5. Conclusions
5.1. Discussion and Concluding Remarks
The analysis of cost-effectiveness for Mpox control strategies across Nigeria, Spain, Italy, and the DRC reveals critical insights into how resources can be optimally allocated for epidemic management in these regions. The results, drawn from Table 6, show that the effective treatment only strategy () is consistently more cost effective than the combined control strategy () in all countries.
In Nigeria, where healthcare infrastructure may be stretched, the ICER for effective treatment only () is significantly lower at 0.00004 compared to the combined control strategy (), which stands at 0.00015. This indicates that prioritizing effective treatment rather than trying to combine it with awareness campaigns will yield more efficient use of limited resources. The cost effectiveness of effective treatment only becomes even more important when considering Nigeria’s resource constraints and the need for rapid, and impactful interventions that can be scaled effectively across the country.
Similarly, in Spain, with a relatively more robust healthcare system but still facing pressures from occasional outbreaks, the ICER for effective treatment only (0.00023) is lower than the combined control strategy (0.00059). This suggests that, even in a high income country, effective treatment interventions should take precedence as they offer the greatest cost benefit. Spain can benefit from maintaining a clear focus on treatment, which will allow for a more efficient allocation of resources without compromising the response to the epidemic.
In Italy, where the healthcare system is advanced but still vulnerable to the pressures of managing infectious disease outbreaks, the effective treatment only strategy () demonstrates a significant cost advantage, with an ICER of 0.00016, compared to the combined strategy () with ICER of 0.00063. Given Italy’s extensive experience in the management of infectious diseases (as seen in its response to COVID-19), the findings suggest that even in well funded healthcare systems, effective treatment interventions are more cost effective and should remain the focal point of control efforts.
In DRC, a country with a fragile healthcare system and limited resources, the effective treatment only strategy is again more cost effective, with an ICER of 0.00004, much lower than the combined strategy at 0.00019. The findings for DRC highlight the importance of focusing on treatment as the primary response, particularly in low resource settings where cost efficiency is a key consideration. Given the challenges DRC faces with healthcare access and infrastructure, an effective treatment focused approach could potentially save more lives without overburdening the already limited healthcare capacity.
However, across these diverse settings ranging from low resource environments like Nigeria and DRC to more advanced systems in Spain and Italy the effective treatment only strategy proves to be the most cost effective option for controlling Mpox. This aligns with the realities each country faces in terms of healthcare infrastructure, financial constraints, and the need for effective measures to control epidemics.
5.2. Limitation of the Study and Future Work
One notable limitation of this study is the exclusion of zoonotic transmission dynamics in the modeling framework. Specifically, the model does not account for human interactions with animal reservoirs, such as those working in zoos, wildlife parks, veterinary clinics, pet ownership settings, and related environments. Incorporating a dedicated compartment to represent individuals who are regularly exposed to potential animal hosts would enhance the model’s realism and provide a more comprehensive understanding of Mpox transmission pathways. Future studies should consider integrating these dynamics to better inform control strategies, particularly in regions where human-animal interactions are frequent and significant.
Author Contributions
Conceptualisation, K.O., Y.T.T. and I.O.I.; Methodology, K.O., Y.T.T. and I.O.I. Software, I.O.I., A.A., and K.O.; Validation, I.O.I. and K.O.; Formal analysis, K.O and I.O.I.; Investigation, I.O.I. and K.O.; Resources and funding, K.O.; Data curation, I.O.I., A.A., and K.O.; Writing—original draft preparation, K.O., Y.T.T, and I.O.I.; Writing—review and editing, K.O., A.A., Y.T.T. and I.O.I.; Visualisation, I.O.I., A.A., and K.O.; Supervision, I.O.I. and K.O.; Project Administration, I.O.I. and K.O. All authors have read and agreed to the published version of the manuscript.
Funding
No funding is received for this project.
Institutional Review Board Statement
Not applicable.
Informed Consent Statement
Not applicable.
Data Availability Statement
All used data are publicly available, and the code used to generate plots can be requested from the corresponding author.
Acknowledgments
The authors would like to appreciate the Black in Mathematics Association (BMA) for providing the collaborative platform to carry out this research.
Conflicts of Interest
The authors declare that there is no competing interest.
Appendix A. Mathematical Model Analysis
Here, we aim to qualitatively analyze the dynamic properties of the strain Mpox dynamics model 4.
Appendix A.1. Positivity and Boundedness
For model 4 to be epidemiologically meaningful, it is imperative to show that all its state variables are non-negative for all time (t), and that is indeed bounded. Thus, we adopt the following theorem:
Theorem A1.
let the initial values for the model 4 be . Then the solutions are positive for all time .
Proof.
Let Thus, We have, from the first equation of model 4 that
which can be written as:
so that
Similarly, this can be shown that . □
The SEIHR X SI formulated model is represented by differential equations in system 4, which is to be analyzed in a feasible region , and all state variables and parameters of the model are assumed to be positive . The bounded region is obtained through the following lemma.
Lemma A1.
The compact defined as () is a positively invariant set, which attracts all positive orbits in .
Proof.
According to the system of Equation (4), we have: Proof. Since and , then the derivative of is given by
and
Simplifying eqn (A1) becomes:
Since and for all , eqn (A3) becomes:
Integrating eqn (A4) and solving gives:
Similarly, solving the second equation of (A2):
Therefore, as and . Hence:
□
This implies that and are the upper bond for human population and mammal reservoirs, respectively. Thus, from Lemma A1 the set is positive invariant with respect to the system (4). Then we conclude that the set is positively invariant and all solutions of system (4) are non-negative and epidemiologically well-posed.
Appendix A.2. Disease-Free Equilibrium
At the disease-free equilibrium (DFE), the compartment The DFE of the model , is given as
To compute the basic reproduction number , we used the next-generation matrix approach. The rate of transfer vectors into and out of the affected compartments f and v respectively, are given by
The Jacobian matrix of f and v are given by;
So that,
where is positive since all parameters are positive and .
Appendix A.3. Existence and uniqueness of solution
We show that eqn (4) has a unique solution under the condition eqn (5) using the Lipschitz condition.
Consider a general form of ODE with . If f is continuous and has partial derivatives that are continuous in the region , then is Lipschitz continuous.
We re-write our model 4 in the form with solution
Lemma A2.
Let be continuous differentiable at .
Theorem A2.
The model (4) has a unique solution if is continuous and have continuous partial derivative.
Proof.
Some partial derivatives of are given below
Appendix A.3.1. Endemic equilibrium
The model (4) has an endemic equilibrium with is given as:
Substituting Equation (A.3.1) into the forces of infection and and simplifying, such that
we have,
where , , , , , ,.
Appendix A.4. Local stability of Mpox-free equilibrium
We analyze the local stability of Mpox free equilibrium of the model system (4) by using the control reproduction number in the following theorem as described in [26].
Theorem A3.
The Mpox free equilibrium , of the model (4) is locally asymptotically stable in the biological feasible region if and unstable if .
Proof.
In order to prove Theorem A3, the Jacobian matrix of the model (4) was obtained at Mpox disease-free equilibrium , where , and and . as
From eqn (A11), it is sufficient to show that all the eigenvalues of are negative. We obtain the first four eigenvalues as: , while the remaining eigenvalues can be obtained from the sub-matrix , which is given by:
The solutions of the characteristic polynomial for eqn (A12) are given as
where
Applying Routh-Hurwitz criterion, the cubic eqn (A13) will have a roots with negative real parts if and only if Clearly, . As a result, the disease free equilibrium is locally asymptotically stable if
□
References
- WHO. Mpox (monkeypox), 2024. https://www.who.int/news-room/fact-sheets/detail/monkeypox [Accessed 02-03-2024].
- NCDC. MonkeyPox, 2022. https://ncdc.gov.ng/ncdc.gov.ng/diseases/factsheet/55 [Accessed 02-03-2024].
- Idisi, O.I.; Yusuf, T.T.; Adeniyi, E.; Onifade, A.A.; Oyebo, Y.T.; Samuel, A.T.; Kareem, L.A. A new compartmentalized epidemic model to analytically study the impact of awareness on the control and mitigation of the monkeypox disease. Healthcare Analytics 2023, 4, 100267. [Google Scholar] [CrossRef]
- WHO. WHO recommends new name for monkeypox disease, 2022. https://www.who.int/news/item/28-11-2022-who-recommends-new-name-for-monkeypox-disease [Accessed 02-03-2024].
- McCollum, A.M.; Hill, A.; Shelus, V.; Traore, T.; Onoja, B.; Nakazawa, Y.; Doty, J.B.; Adesola YinkaOgunleye, B.W.P.; Hutsona, C.L.; Lewis, R. Weekly epidemiological record Relevé épidémiologique hebdomadaire, 2023. https://openwho.org/courses/monkeypox-intermediate.
- CDC. About Mpox | Mpox | Poxvirus | CDC — cdc.gov, 2024. https://www.cdc.gov/poxvirus/mpox/about/index.html [Accessed 02-03-2024].
- Li, S.; Samreen.; Ullah, S.; AlQahtani, S.A.; Tag, S.M.; Akgül, A. Mathematical assessment of Monkeypox with asymptomatic infection: Prediction and optimal control analysis with real data application. Results in Physics 2023, 51, 106726. [CrossRef]
- Rashid, S.; Bariq, A.; Ali, I.; et al. Dynamic analysis and optimal control of a hybrid fractional monkeypox disease model in terms of external factors. Scientific Reports 2025, 15, 2944. [Google Scholar] [CrossRef] [PubMed]
- Alshehri, A.; Ullah, S. Optimal control analysis of Monkeypox disease with the impact of environmental transmission. AIMS Mathematics 2023, 8, 16926–16960. [Google Scholar] [CrossRef]
- Ngungu, M.; Addai, E.; Adeniji, A.; Adam, U.M.; Oshinubi, K. Mathematical epidemiological modeling and analysis of monkeypox dynamism with non-pharmaceutical intervention using real data from United Kingdom. Frontiers in Public Health 2023, 11, 1101436. [Google Scholar] [CrossRef] [PubMed]
- Hassan, A.H.; Aldila, D.; Noor Aziz, M.H. Optimal control and stability analysis of monkeypox transmission dynamics with the impact of contaminated surfaces. Frontiers in Applied Mathematics and Statistics 2024, Volume 10 - 2024. [CrossRef]
- Acheneje, G.O.; Omale, D.; Atokolo, W.; Bolaji, B. Modeling the transmission dynamics of the co-infection of COVID-19 and Monkeypox diseases with optimal control strategies and cost–benefit analysis. Franklin Open 2024, 8, 100130. [Google Scholar] [CrossRef]
- Adepoju, O.; Ibrahim, H. An optimal control model for monkeypox transmission dynamics with vaccination and immunity loss following recovery. Healthcare Analytics 2024, 6, 100355. [Google Scholar] [CrossRef]
- Peter, O.J.; Kumar, S.; Kumari, N.; Oguntolu, F.A.; Oshinubi, K.; Musa, R. Transmission dynamics of Monkeypox virus: a mathematical modelling approach. Modeling Earth Systems and Environment 2022, pp. 1–12. [CrossRef]
- Peter, O.J.; Madubueze, C.E.; Ojo, M.M.; et al. Modeling and Optimal Control of Monkeypox with Cost-Effective Strategies. Modeling Earth Systems and Environment 2023, 9, 1989–2007. [Google Scholar] [CrossRef]
- O., I.I.; K., O.; B., S.V.; M., Y.M.; S., O.O.; O., E.H. Investigating Mpox Strain Dynamics Using Computational and Data-Driven Approaches. Viruses 2025, 17. [CrossRef]
- S., L.; T., W.J. Optimal control applied to biological models. CRC press 2007.
- F., H.R. Optimal control of non-linear advertising models with replenishable budget. Optimal Control application and methods 1982, 3. [CrossRef]
- T., Y.T.; A., A. Effective strategies towards eradicating the tuberculosis epidemic: An optimal control theory alternative. Healthcare Analytics 2023, 3. [CrossRef]
- Rabiu, M.; Dansu, E.J.; Mogbojuri, O.A.; Idisi, I.O.; Yahaya, M.M.; Chiwira, P.; Abah, R.T.; Adeniji, A.A. Modeling the sexual transmission dynamics of mpox in the United States of America. The European Physical Journal Plus 2024, 139, 250. [Google Scholar] [CrossRef]
- H, L.; M, R.; A., K. Optimal control of an epidemic model with a saturated incidence rate. Nonlin Anal 2012, 17, 448–59. [CrossRef]
- O., Z.; M., R.; I., E. A multi-regional epidemic model for controlling the spread of Ebola: awareness, treatment, and travel-blocking optimal control approaches. Math Methods Appl Sci 2017, 40, 1265–79. [CrossRef]
- T., Y.T.; F., B. Optimal strategy for controlling the spread of HIV/AIDS disease: a case study of South Africa. Journal of biological dynamics 2011, 6, 475–494. [CrossRef]
- OWID. Population, 2024. https://www.worldometers.info/population/europe/southern-europe/x [Accessed 02-03-2024].
- Akinyemi, S.T.; Idisi, I.O.; Rabiu, M.; Okeowo, V.I.; Iheonu, N.; Dansu, E.J.; Abah, R.T.; Mogbojuri, O.A.; Audu, A.M.; Yahaya, M.M.; et al. A tale of two countries: Optimal control and cost-effectiveness analysis of monkeypox disease in Germany and Nigeria. Healthcare Analytics 2023, 4, 100258. [Google Scholar] [CrossRef]
- I., I.O.; T., Y.T. A Mathematical Model For Lassa Fever Transmission Dynamics With Impacts of Control Measures: Analysis And Simulation. European Journal of Mathematics and Statistics 2021, 2, 19–28. [CrossRef]
Figure 1.
Schematic Diagram for Dual Strain Mpox Model.
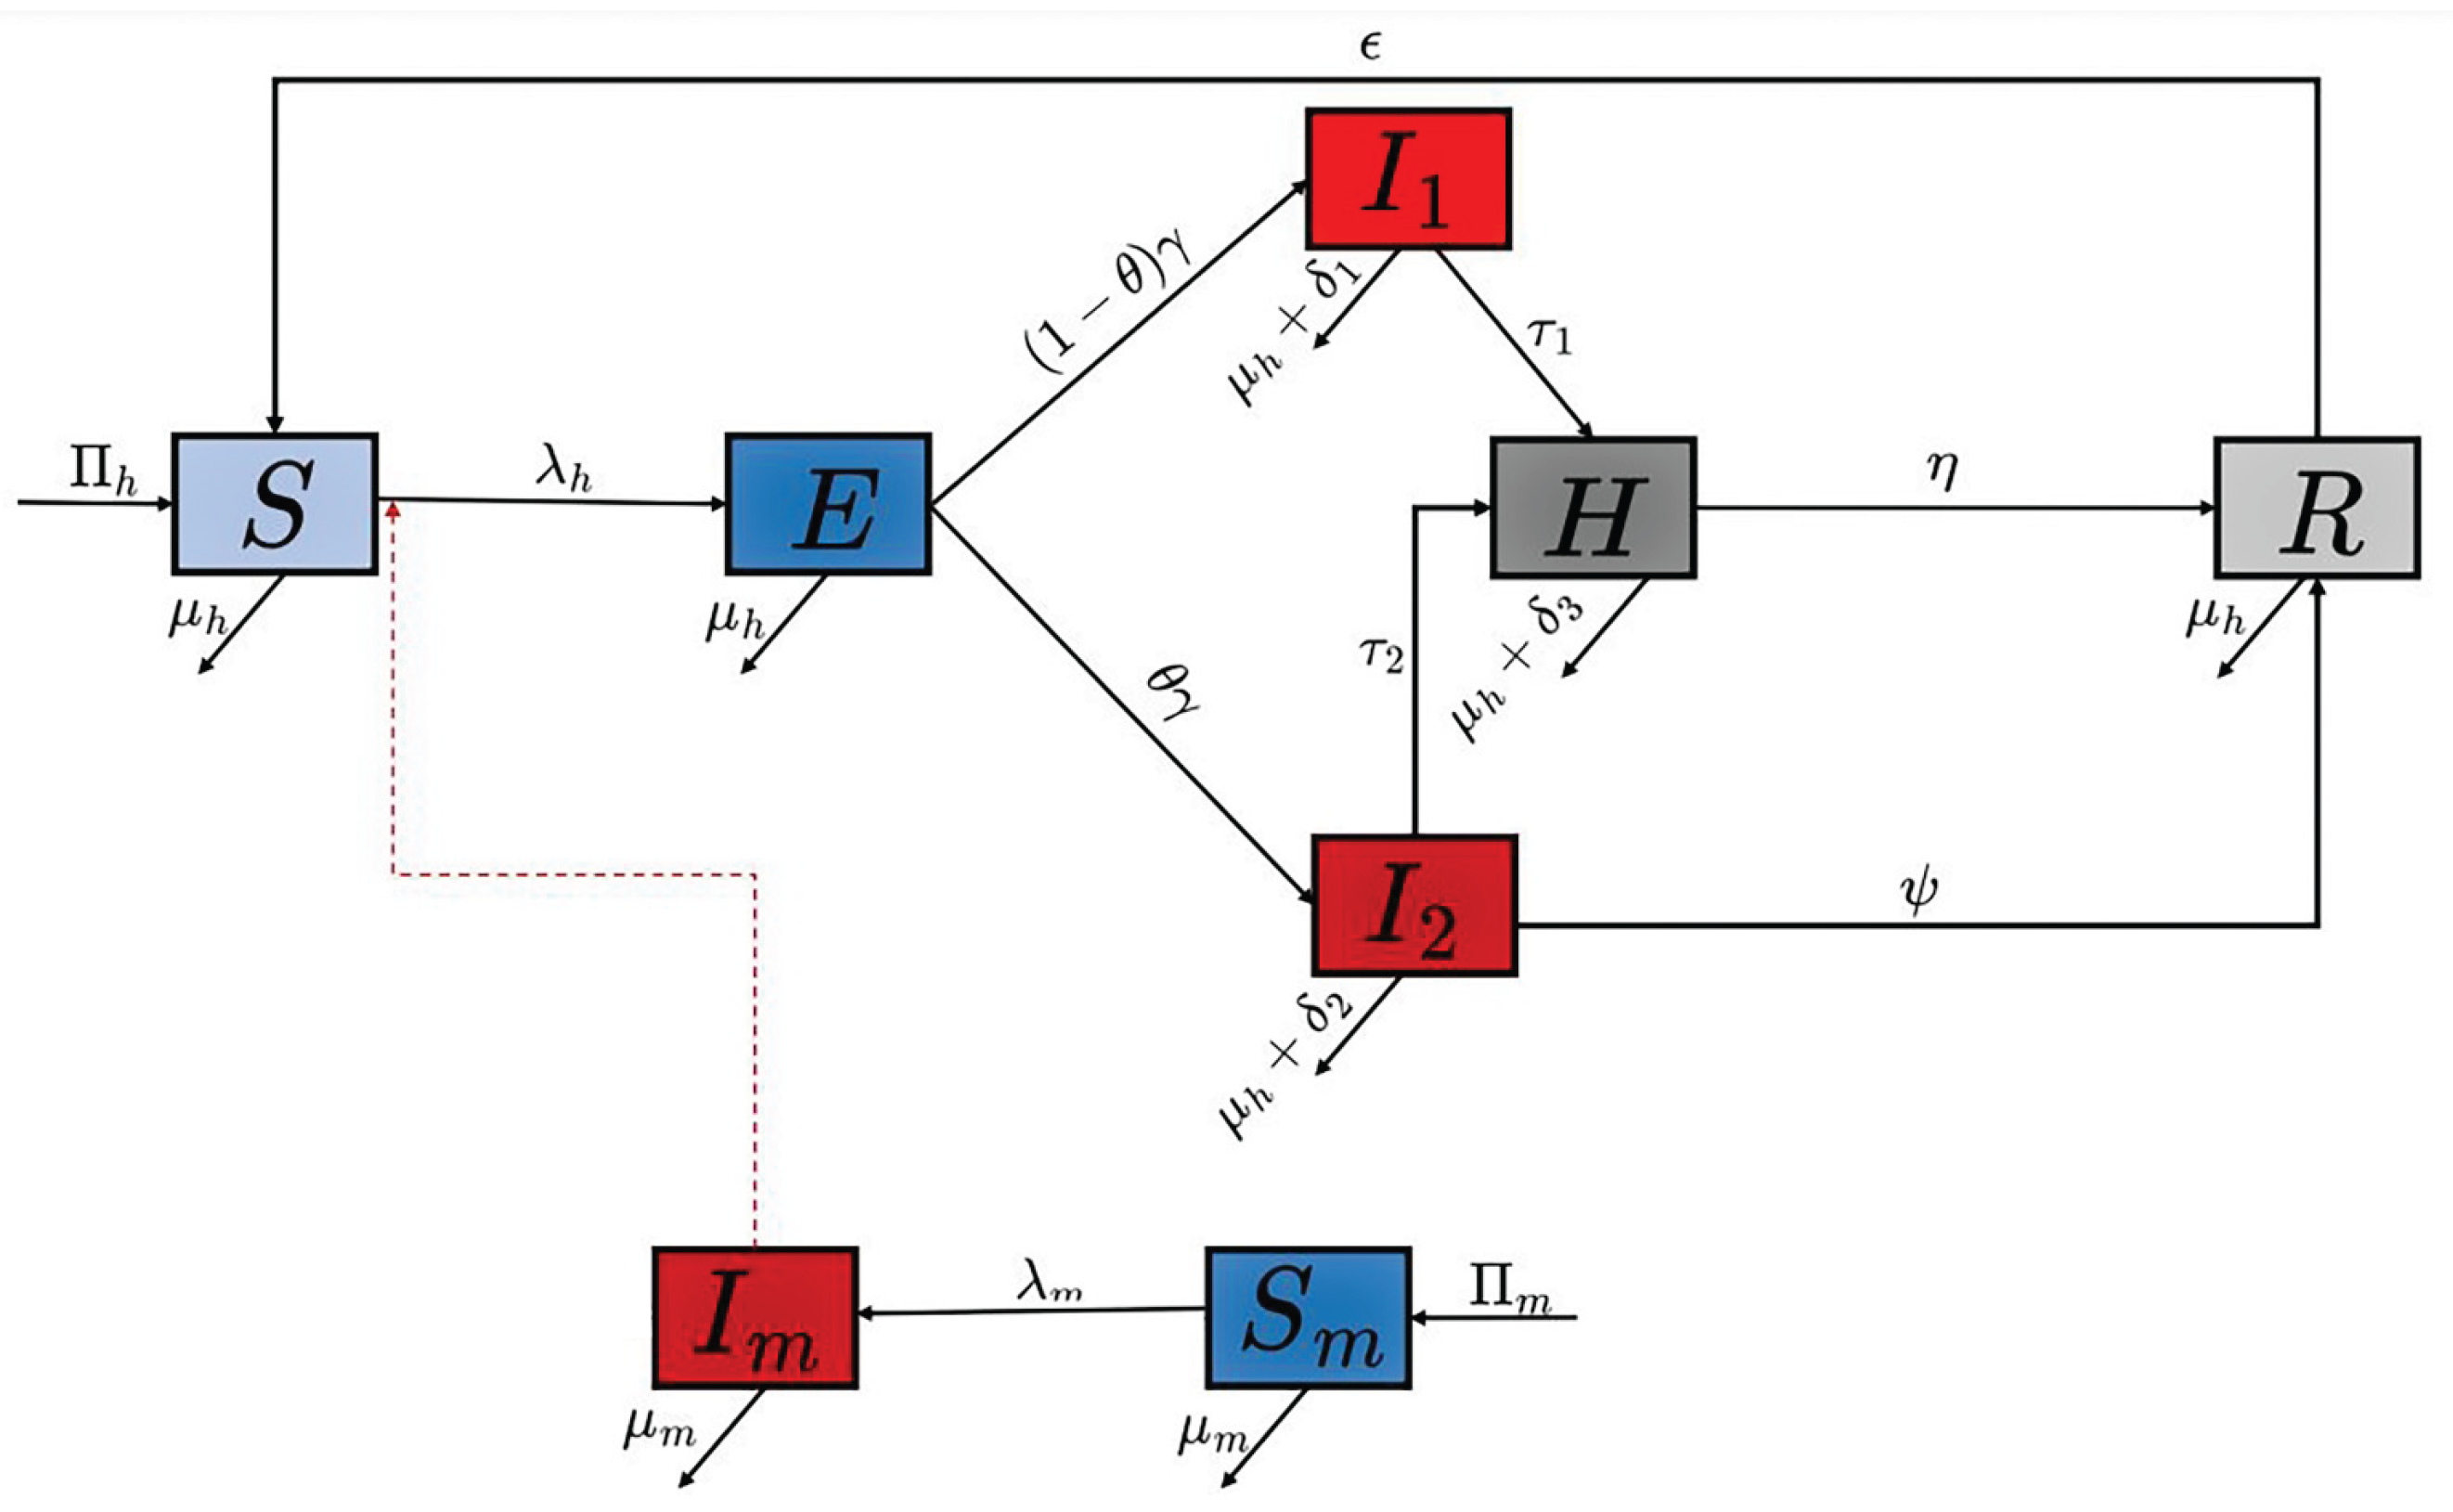
Figure 2.
Contour plots for Spain, Italy, Nigeria, and the DRC using the control reproduction numbers as the response function.
Figure 2.
Contour plots for Spain, Italy, Nigeria, and the DRC using the control reproduction numbers as the response function.
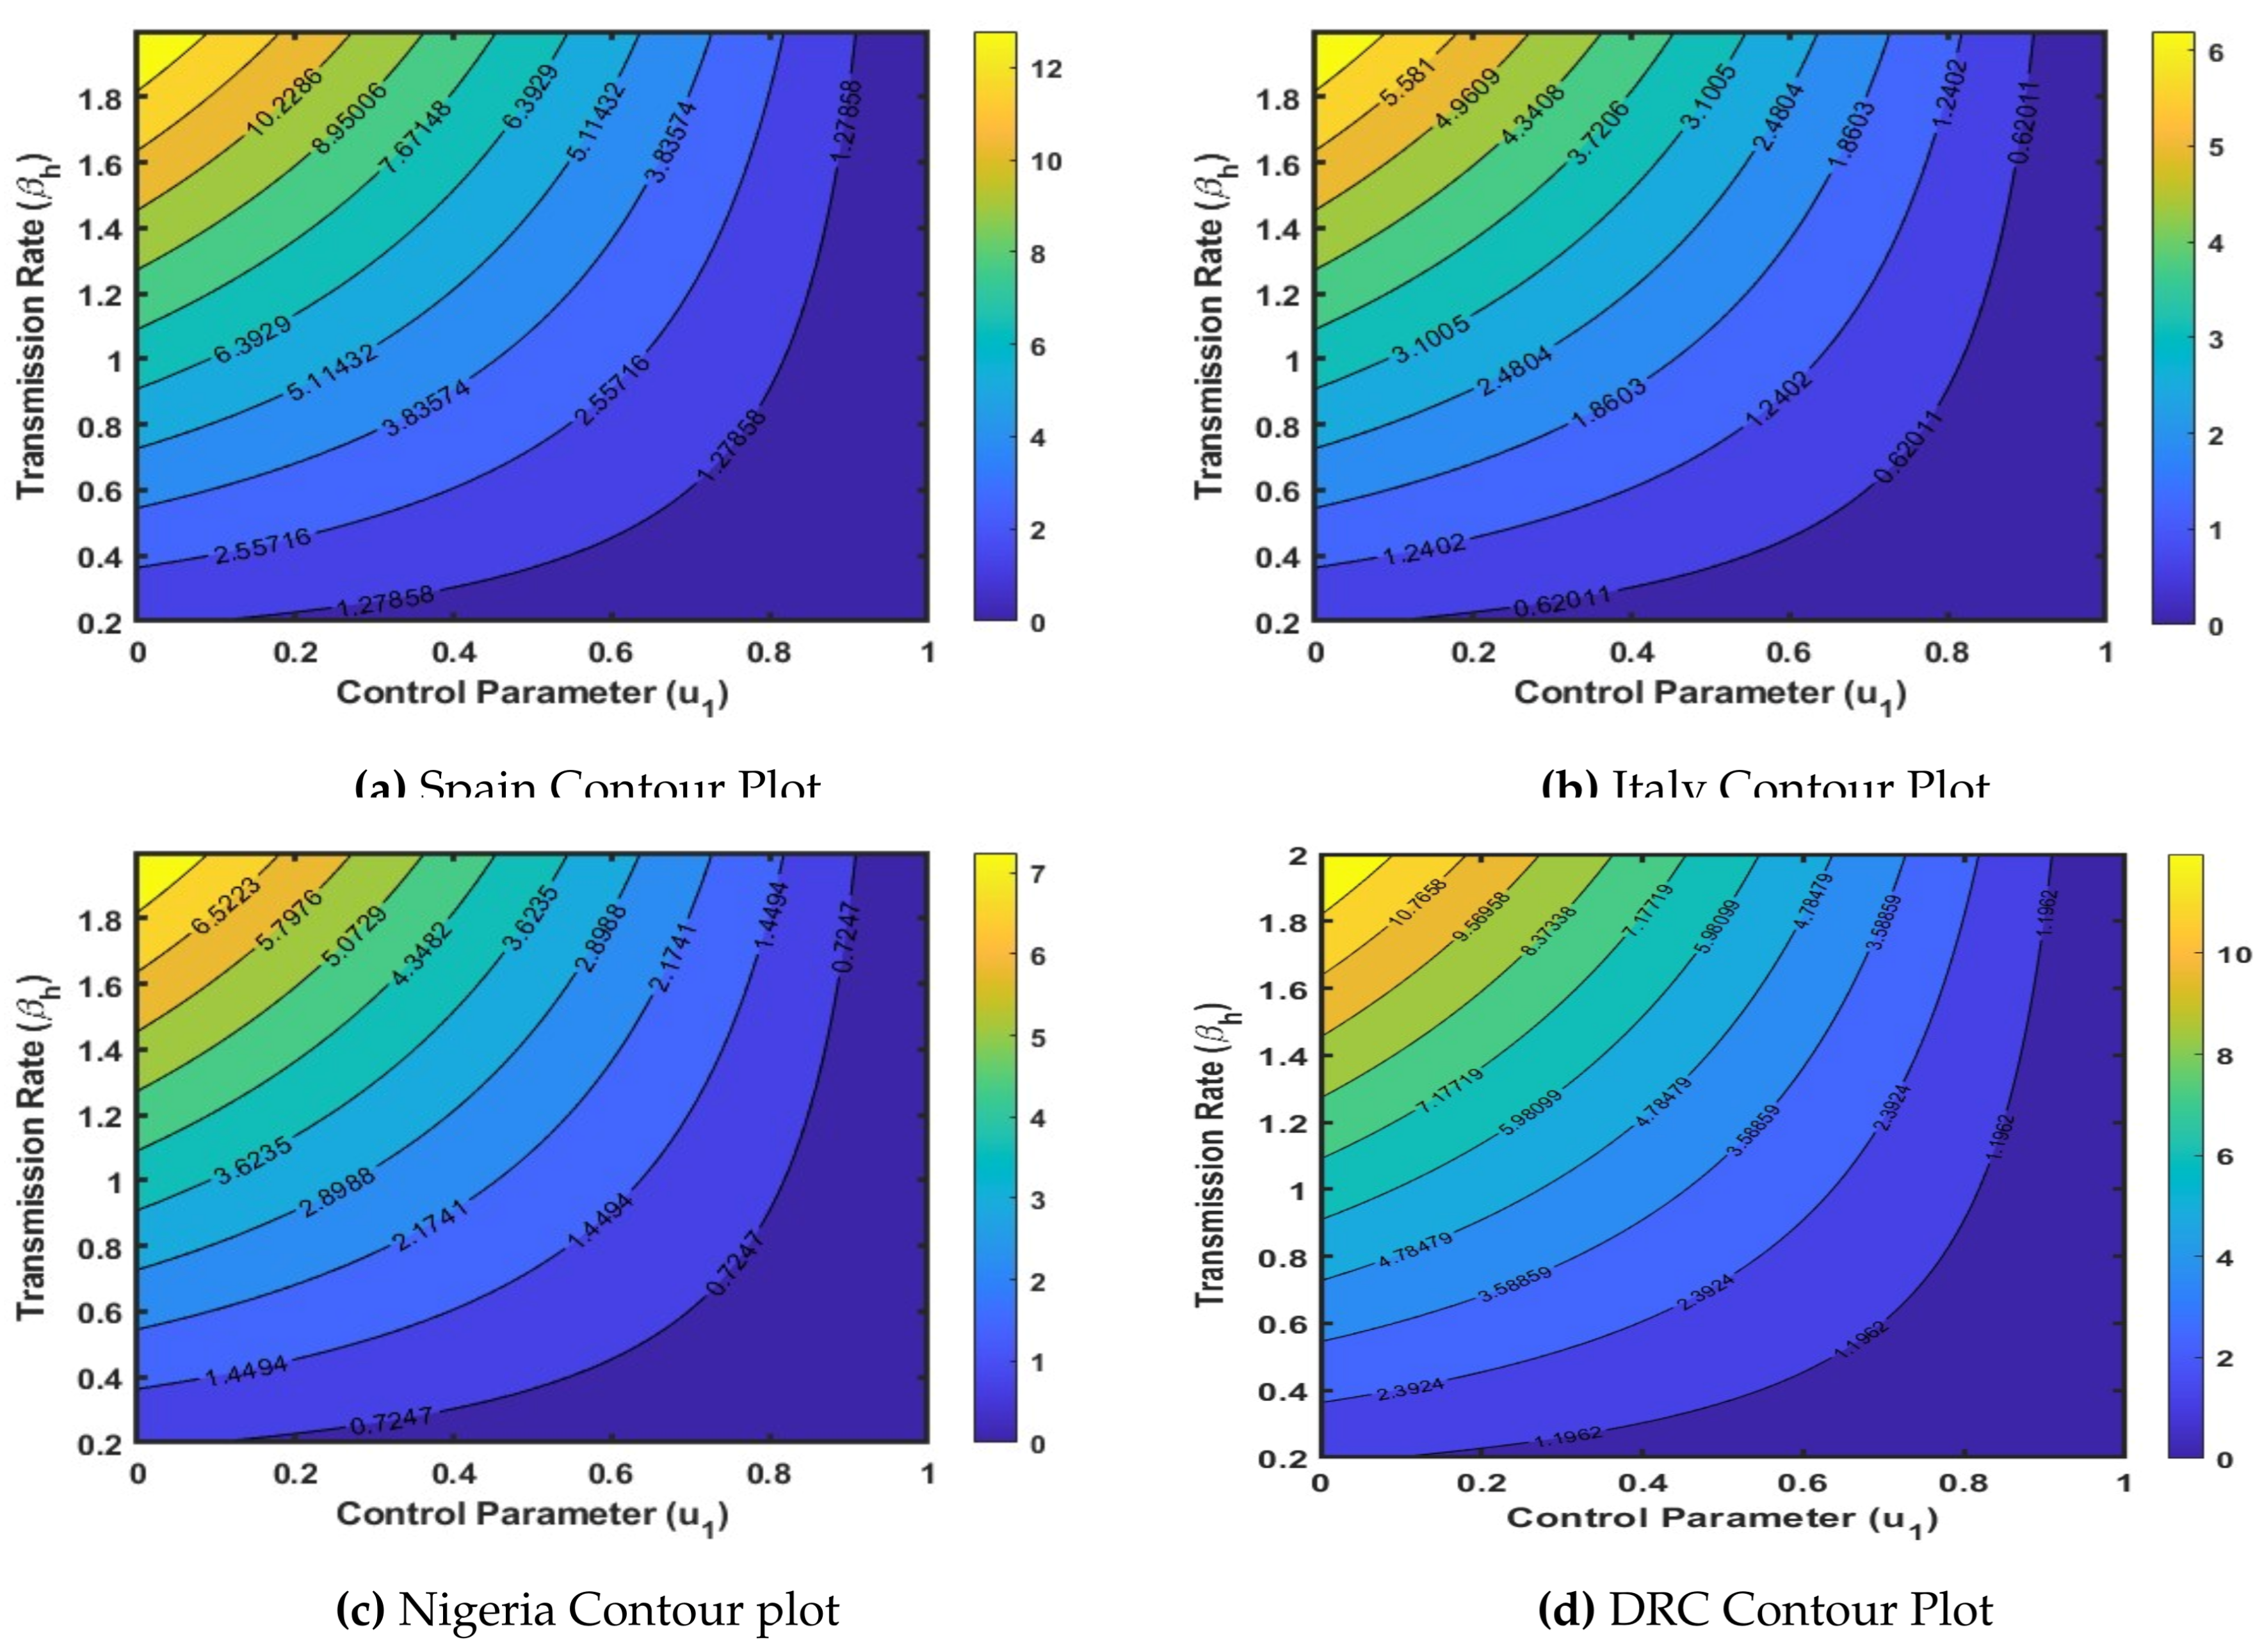
Figure 3.
Country: Nigeria.
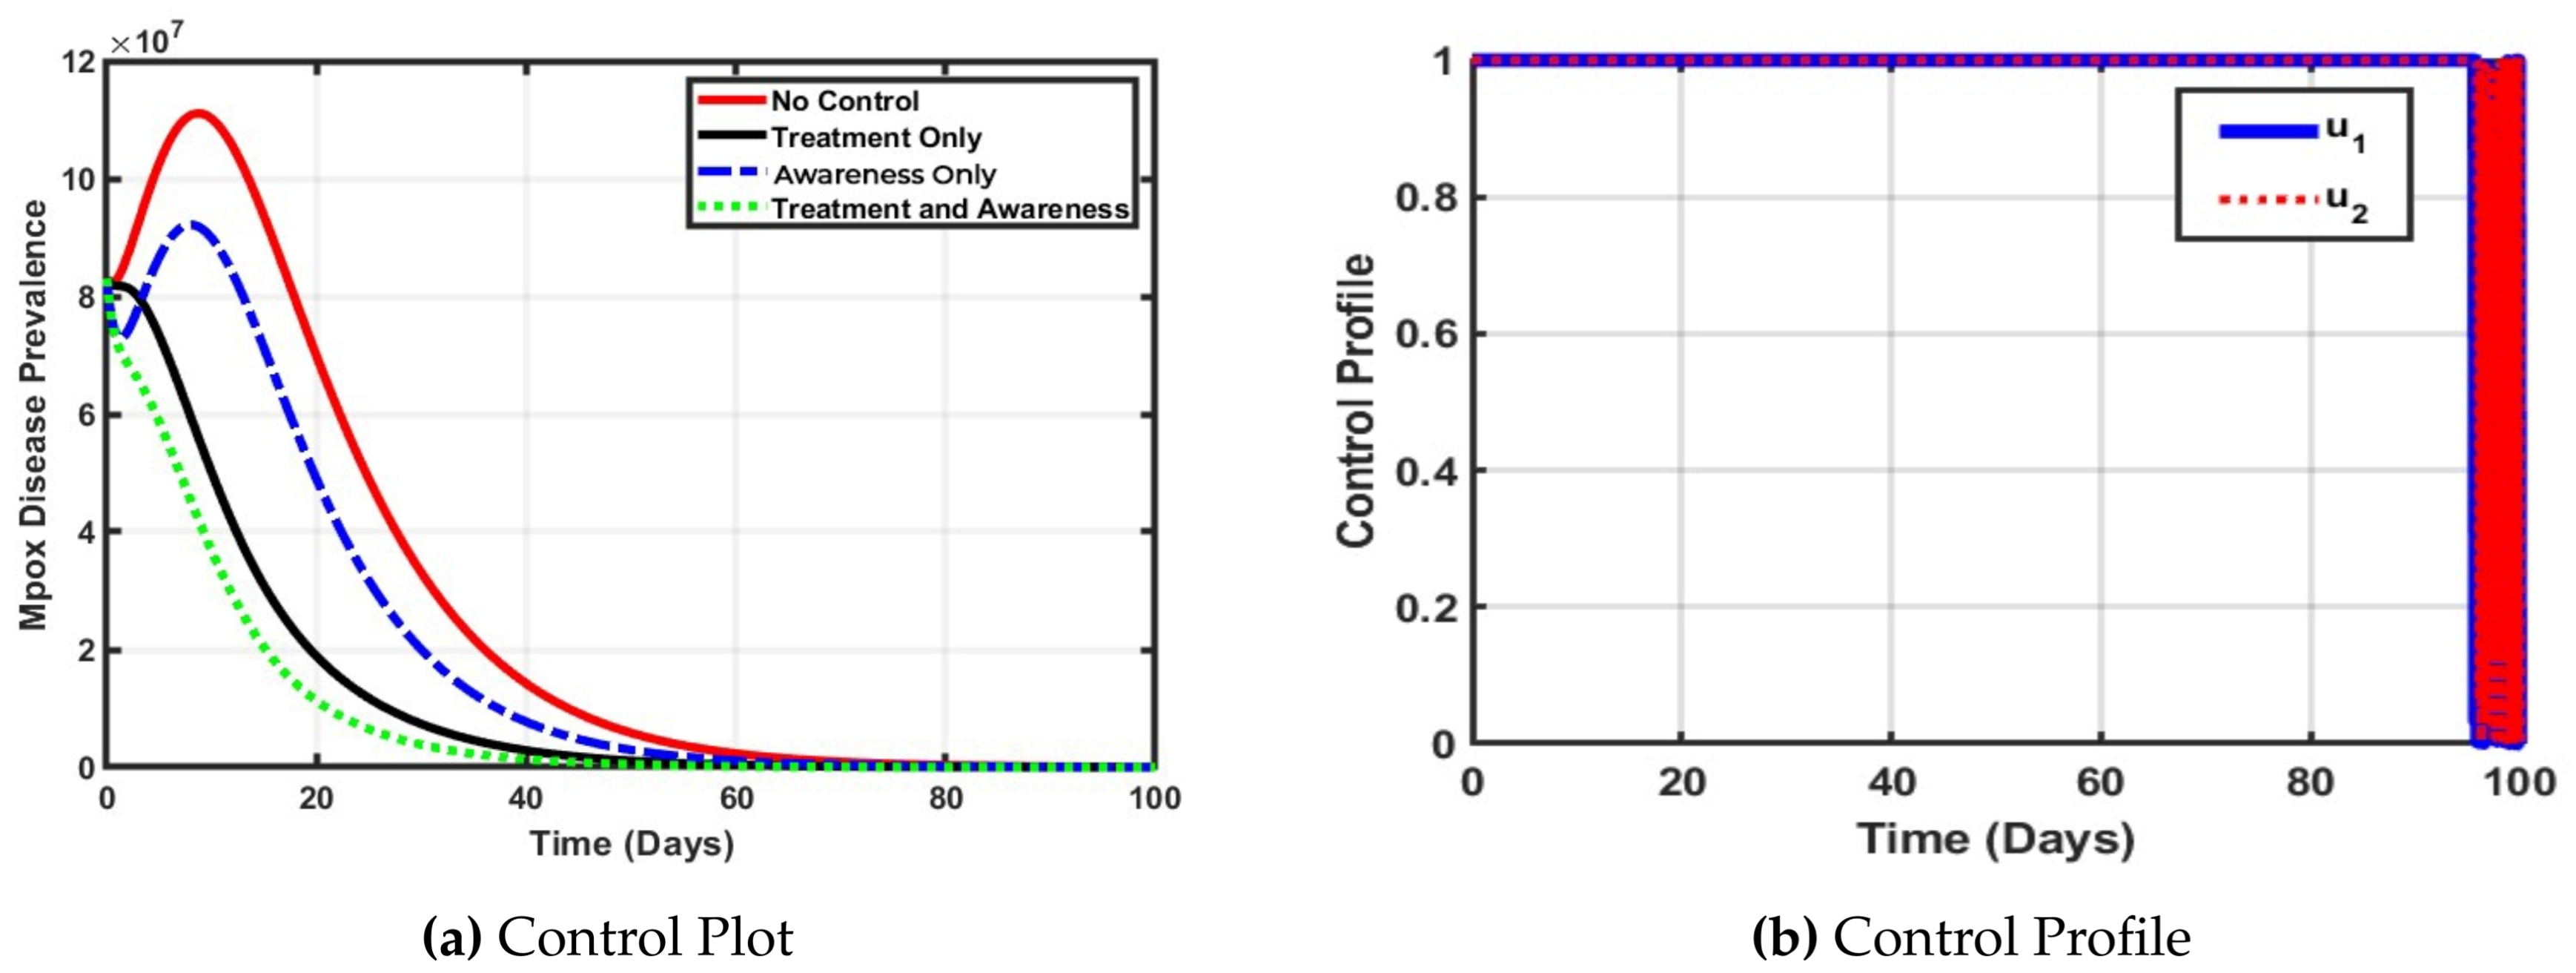
Figure 4.
Country Italy.
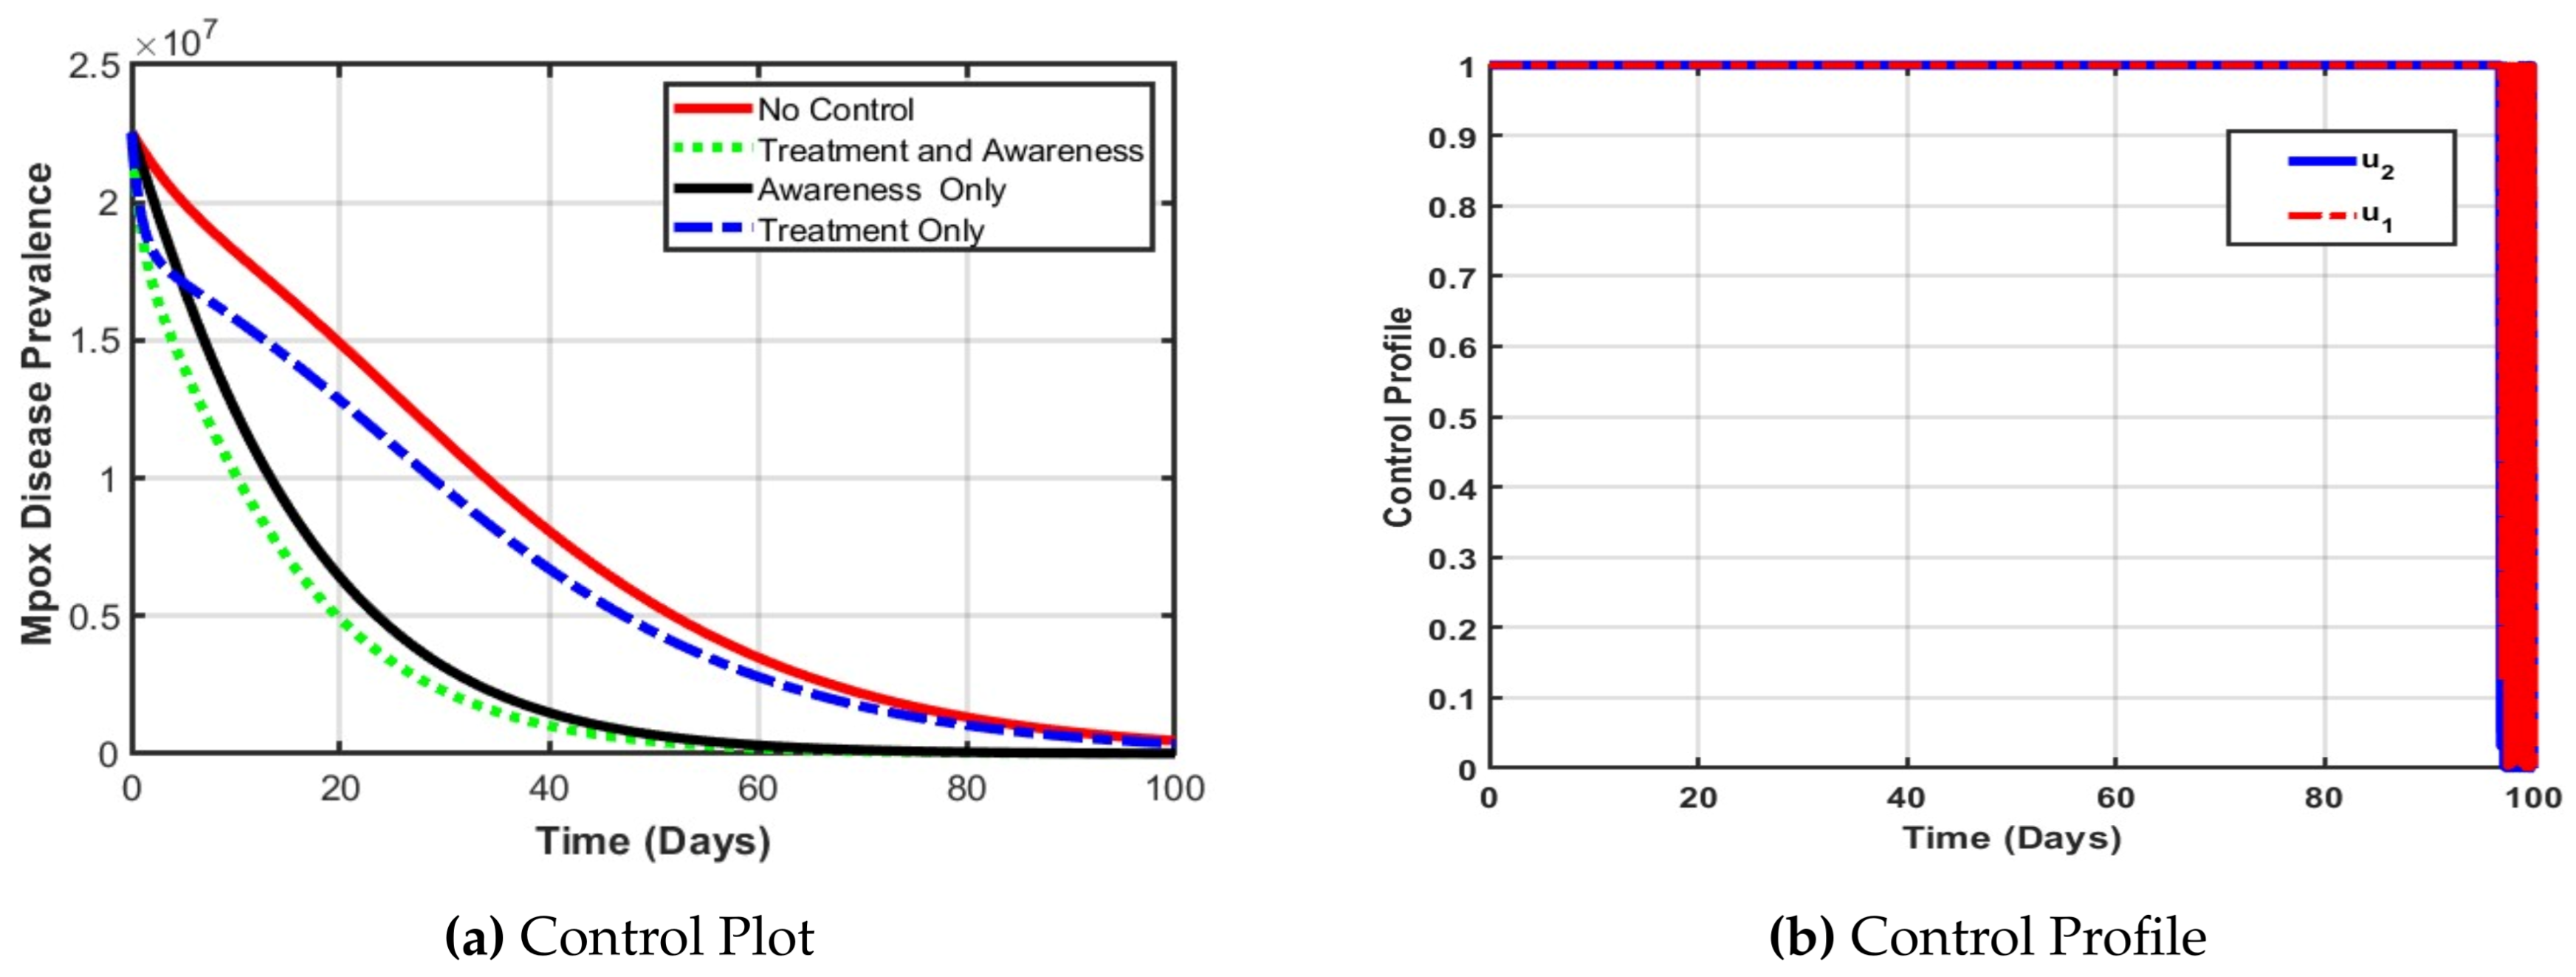
Figure 5.
Country Spain.
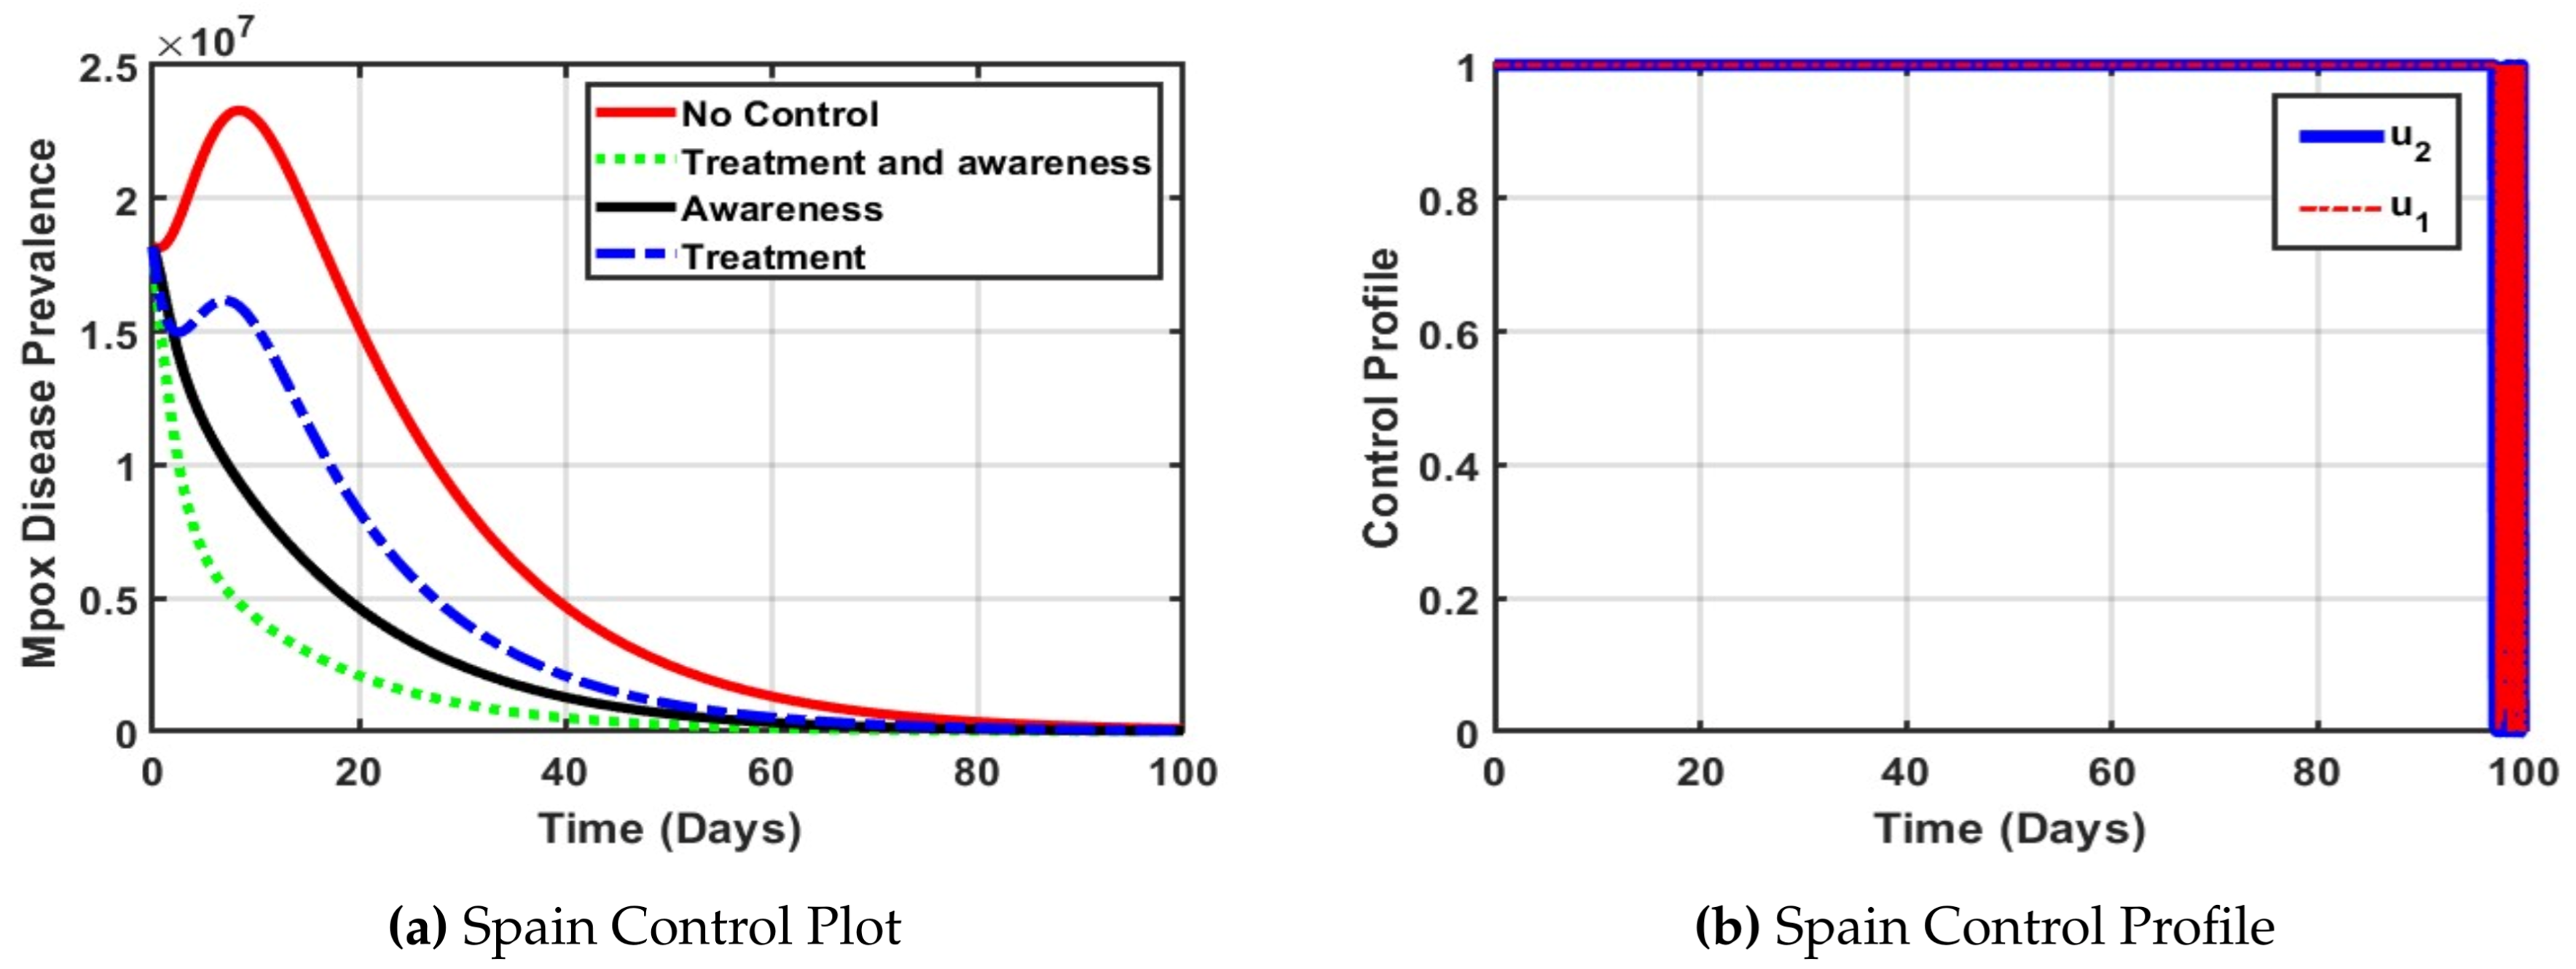
Figure 6.
Country DRC.
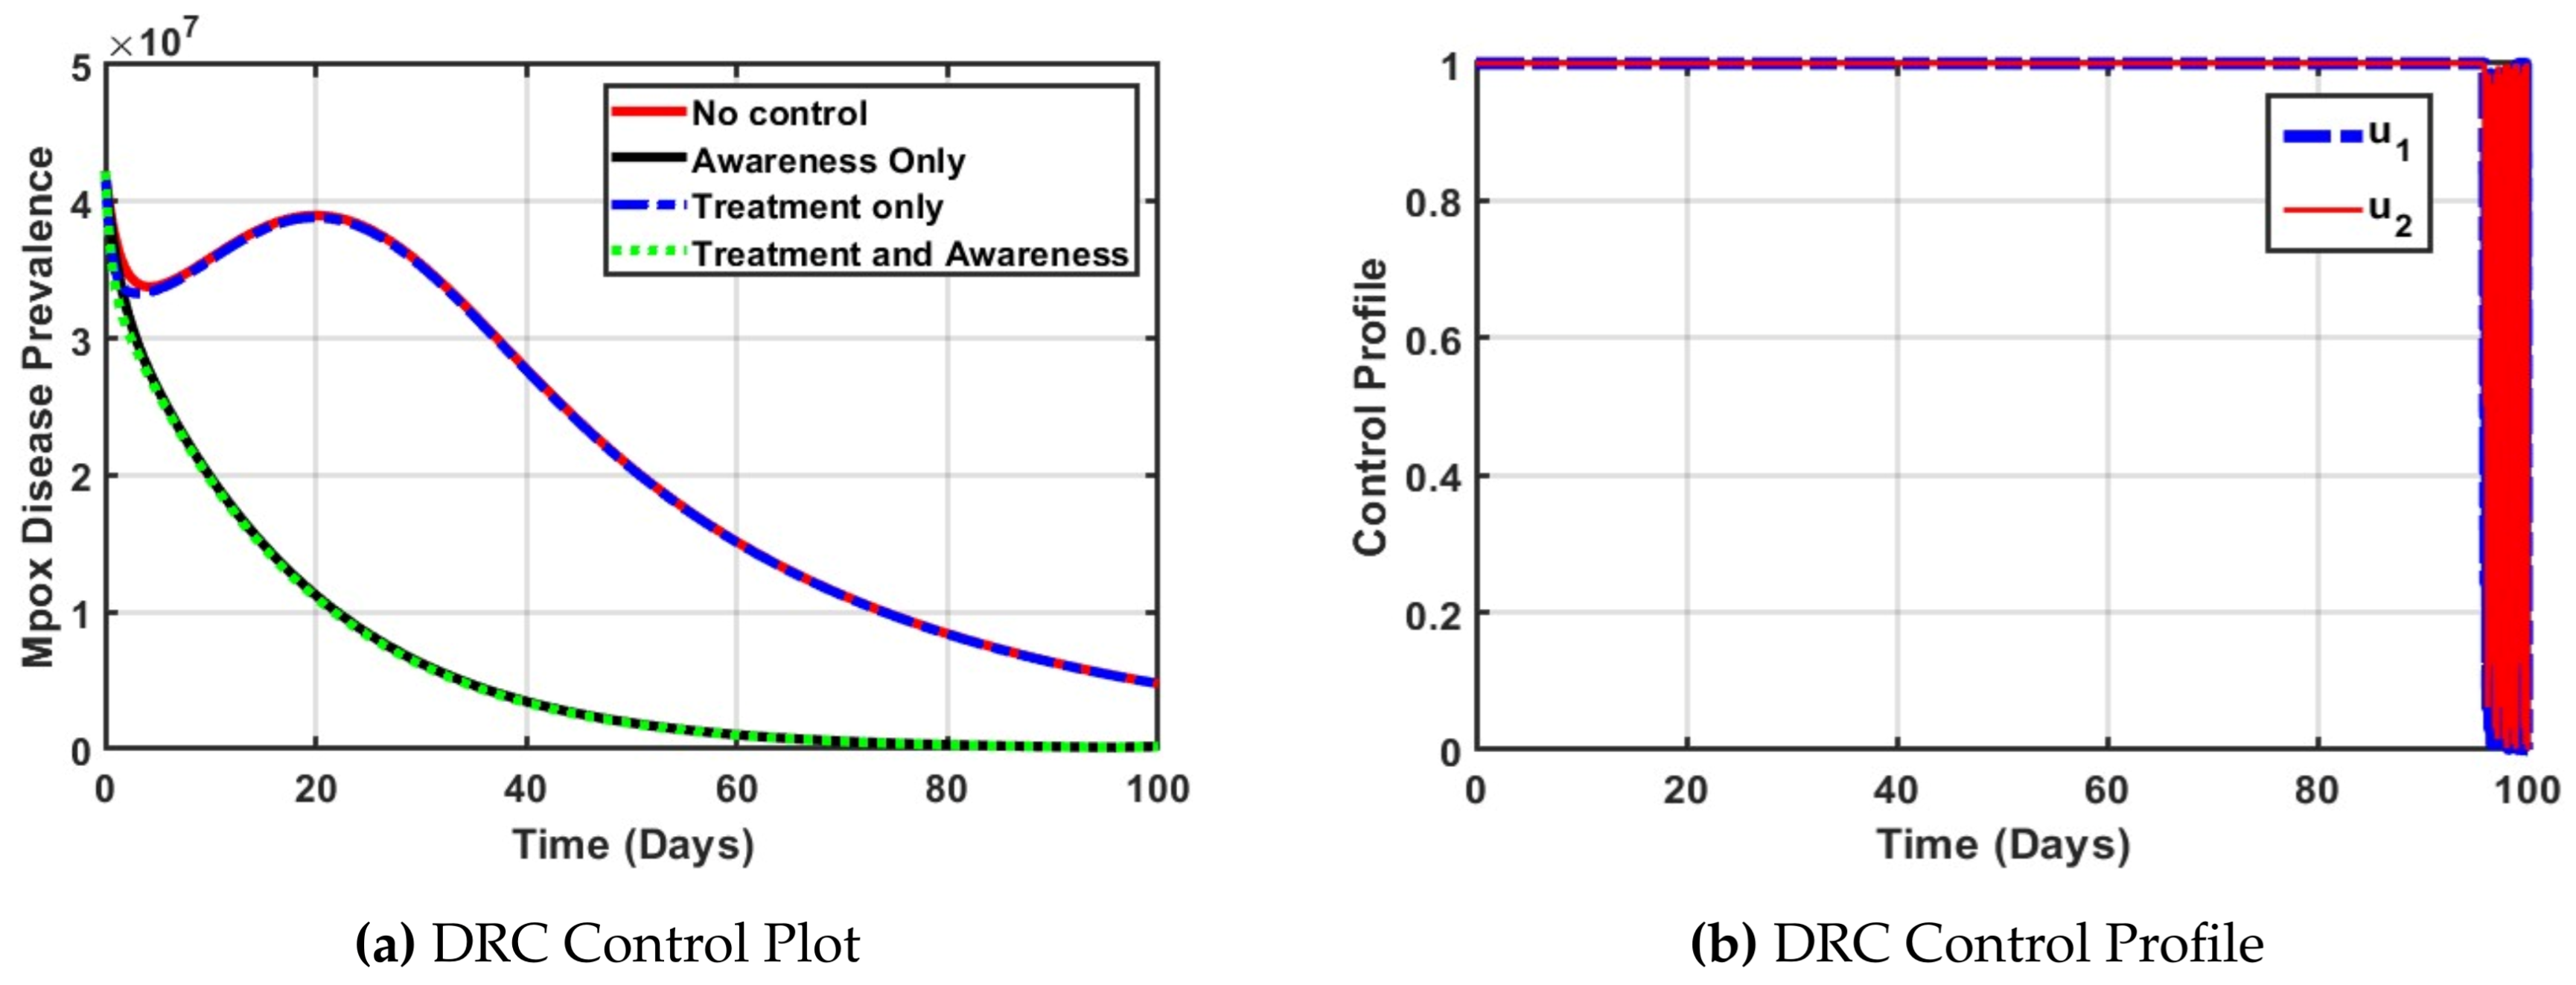
Figure 7.
Efficiency indices for control measures for selected countries for 100 days projection.
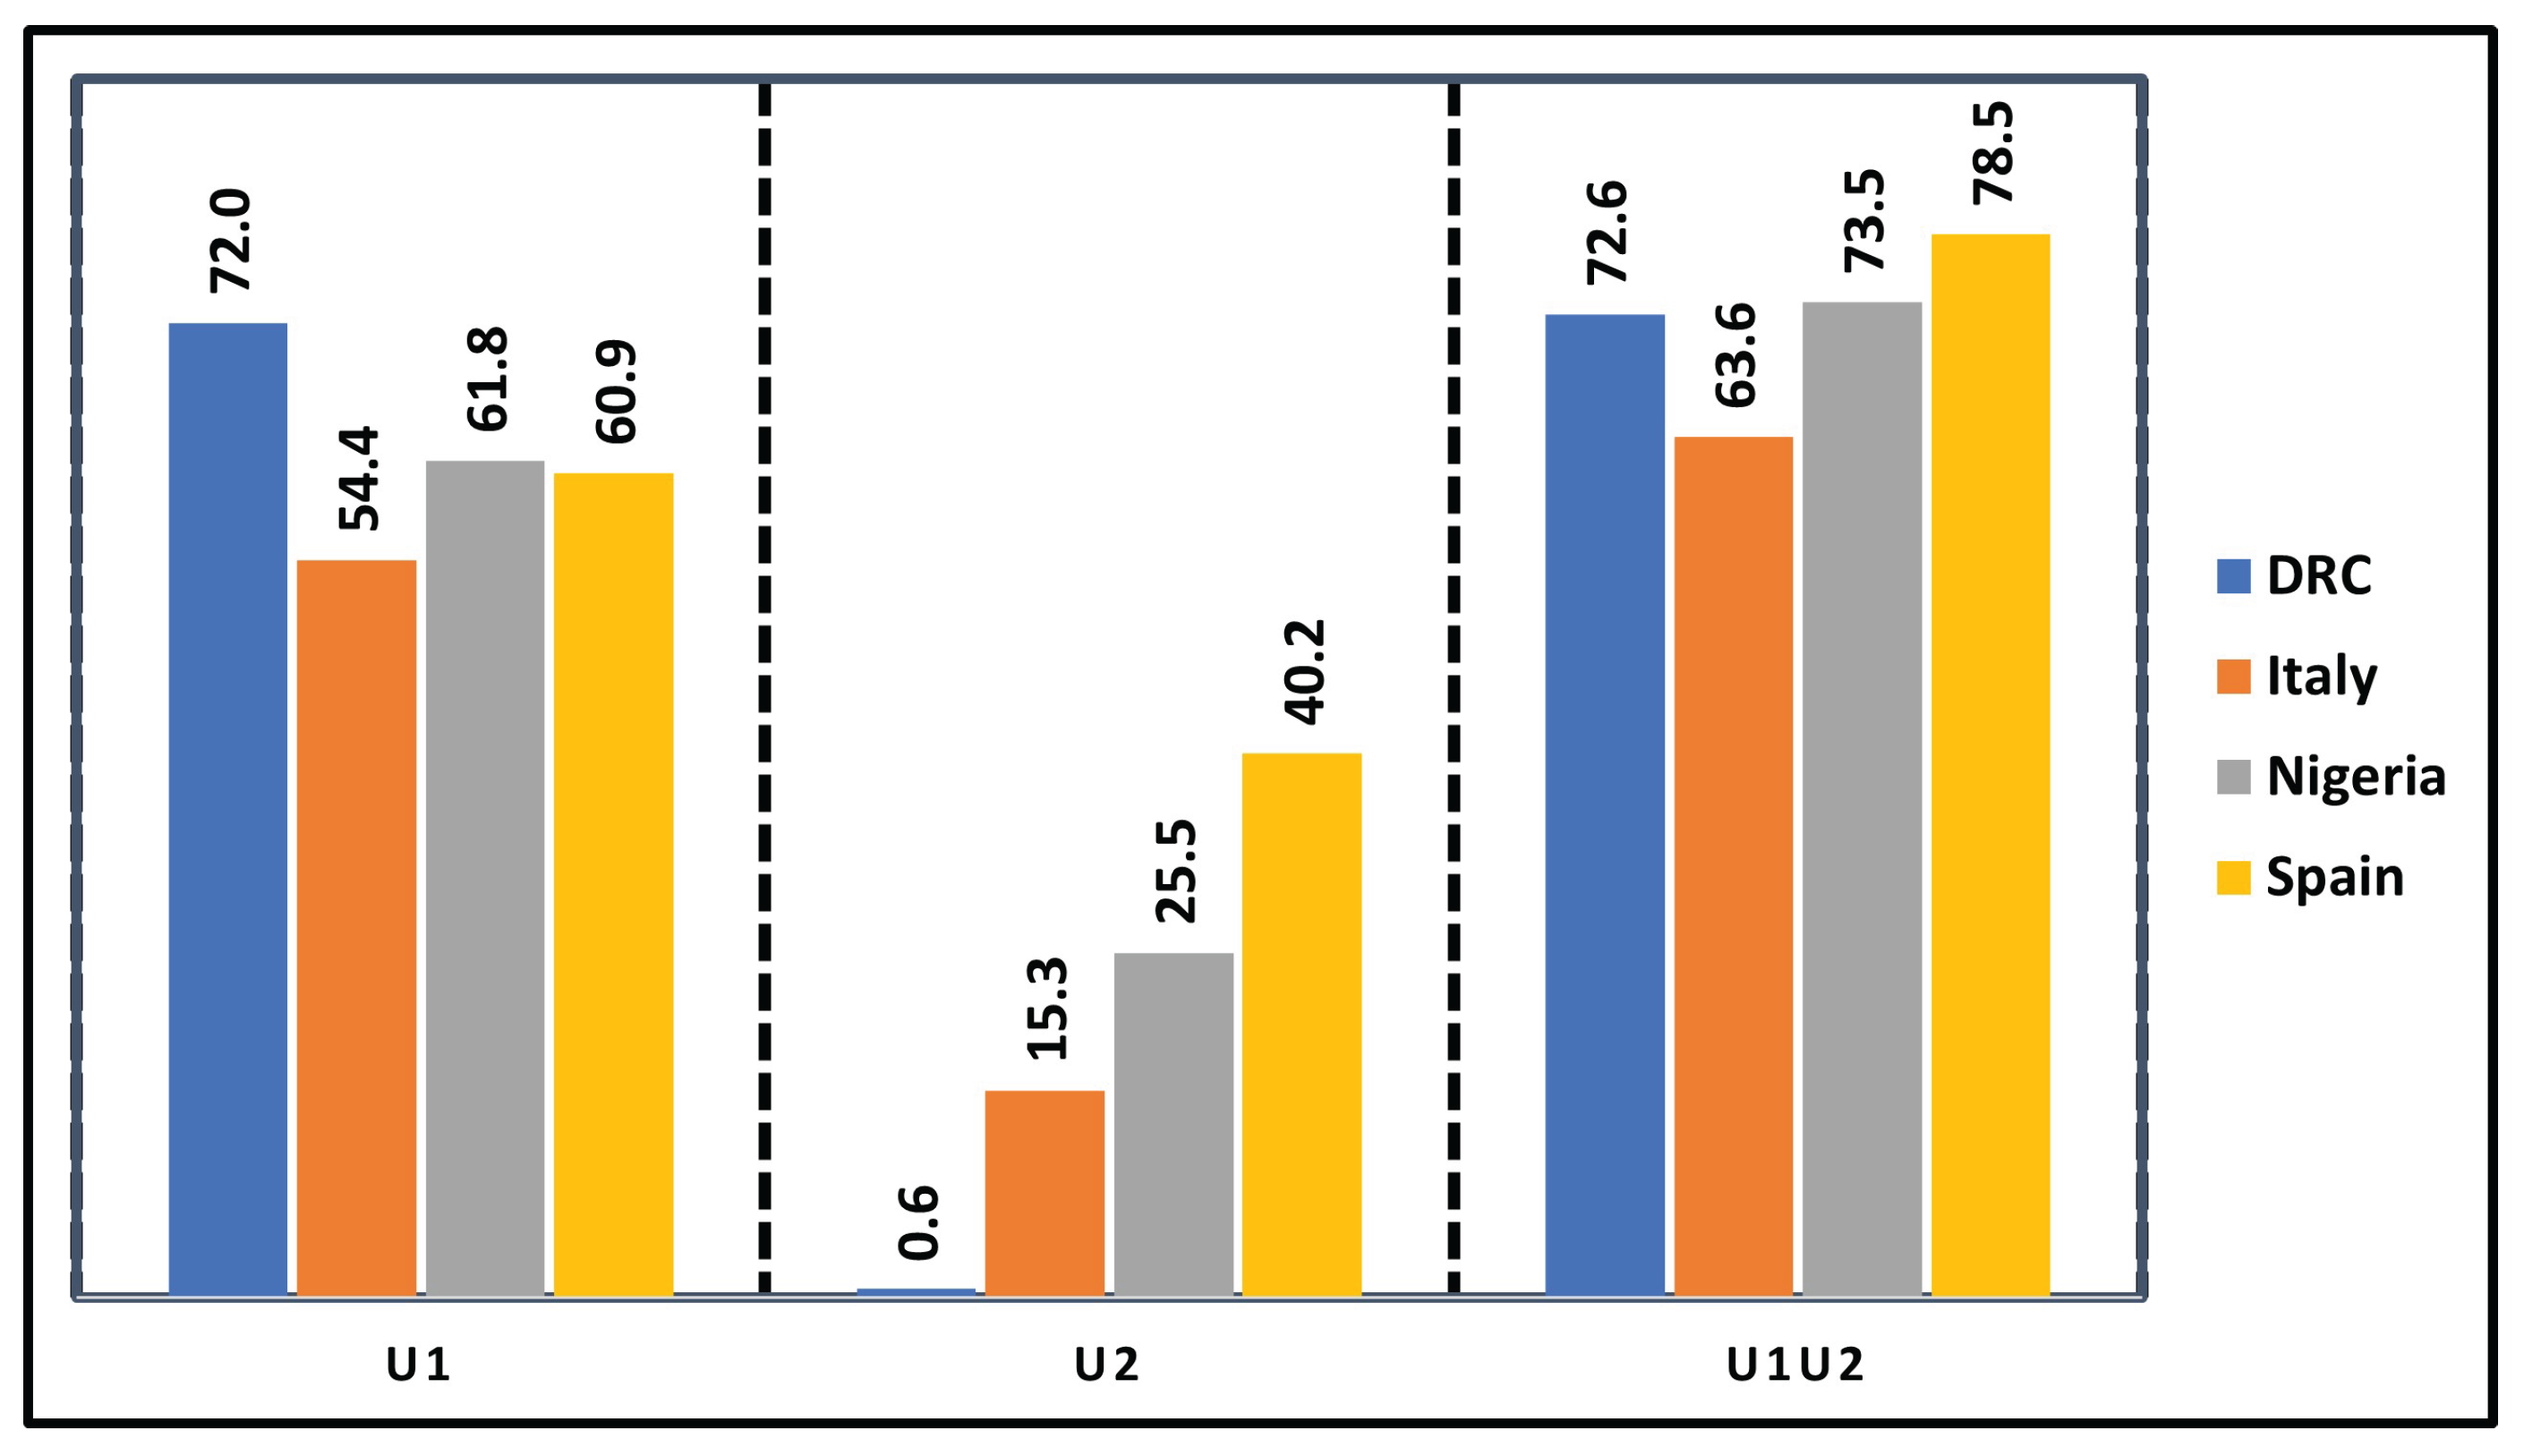

Table 1.
Description of Variables and Parameters Used in the Model (4).
Table 1.
Description of Variables and Parameters Used in the Model (4).
| Parameter | Interpretation |
|---|---|
| Recruitment rates into the human population | |
| Transmission rate of individuals to the exposed from the susceptible class | |
| Re-infection rate or loss of immunity of recovered individuals for both clade | |
| Transmission rate of individuals from exposed class to | |
| infectious compartment for clade I and clade II | |
| The proportion of individuals infected | |
| Hospitalised rate of individuals in infectious population clade I | |
| Hospitalised rate of individuals in infectious population clade II | |
| Disease-induced death rate in infectious population clade I | |
| Disease-induced death rate in infectious population clade II | |
| Disease-induced death rate in infectious population in the hospitalised class | |
| Recovery rate of individuals from hospitalized | |
| Recovery rate of individuals from infectious population clade II | |
| Natural mortality rate of human population | |
| Recruitment rates into the vector population | |
| Transmission rate of susceptible vector to infectious vector | |
| Natural mortality rate of the vector population | |
| Modification parameters that reduce the infection transmission | |
| rate between humans and mammals | |
| The effective human-to-human transmission rate of Mpox | |
| The animal-to-human (reverse zoonotic) transmission rate. | |
| The animal-to-animal (or reservoir-to-reservoir) transmission rate. |
Table 2.
Estimated parameter values of the model (4) for the countries Spain, Nigeria, Italy and DRC.
Table 2.
Estimated parameter values of the model (4) for the countries Spain, Nigeria, Italy and DRC.
| Paramater | Spain | Nigeria | DRC | Italy |
|---|---|---|---|---|
| 2.300e-04 | 8.800e-04 | 1.870 e-01 | 4.3 e-05 | |
| 4.466e01 | 5.419e-01 | 6.728e01 | 2.5404 e01 | |
| 5.000e-05 | 3.300e-04 | 2.000e-02 | 5.0e-04 | |
| 4.10 e-02 | 2.300e-02 | 2.151e-01 | 5.043 e-01 | |
| 3.090 e-02 | 1.160e-02 | 5.300e-04 | 2.212e-01 | |
| 0.789e01 | 1.038e-01 | 8.023e-01 | 1.3080e01 | |
| 0. 4645e01 | 0.4954e01 | 0.4610e01 | 0.96082 e01 | |
| 3.853e-01 | 3.922e-01 | 0.1553e01 | 0.27450 e01 | |
| 0.2677 e01 | 0.1810 e01 | 0.2254 e01 | 1.25396 e01 | |
| 0.31741 e01 | 0.4117 e01 | 0.9819 e01 | 0.18953 e01 | |
| 0.6902 e01 | 0.3810 e01 | 0.4695 e01 | 1.25396 e01 | |
| 0.1072 e01 | 6.284 e-01 | 8.703 e-01 | 0.14317 e01 | |
| 0.2311 e01 | 3.3360 e-01 | 3.888 e-01 | 0.75697 e01 |
Table 3.
Reference Paramater Values.
| Country | |||||||
|---|---|---|---|---|---|---|---|
| Italy | 687.30 | 0.0121 | 0.0714 | 1393.5 | 0.0180 | 0.1039 | 0.0004 |
| Spain | 2330.3 | 0.0118 | 0.0714 | 9559.5 | 0.0009 | 0.4551 | 0.0003 |
| Nigeria | 5329.8 | 0.0185 | 0.0714 | 1083.9 | 0.0320 | 0.5761 | 0.0076 |
| DRC | 8259.8 | 0.0163 | 0.0714 | 956.8 | 0.0001 | 0.5739 | 0.0102 |
Table 4.
Efficiency indices (EI) and total cost (TC) of control strategies for Mpox in each country.
Table 4.
Efficiency indices (EI) and total cost (TC) of control strategies for Mpox in each country.
| Nation | Control | A | B | TIA | EI | TC |
|---|---|---|---|---|---|---|
| Nigeria | 73.5 | |||||
| Nigeria | 61.8 | |||||
| Nigeria | 25.5 | |||||
| Spain | 78.5 | |||||
| Spain | 60.9 | |||||
| Spain | 40.2 | |||||
| Italy | 63.6 | |||||
| Italy | 54.4 | |||||
| Italy | 15.3 | |||||
| DRC | 72.6 | |||||
| DRC | 72.0 | |||||
| DRC | 0.6 |
Table 5.
Efficiency indices (EI) and total cost (TC) for selected Mpox control strategies in each country.
Table 5.
Efficiency indices (EI) and total cost (TC) for selected Mpox control strategies in each country.
| Nation | Control | A | B | TIA | EI | TC |
|---|---|---|---|---|---|---|
| Nigeria | 73.5 | |||||
| Nigeria | 25.5 | |||||
| Spain | 78.5 | |||||
| Spain | 40.2 | |||||
| Italy | 63.6 | |||||
| Italy | 15.3 | |||||
| DRC | 72.6 | |||||
| DRC | 0.6 |
Table 6.
Efficiency indices (EI), total cost (TC), and ICER of Mpox control strategies across countries.
Table 6.
Efficiency indices (EI), total cost (TC), and ICER of Mpox control strategies across countries.
| Nation | Control | A | B | TIA | EI | TC | ICER |
|---|---|---|---|---|---|---|---|
| Nigeria | |||||||
| Nigeria | 0.00004 | ||||||
| Spain | |||||||
| Spain | 0.00023 | ||||||
| Italy | |||||||
| Italy | 0.00016 | ||||||
| DRC | |||||||
| DRC | 0.00004 |
Disclaimer/Publisher’s Note: The statements, opinions and data contained in all publications are solely those of the individual author(s) and contributor(s) and not of MDPI and/or the editor(s). MDPI and/or the editor(s) disclaim responsibility for any injury to people or property resulting from any ideas, methods, instructions or products referred to in the content. |
© 2025 by the authors. Licensee MDPI, Basel, Switzerland. This article is an open access article distributed under the terms and conditions of the Creative Commons Attribution (CC BY) license (http://creativecommons.org/licenses/by/4.0/).
Copyright: This open access article is published under a Creative Commons CC BY 4.0 license, which permit the free download, distribution, and reuse, provided that the author and preprint are cited in any reuse.


