
Submitted:
04 July 2025
Posted:
08 July 2025
You are already at the latest version
Abstract
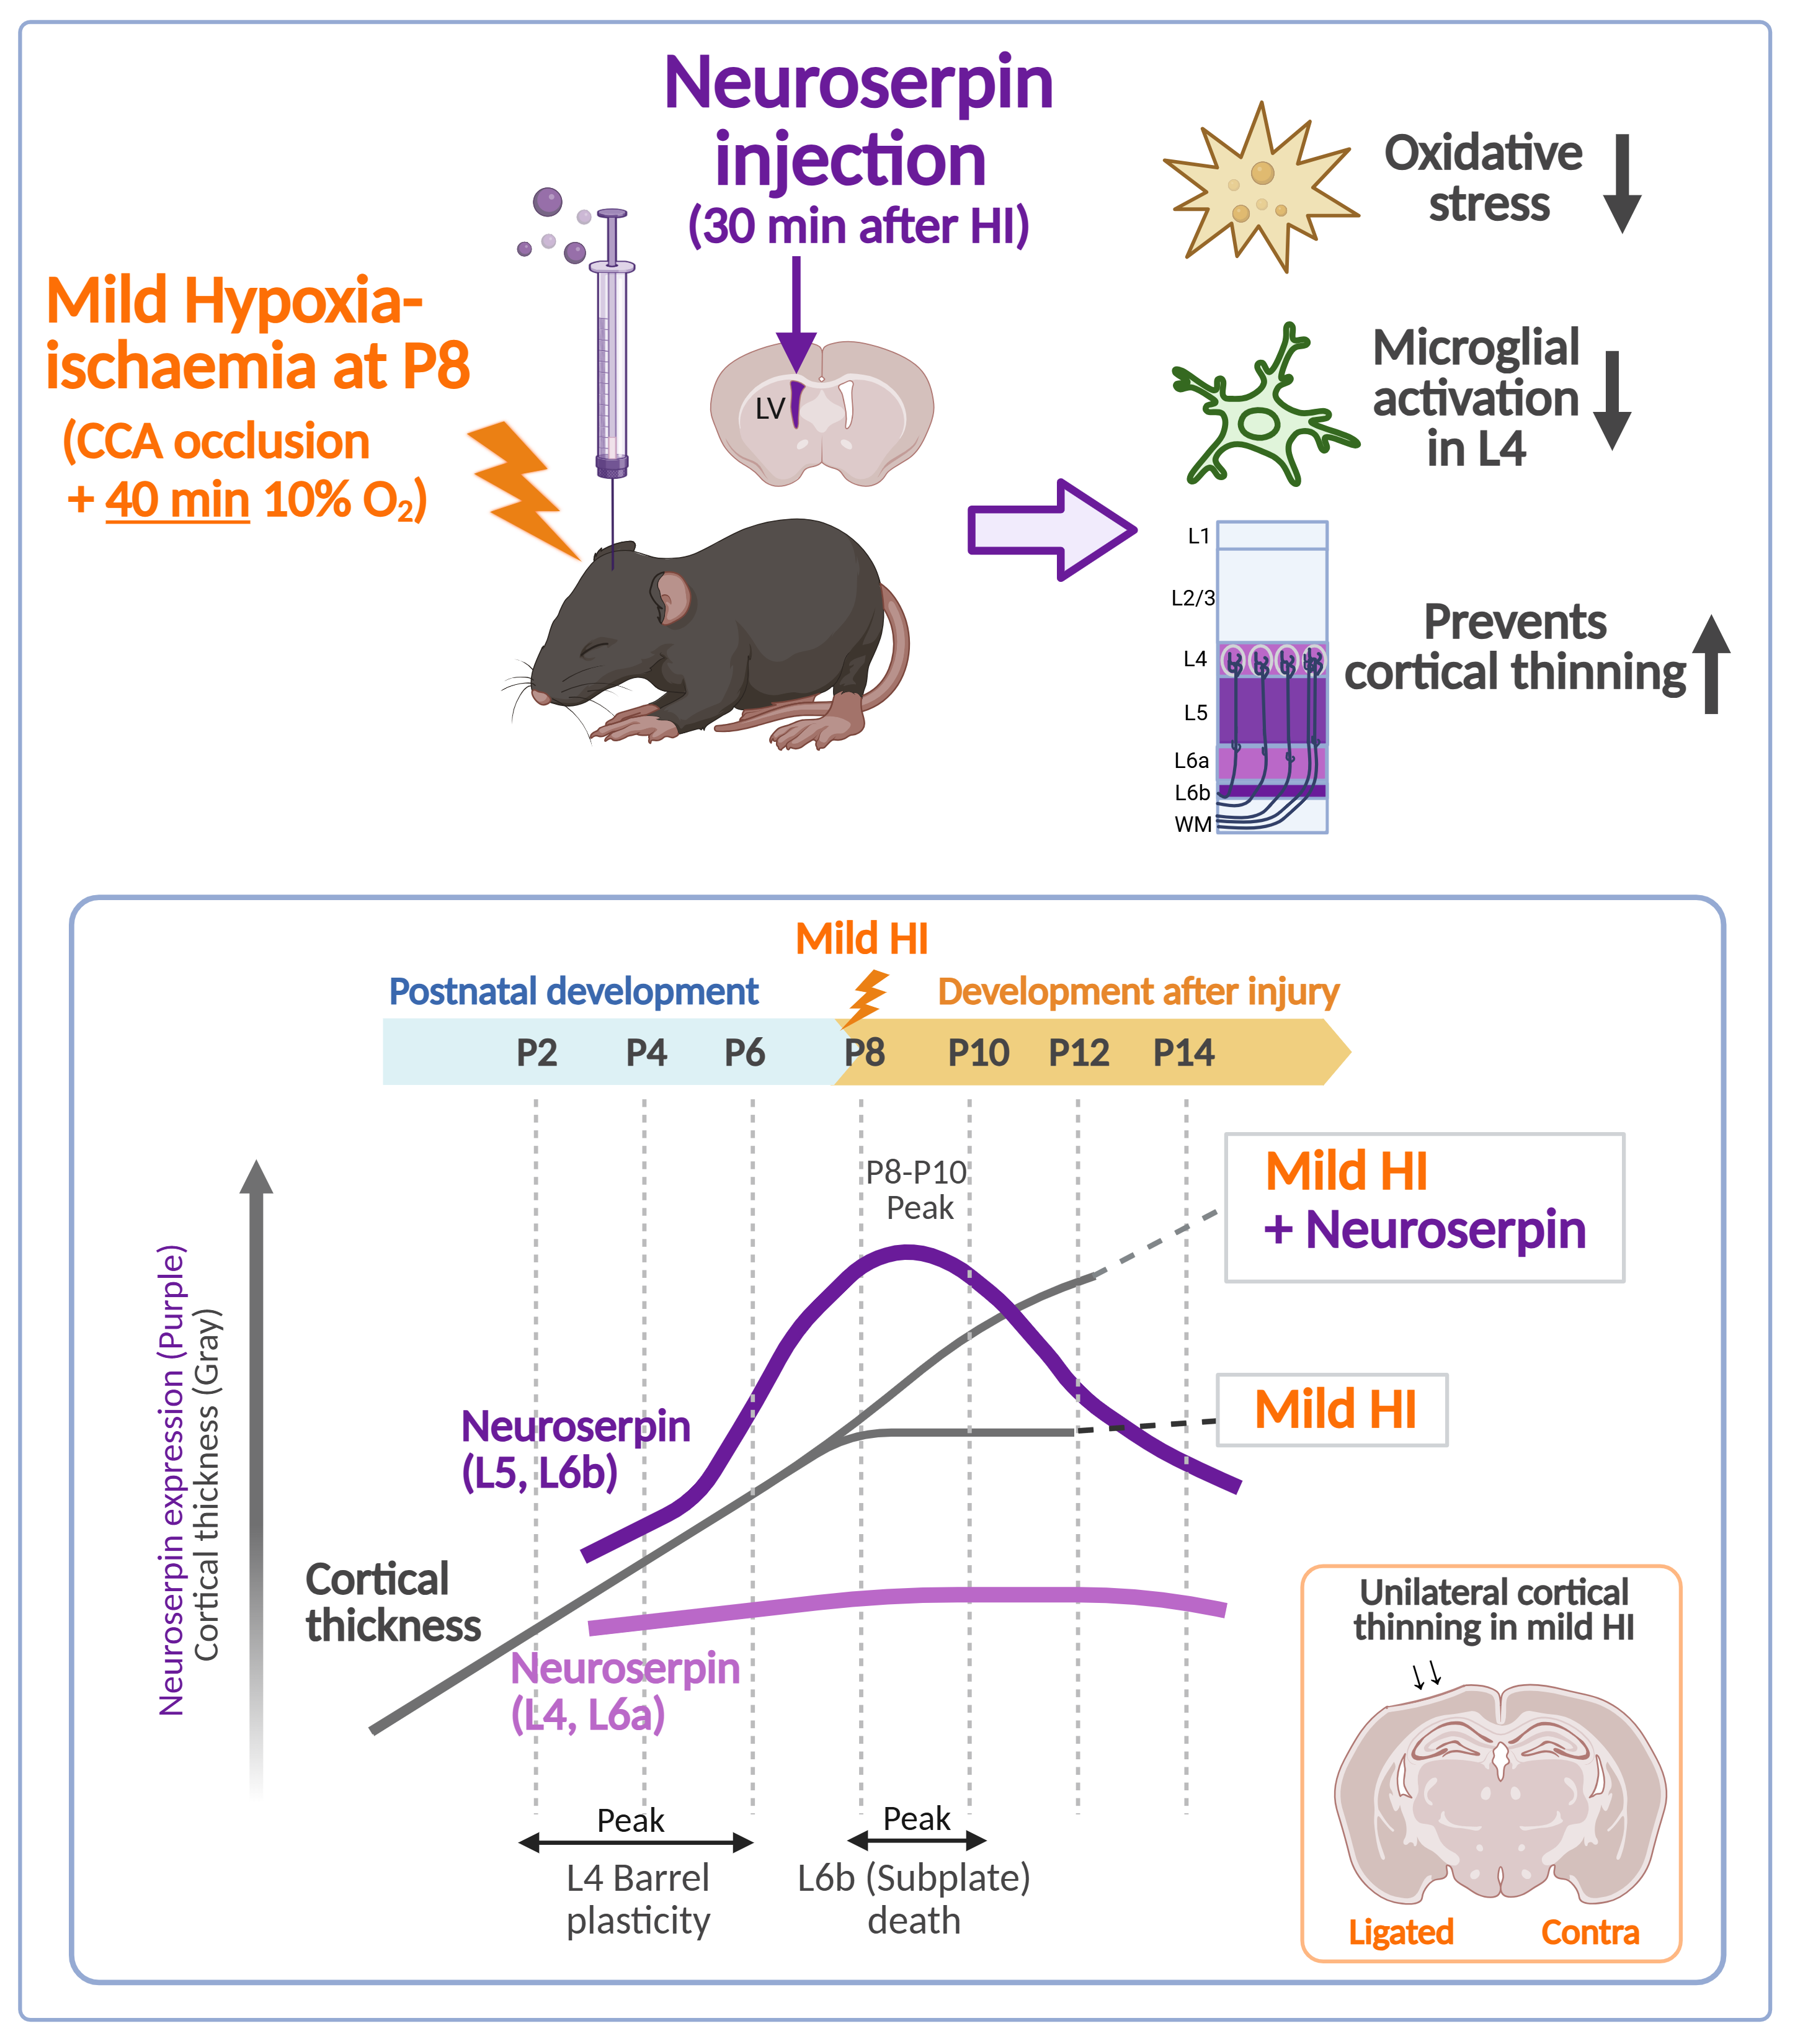
Neonatal hypoxic-ischaemic encephalopathy (HIE) remains a leading cause of infant morbidity and mortality worldwide, with therapeutic hypothermia being the only clinically approved treatment. This study investigates the cortical expression pattern of neuroserpin during postnatal brain development and evaluates its neuroprotective potential in hypoxia-ischaemia (HI)-induced brain damage using a modified Rice-Vannucci model. Experiments were conducted in neuroserpin knockout (KO) mice and through administration of exogenous neuroserpin into the brain. Between postnatal day 4 to 14 (P4-P14), neuroserpin-immunoreactive cell density peaked at P8-P10 in cortical layers 5 and 6b, with gradual increase in layers 2/3 and minimal changes in layers 4 and 6a. Despite comparable levels of ischaemic brain damage between the KO and wild-type (WT) mice, exogenous neuroserpin administration suppressed the HI-induced oxidative stress. Additionally, it reduced microglial activation in the cortex in mild HIE, mitigating cortical thinning and preserving neuronal distribution. These findings suggest that endogenous neuroserpin alone is insufficient for neuroprotection against HI-induced damage, but exogenous neuroserpin shows promise as a pharmacological intervention for mild neonatal HIE.
Keywords:
neonatal hypoxic-ischaemic encephalopathy
; Rice-Vannucci model
; neuroserpin
; neuroprotection
1. Introduction
Neonatal hypoxic-ischaemic encephalopathy (HIE) is a severe neurological condition characterised by cellular and structural brain damage caused by insufficient oxygen delivery, leading to focal or global hypoxia and ischaemia (Volpe, 2001). Annually, over 1 million infants worldwide are affected by HIE, with high mortality rates and lifelong neurological sequelae, including movement disorders, cognitive and language deficits, and seizures (de Vries and Jongmans, 2010; Lee et al., 2013). The extent of brain injury and its outcomes in neonatal HIE depends on factors such as the degree and duration of hypoxia/ischaemia (HI) and the stage of brain maturation at the time of the insult. Clinical tools such as Sarnat staging, modified Sarnat staging and Thompson score are used to classify neonatal HIE severity (mild, moderate or severe) and to determine eligibility for therapeutic hypothermia, the only clinically approved treatment (Sarnat and Sarnat, 1976; Thompson et al., 1997). This treatment involves cooling the body or head to 33.5±0.5°C or 34.5±0.5°C to slow metabolism and reduce cellular energy demands, significantly improving clinical outcomes (Boutilier, 2001; Azzopardi et al., 2009; Azzopardi et al., 2014; Millar et al., 2017; Ranjan and Gulati, 2023). However, therapeutic hypothermia alone is insufficient to prevent brain injury, associated sequelae, and mortality (Davidson et al., 2015; Thayyil et al., 2021), underscoring the urgent need to develop new pharmacotherapeutic strategies for neuroprotection in neonatal HIE.
The primary pathogenic factors underlying brain damage in neonatal HIE include excitotoxicity, oxidative stress, inflammation, mitochondrial dysfunction and endoplasmic reticulum (ER) stress, which collectively lead to cell death through apoptosis, necrosis and/or ferroptosis (Millar et al., 2017; Yang et al., 2024). During the primary phase of energy failure caused by hypoxia and ischaemia (HI), ATP depletion, cytosolic calcium accumulation, neuronal depolarisation, and excessive glutamate release trigger excitotoxicity. Although there is a brief recovery period during reperfusion (latent phase), persistent excitotoxicity, inflammation, oxidative stress and mitochondrial dysfunction drive cell death (apoptosis and/or necrosis) in the secondary and tertiary phases. Activated microglia, astrocytes and neutrophils exacerbate brain injury by releasing inflammatory cytokines, chemokines, free radicals and proteases, which increase blood-brain barrier (BBB) permeability and contribute to neurotoxicity (Disdier and Stonestreet, 2020). Importantly, these pathogenic factors can also disrupt key processes of brain maturation, such as synaptogenesis, myelination, and astrocyte proliferation during postnatal development (Semple et al., 2013).
Several pharmacotherapeutic candidates targeting inflammation and oxidative stress, including erythropoietin and melatonin, have shown promise in clinical and anatomical studies of neonatal HIE (Millar et al., 2017; Ranjan and Gulati, 2023; Yang et al., 2024). However, given the multifactorial nature of HIE pathology, identifying complementary or alternative targets for neuroprotection is crucial. Neuroserpin, an endogenous inhibitor of tissue plasminogen activator (tPA), is highly conserved across species (Osterwalder et al., 1996; Kumar and Ragg, 2008), and is expressed in neonatal and adult brains (Kondo et al., 2015; Adorjan et al., 2019). Neuroserpin’s neuroprotective properties have been demonstrated in adult rodent models of middle cerebral artery occlusion (MCAO) (Yepes et al., 2000; Cinelli et al., 2001; Liao et al., 2026) and in vitro in oxygen-glucose deprivation and reoxygenation (OGD/R) models (Ma et al., 2012; Wang et al., 2015; Yang et al., 2016). These studies suggest that neuroserpin mitigates NMDA receptor-mediated excitotoxicity, oxidative stress, inflammation, and ER stress, thereby reducing cell death and brain injury in adult stroke. Given the overlap in pathogenic mechanisms between adult stroke and neonatal HIE, neuroserpin holds significant potential as a candidate for the treatment of neonatal HIE (Hastings et al., 1997; Millar et al., 2017). Recent evidence highlights neuroserpin’s potential in HIE models. tPA knockout was shown to attenuate BBB permeability in a neonatal HIE model (Dupré et al., 2020), and neuroserpin administration reduced hippocampal neuronal death in a similar model (Kilicdag et al., 2024). However, the effects of neuroserpin on cortical damage and its underlying mechanisms remain unclear. This study aims to investigate the neuroprotective effects of neuroserpin on cortical injury in the Rice-Vannucci model of neonatal HIE, utilizing neuroserpin KO mice and administration of exogenous neuroserpin into the brain after the HI event.
2. Materials and Methods
2.1. Mouse Model of Neonatal HIE
To investigate the impact of neuroserpin deficiency on brain damage in HIE, a modified Rice-Vannucci model (Rice et al., 1981) was used with neuroserpin knockout (KO) mice (Serpini1tm1Dpw (B6.129-Serpini1tm1Dpw/J), stock number 019121, The Jackson Laboratory, Bar Harbor, ME, USA) and wild-type (WT) mice. Neuroserpin KO mice were generated on a mixed 129/Sv and C57BL/6JBom background via neo cassette insertion in the second exon (Madani et al., 2003). At postnatal day 8 (P8) when mouse brain development is comparable to the late third trimester or early neonatal period in humans (Semple et al., 2013), unilateral common carotid artery (CCA) ligation followed by hypoxia (10% oxygen in a nitrogen gas mixture), was performed. Mice were anaesthetised with vaporised isoflurane (3.5% induction and 2% maintenance), and the left CCA was ligated with a 6-0 vicryl suture (W9981, Ethicon, Somerville, NJ, USA). After recovery, pups were returned to their cages for at least 1 hour before exposure to hypoxia at 37°C for 40 minutes. At P10, the pups were transcardially perfused with phosphate buffered saline (PBS, 0.1M, pH7.4). These experiments were conducted under UK Home Office protocols and in accordance with the project licence.
To evaluate the protective effects of exogenous neuroserpin, another modified Rice-Vannucci model was employed, in which both the CCA and the external carotid artery (ECA) were permanently ligated to reduce brain damage variability (Edwards et al., 2017). C57BL/6J mice (Oriental Bio Service Inc., Kyoto, Japan) at P8 underwent left CCA and ECA ligation with 6-0 silk sutures (DEWB0603, Akiyama-seisakusyo Co. Ltd., Tokyo, Japan), allowed to rest for at least 1 hour, and then exposed to hypoxic gas (10% oxygen in a nitrogen gas mixture) at 37°C for 40 minutes. Thirty minutes after hypoxia, the pups were injected into the lateral ventricle (coordinates: 1.1 mm laterally and 3.0 mm caudally from the lambda and -2.3 mm vertically from the cranial surface) with either artificial cerebrospinal fluid (ACSF) (Tocris Bioscience, Minneapolis, MN, USA) or 100 ng of neuroserpin (PeproTech, Rocky Hill, NJ, USA, dissolved in ACSF at a concentration of 50 μg/mL, total volume of 2 μL) using a pulled glass capillary needle attached to a Hamilton syringe (701RN, Merck Life Science UK Ltd., Dorest, UK). After injection, the injector was held at the site for 1 min to prevent reflux (Kim et al., 2014). The pups were transcardially perfused with saline and/or 4% PFA in PBS either 24 hours or 4 days later. All experiments were approved by the institutional animal care and use committee of Kyoto Pharmaceutical University (Permit number: A22-062-01) and were performed in accordance with the institutional guidelines.
2.2. Cell Culture
Primary cortical neurons were prepared and cultured as described previously (Liao et al., 2023; Liao et al., 2026). Briefly, pregnant Sprague Dawley rats at E18 were sacrificed by cervical dislocation. The cortices from the embryos were dissected out in ice-cold HBSS buffer (Life Technologies, Waltham, MA, USA) supplemented with 0.06% D-glucose, 1 mM sodium pyruvate, 10 mM HEPES buffer and 1% penicillin-streptomycin, and digested in 0.05% trypsin at 37°C for 15 minutes with a shake every 2 minutes. Primary cortical neurons were dissociated by pipetting 15–20 times in Neurobasal medium (21103049, Gibco, Carlsbad, NM, USA) supplemented with 2% B27, 2 mM L-glutamine, 10 mM D-glucose and 1% penicillin-streptomycin (Life Technologies), and plated on poly-L-lysine (Sigma-Aldrich, 0.1 mg/mL)-coated culture dishes (8 × 10⁵cells/35 mm dish). After 7 days in vitro (DIV), with half-medium changes every 3 days, neurons were used for the following experiments.
To investigate the effect of HI insult on neuroserpin expression in cultured neurons, an oxygen-glucose deprivation reperfusion model was used. Briefly, the cortical neurons at 7 DIV were cultured with glucose-free DMEM medium in a Modular Incubator Chamber (Billups-Rothenberg, Del Mar, CA, USA) for 4 hours with hypoxia environmental conditions (95% N2 and 5% CO2). Then, cortical neurons were refreshed with the standard culture medium under normoxic conditions for reperfusion.
2.3. Immunohistochemistry
For developmental neuroserpin immunostaining, brains from P4–P14 and adult mice were perfused with PBS followed by 4% PFA in PBS and fixed in 4% PFA for 48 hours. Brains were embedded in 5% agarose, and then sectioned coronally (80 µm thickness) using a vibrating microtome (VT1000S, Leica, Wetzlar, Germany). After washing with PBS, the sections were incubated in 2% donkey serum (D9663, Sigma, Saint Louis, MO, USA) in PBS containing 0.2% Triton X-100 as a blocking solution. The sections were then incubated with rabbit anti-neuroserpin polyclonal antibody (ab33077, Abcam, Cambridge, UK; diluted 1:1000 with blocking solution) and goat anti-connective tissue growth factor (CTGF) polyclonal antibody (Sc-14939, Santa Cruz Biotechnology, Santa Cruz, CA, USA; diluted 1:1000 with blocking solution) at 4 °C overnight. Subsequently, the sections were washed with PBS, and then incubated with the following secondary antibodies for 2 hours at room temperature (RT): Alexa Fluor 488-conjugated donkey anti-rabbit IgG (A21206, Thermo Fisher Scientific, Waltham, MA, USA; diluted 1:500 with blocking solution) and Alexa Fluor 568-conjugated donkey anti-goat IgG (A11057, Thermo Fisher Scientific; diluted 1:500 with blocking solution). Sections were mounted on glass slides and imaged using a confocal laser microscope (LSM 710, Carl Zeiss, Oberkochen, Germany). Neuroserpin-immunoreactive cells were quantified in a blinded manner using ImageJ software with the Analyse Particles plugin (NIH, MD, USA). Heatmaps were generated by averaging cortical images and overlaying them using ImageJ with the bUnwarpJ plugin.
For HIE brain immunostaining, brains were perfused with saline and 4% PFA in PBS, fixed in 4% PFA for 24 hours, then cryoprotected in 30% sucrose for 48 hours. After washing with PBS, brains were snap-frozen in 2-methylbutan cooled with dry ice, and sectioned coronally (20 µm thickness) using a cryostat (CM1860, Leica). Sections were blocked using mouse-on-mouse blocking kit (Vector Laboratories, CA, USA), and incubated with blocking solution (0.3% Triton X-100 and 20% normal goat serum (Vector Laboratories) in PBS). The sections were then incubated with the following primary antibodies in 5% normal goat serum in PBS containing 0.1% Triton X-100 for 48 h at 4°C: mouse anti-NeuN monoclonal antibody (MAB377, Chemicon International Inc., Temecula, CA, USA; diluted 1:1000), rat anti-CD68 antibody (ab53444, Abcam; diluted 1:200), and rabbit anti-neuroserpin antibody (ab33077, Abcam; diluted 1:200). Sections were washed with PBS, and then incubated with Alexa Fluor 488-conjugated goat anti-mouse IgG (A11001, Thermo Fisher Scientific; diluted 1:250), Alexa Fluor 568-conjugated goat anti-rat IgG (A11077, Thermo Fisher Scientific; diluted 1:250), and Alexa Fluor 647-conjugated goat anti-rabbit IgG (A21245, Thermo Fisher Scientific; diluted 1:250) for 2 hours at RT. After nuclear staining with 4′,6-diamidino-2-phenylindole (DAPI, D523, Dojin Kagaku, Tokyo, Japan; diluted 1:800 in PBS), the sections were mounted on glass slides and imaged using an all-in-one fluorescence microscope (BZ-X800, Keyence, Osaka, Japan). CD68-immunoreactive areas, number of NeuN-immunoreactive cells and cortical thickness were measured in a blinded manner using ImageJ software. The number of neuroserpin-immunoreactive cells was manually counted in a blinded manner.
2.4. Immunoblotting
After perfusion with PBS, mouse brain hemispheres were homogenised and sonicated in lysis buffer containing 50 mM Tris-HCl (pH 7.4), 150 mM NaCl, 1% Nonidet P-40, 0.5% sodium deoxycholate, and 0.1% sodium dodecyl sulfate, supplemented with a complete protease inhibitor cocktail tablet (Roche Diagnostics, Mannheim, Germany) and phosphatase inhibitor cocktail solution (Wako Pure Chemical Industries, Osaka, Japan). The supernatant was collected after centrifugation at 17,800 × g for 15 min at 4°C. Protein concentrations were determined using a BCA protein assay kit (Pierce, Rockford, IL, USA). Equal amounts of protein from each lysate were subjected to gel electrophoresis (SDS-polyacrylamide) on 5-20% polyacrylamide gels (e-PAGEL HR, Atto, Tokyo, Japan), and transferred onto nitrocellulose membranes. Membranes were blocked with 3% skim milk in Tris-buffered saline containing 0.05% Tween-20 (TBS-T) and incubated with mouse anti-hexanoyl-lysine (HEL) antibody (MHL-021P, Japan Institute for the Control of Ageing, Shizuoka, Japan; diluted 1:500 with Can Get Signal Solution 1 (Toyobo, Osaka, Japan)) and rabbit anti-neuroserpin antibody (ab33077, Abcam; diluted 1:500 with blocking solution) at 4°C overnight. Following washes with TBS-T, the membranes were incubated with horseradish peroxidase (HRP)-conjugated anti-mouse IgG (sc-516102, Santa Cruz Biotechnology; diluted 1:2500 with Can Get Signal Solution 2 (Toyobo)) and HRP-conjugated anti-rabbit IgG (111-035-144, Jackson ImmunoResearch Laboratories, PA, USA; diluted 1:2500 with blocking solution) for 1 hour at RT. After washing, immunoreactive bands were detected with Chemi-Lumi One Super (Nacalai Tesque) using a LAS-3000 mini-image analysis system (Fujifilm, Tokyo, Japan). The membranes were then immersed in a stripping solution (193-16375, Wako Pure Chemical) for 15 minutes at RT, washed with TBS-T and used for glyceraldehyde-3-phosphate dehydrogenase (GAPDH) detection with mouse anti-GAPDH antibody (016-25523, Wako Pure Chemical Industries; diluted 1:2000 with blocking solution) and HRP-conjugated anti-mouse IgG (Santa Cruz Biotechnology). Band intensities were quantified using ImageJ software (NIH, MD, USA). The same sample was included in each Western blot analysis as a loading control, and band intensities were normalised. The band intensities of neuroserpin protein were divided by those of GAPDH protein, and the relative expression to the control group was calculated.
For the cultured neurons, immunoblotting of neuroserpin was conducted after oxygen-glucose deprivation reperfusion with different times (0, 0.25, 0.5, 1, 2, 4, 6, 8, 12, 24 hours). Cortical neurons were lysed in RIPA buffer supplemented with protease inhibitor cocktail, and the supernatant was collected after centrifugation with 15,294 × g for 15 minutes at 4°C. The Pierce BCA protein assay kit (Thermo Scientific, Waltham, MA, USA) was used to determine the protein quantitation. Equal protein amounts were separated by 10% SDS-PAGE gel and transferred to PVDF membranes. After blocking with 5% skim milk in TBS-T and washing three times with TBS-T, the blocked membranes were incubated with antibodies against neuroserpin (mouse, 1:1000; sc-48360, Santa Cruz Biotechnology) and GAPDH (rabbit, 1:2000; 10494-1-AP, Proteintech, Rosemont, IL, USA) overnight at 4 °C. After washing three times with TBS-T, the membranes were incubated with goat anti-mouse IgG H&L (HRP) (1:2000; 7076S, Cell Signaling Technology, MA, USA) and goat anti-rabbit IgG H&L (HRP) (1:4000; 7074S, Cell Signaling Technology) for 1 hour at RT. After washing, immunoreactive bands were visualized using enhanced chemiluminescence (GE Healthcare, Chicago, IL, USA) and imaged by Amersham Imager 600 (GE Healthcare). For quantification of protein levels, the band gray value was analyzed using Quantity One software (Bio-Rad, Hercules, CA, USA), and the value of neuroserpin protein was divided by the internal reference protein to obtain the relative expression. The relative expression in the experimental group was normalized to that in the control group.
2.5. Statistical Analyses
All data are presented as mean ± standard error of the mean (SEM). Statistical differences between group means were analysed using appropriate tests based on experimental design. These included Student's t-test for comparisons between two groups, one-way analysis of variance (ANOVA) followed by a Tukey’s post-hoc test, least significant difference (LSD), or Bonferoni’s multiple comparison post-hoc tests for multi-group comparisons. Two-way analysis of variance (ANOVA) followed by a Tukey’s post-hoc test for factors with two independent variables, and Fisher's exact test for categorical data analysis were used. A p-value of less than 0.05 was considered statistically significant.
3. Results
3.1. Transition of Neuroserpin Expression in the Cortex During Mouse Postnatal Development
Our previous study in human brain development demonstrated that the subplate and deep cortical plate neurons are the primary sources of neuroserpin from the 25th gestational week until the first postnatal month, and that neuroserpin expression expands towards the upper cortical layers after the 3rd postnatal month (Adorjan et al., 2019). Furthermore, we showed that neuroserpin is highly expressed in the subplate neurons of the mouse brain at P8 which is approximately equivalent to the human full-term (Kondo et al., 2015). However, the detailed spatiotemporal patterns of neuroserpin during neonatal mouse brain development remain unknown. We therefore examined the expression pattern of endogenous neuroserpin during the crucial time span of P4–P14.
The specificity of the neuroserpin antibody was confirmed by immunostaining brain sections from neuroserpin KO mice, which exhibited no immunoreactivity (Figure 1A and B). At P10, a notable expression of neuroserpin was observed in the cerebral cortex, with additional presence in the hippocampus, amygdala, and lateral thalamus (Figure 1C). It is noteworthy that neuroserpin-immunoreactive cells were abundant in layer 6b (L6b) (Figure 1A), which exhibited selective expression of CTGF (Figure 1D), as well as in layer 5 (L5) (Figure 1A). In contrast, there was a relative scarcity of neuroserpin-immunoreactivity in layers 4 and 6a (Figure 1A). Neuroserpin immunoreactivity was detected in neurons in all cortical layers at the examined ages ranging from P4, P14 to 6 months. However, the expression pattern of neuroserpin was not static during the first two postnatal weeks (Figure 1E-I). The heatmapping of neuroserpin immunoreactivity shows the dynamic alteration in the overall cortical expression patterns over time (Figure 1E). At P4, neuroserpin was observed to be enriched in L5 and L6b, notably in the retrosplenial cortex, the cortical area closest to the midline (Figure 1E and G). Subsequently, the density of neuroserpin-immunoreactive cells in L5 and L6b increased, particularly in the barrel field of the primary somatosensory area (S1), with peaks at P8-P10 (Figure 1E-H). In contrast to L5 and L6b, the density and the proportion of neuroserpin-immunoreactive cells in layers 2/3 (L2/3) increased continuously during the first two postnatal weeks, reaching the same extent as in L5 at P14 (Figure 1H and I). Notably, the number of neuroserpin-immunoreactive cells in L4 was significantly lower compared to other layers at P10 and P14 (Figure 1I). In the adult mouse cortex, neuroserpin expression was more uniformly distributed throughout the upper cortical layers, with minimal presence in L6b (Figure 1E). These results demonstrate that the transition of neuroserpin expression from the inner layers to all layers during cortical development is well conserved between humans and mice. Furthermore, the expression of neuroserpin in primary cortical neurons gradually increased from day in vitro (DIV) 1 to DIV14 (Supplementary Figure 1), suggesting that neuroserpin expression is associated with neuronal maturation.
3.2. Effects of Hypoxia-Ischaemia on Neuroserpin Expression in Primary Cultured Cortical Neurons and Mouse Cortex
As the protein level of neuroserpin is increased following HI insults in adult brains (Yepes et al., 2000; Liang et al., 2004), we sought to investigate whether HI affects neuroserpin expression in cultured cortical neurons and the neonatal cortex in vivo. To this end, neuroserpin expression was analysed in an in vitro HI model and in neonatal mice subjected to the modified Rice-Vannucci procedure at P8 (Figure 2A). The expression of neuroserpin was increased in cultured cortical neurons after reoxygenation following oxygen-glucose deprivation, reaching a maximum level at 4 hours and returning to control levels at 8 hours (Figure 2B). In contrast, the expression levels of neuroserpin protein in the hemicerebrum were abundant and comparable between sham and HIE mice at 24 hours after the HI procedure (Figure 2C). Additionally, there was no dramatic difference in the cortical expression pattern of neuroserpin between sham and mild HIE mice 4 days after the HI procedure, although the number of neuroserpin-immunoreactive cells in L4 tended to be lower in mild HIE mice compared to sham mice (Figure 2D). These results suggest that reoxygenation following HI might increase the cortical expression of neuroserpin, but this effect is not sustained over the long term.
3.3. No Difference in Neonatal Hypoxic-Ischaemic Brain Damage Between Neuroserpin KO Mice and WT Mice
To investigate whether endogenous neuroserpin plays a role in neuroprotection against neonatal HI brain damage, WT mice and neuroserpin KO mice were subjected to HI procedures according to the modified Rice-Vannucci model at P8, and the extent of HI brain damage was determined by 2,3,5-Triphenyltetrazolium chloride (TTC) staining at P10 (Figure 3). There was no significant difference in the volume of HI brain damage between WT mice and KO mice (WT: 4.79 ± 1.56 mm3, KO: 4.02 ± 1.22 mm3), given equivalent overall brain sizes (Figure 3A and B). Even when only the animals with metabolically inactive tissue were compared, the volume of the brain damage in the KO mice was comparable to that in WT mice (WT: 6.71 ± 1.87 mm3, KO: 7.78 ± 1.91 mm3) (Figure 3A and C). The analysis of the incidence of HI damage in each brain area showed that the hippocampus and striatum were more susceptible than the thalamus and cortex: the incidence was 90% in the hippocampus and striatum and 40% in the thalamus and cortex of WT mice (p=0.03, Fisher's exact test). Although the incidence of HI damage in the thalamus appeared to be higher in KO mice than in WT mice (WT: 40%, KO: 67%; p=0.24), there was no significant difference between WT and KO mice in any of the brain regions examined (Figure 3D).
3.4. Neuroprotective Effect of Treatment with Neuroserpin on Brain Damage in Mild Neonatal HIE
To evaluate the effects of exogenous neuroserpin on brain damage in a neonatal HIE model, recombinant neuroserpin protein was injected into the lateral ventricle of WT mice 30 min after the HI procedure at P8, and the brains were harvested at P12. Since the considerable variability of outcomes in terms of infarct presence and size was observed in the aforementioned HIE model, mice were subjected to ligation of the left CCA as well as ECA, followed by exposure to hypoxic gas for 40 min in this experiment (Edwards et al., 2017) (Figure 4A). As oxidative stress is one of the most critical factors contributing to brain damage in neonatal HIE (Millar et al., 2017; Yang et al., 2024), we first assessed the effect of neuroserpin injection on HI-induced oxidative stress by detecting the levels of 13-hydroperoxyoctadecanoic acid (13-HPODE)-modified protein (namely HEL), which indicates the level of lipid peroxidation (Figure 4B and C). As our previous study demonstrated that the administration of an inducer of oxidative stress (paraquat) resulted in increased levels of 26- and 50-kDa HEL in mouse brains (Ishihara et al., 2009), the intensity of these bands was measured in this study (Figure 4B and C). The intensity of the 26-kDa band was higher in the ligated side of the cerebral hemisphere of the HI-ACSF group (the mice that underwent HI insult and ACSF injection) than in the contralateral side, but there was no significant difference in the intensity of the 50-kDa band between the contralateral and ligated sides. The increased level of the 26-kDa HEL was significantly reduced by treatment with neuroserpin to the level observed in naïve mice, indicating that exogenous neuroserpin suppressed HI-induced oxidative stress. Furthermore, as neonatal HI induces the accumulation of activated microglia in injury regions (McRae et al., 1995; Brégère et al., 2022), we investigated the effect of neuroserpin administration on microglial activation by detecting immunoreactivity for CD68, a marker of activated microglia with phagocytic activity (Figure 4D-F). The severity of HI brain damage was categorised as mild or severe based on cortical shape: brains with and without obvious cortical depression were classified as severe and mild damage, respectively. There was no significant difference in severity between the HI-ACSF group and the HI-NSP group (the mice that underwent HI insult and neuroserpin injection): the number of mice exhibiting severe and mild HI damage in the HI-ACSF group was 1 and 6, respectively, and the number of mice in the HI-NSP group was 4 and 4, respectively (p=0.28, Fisher's exact test). Marked CD68-immunoreactivity was observed in the cerebral hemisphere of HI mice, but not observed in the sham mice (Figure 4D-F). In the severe category, neuroserpin treatment did not reduce the size of CD68-immunoreactive areas in either the cerebral hemisphere or any brain region of interest (cortex, hippocampus or thalamus) (Supplementary Figure 2). However, in the mild category, CD68-immunoreactive areas, particularly in the cortex, were significantly smaller in the HI-NSP group than in the HI-ACSF group (Figure 4D-F), indicating that neuroserpin suppressed microglial activation in mild HIE. It is noteworthy that the HI-ACSF group exhibited evident CD68-immunoreactivity in cortical L4 and it was clearly suppressed by treatment with neuroserpin. In contrast, no significant reduction in CD68-immunoreactivity was observed in the hippocampus following treatment with neuroserpin (Figure 4D and F).
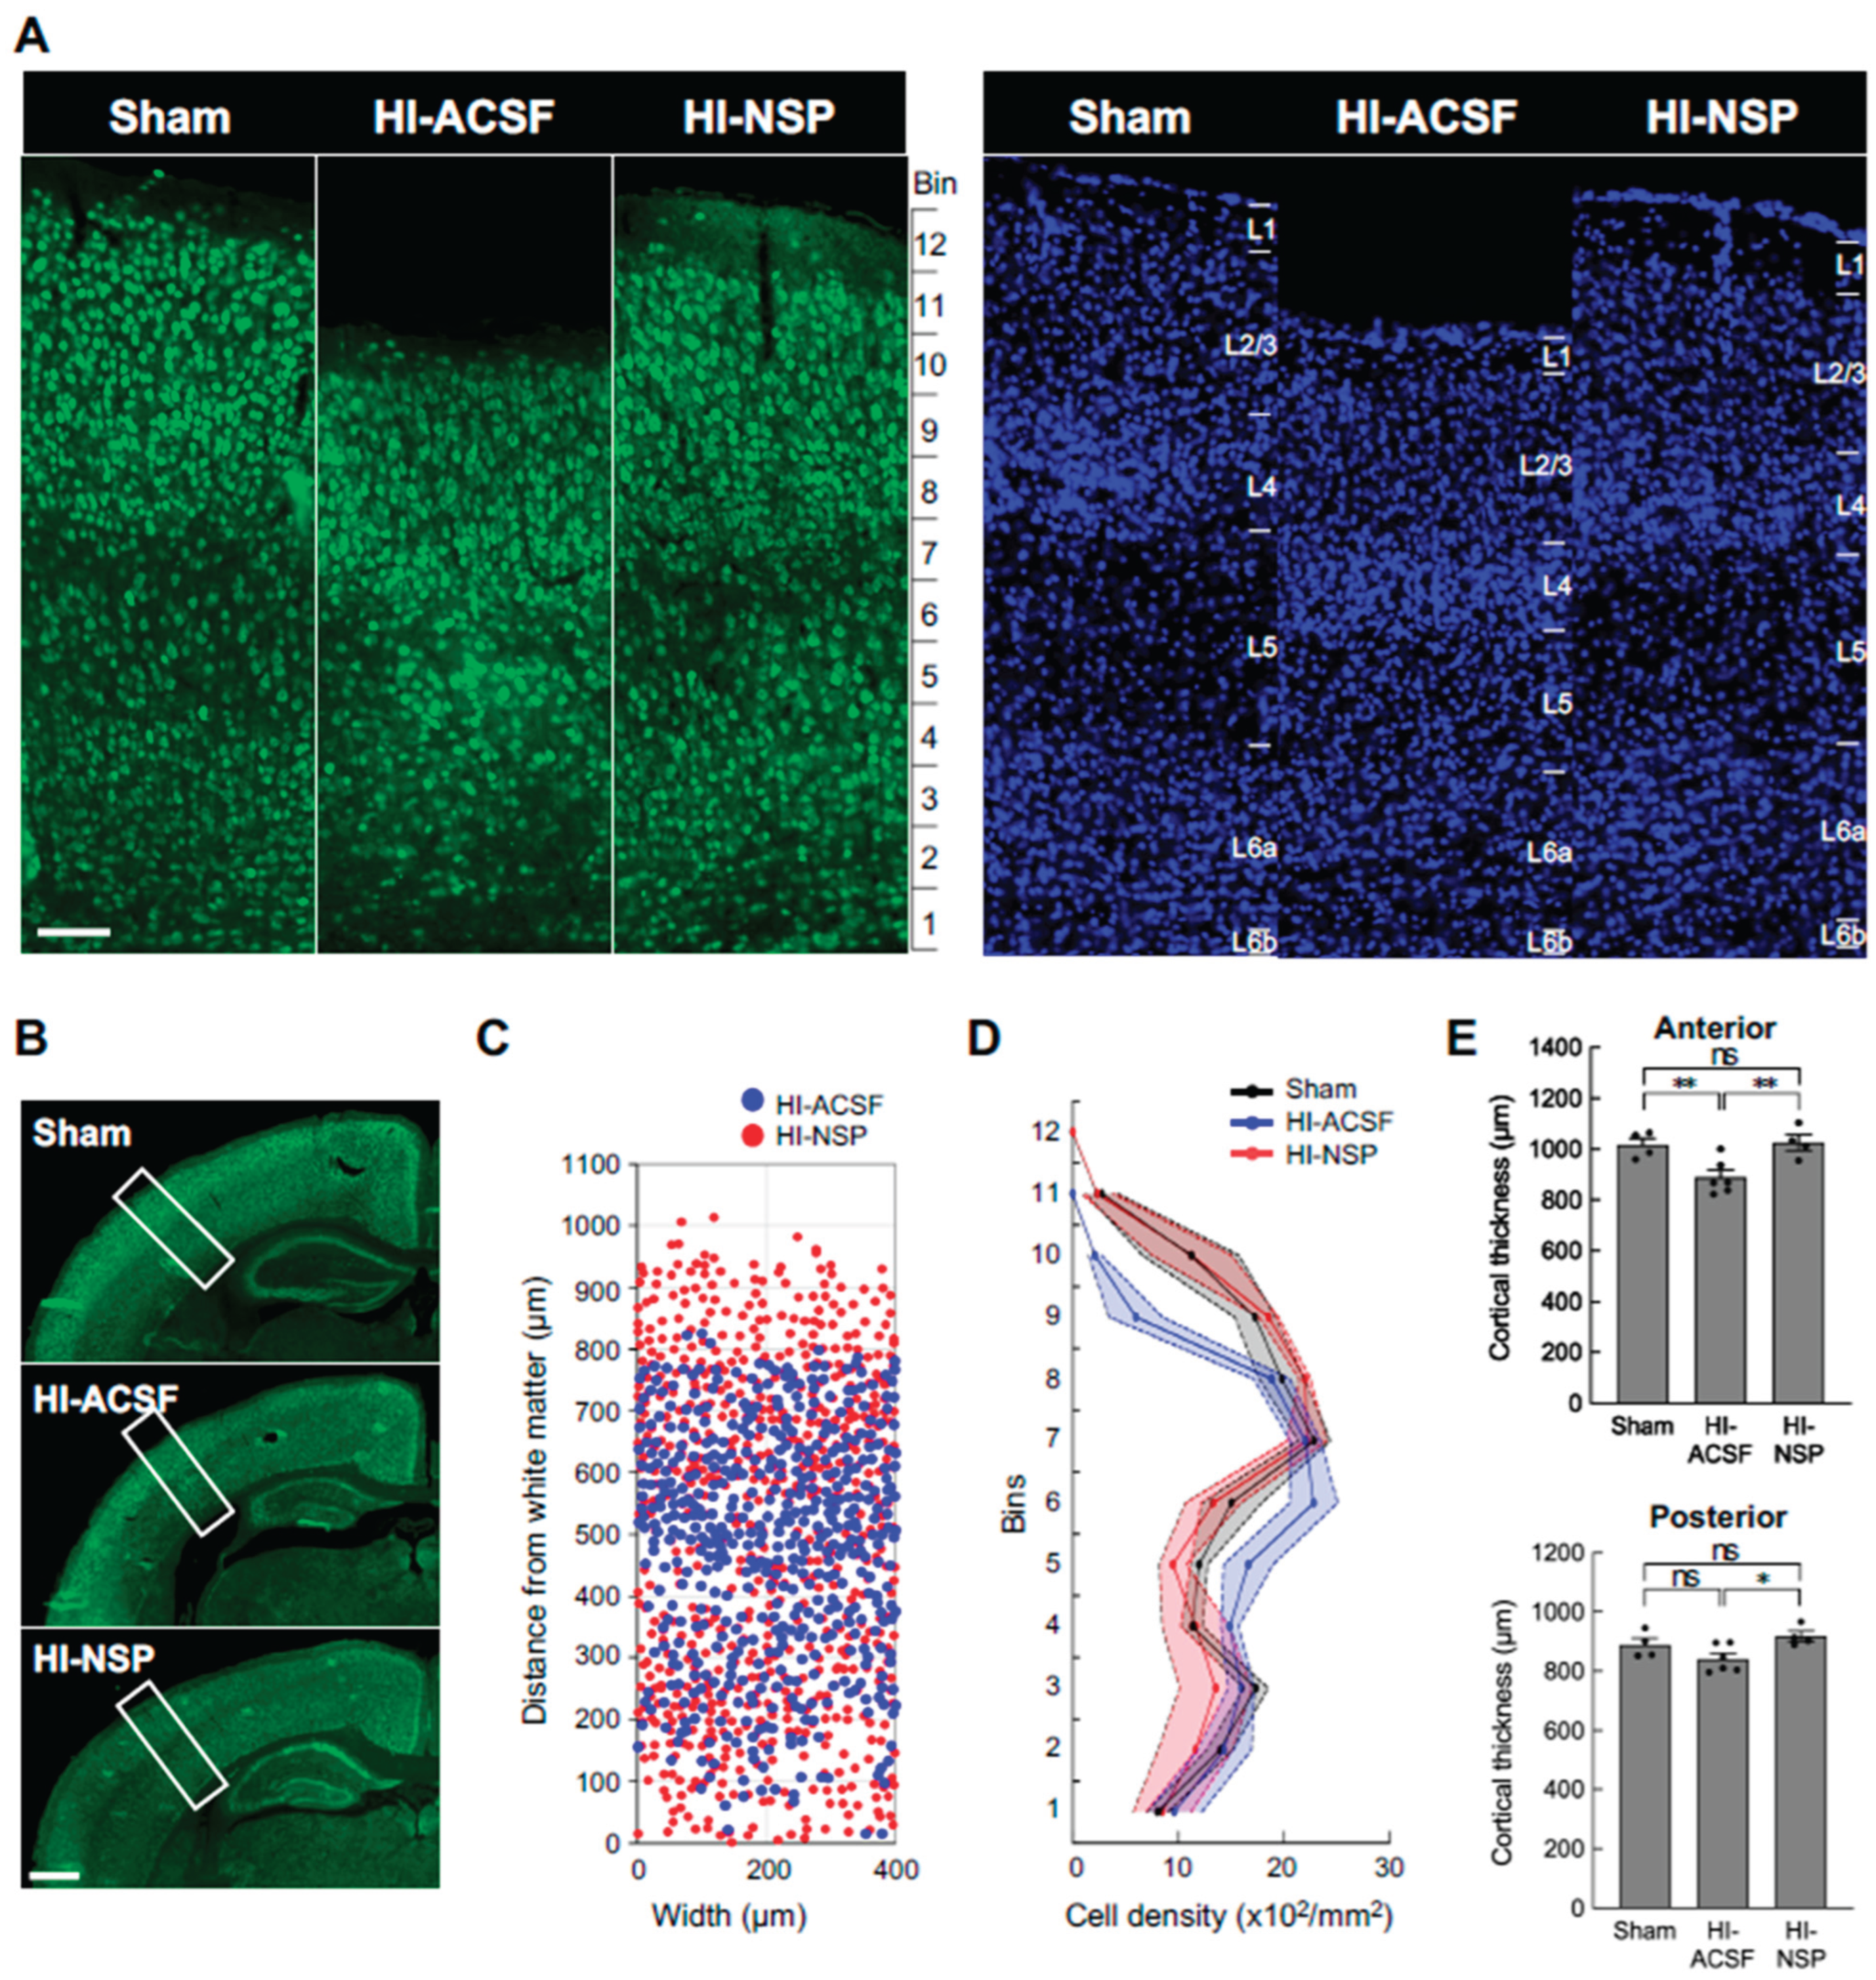
Since the protective effects of neuroserpin were observed particularly in the cortex in mild HIE, we further examined whether the laminar distribution of mature neurons was affected in mild HIE and whether the alteration was suppressed by treatment with neuroserpin. To this end, we analysed the density of NeuN-immunoreactive cells in 100 μm bins in the primary somatosensory cortex at P12, following HI at P8. The distribution of the NeuN-immunoreactive cells was altered after HI, but this alteration was prevented by neuroserpin treatment, maintaining levels similar to sham controls in the HI group subjected to HI at P8 (Figure 5A-C). In addition, cortical thickness was reduced in the HI-ACSF group compared to the sham group, but the reduction was significantly attenuated by treatment with neuroserpin (Figure 5D). In the context of cortical development, laminar maturation occurs in deep layers (L5-6) by P2 in mice, and upper layers (L1-4) appear by P8 (Gonda et al., 2013; Hoerder-Suabedissen and Molnár, 2015; Yoshinaga et al., 2021). Therefore, these results suggest that neuroserpin exerts neuroprotective effects against HI-induced cortical damage and/or impaired laminar maturation in mild neonatal HIE. Notably, the laminar distribution of NeuN-immunoreactive cells and cortical thickness in the HI-ACSF and HI-NSP groups were comparable in a preterm HIE mouse model where P2 mice were subjected to an HI insult and administered neuroserpin (Supplementary Figure 3), suggesting that there is a critical period for the neuroprotective effect of neuroserpin on the HI-induced cortical abnormalities.
4. Discussion
This study aimed to elucidate the spatiotemporal expression pattern of neuroserpin during postnatal brain development and to assess its protective effects, both endogenous and exogenous, in a neonatal hypoxic-ischemic encephalopathy (HIE) mouse model. Our findings reveal that neuroserpin expression in the cortex undergoes dynamic changes during the first two postnatal weeks. Notably, neuroserpin-immunoreactive cell density peaks in layers 5 and 6b at postnatal days (P) 8-10 and gradually increases in layer 2/3, while remaining relatively stable in L4 and L6a. Contrary to initial expectations, neuroserpin deficiency did not exacerbate brain damage in the modified Rice-Vannucci model of neonatal HIE. However, in a mild neonatal HIE model, exogenous neuroserpin treatment significantly mitigated oxidative stress, microglial activation, cortical thinning, and neuronal distribution changes caused by the HI insult.
Emerging evidence suggests that even mild HIE can have long-term impacts. While children with mild HIE (Sarnat stage 1) have been historically assumed to experience minimal long-term effects, recent studies have highlighted subtle but significant deficits, including cognitive and neuropsychological challenges later in life (Robertson and Finer, 1985; Robertson et al., 1989). Some untreated infants with mild HIE exhibit cognitive, language and communication deficits at 18-22 months (Chalak et al., 2018), and children with mild HIE experience neuropsychological problems in school and peer relationships in adolescence (Halpin et al., 2022). Moreover, recent studies have reported electroencephalography (EEG) abnormalities in infants with even just mild HIE (Garvey et al., 2021; Natarajan et al., 2022). However, the pathophysiology of mild neonatal HIE remains poorly understood.
Our study showed a marked microglial phagocytic immunoreactivity in L4, particularly in the S1, as well as a reduction in cortical thickness and an alteration in neuronal distribution in mild HIE mice that had been subjected to an HI insult at P8 (Figure 4 and Figure 5). In the rodent S1 barrel cortex, thalamocortical projections innervate the cortical plate at P2 and begin to form periphery-related patterns in the whisker barrel field (Molnár and Kwan, 2024). At P8, the majority of L4 neurons are localised within the septa of the cytoarchitectonic barrels. Subsequently, sensory input-dependent L4 to L2/3 and intra-L2/3 horizontal connections are established at P10–P14 and P13–P16, respectively (Erzurumlu and Gaspar, 2012). It can therefore be reasonably deduced that the HI-induced microglial inflammation and neuronal damage in L4 at P8 could result in the impairment of the corticocortical connections between L4 and L2/3. Our study also found that the treatment with neuroserpin markedly diminished the activated microglial immunoreactivity in the cortex of mild HIE mice (Figure 4). Notably, the number of neuroserpin-immunoreactive cells in L4 was relatively low compared to other layers, with no significant change from P4 to P14 (Figure 1). These findings suggest that the low level of neuroserpin expression in L4 is likely to be associated with its vulnerability following HI, and that a single administration of neuroserpin is sufficient to protect against the cortical damage in mild HIE. Although further functional studies are required to explore neuroserpin’s role in cortical circuit development, our data suggest that its administration could ameliorate HI-induced disruptions in connectivity during critical developmental windows.
In preterm mild/moderate HI models where rodents underwent the HI procedure at P2, previous studies have shown that HI causes the strongest cleaved caspase-3 immunoreactivity in L4 (Okusa et al., 2014), and transient hypoconnectivity in L4 as well as persistent functional and anatomical changes in circuits to L4 until adolescence (Sheikh et al., 2022). In contrast to the neonatal HIE model (Figure 4 and 5), the neuroprotective effect of neuroserpin was not found in the preterm HIE model (Supplementary Figure 3), suggesting that the neuroprotective effects of neuroserpin may depend on the timing and severity of HI injury. Additionally, in our neonatal HIE model (P8), neuroserpin treatment was effective in mild cases but failed to suppress damage in severe cases (Supplementary Figure 2). These findings point to the existence of a critical window for neuroserpin's efficacy and the need for severity-based optimization of dosing.
Our results also diverge from findings in adult stroke models, where neuroserpin deficiency exacerbates outcomes and its supplementation reduces infarct size and neurological deficits (Yepes et al., 2000; Cinelli et al., 2001; Zhang et al., 2002; Gelderblom et al., 2013). Neuroserpin deficiency results in larger infarct size and worse neurological outcome after MCAO in adult mice (Gelderblom et al., 2013). However, our results in the neonatal HIE model did not reflect the aggravating effects of neuroserpin deficiency observed in the adult stroke model. This discrepancy may be attributed to a variety of factors, ranging from differences in brain maturity, alteration in the expression levels and patterns of neuroserpin, tPA and other protective factors during brain maturation, to regional and layer-selective HI susceptibility between neonatal and adult brains.
Given the complexity of neonatal HIE pathology, which involve oxidative stress, inflammation, excitotoxicity, and impaired cortical maturation, therapeutic approaches targeting multiple mechanisms are highly desirable. Neuroserpin has demonstrated diverse protective effects, including inhibition of microglial activation, reduction of oxidative stress-induced cell death, and attenuation of NMDA-induced neurotoxicity in vitro (Lebeurrier et al., 2005; Ma et al., 2012; Wang et al., 2015; Cheng et al., 2017). Indeed, the present study demonstrated that a single administration of neuroserpin significantly suppressed oxidative stress and microglial activation in a neonatal HIE model. Importantly, neuroserpin treatment protected against cortical thinning and alterations in neuronal distribution caused by HI insult. Moreover, its potential role in synaptic connectivity and plasticity suggests additional benefits for cognitive and behavioral outcomes (Madani et al., 2003; Reumann et al., 2017; Pagnozzi AM et al., 2023). Given that the L5 and L6b (a layer which is considered the remnant of subplate) neurons are the major sources of neuroserpin at P8-P10 (Kondo et al., 2015), secreted neuroserpin from L5 and L6b neurons may play a role in cortical maturation, including the development of thalamocortical and intracortical circuits (Molnár et al., 2020). While a recent study reports no significant impact of neuroserpin deficiency on cortical lamination or dendritic length during postnatal development (Kement et al., 2021), its involvement in cortical circuit formation warrants further investigation. These findings highlight neuroserpin's potential as a versatile pharmacotherapeutic candidate for neonatal HIE.
This study provides novel insights into the pathophysiology of mild neonatal HIE, demonstrating marked microglial activation particularly in layer 4, altered distribution of cortical neurons, and cortical thinning. Furthermore, we show that endogenous neuroserpin is insufficient to protect against HI-induced brain damage in neonatal mice, but exogenous neuroserpin treatment at the time of HI significantly mitigates oxidative stress, microglial activation, and cortical thinning. While therapeutic hypothermia remains the only clinically approved treatment for moderate-to-severe neonatal HIE, our findings suggest that neuroserpin could serve as a promising complementary therapy for neonatal HIE, offering neuroprotection across multiple pathological domains. Further research should focus on identifying the critical period and optimal conditions for neuroserpin administration to maximise its therapeutic potential.
Supplementary Materials
The following supporting information can be downloaded at the website of this paper posted on Preprints.org.
Author Contributions
Conceptualization, Lei Shi, Lancelot Millar, Anna Hoerder-Suabedissen and Zoltán Molnár; Data curation, Eri Kawashita, Yumi Fukuzaki, Jan Fischer, Lei Shi, Yumei Liao and Peiyun Zhong; Formal analysis, Eri Kawashita, Yumi Fukuzaki, Jan Fischer, Yumei Liao and Peiyun Zhong; Funding acquisition, Eri Kawashita, Yumi Fukuzaki, Lei Shi and Zoltán Molnár; Investigation, Eri Kawashita, Yumi Fukuzaki, Jan Fischer, Lei Shi, Yumei Liao and Peiyun Zhong; Methodology, Eri Kawashita, Yumi Fukuzaki, Jan Fischer, Lei Shi, Yumei Liao, Lancelot Millar, Peiyun Zhong, Anna Hoerder-Suabedissen and Luana Soares; Project administration, Eri Kawashita and Zoltán Molnár; Resources, Eri Kawashita, Yumi Fukuzaki, Lei Shi, Keiichi Ishihara and Zoltán Molnár; Supervision, Eri Kawashita, Lei Shi, Anna Hoerder-Suabedissen, Luana Soares, Keiichi Ishihara and Zoltán Molnár; Validation, Eri Kawashita and Yumi Fukuzaki; Visualization, Eri Kawashita, Yumi Fukuzaki, Jan Fischer and Yumei Liao; Writing – original draft, Eri Kawashita, Yumi Fukuzaki, Jan Fischer and Yumei Liao; Writing – review & editing, Eri Kawashita, Jan Fischer, Lei Shi, Anna Hoerder-Suabedissen, Keiichi Ishihara and Zoltán Molnár. All authors participated in editing and approved the final version.
Funding
This work was supported by a Royal Society Newton Advanced Fellowship [AOMSNAF0051003], The International Science and Technology Cooperation Projects of Guangdong Province [2023A0505050121], and Guangdong Basic and Applied Basic Research Foundation [2022B1515130007], to LS; by the Uehara Memorial Foundation Overseas Postdoctoral Fellowship, to YF; and by JSPS KAKENHI Fostering Joint International Research (A) [20KK0381], JSPS KAKENHI Grant-in-Aid for Scientific Research (C) [23K06176], and Takeda Science Foundation, to EK. ZM’s laboratory was supported by BBSRC Project Grant [BB/X008711/1], MRC Project Grant [MR/W029073/1], Einstein Stiftung Berlin with Prof Britta Eickholt at Charité-Universitätsmedizin Berlin, Germany as part of being Einstein Fellow at Charité Universitätsmedizin Berlin, Oxford Martin School Grant: repairing the brain with 3D-printed neural tissues (Bayley, Szele, Molnár), and St John’s College Research Centre Grant.
Acknowledgments
The authors would like to thank Dr. Masahiro Tsuji from Kyoto Women's University, Dr. Keiichi Ishihara from Kyoto Pharmaceutical University and Dr. Satoshi Akiba from Kyoto Pharmaceutical University for the constructive suggestions regarding the manuscript.
Conflicts of Interest
The authors declare no conflict of interest.
References
- Adorjan, I.; et al. Neuroserpin expression during human brain development and in adult brain revealed by immunohistochemistry and single cell RNA sequencing. J. Anat. 2019, 235, 543–554. [Google Scholar] [CrossRef]
- Azzopardi, D.; et al. Effects of hypothermia for perinatal asphyxia on childhood outcomes. N. Engl. J. Med. 2014, 371, 140–9. [Google Scholar] [CrossRef] [PubMed]
- Azzopardi, D.V.; et al. Moderate hypothermia to treat perinatal asphyxial encephalopathy. N. Engl. J. Med. 2009, 361, 1349–58. [Google Scholar] [CrossRef]
- Boutilier, R.G. Mechanisms of cell survival in hypoxia and hypothermia. J. Exp. Biol. 2001, 204, 3171–81. [Google Scholar] [CrossRef] [PubMed]
- Brégère, C.; et al. Microglia and Stem-Cell Mediated Neuroprotection after Neonatal Hypoxia-Ischemia. Stem Cell Rev Rep. 2022, 18, 474–522. [Google Scholar] [CrossRef] [PubMed]
- Chalak, L.F.; et al. Prospective research in infants with mild encephalopathy identified in the first six hours of life: neurodevelopmental outcomes at, 18-22 months. Pediatr. Res. 2018, 84, 861–868. [Google Scholar] [CrossRef]
- Cheng, Y.; et al. Neuroserpin Attenuates H(2)O(2)-Induced Oxidative Stress in Hippocampal Neurons via AKT and BCL-2 Signaling Pathways. J. Mol. Neurosci. 2017, 61, 123–131. [Google Scholar] [CrossRef]
- Cinelli, P.; et al. Neuroserpin, a neuroprotective factor in focal ischemic stroke. Mol. Cell. Neurosci. 2001, 18, 443–57. [Google Scholar] [CrossRef]
- Davidson, J.O.; et al. Therapeutic Hypothermia for Neonatal Hypoxic-Ischemic Encephalopathy - Where to from Here? Front. Neurol. 2015, 6, 198. [Google Scholar] [CrossRef]
- de Vries, L.S.; Jongmans, M.J. Long-term outcome after neonatal hypoxic-ischaemic encephalopathy. Arch. Dis. Child. Fetal Neonatal Ed. 2010, 95, F220–4. [Google Scholar] [CrossRef]
- Disdier, C.; Stonestreet, B.S. Hypoxic-ischemic-related cerebrovascular changes and potential therapeutic strategies in the neonatal brain. J. Neurosci. Res. 2020, 98, 1468–1484. [Google Scholar] [CrossRef] [PubMed]
- Dupré, N.; et al. Neonatal cerebral hypoxia-ischemia in mice triggers age-dependent vascular effects and disabilities in adults; implication of tissue plasminogen activator (tPA). Exp. Neurol. 2020, 323, 113087. [Google Scholar] [CrossRef]
- Edwards, A.B.; et al. Modification to the Rice-Vannucci perinatal hypoxic-ischaemic encephalopathy model in the P7 rat improves the reliability of cerebral infarct development after 48hours. J. Neurosci. Methods. 2017, 288, 62–71. [Google Scholar] [CrossRef] [PubMed]
- Erzurumlu, R.S.; Gaspar, P. Development and critical period plasticity of the barrel cortex. Eur. J. Neurosci. 2012, 35, 1540–53. [Google Scholar] [CrossRef]
- Garvey, A.A.; et al. Multichannel EEG abnormalities during the first 6 hours in infants with mild hypoxic-ischaemic encephalopathy. Pediatr. Res. 2021, 90, 117–124. [Google Scholar] [CrossRef]
- Gelderblom, M.; et al. Deficiency in serine protease inhibitor neuroserpin exacerbates ischemic brain injury by increased postischemic inflammation. PLoS One. 2013, 8, e63118. [Google Scholar] [CrossRef]
- Gonda, Y.; et al. Robo1 regulates the migration and laminar distribution of upper-layer pyramidal neurons of the cerebral cortex. Cereb. Cortex. 2013, 23, 1495–508. [Google Scholar] [CrossRef]
- Halpin, S.; et al. Long-term neuropsychological and behavioral outcome of mild and moderate hypoxic ischemic encephalopathy. Early Hum. Dev. 2022, 165, 105541. [Google Scholar] [CrossRef]
- Hastings, G.A.; et al. Neuroserpin, a brain-associated inhibitor of tissue plasminogen activator is localized primarily in neurons. Implications for the regulation of motor learning and neuronal survival. J. Biol. Chem. 1997, 272, 33062–7. [Google Scholar] [CrossRef]
- Hoerder-Suabedissen, A.; Molnár, Z. Development, evolution and pathology of neocortical subplate neurons. Nat. Rev. Neurosci. 2015, 16, 133–46. [Google Scholar] [CrossRef]
- Ishihara, K.; et al. Increased lipid peroxidation in Down's syndrome mouse models. J. Neurochem. 2009, 110, 1965–76. [Google Scholar] [CrossRef] [PubMed]
- Kement, D.; et al. Neuroserpin Is Strongly Expressed in the Developing and Adult Mouse Neocortex but Its Absence Does Not Perturb Cortical Lamination and Synaptic Proteome. Front. Neuroanat. 2021, 15, 627896. [Google Scholar] [CrossRef]
- Kilicdag, H.; et al. Neuroserpin As an Adjuvant Therapy for Hypothermia on Brain Injury in Neonatal Hypoxic-Ischemic Rats. Am. J. Perinatol. 2024, 41, 1538–1543. [Google Scholar] [CrossRef] [PubMed]
- Kim, J.Y.; et al. Intracerebroventricular viral injection of the neonatal mouse brain for persistent and widespread neuronal transduction. J Vis Exp. 2014, 51863. [Google Scholar] [CrossRef]
- Kondo, S.; et al. Secretory function in subplate neurons during cortical development. Front. Neurosci. 2015, 9, 100. [Google Scholar] [CrossRef]
- Kumar, A.; Ragg, H. Ancestry and evolution of a secretory pathway serpin. BMC Evol. Biol. 2008, 8, 250. [Google Scholar] [CrossRef]
- Lebeurrier, N.; et al. The brain-specific tissue-type plasminogen activator inhibitor, neuroserpin, protects neurons against excitotoxicity both in vitro and in vivo. Mol. Cell. Neurosci. 2005, 30, 552–8. [Google Scholar] [CrossRef] [PubMed]
- Lee, A.C.; et al. Intrapartum-related neonatal encephalopathy incidence and impairment at regional and global levels for 2010 with trends from 1990. Pediatr. Res. 2013, 74 (Suppl 1), 50–72. [Google Scholar] [CrossRef]
- Liang, W.; et al. Reductions in mRNA of the neuroprotective agent, neuroserpin, after cerebral ischemia/reperfusion in diabetic rats. Brain Res. 2004, 1015, 175–80. [Google Scholar] [CrossRef]
- Liao, Y.; et al. The Protective Effect of (-)-Tetrahydroalstonine against OGD/R-Induced Neuronal Injury via Autophagy Regulation. Molecules. 2023, 28. [Google Scholar] [CrossRef]
- Liao, Y.; et al. Neuroserpin alleviates cerebral ischemia-reperfusion injury by suppressing ischemia-induced endoplasmic reticulum stress. Neural Regeneration Research. 2026, 21, 333–45. [Google Scholar] [CrossRef] [PubMed]
- Ma, J.; et al. Effect of neuroserpin in a neonatal hypoxic-ischemic injury model ex vivo. Biol Res. 2012, 45, 357–62. [Google Scholar] [CrossRef]
- Madani, R.; et al. Impaired explorative behavior and neophobia in genetically modified mice lacking or overexpressing the extracellular serine protease inhibitor neuroserpin. Mol Cell Neurosci. 2003, 23, 473–94. [Google Scholar] [CrossRef]
- McRae, A.; et al. Microglia activation after neonatal hypoxic-ischemia. Brain Res. Dev. Brain Res. 1995, 84, 245–52. [Google Scholar] [CrossRef]
- Millar, L.J.; et al. Neonatal Hypoxia Ischaemia: Mechanisms, Models, and Therapeutic Challenges. Front. Cell. Neurosci. 2017, 11, 78. [Google Scholar] [CrossRef]
- Molnár, Z.; Kwan, K.Y. Development and Evolution of Thalamocortical Connectivity. Cold Spring Harb. Perspect. Biol. 2024, 16. [Google Scholar] [CrossRef]
- Molnár, Z.; et al. Transient cortical circuits match spontaneous and sensory-driven activity during development. Science. 2020, 370. [Google Scholar] [CrossRef]
- Natarajan, N.; et al. Association Between Early EEG Background and Outcomes in Infants With Mild HIE Undergoing Therapeutic Hypothermia. Pediatr. Neurol. 2022, 134, 52–58. [Google Scholar] [CrossRef]
- Okusa, C.; et al. Subplate in a rat model of preterm hypoxia-ischemia. Ann Clin Transl Neurol. 2014, 1, 679–91. [Google Scholar] [CrossRef]
- Osterwalder, T.; et al. Neuroserpin, an axonally secreted serine protease inhibitor. Embo j. 1996, 15, 2944–53. [Google Scholar]
- Pagnozzi, A.M.; et al. Early brain morphometrics from neonatal MRI predict motor and cognitive outcomes at 2-years corrected age in very preterm infants. Neuroimage 2023, 267, 119815. [Google Scholar] [CrossRef] [PubMed]
- Ranjan, A.K.; Gulati, A. Advances in Therapies to Treat Neonatal Hypoxic-Ischemic Encephalopathy. J Clin Med. 2023, 12, 6653. [Google Scholar] [CrossRef]
- Reumann, R.; et al. The serine protease inhibitor neuroserpin is required for normal synaptic plasticity and regulates learning and social behavior. Learn Mem. 2017, 24, 650–659. [Google Scholar] [CrossRef]
- Rice, J.E. , 3rd, et al., The influence of immaturity on hypoxic-ischemic brain damage in the rat. Ann. Neurol. 1981, 9, 131–41. [Google Scholar] [CrossRef]
- Robertson, C.; Finer, N. Term infants with hypoxic-ischemic encephalopathy: outcome at 3.5 years. Dev. Med. Child Neurol. 1985, 27, 473–84. [Google Scholar] [CrossRef] [PubMed]
- Robertson, C.M.; et al. School performance of survivors of neonatal encephalopathy associated with birth asphyxia at term. J. Pediatr. 1989, 114, 753–60. [Google Scholar] [CrossRef]
- Sarnat, H.B.; Sarnat, M.S. Neonatal encephalopathy following fetal distress. A clinical and electroencephalographic study. Arch. Neurol. 1976, 33, 696–705. [Google Scholar] [CrossRef]
- Semple, B.D.; et al. Brain development in rodents and humans: Identifying benchmarks of maturation and vulnerability to injury across species. Prog Neurobiol. 2013, 106-107. [Google Scholar] [CrossRef]
- Sheikh, A.; et al. Neonatal Hypoxia-Ischemia Causes Persistent Intracortical Circuit Changes in Layer 4 of Rat Auditory Cortex. Cereb. Cortex 2022, 32, 2575–2589. [Google Scholar] [CrossRef]
- Thayyil, S.; et al. Hypothermia for moderate or severe neonatal encephalopathy in low-income and middle-income countries (HELIX): a randomised controlled trial in India, Sri Lanka, and Bangladesh. Lancet Glob Health. 2021, 9, e1273–e1285. [Google Scholar] [CrossRef]
- Thompson, C.M.; et al. The value of a scoring system for hypoxic ischaemic encephalopathy in predicting neurodevelopmental outcome. Acta Paediatr. 1997, 86, 757–61. [Google Scholar] [CrossRef] [PubMed]
- Volpe, J.J. Perinatal brain injury: from pathogenesis to neuroprotection. Ment Retard Dev Disabil Res Rev. 2001, 7, 56–64. [Google Scholar] [CrossRef]
- Wang, L.; et al. Neuroprotective effect of neuroserpin in oxygen-glucose deprivation- and reoxygenation-treated rat astrocytes in vitro. PLoS One. 2015, 10, e0123932. [Google Scholar] [CrossRef]
- Yang, M.; et al. Hypoxic-Ischemic Encephalopathy: Pathogenesis and Promising Therapies. Mol. Neurobiol. 2024. [Google Scholar] [CrossRef]
- Yang, X.; et al. Neuroserpin Protects Rat Neurons and Microglia-Mediated Inflammatory Response Against Oxygen-Glucose Deprivation- and Reoxygenation Treatments in an In Vitro Study. Cell Physiol Biochem. 2016, 38, 1472–82. [Google Scholar] [CrossRef] [PubMed]
- Yepes, M.; et al. Neuroserpin reduces cerebral infarct volume and protects neurons from ischemia-induced apoptosis. Blood. 2000, 96, 569–76. [Google Scholar] [PubMed]
- Yoshinaga, S.; et al. Comprehensive characterization of migration profiles of murine cerebral cortical neurons during development using FlashTag labeling. iScience. 2021, 24, 102277. [Google Scholar] [CrossRef]
- Zhang, Z.; et al. Adjuvant treatment with neuroserpin increases the therapeutic window for tissue-type plasminogen activator administration in a rat model of embolic stroke. Circulation. 2002, 106, 740–5. [Google Scholar] [CrossRef]
Figure 1.
Cortical neuroserpin expression pattern during postnatal brain maturation. (A, B) Representative images of neuroserpin immunoreactivity in the primary somatosensory cortex of wild-type (WT) mice (A) and neuroserpin knockout (KO) mice (B) at P10. The scale bars indicate 200 µm, bar in B also applies to D. (C) Distribution of neuroserpin-immunoreactive cells as seen in the coronal section of a representative P10 mouse brain (ctx: cerebral cortex; hip: hippocampus; th: thalamus; amy: amygdala). The immunoreactivity of the individual cells was enhanced by ImageJ to be visible at the given magnification. The scale bar indicates 1 mm. (D) Representative image of connective tissue growth factor (CTGF) immunoreactivity in the somatosensory cortex of neuroserpin KO mice. (E) Representative heatmaps of neuroserpin immunoreactivity in the parietal cortex at various postnatal ages (P4, 8, 10, 14 and adult). The scale bar indicates 1 mm. (F) Magnified heatmap of neuroserpin immunoreactivity in the somatosensory cortex at P10. Layers V and VI has the strongest immunoreactivity. The scale bar indicates 200 µm. (G) Representative images of neuroserpin immunoreactivity in the cortex at P4, 8, 10, and 14. The scale bar in P10 indicates 500 µm and applies to all panels. (H) Density of neuroserpin-immunoreactive cells in each of the layers (n=4 at each age). Values represent the mean ± standard error of the mean (SEM). Statistical significance was evaluated using a two-way analysis of variance (ANOVA) followed by a Tukey post-hoc test. *P < 0.05, **P < 0.01. (I) Relative proportion of total number of neuroserpin-immunoreactive cells in each layer (n=4 at each age). Values represent the mean ± SEM. Statistical significance was evaluated using a two-way analysis of ANOVA followed by a Tukey post-hoc test. *P < 0.05, **P < 0.01 vs. L4 at each age. aP < 0.01 P4 vs. P14 in each layer. bP < 0.01 P8 vs. P14 in each layer. cP < 0.01 P10 vs. P14 in each layer.
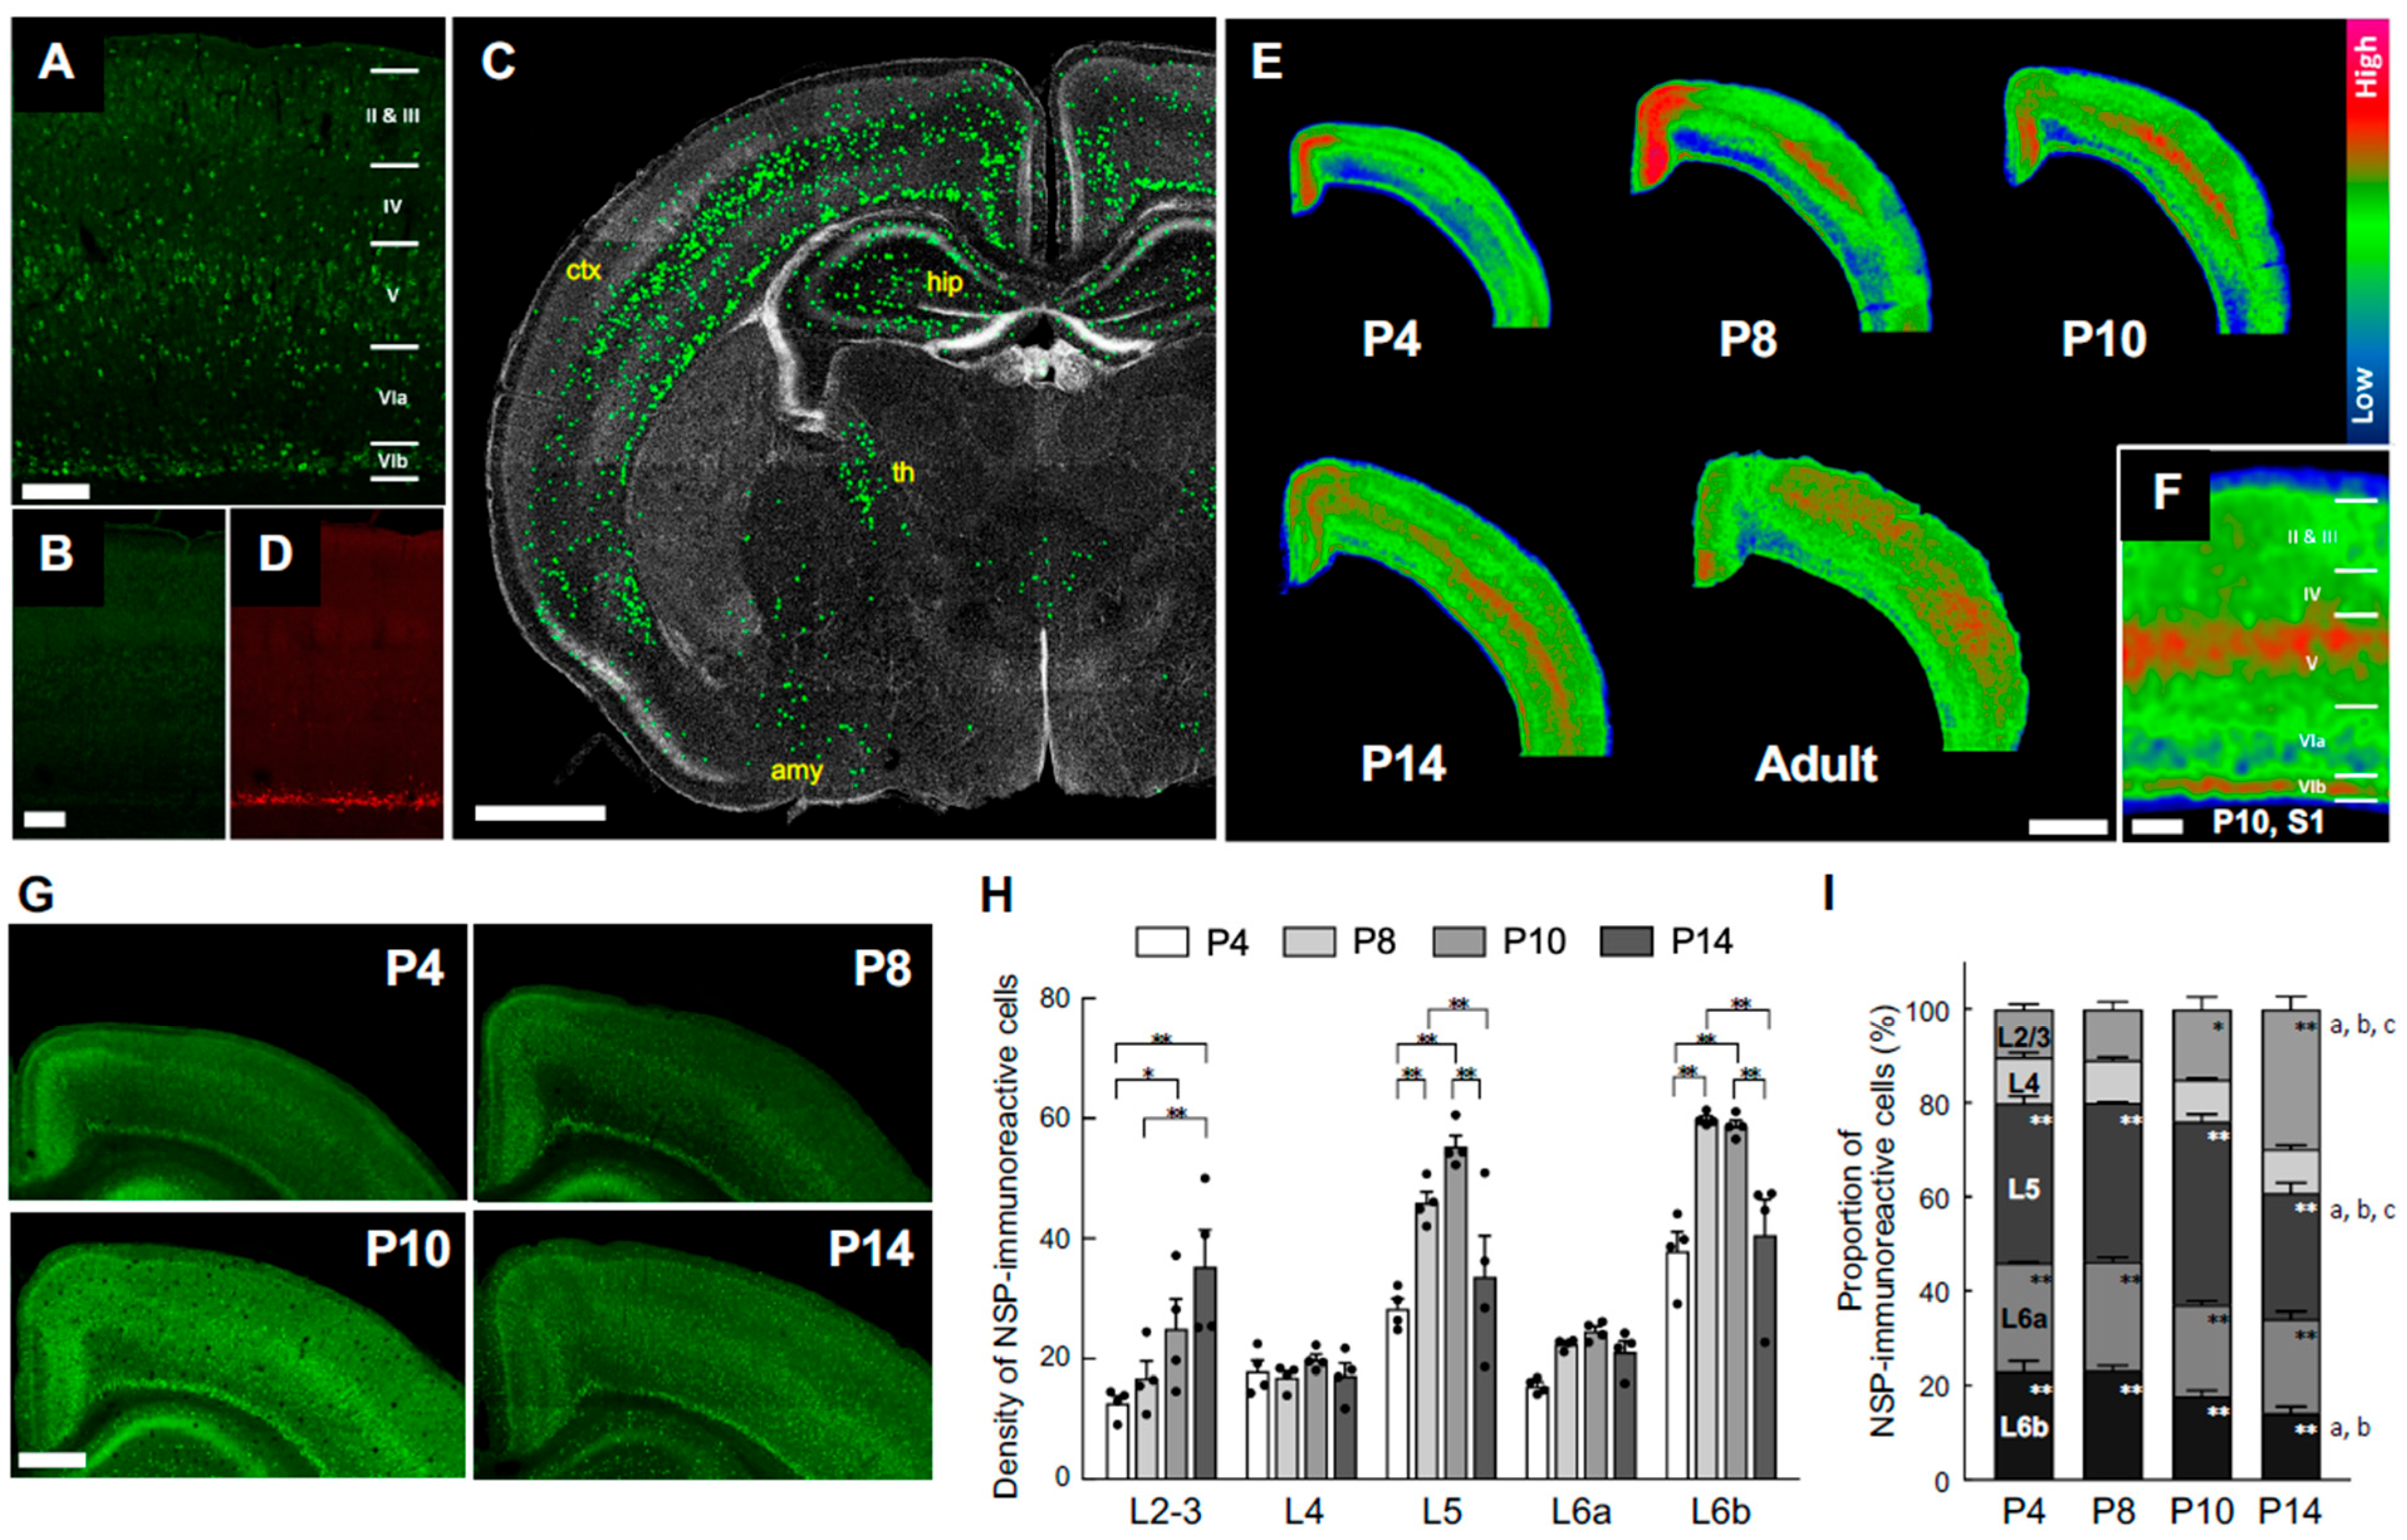
Figure 2.
Neuroserpin expression in cultured cortical neurons exposed to oxygen-glucose deprivation and reoxygenation (OGD/R) and the mouse cortex of a neonatal HIE model. (A) Diagrams of the experimental procedures of the generation of the oxygen-glucose deprivation/reoxygenation (OGD/R) model and the neonatal HIE mouse model. In the in vitro HI model, primary cortical neurons at DIV 7 were exposed to OGD for 4 h, followed by reoxygenation. The cells were harvested at the specified time points. C57BL/6J mice at P8 were subjected to left CCA and ECA ligation, and then exposed to hypoxic gas (10% oxygen in a nitrogen gas mixture) for 40 min after a minimum of 1 h rest. Western blotting was performed on the hemicerebrums were collected 24h following the HI procedure. For immunohistochemical staining, brains were collected 4 days following the HI procedure. (B) A representative immunoblotting image of neuroserpin expression in cultured primary neurons at the indicated time points following OGD (upper panel). The band intensity was measured and normalized to that of GAPDH (lower panel) (n=4 at each time point). Values represent the mean ± SEM. Statistical significance was evaluated using a one-way ANOVA followed by a Bonferroni's multiple comparisons test. *P < 0.05, **P < 0.01, ***P < 0.001. (C) Representative immunoblotting images of neuroserpin and GAPDH expression in the contra and ligated sides of the hemicerebrums of sham mice and HIE mice 24h following the HI procedure (upper panel). The band intensity was measured using ImageJ software and normalised to that of GAPDH (lower panel) (sham mice: n=3; HIE mice: n=6). Values represent the mean ± SEM. Statistical significance was evaluated using a one-way ANOVA followed by a Tukey post-hoc test. ns: non-significant. (D) Representative immunostained images of neuroserpin in the somatosensory cortex of sham mice and mild HIE mice 4 days after the HI procedure (left panel). The scale bar indicates 100 µm. The number of neuroserpin-immunoractive cells in each cortical layer was counted in a blinded manner (left panel) (sham mice: n=4; HIE mice: n=6). Values represent the mean ± SEM. Statistical significance was evaluated using a two-way ANOVA followed by a Tukey post-hoc test. *P < 0.05, ns: non-significant.
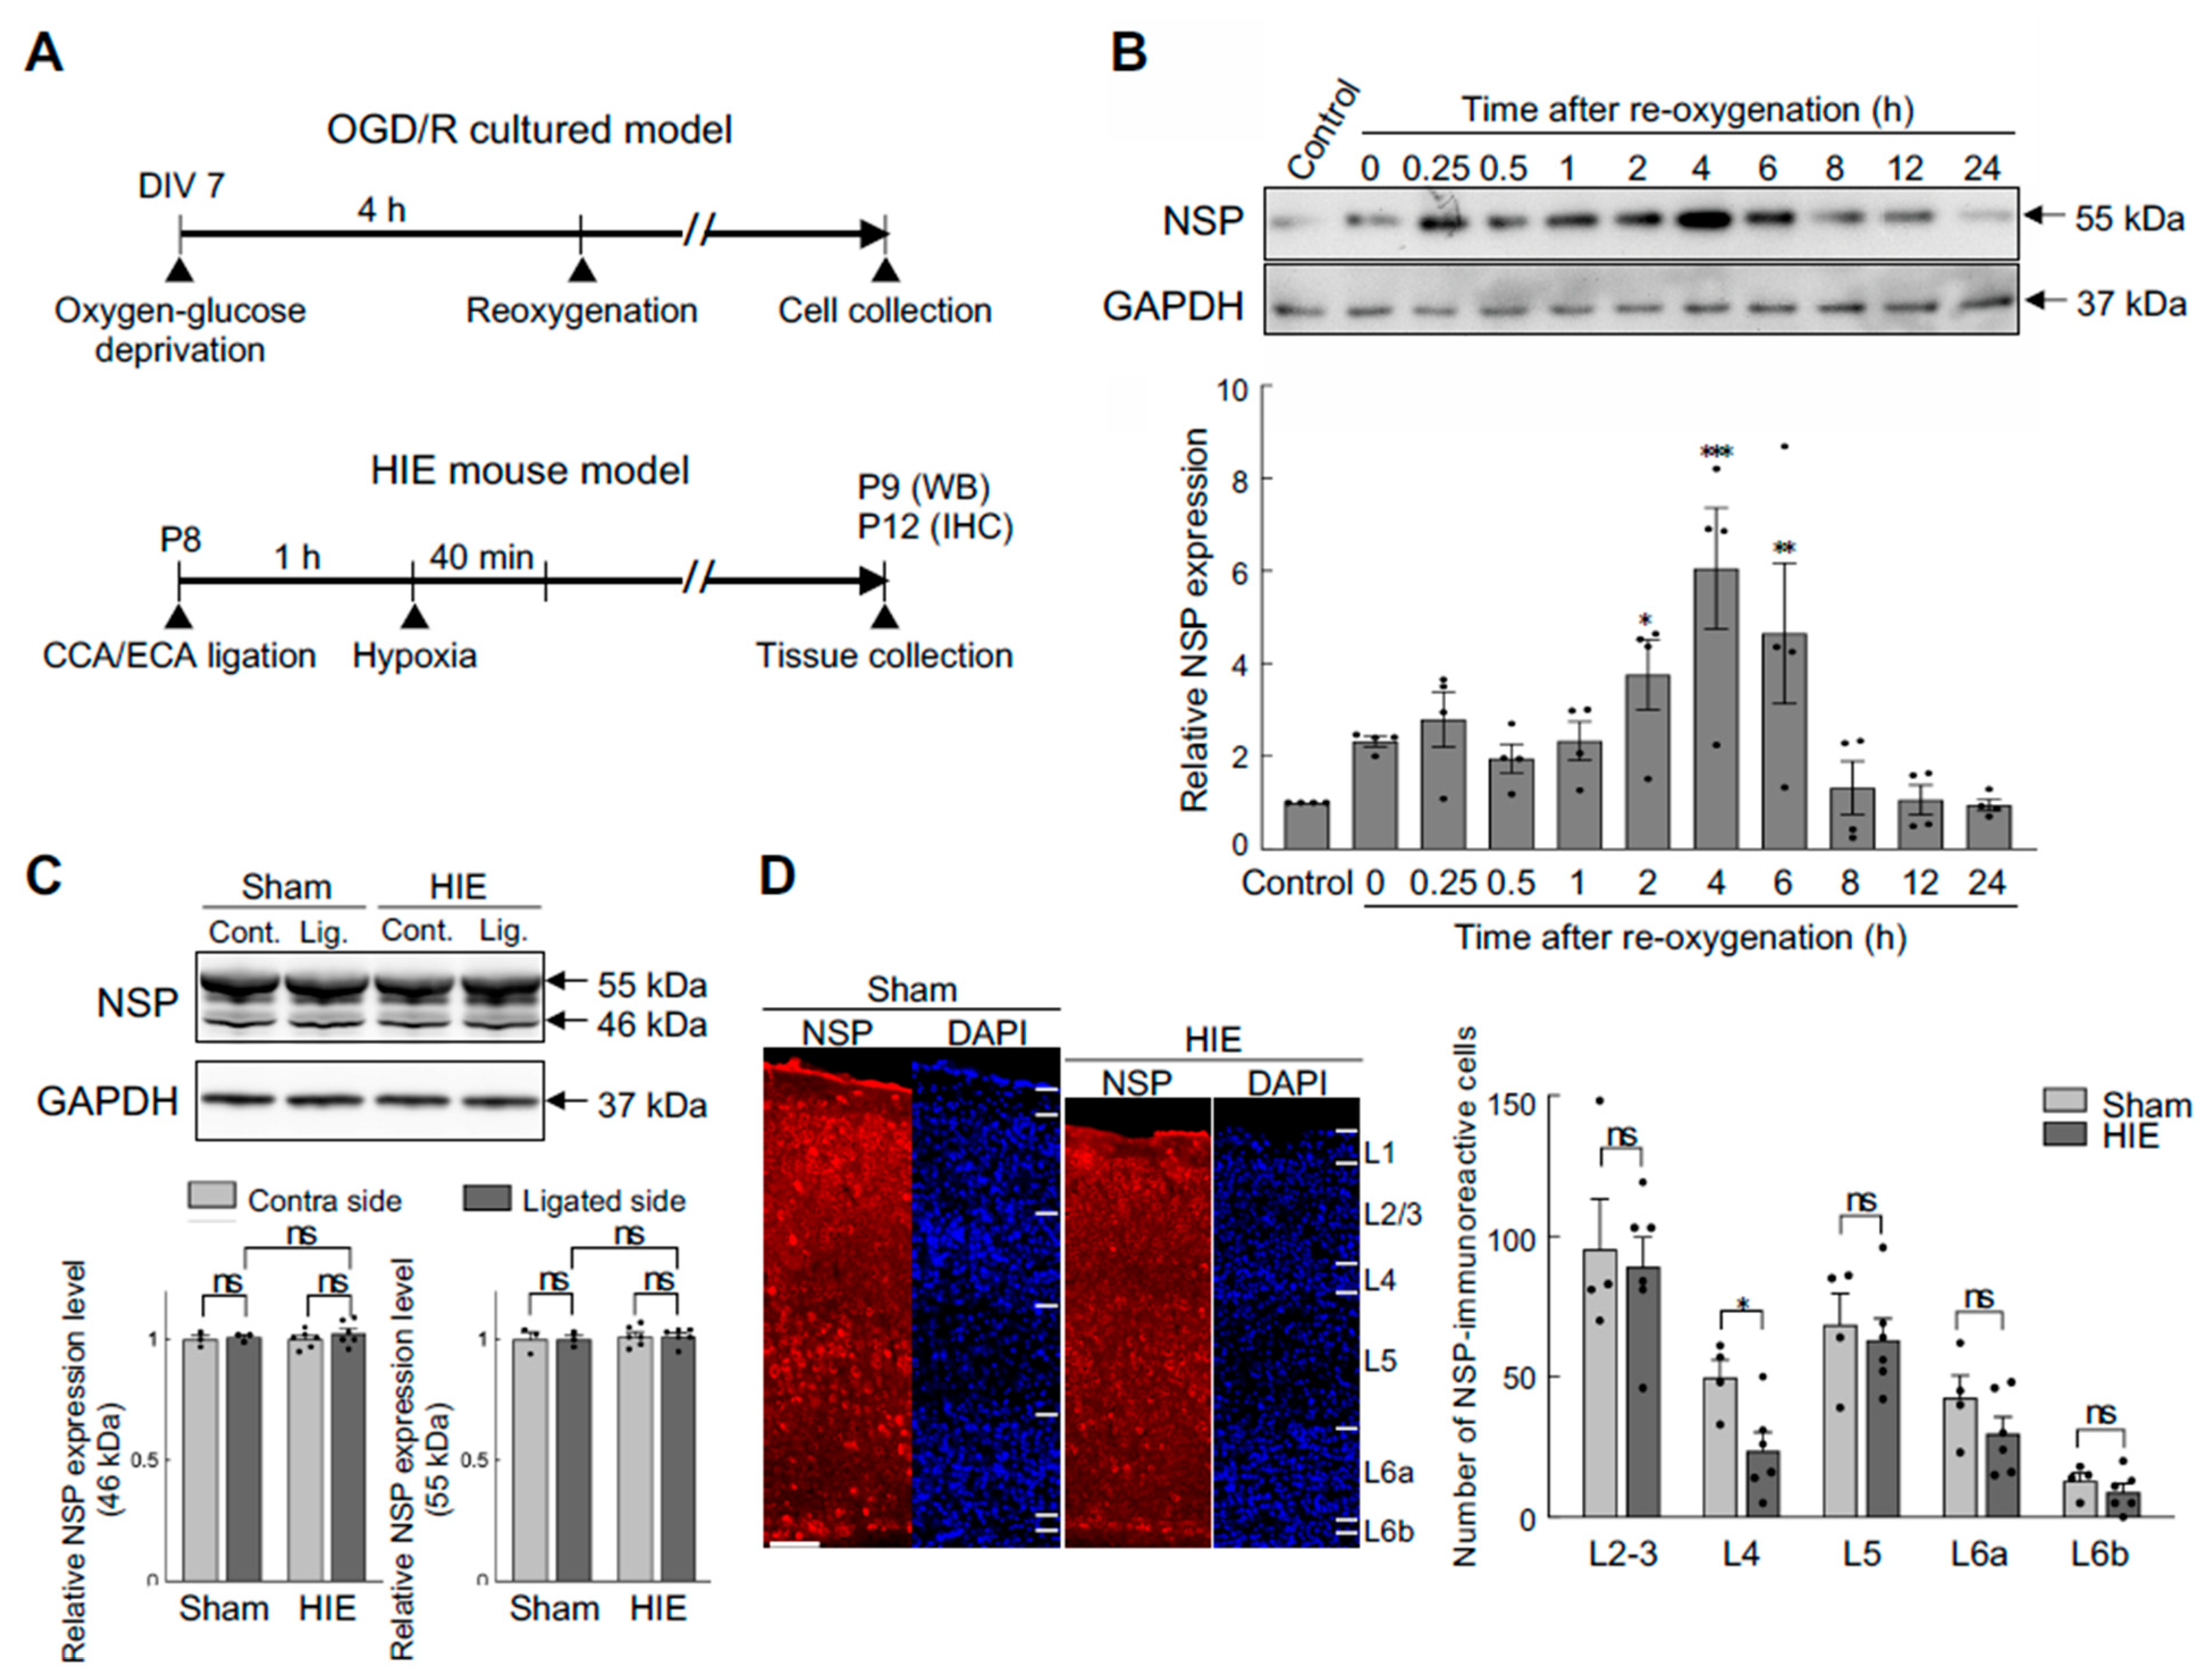
Figure 3.
Effects of neuroserpin deficiency on HI-induced brain damage. (A) Representative 2,3,5-Triphenyltetrazolium chloride (TTC) staining images of the brains of P10 WT mice and neuroserpin KO mice following the HI procedure at P8. The red TTC staining marks viable tissue, while its absence (appears white) indicates the presence of brain damage. (B) Mean volume of damaged brain area in WT and neuroserpin KO mice was measured using ImageJ software (WT mice: n=14; KO mice: n=29). Values represent the mean ± SEM. Statistical significance was evaluated using Student's t-test. ns: non-significant. (C) Mean volume of damaged brain area in WT and neuroserpin KO mice, with the exclusion of animals that did not sustain any brain injury (WT mice: n=10; KO mice: n=15). Values represent the mean ± SEM. Statistical significance was evaluated using Student's t-test. (D) Incidence of HI-induced damage in each brain region (Hip: hippocampus; Str: striatum; Th: thalamus; and Ctx: cortex). Statistical significance between WT and KO groups in each brain region was evaluated using Fisher's exact test.
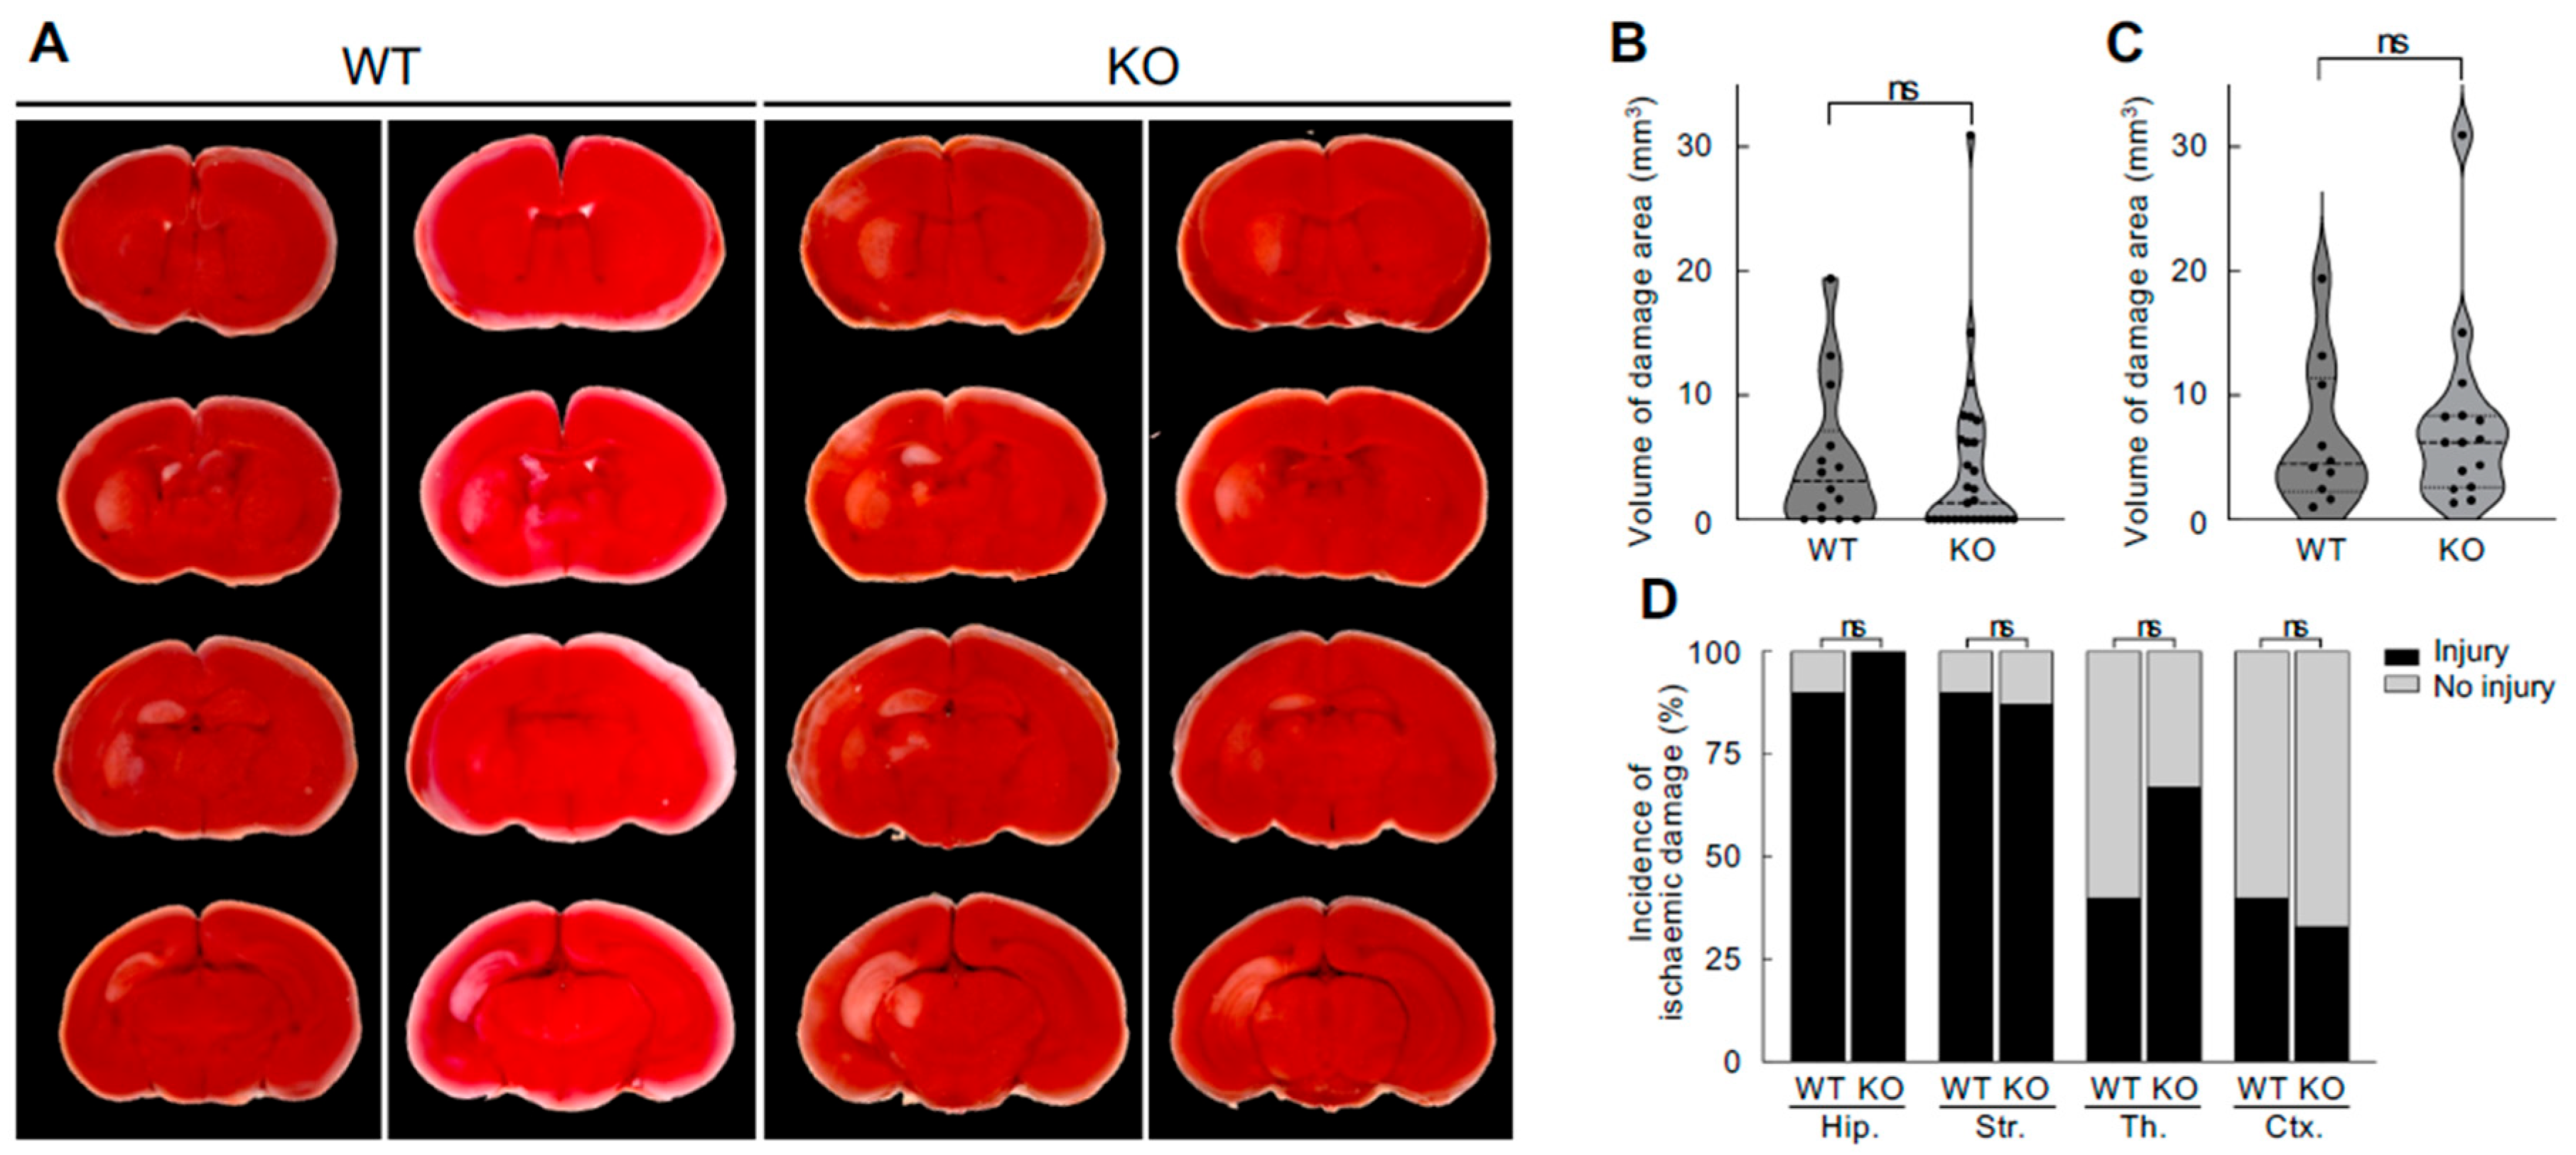
Figure 4.
Effects of an intracerebroventricular injection of recombinant neuroserpin protein on HI-induced oxidative stress and microglial activation. (A) Diagrams of the experimental procedures for the generation of a neonatal HIE model and the administration of recombinant neuroserpin protein. C57BL/6J mice at P8 were subjected to left CCA and ECA ligation, allowed to rest for at least 1h, and then exposed to hypoxic gas (10% oxygen in a nitrogen gas mixture) for 40 min. The pups were administered 100 ng of recombinant neuroserpin protein or ACSF intracerebroventricularly 30 min after HI procedures. Western blotting was performed on the hemicerebrums collected 24 h following the HI insult. For immunohistochemical analysis, brains were collected 4 days following the HI insult. HI-ACSF: mice that underwent HI insult and ACSF injection; HI-NSP: mice that underwent HI insult and neuroserpin injection. (B) Representative immunoblotting images of HEL and GAPDH expression in the contra and ligated sides of the hemicerebrums of HI-ACSF mice and HI-NSP mice 24h following the HI procedure, and in the hemicerebrum of naïve mice. (C) The band intensity was measured using ImageJ software and normalised to that of GAPDH (HI-ACSF mice: n=6; HI-NSP mice: n=4; naïve mice: n=5). Values represent the mean ± SEM. Statistical significance was evaluated using a one-way ANOVA followed by a Tukey post-hoc test. *P < 0.05, **P < 0.01. ns: non-significant. (D) Representative images of CD68 immunostaining of brain sections including the somatosensory cortex from P12 sham mice, HI-ACSF mice and HI-NSP mice with mild HIE. The merged images of CD68 and DAPI staining (upper panel), and the images of CD68 immunostaining with a region of interest demarcating each brain region are presented (lower panel, ctx: cerebral cortex; th: thalamus; hip: hippocampus). The scale bar indicates 500 µm and applies to all panels. (E) Magnified immunostained images of CD68, indicated by the rectangle in Figure 4D, are presented. The scale bar indicates 200 µm. (F) The CD68-immunoreactive areas in the ligated side of the hemisphere, cortex, thalamus and hippocampus were measured using ImageJ software in a blinded manner (sham mice: n=4; HI-ACSF mice: n=6; HI-NSP mice: n=4). Values represent the mean ± SEM. Statistical significance was evaluated using a one-way ANOVA followed by an LSD post-hoc test. *P < 0.05, **P < 0.01. ns: non-significant.
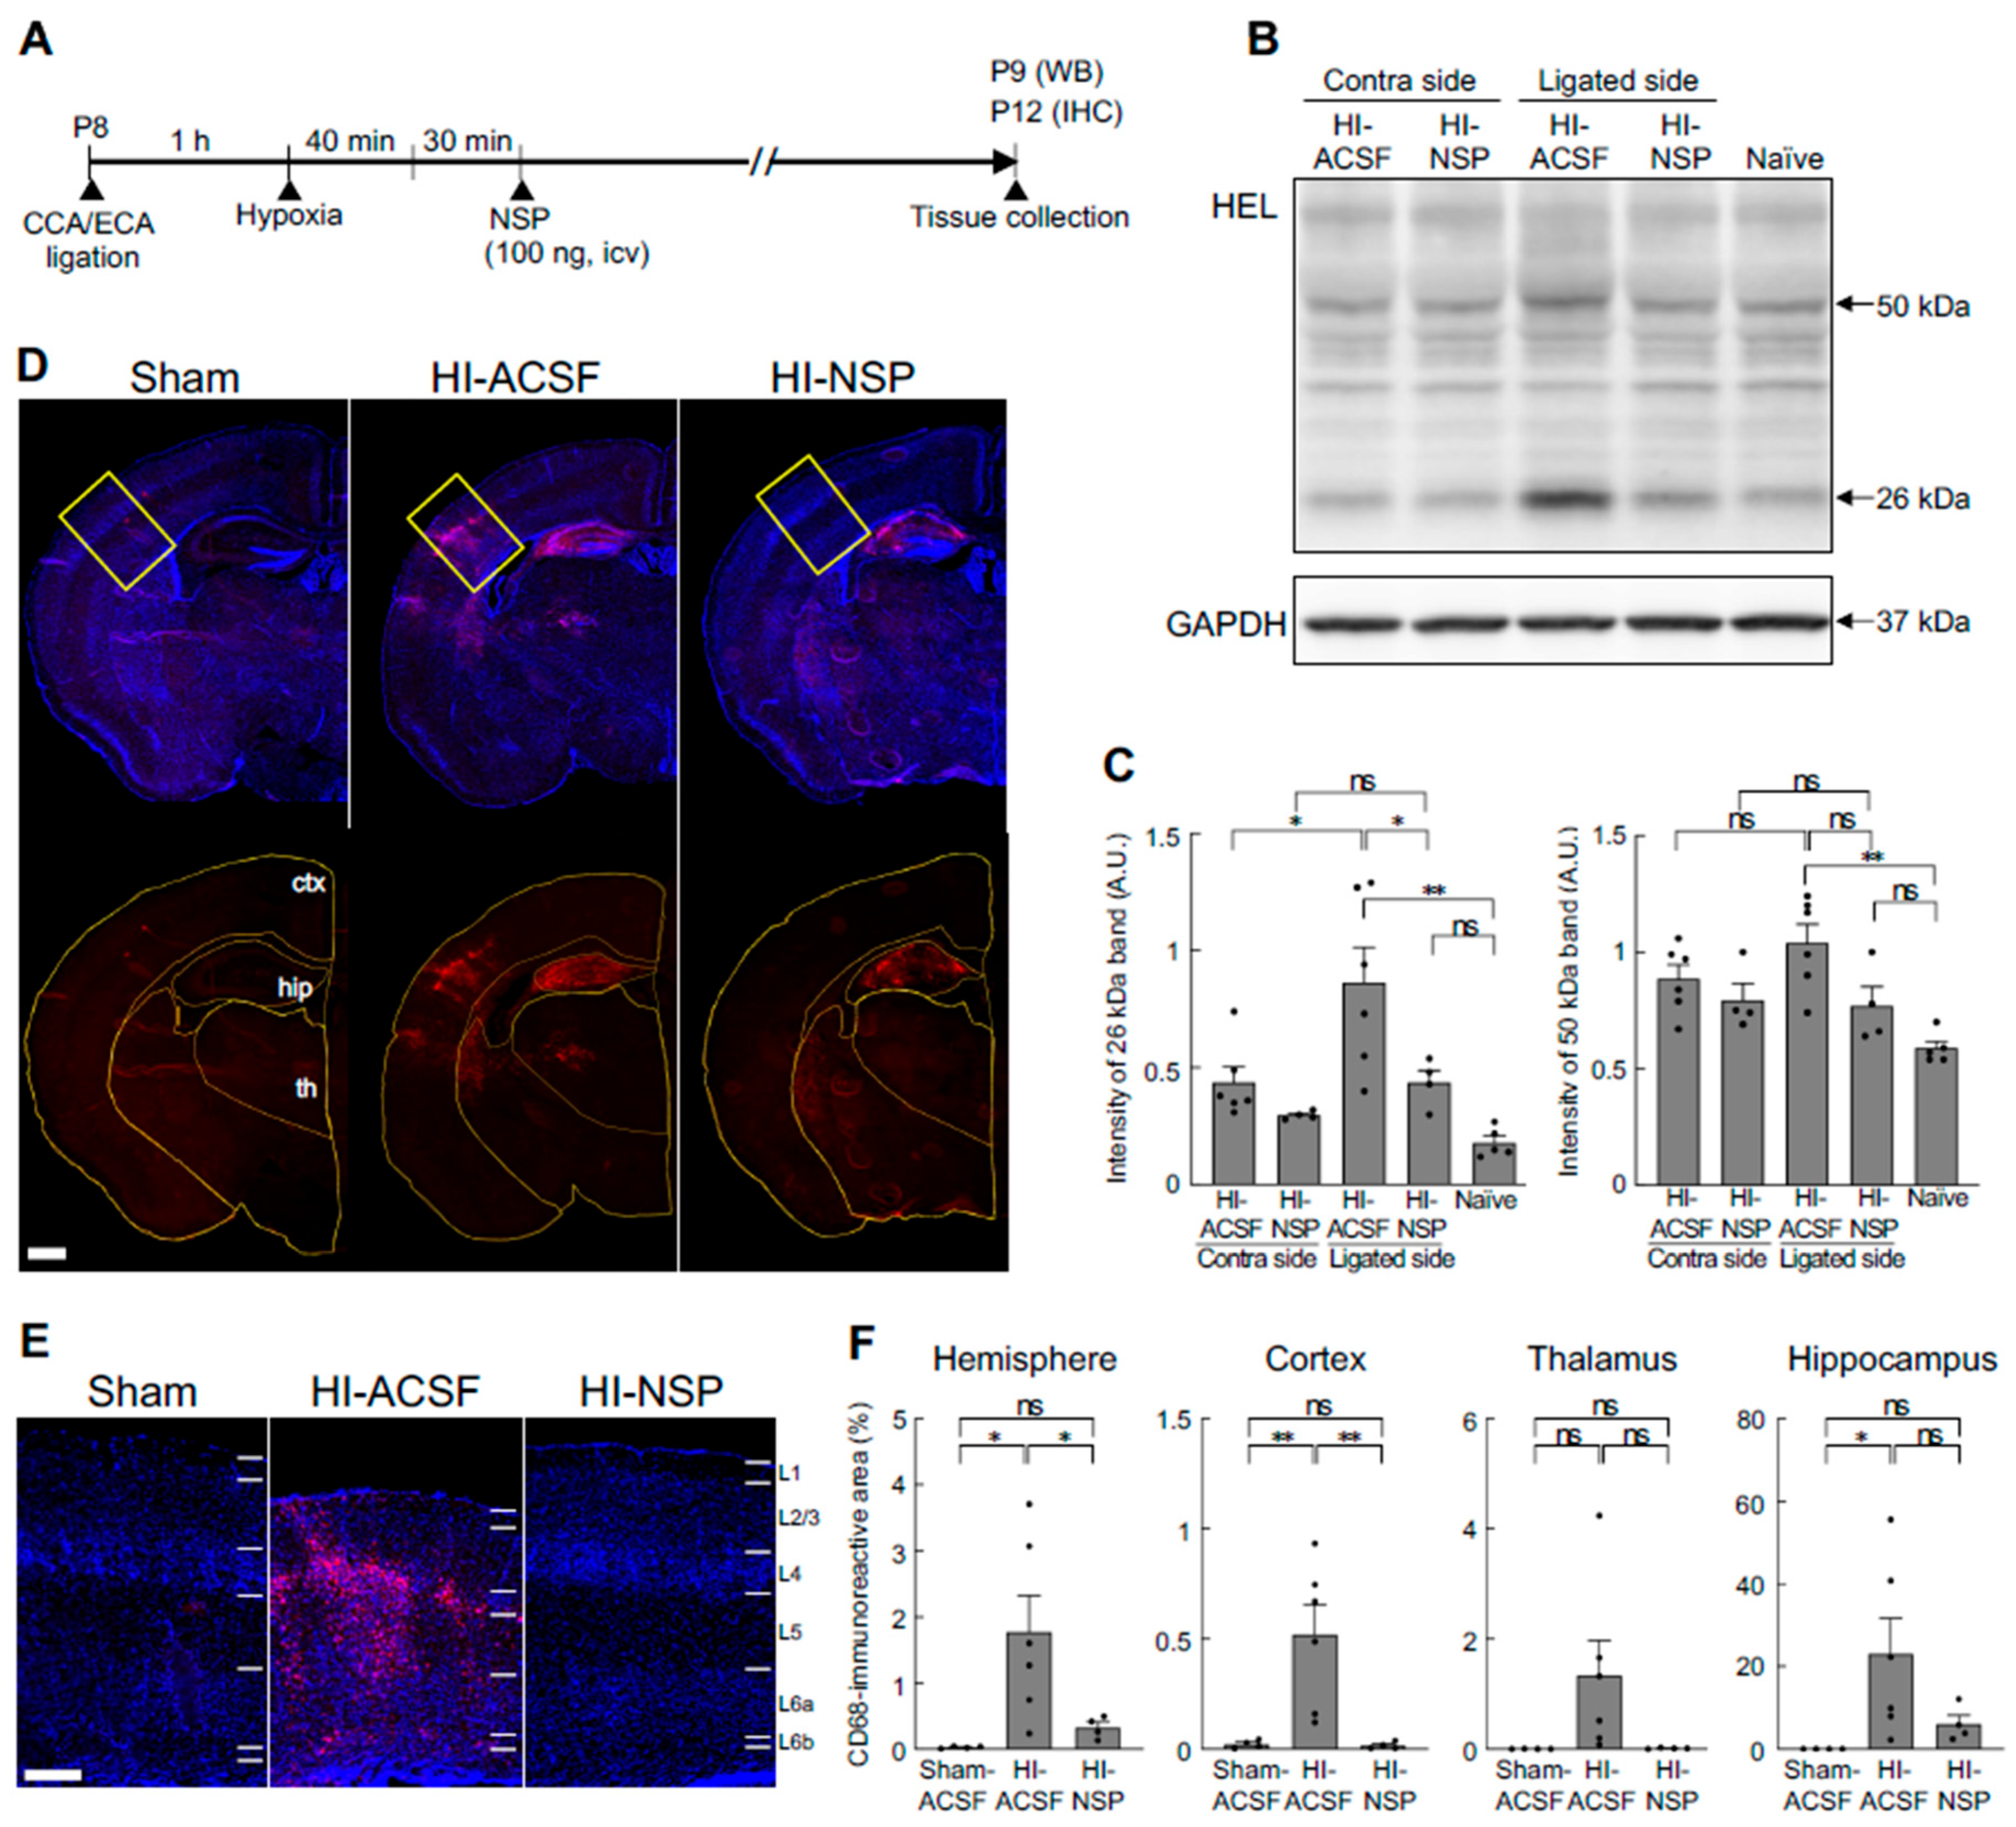
Figure 5.
Effects of an intracerebroventricular injection of recombinant neuroserpin protein on HI-induced alteration in cortical distribution of neurons and reduction in cortical thickness. (A) Representative images of NeuN immunostaining (left panel) and DAPI staining (right panel) in the brains of P12 sham mice, HI-ACSF mice and HI-NSP mice with mild HIE. C57BL/6J mice were subjected to HI procedures at P8, and then administered 100 ng of recombinant neuroserpin protein into the lateral ventricle of the brain 30 min after HI insults. The scale bar indicates 100 µm and applies to all panels. (B) The rectangle indicates the somatosensory cortex of high-magnification images, and the area was used for cell counting. The scale bar indicates 500 µm. (C) Illustration of the distribution of NeuN-immunoreactive cells in the rectangular area shown in Figure 5B. (D) The density distribution of NeuN-immunoreactive cells in the rectangular area shown in Figure 5B (sham mice: n=4; HI-ACSF mice: n=6; HI-NSP mice: n=4). Values represent the mean ± SEM. (E) Cortical thickness of the anterior and posterior somatosensory cortex is shown in the upper and lower panels, respectively. Cortical thickness was measured at three different locations in the rectangular area using ImageJ software in a blind manner, and mean value was calculated (sham mice: n=4; HI-ACSF mice: n=6; HI-NSP mice: n=4). Values represent the mean ± SEM. Statistical significance was evaluated using a one-way ANOVA followed by an LSD post-hoc test. *P < 0.05, **P < 0.01. ns: non-significant.
Disclaimer/Publisher’s Note: The statements, opinions and data contained in all publications are solely those of the individual author(s) and contributor(s) and not of MDPI and/or the editor(s). MDPI and/or the editor(s) disclaim responsibility for any injury to people or property resulting from any ideas, methods, instructions or products referred to in the content. |
© 2025 by the authors. Licensee MDPI, Basel, Switzerland. This article is an open access article distributed under the terms and conditions of the Creative Commons Attribution (CC BY) license (http://creativecommons.org/licenses/by/4.0/).
Copyright: This open access article is published under a Creative Commons CC BY 4.0 license, which permit the free download, distribution, and reuse, provided that the author and preprint are cited in any reuse.


